2017 q1 investment webinar - the san diego foundation
TRANSCRIPT

Quarterly Investment Narrative Conference Call
Thursday, June 1, 2017
Speakers
Horacio Valeiras, CFA Principal, HAV Capital
Investment Chair, Board of Governors The San Diego Foundation
Matt Fettig, CFA Vice President, Chief Investment Officer
The San Diego Foundation
Adrienne Vargas Vice President, Chief Giving Officer
The San Diego Foundation

Agenda
1. Macroeconomic update
2. Performance & attribution for Endowment Portfolio
3. Performance & attribution for Long-Term Portfolio
4. Performance & attribution for Medium-Term Portfolio
5. Performance & attribution for Short-Term Portfolio
6. Q&A
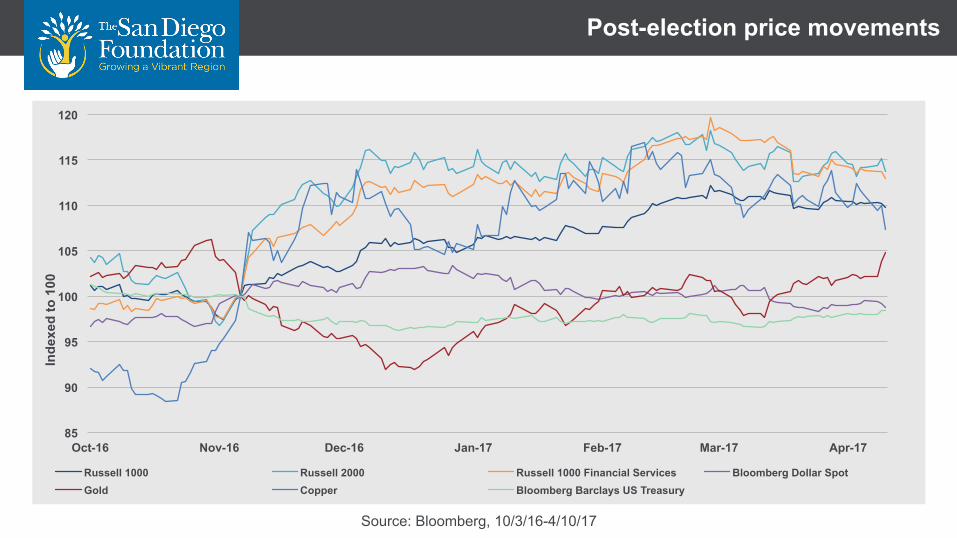
Post-election price movements
Source: Bloomberg, 10/3/16-4/10/17
85
90
95
100
105
110
115
120
Oct-16 Nov-16 Dec-16 Jan-17 Feb-17 Mar-17 Apr-17
Inde
xed
to 1
00
Russell 1000 Russell 2000 Russell 1000 Financial Services Bloomberg Dollar Spot Gold Copper Bloomberg Barclays US Treasury
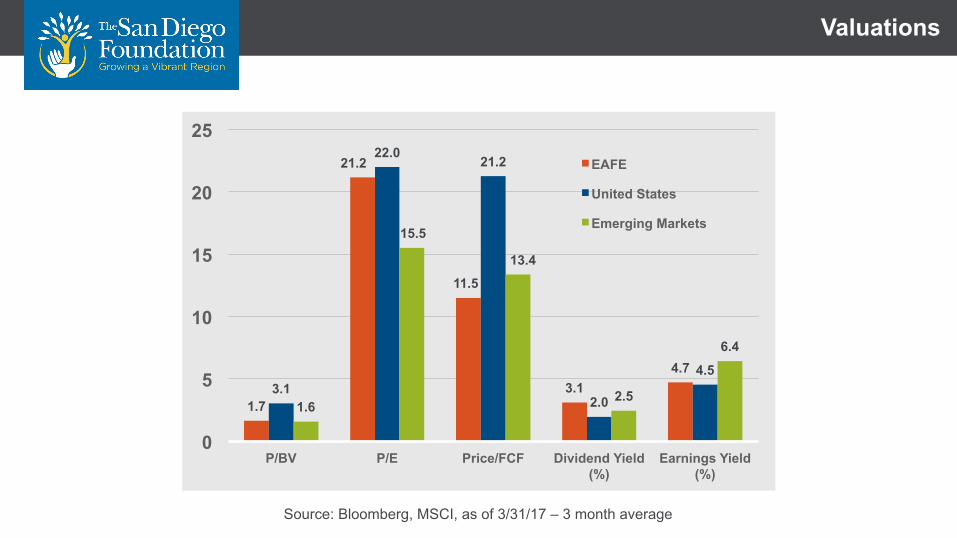
Valuations
Source: Bloomberg, MSCI, as of 3/31/17 – 3 month average
1.7
21.2
11.5
3.1 4.7
3.1
22.0 21.2
2.0
4.5
1.6
15.5
13.4
2.5
6.4
0
5
10
15
20
25
P/BV P/E Price/FCF Dividend Yield (%)
Earnings Yield (%)
EAFE
United States
Emerging Markets

International economics summary
Area GDP (Real, YoY) Inflation (CPI, YoY) Unemployment
United States 1.2% 3/31/17
2.2% 4/30/17
4.4% 4/30/17
Western Europe 2.0% 3/31/17
1.4% 4/30/17
7.8% 4/30/17
Japan 1.6% 3/31/17
0.4% 4/30/17
2.8% 4/30/17
BRIC Nations 5.2% 12/31/16
2.9% 4/30/17
5.2% 4/30/17
Brazil (2.5%) 12/31/16
4.1% 4/30/17
13.6% 4/30/17
Russia 0.5% 3/31/17
4.1% 4/30/17
5.3% 4/30/17
India 6.1% 3/31/17
3.0% 4/30/17
4.0% 4/30/17
China 6.9% 3/31/17
1.2% 4/30/17
4.0% 4/30/17

U.S. Treasury Forward Yield Curve
Source: Bloomberg, FRED, as of 3/31/17
0%
1%
2%
3%
4%
1 Mo 3 Mo 2 Yr 5 Yr 7 Yr 10 Yr 15 Yr 20 Yr 30 Yr
Spot 6 Mo (Forward) 12 Mo (Forward)
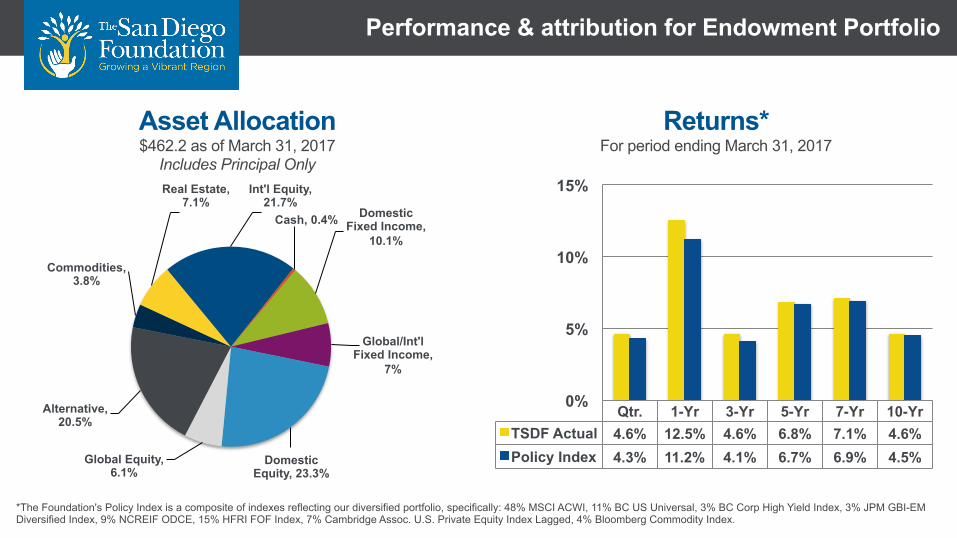
Performance & attribution for Endowment Portfolio
Asset Allocation $462.2 as of March 31, 2017
Includes Principal Only
Returns* For period ending March 31, 2017
Domestic Fixed Income,
10.1%
Global/Int'l Fixed Income,
7%
Domestic Equity, 23.3%
Global Equity, 6.1%
Alternative, 20.5%
Commodities, 3.8%
Real Estate, 7.1%
Int'l Equity, 21.7%
Cash, 0.4%
Qtr. 1-Yr 3-Yr 5-Yr 7-Yr 10-Yr TSDF Actual 4.6% 12.5% 4.6% 6.8% 7.1% 4.6% Policy Index 4.3% 11.2% 4.1% 6.7% 6.9% 4.5%
0%
5%
10%
15%
*The Foundation's Policy Index is a composite of indexes reflecting our diversified portfolio, specifically: 48% MSCI ACWI, 11% BC US Universal, 3% BC Corp High Yield Index, 3% JPM GBI-EM Diversified Index, 9% NCREIF ODCE, 15% HFRI FOF Index, 7% Cambridge Assoc. U.S. Private Equity Index Lagged, 4% Bloomberg Commodity Index.
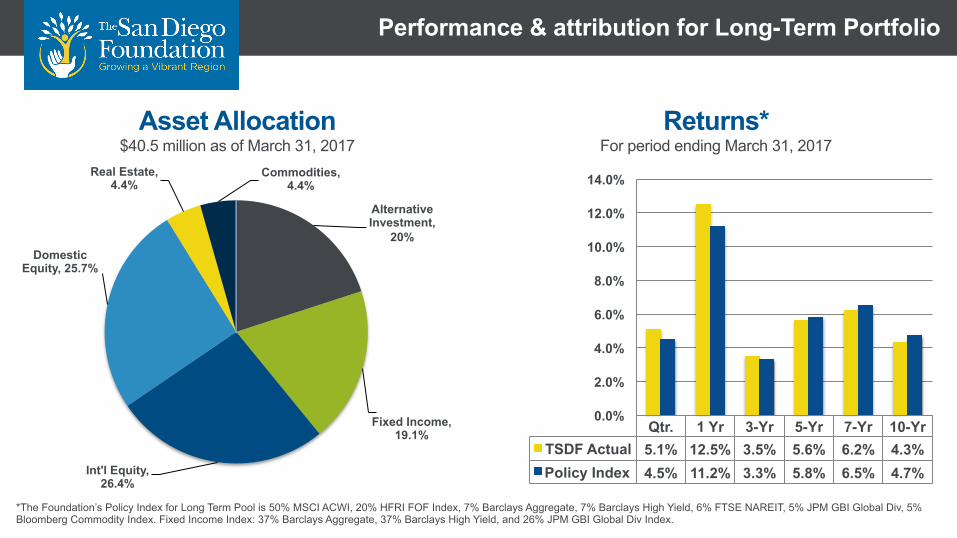
Performance & attribution for Long-Term Portfolio
Asset Allocation $40.5 million as of March 31, 2017
Returns* For period ending March 31, 2017
Alternative Investment,
20%
Fixed Income, 19.1%
Int'l Equity, 26.4%
Domestic Equity, 25.7%
Real Estate, 4.4%
Commodities, 4.4%
Qtr. 1 Yr 3-Yr 5-Yr 7-Yr 10-Yr TSDF Actual 5.1% 12.5% 3.5% 5.6% 6.2% 4.3% Policy Index 4.5% 11.2% 3.3% 5.8% 6.5% 4.7%
0.0%
2.0%
4.0%
6.0%
8.0%
10.0%
12.0%
14.0%
*The Foundation’s Policy Index for Long Term Pool is 50% MSCI ACWI, 20% HFRI FOF Index, 7% Barclays Aggregate, 7% Barclays High Yield, 6% FTSE NAREIT, 5% JPM GBI Global Div, 5% Bloomberg Commodity Index. Fixed Income Index: 37% Barclays Aggregate, 37% Barclays High Yield, and 26% JPM GBI Global Div Index.

Performance & attribution for Medium-Term Portfolio
Asset Allocation $53.8 million as of March 31, 2017
Returns* For period ending March 31, 2017
Domestic Fixed
Income, 56.3% Domestic
Equity, 14.7%
Cash, 5%
Int'l Equity, 15.5%
Global/Int'l Fixed
Income, 3.7% Commodities, 4.8%
Qtr. 1-Yr 3-Yr 5-Yr 7-Yr 10-Yr TSDF Actual 2.8% 7.4% 1.7% 3.4% 3.9% 3.0% Policy Index 2.6% 5.2% 2.1% 3.4% 4.2% 3.5%
0.0%
2.0%
4.0%
6.0%
8.0%
*The Foundation’s Policy Index for Medium Term Portfolio is 30% MSCI ACWI, 35% Barclays Aggregate, 5% Barclays High Yield, 4% Barclays Global Aggregate, 21% BofA ML 1-3 yr Treasury, 5% 91 Day T-Bills. Fixed Income Index: 54% Barclays Aggregate, 8% Barclays High Yield, 6% Barclays Global Aggregate, 32% BofA ML 1-3 yr Treasury.
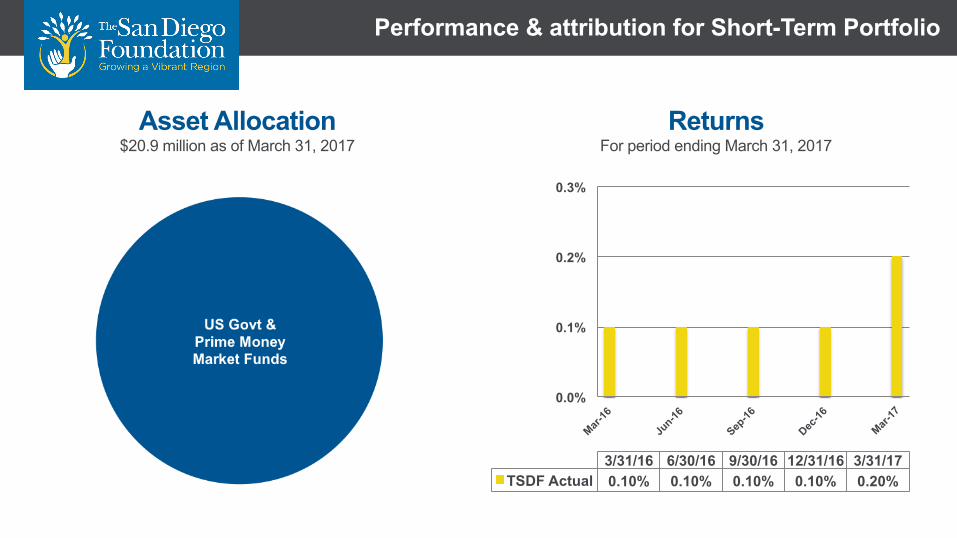
Performance & attribution for Short-Term Portfolio
Asset Allocation $20.9 million as of March 31, 2017
Returns For period ending March 31, 2017
0.0%
0.1%
0.2%
0.3%
3/31/16 6/30/16 9/30/16 12/31/16 3/31/17 TSDF Actual 0.10% 0.10% 0.10% 0.10% 0.20%

Q&A
To submit questions for the Q&A, please use the “Questions” chat function

Thank You
SDFoundation.org/Investments