2017 q4 fs and notes (annual) - torstar.com · 2017 q4 fs and notes (annual) created date:...
TRANSCRIPT

TORSTAR – Consolidated Financial Statements
1
Consolidated Financial Statements – Contents
PageManagement’s Report on Responsibility for Financial ReportingIndependent Auditors' ReportConsolidated Statement of Financial PositionConsolidated Statement of LossConsolidated Statement of Comprehensive LossConsolidated Statement of Changes in EquityConsolidated Statement of Cash FlowsNotes to the 2017 Consolidated Financial Statements:
1 Corporate Information2 Significant Accounting Policies3 Segmented Information4 Investments In Subsidiaries5 Restricted Cash6 Inventories7 Investments In Joint Ventures8 Investments In Associated Businesses9 Property, Plant And Equipment
10 Intangible Assets11 Goodwill12 Impairment Of Assets13 Other Assets14 Income Taxes15 Financial Instruments16 Capital Management17 Provisions18 Other Liabilities19 Employee Benefits20 Share Capital21 Share-Based Compensation Plans22 Accumulated Other Comprehensive Income (Loss)23 Other Income24 Discontinued Operations25 Other Non-Cash Items Provided By (Used In) Operating Activities26 Acquisitions, Divestitures And Portfolio Investments27 Commitments And Contingencies28 Related Party Transactions
2345678
99
2425262626273031323233333639404141484952525353545555

TORSTAR – Consolidated Financial Statements
2
MANAGEMENT’S REPORT ON RESPONSIBILITY FOR FINANCIAL REPORTING
Management is responsible for preparation of the consolidated financial statements, notes hereto and other financial information contained in this annual report. The consolidated financial statements have been prepared in conformity with International Financial Reporting Standards using the best estimates and judgements of management, where appropriate. Information presented elsewhere in this annual report is consistent with that in the consolidated financial statements.
Management is also responsible for maintaining a system of internal control designed to provide reasonable assurance that assets are safeguarded and that accounting systems provide timely, accurate and reliable information.
The Board of Directors is responsible for ensuring that management fulfills its responsibilities for financial reporting and internal control. The Board is assisted in exercising its responsibilities by the Audit Committee of the Board. The Committee meets quarterly with management and the internal and external auditors, and separately with the internal and external auditors, to satisfy itself that management’s responsibilities are properly discharged, and to discuss accounting and auditing matters. The Committee reviews the consolidated financial statements and recommends approval of the consolidated financial statements to the Board.
The internal and external auditors have full and unrestricted access to the Audit Committee to discuss their audits and their related findings as to the integrity of the financial reporting process.
John Boynton Lorenzo DeMarchiPresident and Chief Executive Officer Executive Vice-President and Chief Financial OfficerFebruary 27, 2018

TORSTAR – Consolidated Financial Statements
3
INDEPENDENT AUDITORS’ REPORT
To the Shareholders of Torstar Corporation
We have audited the accompanying consolidated financial statements of Torstar Corporation, which comprise the consolidated statement of financial position as at December 31, 2017 and 2016, and the consolidated statements of loss, comprehensive loss, changes in equity and cash flows for the years then ended, and a summary of significant accounting policies and other explanatory information.
Management's responsibility for the consolidated financial statementsManagement is responsible for the preparation and fair presentation of these consolidated financial statements in accordance with International Financial Reporting Standards, and for such internal control as management determines is necessary to enable the preparation of consolidated financial statements that are free from material misstatement, whether due to fraud or error.
Auditors’ responsibilityOur responsibility is to express an opinion on these consolidated financial statements based on our audits. We conducted our audits in accordance with Canadian generally accepted auditing standards. Those standards require that we comply with ethical requirements and plan and perform the audit to obtain reasonable assurance about whether the consolidated financial statements are free from material misstatement.
An audit involves performing procedures to obtain audit evidence about the amounts and disclosures in the consolidated financial statements. The procedures selected depend on the auditors’ judgment, including the assessment of the risks of material misstatement of the consolidated financial statements, whether due to fraud or error. In making those risk assessments, the auditors consider internal control relevant to the entity's preparation and fair presentation of the consolidated financial statements in order to design audit procedures that are appropriate in the circumstances, but not for the purpose of expressing an opinion on the effectiveness of the entity's internal control. An audit also includes evaluating the appropriateness of accounting policies used and the reasonableness of accounting estimates made by management, as well as evaluating the overall presentation of the consolidated financial statements.
We believe that the audit evidence we have obtained in our audits is sufficient and appropriate to provide a basis for our audit opinion.
OpinionIn our opinion, the consolidated financial statements present fairly, in all material respects, the financial position of Torstar Corporation as at December 31, 2017 and 2016 and its financial performance and its cash flows for the years then ended in accordance with International Financial Reporting Standards.
Toronto, Canada Ernst & Young LLPFebruary 27, 2018 Chartered Professional Accountants Licensed Public Accountants

TORSTAR – Consolidated Financial Statements
4
Torstar CorporationConsolidated Statement of Financial Position
(Thousands of Canadian Dollars)
As atDecember 31, 2017
As atDecember 31, 2016
AssetsCurrent:Cash and cash equivalents $71,377 $75,374Restricted cash (note 5) 9,056 11,847Receivables (note 15) 112,946 116,487Inventories (note 6) 4,326 4,829Derivative financial instruments (note 15) 57Prepaid expenses 4,373 4,467Prepaid and recoverable income taxes 1,000 9,271Total current assets 203,135 222,275
Investments in joint ventures (note 7) 23,420 27,463Investments in associated businesses (note 8) 142,769 157,897Property, plant and equipment (note 9) 55,259 61,969Intangible assets (note 10) 40,217 55,945Goodwill (note 11) 8,133Other assets (note 13) 12,967 12,414Employee benefits (note 19) 7,073Deferred income tax assets (note 14) 3,460 11,322Total assets $481,227 $564,491Liabilities and Equity
Current:Accounts payable and accrued liabilities (note 15) $89,132 $101,133Derivative financial instruments (note 15) 472Provisions (note 17) 18,113 28,473Income taxes payable 6,781 7,212Total current liabilities 114,026 137,290
Provisions (note 17) 6,714 11,104Other liabilities (note 18) 6,599 7,616Employee benefits (note 19) 104,716 77,407Deferred income tax liabilities (note 14) 3,342 4,904Equity:
Share capital (note 20) 403,040 402,814Contributed surplus 21,322 20,797Accumulated deficit (176,180) (102,599)Accumulated other comprehensive income (loss) (note 22) (2,207) 5,176Total equity attributable to equity shareholders 245,975 326,188Minority interests (145) (18)
Total equity 245,830 326,170Total liabilities and equity $481,227 $564,491(see accompanying notes)ON BEHALF OF THE BOARD
John Honderich Paul WeissDirector Director
TORSTAR – Consolidated Financial Statements
5
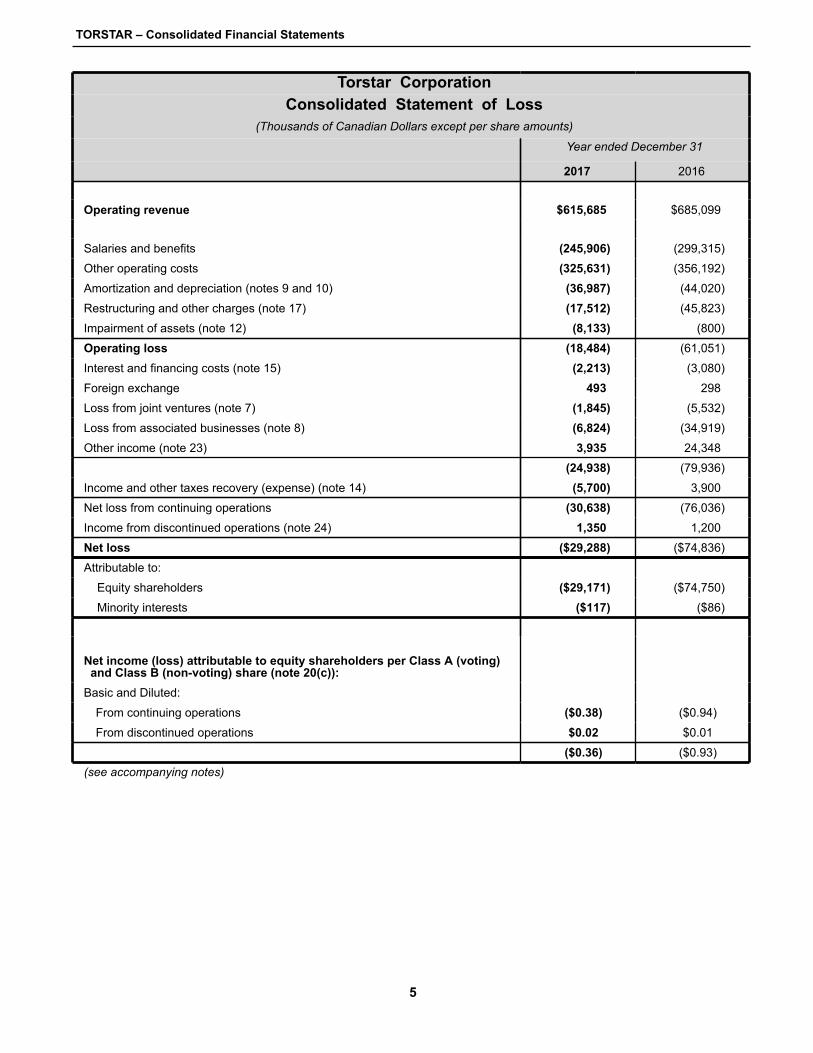
Torstar CorporationConsolidated Statement of Loss
(Thousands of Canadian Dollars except per share amounts)
Year ended December 31
2017 2016
Operating revenue $615,685 $685,099
Salaries and benefits (245,906) (299,315)
Other operating costs (325,631) (356,192)
Amortization and depreciation (notes 9 and 10) (36,987) (44,020)
Restructuring and other charges (note 17) (17,512) (45,823)
Impairment of assets (note 12) (8,133) (800)
Operating loss (18,484) (61,051)
Interest and financing costs (note 15) (2,213) (3,080)
Foreign exchange 493 298
Loss from joint ventures (note 7) (1,845) (5,532)
Loss from associated businesses (note 8) (6,824) (34,919)
Other income (note 23) 3,935 24,348
(24,938) (79,936)
Income and other taxes recovery (expense) (note 14) (5,700) 3,900
Net loss from continuing operations (30,638) (76,036)
Income from discontinued operations (note 24) 1,350 1,200
Net loss ($29,288) ($74,836)
Attributable to:
Equity shareholders ($29,171) ($74,750)
Minority interests ($117) ($86)
Net income (loss) attributable to equity shareholders per Class A (voting)and Class B (non-voting) share (note 20(c)):
Basic and Diluted:
From continuing operations ($0.38) ($0.94)
From discontinued operations $0.02 $0.01
($0.36) ($0.93)(see accompanying notes)

TORSTAR – Consolidated Financial Statements
6
Torstar CorporationConsolidated Statement of Comprehensive Loss
(Thousands of Canadian Dollars)
Year ended December 312017 2016
Net loss ($29,288) ($74,836)
Other comprehensive income (loss) (“OCI”) that are or may be reclassifiedsubsequently to net income (loss):
Unrealized foreign currency translation adjustment (“CTA”) (no income tax effect) 38 27
Unrealized foreign currency translation adjustment for associated businesses (noincome tax effect) (note 8) (7,489) (5,459)
Net movement on available-for-sale financial assets (332) 2,910
Income tax effect 400 (400)
Unrealized gain on hedge of net investment 5,777Income tax effect (800)
(7,383) 2,055
OCI that will not be reclassified subsequently to net income (loss):
Actuarial loss on employee benefits (note 19) (35,757) (1,734)
Actuarial gain (loss) on employee benefits for associated businesses (no incometax effect) (note 8) 66 (1,726)
(35,691) (3,460)
Comprehensive loss, net of tax ($72,362) ($76,241)Attributable to:Equity shareholders ($72,245) ($76,155)Minority interests ($117) ($86)
(see accompanying notes)
TORSTAR – Consolidated Financial Statements
7
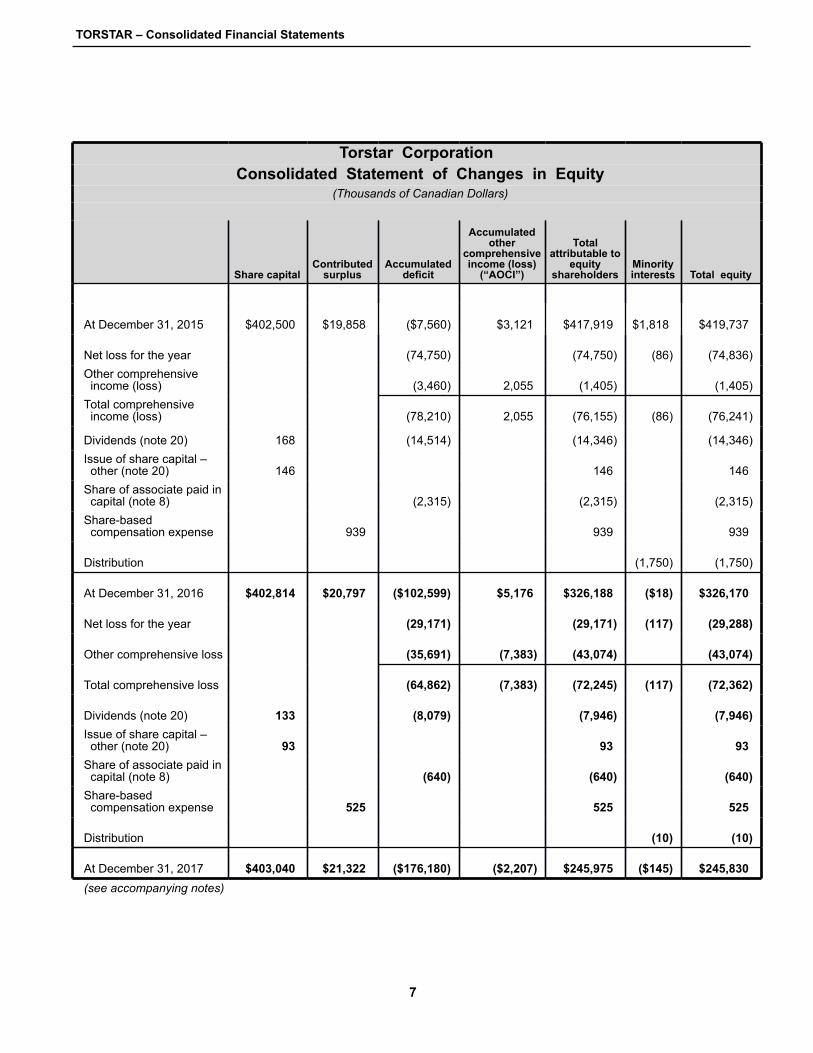
Torstar CorporationConsolidated Statement of Changes in Equity
(Thousands of Canadian Dollars)
Share capitalContributed
surplusAccumulated
deficit
Accumulatedother
comprehensiveincome (loss)
(“AOCI”)
Totalattributable to
equityshareholders
Minorityinterests Total equity
At December 31, 2015 $402,500 $19,858 ($7,560) $3,121 $417,919 $1,818 $419,737
Net loss for the year (74,750) (74,750) (86) (74,836)Other comprehensiveincome (loss) (3,460) 2,055 (1,405) (1,405)
Total comprehensiveincome (loss) (78,210) 2,055 (76,155) (86) (76,241)
Dividends (note 20) 168 (14,514) (14,346) (14,346)Issue of share capital –other (note 20) 146 146 146
Share of associate paid incapital (note 8) (2,315) (2,315) (2,315)
Share-basedcompensation expense 939 939 939
Distribution (1,750) (1,750)
At December 31, 2016 $402,814 $20,797 ($102,599) $5,176 $326,188 ($18) $326,170
Net loss for the year (29,171) (29,171) (117) (29,288)
Other comprehensive loss (35,691) (7,383) (43,074) (43,074)
Total comprehensive loss (64,862) (7,383) (72,245) (117) (72,362)
Dividends (note 20) 133 (8,079) (7,946) (7,946)Issue of share capital –other (note 20) 93 93 93
Share of associate paid incapital (note 8) (640) (640) (640)
Share-basedcompensation expense 525 525 525
Distribution (10) (10)
At December 31, 2017 $403,040 $21,322 ($176,180) ($2,207) $245,975 ($145) $245,830(see accompanying notes)
TORSTAR – Consolidated Financial Statements
8
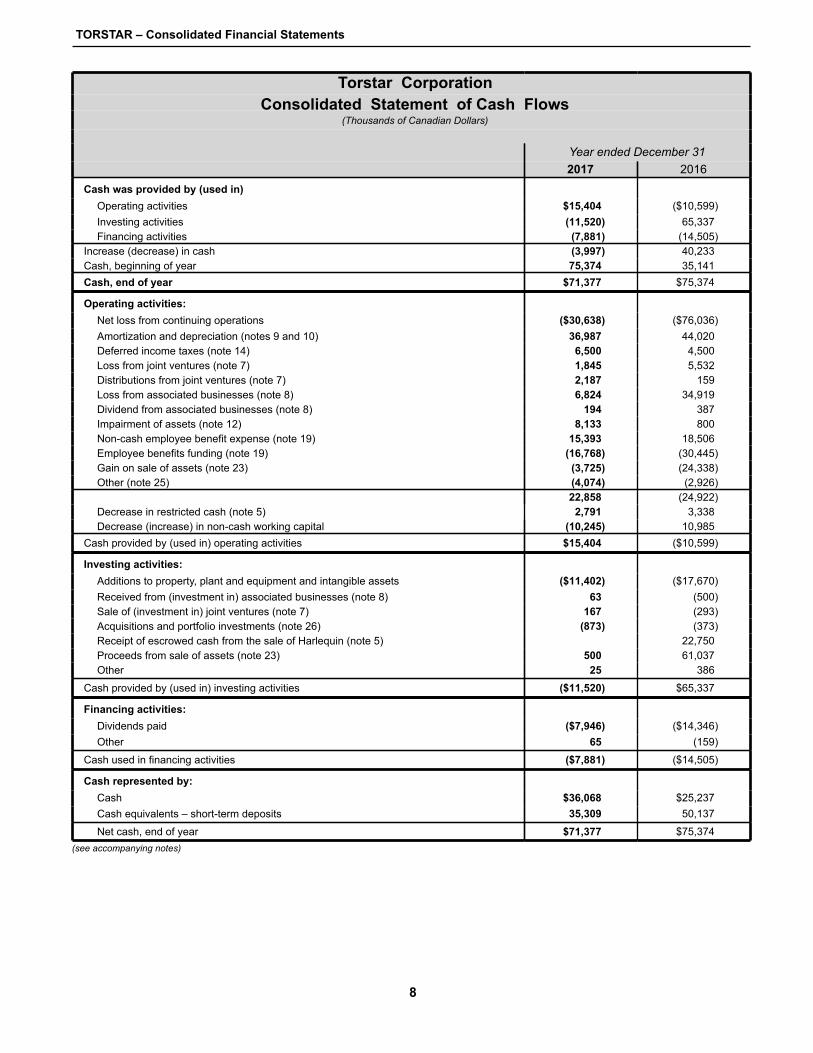
Torstar CorporationConsolidated Statement of Cash Flows
(Thousands of Canadian Dollars)
Year ended December 312017 2016
Cash was provided by (used in)Operating activities $15,404 ($10,599)Investing activities (11,520) 65,337Financing activities (7,881) (14,505)
Increase (decrease) in cash (3,997) 40,233Cash, beginning of year 75,374 35,141Cash, end of year $71,377 $75,374
Operating activities:Net loss from continuing operations ($30,638) ($76,036)Amortization and depreciation (notes 9 and 10) 36,987 44,020Deferred income taxes (note 14) 6,500 4,500Loss from joint ventures (note 7) 1,845 5,532Distributions from joint ventures (note 7) 2,187 159Loss from associated businesses (note 8) 6,824 34,919Dividend from associated businesses (note 8) 194 387Impairment of assets (note 12) 8,133 800Non-cash employee benefit expense (note 19) 15,393 18,506Employee benefits funding (note 19) (16,768) (30,445)Gain on sale of assets (note 23) (3,725) (24,338)Other (note 25) (4,074) (2,926)
22,858 (24,922)Decrease in restricted cash (note 5) 2,791 3,338Decrease (increase) in non-cash working capital (10,245) 10,985
Cash provided by (used in) operating activities $15,404 ($10,599)
Investing activities:Additions to property, plant and equipment and intangible assets ($11,402) ($17,670)Received from (investment in) associated businesses (note 8) 63 (500)Sale of (investment in) joint ventures (note 7) 167 (293)Acquisitions and portfolio investments (note 26) (873) (373)Receipt of escrowed cash from the sale of Harlequin (note 5) 22,750Proceeds from sale of assets (note 23) 500 61,037Other 25 386
Cash provided by (used in) investing activities ($11,520) $65,337
Financing activities:Dividends paid ($7,946) ($14,346)Other 65 (159)
Cash used in financing activities ($7,881) ($14,505)
Cash represented by:Cash $36,068 $25,237Cash equivalents – short-term deposits 35,309 50,137
Net cash, end of year $71,377 $75,374(see accompanying notes)

TORSTAR – Consolidated Financial Statements
9
NOTES TO THE CONSOLIDATED FINANCIAL STATEMENTSYears ended December 31, 2017 and 2016
(Tabular amounts in thousands of Canadian dollars except per share amounts)
1. CORPORATE INFORMATION
Torstar Corporation (the "Company") is incorporated under the laws of Ontario, Canada and its Class B (non-voting) shares are publicly traded on the Toronto Stock Exchange. The registered office is located at One Yonge Street, Toronto, Canada. The principal activities of the Company and its subsidiaries are described in Note 3.
2. SIGNIFICANT ACCOUNTING POLICIES
(a) Basis of preparation
These consolidated financial statements have been prepared in accordance with International Financial Reporting Standards (“IFRS”) as issued by the International Accounting Standards Board (“IASB”). The policies applied in these consolidated financial statements are based on IFRS policies effective as of December 31, 2017. These consolidated financial statements have been authorized for issue in accordance with a resolution from the Board of Directors on February 27, 2018.
Comparative figures for previous periods have been restated to conform to the current year presentation.
(b) Basis of measurement
The consolidated financial statements have been prepared under the historical cost convention, except for certain financial instruments that are measured at fair value as described in the accounting policies.
(c) Principles of consolidation
The consolidated financial statements of the Company include the accounts of Torstar Corporation and all its subsidiaries over which it has control. The Company controls an investee when the Company is exposed to, or has rights to, variable returns from its relationship with the investee and has the ability to affect those returns through its power over the investee. The Company considers all relevant facts and circumstances in assessing whether or not the Company’s voting rights in an investee are sufficient to give it power. These facts and circumstances include: the size of the Company’s holding of voting rights relative to the size and dispersion of holdings of the other vote holders; potential voting rights held by the Company, other vote holders or other parties; and rights arising from other contractual arrangements. The financial statements of subsidiaries are included in the consolidated financial statements from the date control commences and are de-consolidated on the date when control ceases.
Profit or loss and each component of OCI are attributed to the equity holders of the Company and to the minority interests, even if this results in the minority interests having a deficit balance.
Intra-group balances and transactions are eliminated on consolidation. Unrealized gains arising from transactions with equity-accounted investees are eliminated against the investment to the extent of the Company’s interest in the investee. Unrealized losses are eliminated in the same way as unrealized gains, but only to the extent that there is no evidence of impairment.
(d) Investments in joint ventures and associated businesses
A joint venture is a type of joint arrangement in which the parties that have joint control of the arrangement have rights to the net assets of the joint venture. Joint control is the contractually agreed sharing of control of an arrangement, which exists only when decisions about the relevant activities require unanimous consent of the parties sharing control.

TORSTAR – Consolidated Financial Statements
10
An associate is an entity in which the Company has significant influence. Significant influence is the power to participate in the financial and operating policy decisions of the investee but does not represent control or joint control over those decisions.
The considerations made in determining joint control or significant influence are similar to those necessary to determine control over subsidiaries.
Investments in joint ventures and associates are accounted for using the equity method, whereby the investment is carried in the consolidated statement of financial position at cost (which includes acquisition-related fees) plus post-acquisition changes in the Company’s share of the net assets of the investment. Goodwill relating to the joint venture or associate is included in the carrying amount of the investment and is neither amortized nor individually tested for impairment. When the Company’s share of losses of a joint venture or associate exceeds the Company’s carrying value of the investment, the Company discontinues recognizing its share of further losses. Additional losses are recognized only to the extent that the Company has incurred legal or constructive obligations or made payments on behalf of the joint venture or associate.
The consolidated statement of income or loss reflects the Company’s share of the results of operations of the joint venture or associate. Where there has been a change recognized directly in the OCI of the joint venture or associate, the Company recognizes its share of any changes and discloses this, when applicable, in OCI. When there has been a change recognized directly in the equity of the joint venture or associate, the Company recognizes, when applicable, its share of any changes in the consolidated statement of changes in equity.
The financial statements of the joint venture or associate are prepared for the same reporting period as the Company except when the joint venture or associate does not have coterminous year-end and quarter-ends with the Company, in which case the most recent period-end available in a quarter is used. When necessary, adjustments are made to bring the accounting policies of the joint venture or associate in line with those of the Company.
After the initial application of the equity method, the Company determines at each reporting date whether there is any objective evidence that the investment in the joint venture or associate is impaired and consequently whether it is necessary to recognize an impairment loss with respect to the Company’s investment. If this is the case, the Company calculates the amount of impairment as the difference between the recoverable amount of the investment and its carrying value and recognizes the impairment in the consolidated statement of income or loss.
Upon loss of significant influence over an associate, the Company measures and recognizes any retained investment at its fair value. Upon loss of joint control over a joint venture, the Company considers whether it has significant influence, in which case the retained investment is accounted for as an associate using the equity method, otherwise the Company measures and recognizes any retained investment as a portfolio investment at its fair value. Any difference between the carrying amount of the investment and the fair value of the retained investment or proceeds from disposal of the investment is recognized in profit or loss.
(e) Foreign currency translation
The Company’s consolidated financial statements are presented in Canadian dollars, which is the Company’s functional currency. Each entity consolidated by the Company determines its own functional currency based on the primary economic environment in which the entity operates.
Transactions in foreign currencies are initially recorded by the entities in their respective functional currencies on the date of the transaction. Monetary assets and liabilities denominated in currencies other than the entity’s functional currency are translated at the rates as at the date of the consolidated statement of financial position (period end rates). Foreign currency exchange gains and losses resulting from the settlement of such transactions and from the translation of monetary assets and liabilities not denominated in the functional currency of an entity are recognized in the consolidated statement of income or loss, except for qualifying cash flow and net investment hedges for which these exchange differences are deferred in accumulated other comprehensive income or loss (“AOCI”) within equity. These deferred foreign exchange gains and losses are carried forward to be recognized in income in the same period as the corresponding gains or losses associated with the hedged item. Non-monetary assets and liabilities are translated into functional currencies at historical exchange rates.
TORSTAR – Consolidated Financial Statements
11
Assets and liabilities of entities with functional currencies other than Canadian dollars are translated at the period end rates of exchange, and items of income and expense are translated into Canadian dollars at the rates prevailing on the dates of the transactions, or average rates of exchange where these approximate actual rates. The resulting translation adjustments are included in OCI. Upon reduction of the Company’s investment in a foreign subsidiary due to a sale or liquidation, the proportionate amount of AOCI is recognized in income.
(f) Financial instruments
Financial assets and liabilities
The Company classifies its financial assets and liabilities into the following categories:
• Financial instruments at fair value through profit or loss• Loans and receivables• Financial assets classified as available-for-sale (“AFS”)• Other financial liabilities
The Company has not classified any financial instruments as held-to-maturity. Appropriate classification of financial assets and liabilities is determined at the time of initial recognition or when reclassified in the consolidated statement of financial position.
Financial instruments are recognized on the trade date - the date on which the Company becomes a party to the contractual provisions of the instrument.
Financial assets and liabilities at fair value through profit or loss
The Company classifies certain financial assets and liabilities as either held for trading or designated at fair value through profit or loss. Assets and liabilities in this category include derivative financial instruments that are not designated as hedging instruments in hedge relationships.
Financial instruments at fair value through profit or loss are carried at fair value. Related realized and unrealized gains and losses are included in the consolidated statement of income or loss.
Loans and receivables
Loans and receivables include originated and purchased non-derivative financial assets with fixed or determinable payments that are not quoted in an active market. Assets in this category are classified as current assets in the consolidated statement of financial position and include current receivables, cash and cash equivalents. Non-current receivables are classified as other assets.
Loans and receivables are initially recognized at fair value plus transaction costs. They are subsequently measured at amortized cost using the effective interest method less any impairment. Receivables are reduced by estimated bad debt provisions which are determined by reference to past experience and expectations. Cash and cash equivalents consist of cash in bank and highly liquid short-term investments.
Financial assets classified as AFS
Financial assets that are not classified as at fair value through profit or loss or as loans and receivables are classified as AFS. A financial asset classified as AFS is initially recognized at its fair value plus transaction costs that are directly attributable to the acquisition of the financial asset. Financial assets classified as AFS are carried at fair value with the changes in fair value reported as unrealized gains or losses on AFS assets within OCI, unless the asset is subject to a fair value hedge, in which case changes in fair value resulting from the risk being hedged are recorded in the consolidated statement of income or loss.
Financial assets classified as AFS are assessed for impairment at each reporting date and the Company recognizes any impairment in the consolidated statement of income or loss.
TORSTAR – Consolidated Financial Statements
12
Other financial liabilities
Other financial liabilities are measured at amortized cost using the effective interest rate method. Other financial liabilities include accounts payable and accrued liabilities and long-term debt instruments. Long-term debt instruments are initially measured at fair value, which is the consideration received, net of transaction costs incurred. Transaction costs related to long-term debt instruments are included in the value of the instruments and amortized using the effective interest rate method.
Derecognition
A financial asset is derecognized when the rights to receive cash flows from the asset have expired or when the Company has transferred its rights to receive cash flows from the asset. Any unrealized gains and losses recorded in AOCI are transferred to the consolidated statement of income or loss on disposal of an AFS asset.
A financial liability is derecognized when the obligation under the liability is discharged, cancelled or expires.
Derivative instruments and hedging
In the normal course of business, the Company uses derivative financial instruments to manage its risks related to foreign currency exchange rate fluctuations, interest rates and share-based compensation liability and expense. Derivative transactions are governed by a uniform set of policies and procedures covering areas such as authorization, counterparty exposure and hedging practices. Positions are monitored based on changes in interest and foreign currency exchange rates and their impact on the market value of derivatives. Credit risk on derivatives arises from the potential for counterparties to default on their contractual obligations to the Company. The Company limits its credit risk by dealing with counterparties that are considered to be of high credit quality. The Company does not enter into derivative transactions for trading or speculative purposes.
All derivatives, including derivatives designated as hedges for accounting purposes and embedded derivatives, are recorded in the consolidated statement of financial position at fair value. The treatment of changes in the fair value of derivatives depends on whether or not they are designated as hedges for accounting purposes.
Collar arrangements and foreign exchange contracts to sell U.S. dollars have been designated as hedges against the foreign currency exposure on the net investment in VerticalScope. Gains and losses on these instruments, to the extent of hedge effectiveness, are transferred to OCI to offset the gains and losses on translation of the net investment. The portion of the hedge that is deemed ineffective is recorded in the consolidated statement of income or loss.
The Company uses derivative instruments to manage its exposure to changes in the fair value of its deferred share unit (“DSU”) plans and the cost of its restricted share unit (“RSU”) plan. The changes in the fair value of these instruments are recorded as compensation expense. The change in the Company’s share price between the settlement date and the reporting date is included in the consolidated statement of financial position at the fair value of these derivative instruments at each reporting date.
The treatment of changes in the fair value of a derivative depends on the intended use of the derivative and the resulting designation. In order for a derivative to qualify for hedge accounting, the derivative must be formally designated as a fair value, cash flow or net investment hedge by documenting the relationship between the derivative and the hedged item. Documentation includes a description of the hedging instrument, the hedged item, the risk being hedged, the Company’s risk management objective and strategy for undertaking the hedge, the method for assessing the effectiveness of the hedge and the method for measuring hedge ineffectiveness. Additionally, the hedge relationship must be expected to be highly effective at offsetting changes in either the fair value or cash flows of the hedged item at both the inception of the hedge and on an ongoing basis. The Company assesses the ongoing effectiveness of its hedges at each reporting date.
Amounts in AOCI are recycled to the consolidated statement of income or loss in the period when the hedged item will affect profit and loss (for instance, when the forecast sale that is hedged takes place). If a hedging instrument expires or is sold, or when a hedge no longer meets the criteria for hedge accounting, any unrealized cumulative
TORSTAR – Consolidated Financial Statements
13
gain or loss remains in AOCI and is recognized when the forecast transaction is ultimately recognized in the consolidated statement of income or loss. If a forecast transaction is no longer expected to occur, the unrealized cumulative gain or loss that was reported in AOCI is recognized in the consolidated statement of income or loss.
Fair value hedges
These are hedges of the fair value of recognized assets, liabilities or a firm commitment. Changes in the fair value of derivatives that are designated as fair value hedges are recorded in the consolidated statement of income or loss together with any changes in the fair value of the hedged asset or liability attributable to the hedged risk.
Cash flow hedges
These are hedges of highly probable forecast transactions. The effective portion of changes in the fair value of derivatives that are designated as a cash flow hedge is recognized in OCI. The gain or loss relating to the ineffective portion is recognized in the consolidated statement of income or loss.
Net investment hedges
These are hedges of the Company’s net investment in its foreign operations, currently VerticalScope. The effective portion of the change in the fair value of the hedging instrument is recorded directly in OCI. The ineffective portion is recognized in the consolidated statement of income or loss in the period in which the change occurs. Upon the sale or liquidation of the foreign operations, the amounts deferred in AOCI are recognized in the consolidated statement of income or loss.
Embedded derivatives
An embedded derivative is a component of a hybrid instrument that also includes a non-derivative host contract, with the effect that a portion of the cash flows of the combined instrument varies in a way similar to a stand-alone derivative. If certain conditions are met, an embedded derivative is separated from the host contract and accounted for as a derivative in the consolidated statement of financial position, at its fair value. Any future changes in the fair value are recorded in the consolidated statement of income or loss.
Derivatives that do not qualify for hedge accounting
Certain derivative instruments, while providing effective economic hedges, are not designated as hedges for accounting purposes. Changes in the fair value of any derivatives that are not designated as hedges for accounting purposes are recognized in the consolidated statement of income or loss.
Determination of fair value
Fair value is defined as the price at which an asset or liability could be exchanged in a current transaction between knowledgeable, willing parties, other than in a forced or liquidation sale. The fair value of instruments quoted in active markets is determined using quoted prices where they represent those at which regularly and recently occurring transactions take place. The Company uses valuation techniques to establish the fair value of instruments where prices quoted in active markets are not available. Where possible, parameter inputs to the valuation techniques are based on observable data derived from prices of relevant instruments traded in an active market. These valuation techniques involve some level of management estimation and judgement, the degree of which will depend on the price transparency for the instrument or market and the instrument’s complexity.
The Company categorizes fair value measurements according to a three-level hierarchy. The hierarchy prioritizes the inputs used in the Company’s valuation techniques. A level is assigned to each fair value measurement based on the lowest level input significant to the fair value measurement in its entirety. The three levels of the fair value hierarchy are defined as follows:
Level 1 - Unadjusted quoted prices at the measurement date for identical assets or liabilities in active markets.

TORSTAR – Consolidated Financial Statements
14
Level 2 - Observable inputs other than quoted prices included in Level 1, such as quoted prices for similar assets and liabilities in active markets; quoted prices for identical or similar assets and liabilities in markets that are not active; or other inputs that are observable or can be corroborated by observable market data.
Level 3 - Significant unobservable inputs which are supported by little or no market activity.
The fair value hierarchy also requires the Company to maximize the use of observable inputs and minimize the use of unobservable inputs when measuring fair value.
The fair value of derivative financial instruments reflects the estimated amount that the Company would have been required to pay if forced to settle all unfavourable outstanding contracts or the amount that would be received if forced to settle all favourable contracts at the reporting date. The fair value represents a point-in-time estimate that may not be relevant in predicting the Company’s future earnings or cash flows.
The Company’s derivative financial instruments include derivative instruments to manage its exposure associated with changes in the fair value of its DSU plans and the cost of its RSU plan, and foreign exchange forward contracts and collar arrangements to hedge the foreign currency exposure on its net investment in VerticalScope. The fair value of the derivative instruments used to manage the Company’s exposure under the DSU and RSU plans is classified within Level 2 and is based on the movement in the Company’s share price between the quarterly settlement date and the reporting date which are observable inputs.
The fair value of the foreign exchange forward contracts and collar arrangements is classified within Level 2 as it is based on foreign currency rates quoted by banks and is the difference between the forward exchange rate and the contract rate.
The fair value of portfolio investments that have quoted market prices is classified within Level 1 except when the securities are not actively traded and thus classified within Level 2. The fair value of portfolio investments that do not have quoted market prices is classified within Level 3 and determined when possible using a valuation technique that maximizes the use of observable market inputs and unobservable market inputs such as earnings multiples and cash flow projections.
(g) Inventories
Inventories are valued at the lower of cost and net realizable value. Net realizable value is the estimated selling price in the ordinary course of business, less estimated costs of completion and estimated costs necessary to make the sale. Raw materials are valued at purchase cost on a first in, first out basis. The cost of finished goods and work in progress includes raw materials, translation and printing and production costs. Provisions are made for slow moving and obsolete inventory. If the carrying value exceeds the net realizable amount, a writedown is recognized. The writedown may be reversed in a subsequent period if the circumstances causing it no longer exist.
(h) Property, plant and equipment
Property, plant and equipment are stated at cost or at fair value as deemed cost, net of accumulated depreciation and any accumulated impairment losses. Cost includes expenditures that are directly attributable to the acquisition of the asset. When significant parts of property, plant and equipment are required to be replaced in intervals, the Company recognizes such parts as individual assets with specific useful lives and depreciation, respectively. Likewise, when a major inspection is performed, its cost is recognized in the carrying amount of the plant and equipment as a replacement if the recognition criteria are satisfied. All other repair and maintenance costs are recognized in the consolidated statement of income or loss as incurred.

TORSTAR – Consolidated Financial Statements
15
Depreciation is calculated using the straight-line basis over the estimated useful life of the asset as follows:
• Buildings Structural 25 – 60 years Components 10 – 35 years
• Machinery and equipment Machinery and equipment 3 – 40 years Furniture and fixtures 3 – 10 years
• Leasehold improvements Term of the lease plus renewal periods, when renewal is reasonably assured
The useful lives and methods of depreciation and the assets’ residual values are reviewed at least annually, and the depreciation charge is adjusted prospectively, if appropriate.
An item of property, plant and equipment and any significant part initially recognized is derecognized upon disposal or when no future economic benefits are expected from its use or disposal. Any gain or loss arising on derecognition of the asset is included in the consolidated statement of income or loss when the asset is derecognized.
(i) Intangible assets
Intangible assets are recognized separately from goodwill when they are separable or arise from contractual or other legal rights and their fair value can be measured reliably. The useful lives of intangible assets are assessed as either finite or indefinite.
Intangible assets which have a finite useful life are amortized over the useful economic life of the asset and are stated at cost less accumulated amortization and any accumulated impairment losses. The amortization period and the amortization method for an intangible asset with a finite useful life are reviewed at least annually. Changes in the expected useful life or the expected pattern of consumption of future economic benefits is accounted for by changing the amortization period or method, as appropriate, and adjusted prospectively.
Amortization is calculated using the straight-line basis over the estimated useful life of the asset as follows:
• Software 3 – 10 years• Customer relationships and other 2 – 10 years• Trademarks 2 – 5 years• Domain names 5 – 10 years• Other 5 – 10 years
Gains or losses arising from derecognition of an intangible asset are measured as the difference between the net disposal proceeds and the carrying amount of the asset and are recognized in the consolidated statement of income or loss when the asset is derecognized.
(j) Business combinations and goodwill
Business combinations are accounted for using the acquisition method. The cost of an acquisition is measured as the aggregate of the consideration transferred, measured at acquisition date fair value and the amount of any non-controlling interest in the acquiree. Acquisition costs incurred are expensed in the consolidated statement of income or loss.
When the Company acquires a business, it assesses the financial assets and liabilities assumed for appropriate classification and designation in accordance with the contractual terms, economic circumstances and pertinent conditions at the acquisition date. If the business combination is achieved in stages, the acquisition date fair value of the Company’s previously held equity or jointly controlled interest in the acquiree is remeasured to fair value at the acquisition date through profit or loss. Any contingent consideration to be transferred by the Company will be recognized at fair value at the acquisition date. Subsequent changes to the fair value of the contingent consideration

TORSTAR – Consolidated Financial Statements
16
which is deemed to be an asset or liability will be recognized in accordance with IAS 39, Financial Instruments: Recognition and Measurement, either in the consolidated statement of income or loss or as a change to OCI.
Goodwill represents the excess of the cost of an acquisition over the fair value of the Company’s share of the net identifiable assets of the acquired business at the date of acquisition. If this consideration is lower than the fair value of the net assets acquired, the difference is recognized in the consolidated statement of income or loss. After initial recognition, goodwill is measured at cost less any accumulated impairment losses.
(k) Non-current assets held for sale and discontinued operations
The Company classifies non-current assets and disposal groups as held for sale if their carrying amounts will be recovered principally through a sale rather than through continuing use. Such non-current assets and disposal groups classified as held for sale are measured at the lower of their carrying amount and fair value less costs to sell.
The criteria for held for sale classification is regarded as met only when the sale is highly probable and the asset or disposal group is available for immediate sale in its present condition. Remaining actions required to complete the sale should indicate that it is unlikely that significant changes to the sale will be made or that the sale will be withdrawn. Additionally, the sale should be expected within one year from the date of the classification.
Property, plant and equipment and intangible assets are not depreciated or amortized once classified as held for sale. Assets and liabilities classified as held for sale are presented separately as current items in the consolidated statement of financial position.
A disposal group qualifies as a discontinued operation if it is:• A component of the Company that is a cash generating unit (“CGU”) or a group of CGUs;• A major line of business or major geographical area; or • Classified as held for sale or already disposed in such a way.
Discontinued operations are excluded from the results of continuing operations and are presented as a single amount, net of tax, as income or loss from discontinued operations in the consolidated statement of income or loss.
(l) Impairment of non-financial assets
Property, plant and equipment, intangible assets and goodwill are tested for impairment when events or changes in circumstances indicate the carrying value may not be recoverable. Additionally, intangible assets with an indefinite useful life and goodwill are subject to an annual impairment test. For the purpose of measuring recoverable amounts, assets are grouped at the lowest levels for which there are separately identifiable cash inflows (a CGU). The test for impairment for property, plant and equipment, intangible assets or goodwill is to compare the recoverable amount of the asset or CGU to the carrying value. The recoverable amount is the greater of fair value less costs to sell ("FVLCS"), and value in use ("VIU"). An impairment loss is recognized for the amount by which the asset’s carrying value exceeds its recoverable amount. In its assessment of the recoverable amounts of the group of CGUs at both December 31, 2017 and December 31, 2016, the Company considered both the VIU and FVLCS approaches.
Goodwill acquired through a business combination is allocated to each CGU or group of CGUs that is expected to benefit from the related business combination. For internal management purposes, goodwill is monitored at the operating segment level which represents a group of CGUs. Goodwill is not amortized.
The Company evaluates impairment losses, other than goodwill impairment, for potential reversals when events or circumstances warrant such consideration.
The VIU calculation uses cash flow projections for a five year period and a terminal value. The terminal value is the value attributed to the cash flow beyond the projected period using a perpetual growth rate. The key assumptions in the VIU calculations are:
• Earnings before interest, taxes, depreciation and amortization, restructuring and other charges, and impairment of assets (“Adjusted EBITDA”), growth rates (for periods within the cash flow projections and in perpetuity for the calculation of the terminal value), future levels of maintenance expenditures on capital and discount rates.

TORSTAR – Consolidated Financial Statements
17
• Adjusted EBITDA growth rates and future levels of capital expenditures are based on management’s best estimates considering historical and expected operating plans, strategic plans, economic conditions and the general outlook for the industry and markets in which the CGU or group of CGUs operates. The projections are based on the most recent financial budgets, approved by the Company’s Board of Directors, three year strategic plans and management forecasts beyond that period.
• In calculating the VIU, the Company uses a discount rate in order to establish values for each CGU or group of CGUs. The discount rate applied to each calculation is a pre-tax rate that reflects an optimal debt-to-equity ratio and considers the risk free rate, market equity risk premium, size premium and the risks specific to each CGU or group of CGUs cash flow projections.
• The perpetuity growth rate is based on management’s best estimates considering the industry, operating income trends and growth prospects for that specific CGU or group of CGUs.
The FVLCS calculation uses projections for a one year period and a forward multiple. The key assumptions in the fair value less cost to sell calculation are:
• Earnings before interest, taxes, depreciation and amortization, restructuring and other charges, and impairment of assets (“Adjusted EBITDA”). The projections are based on the most recent financial budgets approved by the Company’s Board of Directors.
• Forward multiples which are based on public market data including information from analysts covering the Company as well as competitor data.
(m) Revenue recognition
The Company has a number of different revenue streams. Print and digital advertising revenue is primarily generated through the provision of advertisements in print publications as well as on various digital platforms. Revenue from circulation/subscribers is largely generated by home delivery subscriptions; single copy sales at newsstands and vending machines; and the provision of digital format subscriptions. Distribution revenue is primarily generated from the delivery of flyers to consumers on behalf of advertisers. Other revenues are generated from the provision of commercial printing for external customers as well as the sale of various products.
Print advertising and distribution revenue
Revenue related to print advertising and flyer distribution is recognized when a print advertisement or flyer is included in the newspaper and the newspapers are delivered to the reader.
Digital advertising revenue
The Company has a number of digital advertising revenue streams. The majority of the Company’s digital revenue is recognized when advertisements are placed on digital platforms and to a lesser extent when a user clicks on an advertisement, on a per click basis.
Circulation/subscription revenue
In respect of revenue from circulation/subscribers related to print newspapers, the Company recognizes revenue at the time of delivery of the newspaper to the customer/subscriber. Revenue from single copy sales is recognized net of a provision for returns based on historical rates of returns. In the case of revenue from subscribers, revenue is recognized proportionately over the term of the subscription.
Other revenue
Other revenue is recognized upon delivery to or at the time that goods are made available to the customer. For example, when products are printed for external customers, revenue is recognized at the time that such materials are made available to the customer. In the case of product sales, revenue is recognized per the terms of delivery.

TORSTAR – Consolidated Financial Statements
18
(n) Employee benefits
The Company maintains both defined benefit and capital accumulation ("defined contribution") employee benefit plans. Details with respect to accounting for defined benefit employee future benefit plans are as follows:
• The net asset or net liability recognized in the consolidated statement of financial position is the present value of the defined benefit obligation at the reporting date less the fair value of the plan assets. The service cost and obligations of pensions and post employment benefits earned by employees are calculated annually by independent actuaries using the projected unit credit method prorated on service and management's best estimate of assumptions of salary increases, retirement ages of employees and expected health care costs.
• The present value of the defined benefit obligation is determined by discounting estimated future cash flows using the current interest rate at the reporting date on high quality fixed income investments with maturities that match the expected maturity of the obligations.
• Net interest is determined by multiplying the net defined benefit liability or asset by the discount rate used to determine the defined benefit obligation (at the beginning of the year) and is included in Interest and financing costs in the consolidated statement of income or loss.
• Past service costs are recognized immediately in the consolidated statement of income or loss.
• Current service costs, past service costs, special termination benefits, curtailment gains or losses and administration costs are recognized in the consolidated statement of income or loss and are included in Salaries and benefits or Restructuring and other charges, as applicable.
• Changes in actuarial gains and losses that arise in calculating the present value of the defined benefit obligation and the fair value of plan assets are recognized in OCI in the period in which they arise and charged or credited to retained earnings. On an interim basis, management estimates the changes in the actuarial gains and losses. These estimates are adjusted when the annual valuation or estimate is completed by the independent actuaries.
• For the funded plans, the value of any minimum funding requirements (as determined by applicable pension legislation) is recognized to the extent that the amounts are considered recoverable. Recoverability is limited to the extent to which the Company can reduce the future contributions to the plan.
Company contributions to defined contribution plans are expensed as incurred.
Termination benefits are expensed at the earlier of the time at which the Company can no longer withdraw the offer of those benefits and the time at which the Company recognizes costs for a restructuring. Benefits which are not expected to be settled wholly within twelve months from the end of the reporting period are discounted.
(o) Share-based compensation plans
The Company has a share option plan, an employee share purchase plan (“ESPP”), two DSU plans and an RSU plan.
Share option plan and ESPP
Eligible senior executives may be granted options to purchase Class B non-voting shares at an option price which shall not be less than the closing market price of the shares on the last trading day before the grant. Share options vest, and are expensed, over four years from the date of grant.
Under the Company’s ESPP, employees may subscribe for Class B non-voting shares of the Company to be paid for through payroll deductions over two-year periods at a purchase price which is the lower of the market price on the entry date or the market price at the end of the payment period. The value of the shares that an employee may subscribe for is restricted to a maximum of 20% of salary at the beginning of the two-year period.
TORSTAR – Consolidated Financial Statements
19
The fair value of share options granted and ESPP subscriptions are measured using the Black-Scholes pricing model. For share options, the model considers each tranche with graded vesting features as a separate share option grant. Forfeitures are estimated on the grant date and are revised as the actual forfeitures differ from estimates.
The fair value of share options granted and ESPP subscriptions is recognized as compensation expense over the vesting and subscription periods with a related credit to contributed surplus. The contributed surplus balance is reduced as options are exercised and as the ESPP matures through a credit to share capital. The consideration paid by option holders and the ESPP subscribers is credited to share capital when the options are exercised or when the plan matures.
DSUs
Eligible executives may elect to receive certain cash incentive compensation in the form of DSUs. Each DSU is equal in value to one Class B non-voting share of the Company and is issued on the basis of the closing market price per share of Class B non-voting shares of the Company on the Toronto Stock Exchange on the date of issue. DSUs also accrue dividend equivalents payable in additional units in an amount equal to dividends paid on Class B non-voting shares of the Company.
The Company has also adopted a DSU plan for non-employee directors. Each non-employee director receives an award of DSUs as part of his or her annual Board retainer. In addition, a non-employee director holding less than the minimum shareholding requirement of Class B non-voting shares, Class A voting shares, DSUs, or a combination thereof, receives the cash portion of his or her annual Board retainer in the form of DSUs. Any non-employee director may also elect to participate in the DSU plan in respect of part or all of his or her retainer and attendance fees. The terms of the director DSU plan are substantially the same as the executive DSU plan.
Compensation expense is recorded in the year DSUs are granted and changes in the fair value of outstanding DSUs, including deemed dividend equivalents, are recorded as an expense in the period that they occur. DSUs can only be redeemed once the executive or director is no longer employed with the Company whereupon the executive or director is entitled to receive the fair market value of the equivalent number of Class B non-voting shares, net of withholdings, in cash. Outstanding DSUs are recorded as long-term liabilities.
RSUs
Eligible executives may be granted RSU awards equivalent in value to Class B non-voting shares of the Company as part of their long-term incentive compensation. RSUs vest after three years and are settled in cash. RSU grants accrue dividend equivalents payable in additional units in an amount equal to dividends paid on Class B non-voting shares of the Company. RSUs are accrued over the three-year vesting period as compensation expense and a related liability. Forfeitures are estimated on the grant date and revised if the actual forfeitures differ from the estimates. The liability is recorded at fair value at each reporting date. Accrued RSUs are recorded as long-term liabilities, except for the portion that will vest within twelve months which is recorded as a current liability.
(p) Taxes
Tax expense comprises current and deferred tax. Tax expense is recognized in the consolidated statement of income or loss, unless it relates to items recognized outside the consolidated statement of income or loss. Tax expense relating to items recognized outside of the consolidated statement of income or loss is recognized in correlation to the underlying transaction in either OCI or equity.
Current income tax
Current income tax assets and liabilities for the current and prior periods are measured at the amount expected to be recovered from or paid to the taxation authorities. The tax rates and tax laws used to compute the amount are those that are enacted or substantively enacted at the reporting date.

TORSTAR – Consolidated Financial Statements
20
Deferred income tax
Deferred income tax is provided using the liability method for temporary differences between the tax bases of assets and liabilities and their carrying amount for financial reporting purposes. Deferred income tax assets and liabilities are measured using substantively enacted tax rates and laws at the reporting date that are expected to be in effect when the temporary differences are expected to reverse.
Deferred income taxes are recognized for taxable temporary differences arising on investments in subsidiaries, associates and joint ventures except where the reversal of the temporary difference can be controlled and it is probable that the difference will not reverse in the foreseeable future. Deferred income tax assets and liabilities are not recognized for temporary differences that arise on initial recognition of assets and liabilities other than in a business combination.
Deferred income tax assets are recognized for all deductible temporary differences, carry forward of unused tax credits and unused tax losses to the extent that it is probable that sufficient taxable profit will be available against which they can be utilized.
(q) Provisions
Provisions are recognized if the Company has a present legal or constructive obligation as a result of past events, if it is probable that an outflow of resources will be required to settle the obligation, and a reliable estimate can be made of the amount of the obligation.
The amount recognized as a provision is the best estimate of the consideration required to settle the present obligation as of the date of the consolidated statement of financial position, taking into account the risks and uncertainties surrounding the obligation.
Provisions are discounted and measured at the present value of the expenditure expected to be required to settle the obligation, using a pre-tax rate that reflects the current market assessments of the time value of money and the risks specific to the obligation. The increase in the provision due to the passage of time is recognized as interest expense.
When some or all of the economic benefits required to settle a provision are expected to be recovered from a third party (for example, because the obligation is covered by an insurance policy), an asset is recognized if it is virtually certain that reimbursement will be received.
(r) Use of estimates and judgements
The preparation of the Company’s consolidated financial statements in conformity with IFRS requires management to make judgements, estimates and assumptions that affect the application of accounting policies and the reported amounts of revenues, expenses, assets, liabilities and the disclosure of contingent liabilities, at the end of the reporting period.
Management uses estimates when accounting for certain items such as revenues, allowance for doubtful accounts, useful lives of long-lived assets, asset impairments, provisions, share-based compensation plans, employee benefit plans, deferred income taxes, tax credits and goodwill impairment. Estimates are also made by management when recording the fair value of assets acquired and liabilities assumed in a business combination.
Estimates are based on a number of factors, including historical experience, current events and other assumptions that management believes are reasonable under the circumstances. By their nature, these estimates are subject to measurement uncertainty and actual results could differ. Estimates and underlying assumptions are reviewed on an ongoing basis. Revisions to accounting estimates are recognized in the period in which the estimates are revised and in any future periods affected.

TORSTAR – Consolidated Financial Statements
21
The more significant estimates and assumptions made by management are described below:
Employee benefits
The valuation by independent actuaries uses management’s assumptions for rate of compensation increase, trends in healthcare costs, employee turnover and expected mortality. However, the most significant assumption is the discount rate which is used to determine the present value of the future cash flows that are expected to be required to settle employee benefit obligations. The discount rate is based on the market yield on long-term high-quality corporate bonds with maturities matching the estimated cash flows from the benefit plan at the time of estimation. A lower discount rate would result in a higher employee benefit obligation. Further details about the assumptions used are provided in Note 19.
Impairment of non-financial assets
The Company tests goodwill and indefinite life intangible assets for impairment annually, or more frequently if there are indicators that impairment may have arisen. Impairment exists when the carrying value of an asset, CGU or group of CGUs exceeds its recoverable amount, which is the higher of its FVLCS and its VIU. The FVLCS calculation is based on available data from binding sales transactions in arm’s length transactions of similar assets or observable market prices for similar transactions, adjusted for the specific facts and circumstances, less incremental costs for disposing of the asset. The VIU calculation is based on a discounted cash flow model. The key estimates and assumptions used in arriving at the FVLCS and VIU are outlined in Note 2(l).
In calculating the recoverable amount, management is required to make several assumptions, including, but not limited to, expected future revenues, expected future cash flows, forward multiples and discount rates. Management's assumptions are influenced by current market conditions and levels of competition, both of which may affect expected revenues. Expected cash flows may be further affected by changes in operating costs beyond what is currently anticipated. Management has also made certain assumptions for the forward multiples, discount and terminal growth rates to reflect possible variations in the cash flows, however, the risk premiums expected by market participants, as reflected in forward multiples, related to uncertainties about the industry, specific reporting units or specific intangible assets may differ or change quickly, depending on economic conditions and other events. Changes in any of these assumptions may have a significant impact on the fair value of the investment, CGU or group of CGUs or intangible assets and the results of the related impairment testing.
As at December 31, 2017, the carrying value of investments, intangible assets and property plant and equipment represented 35%, 8%, and 11% respectively of total assets and each reporting segment had investments and intangible assets with carrying values subject to these estimates. As at December 31, 2016, the carrying value of investments, intangible assets, property, plant and equipment and goodwill represented 33%, 10%, 11% and 1%respectively of total assets. Additionally, as a result of rapid and significant shifts in the print and digital advertising markets, expected future revenues and cash flows, the Company has recorded impairment charges related to goodwill and investments totalling $11.1 million in the year ended December 31, 2017 ($7.5 million of impairment charges related to intangible assets and investments in the year ended December 31, 2016). These charges impact net income or loss but have no effect on cash flows.
More details are provided in Note 12.
Taxes
The Company is subject to income taxes in Canada, and the discontinued operations were also subject to income taxes in foreign jurisdictions. Significant judgement is required in determining the world-wide provision for income taxes. In the ordinary course of business, there are many transactions and calculations for which the ultimate tax determination is uncertain. Management uses judgement in interpreting tax laws and determining the appropriate rates and amounts in recording current and deferred income taxes, giving consideration to timing and probability. Actual income taxes could significantly vary from these estimates as a result of future events, including changes in income tax law or the outcome of reviews by tax authorities and related appeals. To the extent that the final tax outcome is different from the amounts that were initially recorded, such differences will impact the income tax provision in the period in which such determination is made.

TORSTAR – Consolidated Financial Statements
22
Deferred income tax assets are recognized for all deductible temporary differences, carry forward of unused tax credits and unused tax losses to the extent that it is probable that sufficient taxable profit will be available against which they can be utilized. When assessing the probability of taxable profit being available, management primarily considers prior years’ results, forecasted future results and non-recurring items. As such, the assessment of the Company’s ability to utilize tax losses carried forward is to a large extent judgement-based. If the future taxable results of the Company differ significantly from those expected, the Company would be required to increase or decrease the carrying value of the deferred income tax assets with a potentially material impact on the Company’s consolidated statement of financial position and consolidated statement of comprehensive income or loss. The carrying amount of deferred income tax assets is reassessed at each reporting period and reduced to the extent that it is no longer probable that sufficient taxable profits will be available to utilize all or part of the deferred income tax assets. Unrecognized deferred income tax assets are reassessed at each reporting period and are recognized to the extent that it is probable that there will be sufficient taxable profits to allow all or part of the asset to be recovered.
Further details on taxes are disclosed in Note 14.
Significant judgements made by management are described below:
Classification of investments as subsidiaries, joint ventures, associated businesses and portfolio investments.
Classification of investments requires judgement on whether the Company controls, has joint control or significant influence over the strategic financial and operating decisions relating to the activity of the investee. In assessing the level of control or influence that the Company has over an investment, management considers ownership percentages, board representation as well as other relevant provisions in shareholder agreements. If an investor holds 20% or more of the voting power of the investee, it is presumed that the investor has significant influence, unless it can be clearly demonstrated that this is not the case. Conversely, if the investor holds less than 20% of the voting power of the investee, it is presumed that the investor does not have significant influence, unless such influence can be clearly demonstrated.
The Company has classified its investment in VerticalScope as an associated business (rather than being consolidated subsidiary or classified as a joint venture) based on management’s judgement that the Company does not have control but has significant influence, based on rights to board representation and other provisions in the shareholders agreement. The Company has classified its investments in Black Press Ltd., Blue Ant Media Inc. and up until July 5, 2016, Shop.ca Network Inc. as associated businesses based on management’s judgement that the Company has significant influence despite holding less than 20%, based on rights to board representation and other provisions in the respective shareholders’ agreements.
Classification of cash equivalents
Classification of cash equivalents requires judgement on whether the short-term investments are easily convertible into cash. Short-term investments with maturities on acquisition of 90 days or less are presumed to be cash equivalents due to the short holding period of the investment. The Company has classified its short-term investments with original maturities on acquisition of over 90 days but less than 365 days as cash equivalents based on management’s judgement that the short-term investments are liquid as the Company has a contractual right to convert them into cash upon 30 days notice without loss of interest after the initial 30 days.
Determination of operating segments, reportable segments and CGUs
During the fourth quarter of 2017, the Company realigned its operating segments into Community Brands and Daily Brands in order better align its operations by type of publication. The Company has three reportable operating segments: Community Brands ("Communities"), Daily Brands ("Dailies") and Digital Ventures. “Corporate” is the provision of corporate services and administrative support. Digital businesses outside the traditional newspaper operations are managed as one operating segment - Digital Ventures, and remains a separate reportable segment. The Company’s chief operating decision-maker (“CODM”) monitors the operating results of the operating segments for the purpose of assessing performance. Segment performance is evaluated based on operating profit which corresponds to operating profit as measured in the consolidated financial statements except that it includes the proportionately consolidated share of joint venture operations. Decisions regarding resource allocation are made at the reportable operating segment level.

TORSTAR – Consolidated Financial Statements
23
Within the Communities operating segment, the Company has identified a number of CGUs including the community newspapers and their flyer distribution, printing operations as well as a number of separate digital CGUs. In addition, the Company has identified two CGUs within the Dailies operating segment, which includes all daily newspapers and their respective flyer distribution as well as a number of other smaller digital platforms and publications. Within the Digital Ventures segment, the Company has identified eyeReturn Marketing as one CGU.
(s) Changes in accounting policies
Policies adopted in 2017:
Several new amendments and interpretations applied for the first time in 2017. However, they had little or no impact on the consolidated financial statements of the Company.
The Company has not early adopted any other standard, interpretation or amendment that has been issued but is not yet effective.
Future changes in accounting standards:
There are several new standards and amendments to accounting standards which will be effective for the Company subsequent to 2017, however, only the following new standards are expected to have a material impact on the interim or annual consolidated financial statements or disclosures of the Company:
IFRS 15 Revenue from Contracts with Customers
In May 2014, the IASB issued IFRS 15 Revenue from Contracts with Customers which specifies how and when an entity will recognize revenue as well as requiring such entities to provide users of financial statements with more informative, relevant disclosures. The standard provides a single, principles based five-step model to be applied to all contracts with customers. The Company has evaluated the new standard and there is no material impact on the consolidated financial statements from the adoption of this standard. The Company plans to adopt the standard on its effective date of January 1, 2018 and will present additional disclosure upon adoption.
IFRS 9 Financial Instruments
In July 2014, the IASB issued a finalized version of IFRS 9 Financial Instruments which contains accounting requirements for financial instruments. The Company has evaluated the application of IFRS 9 and expects that (i) portfolio investments will be classified as fair value through other comprehensive income and, (ii) the hedge of the net investment in VerticalScope will be treated as a continuing hedge and previously recognized gains from the change in fair value of the hedges will be reclassified from retained earnings to a new category in the consolidated statement of changes in equity. The Company plans to adopt the standard on its effective date of January 1, 2018 and will also present additional disclosure upon adoption of IFRS 9.
IFRS 16 Leases
In January 2016, the IASB issued IFRS 16 which supersedes IAS 17 Leases and related interpretations. The new standard provides a single lessee accounting model which eliminates the distinction between operating and finance leases, by requiring lessees to recognize assets and liabilities for all leases unless the underlying asset has a low value or the lease term is 12 months or less. Lessor accounting remains largely unchanged and the distinction between operating and finance leases is retained. The Company does not anticipate early adoption and plans to adopt the standard on its effective date of January 1, 2019. The Company is in the process of reviewing the standard to determine the impact on the consolidated financial statements.

TORSTAR – Consolidated Financial Statements
24
3. SEGMENTED INFORMATION
During the fourth quarter of 2017, the Company realigned its management structure and operating segments into Community Brands and Daily Brands in order to better align its operations by type of publication. The Company has three reportable operating segments: Communities, Dailies and Digital Ventures. Corporate is the provision of corporate services and administrative support. Digital businesses outside the traditional newspaper operations are managed as one operating segment - Digital Ventures, and remains a separate reportable segment. The Company’s chief operating decision-maker (“CODM”) monitors the operating results of the operating segments for the purpose of assessing performance. Segment performance is evaluated based on operating profit which corresponds to operating profit as measured in the consolidated financial statements except that it includes the proportionately consolidated share of joint venture operations. Decisions regarding resource allocation are made at the reportable operating segment level.
Year ended December 31, 2017 Communities DailiesDigital
Ventures Corporate Total
Adjustments and
Eliminations¹
PerConsolidatedStatement of
LossOperating revenue $304,253 $315,050 $72,297 $691,600 ($75,915) $615,685Salaries and benefits (140,693) (100,428) (23,476) ($6,983) (271,580) 25,674 (245,906)Other operating costs (132,643) (188,439) (23,290) (3,931) (348,303) 22,672 (325,631)Amortization and depreciation (13,352) (21,491) (32,025) (66,868) 29,881 (36,987)Restructuring and othercharges (11,136) (6,533) (981) (200) (18,850) 1,338 (17,512)Impairment of assets (11,133) (11,133) 3,000 (8,133)
Reportable segment operatingprofit (loss) $6,429 ($1,841) ($18,608) ($11,114) ($25,134) $6,650 ($18,484)
Interest and financing costs (2,213)Foreign exchange 493Loss from joint ventures (1,845)Loss from associatedbusinesses (6,824)Other income 3,935
Loss before taxes fromcontinuing operations ($24,938)
Year ended December 31, 2016 Communities DailiesDigital
Ventures Corporate Total
Adjustments and
Eliminations¹
PerConsolidatedStatement of
LossOperating revenue $332,379 $355,337 $73,981 $761,697 ($76,598) $685,099Salaries and benefits (155,715) (138,115) (22,489) ($8,078) (324,397) 25,082 (299,315)Other operating costs (141,333) (210,077) (25,352) (2,614) (379,376) 23,184 (356,192)Amortization and depreciation (12,865) (29,451) (79,642) (66) (122,024) 78,004 (44,020)Restructuring and othercharges (13,504) (32,531) (262) (610) (46,907) 1,084 (45,823)Impairment of assets (800) (6,700) (7,500) 6,700 (800)Reportable segment operating
profit (loss) $8,162 ($54,837) ($60,464) ($11,368) ($118,507) $57,456 ($61,051)Interest and financing costs (3,080)Foreign exchange 298Loss from joint ventures (5,532)Loss from associatedbusinesses (34,919)Other income 24,348Loss before taxes from
continuing operations ($79,936)

TORSTAR – Consolidated Financial Statements
25
¹ Adjustments and eliminations represent the elimination of the proportionately consolidated results of, and transactions with joint ventures and VerticalScope.
The following charts provide a breakdown of total segmented operating revenue for the years ended December 31, 2017 and December 31, 2016.
Year ended December 31, 2017
Communities Dailies Digital Ventures Total
$ % $ % $ % $ %
Print advertising $125,520 41.3% $144,864 46.0% $270,384 39.1%
Digital advertising 30,747 10.1% 25,495 8.1% $72,297 100.0% 128,539 18.6%
Distribution 110,883 36.4% 18,991 6.0% 129,874 18.8%
Subscriber 715 0.2% 114,262 36.3% 114,977 16.6%
Other 36,388 12.0% 11,438 3.6% 47,826 6.9%
Total $304,253 100.0% $315,050 100.0% $72,297 100.0% $691,600 100.0%
Year ended December 31, 2016
Communities Dailies Digital Ventures Total
$ % $ % $ % $ %
Print advertising $145,817 43.9% $176,722 49.7% $322,539 42.3%
Digital advertising 31,854 9.6% 27,288 7.7% $73,981 100.0% 133,123 17.5%
Distribution 117,147 35.2% 21,965 6.2% 139,112 18.3%
Subscriber 934 0.3% 119,194 33.5% 120,128 15.8%
Other 36,627 11.0% 10,168 2.9% 46,795 6.1%
Total $332,379 100.0% $355,337 100.0% $73,981 100.0% $761,697 100.0%
Geographical information
The Company operates in the following main geographical areas:
Revenue¹ Non-current assets²
Year ended December 31 As at December 31
2017 2016 2017 2016
Canada $612,266 $681,731 $95,476 $126,047United States 3,419 3,368
Total $615,685 $685,099 $95,476 $126,047
¹ Revenue is allocated based on the country in which the order is received.² Non-current assets include property, plant and equipment; intangible assets and goodwill.
4. INVESTMENTS IN SUBSIDIARIES
The Company’s material subsidiaries are: Toronto Star Newspapers Limited and Metroland Media Group Ltd., which are Ontario corporations and Free Daily News Group Inc., which is a New Brunswick corporation. The Company has 100% voting and equity securities interest in each of these corporations.
The principal activities of these subsidiaries are described in Note 3.

TORSTAR – Consolidated Financial Statements
26
5. RESTRICTED CASH
At December 31, 2017, the Company had restricted cash totalling $9.1 million (December 31, 2016 – $11.8 million) which includes $7.7 million (December 31, 2016 – $10.5 million) held as collateral for outstanding standby letters of credit in respect of an unfunded executive retirement plan liability (Note 19).
In February 2016, the Company received $22.8 million related to the sale of Harlequin Enterprises Limited ("Harlequin") in August 2014 which had been held in an escrow account.
6. INVENTORIES
December 31, 2017 December 31, 2016Work in progress $73 $118Raw materials 4,253 4,711
$4,326 $4,829
The Company expensed inventory costs of $39.5 million for the year ended December 31, 2017 (2016 – $42.9 million).
7. INVESTMENTS IN JOINT VENTURES
The Company’s joint ventures include investments in Workopolis (50%) and Sing Tao Daily (approximately 50%).
The table below provides a continuity of Investments in joint ventures:
Year ended December 31
2017 2016
Balance, beginning of year $27,463 $32,861Loss from joint ventures (1,845) (5,532)Distributions from joint ventures (2,187) (159)Investment and other (11) 293
Balance, end of year $23,420 $27,463

TORSTAR – Consolidated Financial Statements
27
Summarized Supplemental Financial Information
The following is summarized supplemental financial information based on the Company’s proportionate share of the joint ventures:
(i) Statement of Financial Position
As at As at
December 31, 2017 December 31, 2016
Cash and cash equivalents $7,324 $7,880Other current assets 6,260 6,049Total current assets 13,584 13,929Total non-current assets 16,786 21,227
Total assets $30,370 $35,156
Current liabilities $6,216 $6,825Other non-current liabilities 734 868Total equity 23,420 27,463
Total liabilities and equity $30,370 $35,156
(ii) Statements of Loss and Comprehensive Loss
Year ended December 31
2017 2016
Operating revenue $31,126 $36,634
Salaries and benefits (12,609) (14,739)
Other operating costs (14,327) (16,167)
Amortization and depreciation (1,816) (3,203)
Restructuring and other charges (814) (780)
Impairment of assets (note 12) (3,000) (6,700)Operating loss (1,440) (4,955)
Interest and financing costs (5) (21)
Foreign exchange 4 20
Other income (3)(1,444) (4,956)
Income and other taxes (401) (576)
Net loss and Comprehensive loss ($1,845) ($5,532)
8. INVESTMENTS IN ASSOCIATED BUSINESSES
As of December 31, 2017, the Company’s investments in associated businesses include a 19.4% equity interest in Black Press Ltd. (“Black Press”); a 15.9% equity investment in Blue Ant Media Inc. (“Blue Ant”); a 33.3% equity interest in Canadian Press Enterprises Inc. (“Canadian Press”); a 56.4% equity investment in VerticalScope and a
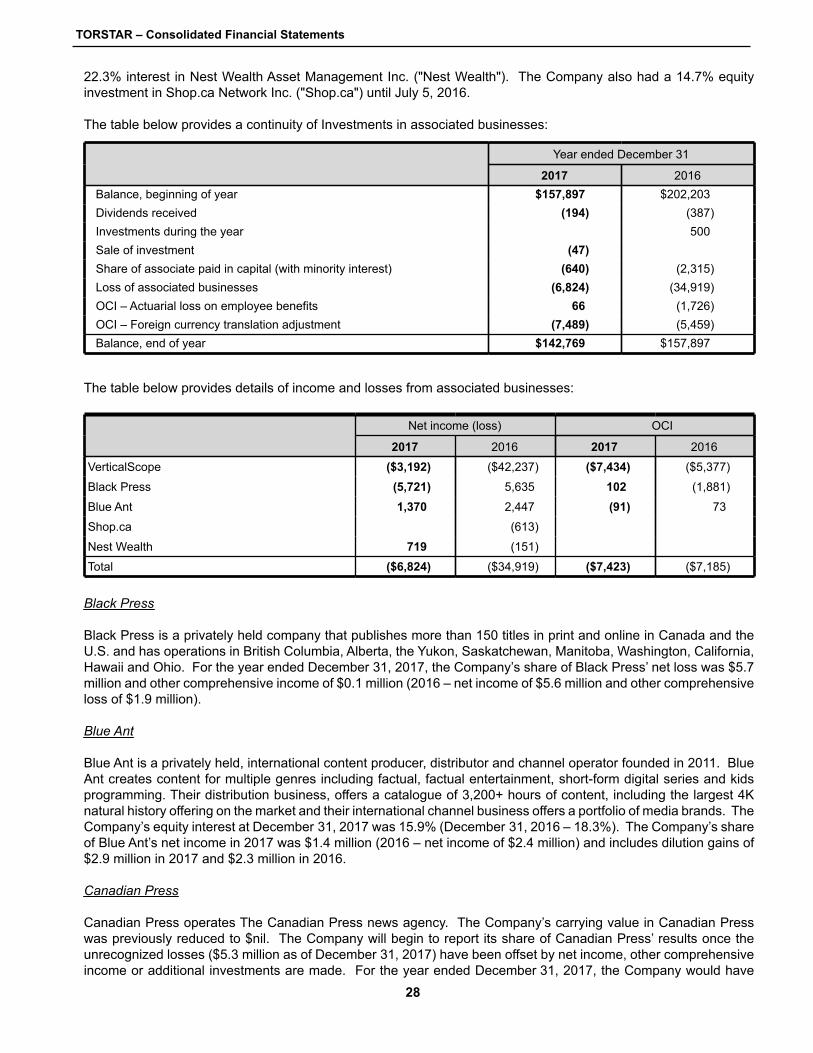
TORSTAR – Consolidated Financial Statements
28
22.3% interest in Nest Wealth Asset Management Inc. ("Nest Wealth"). The Company also had a 14.7% equity investment in Shop.ca Network Inc. ("Shop.ca") until July 5, 2016.
The table below provides a continuity of Investments in associated businesses:
Year ended December 31
2017 2016Balance, beginning of year $157,897 $202,203Dividends received (194) (387)Investments during the year 500Sale of investment (47)Share of associate paid in capital (with minority interest) (640) (2,315)Loss of associated businesses (6,824) (34,919)OCI – Actuarial loss on employee benefits 66 (1,726)OCI – Foreign currency translation adjustment (7,489) (5,459)Balance, end of year $142,769 $157,897
The table below provides details of income and losses from associated businesses:
Net income (loss) OCI
2017 2016 2017 2016
VerticalScope ($3,192) ($42,237) ($7,434) ($5,377)
Black Press (5,721) 5,635 102 (1,881)
Blue Ant 1,370 2,447 (91) 73
Shop.ca (613)
Nest Wealth 719 (151)
Total ($6,824) ($34,919) ($7,423) ($7,185)
Black Press
Black Press is a privately held company that publishes more than 150 titles in print and online in Canada and the U.S. and has operations in British Columbia, Alberta, the Yukon, Saskatchewan, Manitoba, Washington, California, Hawaii and Ohio. For the year ended December 31, 2017, the Company’s share of Black Press’ net loss was $5.7 million and other comprehensive income of $0.1 million (2016 – net income of $5.6 million and other comprehensive loss of $1.9 million).
Blue Ant
Blue Ant is a privately held, international content producer, distributor and channel operator founded in 2011. Blue Ant creates content for multiple genres including factual, factual entertainment, short-form digital series and kids programming. Their distribution business, offers a catalogue of 3,200+ hours of content, including the largest 4K natural history offering on the market and their international channel business offers a portfolio of media brands. The Company’s equity interest at December 31, 2017 was 15.9% (December 31, 2016 – 18.3%). The Company’s share of Blue Ant’s net income in 2017 was $1.4 million (2016 – net income of $2.4 million) and includes dilution gains of $2.9 million in 2017 and $2.3 million in 2016.
Canadian Press
Canadian Press operates The Canadian Press news agency. The Company’s carrying value in Canadian Press was previously reduced to $nil. The Company will begin to report its share of Canadian Press’ results once the unrecognized losses ($5.3 million as of December 31, 2017) have been offset by net income, other comprehensive income or additional investments are made. For the year ended December 31, 2017, the Company would have

TORSTAR – Consolidated Financial Statements
29
reported income of $1.1 million and other comprehensive loss of $1.8 million from Canadian Press (2016 – income of $0.3 million and other comprehensive loss of $1.8 million).
Shop.ca
For the year ended December 31, 2016, the Company’s share of Shop.ca’s net loss was $0.6 million. Shop.ca declared bankruptcy on July 5, 2016.
Nest Wealth
Nest Wealth is an online investment portfolio manager, or 'robo-advisor' in the financial technology sector. The Company's share of Nest Wealth's income was $0.7 million for the year ended December 31, 2017 (2016 – loss of $0.2 million).
VerticalScope
VerticalScope is a Toronto-based vertically focused digital media company with expertise in programmatic advertising which services the North American market through its network of user forums and premium content sites offering advertisers access to large audiences in popular verticals including automotive, powersports, outdoors, home and health.
The Company has acquired a 56.4% interest in VerticalScope. Pursuant to certain terms in the shareholders agreement, the investment is accounted for as an associated business using the equity method.
The following is summarized supplemental financial information for 100% of VerticalScope including the Company’s fair value adjustments on acquisition of the investment:
(i) Statement of Financial Position
As at December 31, 2017 As at December 31, 2016
Cash and cash equivalents $28,682 $24,310Other current assets 16,015 16,716Total current assets 44,697 41,026Total non-current assets 303,189 319,149
Total assets $347,886 $360,175
Current portion long-term debt $3,450 $6,009Other current liabilities 19,701 9,162Total current liabilities 23,151 15,171Long-term debt 130,920 115,692Other non-current liabilities 4,747 23,840Total equity 189,068 205,472
Total liabilities and equity $347,886 $360,175
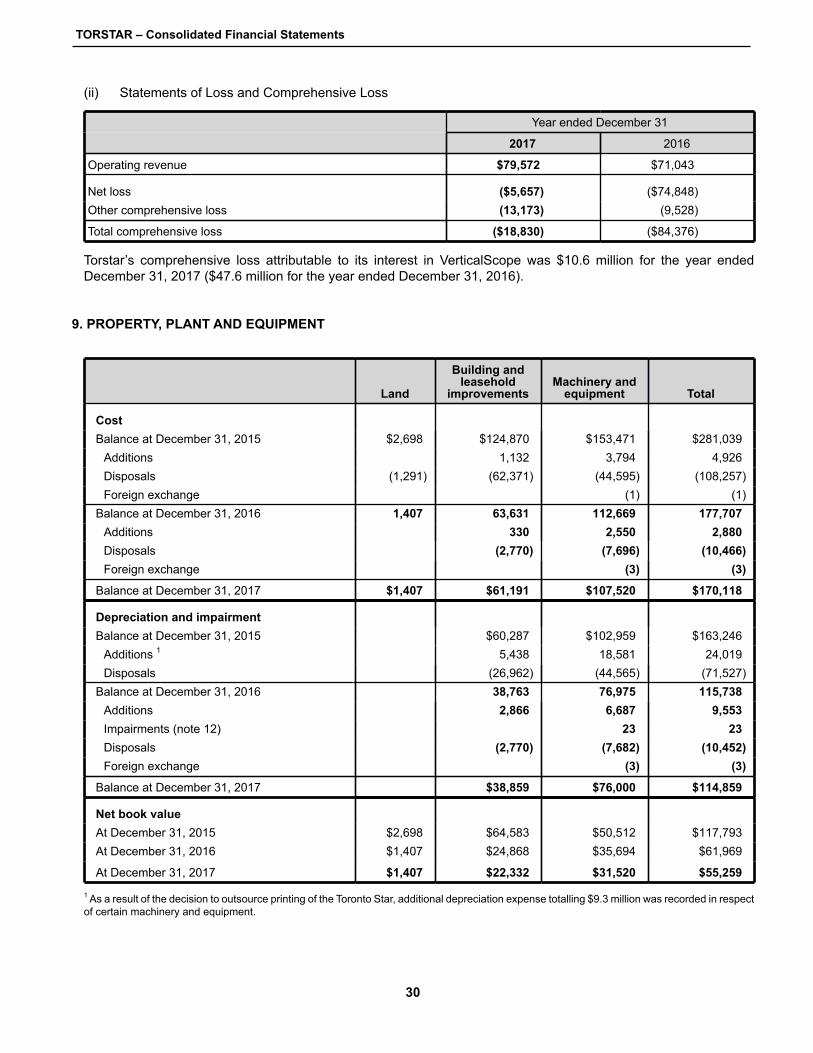
TORSTAR – Consolidated Financial Statements
30
(ii) Statements of Loss and Comprehensive Loss
Year ended December 31
2017 2016
Operating revenue $79,572 $71,043
Net loss ($5,657) ($74,848)Other comprehensive loss (13,173) (9,528)
Total comprehensive loss ($18,830) ($84,376)
Torstar’s comprehensive loss attributable to its interest in VerticalScope was $10.6 million for the year ended December 31, 2017 ($47.6 million for the year ended December 31, 2016).
9. PROPERTY, PLANT AND EQUIPMENT
Land
Building andleasehold
improvementsMachinery and
equipment Total
CostBalance at December 31, 2015 $2,698 $124,870 $153,471 $281,039
Additions 1,132 3,794 4,926Disposals (1,291) (62,371) (44,595) (108,257)Foreign exchange (1) (1)
Balance at December 31, 2016 1,407 63,631 112,669 177,707Additions 330 2,550 2,880Disposals (2,770) (7,696) (10,466)Foreign exchange (3) (3)
Balance at December 31, 2017 $1,407 $61,191 $107,520 $170,118
Depreciation and impairmentBalance at December 31, 2015 $60,287 $102,959 $163,246
Additions 1 5,438 18,581 24,019Disposals (26,962) (44,565) (71,527)
Balance at December 31, 2016 38,763 76,975 115,738Additions 2,866 6,687 9,553Impairments (note 12) 23 23Disposals (2,770) (7,682) (10,452)Foreign exchange (3) (3)
Balance at December 31, 2017 $38,859 $76,000 $114,859
Net book valueAt December 31, 2015 $2,698 $64,583 $50,512 $117,793At December 31, 2016 $1,407 $24,868 $35,694 $61,969
At December 31, 2017 $1,407 $22,332 $31,520 $55,259
1 As a result of the decision to outsource printing of the Toronto Star, additional depreciation expense totalling $9.3 million was recorded in respect of certain machinery and equipment.

TORSTAR – Consolidated Financial Statements
31
10. INTANGIBLE ASSETS
Indefinitelife
Finite life
TotalSoftware Other Total
CostBalance at December 31, 2015 $38,414 $94,814 $14,104 $108,918 $147,332
Additions - internally developed 4,871 4,871 4,871Additions - purchased 4,054 4,054 4,054Reclassifications ² (38,414) 38,414 38,414Disposals (16,531) (16,531) (16,531)
Balance at December 31, 2016 87,208 52,518 139,726 139,726Acquisitions (note 26) 5,339 5,339 5,339Additions - internally developed 1 4,091 4,091 4,091Additions - purchased 2,276 2,276 2,276Disposals (26,018) (26,018) (26,018)
Balance at December 31, 2017 $67,557 $57,857 $125,414 $125,414
Amortization and ImpairmentBalance at December 31, 2015 $19,276 $49,240 $10,995 $60,235 $79,511
Amortization 17,160 2,841 20,001 20,001Impairments (note 12) 800 800 800Reclassifications ² (19,276) 19,276 19,276Disposals (16,531) (16,531) (16,531)
Balance at December 31, 2016 49,869 33,912 83,781 83,781Amortization 20,479 6,955 27,434 27,434Disposals (26,018) (26,018) (26,018)
Balance at December 31, 2017 $44,330 $40,867 $85,197 $85,197
Net book valueAt December 31, 2015 $19,138 $45,574 $3,109 $48,683 $67,821At December 31, 2016 $37,339 $18,606 $55,945 $55,945
At December 31, 2017 $23,227 $16,990 $40,217 $40,217
¹ This amount includes $0.8 million for software in development for which amortization has not commenced.² During the year ended December 31, 2016, the Company both tested for impairment and then reclassified certain indefinite life intangible assets in the Communities and Dailies segments to finite life intangible assets to be amortized over a period of five to ten years.
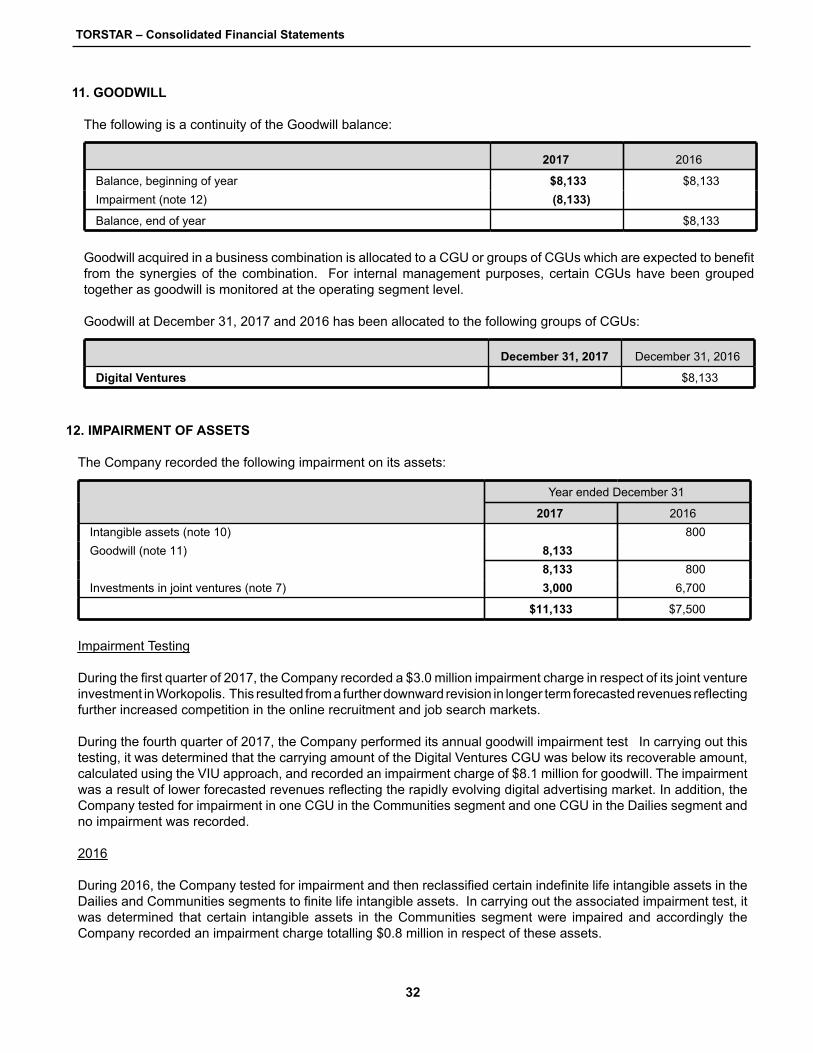
TORSTAR – Consolidated Financial Statements
32
11. GOODWILL
The following is a continuity of the Goodwill balance:
2017 2016
Balance, beginning of year $8,133 $8,133Impairment (note 12) (8,133)
Balance, end of year $8,133
Goodwill acquired in a business combination is allocated to a CGU or groups of CGUs which are expected to benefit from the synergies of the combination. For internal management purposes, certain CGUs have been grouped together as goodwill is monitored at the operating segment level.
Goodwill at December 31, 2017 and 2016 has been allocated to the following groups of CGUs:
December 31, 2017 December 31, 2016
Digital Ventures $8,133
12. IMPAIRMENT OF ASSETS
The Company recorded the following impairment on its assets:
Year ended December 31
2017 2016Intangible assets (note 10) 800Goodwill (note 11) 8,133
8,133 800Investments in joint ventures (note 7) 3,000 6,700
$11,133 $7,500
Impairment Testing
During the first quarter of 2017, the Company recorded a $3.0 million impairment charge in respect of its joint venture investment in Workopolis. This resulted from a further downward revision in longer term forecasted revenues reflecting further increased competition in the online recruitment and job search markets.
During the fourth quarter of 2017, the Company performed its annual goodwill impairment test In carrying out this testing, it was determined that the carrying amount of the Digital Ventures CGU was below its recoverable amount, calculated using the VIU approach, and recorded an impairment charge of $8.1 million for goodwill. The impairment was a result of lower forecasted revenues reflecting the rapidly evolving digital advertising market. In addition, the Company tested for impairment in one CGU in the Communities segment and one CGU in the Dailies segment and no impairment was recorded.
2016
During 2016, the Company tested for impairment and then reclassified certain indefinite life intangible assets in the Dailies and Communities segments to finite life intangible assets. In carrying out the associated impairment test, it was determined that certain intangible assets in the Communities segment were impaired and accordingly the Company recorded an impairment charge totalling $0.8 million in respect of these assets.
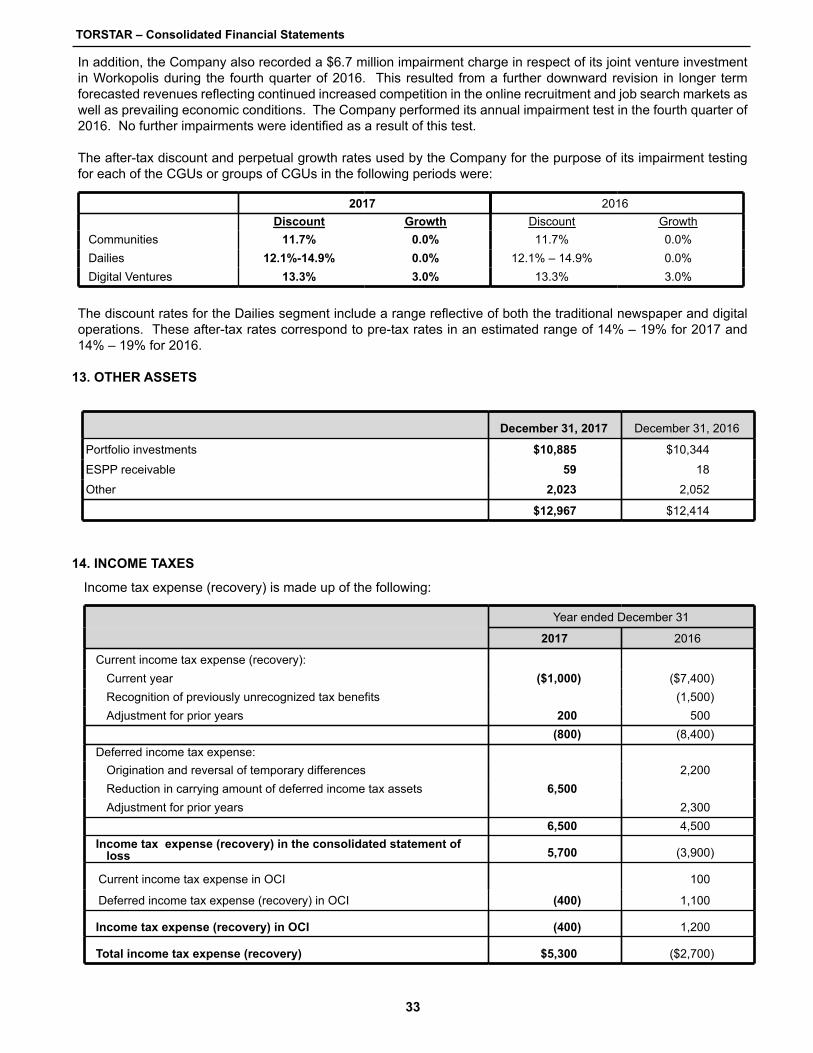
TORSTAR – Consolidated Financial Statements
33
In addition, the Company also recorded a $6.7 million impairment charge in respect of its joint venture investment in Workopolis during the fourth quarter of 2016. This resulted from a further downward revision in longer term forecasted revenues reflecting continued increased competition in the online recruitment and job search markets as well as prevailing economic conditions. The Company performed its annual impairment test in the fourth quarter of 2016. No further impairments were identified as a result of this test.
The after-tax discount and perpetual growth rates used by the Company for the purpose of its impairment testing for each of the CGUs or groups of CGUs in the following periods were:
2017 2016Discount Growth Discount Growth
Communities 11.7% 0.0% 11.7% 0.0%Dailies 12.1%-14.9% 0.0% 12.1% – 14.9% 0.0%Digital Ventures 13.3% 3.0% 13.3% 3.0%
The discount rates for the Dailies segment include a range reflective of both the traditional newspaper and digital operations. These after-tax rates correspond to pre-tax rates in an estimated range of 14% – 19% for 2017 and 14% – 19% for 2016.
13. OTHER ASSETS
December 31, 2017 December 31, 2016
Portfolio investments $10,885 $10,344
ESPP receivable 59 18
Other 2,023 2,052
$12,967 $12,414
14. INCOME TAXES
Income tax expense (recovery) is made up of the following:
Year ended December 31
2017 2016
Current income tax expense (recovery):Current year ($1,000) ($7,400)Recognition of previously unrecognized tax benefits (1,500)Adjustment for prior years 200 500
(800) (8,400)Deferred income tax expense:
Origination and reversal of temporary differences 2,200Reduction in carrying amount of deferred income tax assets 6,500Adjustment for prior years 2,300
6,500 4,500Income tax expense (recovery) in the consolidated statement of
loss 5,700 (3,900)
Current income tax expense in OCI 100
Deferred income tax expense (recovery) in OCI (400) 1,100
Income tax expense (recovery) in OCI (400) 1,200
Total income tax expense (recovery) $5,300 ($2,700)
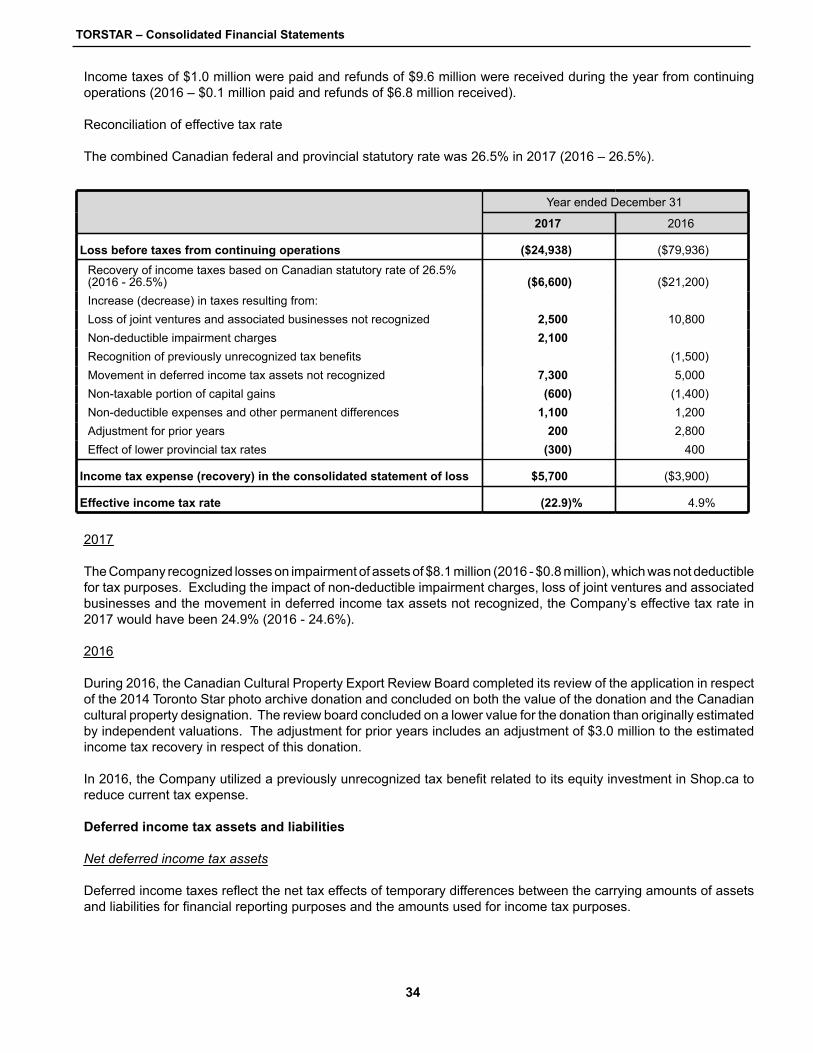
TORSTAR – Consolidated Financial Statements
34
Income taxes of $1.0 million were paid and refunds of $9.6 million were received during the year from continuing operations (2016 – $0.1 million paid and refunds of $6.8 million received).
Reconciliation of effective tax rate
The combined Canadian federal and provincial statutory rate was 26.5% in 2017 (2016 – 26.5%).
Year ended December 31
2017 2016
Loss before taxes from continuing operations ($24,938) ($79,936)
Recovery of income taxes based on Canadian statutory rate of 26.5%(2016 - 26.5%) ($6,600) ($21,200)Increase (decrease) in taxes resulting from:Loss of joint ventures and associated businesses not recognized 2,500 10,800Non-deductible impairment charges 2,100Recognition of previously unrecognized tax benefits (1,500)Movement in deferred income tax assets not recognized 7,300 5,000Non-taxable portion of capital gains (600) (1,400)Non-deductible expenses and other permanent differences 1,100 1,200Adjustment for prior years 200 2,800Effect of lower provincial tax rates (300) 400
Income tax expense (recovery) in the consolidated statement of loss $5,700 ($3,900)
Effective income tax rate (22.9)% 4.9%
2017
The Company recognized losses on impairment of assets of $8.1 million (2016 - $0.8 million), which was not deductible for tax purposes. Excluding the impact of non-deductible impairment charges, loss of joint ventures and associated businesses and the movement in deferred income tax assets not recognized, the Company’s effective tax rate in 2017 would have been 24.9% (2016 - 24.6%).
2016
During 2016, the Canadian Cultural Property Export Review Board completed its review of the application in respect of the 2014 Toronto Star photo archive donation and concluded on both the value of the donation and the Canadian cultural property designation. The review board concluded on a lower value for the donation than originally estimated by independent valuations. The adjustment for prior years includes an adjustment of $3.0 million to the estimated income tax recovery in respect of this donation.
In 2016, the Company utilized a previously unrecognized tax benefit related to its equity investment in Shop.ca to reduce current tax expense.
Deferred income tax assets and liabilities
Net deferred income tax assets
Deferred income taxes reflect the net tax effects of temporary differences between the carrying amounts of assets and liabilities for financial reporting purposes and the amounts used for income tax purposes.

TORSTAR – Consolidated Financial Statements
35
Significant components of the Company’s deferred income tax assets and liabilities as at December 31, 2017 and December 31, 2016 are as follows:
December 31,2016
Recognizedin net income
(loss) fromcontinuingoperations
Recognizedin OCI fromcontinuingoperations
Recognizedin net income
(loss) fromdiscontinuedoperations
December 31,2017
Provisions for returns and doubtful accounts $850 ($279) $571Property, plant and equipment (5,376) 429 (4,947)Intangible assets (3,468) 2,165 (1,303)Financial instruments 100 (100)Provision for employee benefit obligations (1,961) 1,961Share-based payment transactions 619 93 712Tax losses carried forward 3,279 453 3,732Provisions 5,662 (2,294) ($200) 3,168Goodwill 995 (16) 979Excess tax basis over carrying value of
investments 5,884 (6,284) $400Other (166) (2,628) (2,794)Net deferred income tax assets $6,418 ($6,500) $400 ($200) $118As reported in the consolidated statement
of financial positionDeferred income tax assets $11,322 $3,460Deferred income tax liabilities (4,904) (3,342)
Net deferred income tax assets $6,418 $118
December 31,2015
Recognizedin net income
(loss) fromcontinuingoperations
Recognizedin OCI fromcontinuingoperations
Recognizedin net income
(loss) fromdiscontinuedoperations
December 31,2016
Provisions for returns and doubtful accounts $1,124 ($274) $850Property, plant and equipment (4,639) (737) (5,376)Intangible assets (6,259) 2,791 (3,468)Financial instruments 900 (100) ($700) 100Provision for employee benefit obligations (1,761) (200) (1,961)Share-based payment transactions 666 (47) 619Tax losses carried forward 2,776 503 3,279Provisions 8,779 (2,217) ($900) 5,662Goodwill 1,098 (103) 995Excess tax basis over carrying value of
investments 7,776 (1,492) (400) 5,884Other 2,458 (2,624) (166)Net deferred income tax assets $12,918 ($4,500) ($1,100) ($900) $6,418As reported in the consolidated statement of
financial positionDeferred income tax assets $15,233 $11,322Deferred income tax liabilities (2,315) (4,904)
Net deferred income tax assets $12,918 $6,418
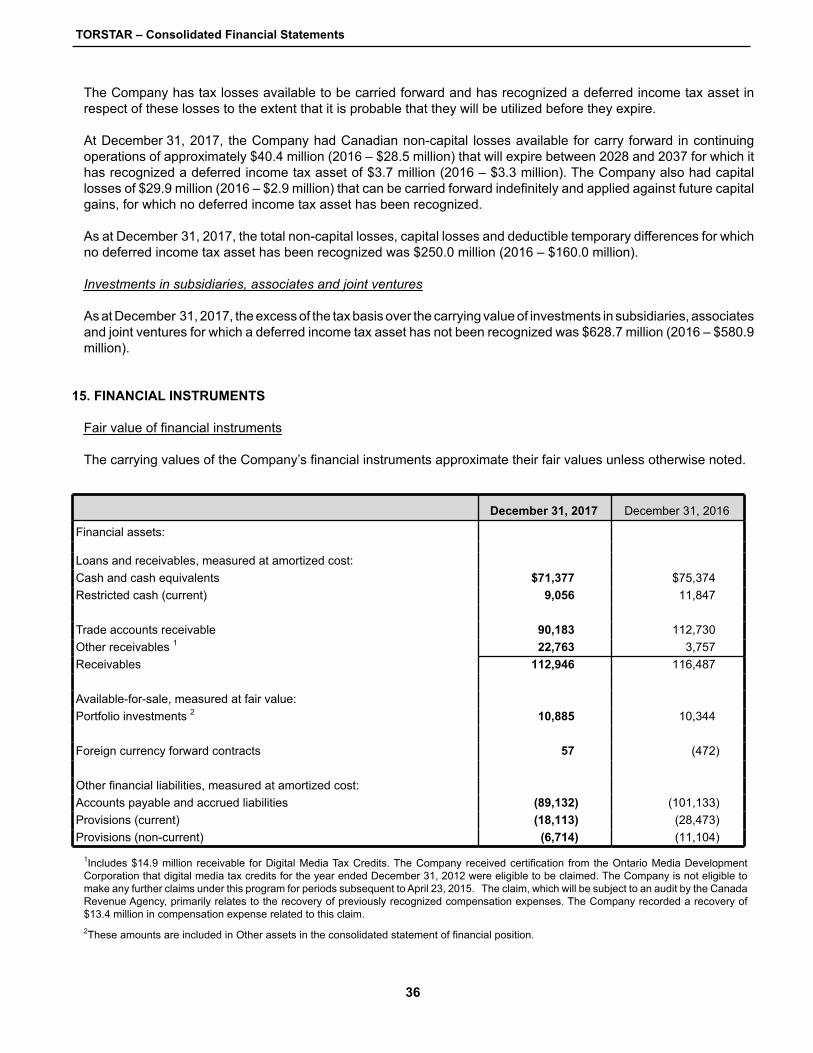
TORSTAR – Consolidated Financial Statements
36
The Company has tax losses available to be carried forward and has recognized a deferred income tax asset in respect of these losses to the extent that it is probable that they will be utilized before they expire.
At December 31, 2017, the Company had Canadian non-capital losses available for carry forward in continuing operations of approximately $40.4 million (2016 – $28.5 million) that will expire between 2028 and 2037 for which it has recognized a deferred income tax asset of $3.7 million (2016 – $3.3 million). The Company also had capital losses of $29.9 million (2016 – $2.9 million) that can be carried forward indefinitely and applied against future capital gains, for which no deferred income tax asset has been recognized.
As at December 31, 2017, the total non-capital losses, capital losses and deductible temporary differences for which no deferred income tax asset has been recognized was $250.0 million (2016 – $160.0 million).
Investments in subsidiaries, associates and joint ventures
As at December 31, 2017, the excess of the tax basis over the carrying value of investments in subsidiaries, associates and joint ventures for which a deferred income tax asset has not been recognized was $628.7 million (2016 – $580.9 million).
15. FINANCIAL INSTRUMENTS
Fair value of financial instruments
The carrying values of the Company’s financial instruments approximate their fair values unless otherwise noted.
December 31, 2017 December 31, 2016
Financial assets:
Loans and receivables, measured at amortized cost:Cash and cash equivalents $71,377 $75,374Restricted cash (current) 9,056 11,847
Trade accounts receivable 90,183 112,730Other receivables 1 22,763 3,757Receivables 112,946 116,487
Available-for-sale, measured at fair value:Portfolio investments 2 10,885 10,344
Foreign currency forward contracts 57 (472)
Other financial liabilities, measured at amortized cost:Accounts payable and accrued liabilities (89,132) (101,133)Provisions (current) (18,113) (28,473)Provisions (non-current) (6,714) (11,104)
1Includes $14.9 million receivable for Digital Media Tax Credits. The Company received certification from the Ontario Media Development Corporation that digital media tax credits for the year ended December 31, 2012 were eligible to be claimed. The Company is not eligible to make any further claims under this program for periods subsequent to April 23, 2015. The claim, which will be subject to an audit by the Canada Revenue Agency, primarily relates to the recovery of previously recognized compensation expenses. The Company recorded a recovery of $13.4 million in compensation expense related to this claim.2These amounts are included in Other assets in the consolidated statement of financial position.

TORSTAR – Consolidated Financial Statements
37
The fair value of financial assets and liabilities by level of hierarchy was as follows:
At December 31, 2017 At December 31, 2016
Level 1 Level 2 Level 3 Level 1 Level 2 Level 3
Measured at fair value:Portfolio investments $10,885 $10,344Derivative financial instruments:
- Foreign currency collar arrangements $57 ($472)
Changes in the fair value of Level 3 financial instruments were as follows:
Year ended December 31
2017 2016
Balance, beginning of year $10,344 $7,439Additions (note 26) 873 368Distributions received (373)Exchange differences and OCI (332) 2,910
Balance, end of year $10,885 $10,344
Interest and financing costs
Year ended December 31
2017 2016
Interest earned on short-term investments $484 $427Interest accretion costs (185) (355)
Interest – other 140 (81)Net financial expense related to employee benefit plans (2,652) (3,071)
($2,213) ($3,080)
Interest paid during the year ended December 31, 2017 was $nil (2016 – $0.1 million). Interest received during the year ended December 31, 2017 was $0.4 million (2016 – $0.5 million).
Risk management
The Company is exposed to various risks related to its financial assets and liabilities, which include liquidity risk, credit risk and market risk. These risk exposures are managed on an ongoing basis.
(i) Liquidity risk
Liquidity risk is the risk that the Company will not be able to meet its financial obligations as they fall due or at a reasonable cost. The Company manages liquidity risk by maintaining sufficient balances in cash and cash equivalents. As at December 31, 2017, the Company had $71.4 million in cash and cash equivalents (December 31, 2016 – $75.4 million).

TORSTAR – Consolidated Financial Statements
38
The maturity profile of the Company’s financial liabilities, based on contractual undiscounted payments, is as follows:
2018 2019 2020 2021 2022 2023+ Total
Foreign currency collar arrangements $57 $57Accounts payable and accrued
liabilities¹ 87,771 87,771Licenses 1,361 1,361Provisions 18,113 $2,676 $1,360 $779 $682 $1,684 25,294
$107,302 $2,676 $1,360 $779 $682 $1,684 $114,483
¹ This amount excludes the $1.4 million of Licenses payable in 2018.
(ii) Credit risk
In the normal course of business, the Company is exposed to credit risk from its accounts receivable from customers. The carrying amounts of accounts receivable are net of allowances for doubtful accounts. Allowances for doubtful accounts are estimated based on past experience, specific risks associated with the customer and other relevant information.
The Company is exposed to credit related losses in the event of non-performance by counterparties to derivative instruments. Given their high credit ratings, the Company does not anticipate any counterparties failing to meet their obligations. The Company has a policy, approved by the Board of Directors, of only contracting with major financial institutions as counterparties.
The maximum exposure to credit risk is the carrying value of the financial assets.
The following table sets out the ageing of the trade receivables:
December 31, 2017 December 31, 2016
Gross accounts receivable:Current $44,874 $55,624Up to three months past due date 42,570 52,247Three to twelve months past due date 7,095 10,151Impaired 260 65
94,799 118,087Allowances for doubtful accounts (4,616) (5,357)
$90,183 $112,730
The continuity of the allowance for doubtful accounts is as follows:
Year ended December 31
2017 2016
Balance, beginning of year ($5,357) ($5,294)Utilized 3,478 958Income statement movements (2,737) (1,021)
Balance, end of year ($4,616) ($5,357)

TORSTAR – Consolidated Financial Statements
39
(iii) Market risk
Market risk is the risk that changes in market prices, such as foreign exchange rates and interest rates will affect the Company’s income or the value of its financial instruments.
a. Foreign currency risk
The Company’s primary exposure to foreign currency risk is through its investment in VerticalScope, which is denominated in the U.S. dollar. In order to offset the foreign exchange risk on its consolidated statement of financial position from its net investment in VerticalScope, the Company entered into collar arrangements totaling U.S. $137.0 million which were designated as a hedge of the original net investment in VerticalScope. Any fluctuations in fair value arising from fluctuations in the rate of exchange of Cdn. dollar per U.S. dollar within the collar range will be recorded in net income while any fluctuations outside this collar range will be recorded in OCI to the extent of hedge effectiveness to offset any gains or losses on translation of the net investment. As at December 31, 2016, the collar arrangements for U.S. $137.0 million established a rate of exchange with a range of Cdn. $1.19 to Cdn. $1.46 for U.S. $1.00 maturing in 2017.
During the three month period ended March 31, 2017, the Company rolled over the collar arrangements totaling U.S. $137 million and simultaneously entered into a new U.S. $137.0 million zero cost collar arrangement with a range of Cdn. $1.20 to Cdn. $1.40 for U.S $1.00 maturing in 2018.
The hedges were highly effective during the year ended December 31, 2017. The change in the fair value of the hedges was a gain of $0.5 million which has been included in foreign exchange in the consolidated statement of income (loss).
The net fair value of the collar options outstanding at December 31, 2017 was $0.1 million favourable (December 31, 2016 - $0.5 million unfavourable).
In February 2018, the Company rolled over the collar arrangement totaling U.S. $137.0 million and simultaneously entered into a new U.S. $137.0 million zero cost collar arrangement with a range of Cdn. $1.15 to Cdn. $1.31 for U.S. $1.00 maturing in 2018.
b. Interest rate risk
The Company is currently exposed to interest rate risk on its cash equivalents. An assumed decrease of 1% in the Company’s short-term investment rates during the year ended December 31, 2017 would have decreased net income by $0.5 million (2016 – $0.4 million), with an equal but opposite effect for an assumed increase of 1% in short-term investment rates.
16. CAPITAL MANAGEMENT
The Company’s capital management objectives are to maintain financial flexibility in order to preserve its capacity to meet its financial commitments, to meet its potential obligations resulting from internal growth and acquisitions and to pay dividends.
The Company defines capital as total equity. At December 31, 2017, capital under management was $245.8 million (December 31, 2016 – $326.2 million). There have been no changes to the Company's approach to capital management during the year.
The Company manages its capital structure in accordance with changes in economic conditions. In order to maintain or adjust its capital structure, subject to capital market conditions, the Company may elect to adjust the amount of debt outstanding, adjust the amount of dividends paid to shareholders, return capital to its shareholders, repurchase its shares in the marketplace, issue new shares or sell assets.
The Company is currently meeting all its financial commitments. The Company is not subject to any external capital requirements.

TORSTAR – Consolidated Financial Statements
40
17. PROVISIONS
Restructuring Other Total
Balance at December 31, 2015 $33,286 $8,963 $42,249Provisions made during the year 48,477 48,477Reversals of provisions during the year (3,989) (3,989)Discontinued operations (1,400) (1,400)Adjustment to contingent consideration (10) (10)Provisions paid during the year (40,900) (5,106) (46,006)Interest accretion 256 256Balance at December 31, 2016 $37,130 $2,447 $39,577Provisions made during the year 18,509 18,509Reversals of provisions during the year (997) (997)Discontinued operations (1,550) (1,550)Provisions received (paid) during the year (31,139) 293 (30,846)Interest accretion 134 134
Balance at December 31, 2017 $23,637 $1,190 $24,827Current $16,923 $1,190 $18,113Non-current $6,714 $6,714Balance at December 31, 2016Current $26,026 $2,447 $28,473Non-current $11,104 $11,104Balance at December 31, 2015Current $20,058 $8,963 $29,021Non-current $13,228 $13,228
Restructuring
During the year ended December 31, 2017, the Company recorded restructuring charges of $17.5 million related to ongoing efforts to reduce costs. Restructuring charges of $11.1 million were recorded in the Communities Segment, $6.2 million in the Dailies Segment and $0.2 million at Corporate.
In 2016, the Company recorded restructuring charges of $45.8 million. The restructuring charges included $44.5 million related to ongoing efforts to reduce costs (including a provision of $20.0 million in respect of the outsourcing of printing of the Toronto Star to Transcontinental Printing) as well as additional charges of $0.5 million in respect of inventory related to MMG's decision to phase out product sales and $0.8 million write-off of receivables. Restructuring charges of $13.5 million were recorded in the Communities Segment; $31.7 million in the Dailies Segment and $0.6 million at Corporate.
The non-current restructuring provisions are expected to be paid out through 2029.
Other
In connection with the sale of Harlequin, the Company indemnified the Purchaser for costs and fees related to certain matters including certain tax and pre-existing litigation matters. The Company assessed the fees that it may incur as well as the probability of occurrence of any losses in respect of these matters, estimated the exposure under these indemnities and recorded a contingent liability in respect of these matters. The Company reviews the estimates at each reporting period and any required adjustments are included in the determination of Income from discontinued operations.

TORSTAR – Consolidated Financial Statements
41
The Company is also involved in various legal actions, which arise in the ordinary course of business. While the final outcome of these matters cannot be predicted with certainty, any additional liability that may arise from such contingencies is not expected to have a material adverse effect on the financial position or results of operations of the Company.
On October 21, 2016, the Company accepted service of a proposed class action proceeding that has been commenced in the Ontario Superior Court of Justice against the Company, certain of its subsidiaries and employees, and other third parties relating to the sale and display of certain advertisements on the wheels.ca and autocatch.com digital properties. The representative plaintiffs are two used car dealers. They are seeking damages based on alleged breach of contract, negligence, and misleading marketing practices. A settlement has been reached, but remains subject to court approval. It is expected that the action will be certified on consent for purposes of effecting settlement. While there can be no assurance as to the outcome of any litigation, based on the information currently available to us, the Company does not believe that this litigation, including the Company’s contribution to the anticipated settlement, will have a material effect on the Company’s financial position or results of operations.
18. OTHER LIABILITIES
December 31, 2017 December 31, 2016
Employees' shares subscribed (note 21(b)) $627 $765RSU Plan (note 21(c)) 853 754DSU Plan (note 21(d)) 1,982 1,651Other employment benefits 1,515 1,401Licenses 1,308Other 1,622 1,737
$6,599 $7,616
19. EMPLOYEE BENEFITS
The Company maintains a number of defined benefit plans which provide pension benefits to its employees in the Province of Ontario. The Ontario registered pension plans are regulated by the Financial Services Commission of Ontario. Pension benefits are calculated based on a combination of years of service and compensation levels. The contributions for the most significant plans are based on career average earnings with a base year upgrade. Pensionable earnings for years of service prior to the base year are calculated using the base year earnings. The current base year for Canadian plans is 2005. None of the plans include mandatory indexing provisions. The assets of the funded plans are held by third party trustees. Funding for the plans is comprised of employer and employee contributions. The determination of the minimum level of Company contributions is calculated using actuarial valuations that are prepared by independent actuaries based on the provisions in each plan and legislative regulations. The obligations for unfunded plans are paid when the obligation falls due. All defined benefit pension plans are closed to new members.
The Company also maintains defined contribution plans in Canada. Employee contributions are matched by the Company according to plan formulae and the contributions are held and managed by third party providers. The Company has no further payment obligations once the matching contributions have been paid.
Other post employment benefits plans provide for various health and life insurance benefits to employees in the newspaper operations hired prior to August 23, 2000. The annual costs are calculated by independent actuaries and are based on historical and projected usage patterns and costs.
Governance of the above plans is the Company’s responsibility. The Pension Committee of the Company’s Board of Directors provides oversight of the registered pension plans and defined contribution plans in Canada.
Information concerning the Company’s post employment benefit plans is as follows:

TORSTAR – Consolidated Financial Statements
42
Net defined benefit plan obligations
Changes to the net defined benefit obligation were as follows:
Pension plans Other postemploymentbenefit plans TotalFunded Unfunded 1
At December 31, 2015 $11,426 $21,238 $47,875 $80,539
Expense recognized in the consolidatedstatement of income or loss:
Salaries and benefits 14,401 612 187 15,200Restructuring and other charges 835 (600) 235Interest and financing costs 599 676 1,796 3,071
15,835 1,288 1,383 18,506Amounts recognized in OCI 3,351 (1,782) 165 1,734Contributions to plans (17,951) (10,086) (2,408) (30,445)At December 31, 2016 12,661 10,658 47,015 70,334
Expense recognized in the consolidatedstatement of income or loss:
Salaries and benefits 12,237 305 199 12,741Interest and financing costs 562 350 1,740 2,652
12,799 655 1,939 15,393Amounts recognized in OCI 32,938 1,105 1,714 35,757Contributions to plans (10,850) (3,471) (2,447) (16,768)At December 31, 2017 $47,548 $8,947 $48,221 $104,716
1 As at December 31, 2017, the unfunded pension plan includes an executive retirement plan liability of $8.9 million (December 31, 2016 – $10.7 million) which is supported by an outstanding letter of credit of $7.7 million as at December 31, 2017 (December 31, 2016 – $10.5 million).
A summary of the components of the net defined benefit obligation as at December 31, 2017 and 2016 is as follows:
2017Pension plans Other post
employmentbenefit plans TotalFunded Unfunded
Defined benefit obligations $938,427 $8,947 $48,221 $995,595Fair value of plan assets (890,879) (890,879)
Net defined benefit obligation $47,548 $8,947 $48,221 $104,716
Recorded in:Liabilities $47,548 $8,947 $48,221 $104,716

TORSTAR – Consolidated Financial Statements
43
2016Pension plans Other post
employmentbenefit plans TotalFunded Unfunded
Defined benefit obligations $913,578 $10,658 $47,015 $971,251Fair value of plan assets (900,917) (900,917)
Net defined benefit obligation $12,661 $10,658 $47,015 $70,334
Recorded in:Assets $7,073 $7,073Liabilities $19,734 $10,658 $47,015 $77,407
The following charts provide a summary of changes in the defined benefit obligation and the fair value of plan assets during 2017 and 2016:
2017Pension Plans Other post
employmentbenefit plans TotalFunded Unfunded
Accrued benefit obligations:Balance, beginning of year $913,578 $10,658 $47,015 $971,251Current service cost 11,086 305 199 11,590Interest cost 33,879 350 1,740 35,969Benefits paid (75,973) (3,471) (2,447) (81,891)Remeasurement losses 53,455 1,105 1,714 56,274Participant contributions 2,402 2,402Balance, end of year $938,427 $8,947 $48,221 $995,595
Plans’ assets:Fair value, beginning of year $900,917 $900,917Interest income included in net interest expense 33,317 33,317Remeasurement gains 20,517 20,517Benefits paid (75,973) ($3,471) ($2,447) (81,891)Employer contributions 10,850 3,471 2,447 16,768Participant contributions 2,402 2,402Administration costs (1,151) (1,151)Fair value, end of year $890,879 $890,879
Funded status – deficit $47,548 $8,947 $48,221 $104,716

TORSTAR – Consolidated Financial Statements
44
2016Pension Plans Other post
employmentbenefit plans TotalFunded Unfunded
Accrued benefit obligations:Balance, beginning of year $920,659 $21,238 $47,875 $989,772Current service cost 12,896 612 187 13,695Interest cost 35,247 676 1,796 37,719Benefits paid (68,940) (10,086) (2,408) (81,434)Remeasurement losses (gains) 9,919 (1,782) 165 8,302Participant contributions 2,962 2,962Special termination benefits 1,022 1,022Curtailment (187) (600) (787)Balance, end of year $913,578 $10,658 $47,015 $971,251
Plans’ assets:Fair value, beginning of year $909,233 $909,233Interest income included in net interest expense 34,648 34,648Remeasurement gains 6,568 6,568Benefits paid (68,940) ($10,086) ($2,408) (81,434)Employer contributions 17,951 10,086 2,408 30,445Participant contributions 2,962 2,962Administration costs (1,505) (1,505)Fair value, end of year $900,917 $900,917
Funded status – deficit $12,661 $10,658 $47,015 $70,334
Net benefit expense for defined benefit plans recognized in the 2017 and 2016 consolidated statement of income or loss is as follows:
2017Pension plans Other post
employmentbenefit plans TotalFunded Unfunded
Current service cost $11,086 $305 $199 $11,590Net interest expense 562 350 1,740 2,652Administration costs 1,151 1,151
Net benefit expense $12,799 $655 $1,939 $15,393
2016Pension plans Other post
employmentbenefit plans TotalFunded Unfunded
Current service cost $12,896 $612 $187 $13,695Net interest expense 599 676 1,796 3,071Special termination benefits 1,022 1,022Curtailment (187) (600) (787)Administration costs 1,505 1,505
Net benefit expense $15,835 $1,288 $1,383 $18,506

TORSTAR – Consolidated Financial Statements
45
Amounts recognized in the 2017 and 2016 consolidated statements of comprehensive income or loss (before tax):
2017Pension plans Other post
employmentbenefit plans TotalFunded Unfunded
Remeasurement gains (losses):Actuarial gain (loss) from:
Financial assumptions ($47,827) ($68) ($2,165) ($50,060)Experience adjustment (5,628) (1,037) 451 (6,214)
Total actuarial losses (53,455) (1,105) (1,714) (56,274)Return on plan assets excluding amounts
included in net interest expense 20,517 20,517
Amounts recognized in OCI ($32,938) ($1,105) ($1,714) ($35,757)
2016Pension plans Other post
employmentbenefit plans TotalFunded Unfunded
Remeasurement gains (losses):Actuarial gain (loss) from:
Financial assumptions ($12,049) $97 ($533) ($12,485)Demographic assumptions 2,018 2,018Experience adjustment 2,130 (333) 368 2,165
Total actuarial gains (losses) (9,919) 1,782 (165) (8,302)Return on plan assets excluding amounts
included in net interest expense 6,568 6,568
Amounts recognized in OCI ($3,351) $1,782 ($165) ($1,734)
The significant assumptions used by the Company in 2017 and 2016 are noted below. Assumptions regarding future mortality are based on actuarial advice in accordance with published mortality statistics and experience. For the Canadian plans in 2017 and 2016, the Company used the 2014 Private Sector Canadian Pensioners' Mortality Table projected generationally using scale B with a multiplier applied at December 31, 2017 and December 31, 2016 (for the larger plans, the multiplier ranged from 94% to 103%).

TORSTAR – Consolidated Financial Statements
46
Pension plansOther post employment benefit
plans
2017 2016 2017 2016
To determine benefit obligation at end of year:Discount rate 3.1% to 3.4% 3.2% to 3.8% 3.4% 3.8%Rate of future compensation increase 2.5% 2.5%
To determine benefit expense:Discount rate 3.2% to 3.8% 3.1% to 3.9% 3.8% 3.9%Rate of future compensation increase 2.5% 2.0% to 2.5%
Health care cost trend rates at end of year:Initial rate 5.0% 4.8%Ultimate rate 5.0% 5.0%Year ultimate rate reached 2018 2017
Longevity for pensioners currently at age 65:Male 21.9 years 21.8 yearsFemale 24.2 years 24.2 years
The effect of a one percent increase or decrease in significant financial assumptions used for the Company’s pension and other post employment benefit plans would result in an increase (decrease) in the accrued benefit obligation:
December 31, 2017 December 31, 2016
1% increase 1% decrease 1% increase 1% decrease
Pension plans:Discount rate ($114,175) $130,189 ($113,605) $129,897Rate of compensation increase 8,974 (8,822) 8,651 (8,503)
Other post employment benefit plans:Discount rate (5,028) 6,131 (4,880) 5,945Per capita cost of health care 1,457 (1,267) 1,336 (1,166)
For the significant pension plans, the impact of a change in longevity rates if members were one year younger than their actual age would increase the net benefit obligation by 2.5% (December 31, 2016 – 2.4%).
The above sensitivity analyses are based on a change in an assumption while holding all other assumptions constant, which in practice is unlikely to occur as changes in some of the assumptions may be correlated. The calculation of the sensitivities uses the same methods that were applied when calculating the net accrued benefit obligation in the consolidated statement of financial position.

TORSTAR – Consolidated Financial Statements
47
Pension plan assets for the Canadian plans, measured as at December 31, 2017 and 2016 are as follows:
2017 2016
Investments quoted in active markets:Cash and cash equivalents $170,149 $147,457Equity investments
Canada 82,095 111,353United States 75,052 67,839Outside North America 91,146 81,659
Unquoted investments:Fixed income
Government of Canada 69,963 44,616Provinces and municipalities of Canada 308,782 338,239Canadian corporations 17,927 33,309Government of United States 861
Pooled fundsEquity – North America 845 2,067Fixed Income – Canadian corporations 74,059 74,378
$890,879 $900,917
Through its defined benefit plans, the Company is exposed to a number of risks the most significant of which include changes in long-term discount rates used to calculate plan liabilities, the rate of return on plan assets, and changes in demographics, mortality and plan experience. These factors impact the potential for inadequate plan funding, unfunded obligations and increases in contributions.
The Company periodically reviews its targeted investment portfolio mix. At December 31, 2017, the target allocation mix was 28% equity securities and 72% fixed income securities for the Canadian plans (December 31, 2016 – 29% equity securities and 71% fixed income securities).
The Company’s 2017 actual funding for its Canadian registered pension plans was approximately $11 million (2016– $18 million). The Company has prepared actuarial reports as of December 31, 2016 for its significant plans. Estimated funding in 2018 is expected to be approximately $9 million. The next required actuarial reports will be as of December 31, 2019 for the majority of the Company's defined benefit pension plans.
The weighted average duration of the defined benefit obligation is 13.8 years (2016 – 12.9 years). As at December 31, 2017, the expected maturity profile of the undiscounted pension plan and other post employment benefits is $81 million in the next year, $509 million in 2 to 10 years and $1,362 million in over 10 years (December 31, 2016 – $49 million in the next year, $470 million in 2 to 10 years and $1,090 million in over 10 years for continuing operations).
Defined contribution plans
The total amount expensed for defined contribution plans in 2017 was $2.0 million (2016 – $1.8 million).

TORSTAR – Consolidated Financial Statements
48
20. SHARE CAPITAL
(a) Rights attaching to the Company’s share capital:
(i) Class A (voting) and Class B (non-voting) shares, no par value
Class A and Class B shareholders may elect to receive dividends in cash or stock dividends in the form of Class B shares. Class A shares are convertible at any time at the option of the holder into Class B shares.
(ii) Voting provisions
Class B shares are non-voting unless the Company has failed to pay the full quarterly preferential dividend (7.5 cents per annum) on the Class B non-voting shares in each of eight consecutive quarters.
(iii) Restrictions on transfer
Registration of the transfer of any of the Company’s shares may be refused if such transfer could jeopardize either the ability of the Company to engage in broadcasting or its status as a Canadian newspaper or periodical publisher.
(b) Summary of changes in the Company’s share capital:
Year ended December 31
2017 2016
Shares Amount Shares Amount
Class A shares (voting)Balance, beginning of period 9,826,215 $2,670 9,839,355 $2,673Converted to Class B (9,000) (2) (13,140) (3)Balance, end of period 9,817,215 $2,668 9,826,215 $2,670
Class B shares (non-voting)Balance, beginning of period 70,891,322 $400,144 70,707,063 $399,827Converted from Class A 9,000 2 13,140 3Dividend reinvestment plan 85,280 133 93,201 168Issued under ESPP 50,911 92 76,868 144Other 625 1 1,050 2Balance, end of period 71,037,138 $400,372 70,891,322 $400,144
Total Class A and Class B shares 80,854,353 $403,040 80,717,537 $402,814
An unlimited number of Class B shares is authorized. While the number of Class A shares is unlimited, the issuance of further Class A shares may, under certain circumstances, require unanimous board approval.
(c) Earnings (loss) per share
Basic earnings (loss) per share amounts have been determined by dividing net income or loss attributable to equity shareholders by the weighted average number of Class A and Class B shares outstanding during the period.
The treasury stock method is used for the calculation of the dilutive effect of share options and other dilutive securities. In calculating diluted per share amounts under the treasury stock method, the numerator remains unchanged from the basic per share calculation as the assumed exercise of the Company’s share options and the ESPP does not result in an adjustment to income or loss.

TORSTAR – Consolidated Financial Statements
49
The reconciliation of the denominator in calculating diluted per share amounts is as follows:
Year ended December 31
(thousands of shares) 2017 2016
Weighted average number of shares outstanding, basic and diluted 80,785 80,653
Outstanding share options totalling 7,028,109 (December 31, 2016 – 5,686,932), which are anti-dilutive, have been excluded from the above calculation of dilutive securities.
(d) Dividends
The following dividends were declared and distributed by the Company per Class A (voting) share and Class B (non-voting) share, and in total:
Year ended December 31
2017 2016
First quarter ended March 31: 2.5 cents (2016 – 6.5 cents) $2,018 $5,236Second quarter ended June 30: 2.5 cents (2016 – 6.5 cents) 2,020 5,243Third quarter ended September 30: 2.5 cents (2016 – 2.5 cents) 2,020 2,018Fourth quarter ended December 31: 2.5 cents (2016 – 2.5 cents) 2,021 2,017
Total dividends $8,079 $14,514
21. SHARE-BASED COMPENSATION PLANS
(a) Share option plan
The maximum number of shares that may be issued under the share option plan is 18,000,000 and the number of shares reserved for issuance to insiders (together with shares issuable to insiders under all other share compensation arrangements) cannot exceed 10% of the outstanding Class A and Class B shares. The term of the options shall not exceed ten years from the date the option is granted. Up to 25% of an option grant may be exercised twelve months after the date granted, and a further 25% after each subsequent anniversary. As of December 31, 2017, options to purchase 13,040,461 shares have been granted, net of options cancelled (December 31, 2016 – 11,669,284).
A summary of changes in the share option plan is as follows:
2017 2016
Share options
Weightedaverage
exercise price Share options
Weighted average
exercise price
Units outstanding, beginning of year 5,686,932 $7.08 5,543,589 $8.66Granted 2,205,018 $1.70 1,389,039 $2.78Forfeited or expired (863,841) $8.53 (1,245,696) ($9.31)
Units outstanding, end of year 7,028,109 $5.12 5,686,932 $7.08

TORSTAR – Consolidated Financial Statements
50
As at December 31, 2017, outstanding share options were as follows:
Range of exercise priceShare optionsoutstanding
Weightedaverage
remainingcontractual life
Weightedaverage
exercise priceShare options
exercisable
Weightedaverage
exercise price
$1.59 – $5.85 3,927,040 8.20 $2.82 1,422,855 $4.34$6.33 – $7.81 2,171,993 5.31 $6.80 1,920,586 $6.84$8.28 – $18.78 929,076 2.71 $10.93 929,076 $10.93
$1.59 – $18.78 7,028,109 6.58 $5.12 4,272,517 $6.89
The fair value of the share options on the date of grant and the key assumptions used are as follows:
2017 2016
Fair Value $0.31 – $0.44 $0.30 – $0.35Risk-free interest rate 1.0% – 1.5% 0.6% – 1.1%Expected dividend yield 5.2% – 6.3% 9.4%Expected share price volatility 37.4% – 40.5% 34.2% – 38.9%Expected weighted average time until exercise (years) 6 6
(b) ESPP
As at December 31, outstanding employee subscriptions were as follows:
2017 2016
Maturing in 2018 2019 2017 2018Subscription price at entry date $1.84 $1.55 $6.28 $1.84Number of shares 173,973 203,190 62,046 203,975
The fair value of the subscriptions on the subscription date and the key assumptions used are as follows:
2017 2016Fair Value $0.24 $0.23Risk-free interest rate 0.6% 0.6%Expected dividend yield 6.3% 14.3%Expected share price volatility 47.8% 47.2%Expected time until exercise (years) 2 2

TORSTAR – Consolidated Financial Statements
51
(c) RSU plan
A summary of changes in the RSU plan is as follows:
2017 2016
Units outstanding, beginning of year 975,734 872,160Vested and paid (284,468) (294,936)Granted 794,372 446,762Forfeited (155,267) (124,075)Dividend equivalents 87,198 75,823
Units outstanding, end of year 1,417,569 975,734
As at December 31, 2017, 769,489 units have been accrued at a value of $1.3 million of which 270,454 units have been accrued in Accounts payable and accrued liabilities at a value of $0.5 million while 499,035 units have been accrued in Other liabilities at a value of $0.9 million (December 31, 2016 – 679,576 units were accrued at a value of $1.3 million of which 284,468 units were accrued in Accounts payable and accrued liabilities at a value of $0.5 million and 395,108 units were accrued in Other liabilities at a value of $0.8 million).
The Company has entered into a derivative instrument in order to lock in the expense for 345,300 RSUs. Changes in the fair value of this instrument are recorded as compensation expense and offset the impact of changes in the value of the RSUs that have been accrued. As the RSUs are accrued over the three-year period until the RSUs vest, there will not be an exact offset each period.
In January 2018, 270,454 RSUs have vested and were paid.
(d) DSU plan
A summary of changes in the DSU plan is as follows:
2017 2016
Units outstanding, beginning of year 864,147 657,483Granted 235,602 160,072Directors’ mandatory retainer 6,387 10,833Directors’ voluntary election 16,031 21,913Dividends 62,496 96,595Redemption (25,682) (82,749)
Units outstanding, end of year 1,158,981 864,147
As at December 31, 2017, the 1,158,191 units outstanding were valued at $2.0 million (December 31, 2016 – 864,147 units valued at $1.7 million).
The Company has entered into a derivative instrument in order to offset its exposure to 490,000 units. Changes in the fair value of this instrument are recorded as compensation expense and offset the impact of changes in the value of the outstanding DSUs.
(e) In 2017, the Company has recognized share-based compensation expense totalling $1.1 million (2016 – $1.4 million).

TORSTAR – Consolidated Financial Statements
52
22. ACCUMULATED OTHER COMPREHENSIVE INCOME (LOSS)
The following is a continuity for the components of Accumulated other comprehensive income:
Foreign CTA 1Available-for-sale
securities 2Net investment
hedge 3 Total
As at December 31, 2015 $10,782 $346 ($8,007) $3,121
OCI (5,432) 2,510 4,977 2,055
As at December 31, 2016 5,350 2,856 (3,030) 5,176OCI (7,451) 68 (7,383)
As at December 31, 2017 ($2,101) $2,924 ($3,030) ($2,207)
1Net of deferred income tax asset/liability of $nil (2016 – $nil).2Net of deferred income tax liability of $nil (2016 – $400).3Net of current income tax recovery of $500 (2016 – deferred income tax recovery of $500).
23. OTHER INCOME
Year ended December 31
2017 2016
Gain on sale of assets $24,338Gain on sale of newspapers $3,225Gain on sale of wagjag.com 500Other 210 10
$3,935 $24,348
2017
The gain on sale of newspapers was related to the transaction with Postmedia Network Inc. (“Postmedia”) for the purchase and sale of a number of community and daily newspapers (note 26).
In October 2017, wagjag.com and related assets were sold for gross proceeds of $0.5 million.
2016
In February 2016, the Company sold a real estate property in Mississauga for net cash proceeds of $5.5 million and recorded a gain of $1.3 million.
In July 2016, the Company sold a real estate property in Guelph for net cash proceeds of $1.9 million and recorded a gain of $1.3 million.
In September 2016, the Company sold the Vaughan printing facility and surrounding lands for net cash proceeds of $53.6 million and recorded a gain of $21.8 million.

TORSTAR – Consolidated Financial Statements
53
24. DISCONTINUED OPERATIONS
On August 1, 2014, the Company sold all of the shares of Harlequin (which previously represented the Company’s Book Publishing Segment) to a division of HarperCollins Publishers L.L.C., a subsidiary of News Corp. (the “Purchaser”). In connection with the sale, the Company indemnified the Purchaser for costs and fees related to certain matters including certain tax and pre-existing litigation matters for which the Company estimated the exposure under these indemnities and recorded a contingent liability in respect of these matters. During the year ended December 31, 2017, the Company reviewed its estimates and recorded a reduction in its provisions of $1.6 million (2016 – reduced its provision by $1.4 million) as presented below:
(i) Statement of Income
Year ended December 31
2017 2016
Gain on sale of Harlequin (note 17) $1,550 1,400Income before taxes from discontinued operations 1,550 1,400Income and other taxes (200) (200)
Net income from discontinued operations $1,350 $1,200
Attributable to:Equity shareholders $1,350 $1,200
Net income from discontinued operations attributable to equityshareholders per Class A (voting) and Class B (non-voting) share(note 20(c)):
Basic and Diluted $0.02 $0.01
(ii) Statement of Comprehensive Income
Year ended December 312017 2016
Net income from discontinued operations $1,350 $1,200
Comprehensive income from discontinued operations, net of tax $1,350 $1,200
Attributable to:
Equity shareholders $1,350 $1,200
25. OTHER NON-CASH ITEMS PROVIDED BY (USED IN) OPERATING ACTIVITIES
Year ended December 31
2017 2016
Share-based compensation plans $955 $740Foreign exchange (493) (298)Restructuring provisions (4,390) (2,380)Interest accretion 185 355Other (331) (1,343)
($4,074) ($2,926)

TORSTAR – Consolidated Financial Statements
54
26. ACQUISITIONS, DIVESTITURES AND PORTFOLIO INVESTMENTS
2017 Acquisitions
On November 27, 2017 the Company entered into an asset purchase agreement with Postmedia relating to the purchase and sale of a number of community and daily newspapers. As part of the transaction, the Company acquired eight weekly community publications, seven daily community newspapers and two free daily newspapers from Postmedia. As consideration for the purchase, the Company sold 22 weekly community newspapers in eastern and southern Ontario and the Metro Winnipeg and Metro Ottawa free daily publications to Postmedia. The transaction was a non-monetary transaction as there was no cash exchanged. The estimated fair value of both the net assets acquired from Postmedia and the net assets sold by the Company was $3.5 million. The difference between the consideration received, being the net assets acquired at fair value, and the carrying value of the net liabilities transferred and cost of disposal was recognized as a gain on disposal of newspapers (note 23). In the year ended December, 31, 2017, the Company also incurred severance costs of $1.4 million and provisions for onerous leases and contracts of $0.5 million and $0.5 million respectively, which are included in Restructuring and other charges (note 17).
In 2017, revenue and operating earnings were $1.5 million lower ($2.7 million lower in Communities segment and $1.2 million higher in the Dailies segment) and $0.3 million higher respectively as a result of this transaction. The full year impact of properties acquired and sold would have resulted in a net reduction in revenue in 2017 of approximately $14 million ($22 million lower in the Communities segment and $8 million higher in the Dailies segment).
The fair value of identifiable assets acquired and liabilities assumed were as follows:
CommunitiesAssets acquired
Prepaid expenses $36
Intangible assets (note 10) 5,339
Total assets acquired 5,375
Liabilities assumed
Accounts payable and accrued liabilities (8)
Deferred revenue (1,845)
Other liabilities (50)
Total liabilities assumed (1,903)
Net assets acquired at fair value $3,472
The Company transferred the following net liabilities to Postmedia and recognized a gain on disposal of newspapers as follows:
CommunitiesConsideration for disposal
Prepaid assets $60
Deferred revenue (112)
Net liabilities transferred (52)
Consideration received (net assets acquired at fair value) 3,472
Disposal costs (299)
Gain on disposal of newspapers $3,225
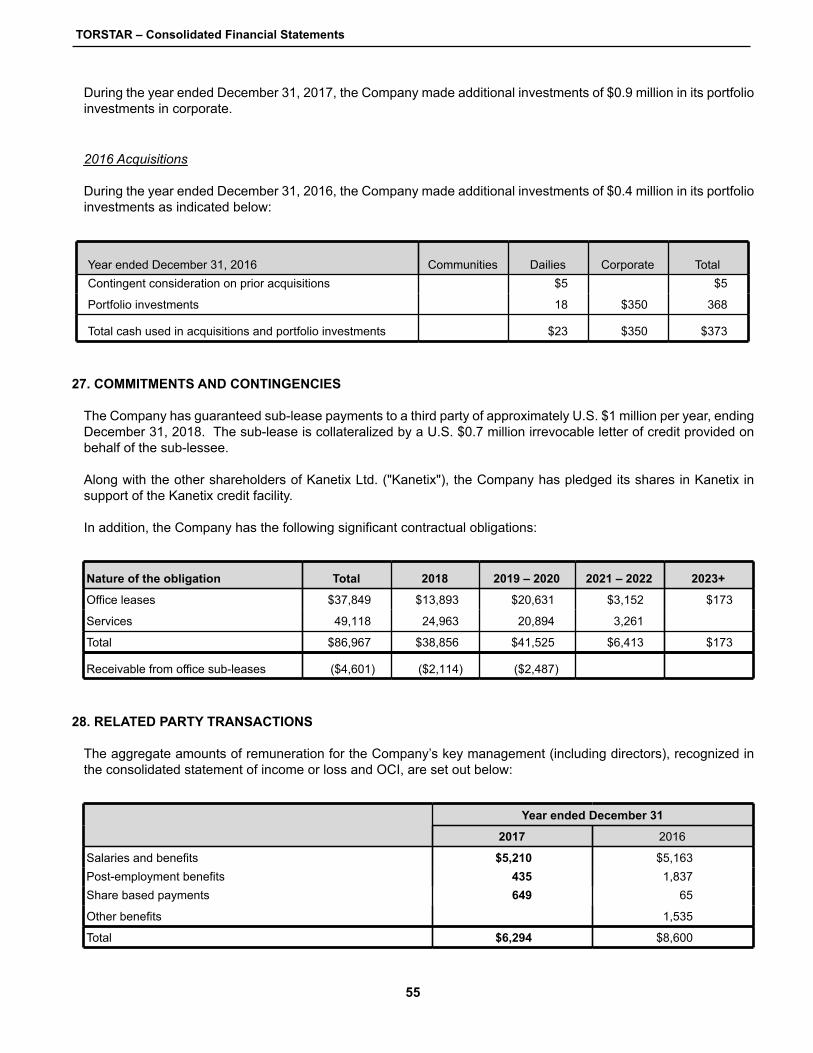
TORSTAR – Consolidated Financial Statements
55
During the year ended December 31, 2017, the Company made additional investments of $0.9 million in its portfolio investments in corporate.
2016 Acquisitions
During the year ended December 31, 2016, the Company made additional investments of $0.4 million in its portfolio investments as indicated below:
Year ended December 31, 2016 Communities Dailies Corporate TotalContingent consideration on prior acquisitions $5 $5
Portfolio investments 18 $350 368
Total cash used in acquisitions and portfolio investments $23 $350 $373
27. COMMITMENTS AND CONTINGENCIES
The Company has guaranteed sub-lease payments to a third party of approximately U.S. $1 million per year, ending December 31, 2018. The sub-lease is collateralized by a U.S. $0.7 million irrevocable letter of credit provided on behalf of the sub-lessee.
Along with the other shareholders of Kanetix Ltd. ("Kanetix"), the Company has pledged its shares in Kanetix in support of the Kanetix credit facility.
In addition, the Company has the following significant contractual obligations:
Nature of the obligation Total 2018 2019 – 2020 2021 – 2022 2023+
Office leases $37,849 $13,893 $20,631 $3,152 $173
Services 49,118 24,963 20,894 3,261
Total $86,967 $38,856 $41,525 $6,413 $173
Receivable from office sub-leases ($4,601) ($2,114) ($2,487)
28. RELATED PARTY TRANSACTIONS
The aggregate amounts of remuneration for the Company’s key management (including directors), recognized in the consolidated statement of income or loss and OCI, are set out below:
Year ended December 31
2017 2016
Salaries and benefits $5,210 $5,163Post-employment benefits 435 1,837Share based payments 649 65
Other benefits 1,535
Total $6,294 $8,600
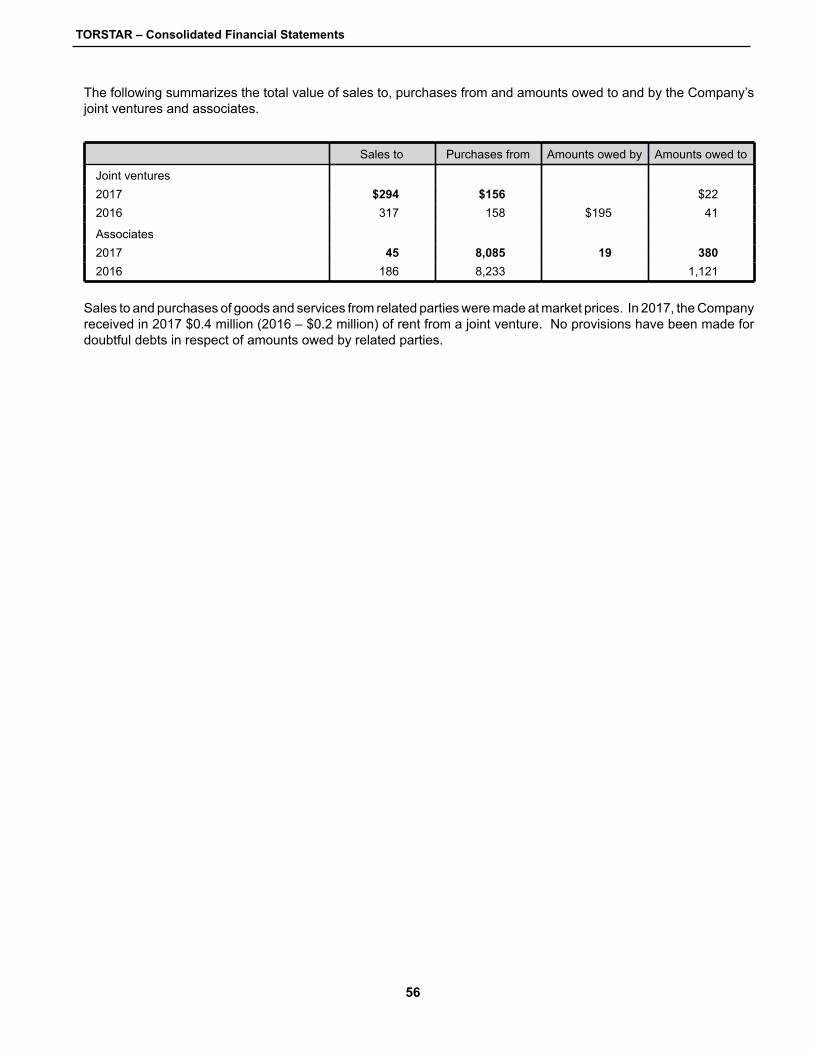
TORSTAR – Consolidated Financial Statements
56
The following summarizes the total value of sales to, purchases from and amounts owed to and by the Company’s joint ventures and associates.
Sales to Purchases from Amounts owed by Amounts owed to
Joint ventures2017 $294 $156 $222016 317 158 $195 41
Associates2017 45 8,085 19 3802016 186 8,233 1,121
Sales to and purchases of goods and services from related parties were made at market prices. In 2017, the Company received in 2017 $0.4 million (2016 – $0.2 million) of rent from a joint venture. No provisions have been made for doubtful debts in respect of amounts owed by related parties.