2017 sustainable energy in america 2017 sustainable energy in america factbook marks the fifth year...
TRANSCRIPT

No portion of this document may be reproduced, scanned into an electronic system, distributed, publicly displayed or used as the basis of derivative works without attributing Bloomberg Finance L.P. and the Business Council for Sustainable Energy. For more information on terms of use, please contact [email protected]. Copyright and Disclaimer notice on the last page applies throughout. Developed in partnership with the Business Council for Sustainable Energy.
GET THE FACTS www.bcse.org
2017
Sustainable Energy in America FACTBOOK

1 © Bloomberg Finance L.P. 2017. Developed in partnership with The Business Council for Sustainable Energy.
Overview
The 2017 Sustainable Energy in America Factbook marks the fifth year that BCSE and BNEF have collaborated to document the
transformation of the US energy system and the growing contributions of sustainable energy technologies. In the past five years,
these contributions have been significant, including:
• The addition of 76 gigawatts (GW) of renewable energy generating capacity, and 39GW of natural gas-fired capacity.
Renewables (inclusive of large hydro) and natural gas now meet half of US power demand, up from only 38% in 2011.
• A 10% improvement in US energy productivity, meaning the US economy is using 10% less energy to power each unit of
growth.
• A 4% drop in average retail electricity prices in real terms. In New York, Texas, and Florida, prices have fallen over 10% in
that time.
• A 12% jump in total gas production, and a 79% surge in shale gas extraction since 2011.
• A 12% improvement in vehicle fuel economy, propelled by federal fuel efficiency standards.
The 2017 Factbook provides an update through the end of 2016, highlighting a number of key developments that occurred as the
long-term transformation of US energy continues to unfold. The rapid pace of renewable energy deployment accelerated,
consumption and export of domestic natural gas hit record levels, and the economy grew more energy efficient than ever. Utilities
ramped up investments in electric and natural gas transmission, helping to create a more reliable energy system. In the face of
all this change, Americans are enjoying lower energy bills and are directing less of their household income to energy spending
than at any other time on record.
The Sustainable Energy in America Factbook provides a detailed look at the state of US energy and the role that a range of new
technologies are playing in reshaping the industry. The Factbook is researched and produced by Bloomberg New Energy
Finance and commissioned by the Business Council for Sustainable Energy. As always, the goal is to offer simple, accurate
benchmarks on the status and contributions of new sustainable energy technologies.

2 © Bloomberg Finance L.P. 2017. Developed in partnership with The Business Council for Sustainable Energy.
Table of contents
8. Global context
1. Introduction
2. A look across
the US energy
sector
3. Natural gas
4. Large-scale
renewable
electricity and
CCS
2.1 Bird’s-eye view
2.2 Policy, finance, economics
4.1 Solar (PV, solar thermal)
4.2 Wind
4.3 Biomass, biogas, waste-to-
energy
4.4 Geothermal
4.5 Hydropower
4.6 CCS
5. Distributed
power and
storage
5.1 Small-scale solar
5.2 Small- and medium-scale wind
5.3 Small-scale biogas
5.4 Combined heat and power and
waste-heat-to-power
5.5 Fuel cells (stationary)
5.6 Energy storage
6. Demand-
side energy
efficiency
6.1 Energy efficiency
6.2 Smart grid and demand response
7. Sustainable
transportation
7.1 Electric vehicles
7.2 Natural gas vehicles
7.3 Biofuels

3 © Bloomberg Finance L.P. 2017. Developed in partnership with The Business Council for Sustainable Energy.
About the Factbook (1 of 4): What is it and what’s new
• Aims to augment existing, reputable sources of information on US energy
• Focuses on renewables, efficiency, natural gas
• Fills important data gaps in certain areas (eg, investment flows by sector, contribution of distributed energy)
• Contains data through the end of 2016 wherever possible
• Employs Bloomberg New Energy Finance data in most cases, augmented by EIA, FERC, ACEEE, LBNL, and other
sources where necessary
• Contains the very latest information on new energy technology costs
• Has been graciously underwritten by the Business Council for Sustainable Energy
• Is in its fifth edition (first published in January 2013)
What is it?
• Format: This year’s edition of the Factbook (this document) consists of Powerpoint slides showing updated charts. For
those looking for more context on any sector, the 2014 edition(1) can continue to serve as a reference. The emphasis of
this 2017 edition is to capture new developments that occurred in the past year.
• Updated analysis: Most charts have been extended by one year to capture the latest data.
• 2016 developments: The text in the slides highlights major changes that occurred over the past year.
• New coverage: This report contains data shown for the first time in the Factbook, including transmission investment,
PURPA-driven solar build, battery pricing, natural gas exports, energy spending, biofuel blending and electric vehicle
model availability.
What’s new?
(1) The 2014 Factbook can be found here: http://www.bcse.org/factbook/pdfs/2014%20Sustainable%20Energy%20in%20America%20Factbook.pdf

4 © Bloomberg Finance L.P. 2017. Developed in partnership with The Business Council for Sustainable Energy.
OT
HE
R
CL
EA
N
EN
ER
GY
(no
t co
vere
d
in t
his
rep
ort
)
SU
STA
INA
BL
E
EN
ER
GY
(as
de
fin
ed
in
th
is
rep
ort
)
RENEWABLE
ENERGY
FOSSIL-
FIRED /
NUCLEAR
POWER
DISTRIBUTED POWER,
STORAGE, EFFICIENCY
TRANSPORT
• Solar
• Wind
• Geothermal
• Hydro
• Biomass
• Biogas
• Waste-to-energy
• Natural gas
• CCS
• Small-scale renewables
• CHP and WHP
• Fuel cells
• Storage
• Smart grid / demand response
• Building efficiency
• Industrial efficiency (aluminum)
• Direct use applications for natural gas
• Electric vehicles
(including hybrids)
• Natural gas vehicles
• Biofuels
• Wave / tidal • Nuclear
• Lighting
• Industrial efficiency (other industries)
About the Factbook (2 of 4): Understanding terminology for this report

5 © Bloomberg Finance L.P. 2017. Developed in partnership with The Business Council for Sustainable Energy.
About the Factbook (3 of 4): The sub-sections within each sector
Deployment: captures how much activity
is happening in the sector, typically in
terms of new build or supply and demand
Financing: captures the amount of
investment entering the sector
Economics: captures the costs of
implementing projects or adopting
technologies in the sector
For each sector, the report
shows data pertaining to
three types of metrics
(sometimes multiple charts
for each type of metric)
Notes: A small number of sectors do not have slides for each of these metrics, due to scarcity of data. The section on energy efficiency also includes a set of slides dedicated to policy.

6 © Bloomberg Finance L.P. 2017. Developed in partnership with The Business Council for Sustainable Energy.
About the Factbook (4 of 4): Sponsorship of this report
The Business Council for Sustainable Energy (BCSE) is a coalition of companies and trade associations from the
energy efficiency, natural gas and renewable energy sectors. The Council membership also includes independent
electric power producers, investor-owned utilities, public power, commercial end-users and project developers and
service providers for energy and environmental markets. Since 1992, the Council has been a leading industry
voice advocating for policies at the state, national and international levels that increase the use of commercially-
available clean energy technologies, products and services.

7 © Bloomberg Finance L.P. 2017. Developed in partnership with The Business Council for Sustainable Energy.
Executive summary (1 of 8)
Two thousand sixteen marked yet another monumental year in the energy sector, as the US continued to transform how it produces, delivers and
consumes energy. The US further decoupled its economic growth from energy consumption; meanwhile, its energy grew cleaner as renewable
deployment accelerated and natural gas demand and exports achieved new highs. Utilities made critical investments to ensure reliability, and
corporations made new pledges to decarbonize and reduce consumption. These efforts helped push greenhouse gas emissions to their lowest level
in 25 years. At the same time, Americans dedicated a smaller share of their household income to electricity and natural gas bills than at any other
time on record.
In 2016, the US surpassed a number of new milestones. We highlight the most notable achievements below:
American consumers are spending less of their incomes on energy than ever in the modern era.
• Consumers devoted less than 4% of their total annual household spending to energy in 2016, the smallest share ever recorded by the US
government. Falling costs for gasoline, natural gas, and electricity, along with energy efficiency measures, have contributed to this trend.
• Retail electricity prices across the country fell 2.2% in 2016 in real terms from 2015 levels. On average, consumers now pay 4% less per kilowatt-
hour for electricity than in 2007, when removing the impact of inflation. In some regions, falling wholesale energy costs and energy savings have
had an even larger impact: in New York, average retail rates are now 19% below 2007 levels, and in Texas average rates have fallen 30% in real
terms.
• Natural gas prices across the spectrum set or approached record lows in 2016. Retail natural gas prices continued to tumble, as prices for
commercial consumers plunged to their lowest levels since 1977, in real terms. Similarly, industrial prices sank to their lowest recorded levels.
Year-on-year, real commercial and industrial prices declined 3% and 28%, and they have plummeted 41% and 68% below 2007 levels,
respectively. Low natural gas prices have also made natural gas-fired power plants increasingly competitive with traditional coal-fired power plants,
particularly in Appalachia, the source of the shale boom. It is now cheaper to build a new natural gas plant than to build a coal plant across most of
the US.
• Costs for wind and solar have fallen across the board. Utility-scale photovoltaic (PV) capex (the cost of constructing a project from start to end) has
fallen from $2.65 million per megawatt (MW) in 2011 to only $1.14m/MW in 2016. The cost for wind turbines specifically has also declined, from
$1.34m/MW to $1.12m/MW over the same five-year timeframe. At the same time, the performance of the equipment has also improved. Combined,
this has allowed utilities and corporate buyers to sign long-term power purchase deals at under $40 per megawatt-hour (MWh) for solar power in
Nevada and California. For wind, offtake prices continued to fall, with some projects fetching below $20/MWh in Texas and Oklahoma.

8 © Bloomberg Finance L.P. 2017. Developed in partnership with The Business Council for Sustainable Energy.
Executive summary (2 of 8)
Greater energy efficiency efforts have coincided with a lower cost, more sustainable energy economy.
• The US has truly ‘decoupled’ economic growth from energy demand: since 2007, US GDP is up 12% while overall energy consumption has fallen
by 3.6%. In other words, energy productivity continues to improve as less and less energy is needed to fuel growth. In 2016, this trend continued:
energy productivity improved by 1.8%, as real GDP grew 1.6% while energy consumption decreased by 0.2%.
• Within the power sector specifically, energy efficiency measures appear to be making an impact on slowing load growth. In 2016, electricity
demand slipped 1.1%, compared to a 1.6% growth in GDP. Electric demand has now fallen 1.2% from its 2014 peak, while GDP has expanded by
4.2% in real terms. Meanwhile, utilities are devoting more toward efficiency every year, with $6.3bn spent on such programs in 2015 (the latest
year for which data is available). Electric efficiency program spending has nearly tripled since 2007, when utilities spent $2.2bn.
• Energy efficiency investments in the natural gas system also appear to be paying dividends. Within the residential sector, natural gas consumption
has held steady as the number of customers has risen, even when accounting for recent mild winters: gas consumption per customer has fallen
from an average of 210 cubic feet per day (cfd) from 2002-06 to 188cfd from 2012-16. Natural gas utilities invested an estimated $1.4bn into the
efficiency programs in 2015, a 350% increase over 2007’s levels ($0.3bn).
Far from ‘alternative’, sustainable energy is the new normal in the US.
• 2016 set a new record for annual renewable energy capacity additions, as the US added a whopping 22GW of renewable generating capacity.
Over half of these additions – 12.5GW – were from the country’s burgeoning solar industry. Within the solar sector, a number of further records
were set: the 8.9GW of utility-scale photovoltaic (PV) additions more than doubled last year’s record of 4.4GW; commercial and industrial solar
installs increased 34% to 1.1GW; and residential solar ticked up 14% to 2.3GW. Wind additions hit 8.5GW (similar to 2015’s level), and the US
installed its first-ever offshore wind farm, a 30MW project off the coast of Rhode Island. New hydroelectricity build totaled 379MW, while biomass,
biogas and waste-to-energy added 132MW, and 47MW worth of stationary fuel cells were installed.
• Since 1990, over 90% of cumulative generating capacity additions have been renewable energy or natural gas, and, in the past ten years, over half
(54%) of total additions have been dedicated to renewable energy resources. These installations are already having an impact on the grid: natural
gas is now the number one source of power in the US, contributing 34% of the electricity mix in 2016, up from only 22% in 2007. Renewables have
seen their production grow from 8% to 15% over the same timeframe. And from 2015-16 alone, renewable generation surged 12%, exceeding
600TWh for the first time, as non-hydro renewables jumped 16% and hydro rose 6% year-on-year.
• At the same time, the retirement of coal-fired power plants continues to shrink that fuel’s contribution to the power mix: 2016 saw 7GW of coal-fired
capacity disconnect from the grid, after a record 15GW retired in 2015. Another 12GW are currently scheduled to retire within the next five years.
These retirements are due to a confluence of factors, including competition from low-priced natural gas and aging boilers. As a result, coal provides
a smaller share of US power than ever recorded, with only 30% of electricity generated by coal-fired units in 2016. This figure contrasts with 48% in
2008 and represents the lowest share held by coal in at least the past 70 years.

9 © Bloomberg Finance L.P. 2017. Developed in partnership with The Business Council for Sustainable Energy.
Executive summary (3 of 8)
Improved infrastructure is critical to sustained long-term growth for sustainable energy.
• Electric transmission projects received an estimated $21.5bn in 2016, nearly double the $11.9bn invested in 2011, according to data collected by
the Edison Electric Institute. Transmission investment is critical to ensuring the reliable provision of electricity to consumers, relieving grid
congestion, reducing curtailment and enabling diverse and distributed resources to reach demand centers. Recent investments in large
transmission networks, such as the $7bn Competitive Renewable Energy Zone in Texas (completed in 2013), and the MISO Multi-value Project
(expected to be completed by 2020), will help to connect over 30GW of clean energy – mostly wind – to the grid.
• Nonetheless, curtailment of wind energy remains an issue in some regions, including the Midwest. There is some concern that new wind projects
already under development in Texas will max out the transmission capacity built under CREZ, which may reintroduce grid congestion and
curtailment. Meanwhile, states from New York, to Oregon, to Michigan have raised their Renewable Portfolio Standards, which set requirements for
utilities to source energy from renewable projects. These goals will require more renewable energy build and, in some cases, enabling transmission
infrastructure as well.
• Natural gas infrastructure remains important, along all segments of the value chain. In Appalachia, where a production boom has far outstripped
the region’s existing pipeline network, planned projects aim to boost pipeline capacity by 70% through 2020, allowing producers to export more to
the South, Northeast and West and alleviating inter-regional price discrepancies caused by congestion constraints. A simultaneous rise in gas
demand – much of it outside the Appalachian Basin – has given rise to a need for infrastructure build-out in other regions as well. In New England,
for example, coal and nuclear retirements have led to greater reliance on natural gas for power, but a lag in pipeline build has led to large, localized
gas price spikes and constraints in recent winters. Investment in new pipelines to bring gas into the region will be as important as Appalachian
pipeline takeaway capacity.
• Farther down the value chain, expanded service and distribution pipeline networks are connecting to more households, allowing more consumers
to benefit from surging supplies. Gas utilities now claim a record 68 million residential customers, up 13% over the past 10 years. All told, annual
investment in natural gas infrastructure now rivals that of electric transmission: total gas utility investment across transmission, storage and
distribution surged to $21.1bn in 2015, up from an average of $16-17bn over 2011-14, according to data collected by the American Gas
Association.
• Other investments in enabling infrastructure are helping to target demand-side efficiency and distributed resources: smart meter deployments
breached 70 million units in 2016, up 9% from 2015. Total smart meter penetration remains low compared to other nations, at only 44%, but a
number of large utilities have plans to ramp up installations.
• Infrastructure to accelerate the roll-out of electric vehicles is also ramping up, with the total number of public EV charging outlets soaring 29% in
2016 from the year prior to 40,075. California is piloting a new model targeting the main market for consumer EV charging: at home. To this end,
the California Public Utilities Commission approved a plan from PG&E to install 7,500 chargers in northern California alone.

10 © Bloomberg Finance L.P. 2017. Developed in partnership with The Business Council for Sustainable Energy.
Executive summary (4 of 8)
Improved infrastructure is critical to sustained long-term growth for sustainable energy (continued).
• Hydrogen infrastructure for fuel cell vehicles has also made headway in California and the northeastern United States. California’s government has
committed to developing at least 100 hydrogen fueling stations by 2025, with 25 retail hydrogen stations open throughout the state at the end of
2016. Toyota and Air Liquide have committed to building at least 12 hydrogen stations in the Northeast.
Low-priced oil continues to impact the transport sector, where recent gains in fuel economy are at risk of being erased.
• Sales of electric vehicles rebounded in 2016, jumping 38%. The surge was primarily driven by plug-in hybrid vehicles, such as the upgraded Chevy
Volt and new models like the BMW X5 xDrive, attracting 70% more buyers. Battery electric vehicles, including the Tesla Models S and X, saw an
additional 18% in units sold. Electric vehicle sales remain a small portion of total auto sales, topping 1% for the first time in Q3 2016.
• At the same time, hybrid electric vehicles (HEVs) – which compete more directly with traditional internal combustion engines – saw their sales
plunge 10%, likely due to the continued pressure from low oil prices. The falloff in HEV purchases, combined with a rebound in consumer interest in
large SUVs (up 22% in 2016), kept the average fuel economy of vehicles sold flat at 25 miles per gallon (mpg) for the third straight year.
• The return to less fuel efficient vehicles and low gasoline prices have resulted in two consecutive years of rising gasoline consumption. In 2016,
sales of gasoline rose 3.3% to 136bn gallons, only 1.5% below the all-time peak achieved in 2005 and 7.1% above the trough achieved in 2012.
• Current Corporate Average Fuel Economy (CAFE) standards continue to require incremental improvements annually on the part of vehicle
manufacturers. Although the standards through 2021 are set, those for 2022-25 underwent a midterm review in 2016. On 13 January 2017, the EPA
determined to hold CAFE steady at 50.8mpg for light-duty vehicles released in model year 2025. The Trump Administration will ultimately be
responsible for implementing the standard.
• Driven by the rising CAFE standards, the availability of fuel-efficient vehicles continues to climb. The market saw greater penetration of fuel-saving
start-stop technologies, which automatically switch off the engine while the car is stopped to cut fuel use and reduce idling emissions. Availability of
internal combustion engine (ie, traditional gasoline and diesel) models with start-stop technology exceeded 90 vehicles, or 9%, in 2016, up from less
than 1% in 2012. Electric vehicle model availability is also climbing, giving consumers the option to choose among 55 EV options in 2016, including
three fuel cell vehicles. Plug-in hybrid vehicles have experienced the greatest growth in the past two years, with 24 models available at the end of
2016, versus only 18 at the end of 2014.
• Natural gas continues to make inroads as a cleaner alternative to gasoline-powered vehicles, particularly within the heavy-duty vehicle segment.
Industry estimates suggest that 163,000 natural gas vehicles (NGVs) were on the road at the end of 2015, including over 45,000 heavy-duty NGVs.
The falloff in crude oil prices has partially eroded natural gas's price advantage; however, technological improvements continue to improve the
emissions profile of NGVs: a new low-NOx “Near-Zero” heavy-duty natural gas engine released in 2016 exceeds U.S. EPA standards by 90%.
Renewable natural gas (RNG), which can be used to meet federal biofuel blending standards, makes up a large share of total natural gas fuel sales
for vehicles. Year-on-year, RNG use surged 25%.

11 © Bloomberg Finance L.P. 2017. Developed in partnership with The Business Council for Sustainable Energy.
Executive summary (5 of 8)
The US continues to extract near-record amounts of domestic natural gas, despite persistent low prices. Meanwhile, the country’s first
liquefied natural gas export terminal promises to bring new sources of demand.
• Domestic natural gas production held steady near record-highs in 2016 even as prices dropped during the first half of the year. The benchmark
Henry Hub hit an 18-year low of $1.70/MMBtu in March 2016. Due to a lack of pipeline capacity, spot prices in the Appalachian Basis troughed at
$0.37/MMBtu and closed above the $2/MMBtu threshold during only 40 days of the year.
• Producers responded by taking rigs off line, but selective drilling in ‘sweet spots’ and technological advances that allow for greater output from
individual wells have allowed productivity per rig to continue rising. The Marcellus and Utica Shales, in particular, continue to see huge jumps in
productivity annually. All told, this buoyed 2016 natural gas production, holding it roughly steady at 24% above 2007 levels, or just over 81Bcfd.
• 2016 marked the start of operations for the first US liquefied natural gas (LNG) export terminal, at Sabine Pass on the Louisiana/Texas border.
Since February, Sabine has shipped approximately 50 cargoes of LNG to 16 destinations. Currently, LNG exports amount to a small portion of
demand for US gas. With US LNG competitive in a number of markets, additional terminals are under construction and export volumes should rise
significantly through 2020 if these come online as planned.
Investment in zero-carbon technologies slowed after a surge in 2015, as fewer companies sought financing in the public markets.
• Investment over the past ten years into zero-carbon technologies has been substantial, with $507bn flowing into the US clean energy sector. After
$63bn worth of investment into renewable energy and energy smart technologies in 2015, investment in 2016 fell to $59bn. The falloff in spending
was visible particularly within the solar sector, which dropped to $29bn from $35bn the year previous as solar costs fell and companies shunned the
public markets. Wind investment rose 11% to $15.5bn, and energy smart technologies (such as smart grid and electric vehicles) saw investment
ticking up by 5% to $10.6bn. The US remains the second largest destination for clean energy investment, surpassed by only China, which saw
$88bn of investment in 2016.
• The decline in 2016 primarily resulted from fewer companies turning to the public markets for financing, after solar roped in a record $8.3bn in 2015.
The April 2016 bankruptcy of SunEdison, which raised $2.3bn alone in 2015, and a pause in capital raising by yieldcos appear to be drivers of the
falloff.
• Asset finance – which tracks money flowing into new utility-scale projects only – totaled $31.6bn, a small drop-off from 2015’s $32.2bn. Financing in
2015 had surged 46% from 2014 levels, as market participants sought to lock in federal tax credits which were due to expire or step down at the end
of 2016. In the eleventh hour of the 2015 Congress, the Production Tax Credit for wind and the Investment Tax Credit for solar were extended for
five years apiece, effectively giving the market more time to invest, and, accordingly, 2016 declined. Almost all of the funds were directed into solar
and wind, which each captured $14.7bn. Biomass financing amounted to $196m, down from $286m in 2015. Small hydro saw its first significant
investment since 2011, with $77m in asset financing, and biogas received $24m. There was virtually no new financing tracked for waste-to-energy,
geothermal, or carbon capture and storage in 2016.

12 © Bloomberg Finance L.P. 2017. Developed in partnership with The Business Council for Sustainable Energy.
Executive summary (6 of 8)
Key federal policies supportive of sustainable energy hit stumbling blocks in 2016, while state-level actions continued.
• The Obama Administration’s flagship policy on carbon emissions from the power sector, the Clean Power Plan, was stalled in February 2016 when
the US Supreme Court granted plaintiffs a stay on implementing the regulation while a lawsuit is ongoing. With a stay in place, the EPA has been
unable to enforce any upcoming CPP deadlines, the first of which would have required states to submit the first draft of their implementation plans in
September 2016. At the same time, the CPP’s sister policy, the New Source Performance Standards (NSPS), has also been challenged in the
courts. If the NSPS is overturned, it could preclude the EPA from implementing the CPP regardless of its own status (under the US Clean Air Act,
the EPA must first regulate new sources of emissions before it can tackle existing sources).
• The tax credit extensions of late 2015 benefited the wind and solar sectors, but tax credits for other renewable energy and energy efficiency
technologies were not extended at that time and ultimately expired at the end of 2016. Significant attempts were made to extend all the remaining
energy efficiency and renewable energy tax provisions, but after the November 2016 election, congressional leaders shifted focus to tax reform,
where these provisions may be addressed.
• State-level policies remain equally if not more important in driving the sustainable energy transition. Renewable Portfolio Standards (RPS) have
been key tools in driving wind and solar build. States also use Energy Efficiency Resource Standards (EERS) to encourage energy savings, and
states determine net energy metering policies, which can be critical to distributed solar. In 2016, a number of states made sweeping changes to
each of these types of policies. Notable changes included:
− Illinois, which through a major new energy bill supplemented its existing RPS with requirements for utilities to source at least 2TWh of new
wind and solar each, by 2020. Additionally, the bill tightened location requirements, granting preference to in-state build. Taken together,
these changes should promote new, incremental renewable build within Illinois and its neighbors. SB 2814 also created a zero-emissions
credit program for the state’s nuclear facilities, ramped utility ComEd’s energy efficiency target to 17% by 2025 and 21.5% by 2030, and
preserved the current net metering regime (which will phase out when the 5% cap is hit).
− Michigan, whose legislature raised its RPS from 10% in 2015 to 15% in 2021 and expanded the program’s eligibility to include geothermal
heating systems. The new law also removed a cap which prohibited utilities from spending more than 2% of annual revenues on efficiency
programs. Finally, it requires electricity providers to give consumers choice in selecting green programs, while directing the state’s Public
Service Commission to begin the process of developing a tariff for distributed generation.
− Massachusetts, which set a mandate for 1.6GW of offshore wind by 2027, along with a requirement that the state’s utilities procure
9.45TWh of clean energy through long-term contracts and an authorization for the state to set a storage target. Meanwhile, the state
Supreme Court ruled that Massachusetts has not taken enough action on greenhouse gas emissions. In response, the state’s Republican
governor has proposed to raise the RPS target to 80% by 2050 and limit emissions from the transportation sector for the first time, among
other recommendations.

13 © Bloomberg Finance L.P. 2017. Developed in partnership with The Business Council for Sustainable Energy.
Executive summary (7 of 8)
Key federal policies supportive of sustainable energy hit stumbling blocks in 2016, while state-level actions continued.
− Ohio, where the governor vetoed a bill which would have made the state’s renewable energy and efficiency standards voluntary through
2019. The state had already frozen its targets at 2014 levels; with the governor’s veto, the targets will begin rising once again in 2017.
− New York, where the state’s “Reforming the Energy Vision” progressed with the adoption of a new Clean Energy Standard which formalizes a
renewable energy generation target of 50% by 2030, as well as a zero-emissions credit program to support three of the state’s struggling
nuclear facilities. Additionally, Westchester Smart Power became the state’s first Community Choice Aggregation (CCA) program, following
the Public Service Commission’s 2015 order authorizing CCAs, and the state approved $40m of financing for feasibility studies on microgrid
resiliency projects.
− California, which passed legislation requiring the state to reduce its greenhouse gas footprint by 40% below 1990 levels by 2030. A current
law already mandates that the state achieve 1990 emissions levels in 2020. The largest single source of emissions in the economy is the
state’s transport sector, suggesting that the new goal may help drive increased demand for more fuel efficient and alternative vehicle
technologies.
• More broadly, Property Assessed Clean Energy (PACE) is becoming more widely available as additional states and municipalities adopt programs
or enabling legislation. PACE helps finance renewable energy and energy efficiency upgrades to buildings by allowing the owner to pay off the cost
over 20 years via an addition to their property taxes. In 2016, Nevada signed off on legislation to allow for PACE financing, and Atlanta and Loudon
County, VA began developing new programs. As a result, financing via PACE providers is picking up rapidly: commercial PACE financing amounted
to $45m in Q3 2016, up 380% from Q3 2015 levels.
Corporates remain active, keeping a close eye on how – and from which sources – they consume energy.
• Within the US alone, corporations (eg, non-utility offtakers) signed 2.5GW worth of long-term power contracts with wind and solar projects. This tally
marked a one-year decline relative to 2015’s 3.7GW, but it remained well above 2014 levels. Other signs suggest corporate interest in renewable
energy will continue gaining momentum: 83 companies have now signed the “RE100”, a goal of sourcing 100% of their consumption from renewable
energy. Notable signees include Apple, BMW, HP, Johnson & Johnson, Kingspan, and P&G. Google also announced in 2016 that it would already
achieve this milestone globally by 2017. In addition, corporate customers continued to purchase stationary fuel cells to power their facilities,
headquarters, and distribution centers. Announcements of new or recurring orders of stationary fuel cells in 2016 included Home Depot, Morgan
Stanley, IKEA, and Pfizer.

14 © Bloomberg Finance L.P. 2017. Developed in partnership with The Business Council for Sustainable Energy.
Executive summary (8 of 8)
Corporates remain active, keeping a close eye on how – and from which sources – they consume energy (continued)
• Corporations are also increasingly concerned about using energy efficiently. More corporations are using ISO 50001, an energy management
systems standard to reduce costs and carbon emissions. The US Department of Energy Superior Energy Performance program, which certifies
facilities that have implemented the ISO 50001 standard, continued to expand in 2016: new buildings certified include multiple facilities from
Schneider Electric and 3M, and the JW Marriott in Washington, DC. In addition, other voluntary programs encourage corporate and industrial
partners to pledge to improve their energy performance. The DOE’s Better Plants program asks facilities to reduce energy intensity by 25% over ten
years, and the new “EP100”, an initiative where companies pledge to double their energy productivity, was launched in early 2016. Member
companies include Johnson Controls and Swiss Re.
The US remains one of the most competitive places for energy-intensive industries.
• Exceedingly low natural gas and electricity prices have helped to reduce costs for industrial players, particularly those in energy-intensive sectors.
Despite a surge in the value of the dollar over 2015-16, the United States remains among the lowest cost markets for electricity in the world for
industrial customers, beating out other large countries such as China, India, Mexico and Japan.
Greenhouse gas emissions continue to plummet, reaching new milestones despite policy uncertainty.
• Total greenhouse gas emissions in the US plunged to a 25-year low in 2016, falling to an estimated 6.5GtCO2e. Gross emissions (ie, not accounting
for emissions absorbed by forests and sinks) now sit 12.1% below their peak of 7.4Gt attained in 2007, and 11.6% below 2005 levels. The 2005
level is notable because it is the benchmark against which recent national climate policies have been measured: the Paris Accord included a pledge
by the US to reduce emissions between 26-28% below 2005 levels by 2025; estimates for 2016 shows that the US is almost halfway to that goal.
The US is also increasingly close to hitting a 2020 target pledged by the Obama Administration in 2009, which aimed for a 17% decrease from 2005
levels.
• Within the power sector, the progress is even more noteworthy: in 2016, greenhouse gas emissions from US power plants dropped 5.3% in just one
year. Since 2005, the power sector has shrunk its carbon footprint by 24% – in other words, the US is 75% of the way to the Clean Power Plan’s
“32% by 2030” headline target, with 14 additional years left to go. In large part, this decarbonization is due to market forces: the boom in domestic
natural gas production has provided the sector with a cheap, cleaner burning source of fuel (a natural gas combined-cycle plant emits roughly 60%
less carbon than a coal-fired unit); additionally, renewable energy costs have fallen dramatically and corporations have captured cost-savings
through energy efficiency measures.
• The retirement of 49GW of coal-fired power plants and the construction of 104GW of natural gas, 78GW of wind and 39GW of solar over the 2005-
16 timeframe should assure some permanency to US decarbonization: these changes are structural. However, operational fuel switching is still at
play, and a return to a higher priced natural gas environment could reverse, at least partially, the recent downward swing in US emissions.

15 © Bloomberg Finance L.P. 2017. Developed in partnership with The Business Council for Sustainable Energy.
The 2017 Factbook in context of previous editions
The first edition of the Sustainable Energy in America Factbook, published in January 2013, captured five years’ worth of
changes that included a rapid de-carbonization of the US energy sector. From 2007 to 2012, natural gas’s contribution to
electricity had grown from 22% to 31%, and total energy use had fallen by 6%, driven largely by advances in energy efficiency.
Renewables including hydropower grew from 8% to 12% of total electricity output, with generation from non-hydro sources more
than doubling during that time frame.
The second edition of the report, published February 2014, compared developments in 2013 to the longer-term trends described
in the first edition. In some cases, the tendencies had continued: natural gas production, small-scale solar installations, policy-
driven improvements in building efficiency, and electric vehicle usage had continued to gain ground, cementing five-year patterns.
Other measures – total energy consumed (up in 2013 relative to 2012), the amount of emissions associated with that energy
consumption (up), and the amount of new investment into renewable energy (down) – had bucked the longer-term trends.
The third edition of the report came out in February 2015 and provided updated data and analysis covering developments in
2014. Natural gas production continued its upswing, prompting the industry to build and reconfigure infrastructure. Renewables
again grew their share of states’ capacity mixes, reaching 206GW of installations across the country. But policy developments
stagnated and the crude oil price collapse raised the possibility of impacts down the road on sustainable transport and second-
order impacts on the power sector.
The fourth edition of the Factbook was released in February 2016 and looked back on a year in which the US added record
amounts of renewables while policy frameworks for supporting a clean energy future emerged at both the international and
domestic levels. Natural gas generation hit a record-high at the expense of coal, as gas prices sank to the lowest levels since
1999. Coal-to-gas switching also helped to drive down power sector emissions to the lowest point since 1995. Renewable
capacity including hydropower grew from 206GW to 222GW, and the last-minute extension of federal tax credits for renewables
added further momentum to the industry. The signing of the Paris Agreement gave further policy support to sustainable energy.
This most recent update to the Factbook covers 2016, a year in which natural gas generation overtook coal, the growth of
renewables accelerated, and utilities put more dollars into transmission and natural gas infrastructure to improve reliability. As the
transformation of the sector plays out, consumers are spending less of their household income on energy – under 4% in 2016,
the smallest share on record.

16 © Bloomberg Finance L.P. 2017. Developed in partnership with The Business Council for Sustainable Energy.
Table of contents
8. Global context
1. Introduction
2. A look across
the US energy
sector
3. Natural gas
4. Large-scale
renewable
electricity and
CCS
2.1 Bird’s-eye view
2.2 Policy, finance, economics
4.1 Solar (PV, solar thermal)
4.2 Wind
4.3 Biomass, biogas, waste-to-
energy
4.4 Geothermal
4.5 Hydropower
4.6 CCS
5. Distributed
power and
storage
5.1 Small-scale solar
5.2 Small- and medium-scale wind
5.3 Small-scale biogas
5.4 Combined heat and power and
waste-heat-to-power
5.5 Fuel cells (stationary)
5.6 Energy storage
6. Demand-
side energy
efficiency
6.1 Energy efficiency
6.2 Smart grid and demand response
7. Sustainable
transportation
7.1 Electric vehicles
7.2 Natural gas vehicles
7.3 Biofuels

17 © Bloomberg Finance L.P. 2017. Developed in partnership with The Business Council for Sustainable Energy.
0.00
0.02
0.04
0.06
0.08
0.10
0.12
0.14
0.16
0.18
0.20
199
0
199
2
199
4
199
6
199
8
200
0
200
2
200
4
200
6
200
8
201
0
201
2
201
4
201
6
Energy productivity
US GDP and primary energy consumption
(indexed to 1990 levels)
US energy productivity
($ trillion of GDP / quadrillion Btu of energy)
Source: US Energy Information Administration (EIA), Bureau of Economic Analysis, Bloomberg Terminal
Notes: Values for 2016 energy consumption are projected, accounting for seasonality, based on latest monthly values from EIA (data available through October 2016). GDP is real and chained (2009
dollars); annual growth rate for GDP for 2016 is based on consensus of economic forecasts gathered on the Bloomberg Terminal as of January 2017.
● The US economy continues to become more energy productive, as total energy consumption plateaus while GDP advances.
Over the past 25 years, real GDP has accelerated by 80%, while primary energy consumption has risen by only 14%. Within
the past 10 years, this decoupling is even more evident: GDP has grown by 12%, while energy consumption has declined
3.6%.
● By another measure (US GDP per unit of energy consumed), productivity has soared 58% since 1992, 16% since 2007, and
1.8% since 2015. While the shifting composition of the US economy is a key driver, estimates put forward by the American
Council for an Energy Efficient Economy in 2015 indicate that efficiency gains are responsible for as much as 60% of the
energy intensity improvements seen since 1980.
0.9
1.0
1.1
1.2
1.3
1.4
1.5
1.6
1.7
1.8
1.9
199
0
199
2
199
4
199
6
199
8
200
0
200
2
200
4
200
6
200
8
201
0
201
2
201
4
201
6
GDP (indexed)
Primary energy consumption (indexed)
US energy overview: Economy’s energy productivity

18 © Bloomberg Finance L.P. 2017. Developed in partnership with The Business Council for Sustainable Energy.
US energy overview: Energy and electricity consumption
US primary energy consumption by fuel type
(quadrillion Btu) US electricity demand
Source: EIA Notes: CAGR is compound annual growth rate. Values for 2016 are projected, accounting for seasonality, based on latest monthly values from EIA (data available through October 2016)
● Energy consumption dipped for a second consecutive year in 2016, falling by 0.2% even as GDP grew 1.6%. In 2015,
consumption had tumbled 0.8% while the economy expanded at a 2.6% clip.
● At the same time, the energy mix has transitioned towards lower-carbon sources:
˗ Coal’s contribution to total energy collapsed to 14% in 2016, from 23% in 2007.
˗ Natural gas climbed from 23% to nearly 30%, while renewables (including hydropower) surged to over 10%, from 6.5%.
● Annualized electricity growth has been declining, from 5.9% in 1950-1990, to 1.9% in 1990-2007, to -0.1% since 2007.
Demand (TWh) Growth rate (%)
0
15
30
45
60
75
90
105
199
01
99
11
99
21
99
31
99
41
99
51
99
61
99
71
99
81
99
92
00
02
00
12
00
22
00
32
00
42
00
52
00
62
00
72
00
82
00
92
01
02
01
12
01
22
01
32
01
42
01
52
01
6
Renewables Hydro Natural gas
Nuclear Petroleum Coal
-4%
-3%
-2%
-1%
0%
1%
2%
3%
4%
5%
0
500
1,000
1,500
2,000
2,500
3,000
3,500
4,000
4,500
1990
199
11
99
21
99
31
99
41
99
51
99
61
99
71
99
81
99
92
00
02001
200
22
00
32
00
42
00
52
00
62
00
72
00
82
00
92
01
02
01
12012
201
32
01
42
01
52
01
6
Demand Annual growth rate CAGR since 1990

19 © Bloomberg Finance L.P. 2017. Developed in partnership with The Business Council for Sustainable Energy.
49% 48% 44% 45% 42%37% 39% 39%
33% 30%
19% 20%20% 20%
19%19% 19% 19%
19%20%
22% 22% 24% 24%25%
31% 28% 28%33%
34%
8% 9% 11% 10% 13% 12% 13% 13% 14% 15%
0%
20%
40%
60%
80%
100%
200
7
200
8
200
9
201
0
201
1
201
2
201
3
201
4
201
5
201
6
Renewables(including hydro)
Natural gas
Nuclear
Oil
Coal
US electricity generation by fuel type (%) US electricity generation by fuel type (TWh)
● Natural gas has eclipsed coal as the largest contributor to the US electricity mix, hitting 34% in 2016, as aging coal-fired units
retired and natural gas prices remained low. Coal sank to second place, providing 30% of the mix – its lowest share on
record. Year-on-year, coal-fired power plants generated 10% less, slipping to 1,219TWh from 1,352TWh in 2015.
● Renewable generation topped 15% for the first time as the record-breaking drought in the West eased, boosting hydro
generation, and as more solar and wind were connected to the grid.
● Since 2007, the US power sector has made large strides towards a decarbonized grid: coal’s share plummeted from 49% to
30%, while natural gas’s grew from 22% to 34% and renewables from 8% to 15%. On an absolute basis, coal generation
sank 39% and natural gas generation rocketed 56% over the same timeframe.
US energy overview: Electricity generation mix
Source: EIA
Notes: Values for 2016 are projected, accounting for seasonality, based on latest monthly values from EIA (data available through November 2016). In chart at left, contribution from ‘Other’ is not shown; the
amount is minimal and consists of miscellaneous technologies including hydrogen and non-renewable waste. The hydropower portion of ‘Renewables’ includes negative generation from pumped storage.
0
500
1,000
1,500
2,000
2,500
3,000
3,500
4,000
4,500
200
7
200
8
200
9
201
0
201
1
201
2
201
3
201
4
201
5
201
6

20 © Bloomberg Finance L.P. 2017. Developed in partnership with The Business Council for Sustainable Energy.
● In the past five years, renewable energy projects, including hydro, have made up 62% of new capacity additions in the US.
● Additionally, within the past 25 years, 92% of new power capacity built in the US has been natural gas plants or renewable
energy projects, again including hydro.
● In 2016, non-hydro renewables continued to represent the largest share of build, adding 21GW of capacity, or roughly 70% of
total build for the second straight year. Gas build totaled 7.4GW, and for the first time since the 1990s, there was also nuclear
build of 1.1GW.
Source: EIA, Bloomberg New Energy Finance Note: All values are shown in AC except solar, which is included as DC capacity. “Renewables” here does not include hydro, which is shown separately.
Last year’s Factbook included anticipated nuclear build; however, the Watts Bar reactor was in fact turned on in 2016; accordingly, the nuclear build is shown here in 2016.
US energy overview: Electric generating capacity build by fuel type (GW)
0
10
20
30
40
50
60
70
199
0
199
1
199
2
199
3
199
4
199
5
199
6
199
7
199
8
199
9
200
0
200
1
200
2
200
3
200
4
200
5
200
6
200
7
200
8
200
9
201
0
201
1
201
2
201
3
201
4
201
5
201
6
Renewables
Hydro
Nuclear
Oil
Gas
Coal

21 © Bloomberg Finance L.P. 2017. Developed in partnership with The Business Council for Sustainable Energy.
● Solar build boomed in 2016, as the industry installed 12.5GW – a 73% increase over the previous year, and the largest
addition from any single technology in 2016.
● Utility-scale solar PV ramped up the fastest, as developers installed 8.9GW, more than double 2015’s 4.4GW. The upswing in
build was partly driven by the previously anticipated expiration of the Investment Tax Credit (ITC): the ITC was due to drop
from 30% to 10% at the end of 2016, prompting many to bring forward development to capture the full credit. With the five-year
extension granted in late 2015, urgency diminished, but a slew of projects that had already broken ground proceeded.
● Small-scale solar added 3.4GW, as falling costs make it increasingly competitive with retail rates in certain parts of the country.
● Wind build held steady at 8.5GW. Like solar, the wind industry benefited from an eleventh-hour extension of the Production
Tax Credit, which now applies to projects that begin construction by end-2019. For the first time, the US also saw offshore
wind build, as the 30MW Block Island wind farm switched on in December.
● Other sectors (biomass, biogas, waste-to-energy, geothermal, hydro) are idling without long-term policy support. Source: Bloomberg New Energy Finance, EIA Notes: All values are shown in AC except solar, which is included as DC capacity. Numbers include utility-scale (>1MW) projects of all types, rooftop solar,
and small- and medium-sized wind.
US energy overview: Renewable energy capacity build by technology (GW)
9.2 10.2
4.86.6
14.0
0.7
5.1
8.5 8.5
0.30.4
0.9
2.2
3.2
5.7
6.7
7.2
12.5
9.911.2
6.0
9.4
18.2
7.6
12.3
16.2
21.5
5
10
15
20
25
2008 2009 2010 2011 2012 2013 2014 2015 2016
Hydro
Geothermal
Biomass, biogas,waste-to-energy
Solar
Wind

22 © Bloomberg Finance L.P. 2017. Developed in partnership with The Business Council for Sustainable Energy.
102 102 102 102 102 102 102 102 103
41 52 58 6785 92 104
120141
143154 160
169187 194
206222
244
50
100
150
200
250
300
200
8
200
9
201
0
201
1
201
2
2013
201
4
201
5
201
6
Otherrenewables
Hydropower
US cumulative renewable capacity by technology
(including hydropower) (GW)
US cumulative non-hydropower renewable
capacity by technology (GW)
● Total renewable capacity has increased 70% since 2008, reaching 244GW in 2016. Year-on-year, hydropower capacity ticked
up slightly to 103GW and other renewables grew by 21.1GW, or 18%. Wind and solar build in particular continues to climb
due to supportive tax policies, state-level renewable portfolio standards (RPS) and falling system costs.
● Since 2008, new wind and solar build have almost quintupled their total installed capacity, expanding from only 26GW to
123GW at the end of 2016. The bulk of solar’s additions have come within the past five years (35GW from 2012-16), as costs
fell precipitously.
US energy overview: Cumulative renewable energy capacity by technology
Source: Bloomberg New Energy Finance, EIA
Notes: All values are shown in AC except solar, which is included as DC capacity. Hydropower capacity includes pumped hydropower storage facilities. Totals may not sum due to rounding.
2535 40 46
60 61 6675
83
12
25
8 1420
27
40
12
1313
13
1414
14
14
14
3
33
3
33
4
4
4
41
5258
67
8592
104
120
141
20
40
60
80
100
120
140
160
200
8
200
9
201
0
201
1
201
2
201
3
201
4
201
5
201
6
Geothermal
Biomass,biogas, waste-to-energy
Solar
Wind

23 © Bloomberg Finance L.P. 2017. Developed in partnership with The Business Council for Sustainable Energy.
241 249 269 255313
271 264 253 244 259
105 126144 167
194218 254 290 309
360346
375413 422
507 490517
544 553
619
0
100
200
300
400
500
600
700
200
7
200
8
200
9
201
0
201
1
201
2
201
3
201
4
201
5
201
6
Otherrenewables
Hydropower
● Total renewable generation swelled in 2016, increasing 12% over 2015 levels. Newly built wind and solar projects added
50TWh of incremental carbon-free generation, and at the same time, an easing drought out West boosted hydro output to its
highest level in three years. Hydropower remains the largest single source of renewable generation (42%), but wind (36%) is
catching up quickly.
● Non-hydro renewable generation has more than tripled over the past ten years. The largest growth was exhibited within the
wind and solar sectors: wind generation has multiplied almost seven times over, while solar generation grew from virtually
nothing to hit 56TWh in 2016.
US energy overview: Renewable energy generation by technology
Source: Bloomberg New Energy Finance, EIA
Notes: Values for 2016 are projected, accounting for seasonality, based on latest monthly values from EIA (data available through November 2016). Includes net energy consumption by pumped hydropower
storage facilities. Totals may not sum due to rounding. Beginning in 2014, numbers include estimated generation from distributed solar; generation from other distributed resources is not included.
US renewable generation by technology
(including hydropower) (TWh)
US non-hydropower renewable generation by
technology (TWh)
34 55 74 95120141
168182191224
11
11
24
929
39
56
5655
5456
5758
61
6464
63
1515
1515
1516
16
1616
17
105126
144167
194218
254
290309
360
0
50
100
150
200
250
300
350
400
2007
2008
2009
201
0
201
1
201
2
201
3
201
4
201
5
201
6
Geothermal
Biomass, biogas,waste-to-energy
Solar
Wind

24 © Bloomberg Finance L.P. 2017. Developed in partnership with The Business Council for Sustainable Energy.
● US GHG emissions are projected to be at their lowest levels in 25 years, falling to an estimated 6.5GtCO2e in 2016 – close to
levels observed in 1992. All told, total GHG emissions (excluding sinks) are approximately 12% below 2005 levels, the
baseline used in the Obama Administration’s climate commitments, and nearly halfway to the US’ Paris goal of a 26-28% cut
by 2025, as set out under President Obama.
● Total GHG emissions fell an estimated 2.0% year-on-year, following on the heels of a 3.2% decrease the year prior. The power
sector has been a significant driver of the economy’s decarbonization, primarily due to the switch to cleaner-burning natural
gas. In 2016, power-sector emissions shrank 5.3% year on year, bringing them to 24.1% below 2005 levels.
Source: Bloomberg New Energy Finance, EIA, EPA
Notes: ‘Sinks’ refer to forests and green areas which absorb carbon dioxide. Values may differ from last year’s, due to recalculations and revisions published by the EPA, primarily to methane emissions.
Values for 2016 are projected, accounting for seasonality, based on latest monthly values from EIA (data available through October 2016). ‘Obama’s target’ refers to a pledge made in Copenhagen climate
talks in 2009. The target shown here assumes 17% reduction by 2020 on 2005 levels of total GHG emissions, but the actual language of the announcement left vague whether the reductions applied to
economy-wide emissions or just emissions of certain sectors. Data for total GHG emissions comes from EPA’s Inventory of US Greenhouse Gas Emissions and Sinks (1990-2014), published April 2016.
Data for CO2 emissions from the energy sector comes from the EIA’s Monthly Energy Review.
4,000
4,500
5,000
5,500
6,000
6,500
7,000
7,500
8,000
1990
1992
1994
1996
1998
2000
2002
2004
2006
2008
2010
2012
2014
2016
2018
2020
GHG emissions from energy sector, 1990-2016e
Total GHG emissions,1990
Obama's target, 2020
Total (gross) GHG emissions,2005-2016e
0
500
1,000
1,500
2,000
2,500
3,000
1990
1992
1994
1996
1998
2000
2002
2004
2006
2008
2010
2012
2014
2016
2018
2020
GHG emissions from power sector only
US energy overview: Greenhouse gas emissions, power sector, energy sector and economy-wide (MtCO2e)

25 © Bloomberg Finance L.P. 2017. Developed in partnership with The Business Council for Sustainable Energy.
Source: Bloomberg New Energy Finance, EIA, Bloomberg Terminal Notes: Wholesale prices are taken from proxy power hubs in each ISO and are updated through end-2016. The retail power prices shown
here are not exact retail rates, but weighted averages across all rate classes by state, as published by EIA 826. Retail prices are updated through end-November 2016. All prices are in real 2016 dollars.
Average retail power prices (2016 $/MWh)
● Wholesale power prices continued their descent in 2016, as natural gas prices touched an 18-year low in March and more
zero-marginal cost renewables bid into the market. Year-on-year, around-the-clock prices dropped by as much as 29% in New
England (ISONE), 23% in New York (NYISO) and 18% in PJM in real terms. In the Midwest (MISO), prices held relatively flat,
falling 0.2% year-on-year. The declines in 2016 followed after roughly 30% slides in 2015 for most regions.
● Retail prices also declined, at an average clip of 2.2% across the country. Regionally, the falloff in retail prices was most visible
in New York and Texas (ERCOT), which saw decreases of 5.6% and 6.2%, respectively. Retail prices are typically less
responsive to changes in the fuel mix or in fuel prices, because wholesale power costs make up only a portion of retail bills.
● Since 2005, US average retail prices have risen only 1.4% in real terms. Prices are down 7% from their 2008 peak.
Wholesale power prices (2016 $/MWh)
0
20
40
60
80
100
120
140
160
180
200
200
6
200
7
200
8
200
9
201
0
201
1
201
2
201
3
201
4
2015
201
6
New York
NewEnglandCalifornia
PJM
MISO
ERCOT
Northwest
Florida
Southwest
Southeast
0
20
40
60
80
100
120
2006
200
7
200
8
200
9
201
0
201
1
201
2
201
3
2014
201
5
201
6
NYISO
ISONE
CAISO
PJM
MISO
ERCOT
Northwest
US energy overview: Retail and wholesale power prices (2016 $/MWh)

26 © Bloomberg Finance L.P. 2017. Developed in partnership with The Business Council for Sustainable Energy.
Source: Bureau of Economic Analysis, Bloomberg New Energy Finance Notes: Values for the fourth quarter of 2016 are preliminary.
● Americans are dedicating less of their household spending to energy than at any other time on record: energy
consumption as a share of total consumption expenditures averaged 3.9% in 2016, the first year in which this measure
came in below 4% since the Bureau of Economic Analysis began reporting data in 1959.
● Consumption costs for natural gas and electricity reflect a similar trend: natural gas represented under 0.4% of total
spending, and electricity came in at 1.4%, both the lowest totals on record.
● The falloff spending is likely a result of falling fuel costs as well as energy efficiency measures.
Electricity and natural gas as a share of total
consumption expenditure
Total energy goods and services as a share of
total consumption expenditure
US energy overview: Energy as share of total US personal consumption expenditure
0%
2%
4%
6%
8%
10%
1960 65 70 75 80 85 90 95 2000 05 10 150.0%
0.5%
1.0%
1.5%
2.0%
2.5%
1960 65 70 75 80 85 90 95 2000 05 10 15
Electricity
Natural gas

27 © Bloomberg Finance L.P. 2017. Developed in partnership with The Business Council for Sustainable Energy.
Table of contents
8. Global context
1. Introduction
2. A look across
the US energy
sector
3. Natural gas
4. Large-scale
renewable
electricity and
CCS
2.1 Bird’s-eye view
2.2 Policy, finance, economics
4.1 Solar (PV, solar thermal)
4.2 Wind
4.3 Biomass, biogas, waste-to-
energy
4.4 Geothermal
4.5 Hydropower
4.6 CCS
5. Distributed
power and
storage
5.1 Small-scale solar
5.2 Small- and medium-scale wind
5.3 Small-scale biogas
5.4 Combined heat and power and
waste-heat-to-power
5.5 Fuel cells (stationary)
5.6 Energy storage
6. Demand-
side energy
efficiency
6.1 Energy efficiency
6.2 Smart grid and demand response
7. Sustainable
transportation
7.1 Electric vehicles
7.2 Natural gas vehicles
7.3 Biofuels

28 © Bloomberg Finance L.P. 2017. Developed in partnership with The Business Council for Sustainable Energy.
Policy – key sustainable energy policy developments in 2015 (1 of 5): Availability of PACE financing, 2016
● Property Assessed Clean Energy (PACE) is a mechanism to help finance renewable energy and energy efficiency upgrades
to buildings, by allowing the owner to pay off the cost over 20 years via an addition to property taxes.
● PACE is becoming more widely available across the country, as states and municipalities pass enabling legislation. In 2016,
Nevada signed off on legislation to allow for PACE financing, and Atlanta and Loudon County, VA began developing new
PACE programs. Financing via PACE providers is picking up rapidly: commercial PACE financing amounted to $45m in Q3
2016, up 380% from Q3 2015 levels.
● A number of other PACE developments occurred in 2016. In June, Renovate America closed the securitization of $305m in
PACE bonds, the largest securitization to date. In July, the Internal Revenue Service found that, subject to restrictions, the
interest portion of a PACE payment may be deducted from personal income taxes. And in August, the US’s largest
agricultural PACE project to date, a $4m financing of a farm-to-plate hog-raising facility, was completed in Missouri.
Statewide availability
Regional or local availability
Wide availability
Enabling legislation; no program
OR
MI
MN
WI NY
CA CO
MO
AR
KY
OH
TX
FL
UT CT
RI
NH
MD
NJ
GA DC
MA
NV
WY
IL
OK
NE
NM
ME VT
NC
AL
VA
Source: PACENation, Bloomberg New Energy Finance

29 © Bloomberg Finance L.P. 2017. Developed in partnership with The Business Council for Sustainable Energy.
Source: Bloomberg New Energy Finance
Policy – key sustainable energy policy developments in 2015 (2 of 5): US vehicle fleet fuel economy vs. Federal standard, 2004-2016 (miles/gallon)
● The efficiency of fossil-fueled vehicles continues to improve as a result of increasingly stringent federal and state
standards. Cars have outperformed the federal Corporate Average Fuel Economy (CAFE) target in every year since
2004, although this outperformance gap has narrowed in recent years. Trucks have been at risk of non-compliance
several times over the past five years and came in 1.2mpg below the standard in 2016.
● Growing adoption of technologies such as start-stop systems, turbocharging and cylinder deactivation have maintained
the market appeal of internal combustion vehicles while increasing their fuel economy. Sales of alternatively-fueled
vehicles have also helped automakers to meet the standards.
0
5
10
15
20
25
30
35
40
2004 2006 2008 2010 2012 2014 2016
Achievedfueleconomy
Standard
Cars
Trucks

30 © Bloomberg Finance L.P. 2017. Developed in partnership with The Business Council for Sustainable Energy.
Source: EPA documents, Bloomberg New Energy Finance
Policy – key sustainable energy policy developments in 2015 (3 of 5): Mid-term evaluation of fleet fuel efficiency standards for 2022-2025 vehicles
Agencies issued
draft Technical
Assessment Report
on current
technology and
market status.
June 2016
EPA made
proposed
determination that
standards are
‘appropriate.’
November 2016
After comment
period, EPA
finalized
determination that
standards are
‘appropriate.’
January 2017 Q1 2020
Final rule must be
in place no later
than 18 months
before model-year
2022 vehicles
become available.
● The Mid-Term Evaluation for the Corporate Average Fuel Economy (CAFE) standards, a part of EPA’s regulations
governing the emissions of model year 2017-2025 light-duty vehicles, offered the agency an opportunity to address
unforeseen market and technology changes that might impact the progression of CAFE standards.
● On 13 January 2017, EPA determined that the standards are appropriate. However, implementation will rest in the hands
of the Trump Administration.
● The current standard calls for light-duty vehicles to hit 50.8mpg in 2025, up from 35.3mpg in 2016.

31 © Bloomberg Finance L.P. 2017. Developed in partnership with The Business Council for Sustainable Energy.
Source: AEP company reports, campaign website of Donald Trump, Bloomberg New Energy Finance
Policy – key sustainable energy policy developments in 2015 (4 of 5): US transmission infrastructure
● The aging US transmission system has seen increasing investment in recent years and may continue to be a major area
of spending. For example, the transmission lines of AEP, the largest transmission owner in the US, have an average age
of 52 years. AEP estimates that it would need to invest $2.5bn per year simply to maintain the current asset age profile of
the over 40,000 miles of transmission lines under its ownership.
● President Trump has pledged to invest in modernizing and improving the reliability of the US electricity grid as part of his
infrastructure plan.
US transmission infrastructure asset map

32 © Bloomberg Finance L.P. 2017. Developed in partnership with The Business Council for Sustainable Energy.
Source: Bloomberg New Energy Finance, EIA
Policy – key sustainable energy policy developments in 2015 (5 of 5): Clean Power Plan history and outlook
3 Aug 2015 EPA releases final Clean Power Plan
23 Oct 2015 CPP published in Federal Register, lawsuits filed
9 Feb 2016 Supreme Court stays CPP
27 Sept 2016 Oral arguments before DC Circuit appeals court
Early 2017
DC Circuit decision expected
Mid-2017
Supreme Court hears CPP appeal
End 2017/ Early 2018 Supreme Court decision
● The Clean Power Plan (CPP) aims for a national reduction of 32% of power sector CO2 emissions (from 2005 levels)
by 2030 and delegates the responsibility for doing so to individual states. In 2016, power-sector emissions were
already to 24.1% below 2005 levels, according to preliminary government data.
● The plan brought legal challenges from business operators, coal companies, state governments and utilities. It was
stayed by the Supreme Court in February 2016, pending review by a federal appeals court.
● The CPP’s roll-out has been postponed until the legal cases are resolved. Interim compliance deadlines, including
those for states to submit their initial implementation plans in September 2016, have been suspended.
● Regardless of the legal outcome, the CPP in its present form is subject to revision or replacement by the Trump
Administration, which took office in January 2017.

33 © Bloomberg Finance L.P. 2017. Developed in partnership with The Business Council for Sustainable Energy.
● US investment in clean energy fell slightly in 2016, dropping to $58.8bn, a 7% decline from 2015’s all-time record of
$63.2bn. The drop in 2016 stems primarily from a drop in public markets funding, as solar companies turned to other
funding avenues. It also reflects a return to normalcy after the 2015 rush to finance wind and solar projects before what was
then seen as the expiration of the ITC and PTC (which were ultimately extended in late 2015).
● As with 2015, the majority of new investment in 2016 flowed into solar ($29.3bn, or 50% of the total). Wind came in second,
with $15.5bn, or 26%. Energy smart technologies (EST) ranked third with $10.6bn, or 18%.
● Clean energy investment has averaged $54.3bn annually after 2011. High levels of investment in 2011 came on the back of
spending under the American Recovery and Reinvestment Act, and a push to build wind projects in advance of what would
have been the end of the Production Tax Credit in 2012, if Congress had not authorized its extension.
Finance: US clean energy investment (1 of 2) – total new investment, all asset classes ($bn)
Source: Bloomberg New Energy Finance
Notes: Chart displays total clean energy investment in the US across all asset classes (asset finance, public markets, venture capital / private equity, corporate and government R&D, and small
distributed capacity (rooftop solar)). The definition of ‘clean energy’ used here is renewable energy, energy smart technologies (digital energy, energy storage, electrified transportation) and other low-
carbon technologies and activities (carbon markets value chain, companies providing services to the clean energy industry). Values include estimates for undisclosed deals and are adjusted to account
for re-invested equity. Values are in nominal dollars.
10.4
16.5
34.6
47.2 43.6
35.1
46.6
62.6
52.9
44.7
51.7
63.2 58.8
0
10
20
30
40
50
60
70
2004 2005 2006 2007 2008 2009 2010 2011 2012 2013 2014 2015 2016

34 © Bloomberg Finance L.P. 2017. Developed in partnership with The Business Council for Sustainable Energy.
Source: Bloomberg New Energy Finance Notes: See previous slide for definition of ‘clean energy’. Values are in nominal dollars and include estimates for undisclosed deals. The asset finance, public
markets, VC/PE and small distributed capacity figures do not add up to the total investment figure on the previous slide, as the total also includes R&D (corporate and government) and subtracts out re-
invested equity.
Asset finance Public markets Venture capital /
private equity
Small distributed capacity
(ie, rooftop solar)
$0.4 $1.2 $3.2 $7.1 $4.7 $4.7 $3.4 $1.8 $1.5 $6.2$10.0 $10.6
0
50
20
04
20
05
20
06
20
07
20
08
20
09
20
10
20
11
20
12
20
13
20
14
20
15
Other Energy smart technologies Biofuels Wind Solar
● Utility-scale solar and wind dominated asset finance in 2016, as they have since 2006. Investments flowing to wind through
this avenue were up $0.7bn (+5%) from 2015, while those going to solar declined by $1bn (-6%) as costs fell.
● Public market transactions plummeted 70% from the previous year, in large part because the solar sector barely tapped this
source in 2016 after raising $8.3bn in 2015. The record-level 2015 activity had relied in large part on SunEdison and its
yieldco, Terraform Global, which together raised $2.7bn between Q1 and Q3 2015. SunEdison declared bankruptcy in April
2016. Wind and energy smart technologies (EST) topped public market activity in 2016 instead, as NextEra raised $252m in
Q1 and $353m in Q3, while Tesla raised $1.7bn in Q2. The large amount raised by Tesla means that yet again, electrified
transport dominated funds raised by EST companies through public markets.
● Venture capital and private equity investment totaled $3.5bn in 2016, down $0.5bn from 2015. Solar and EST were again the
major VC/PE targets, absorbing 50% and 34% of the funding, respectively.
● Investment in rooftop solar hit $13.1bn in 2016, up $3.2bn from 2015.
Finance: US clean energy investment (2 of 2) – new investment by asset class by sector ($bn)

35 © Bloomberg Finance L.P. 2017. Developed in partnership with The Business Council for Sustainable Energy.
● Investment in electric transmission by investor-owned utilities and independent transmission developers hit a new peak of
$20.1bn in 2015, up 3% from 2014 levels and nearly double what was observed in 2010.
● Based on company reports, investor presentations and a survey conducted by the Edison Electric Institute (EEI),
transmission investment is likely to grow another 7% in 2016. Current capex plans suggest that investment will peak at
$22.5bn in 2017; however, because 2018-2019 budgets are not yet finalized, these numbers may be revised upwards.
● The upswing in transmission investment is motivated by a number of factors, all of which concern the utility’s fundamental
aim of providing reliable, safe power. These include a need to replace and upgrade aging power lines, resiliency planning in
response to recent natural disasters, the integration of renewable resources and congestion reduction.
Finance: US transmission investment by investor-owned utilities and independent transmission developers ($bn)
Source: Edison Electric Institute, Bloomberg New Energy Finance Note: Values are in nominal dollars.
10.2
11.9
14.8
16.9
19.5 20.121.5
22.521.0
18.5
0
5
10
15
20
25
2010 2011 2012 2013 2014 2015 2016e 2017e 2018e 2019e

36 © Bloomberg Finance L.P. 2017. Developed in partnership with The Business Council for Sustainable Energy.
Finance: Returns of global clean energy indices relative to benchmarks
● Global stock markets generally rallied through 2016, following a bearish second-half of 2015.
● While clean energy indices (represented here using the NEX, S&P Global Clean Energy, and Ardour Global Alternative
Energy Index) followed the broader market upward for most of 2016 (benchmarked here by the S&P 500, Dow Jones and
MSCI World & Emerging), recovery was much more gradual. The bankruptcy of US solar company SunEdison in April 2016
contributed to this slow recovery.
● In the last quarter of 2016, clean energy indices plummeted in the wake of the US election results, further widening the gap
between the relative performance of these indices against the broader market indices.
Source: Bloomberg New Energy Finance, Bloomberg Terminal
Notes: Indices normalized to 100 on 1 January 2015. The NEX is the BNEF Wilderhill New Energy Global Innovation Index.
75
80
85
90
95
100
105
110
115
120
125
130
135
De
c 1
4
Fe
b 1
5
Apr
15
Ju
n 1
5
Aug
15
Oct 1
5
De
c 1
5
Fe
b 1
6
Apr
16
Ju
n 1
6
Aug
16
Oct 1
6
De
c 1
6
S&P 500
Dow Jones
MSCI World &Emerging
NEX
Ardour GlobalAlternative Energy
S&P Global CleanEnergy

37 © Bloomberg Finance L.P. 2017. Developed in partnership with The Business Council for Sustainable Energy.
Economics: Global levelized costs of electricity (unsubsidized across power generation technologies, H2 2016 ($/MWh)
● A number of renewable energies have comparable and, at times, cheaper LCOEs than “conventional” power sources. Source: Bloomberg New Energy Finance, EIA Notes: LCOE is the per-MWh inflation-adjusted lifecycle cost of producing electricity from a technology assuming a certain hurdle rate (ie, after-tax, equity
internal rate of return, or IRR). The target IRR used for this analysis is 10% across all technologies. All figures are derived from Bloomberg New Energy Finance analysis. Analysis is based on numbers
derived from actual deals (for inputs pertaining to capital costs per MW) and from interviews with industry participants (for inputs such as debt/equity mix, cost of debt, operating costs, and typical project
performance). Capital costs are based on evidence from actual deals, which may or may not have yielded a margin to the sellers of the equipment; the only 'margin' that is assumed for this analysis is 10%
after-tax equity IRR for project sponsor. The diamonds correspond to the costs of actual projects from regions all over the world; the hollow circles correspond to ‘global central scenarios’ (these central
scenarios are made up of a blend of inputs from competitive projects in mature markets). For nuclear, gas, and coal, the light blue squares correspond to US-specific scenarios. ‘CHP’ stands for combined
heat and power; ‘LFR’ stands for linear Fresnel reflector. EIA is the source for capex ranges for nuclear and conventional plants.
0 100 200 300 400 500
CoalCombined cycle gas
CHPNuclear
Large hydroSmall hydro
Biomass - anaerobic digestionWind - onshore
Geothermal - flashMunicipal solid waste
PV - no trackingPV - tracking
Landfill gasWind - offshore
PV - thin filmBiomass - incineration
Geothermal - binaryBiomass - gasification
Solar thermal - LFRSolar thermal - tower
Solar thermal - parabolic troughMarine - tidal
Marine - wave
Estimated global LCOE range Country LCOEs H1 2016 benchmark H2 2016 benchmark
8441037
US China Europe AustraliaFossil technologies:

38 © Bloomberg Finance L.P. 2017. Developed in partnership with The Business Council for Sustainable Energy.
Economics: US levelized cost of electricity (unsubsidized across power generation technologies, H2 2016 ($/MWh)
Source: Bloomberg New Energy Finance, EIA
0 50 100 150 200 250
Combined cycle gas
Wind - onshore
Coal
PV - tracking
PV - no tracking
CHP
Nuclear
Solar thermal - trough
H2 2016 benchmark H1 2016 benchmark
● Since H1 2016, our US benchmark LCOE estimates have come down for renewable energy technologies, but increased for coal by $8/MWh.
Competition from natural gas-fired generators and renewable energy have displaced coal generation, pushing down coal’s average capacity
factor and raising its LCOE.
● The US wind LCOE fell by $9/MWh from H1 2016 to reach $56/MWh in the second half of the year. In some US markets, average capacity
factors for pipeline wind projects improved 3 percentage points. The unsubsidized LCOE for wind came in as low as $37/MWh in Texas, beating
that of combined-cycle natural gas. The Production Tax Credit (PTC) and accelerated depreciation (MACRS), which are not factored into the
analysis shown above, can make wind even more competitive on a $/MWh basis, with a ‘subsidized’ wind LCOE as low as $22/MWh.
● US solar PV (no tracking) saw its benchmark LCOE drop to $79/MWh. PV with tracking technology faces slightly higher capex costs, but its
ability to capture more sunlight throughout the day raises its capacity factor, making it slightly cheaper than a similar array without tracking
technology. In some regions of the country (the Southwest, Texas), solar PV can be built for $50/MWh – even without accounting for the value
of the Investment Tax Credit (ITC) and MACRS.
● The LCOE for combined-cycle natural gas came in at $52/MWh, roughly unchanged from the first half of the year. The US has one of the lowest
natural gas LCOEs in the Americas, due to its access to low-cost gas.

39 © Bloomberg Finance L.P. 2017. Developed in partnership with The Business Council for Sustainable Energy.
Source: Bloomberg New Energy Finance, company announcements
Finance: Corporate procurement of clean energy
Renewable capacity contracted by corporations,
by technology, 2008-16 (MW) Largest corporate offtakers, 2016 (MW)
233
76
117
108
80
417
237
200
150
50
120
100
0 100 200 300 400 500 600 700
Amazon
Microsoft Corp
Google Inc
Dow Chemical
US Department of Defense
3M Co
Switch SuperNAP
Wal-Mart Stores Inc
Johnson & Johnson
University of California
Solar Wind
01234567891011
0.00.51.01.52.02.53.03.54.04.55.05.5
2008 2009 2010 2011 2012 2013 2014 2015 2016
Solar Wind Biomass & Waste Fuel Cells Cumulative
● Corporate PPA volumes fell to 2.5GW in 2016, from the 2015 record of 3.7GW. The extension of the ITC and PTC relieved the
pressure for offtakers and developers to finalize deals, which was one of the major factors driving high activity in 2015.
● Low power prices also continue to undermine the economic incentives for corporates to sign long-term virtual PPAs. But
ERCOT and SPP have emerged as hotspots for corporates signing such contracts, since wind costs are lower in these regions.
● Corporate sustainability remains a key driver of activity in the space.
● Amazon signed PPAs for 0.65GW of clean energy in 2016, more than double the amount of the second largest company,
Microsoft. Amazon’s 228MW PPA with Lincoln Clean Energy for the Amazon Wind Farm Texas was the largest signed in 2016
and brings Amazon’s cumulative US deals to 1.2GW. Companies like Google (1.9GW signed in total), Microsoft (0.5GW) and
Wal-Mart (0.5GW) also continue to lead in this space.
● Green tariff programs have emerged as a common way for corporates to buy clean energy in regulated utility service territories.
Incremental build Cumulative build

40 © Bloomberg Finance L.P. 2017. Developed in partnership with The Business Council for Sustainable Energy.
Source: Bloomberg New Energy Finance, company announcements
Finance: Corporate procurement of clean energy
● 50 corporates that account for almost 2% of US electricity
demand contracted approximately 9TWh of offsite wind and
1TWh offsite solar in 2016. This volume will at least double
by 2018, as offsite projects contracted in 2016 come online.
Nonetheless, these corporates remain far from achieving
100% renewable electricity procurement – an increasingly
common sustainability goal. Currently, these corporates still
buy approximately 53TWh of brown wholesale power.
● Regulations pertaining to corporate procurement vary by
state. Corporations can sign power purchase agreements in
deregulated states and green tariffs in some regulated states.
Global and US electricity supply and demand
fundamentals of 50 'first-movers', 2016 (TWh) How corporates procure clean energy, by state
9
11
10
21
10
53
74
0
10
20
30
40
50
60
70
80Total demand
Non-renewable supply
Offsite solar and wind - anticipated
Total current renewable supply
REC purchases
Onsite renewable generation
Offsite solar
Offsite wind
Corporate PPA available
Green tariff available
Green tariff under review
One-off renewable energy deal
No green tariff, one-off deal or corporate PPA
Notes: ‘Onsite renewable generation’ includes fuel cells and solar PV. 'First-movers' refers to a
diverse, cross-sector sample of 50 companies with operations in the US that have joined the
RE100, signed the Corporate Renewable Energy Buyers’ Principles or set an ambitious
renewable electricity target. ‘Offsite solar and wind – anticipated’ refers to power to be
produced from projects contracted in 2016 but not expected to come online until 2017 or 2018.

41 © Bloomberg Finance L.P. 2017. Developed in partnership with The Business Council for Sustainable Energy.
Source: Bloomberg New Energy Finance, company announcements, DOE. Note: The key corporate energy efficiency players displayed here are drawn from EP100 members and the list of ISO 50001
certified facilities. ISO 50001 certification means that a company has met established efficiency standards at one or more of its facilities.
Finance: Corporate procurement of clean energy and energy efficiency
Key players: corporate
clean energy procurement Key players: corporate energy efficiency
● Corporate clean energy procurement has continued to gain momentum. 83 companies have pledged to source 100% of their
energy consumption from renewables by signing onto the “RE100” initiative. Notable signees include Apple, BMW, HP,
Johnson & Johnson, Kingspan, and P&G. Google also announced in 2016 that it is on track to meet this milestone by 2017.
● Corporations are also increasingly taking action on energy efficiency, with more companies adopting ISO 50001, an energy
management systems standard for reducing costs and carbon emissions. The US Department of Energy Superior Energy
Performance program, which certifies facilities that have implemented the ISO 50001 standard, continued to expand in 2016:
new buildings certified include multiple facilities from Schneider Electric and 3M, and the JW Marriott in Washington, DC. In
addition, the new “EP100”, an initiative where companies pledge to double their energy productivity, launched in early 2016.
Member companies include Johnson Controls and Swiss Re.
Retail
Financial &
Insurance
Tech
Manu-
facturing
Automotives
Other
Hospitality
Manu-
facturing

42 © Bloomberg Finance L.P. 2017. Developed in partnership with The Business Council for Sustainable Energy.
Table of contents
8. Global context
1. Introduction
2. A look across
the US energy
sector
3. Natural gas
4. Large-scale
renewable
electricity and
CCS
2.1 Bird’s-eye view
2.2 Policy, finance, economics
4.1 Solar (PV, solar thermal)
4.2 Wind
4.3 Biomass, biogas, waste-to-
energy
4.4 Geothermal
4.5 Hydropower
4.6 CCS
5. Distributed
power and
storage
5.1 Small-scale solar
5.2 Small- and medium-scale wind
5.3 Small-scale biogas
5.4 Combined heat and power and
waste-heat-to-power
5.5 Fuel cells (stationary)
5.6 Energy storage
6. Demand-
side energy
efficiency
6.1 Energy efficiency
6.2 Smart grid and demand response
7. Sustainable
transportation
7.1 Electric vehicles
7.2 Natural gas vehicles
7.3 Biofuels

43 © Bloomberg Finance L.P. 2017. Developed in partnership with The Business Council for Sustainable Energy.
Policy: US coal power plant retirements completed and announced by year (GW)
● After 2015 marked the largest single year of coal retirements ever (at just under 15GW), 2016 saw another 7.2GW of coal-
fired power plants drop offline. An additional, as-yet undetermined number of plants (likely less than 2GW in total) also
converted from burning coal to burning natural gas. Since 2011, the coal fleet has shrunk 12% from its peak size of 308GW.
● Persistently low gas prices have increased the competition faced by coal plants, leading many to run less frequently and to
receive lower revenues for their output. At the same time, boilers are aging: 29GW worth of plants with no reported retirement
or conversion date are already over 50 years old. These two factors, combined with rising operating costs – partly due to US
Environmental Protection Agency (EPA) regulations covering sulfur, nitrogen, and mercury emissions from power plants –
have forced many coal plants to retire earlier than originally planned.
● The Mercury and Air Toxics Standard (MATS), one such EPA regulation, remains in place in the midst of an ongoing lawsuit.
The Supreme Court denied a request for a ‘stay’ (ie, to put the regulation on hold) in March 2016, a month after it agreed to
place a stay on the Clean Power Plan. Source: Bloomberg New Energy Finance, EIA
Notes: ‘Retirements’ does not include conversions from coal to natural gas or biomass; includes retirements or announced retirements reported to the EIA through end-November 2016.
1 1 1 1 3
9
6
4
15
7 5
3 2
0
2
4
6
8
10
12
14
16
199
0
199
1
199
2
199
3
199
4
199
5
199
6
199
7
199
8
199
9
200
0
200
1
200
2
200
3
200
4
200
5
200
6
200
7
200
8
200
9
201
0
201
1
201
2
201
3
201
4
201
5
201
6
201
7
201
8
201
9
202
0
EIA retired EIA announced

44 © Bloomberg Finance L.P. 2017. Developed in partnership with The Business Council for Sustainable Energy.
Deployment: US natural gas production and gas-directed rig count
● Rig count continued to shrink in 2016, falling 48% between December 2015 and the end of the following year as producers
struggled to cope with the low-price environment.
● However, total US natural gas production held steady. This is due to a few reasons:
˗ Producers are selectively drilling in productive ‘sweet spots’ and turning to an inventory of drilled but uncompleted wells
(DUCs) to cost-effectively extract gas.
˗ Technological improvements in efficiencies (like pad drilling and longer laterals) are shrinking well completion time,
making it easier to speed up production and expand capacity for each well.
Production (Bcfd) Number of rigs
Source: Bloomberg New Energy Finance, EIA, Baker Hughes. Data up through the latest comprehensive numbers available (October 2016).
0
200
400
600
800
1,000
1,200
1,400
1,600
1,800
0
10
20
30
40
50
60
70
80
90
2006 2007 2008 2009 2010 2011 2012 2013 2014 2015 2016
Shale Other lower 48 Rigs

45 © Bloomberg Finance L.P. 2017. Developed in partnership with The Business Council for Sustainable Energy.
Deployment: US natural gas productivity (production per rig) by shale formation (MMcfd)
● Producers have continued to improve productivity, especially in the Marcellus and Utica, which both outpaced the Haynesville
for the past two years. The most economical dry and wet gas regions are located here, and the area experienced the greatest
advances in rig productivity.
● Meanwhile, productivity in the Haynesville and Eagle Ford plateaued this past year; wellhead economics there are not as
strong as in other regions. The Niobrara continues to see gains.
Source: Bloomberg New Energy Finance, EIA
0
2
4
6
8
10
12
14
200
8
200
9
201
0
201
1
201
2
2013
201
4
201
5
201
6
201
7
Marcellus Haynesville Eagle Ford
Niobrara Permian Bakken
Utica

46 © Bloomberg Finance L.P. 2017. Developed in partnership with The Business Council for Sustainable Energy.
Deployment: Gas production in the continental US (Bcfd)
● Northeast US natural gas production has slowed but continues to hold firm, even as producers shut wells to ride out
unfavorable economics caused by a lack of takeaway capacity.
● Production in other plays declined in 2016 because the current low oil and gas price environment renders many plays
uneconomical; further, the Northeast has become a net supplier to surrounding regions, in light of the new pipeline projects
and reversals emerging out of the region.
All other US regions Northeastern US
Source: Bloomberg New Energy Finance
Notes: Eastern US production is mostly comprised of output from the Marcellus and Utica shales.
0
5
10
15
20
25
30
35
40
45
50
55
60
65
Jan 14 Apr 14 Jul 14 Oct 14 Jan 15 Apr 15 Jul 15 Oct 15 Jan 16 Apr 16 Jul 16 Oct 16 Jan 17
All Other Northeastern US

47 © Bloomberg Finance L.P. 2017. Developed in partnership with The Business Council for Sustainable Energy.
Deployment: US natural gas pipeline installations and materials (million miles)
US existing natural gas distribution pipeline US natural gas distribution mainline material
● Service and distribution pipelines that bring gas from transmission lines to end-users continue to grow steadily.
● Plastic is the material of choice for replacement and expansion efforts as US pipelines are upgraded with more modern
materials. Companies are removing older networks, which are made from cast iron and unprotected steel, and replacing them
with newer plastic / protected steel pipes that are less susceptible to leaks. At the same time, more miles of pipeline are being
added to connect underserved and previously unserved customers.
Source: Bloomberg New Energy Finance, US Department of Transportation, American Gas Association
Notes: ‘Mains’ refer to pipelines to which customers’ service lines are attached; ‘Services’ refer to pipes which carry gas from the distribution pipelines to the customer’s meter. 2015 mainline material data is
an estimate.
0.0
0.5
1.0
1.5
2.0
2.5
1990
1995
2000
2005
2010
2015
Services Mains
0.0
0.5
1.0
1.5
2.0
2.5
1990
1995
2000
2005
2010
2015e
Other Plastic Protected Steel Cast Iron & Unprotected Steel

48 © Bloomberg Finance L.P. 2017. Developed in partnership with The Business Council for Sustainable Energy.
Deployment: US transmission pipeline capacity additions (Bcfd)
● Pipeline companies completed 8Bcfd of pipeline capacity in 2015, below the 11Bcfd planned. In 2016, they only added a
further 1Bcfd of capacity.
● A number of delays pushed the online date of many substantial projects from 2015-2016 into 2017-2018.
● US-Mexico border capacity is currently just over 6Bcfd. Moving forward, capacity will be growing at unprecedented rates, with
proposed capacity in 2020 exceeding 15Bcfd.
Source: Bloomberg New Energy Finance, EIA
Note: EIA data used here includes both first-mile takeaway capacity and other pipeline additions that do not impact takeaway capacity.
36 7 4
9 9 11 96 8 10
15
45
2217 17
6 5 7 8
10
5
10
15
20
25
30
35
40
45
50
19
96
19
97
19
98
19
99
20
00
20
01
20
02
20
03
20
04
20
05
20
06
20
07
20
08
20
09
20
10
20
11
20
12
20
13
20
14
20
15
20
16
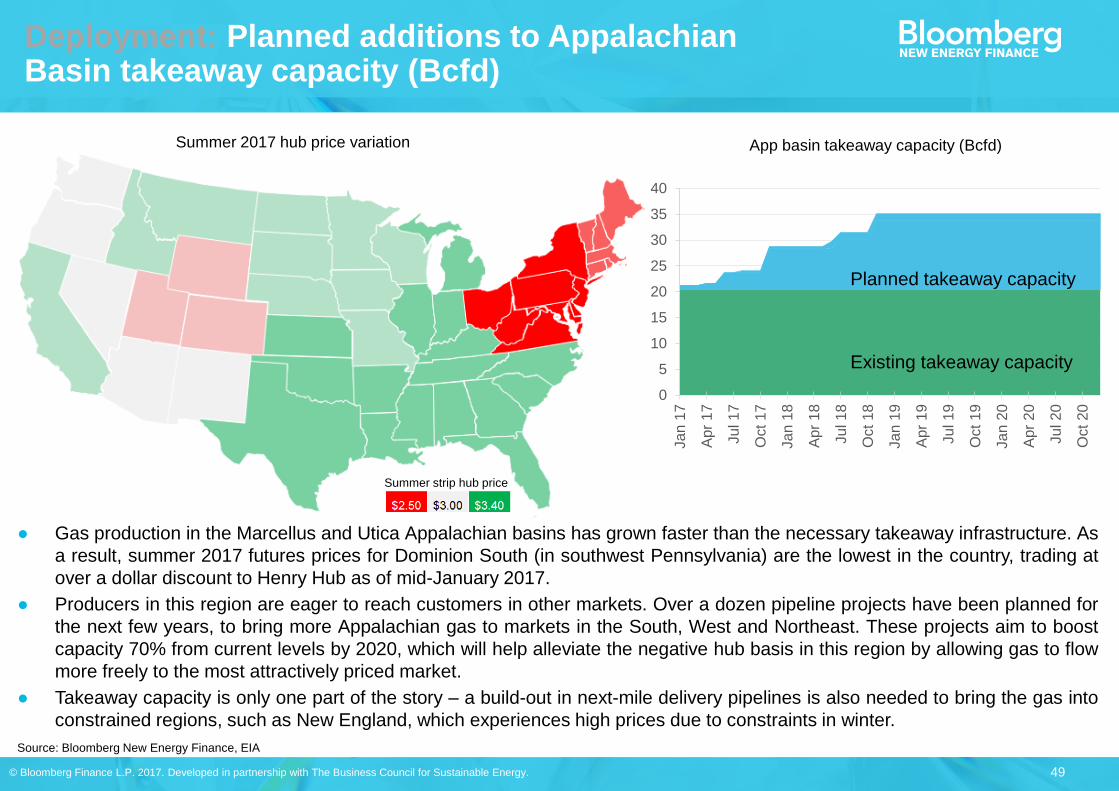
49 © Bloomberg Finance L.P. 2017. Developed in partnership with The Business Council for Sustainable Energy.
Deployment: Planned additions to Appalachian Basin takeaway capacity (Bcfd)
● Gas production in the Marcellus and Utica Appalachian basins has grown faster than the necessary takeaway infrastructure. As
a result, summer 2017 futures prices for Dominion South (in southwest Pennsylvania) are the lowest in the country, trading at
over a dollar discount to Henry Hub as of mid-January 2017.
● Producers in this region are eager to reach customers in other markets. Over a dozen pipeline projects have been planned for
the next few years, to bring more Appalachian gas to markets in the South, West and Northeast. These projects aim to boost
capacity 70% from current levels by 2020, which will help alleviate the negative hub basis in this region by allowing gas to flow
more freely to the most attractively priced market.
● Takeaway capacity is only one part of the story – a build-out in next-mile delivery pipelines is also needed to bring the gas into
constrained regions, such as New England, which experiences high prices due to constraints in winter.
Source: Bloomberg New Energy Finance, EIA
App basin takeaway capacity (Bcfd) Summer 2017 hub price variation
Summer strip hub price
0
5
10
15
20
25
30
35
40
Ja
n 1
7
Apr
17
Ju
l 1
7
Oct
17
Ja
n 1
8
Apr
18
Ju
l 1
8
Oct
18
Ja
n 1
9
Apr
19
Ju
l 1
9
Oct
19
Ja
n 2
0
Apr
20
Ju
l 2
0
Oct 2
0
Existing takeaway capacity
Planned takeaway capacity

50 © Bloomberg Finance L.P. 2017. Developed in partnership with The Business Council for Sustainable Energy.
Deployment: US natural gas demand by end use (Bcfd)
● Total US annual gas demand continues to grow slowly: 2016 demand represented a 21% increase from 2008 levels, and a
slight year-on-year rise from 2015.
● The power sector drove domestic demand growth, offsetting declines in residential and commercial demand. Power sector
gas consumption jumped 7% compared to 2015.
● Foreign demand also helped to buoy US gas demand. Pipeline exports to Mexico have nearly quadrupled since 2008, and
the US started exporting liquefied natural gas (LNG) this past year.
Source: Bloomberg New Energy Finance, EIA Note: Values for 2016 are projected based upon the latest available data (October 2016).
18.2 16.9 18.7 19.1 19.8 20.3 20.9 20.6 20.9
8.68.5
8.5 8.6 7.9 9.0 9.5 8.8 7.8
13.413.1
13.1 12.9 11.413.4 13.9
12.610.6
18.218.8
20.2 20.7 24.922.4
22.2 26.428.4
0.4
1.0 0.9 0.9 1.41.7 1.8
2.02.9 3.7
0.0
10.0
20.0
30.0
40.0
50.0
60.0
70.0
80.0
2008 2009 2010 2011 2012 2013 2014 2015 2016
Industrial Commercial Residential Power LNG exports Mexico exports
58.1 61.362.7
65.6 66.968.6 71.3
59.5
71.7

51 © Bloomberg Finance L.P. 2017. Developed in partnership with The Business Council for Sustainable Energy.
Deployment: US natural gas residential customers vs. residential consumption
● Due to energy efficiency efforts, residential consumption has fallen even as the number of customers has seen moderate
growth. As a result, per capita consumption has been steadily declining since the mid-1990s.
● Residential consumption dropped during the abnormally mild winter of 2011-12, then jumped during the polar vortices in 2013
and 2014. 2015’s mild winter temperatures saw residential consumption return to its longer term, downward trend.
● Residential consumption has continued to decline and, in 2016, fell 6% from 2015 levels.
Bcfd Customers (millions)
Source: Bloomberg New Energy Finance, EIA
Notes: Values for 2016 are projected, accounting for seasonality, based on latest monthly values from EIA (data available through October 2016).
40
45
50
55
60
65
70
75
80
10.0
10.5
11.0
11.5
12.0
12.5
13.0
13.5
14.0
14.5
15.0
19
95
19
96
19
97
19
98
19
99
20
00
20
01
20
02
20
03
20
04
20
05
20
06
20
07
20
08
20
09
20
10
20
11
20
12
20
13
20
14
20
15
20
16
US Nat Gas Residential Consumption, Bcfd (left) US Nat Gas Residential Consumption Forecast, Bcfd (left)
US Residential Customers, Millions (right)
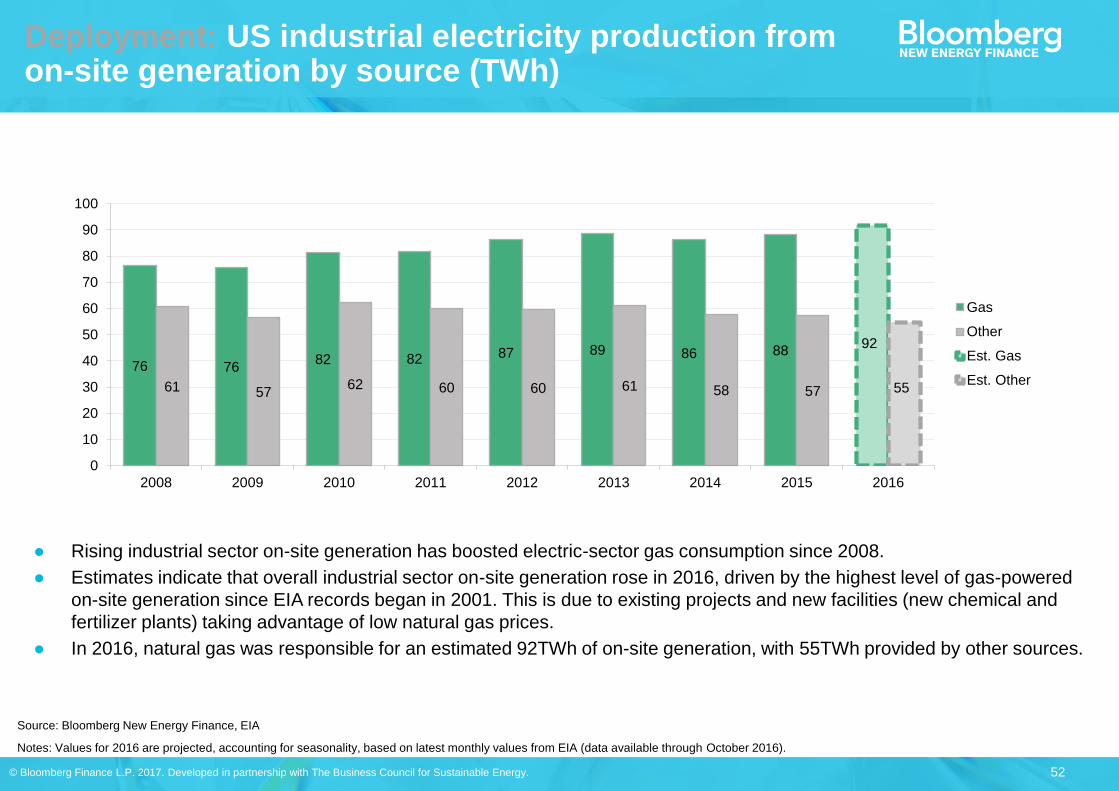
52 © Bloomberg Finance L.P. 2017. Developed in partnership with The Business Council for Sustainable Energy.
Deployment: US industrial electricity production from on-site generation by source (TWh)
● Rising industrial sector on-site generation has boosted electric-sector gas consumption since 2008.
● Estimates indicate that overall industrial sector on-site generation rose in 2016, driven by the highest level of gas-powered
on-site generation since EIA records began in 2001. This is due to existing projects and new facilities (new chemical and
fertilizer plants) taking advantage of low natural gas prices.
● In 2016, natural gas was responsible for an estimated 92TWh of on-site generation, with 55TWh provided by other sources.
Source: Bloomberg New Energy Finance, EIA
Notes: Values for 2016 are projected, accounting for seasonality, based on latest monthly values from EIA (data available through October 2016).
76 7682 82 87 89 86 88
61 5762 60 60 61 58 57
92
55
0
10
20
30
40
50
60
70
80
90
100
2008 2009 2010 2011 2012 2013 2014 2015 2016
Gas
Other
Est. Gas
Est. Other

53 © Bloomberg Finance L.P. 2017. Developed in partnership with The Business Council for Sustainable Energy.
● US natural gas net exports have been trending up since 2011, due in part to growing exports to Mexico as the
deregulation of the energy market there continues to drive demand for US gas.
● In addition, 2016 marked the opening of two trains at the Sabine Pass LNG export terminal, which, combined with a
decrease in imports, made the US a net LNG exporter.
● New, planned pipelines and LNG terminals will look to increase the US’ role as an exporter going forward.
Deployment: US natural gas net exports (Bcfd)
-12
-10
-8
-6
-4
-2
0
2
4
6
8
2011 2012 2013 2014 2015 2016LNG imports LNG exports Imports from Canada Exports to Mexico Exports to Canada Net exports
Source: Bloomberg New Energy Finance, EIA

54 © Bloomberg Finance L.P. 2017. Developed in partnership with The Business Council for Sustainable Energy.
Financing: US midstream gas construction expenditures ($bn)
Source: Bloomberg New Energy Finance, American Gas Association
Notes: Values reflect expenditures reported to the AGA by different types of companies across the supply chain, including transmission companies, investor-owned local distribution companies, and
municipal gas utilities. ‘General’ includes miscellaneous expenditures such as construction of administrative buildings. Totals may not sum due to rounding.
● Midstream expenditures increased 26% year-on-year in 2015, with the largest percentage growth coming from underground
storage and transmission expenditure.
● Distribution spending rose to its highest level yet, at $11.6bn, a 20% increase over 2014 levels, as more customers connected
to the grid and utilities invested in upgrading networks.
$6.4 $5.4$3.5
$7.4$5.3
$6.6$4.7
$6.6
$5.4$4.9
$5.7
$7.0
$7.4
$8.0$9.7
$11.6$0.9
$0.6$0.5
$0.7
$0.6
$0.6 $0.6
$0.8
$1.2
$1.1$1.1
$1.7
$1.6
$1.9 $1.6
$1.9
$14.1
$12.1$11.0
$17.1
$15.1
$17.4$16.7
$21.1
0
5
10
15
20
25
2008 2009 2010 2011 2012 2013 2014 2015General Production and storageUnderground storage DistributionTransmission

55 © Bloomberg Finance L.P. 2017. Developed in partnership with The Business Council for Sustainable Energy.
Economics: Gas breakevens by play and basin ($/MMBtu)
● Producers have seen strong efficiency gains and reductions in drilling and completion (D&C) costs over the past two years,
resulting in “breakeven” prices as low as $2-4/MMBtu. Plays with negative breakevens are those that also extract revenue
from oil production.
● Breakeven prices do not take into account the basis to Henry Hub. In areas such as the Marcellus and Utica, negative basis
can eat into the attractiveness of the plays.
Source: Bloomberg New Energy Finance
-$5
-$4
-$3
-$2
-$1
$0
$1
$2
$3
$4
$5
$6
$7
$8
$9

56 © Bloomberg Finance L.P. 2017. Developed in partnership with The Business Council for Sustainable Energy.
0
20
40
60
80
100
120
2005 2006 2007 2008 2009 2010 2011 2012 2013 2014 2015 2016 2017
Economics: Cost of generating electricity in the US from natural gas vs. coal ($/MWh)
● Power has served as the swing demand source for natural gas: when the price of gas falls below that of coal, gas burn rises
until the differential (in $/MWh) between the two fuels closes.
● As gas becomes consistently cheaper than coal, it creates a strong impetus for coal-to-gas switching. The US observed this
switching in 2012 and again throughout 2015 and 2016, when gas-fired power plants, on average, were cheaper to run than
coal-fired units. At the end of 2016, a rally in gas prices due to higher demand made coal-fired power plants once again
competitive.
● Power burn in PJM has the greatest sensitivity to gas prices and also faces lower gas prices than Henry Hub (which is shown
above). The coal-to-gas switch potential is, therefore, the strongest in this region. Source: Bloomberg New Energy Finance
Notes: Assumes heat rates of 7,410Btu/kWh for CCGT and 10,360Btu/kWh for coal (both are fleet-wide generation-weighted medians); variable O&M of $3.15/MWh for CCGT and $4.25/MWh for coal.
Gas price used is Henry Hub. CCGT stands for a combined-cycle gas turbine. CAPP represents Appalachian coal prices.
Gas (CCGT)
Coal
(CAPP)

57 © Bloomberg Finance L.P. 2017. Developed in partnership with The Business Council for Sustainable Energy.
Economics: US LNG landed cost breakdown ($/MMBtu)
● Sabine Pass exported its first cargo of LNG on 21 February 2016 and since then, it has shipped approximately 50 cargoes of
LNG to 16 destinations. Over half of these cargoes have gone to Latin America. India has also been a consumer of US LNG.
● Sabine plans to begin operations at two more trains in 2017, bringing total US export capacity to 2.4Bcfd by the end of 2017.
97% of this capacity is committed in offtake agreements, so the cargoes will likely ship if the economics continue to make
them attractive to world markets.
● US LNG from Sabine Pass is currently competitive when compared to destination market prices. The short-run landed price
of US LNG includes purchases of gas and shipping costs. The fixed liquefaction fee of $2.25/MMBtu is considered a sunk
cost and therefore irrelevant to marginal cost decisions.
Source: Bloomberg New Energy Finance
Notes: Data is as of January 2017. NBP is used as the destination market price for the UK and Chile. JKM is used as the destination market price for Japan.
$0.00
$1.00
$2.00
$3.00
$4.00
$5.00
$6.00
$7.00
$8.00
Milford, UK via Direct Yokohama, Japan viaPanama Canal
Quintero, Chile viaPanama Canal
Shipping costs
Fixed/tolling fee
Port/insurance/etc
Boil-off
Fuel
LNG tanker charter
Canal toll
15% mark-up
HH contract price
Destination market price

58 © Bloomberg Finance L.P. 2017. Developed in partnership with The Business Council for Sustainable Energy.
Table of contents
8. Global context
1. Introduction
2. A look across
the US energy
sector
3. Natural gas
4. Large-scale
renewable
electricity and
CCS
2.1 Bird’s-eye view
2.2 Policy, finance, economics
4.1 Solar (PV, solar thermal)
4.2 Wind
4.3 Biomass, biogas, waste-to-
energy
4.4 Geothermal
4.5 Hydropower
4.6 CCS
5. Distributed
power and
storage
5.1 Small-scale solar
5.2 Small- and medium-scale wind
5.3 Small-scale biogas
5.4 Combined heat and power and
waste-heat-to-power
5.5 Fuel cells (stationary)
5.6 Energy storage
6. Demand-
side energy
efficiency
6.1 Energy efficiency
6.2 Smart grid and demand response
7. Sustainable
transportation
7.1 Electric vehicles
7.2 Natural gas vehicles
7.3 Biofuels

59 © Bloomberg Finance L.P. 2017. Developed in partnership with The Business Council for Sustainable Energy.
7GW 8GW
18GW
29GW 29GW
42GW45GW
56GW
73GW
2008 2009 2010 2011 2012 2013 2014 2015 2016
Europe Japan USA China India Rest of World
Deployment: Global solar PV build (GW)
● Driven by record high volumes and record low prices, the global photovoltaic (PV) market saw yet another year of expansion
in 2016, rising 30% year-on-year to 73GW. China and the US were particular bright spots, with China adding 30GW alone.
● The US government maintained tariffs on Chinese and Taiwanese solar products (which still account for much of the market).
Nevertheless, low-cost Chinese producers have largely held onto market share in the US. On a global basis, module
oversupply and manufacturing improvements continue to push equipment costs down, spurring uptake.
Source: Bloomberg New Energy Finance
Notes: Values are in GW DC. 2016 values represent an average of optimistic and conservative analyst estimates.

60 © Bloomberg Finance L.P. 2017. Developed in partnership with The Business Council for Sustainable Energy.
Deployment: US large-scale solar build (GW)
● Solar PV build has grown every year since 2009, while solar thermal build has been lumpy and dependent upon a few
projects.
● The Investment Tax Credit (ITC) was extended for five years at the end of 2015, and ‘commence construction’ language
added – meaning that projects have to begin construction, rather than achieve commercial operations, by the deadlines.
● At 8.9GW, 2016 utility-scale PV installations more than doubled the prior record of 4.4GW set in 2015.
● The US commissioned one concentrating solar power (solar thermal) plant in 2016 (the 125MW Crescent Dunes facility in
Nevada). Developers and financiers continue to focus their attention on PV.
Source: Bloomberg New Energy Finance Notes: Values are in GW DC.
0.31.0
1.93.2
4.1 4.4
8.9
0.10.3
1.0
1.9
4.04.5 4.4
9.1
2009 2010 2011 2012 2013 2014 2015 2016e
Utility-scale PV Solar thermal (electrical)

61 © Bloomberg Finance L.P. 2017. Developed in partnership with The Business Council for Sustainable Energy.
Deployment: US solar qualifying facility build (MW)
PURPA solar build in regulated states, relative
to total utility-scale PV build, 2009-15 Planned PURPA solar projects, 2016-2019
● Qualifying facilities (QF) under the Public Utility Regulatory Policy Act (PURPA) made up 52% of utility-scale PV build in
regulated utility territories between 2009 and 2015. As technology costs have plummeted, developers are increasingly
seeking guaranteed interconnection with regulated utilities through PURPA. A rise in green tariffs and a push from developers
and utilities to sign PPAs before the ITC step-down overshadowed PURPA in 2015, but build still reached record highs.
● The PURPA solar pipeline is made up of over 4.9GW of projects that have filed for interconnection between 2016 and 2019.
Most of these projects are in the Northwestern and Southeastern US; in the Southeast, regulated utilities are forecasting flat
or declining electricity demand in the coming years. Source: Bloomberg New Energy Finance Note: Values are in MW DC. Planned projects data is representative of current volumes; 2018-2019 pipelines will eventually see increases.
204 304408 506
838
71
215
320293
219
963
39
108
419
624 700 725
1,801
7%
34%
49% 49%
58%
70%
47%
2009 2010 2011 2012 2013 2014 2015
Other utility-scale PV build PURPA PV build
Percent of new build
2,381
1,885
415
228
2016 2017 2018 2019

62 © Bloomberg Finance L.P. 2017. Developed in partnership with The Business Council for Sustainable Energy.
Policy: Recent regulatory amendments in the five largest PURPA states
Source: Bloomberg New Energy Finance
State Historical
PURPA
capacity
Planned
PURPA
capacity
Additional Information
Oregon 234 710 In March 2016, the Oregon Public Utility Commission rejected proposals to
lower the state’s standard contract to three years and decrease the maximum
size to 100kW.
North Carolina 1,301 703 In January 2015, the North Carolina Utilities Commission rejected a
utility proposal to reduce the maximum project capacity to 100kW and the
standard PPA term to 10 years.
Utah 175 608 In January 2016, regulators approved a request to reduce PURPA contracts
from 20 years to two.
Montana 188 513 In June 2016, the Montana Public Utilities Commission suspended all PURPA
rates for qualified facilities, meaning IPPs will be forced to negotiate each
PPA with the relevant utility. However, in December 2016, FERC overturned
the suspension.
South Carolina 20 328 There is a ceiling of 2MW for standard contracts under PURPA. Any contract
for projects larger than 2MW is negotiable, including contract length.
● The surge of solar projects flooding interconnection queues has propelled backlash from regulated utilities.
● In order to avoid being locked into outdated offtake prices in the long term, utilities are petitioning their state public utility
commissions to reduce the project capacity thresholds for securing standard contracts under PURPA, as well as the
lengths of these contracts.
● Changes to PURPA at the state level as a result of this backlash have forced developers to look to new states.

63 © Bloomberg Finance L.P. 2017. Developed in partnership with The Business Council for Sustainable Energy.
Financing: US large-scale solar investment ($bn)
Venture capital / private equity investment in US
solar by type of investment
Asset finance for US utility-scale solar projects
by technology
● 2016 was another impressive year for private equity capital in US solar, with $1.3bn invested. Venture capital investment
experienced a down year, with a combined $0.44bn invested in early- and late-stage companies.
● Asset finance deals for utility-scale solar faltered, slightly dropping to $14.7bn in 2016. The extension of the investment tax
credit (ITC) in December 2015 relieved some of the pressure on developers to arrange financing for projects in short-order,
although increasing cost-competitiveness for utility-scale PV still led to it being the third-largest year ever for investment in
the space.
Source: Bloomberg New Energy Finance Notes: Values are in nominal dollars and include estimates for undisclosed deals.
3.7
16.6
11.88.0
15.7 14.7
8.1
1.6
1.43.7
24.6
11.8
6.0
9.6
15.714.7
0
5
10
15
20
25
30
2009 2010 2011 2012 2013 2014 2015 2016
CSP
Utility-scalePV
0.20.5 0.4 0.5
0.2
0.9 0.9
1.3
0.6
1.1 1.00.7
0.2
0.30.6
0.2
0.40.2
0.2
0.3
0.38
1.0
1.91.7
1.3
0.4
1.4
1.81.7
0.0
0.2
0.4
0.6
0.8
1.0
1.2
1.4
1.6
1.8
2.0
2009 2010 2011 2012 2013 2014 2015 2016
VC early-stage
VC late-stage
PEexpansioncapital

64 © Bloomberg Finance L.P. 2017. Developed in partnership with The Business Council for Sustainable Energy.
Economics: Price of solar modules and experience curve (2015$/W as function of global cumulative capacity)
● The price of PV modules has roughly followed an experience curve with a learning rate of 26.5% - in other words, prices
have fallen 26.5% for every doubling of cumulative installed capacity.
● From 2008 to 2009, module prices tumbled dramatically due to global oversupply, a dynamic that re-emerged in 2016. We
estimate a global average module price of around $0.41/W in Q4 2016 and Q1 2017.
Source: Bloomberg New Energy Finance, Paul Maycock
Notes: The precise learning rate depends on the end-point chosen, but we believe $0.41/W to be slightly below the experience curve at the end of 2016. Figures in real 2015 dollars.
Cost (2015 $/W)
0.1
1
10
100
1 10 100 1,000 10,000 100,000 1,000,000
Historical prices (Maycock) Chinese c-Si module price Experience curve
1976
1985
2003
1976
1985
2008
Cumulative capacity (MW)
2015
2016(estimate)

65 © Bloomberg Finance L.P. 2017. Developed in partnership with The Business Council for Sustainable Energy.
1.851.35
0.93 0.71 0.68 0.58 0.48
3.24
2.65
1.801.58 1.49
1.311.14
0
1
2
3
4
2010 2011 2012 2013 2014 2015 2016
Other
EPC
BOP
Inverter
Module
Economics: Best-in-class global capex for utility-scale PV (2015$/W)
● The cost of building a utility-scale PV facility declined dramatically from 2010 to 2012 (based on the global benchmark for
mature markets) before leveling off to more modest annual cost reductions from 2012 to 2015. However, cost declines picked
up again in 2016, falling 13% year-on-year.
● Germany, a mature market, sets the best-in-class capex. The US is closing the gap on what has historically been higher costs
for best-in-class utility-scale PV.
● Lower capex translates into lower levelized costs: utility-scale solar plants in Nevada and California have recently secured
PPAs to sell power at long-term rates below $40/MWh (with the help of incentives); for reference, PPAs for similar projects in
California went for over three times this amount just five years ago.
Source: Bloomberg New Energy Finance
Notes: ‘EPC’ refers to ‘engineering, procurement and construction’; ‘BOP’ refers to ‘balance of plant.’ Figures in real 2015 dollars.

66 © Bloomberg Finance L.P. 2017. Developed in partnership with The Business Council for Sustainable Energy.
Economics: Solar REC prices in selected US state markets by vintage year ($/MWh)
● Overall, SREC prices declined aross major markets in 2016, due to oversupply.
● Massachusetts: SREC-I and SREC-II credits remain above $300/MWh and $200/MWh, respectively, but eligibility for both
programs has essentially closed.
● New Jersey: Vintage 2017-18 credits traded at the alternative compliance payment (ACP) level for most of 2016 before
wavering in the second half of the year. NJ SRECs capped 2016 with a rally.
● Maryland: Prices saw modest declines on the threat of new utility-scale build in late-2015, before heading into freefall in the
aftermath of the ITC extension. MD SRECs have continued to trade below $30/MWh since August 2016.
● Pennsylvania: Oversupply has led PA SRECs to gravitate towards PJM’s Tier 1 price.
Source: Bloomberg New Energy Finance, Bloomberg Terminal, ICAP Notes: Data in the charts above (“SREC prices”) are the sole property of ICAP United, Inc. Unauthorized disclosure, copying or
distribution of the Information is strictly prohibited and the recipient of the information shall not redistribute the Information in a form to a third party. The Information is not, and should not be construed as,
an offer, bid or solicitation in relation to any financial instrument. ICAP cannot guarantee, and expressly disclaims any liability for, and makes no representations or warranties, whether express or implied,
as to the Information's currency, accuracy, timeliness, completeness or fitness for any particular purpose.
Maryland and Pennsylvania SREC and PJM Tier 1 REC prices ($/MWh) Massachusetts SREC-I/II and New Jersey SREC prices ($/MWh)
Source: Bloomberg New Energy Finance, ICAP, SRECTrade, The Intercontinental Exchange (ICE) Notes: Some data in chart above is from ICAP; for that data, the disclaimer below applies;
‘v’ refers to credit vintage; ‘MA-I’ and ‘MA-II’ refer to Massachusetts’ SREC-I and SREC-II programs; ‘Tier 1’ represents PJM Tier 1 prices.
100
200
300
400
500
Jan 1
5
Mar
15
May 1
5
Jul 15
Sep 1
5
Nov 1
5
Jan 1
6
Mar
16
May 1
6
Jul 16
Sep 1
6
Nov 1
6
NJ v17
NJ v18
NJ v19
MA-I v16
MA-I v17
MA-II v16
MA-II v17
MA-II v18
0
50
100
150
200
Jan 1
5
Mar
15
May 1
5
Jul 15
Sep 1
5
Nov 1
5
Jan 1
6
Mar
16
May 1
6
Jul 16
Sep 1
6
Nov 1
6
MD 16
MD 17
PA 15
PA 17
Tier 1 v17
Tier 1 v18

67 © Bloomberg Finance L.P. 2017. Developed in partnership with The Business Council for Sustainable Energy.
Table of contents
8. Global context
1. Introduction
2. A look across
the US energy
sector
3. Natural gas
4. Large-scale
renewable
electricity and
CCS
2.1 Bird’s-eye view
2.2 Policy, finance, economics
4.1 Solar (PV, solar thermal)
4.2 Wind
4.3 Biomass, biogas, waste-to-
energy
4.4 Geothermal
4.5 Hydropower
4.6 CCS
5. Distributed
power and
storage
5.1 Small-scale solar
5.2 Small- and medium-scale wind
5.3 Small-scale biogas
5.4 Combined heat and power and
waste-heat-to-power
5.5 Fuel cells (stationary)
5.6 Energy storage
6. Demand-
side energy
efficiency
6.1 Energy efficiency
6.2 Smart grid and demand response
7. Sustainable
transportation
7.1 Electric vehicles
7.2 Natural gas vehicles
7.3 Biofuels

68 © Bloomberg Finance L.P. 2017. Developed in partnership with The Business Council for Sustainable Energy.
Deployment: US large-scale wind build (GW)
● Build has historically seesawed based on the extension and expiration of the Production Tax Credit (PTC) – the key federal
incentive for wind in the US. In 2012, both the PTC and the 1603 Treasury Program (which allowed developers to receive 30%
of a project’s cost back in cash, in lieu of the tax credit) were set to expire at year-end, which prompted a rush to build. While
the cash grant was never renewed, the PTC was extended for one year in January 2013, and a project’s requirement for credit
qualification was changed from completion to ‘start construction.’ By January, however, the pipeline had dried up.
● After the tax credit expired again in December 2013, it was ‘retroactively’ renewed in December 2014 and set to expire again
two weeks later, at the end of 2014.
● Finally, the PTC was again extended in December 2015 for projects commencing construction through 2019, with a phase-out
for projects beginning after 2016. There is a four-year build window to qualify, so build is expected to peak around 2020.
● A majority of the build continues to occur in Texas, thanks to a $7bn transmission build-out in 2013 to connect windy regions in
the Panhandle and West Texas to demand centers farther east. Due to high capacity factors (>50%) and low cost to build,
wind in Texas is among the cheapest in the country, with subsidized levelized cost of electricity reaching as low as $22/MWh.
● Corporates have joined utilities as offtakers for wind, signing purchasing power agreements with 12 wind projects this year in
Texas for just over 850MW. Wind capacity has also received a boost from long-term power hedges with financial institutions.
Incremental Cumulative
Source: Bloomberg New Energy Finance
Notes: Includes all utility-scale wind development, excluding partially commissioned projects, including distributed turbines that are above 1MW (Bloomberg New Energy Finance threshold for utility-scale).
0.41.8
2.7
4.8
9.210.2
4.7
6.6
14.0
0.6
5.1
8.5 8.5
0
15
30
45
60
75
0
3
6
9
12
15
2004 2005 2006 2007 2008 2009 2010 2011 2012 2013 2014 2015 2016
Cumulative capacity

69 © Bloomberg Finance L.P. 2017. Developed in partnership with The Business Council for Sustainable Energy.
Deployment: US wind turbine production and contracting
US wind turbine production capacity by manufacturer
(GW)
US wind turbine supply contracts for commissioned
projects by commissioning year, by manufacturer (GW)
● Several manufacturers have closed nacelle assembly facilities in the US since 2012, including Clipper, Nordex, and
Mitsubishi. Several others laid off workers in 2012 and rehired them in 2013 after the PTC was extended. More recently,
Gamesa has shuttered its US production, and Alstom and GE have combined following the close of GE’s acquisition of
Alstom in October 2015. GE, Vestas and Siemens are the dominant manufacturers in the US market. Other manufacturers
have had a difficult time due to the lower overall demand for turbines.
● The recent PTC extension may provide some business-planning certainty for wind developers and manufacturers, allowing
them to avoid expensive cycles of layoffs and rehiring. We do not expect additional factories in the US to open for onshore
wind, due to the expected end of the PTC following its phase-out.
Source: Bloomberg New Energy Finance
Notes: Production capacity measured by nacelle assembly on US soil.
3.13.9 4.2 4.7 4.7 4.7 4.7 4.4 4.4
2.5 2.7 2.4 2.4 2.4 2.4
1.5 1.50.7 1.5 1.5 1.5
0.7
0.70.7 0.7 0.7
0.8
0.8 1.0
1.0 1.0
0.8
0.81.2
2.3 1.4
1.40.8
0.8 0.8
4.9
6.27.0
12.611.9
10.4 10.59.7 9.7
2
4
6
8
10
12
14
2008 2009 2010 2011 2012 2013 2014 2015 2016
Other
Gamesa
Acciona
Siemens
Vestas
GE
4.3 3.92.3 2.2
5.2
0.5
3.4 3.5 3.4
1.4 1.4
1.7
2.2
0.5
2.63.8
0.8 1.1
0.8
0.9
3.0
1.0
1.40.8
0.6 0.6
0.5
0.3
1.2
0.2 0.21.82.8
0.9
1.2
2.0
9.210.2
4.7
6.6
14.0
0.6
5.1
8.5 8.5
2
4
6
8
10
12
14
2008 2009 2010 2011 2012 2013 2014 2015 2016
Other
Gamesa
Nordex +AccionaSiemens
Vestas
GE

70 © Bloomberg Finance L.P. 2017. Developed in partnership with The Business Council for Sustainable Energy.
Source: Bloomberg New Energy Finance
Notes: In chart at left, ownership is based on BNEF League Tables. In chart at right, ‘Other’ includes projects built by non-utilities such as independent power producers and also includes projects built by
the non-regulated development arms of utilities such as Duke or NextEra; in those cases, the projects are not supplying power to the regulated utilities’ ratepayers but rather to a third party.
Deployment: US wind ownership and development
Top 10 US wind owners, as of end-2016 (GW) US wind capacity commissioned by type of
developer (GW)
● NextEra Energy remains the dominant wind developer in the US market. Next in line are Berkshire Hathaway Energy (the
holding company that includes both PacifiCorp and MidAmerican) and AVANGRID (formerly Iberdrola).
● Regulated utilities are responsible for building only a small share of wind assets in the US; historically, most have preferred to
sign power purchase agreements (PPAs) with independent generators rather than build and own projects.
2.2
2.3
2.5
2.6
2.7
2.7
4.1
5.6
6.0
12.9
TerraForm Power
Duke Energy
E.ON
EDF - Electricite de France
Invenergy
NRG Energy
EDP - Energias de Portugal
AVANGRID
Berkshire Hathaway
NextEra
7.17.9
4.14.8
11.5
0.6
4.0
7.1 6.7
2.12.3
0.6
1.8
2.5
1.2
1.4 1.8
9.2
10.2
4.7
6.6
14.0
0.6
5.1
8.5 8.5
0
2
4
6
8
10
12
14
16
2008 2009 2010 2011 2012 2013 2014 2015 2016
Regulatedutility
Other

71 © Bloomberg Finance L.P. 2017. Developed in partnership with The Business Council for Sustainable Energy.
Deployment: US wind curtailment (% of wind generation)
● Curtailment can occur due to transmission constraints, inflexibilities in the grid and environmental or generation restrictions.
● This was a significant problem in ERCOT (Texas) from 2008-2013, but the build-out and upgrade of the Competitive
Renewable Energy Zone (CREZ) transmission lines and increased efficiency in ERCOT’s wholesale electricity market
addressed the problem. Curtailment fell from a peak of 17% in 2009 to 0.5% in 2014, and stayed just under 1% for 2015.
● PJM saw the lowest curtailment of any region in 2015, at 0.3%.* MISO and New England, on the other hand, have
experienced higher curtailment than other regions. Like ERCOT before CREZ, MISO’s transmission investment has not kept
pace with the rapid build-out of wind projects, and annual curtailment numbers continue to rise. MISO is currently building
transmission in order to alleviate congestion. New England’s curtailment levels in 2015 dropped to 2.4% from 3.3% in 2014.
Even so, this is still over double that of SPP and NYISO.
● In aggregate, total curtailment has shrunk since 2009. However, time-varying influences also played a role: in 2015, for
example, the western and interior US experienced below-normal wind speeds, reducing generation and therefore the need to
curtail in constrained regions. Source: Bloomberg New Energy Finance, Lawrence Berkeley National Laboratory
Notes: *Except for BPA, data represents forced and economic curtailment. BPA’s 2014-15 estimates were unavailable, and data for 2010-2013 are partly estimated. PJM’s 2012 figure is June-December
only. SPP’s 2014 figure is March-December only. ISO-NE and SPP are included only for 2014 onward, as the ISOs did not previously report curtailment data.
0%2%4%6%8%
10%12%14%16%18%
ER
CO
T
MIS
O
BP
A
NY
ISO
PJM
ISO
-NE
SP
P
TO
TA
LS
AM
PL
ED
2007
2008
2009
2010
2011
2012
2013
2014
2015
0%2%4%6%8%
10%12%14%16%18%
ER
CO
T
MIS
O
BP
A
NY
ISO
PJM
ISO
-NE
SP
P
TO
TA
LS
AM
PL
ED
2007
2008
2009
2010
2011
2012
2013
2014
2015

72 © Bloomberg Finance L.P. 2017. Developed in partnership with The Business Council for Sustainable Energy.
0
5
10
15
20
25
2010
2011
2012
2013
2014
2015
2016
2017
Solar PV(utility-scale)
Wind(by region)
Houston
Coastal
South
North
West
Panhandle
Deployment: ERCOT’s Competitive Renewable Energy Zone (CREZ)
● Texas is home to one-quarter of America’s installed wind capacity (over 18GW of 76GW installed as of November 2016).
● The majority was enabled by a $7bn investment in the Competitive Renewable Energy Zone (CREZ) transmission lines,
which connect West Zone and Panhandle wind to load centers in the East.
● The CREZ lines can accommodate roughly 18GW of West + Panhandle wind before significant curtailment (and congestion
pricing) comes back into play—and West + Panhandle wind is within 3 GW of reaching CREZ’s maximum capacity.
Cumulative wind capacity (GW)
Power plant capacity
2GW
1GW
500MW
250MW
Hydro
Wind
Solar PV
Biomass / Biogas
Plants with
interconnection
agreements in
ERCOT’s queue,
as of May 2016
Existing plants
(solid fill)
Other transmission lines
Strong wind resources
CREZ lines
Dallas
Austin
San Antonio
Houston
Map includes generators online as of Feb 2016 –
and proposed new build with interconnection
agreements in ERCOT’s queue (as of May 2016)
Plant pipeline
(hollow fill)
CREZ line capacity maxes
out around 18GW of West +
Panhandle wind
CREZ line capacity maxes out
around 6GW of Panhandle wind
Source: Bloomberg New Energy Finance, ERCOT

73 © Bloomberg Finance L.P. 2017. Developed in partnership with The Business Council for Sustainable Energy.
Deployment: Transmission build-out in MISO
● MISO currently has the most transmission build underway for wind, which will alleviate congestion and create new opportunities for wind
development. MISO’s Multi Value Project (MVP) Portfolio, the result of an extended transmission analysis, includes 17 projects, some of which are
interstate (shown above).
● Additionally, across the US (and sometimes connecting into Canada), there has been a number of proposals for high-voltage direct current
(HVDC) transmission lines. However, none of these have yet begun construction. Generally, transmission build within a specific state or region
receives full approval faster than those that cross multiple jurisdictions. Nearly 21GW-worth of HVDC transmission projects with at least a portion
in the US are currently under development or under construction. Much of this will not be built.
Source: Midwest ISO; MISO MTER14 MVP Triennial Review, September 2014
Notes: Projects are as follows: (1) Big Stone–Brookings, (2) Brookings, SD–SE Twin Cities, (3) Lakefield Jct.–Winnebago–Winco–Burt Area & Sheldon–Burt Area–Webster, (4) Winco–Lime Creek–Emery–
Black Hawk– Hazleton, (5) LaCrosse–N. Madison–Cardinal & Dubuque Co– Spring Green–Cardinal, (6) Ellendale–Big Stone, (7) Adair–Ottumwa, (8) Adair–Palmyra Tap, (9) Palmyra Tap–Quincy–
Merdosia–Ipava & Meredosia–Pawnee, (10) Pawnee–Pana, (11) Pana–Mt. Zion–Kansas–Sugar Creek, (12) Reynolds–Burr Oak–Hiple, (13) Michigan Thumb Loop Expansion, (14) Reynolds–Greentown,
(15) Pleasant Prairie–Zion Energy Center, (16) Fargo-Galesburg–Oak Grove, (17) Sidney–Rising.

74 © Bloomberg Finance L.P. 2017. Developed in partnership with The Business Council for Sustainable Energy.
Financing: Asset finance for US large-scale wind projects ($bn)
● The 2016-20 wind pipeline is very healthy: a large portion of the $14.7bn in financing secured in 2016 is for wind projects to
be commissioned in 2017-2020.
● Asset financing has tracked closely with the status of the Production Tax Credit (PTC), which has expired and been
retroactively extended multiple times since 2012. After developers rushed to secure construction financing in 2012 and 2013
prior to the PTC expiration dates, financing for new wind in 2014 declined. The rebound in 2015 was once again PTC-driven,
as developers sought to ensure project completion by the end of 2016 – the expected end of the PTC qualification period
before it was once again renewed by Congress in mid-December 2015. The final chance to receive the full value of the PTC
was for projects that started construction in 2016; projects that start construction later will receive a phased-down credit.
Source: Bloomberg New Energy Finance
Notes: Values include estimates for undisclosed deals. 2015 figure includes $323m directed towards an offshore wind project, the Deepwater Block Island Offshore Wind Farm.
1.9
4.3
8.7
12.4
17.5
9.6
17.7
10.8
14.3
12.5
10.6
14.014.7
0
2
4
6
8
10
12
14
16
18
20
2004200520062007200820092010201120122013201420152016

75 © Bloomberg Finance L.P. 2017. Developed in partnership with The Business Council for Sustainable Energy.
Economics: Wind turbine price index by turbine type and delivery date ($m/MW)
● Turbine prices fell 42% from $1.94m/MW in H1 2009 to $1.12m/MW in H2 2016. The global oversupply of turbines continues
to suppress prices. However, turbine oversupply occurs primarily in Europe.
● Global onshore installations are estimated to fall 7% from 58.6GW in 2015 to 54.7GW in 2016.
● We continue to see decreasing prices per MWh, especially as several projects with very high capacity factors reach delivery
stage. The global average capacity factor in 2016 was 39%.
Source: Bloomberg New Energy Finance
Notes: Values based on Bloomberg New Energy Finance’s Global Wind Turbine Price Index. Values from the Index have been converted from EUR to USD on contract execution date and are nominal.
1.601.52
1.94
1.74
1.50
1.531.34
1.36
1.34
1.24
1.261.22 1.22
1.321.20
1.201.14 1.12
1.09 1.12
H1 H2 H1 H2 H1 H2 H1 H2 H1 H2 H1 H2 H1 H2 H1 H2 H1 H2 H1 H2
2008 2009 2010 2011 2012 2013 2014 2015 2016 2017
Previous Index (H1 2015) Current Index (H2 2016)

76 © Bloomberg Finance L.P. 2017. Developed in partnership with The Business Council for Sustainable Energy.
Economics: US wind PPA prices compared to wholesale power prices in selected markets ($/MWh)
● Prices for wind power purchase agreements (PPAs) have fallen dramatically as levelized costs declined. According to
interviews with project developers, projects secured PPAs as low as $19/MWh in SPP in 2016. For comparison, data reported
to the Federal Energy Regulatory Commission indicate that the average offtake price for contracts signed in 2011 was
$47/MWh.
● The top regions for utility PPAs are high wind-speed regions with low development costs like SPP, MISO and ERCOT. An
ERCOT price range is not included in the chart above due to insufficient data; however, the region offers some of the lowest
levelized costs for wind in the US, with projects in West and North Texas boasting costs as low as those in SPP.
● Conversely, developing projects in New England can be costly and time consuming, and average project capacity factors are
among the lowest in the country.
● A significant number of wind projects commissioned in 2015 – representing 2.4GW of capacity – secured corporate PPAs.
The popularity of corporate PPAs continued into 2016, with an additional 1.5GW contracted. Source: Bloomberg New Energy Finance, SEC filings, interviews, analyst estimates Notes: *ERCOT PPA information is missing due to insufficient data. MISO is the Midwest region; PJM is the Mid-
Atlantic region; SPP is the Southwest Power Pool, covering the central southern US; NEPOOL is the New England region; ERCOT is most of Texas. Wholesale power price is average of quarterly future
power prices (based on Bloomberg Commodity Fair Value curve) maturing in calendar year 2016 for selected nodes within the region.
0
10
20
30
40
50
60
70
80
90
100
SP
P
PJM
New
York
ER
CO
T*
MIS
O
CA
ISO
South
west
Nort
hw
est
New
Engla
nd
PPA price range
Off-peak power
On-peak power

77 © Bloomberg Finance L.P. 2017. Developed in partnership with The Business Council for Sustainable Energy.
Economics: ‘Class I’ REC prices in selected US state markets ($/MWh)
● Renewable Energy Credits (RECs) provide an additional revenue stream for qualified renewable projects, thereby improving
project economics. However, oversupply drove down REC prices in major markets in 2016.
● New England Class 1 REC prices converged in 2016 due to oversupply. The region’s prices plunged in the second half of the
year in anticipation of additional supply from New England’s Clean Energy Request for Proposals (RFP), before entering a
partial correction around the end of the year.
● Texas has the greatest wind capacity in the country, resulting in a REC oversupply that has severely depressed prices.
● The PJM REC market remains oversupplied, and prices are guided by the value of use during potential future shortages.
Source: Bloomberg New Energy Finance, ICAP, Evolution, Spectron Group Notes: ‘Class I’ generally refers to the portion of REC markets that can be served by a variety of new renewables, including
wind. In contrast, solar REC (SREC) markets are not Class I, as these can only be met through solar. The ‘Class I’ component is usually the bulk of most states’ renewable portfolio standards. Data in the
charts above is the sole property of ICAP United, Inc. Unauthorized disclosure, copying or distribution of the Information is strictly prohibited and the recipient of the information shall not redistribute the
Information in a form to a third party. The Information is not, and should not be construed as, an offer, bid or solicitation in relation to any financial instrument. ICAP cannot guarantee, and expressly
disclaims any liability for, and makes no representations or warranties, whether express or implied, as to the Information's currency, accuracy, timeliness, completeness or fitness for any particular purpose.
0
10
20
30
40
50
60
Dec-13 Jun-14 Dec-14 Jun-15 Dec-15 Jun-16 Dec-16
CT 2017 Class 1
MA 2017 Class 1
CT 2016 Class 1
MA 2016 Class 1
CT 2015 Class 1
MA 2015 Class 1
TX 2015 Class 1

78 © Bloomberg Finance L.P. 2017. Developed in partnership with The Business Council for Sustainable Energy.
Table of contents
8. Global context
1. Introduction
2. A look across
the US energy
sector
3. Natural gas
4. Large-scale
renewable
electricity and
CCS
2.1 Bird’s-eye view
2.2 Policy, finance, economics
4.1 Solar (PV, solar thermal)
4.2 Wind
4.3 Biomass, biogas, waste-to-
energy
4.4 Geothermal
4.5 Hydropower
4.6 CCS
5. Distributed
power and
storage
5.1 Small-scale solar
5.2 Small- and medium-scale wind
5.3 Small-scale biogas
5.4 Combined heat and power and
waste-heat-to-power
5.5 Fuel cells (stationary)
5.6 Energy storage
6. Demand-
side energy
efficiency
6.1 Energy efficiency
6.2 Smart grid and demand response
7. Sustainable
transportation
7.1 Electric vehicles
7.2 Natural gas vehicles
7.3 Biofuels
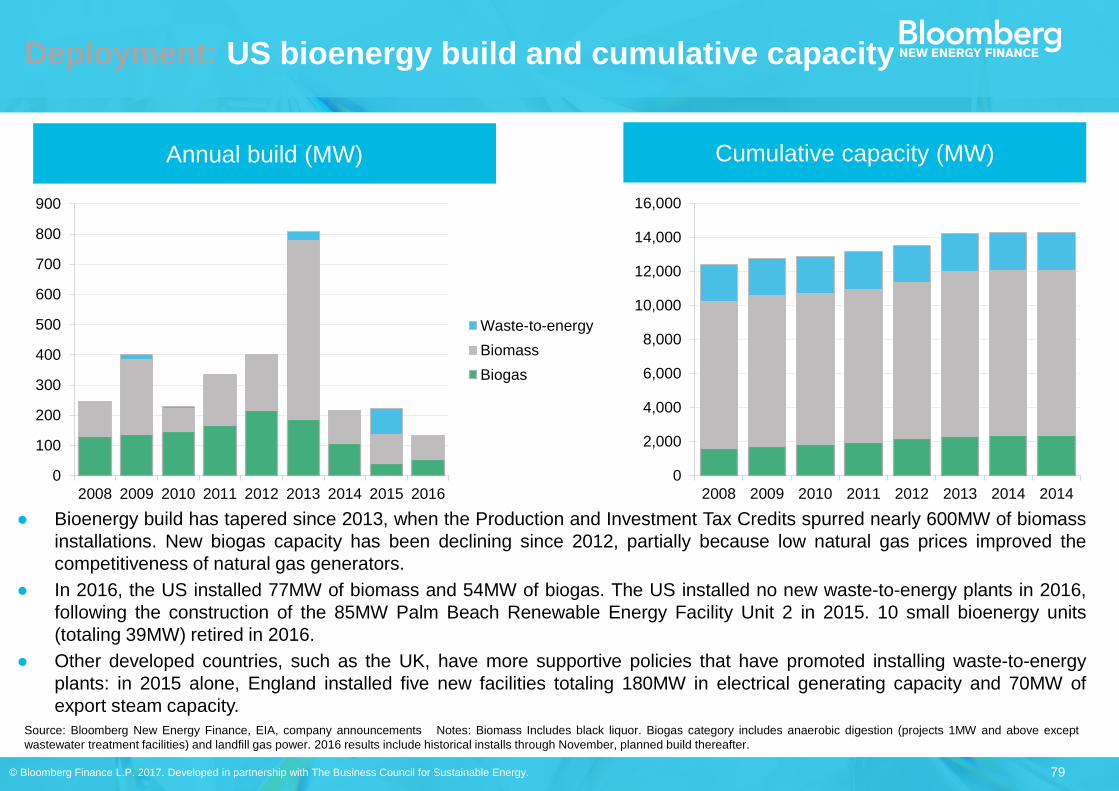
79 © Bloomberg Finance L.P. 2017. Developed in partnership with The Business Council for Sustainable Energy.
Deployment: US bioenergy build and cumulative capacity
Annual build (MW)
● Bioenergy build has tapered since 2013, when the Production and Investment Tax Credits spurred nearly 600MW of biomass
installations. New biogas capacity has been declining since 2012, partially because low natural gas prices improved the
competitiveness of natural gas generators.
● In 2016, the US installed 77MW of biomass and 54MW of biogas. The US installed no new waste-to-energy plants in 2016,
following the construction of the 85MW Palm Beach Renewable Energy Facility Unit 2 in 2015. 10 small bioenergy units
(totaling 39MW) retired in 2016.
● Other developed countries, such as the UK, have more supportive policies that have promoted installing waste-to-energy
plants: in 2015 alone, England installed five new facilities totaling 180MW in electrical generating capacity and 70MW of
export steam capacity.
Source: Bloomberg New Energy Finance, EIA, company announcements Notes: Biomass Includes black liquor. Biogas category includes anaerobic digestion (projects 1MW and above except
wastewater treatment facilities) and landfill gas power. 2016 results include historical installs through November, planned build thereafter.
Cumulative capacity (MW)
0
100
200
300
400
500
600
700
800
900
2008 2009 2010 2011 2012 2013 2014 2015 2016
Waste-to-energy
Biomass
Biogas
0
2,000
4,000
6,000
8,000
10,000
12,000
14,000
16,000
2008 2009 2010 2011 2012 2013 2014 2014

80 © Bloomberg Finance L.P. 2017. Developed in partnership with The Business Council for Sustainable Energy.
Financing: US bioenergy asset finance
Asset finance for US biomass ($m) Asset finance for US biogas and waste-to-energy
($m)
● Asset finance for new-build biomass dropped in 2016 to $196m, all of which was associated with one project: the US Army’s
50MW Schofield Barracks biomass plant in Hawaii, which is expected to be commissioned in 2018. Biogas received $24m,
which went towards the CR&R Perris biomethane plant in California. There was no financing reported for waste-to-energy.
● The largest waste-to-energy (WTE) deals in recent years were the $677m in financing secured in 2012 for the Palm Beach
Biomass Plant Facility Unit 2, and the $575m that went towards the Energy Answers Fairfield plant in 2013. Financing for
WTE has been muted in the past three years, with only the 25MW Constellation Hyperion plant receiving $70m in 2015.
● Low levels of investment from 2013-2016 continue to suggest relatively low new build for the next few years. Plants take two
to four years to complete construction and be commissioned; investment acts as a leading indicator for capacity.
Source: Bloomberg New Energy Finance, EIA Notes: Biomass category includes black liquor. Biogas category includes anaerobic digestion (projects 1MW and above except wastewater treatment
facilities) and landfill gas power. Waste-to-energy includes municipal/industrial waste. Values are nominal and include estimates for undisclosed deals.
566
880755
927
425
1,409
875
40286
1960
200
400
600
800
1,000
1,200
1,400
1,600
2006 2007 2008 2009 2010 2011 2012 2013 2014 2015 2016
449 487383
108216
155 200126
39
17424
290
16
30 368
56
696
575
70
0
100
200
300
400
500
600
700
800
900
1,000
2006 2007 2008 2009 2010 2011 2012 2013 2014 2015 2016
Biogas
Waste-to-energy
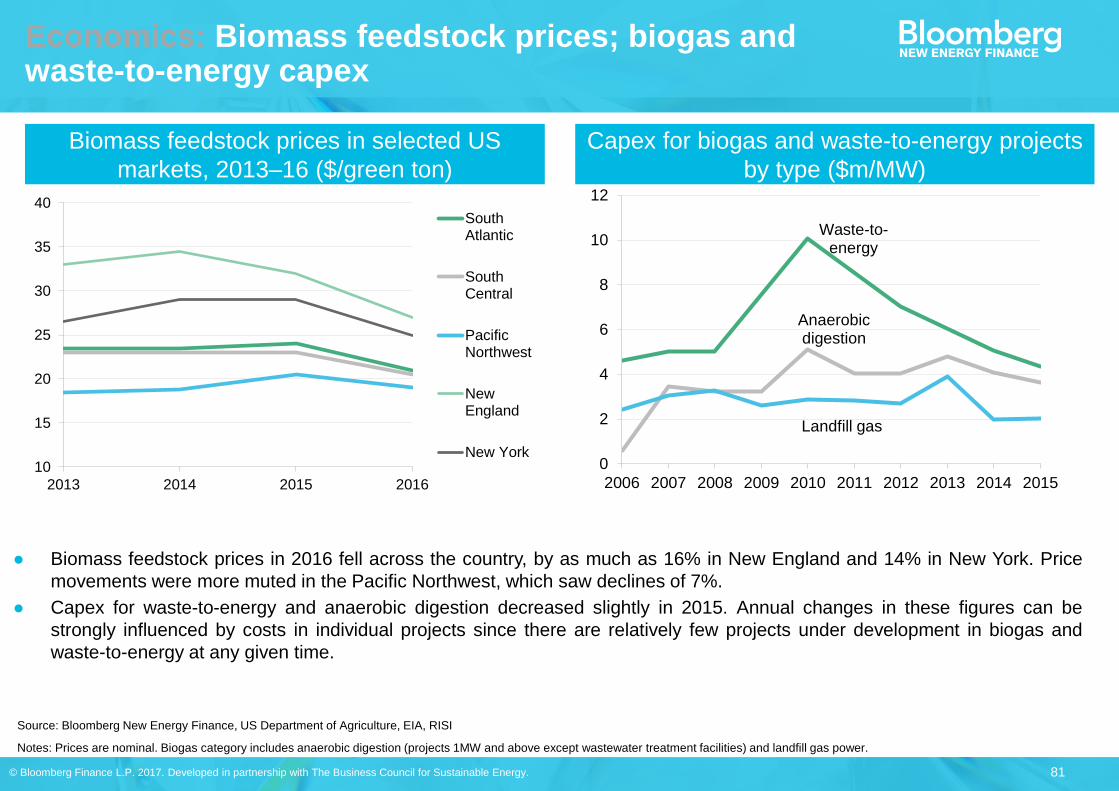
81 © Bloomberg Finance L.P. 2017. Developed in partnership with The Business Council for Sustainable Energy.
Economics: Biomass feedstock prices; biogas and waste-to-energy capex
Biomass feedstock prices in selected US
markets, 2013–16 ($/green ton)
Capex for biogas and waste-to-energy projects
by type ($m/MW)
● Biomass feedstock prices in 2016 fell across the country, by as much as 16% in New England and 14% in New York. Price
movements were more muted in the Pacific Northwest, which saw declines of 7%.
● Capex for waste-to-energy and anaerobic digestion decreased slightly in 2015. Annual changes in these figures can be
strongly influenced by costs in individual projects since there are relatively few projects under development in biogas and
waste-to-energy at any given time.
Source: Bloomberg New Energy Finance, US Department of Agriculture, EIA, RISI
Notes: Prices are nominal. Biogas category includes anaerobic digestion (projects 1MW and above except wastewater treatment facilities) and landfill gas power.
Waste-to-energy
Anaerobic digestion
Landfill gas
0
2
4
6
8
10
12
2006 2007 2008 2009 2010 2011 2012 2013 2014 201510
15
20
25
30
35
40
2013 2014 2015 2016
SouthAtlantic
SouthCentral
PacificNorthwest
NewEngland
New York

82 © Bloomberg Finance L.P. 2017. Developed in partnership with The Business Council for Sustainable Energy.
Table of contents
8. Global context
1. Introduction
2. A look across
the US energy
sector
3. Natural gas
4. Large-scale
renewable
electricity and
CCS
2.1 Bird’s-eye view
2.2 Policy, finance, economics
4.1 Solar (PV, solar thermal)
4.2 Wind
4.3 Biomass, biogas, waste-to-
energy
4.4 Geothermal
4.5 Hydropower
4.6 CCS
5. Distributed
power and
storage
5.1 Small-scale solar
5.2 Small- and medium-scale wind
5.3 Small-scale biogas
5.4 Combined heat and power and
waste-heat-to-power
5.5 Fuel cells (stationary)
5.6 Energy storage
6. Demand-
side energy
efficiency
6.1 Energy efficiency
6.2 Smart grid and demand response
7. Sustainable
transportation
7.1 Electric vehicles
7.2 Natural gas vehicles
7.3 Biofuels

83 © Bloomberg Finance L.P. 2017. Developed in partnership with The Business Council for Sustainable Energy.
Deployment: US geothermal build (MW)
● New US geothermal build lags behind that of other renewables due to long project completion periods (4-7 years), high costs
of development, and lack of policy support. All this has contributed to a dearth of geothermal development, with no new
projects commissioned in 2016. Further, only one project, Cyrq Energy’s Soda Lake 3, moved forward with development after
awarding an engineering, procurement and construction (EPC) contract to Ormat.
● However, 2016 also brought new hope for the sector – the Bureau of Land Management auctioned off new geothermal land
leases in Nevada, Utah and Oregon. In Nevada, 14 of 22 leases cleared – with Ormat snapping up the majority. In addition, a
new lease was granted to develop capacity in California’s Salton Sea. These new leases for development could replenish the
pipeline for geothermal projects in the US.
● The majority of activity has been from experiment with hybridization – the use of another technology alongside geothermal to
enhance the overall performance of the plant. Two such facilities are operated by Enel Green Power North America, Inc.
(EGP-NA). The first is at its triple-hybrid Stillwater plant in Nevada, where the company in 2015 commissioned a new solar
thermal component that had been added to its existing photovoltaic and geothermal hybrid. The second project took place at
EGP-NA's existing Cove Fort geothermal power plant in Utah, where the company in 2016 commissioned a hydroelectric
generator newly added to an injection well.
Incremental Cumulative
Source: Bloomberg New Energy Finance
76
116
50
17
114.9
70
4661
00
500
1,000
1,500
2,000
2,500
3,000
3,500
4,000
0
25
50
75
100
125
150
175
200
2008 2009 2010 2011 2012 2013 2014 2015 2016
Cumulative capacity

84 © Bloomberg Finance L.P. 2017. Developed in partnership with The Business Council for Sustainable Energy.
Financing: Asset finance for US geothermal projects ($m)
● With the lack of additional projects moving forward, 2016 was the second year in a row without new asset financing for US
geothermal projects.
● One project, Ormat’s Don A Campbell Phase II in Nevada, was refinanced in 2016. Ormat raised USD 44m in equity as
Northleaf Capital Partners bought a 36.75% stake, and another USD 55m in debt from bond issuance.
● The US Department of Energy also awarded $29m for research into enhanced geothermal systems, which would use
hydraulic fracturing to stimulate geothermal resources in areas which have less water, heat or permeability. Sandia National
Laboratories and the University of Utah will undertake this research.
Source: Bloomberg New Energy Finance
Notes: Values include estimates for undisclosed deals and are in nominal dollars.
436
55
483
612
153
4
193
0 00
100
200
300
400
500
600
700
2008 2009 2010 2011 2012 2013 2014 2015 2016

85 © Bloomberg Finance L.P. 2017. Developed in partnership with The Business Council for Sustainable Energy.
Economics: Capex for geothermal projects by type ($m/MW)
● With no new projects commissioned in 2016, there are no updates to the capex for geothermal projects in the United States.
● Globally, the levelized cost of electricity from binary power plants, which produce electricity from cooler reservoirs, has
declined in 2016. Geothermal projects in the US and abroad are increasingly employing binary technology, and this focus has
driven down the cost of developing such projects.
● Ultimately, binary remains more expensive than flash or steam technologies – which target higher-temperature resources.
Source: Bloomberg New Energy Finance Notes: values are in nominal dollars.
0
1
2
3
4
5
6
2009 2010 2011 2012 2013 2014 2015 2016
Binary
Flash

86 © Bloomberg Finance L.P. 2017. Developed in partnership with The Business Council for Sustainable Energy.
Table of contents
8. Global context
1. Introduction
2. A look across
the US energy
sector
3. Natural gas
4. Large-scale
renewable
electricity and
CCS
2.1 Bird’s-eye view
2.2 Policy, finance, economics
4.1 Solar (PV, solar thermal)
4.2 Wind
4.3 Biomass, biogas, waste-to-
energy
4.4 Geothermal
4.5 Hydropower
4.6 CCS
5. Distributed
power and
storage
5.1 Small-scale solar
5.2 Small- and medium-scale wind
5.3 Small-scale biogas
5.4 Combined heat and power and
waste-heat-to-power
5.5 Fuel cells (stationary)
5.6 Energy storage
6. Demand-
side energy
efficiency
6.1 Energy efficiency
6.2 Smart grid and demand response
7. Sustainable
transportation
7.1 Electric vehicles
7.2 Natural gas vehicles
7.3 Biofuels

87 © Bloomberg Finance L.P. 2017. Developed in partnership with The Business Council for Sustainable Energy.
Deployment: US hydropower build and licensed capacity
US hydropower US new hydropower capacity licensed or
exempted by FERC (MW)
● New commissioned capacity in hydropower jumped in 2016 after a two-year lull. Although the largest single hydroelectric
generator installed was tied to a dam repair effort (the 120MW Wanapum unit in Washington), 2016 also featured two of the
first substantial greenfield projects in some years: the 105MW Meldahl Hydro Project and 88MW Cannelton Hydro Project,
both on the Ohio River in Kentucky.
● Most new development is focused on unlocking the potential in existing non-powered dams. According to the Department of
Energy, the largest 100 such dams could offer as much as 8GW.
● Hydro projects that began construction before the end of 2016 were able to claim PTC eligibility. FERC approved licenses or
exemptions for 152MW through October 2016.
Incremental build (MW) Cumulative capacity (GW)
Source: Bloomberg New Energy Finance, FERC
Notes: The licensing figures exclude pumped storage licenses. 2016 data are as of October 2016.
Cumulative hydro
capacity 127
151138
162
32
205
71
152
0
50
100
150
200
250
2009 2010 2011 2012 2013 2014 2015 2016
100
101
102
103
104
105
0
100
200
300
400
500
2008 2009 2010 2011 2012 2013 2014 2015 2016
Large hydro (30MW+) Small hydro (<30MW)
Pumped storage Cumulative capacity
Source: Bloomberg New Energy Finance, EIA
Notes: 2016 data are as of end-November 2016.

88 © Bloomberg Finance L.P. 2017. Developed in partnership with The Business Council for Sustainable Energy.
Table of contents
8. Global context
1. Introduction
2. A look across
the US energy
sector
3. Natural gas
4. Large-scale
renewable
electricity and
CCS
2.1 Bird’s-eye view
2.2 Policy, finance, economics
4.1 Solar (PV, solar thermal)
4.2 Wind
4.3 Biomass, biogas, waste-to-
energy
4.4 Geothermal
4.5 Hydropower
4.6 CCS
5. Distributed
power and
storage
5.1 Small-scale solar
5.2 Small- and medium-scale wind
5.3 Small-scale biogas
5.4 Combined heat and power and
waste-heat-to-power
5.5 Fuel cells (stationary)
5.6 Energy storage
6. Demand-
side energy
efficiency
6.1 Energy efficiency
6.2 Smart grid and demand response
7. Sustainable
transportation
7.1 Electric vehicles
7.2 Natural gas vehicles
7.3 Biofuels

89 © Bloomberg Finance L.P. 2017. Developed in partnership with The Business Council for Sustainable Energy.
Deployment: Cumulative CO2 captured by source within the US (MtCO2/year)
● There are more than 60 integrated CCS projects in the US, 30 of which are operational. Overall, 38 projects are intended to send CO2 towards
enhanced oil recovery (EOR). Most operational US CCS projects are at natural gas processing facilities. China has more than 25 integrated CCS
projects, eight of which are operating. 12 of those in China are intended to send CO2 for EOR or methane recovery.
● No new CCS projects for power generation passed final investment decision in 2016. The PetraNova CCS plant, at the W.A. Parish Generating
Station near Houston, Texas, came online in January 2017. It will capture CO2 from a 240MW flue-stream. Mississippi Power's 563MW Kemper
project in the US will begin CCS operations in the coming months. The utility has faced problems with cost overruns and delays through
construction—costs were first estimated at under $2bn for the plant and carbon capture, but this has since risen to $6.7bn. The developers initially
expected to commission the plant in 2015. The problems have to do with the complexity of building a large project, rather than with CCS-specific
concerns.
● The most positive development in 2016 for CCS occurred in Abu Dhabi, for the Al Reyadah steel plant. The project is designed to capture
0.8MtCO2 a year for EOR. In addition, Norway announced plans for the first large-scale industrial CCS project that will create a CCS hub
delivering CO2 from an ammonia plant owned by Yara, a cement plant owned by Norcem and a waste-to-power plant in Oslo. The carbon will be
captured for offshore storage.
● World-wide prospects for CCS look quite limited at this time. The funding gap is still too high and levels of government support or other revenue
streams (eg, avoided cost of carbon or enhanced oil recovery) are still not enough to bridge it. This could change if more public funding was
announced, mandates for coal and carbon capture were implemented or if carbon prices rose to the $50–100/tCO2 range. Some emissions pricing
initiatives that are in the works hold some promise for helping to close the funding gap – for example, Canada is establishing a national carbon tax
that will reach CAD 50 by the early 2020s, and China is introducing a national carbon market in 2017.
Source: Bloomberg New Energy Finance
0
5
10
15
20
25
30
35
1985 1990 1995 2000 2005 2010 2015
Iron / steel production
Other
Cement production
Ethanol production
Chemical plant
Fertiliser production
Oil refining
Coal-to-Liquids (CTL / XTL)
Power plant
Gas processing

90 © Bloomberg Finance L.P. 2017. Developed in partnership with The Business Council for Sustainable Energy.
Financing: Asset finance for US CCS projects that passed post-financial investment decision, by region ($m)
● There was no new investment for large US projects in 2016. Cumulative investment in CCS has been flat for a second year at
just over $180bn.
● CCS projects have high costs and only a small number of projects have been financed, although minimal levels of research
and development continue. China has developed a wide range of pilot projects targeting both power and industrial sources of
CO2. Norway is progressing with preparations for a full-scale industrial CCS project that will use ships for CO2 transportation.
● From 2007-2016, 49% of global asset finance into CCS occurred in the US.
Source: Bloomberg New Energy Finance
Notes: Includes demonstration and commercial scale projects (projects above 100MW or 1MtCO2/yr) post-final investment decision only. Values do not include estimates for undisclosed deals and are in
nominal dollars.
0
20
40
60
80
100
120
140
160
180
200
1990 1991 1992 1993 1994 1995 1996 1997 1998 1999 2000 2001 2002 2003 2004 2005 2006 2007 2008 2009 2010 2011 2012 2013 2014 2015 2016
Carbon Capture Storage Financing by Region (USD billion)
Central & South America
Oceania
Europe
Asia
Middle East & North Africa
North America & Caribbean

91 © Bloomberg Finance L.P. 2017. Developed in partnership with The Business Council for Sustainable Energy.
Economics: Estimated first-of-a-kind (FOAK) capital cost for CCS projects ($m/MW)
● First-of-a-kind (FOAK) costs are much higher than ‘mature’ costs.
● Deployment in the tens of GWs may be needed to bring down technology costs, so ‘mature’ costs do not necessarily
represent the best estimates of FOAKs.
● Globally, no new large-scale power-related projects came online in 2016. One large-scale project linked to steel
manufacturing did commission – the one associated with the Emirates Steel Industries’ Mussafah plant in the UAE.
0.71
4.82
2.74 2.441.62
1.51
1.981.47
0
1
2
3
4
5
6
7
NG+MEA IGCC+SEL PC+MEA PC+OXY
FOAK CCS
FOAK plant
Source: Bloomberg New Energy Finance
Notes: Based on same analysis as in 2014/15 Factbook. Costs are based on 250MWe base plant and capture. NG+MEA refers to natural gas combined-cycle plants with post-combustion (amine) capture;
IGCC+SEL refers to integrated gasification combined cycle plant with pre-combustion (Selexol) capture; PC+MEA is pulverized coal with post-combustion (amine) capture; and PC+OXY is coal
oxycombustion plant with cryogenic CO2 capture.

92 © Bloomberg Finance L.P. 2017. Developed in partnership with The Business Council for Sustainable Energy.
Table of contents
8. Global context
1. Introduction
2. A look across
the US energy
sector
3. Natural gas
4. Large-scale
renewable
electricity and
CCS
2.1 Bird’s-eye view
2.2 Policy, finance, economics
4.1 Solar (PV, solar thermal)
4.2 Wind
4.3 Biomass, biogas, waste-to-
energy
4.4 Geothermal
4.5 Hydropower
4.6 CCS
5. Distributed
power and
storage
5.1 Small-scale solar
5.2 Small- and medium-scale wind
5.3 Small-scale biogas
5.4 Combined heat and power and
waste-heat-to-power
5.5 Fuel cells (stationary)
5.6 Energy storage
6. Demand-
side energy
efficiency
6.1 Energy efficiency
6.2 Smart grid and demand response
7. Sustainable
transportation
7.1 Electric vehicles
7.2 Natural gas vehicles
7.3 Biofuels

93 © Bloomberg Finance L.P. 2017. Developed in partnership with The Business Council for Sustainable Energy.
Deployment: US small-scale solar build by type (GW)
● The small-scale PV markets achieved yet another record in 2016, installing approximately 3.4GW of solar capacity for US
homes and businesses. 12 states experienced more than a 100% growth in residential PV build, based on estimated end-
year 2016 numbers.
● However, the markets are giving early indications of a transformation. The residential PV market is evolving in response to
the endless onslaught of net metering proceedings and saturation effects in the more mature markets. Vendors and installers
are looking beyond California and the Southwest to find new growth opportunities.
● The C&I market is finally showing signs of sustainable growth, with increasing activity both onsite and offsite. The rooftop
C&I market has been slow to develop, but offsite corporate procurement has given US businesses a menu of solar options.
● Small-scale PV uptake is supported by compelling economics – it benefits from the falling technology costs of utility-scale
solar, but competes against premium retail electricity rates. There is also a secondary, behavioral driver, in which more
households become open to considering small-scale solar as more households and businesses install it.
Source: Bloomberg New Energy Finance Note: 2016 US residential and C&I PV build figures are estimated.
Annual US residential and C&I PV build,
2012-2016 (GW)
Quarterly installations of top three residential
PV vendors, Q1 2014-Q2 2016 (MW)
6790
120149 139
168203 221
184 20120
37
49
5046
66
6159
5561
35
34
3737
42
5668
6065
21%
32%
40%37%
34%
42%
47%44%
46%
0
100
200
300
400
Q1 Q2 Q3 Q4 Q1 Q2 Q3 Q4 Q1 Q2
2014 2015 2016
SolarCity Vivint Sunrun Market share of top 3 vendors
0.8 0.9 1.0 0.81.1
0.50.8
1.2
2.0
2.3
1.4
1.7
2.2
2.9
3.4
0.0
0.5
1.0
1.5
2.0
2.5
3.0
3.5
4.0
2012 2013 2014 2015 2016e
Commercial and industrial Residential

94 © Bloomberg Finance L.P. 2017. Developed in partnership with The Business Council for Sustainable Energy.
Financing: Cumulative funds closed by selected US third-party PV financiers ($bn)
● In 2016, tax equity funds totaled an estimated $2.13bn, eclipsing the $1.96bn raised in 2015. Only SolarCity, Sunrun, Vivint,
SunPower and Sungevity raised capital, with SolarCity responsible for nearly $1.4bn of the total. SolarCity was officially
acquired by Tesla on 21 November 2016.
● To start off 2017, Spruce Financial, a residential solar and efficiency financing firm, raised $200m. Vivint’s tax equity fund also
raised a further $100m.
Source: Bloomberg New Energy Finance
Notes: This represents fund size; actual capital invested is lower and non-public. Data is from publicly available documents and submissions from investors; this figure does not capture any undisclosed
deals. Each fund contains an unknown combination of equity, tax equity, or debt (or an absence of tax equity or debt). Vivint and Clean Power Finance totals include cash equity. Figures are nominal.
0.0
0.5
1.0
1.5
2.0
2.5
3.0
3.5
4.0
4.5
5.0
Nov-0
8
Mar-
09
Jul-09
Nov-0
9
Mar-
10
Jul-10
Nov-1
0
Mar-
11
Jul-11
Nov-1
1
Mar-
12
Jul-12
Nov-1
2
Mar-
13
Jul-13
Nov-1
3
Mar-
14
Jul-14
Nov-1
4
Mar-
15
Jul-15
Nov-1
5
Mar-
16
Jul-16
Nov-1
6
SolarCity
Sunrun
Vivint
SunPower
Clean PowerFinance
SunEdison
Sungevity
NRG Solar

95 © Bloomberg Finance L.P. 2017. Developed in partnership with The Business Council for Sustainable Energy.
1.851.35
0.93 0.71 0.68 0.61 0.50
4.09
3.283.02
2.602.40
1.821.66
0
1
2
3
4
5
2010 2011 2012 2013 2014 2015 2016
Other
EPC
BOP
Inverter
Module
1.851.35
0.93 0.71 0.68 0.61 0.50
3.82
3.09
2.251.97 1.83
1.60 1.45
0
1
2
3
4
5
2010 2011 2012 2013 2014 2015 2016
Other
EPC
BOP
Inverter
Module
Economics: Best-in-class capex of small-scale solar (2015$/W)
Best-in-class global capex of commercial-scale PV Best-in-class global capex of residential PV
● Capex for commercial-scale PV, according to the global benchmark, has declined to $1.45/W, driven largely by falling
module prices and declines in ‘balance of plant’ (BOP) costs. Capex for residential PV continues to experience strong
declines as well on a global basis.
● The values shown here reflect best-in-class benchmarks for PV in mature markets such as Germany. In the US, capex is
often higher than the global benchmark for many reasons, such as fragmented regulatory regimes, the prevalence of third-
party owned solar, longer build time, higher acquisition costs and greater profit margins.
Source: Bloomberg New Energy Finance
Notes: ‘EPC’ refers to ‘engineering, procurement and construction’; ‘BOP’ refers to ‘balance of plant.’ Figures are in real 2015 dollars.

96 © Bloomberg Finance L.P. 2017. Developed in partnership with The Business Council for Sustainable Energy.
Table of contents
8. Global context
1. Introduction
2. A look across
the US energy
sector
3. Natural gas
4. Large-scale
renewable
electricity and
CCS
2.1 Bird’s-eye view
2.2 Policy, finance, economics
4.1 Solar (PV, solar thermal)
4.2 Wind
4.3 Biomass, biogas, waste-to-
energy
4.4 Geothermal
4.5 Hydropower
4.6 CCS
5. Distributed
power and
storage
5.1 Small-scale solar
5.2 Small- and medium-scale wind
5.3 Small-scale biogas
5.4 Combined heat and power and
waste-heat-to-power
5.5 Fuel cells (stationary)
5.6 Energy storage
6. Demand-
side energy
efficiency
6.1 Energy efficiency
6.2 Smart grid and demand response
7. Sustainable
transportation
7.1 Electric vehicles
7.2 Natural gas vehicles
7.3 Biofuels

97 © Bloomberg Finance L.P. 2017. Developed in partnership with The Business Council for Sustainable Energy.
Deployment: US small- and medium-scale wind build (MW)
US small-scale (≤100kW) wind build US medium-scale (101kW-1MW) wind build
● In 2015, total build for wind projects below 1MW in size remained limited, with 7MW commissioned. Small- and medium-
scale wind deployment has been muted since 2012; capacity additions fell 70% for the small-scale and 77% for the
medium-scale category from 2012 to 2013, and have remained low since.
● Cumulative capacity for small- and medium-scale wind thus only made minor advances to 147MW and 432MW,
respectively, in 2015.
Incremental (MW) Cumulative (MW) Incremental (MW) Cumulative (MW)
Source: US DOE 2015 Distributed Wind Market Report, published August 2016 (and previous editions of this report)
3 35
3
9 10
1720
26
19 18
64 4
0
100
200
300
400
500
600
0
10
20
30
40
50
60
20
02
20
03
20
04
20
05
20
06
20
07
20
08
20
09
20
10
20
11
20
12
20
13
20
14
20
15
Cumulative capacity
0
19
74 3 3
14
9 912
19
42 3
0
100
200
300
400
500
600
0
10
20
30
40
50
60
20
02
20
03
20
04
20
05
20
06
20
07
20
08
20
09
20
10
20
11
20
12
20
13
20
14
20
15
Cumulative capacity

98 © Bloomberg Finance L.P. 2017. Developed in partnership with The Business Council for Sustainable Energy.
Economics: US small-scale (≤100kW) wind turbine average size and installation cost
● Through 2012, installation costs had risen as the average size of small-scale wind turbine installations climbed. In 2013,
costs flatlined as the average size fell by more than half compared to the previous year and capacity additions dropped. In
2015, out of contracts for 1,713 units for distributed wind, 1,695 were for units up through 100kW.
● Costs vary widely between projects depending on factors such as siting, available wind resource, tower height, obstructions
in the area, etc.
● For 2013-2014, the average levelized cost of electricity for small-scale distributed wind installations was 12¢/kWh
($120/MWh). This dropped slightly in 2015, to 11¢/kWh ($111/MWh). The figure was calculated by the US Department of
Energy in its report on distributed wind, using a sample size of 1.45MW from 73 projects in 2013-14 and 1.24MW from 50
projects in 2015.
Source: US DOE 2015 Distributed Wind Market Report, published August 2016 (and previous editions of this report). Note: Installation cost figures are nominal.
Average size (kW/unit) Installation cost ($/kW)
1.00.8
1.0 1.1
1.72.1
3.3
2.6
5.0
2.12.3
2.5
$0
$1,000
$2,000
$3,000
$4,000
$5,000
$6,000
$7,000
0
1
2
3
4
5
6
7
2004 2005 2006 2007 2008 2009 2010 2011 2012 2013 2014 2015
Average size Cost

99 © Bloomberg Finance L.P. 2017. Developed in partnership with The Business Council for Sustainable Energy.
Table of contents
8. Global context
1. Introduction
2. A look across
the US energy
sector
3. Natural gas
4. Large-scale
renewable
electricity and
CCS
2.1 Bird’s-eye view
2.2 Policy, finance, economics
4.1 Solar (PV, solar thermal)
4.2 Wind
4.3 Biomass, biogas, waste-to-
energy
4.4 Geothermal
4.5 Hydropower
4.6 CCS
5. Distributed
power and
storage
5.1 Small-scale solar
5.2 Small- and medium-scale wind
5.3 Small-scale biogas
5.4 Combined heat and power and
waste-heat-to-power
5.5 Fuel cells (stationary)
5.6 Energy storage
6. Demand-
side energy
efficiency
6.1 Energy efficiency
6.2 Smart grid and demand response
7. Sustainable
transportation
7.1 Electric vehicles
7.2 Natural gas vehicles
7.3 Biofuels

100 © Bloomberg Finance L.P. 2017. Developed in partnership with The Business Council for Sustainable Energy.
Deployment: US anaerobic digester operational projects at commercial livestock farms (number of projects)
● Growth of the small anaerobic digester market has stalled out, as more projects were retired (eight) than completed (three) in
2015. As of May 2016, no new projects had been completed for 2016, although three were under construction.
● Prior to 2014 (when seven projects were built), build ranged between 19-36 additions annually, partially offset by retirements.
● The falloff in installations from 2014-2016 likely reflects both a lag in reporting projects to the voluntary EPA AgSTAR registry,
and the fact that anaerobic digesters face high capital costs and competition from natural gas. This competition intensified as
natural gas prices touched 18-year lows in 2015-16.
● Build in 2012-13 may also have been encouraged by state policies such as the inclusion of anaerobic digestion within North
Carolina’s RPS and the launch of the California cap-and-trade program in 2013, which accepts offset credits from livestock
methane projects.
Annual increase, net of retirements Cumulative
Source: US EPA AgSTAR program
Notes: Columns show annual net increase (accounting for retirements). Data as of May 2016 (release date of the most recent EPA AgSTAR registry).
30
1116
20
32
21
4
-50
35
70
105
140
175
210
245
280
-5
0
5
10
15
20
25
30
35
2008 2009 2010 2011 2012 2013 2014 2015 2016
Cumulative

101 © Bloomberg Finance L.P. 2017. Developed in partnership with The Business Council for Sustainable Energy.
Table of contents
8. Global context
1. Introduction
2. A look across
the US energy
sector
3. Natural gas
4. Large-scale
renewable
electricity and
CCS
2.1 Bird’s-eye view
2.2 Policy, finance, economics
4.1 Solar (PV, solar thermal)
4.2 Wind
4.3 Biomass, biogas, waste-to-
energy
4.4 Geothermal
4.5 Hydropower
4.6 CCS
5. Distributed
power and
storage
5.1 Small-scale solar
5.2 Small- and medium-scale wind
5.3 Small-scale biogas
5.4 Combined heat and power and
waste-heat-to-power
5.5 Fuel cells (stationary)
5.6 Energy storage
6. Demand-
side energy
efficiency
6.1 Energy efficiency
6.2 Smart grid and demand response
7. Sustainable
transportation
7.1 Electric vehicles
7.2 Natural gas vehicles
7.3 Biofuels

102 © Bloomberg Finance L.P. 2017. Developed in partnership with The Business Council for Sustainable Energy.
318440 390 416
572422
1,257
167
156
233241
287
280
291
134
261
110
41
510
708 647
717
962
729
1,397
469
0
10
20
30
40
50
60
70
80
90
100
0
300
600
900
1,200
1,500
2008 2009 2010 2011 2012 2013 2014 2015
Other Commercial Industrial
Cumulative capacity
Deployment: US CHP build and generation
US CHP build (MW) and capacity (GW) US CHP generation (from plants tracked by EIA
generation data) (TWh)
● Installations sunk in 2015 to 469MW, following a 2014 peak of 1,397MW. The drop-off came on the back of a 87% year-on-
year decline in industrial installments.
● Cumulative capacity for CHP dipped from 82.7GW to 81.1GW due to site retirements and industrial plant closures.
● The exceptional CHP build in 2014 was accompanied by a corresponding uptick in generation, which persisted in 2015. 2016
generation is expected to remain close to the previous year’s level and contribute 9% of total US generation.
● Data may underestimate total CHP production because they do not reflect some newer installations, which tend to be smaller
in size and excluded from EIA estimates (see notes below).
Incremental (MW) Cumulative (GW)
Source: Bloomberg New Energy Finance, DOE CHP Installation Database (maintained by ICF, Inc.) Notes: EIA is the best available source for generation data. However, EIA data on CHP is not
comprehensive and so the generation figures are underestimated. Specifically, EIA does not collect data for sites <1MW; EIA may not be aware of certain installations and thus may not send these sites a
survey for reporting; and EIA categorizes some CHP systems as 'electric power' rather than 'industrial CHP', if these systems sell power to the grid while providing steam to an adjacent facility. Values for
2016 are projected, accounting for seasonality, based on latest monthly values from EIA (data available through November 2016).
305293
305 301 309294
367 374 365
0
50
100
150
200
250
300
350
400
2008 2009 2010 2011 2012 2013 2014 2015 2016

103 © Bloomberg Finance L.P. 2017. Developed in partnership with The Business Council for Sustainable Energy.
Deployment: US small-scale CHP build
Source: Bloomberg New Energy Finance, DOE CHP Installation Database (maintained by ICF, Inc.)
US Annual CHP build by system size (# of
projects)
● In 2015, the average CHP system size continued to fall. Installations for both large systems (500kW-10MW) and small ones
(1-25kW) failed to match the levels seen in 2014.
● While gas turbines were still the preferred technology for CHP build in 2015, its number of installations have dropped.
US Annual CHP build by technology (GW)
0
50
100
150
200
250
199
0
199
1
199
21
99
3
199
4
199
5
1996
199
7
199
8
199
9
200
0
200
1
200
2
2003
200
4
200
5
200
62007
200
8
200
9
201
02
01
1
201
2
201
32014
201
5
1-25kW 25-500kW 500kW-1MW 1-10MW 10MW+
0
1
2
3
4
5
6
199
0
199
1
199
2
199
3
199
4
199
5
199
6
199
7
199
8
199
9
200
0
200
1
200
2
200
3
200
4
200
5
200
6
200
7
200
8
200
9
201
0
201
1
201
2
201
3
201
4
201
5
Steam Turbine Gas Turbine Reciprocating Engine
Fuel Cell Microturbine Other

104 © Bloomberg Finance L.P. 2017. Developed in partnership with The Business Council for Sustainable Energy.
● Natural gas and biomass have taken small chunks of the market from coal, reflecting a broader transition away from coal-fired
power. Natural gas remains the most popular source for cogeneration by far, representing 71% of installed CHP capacity.
● More broadly, growth across the CHP sector has also stalled: cumulative capacity has fluctuated around 82GW for the past
five years.
Deployment: US CHP deployment by fuel and by sector, 2015
US CHP deployment by fuel source US CHP deployment by sector
Source: Bloomberg New Energy Finance, DOE CHP Installation Database (maintained by ICF, Inc.)
Natural gas71%
Coal13%
Biomass & waste13%
Oil1%
Other2%
Total = 81.1GW
Industrial80%
Commercial14%
Other6%
Total = 81.1GW

105 © Bloomberg Finance L.P. 2017. Developed in partnership with The Business Council for Sustainable Energy.
● Steam turbines, internal combustion engines and gas combustion turbines remain the cheapest to build.
● The price range of microturbines has continued to tighten.
Financing and economics: US CHP asset finance and capex
Asset finance for US CHP ($m) Capital cost of CHP by technology ($/W)
Source: Bloomberg New Energy Finance, DOE CHP Installation Database (maintained by ICF, Inc.)
Notes: Values are estimated assuming a two-year lag between financing and deployment, and
assuming a weighted average capex of $1.7m/MW in 2006, falling to $1.4m/MW by 2009, and then
increasing to $1.5m/MW in 2010 to reflect a recent trend toward smaller systems. Financing figures
are only available through 2013 since deployment figures are only available through 2015 (and there is
an assumed two-year lag between financing and deployment). Values are in nominal dollars.
Source: Bloomberg New Energy Finance; EPA Combined Heat and Power Partnership,
Catalogue of CHP Technologies, prepared by ICF, Inc.
Notes: ICF, Inc. reports that CHP capex has remained fairly constant since 2008. BNEF data
reflect capex for small CHP facilities powered by gas-fired reciprocating engines, gas turbines
and microturbines and are based on an internal survey among industry participants.
0.0
2.0
4.0
6.0
8.0
10.0
12.0
Fuel Cells Microturbines GasCombustion
Turbines
InternalCombustion
Engines
SteamTurbines
727
1,122
963872
1,425
1,019
1,271
703
0
200
400
600
800
1,000
1,200
1,400
1,600
2006 2007 2008 2009 2010 2011 2012 2013

106 © Bloomberg Finance L.P. 2017. Developed in partnership with The Business Council for Sustainable Energy.
Table of contents
8. Global context
1. Introduction
2. A look across
the US energy
sector
3. Natural gas
4. Large-scale
renewable
electricity and
CCS
2.1 Bird’s-eye view
2.2 Policy, finance, economics
4.1 Solar (PV, solar thermal)
4.2 Wind
4.3 Biomass, biogas, waste-to-
energy
4.4 Geothermal
4.5 Hydropower
4.6 CCS
5. Distributed
power and
storage
5.1 Small-scale solar
5.2 Small- and medium-scale wind
5.3 Small-scale biogas
5.4 Combined heat and power and
waste-heat-to-power
5.5 Fuel cells (stationary)
5.6 Energy storage
6. Demand-
side energy
efficiency
6.1 Energy efficiency
6.2 Smart grid and demand response
7. Sustainable
transportation
7.1 Electric vehicles
7.2 Natural gas vehicles
7.3 Biofuels

107 © Bloomberg Finance L.P. 2017. Developed in partnership with The Business Council for Sustainable Energy.
Deployment: Comparison of fuel cell technology performance and applications
Fuel cell
technology
Typical
system size
(kW)
Fuel type Electrical
efficiency
Combined heat
and power
capable
Applications Notable US
vendors
Molten
carbonate
(MCFC)
300-3,000 Natural gas,
hydrogen, biogas
45-50% Yes Distributed
generation, utility
FuelCell Energy
Solid oxide
(SOFC)
200-10,000 Natural gas,
hydrogen, biogas
53-65% Yes, but typically
heat is used
internally with the
system to increase
electrical efficiency
Distributed
generation, utility
Bloom Energy,
Edgewise Energy
Phosphoric acid
(PAFC)
100-500 Natural gas,
hydrogen, biogas
43% Yes, up to 90%
overall system
efficiency
Distributed
generation, utility
Doosan Fuel Cell
America
Alkaline (AFC) 10-100 Hydrogen 60% No Military, space
Polymer
electrolyte
membrane
(PEM)
1-100 Hydrogen 35-60% No Backup power,
distributed
generation,
transportation,
telecom, material
handling
equipment
Plug Power, Altergy
Systems, Nuvera
Fuel Cells
Direct methanol
fuel cell (DMFC)
<10 Methanol <40% No Auxiliary power,
telecom
Oorja Protonics,
PolyFuel Source: Bloomberg New Energy Finance, US Department of Energy, vendors
Notes: Most stationary fuel cells, regardless of fuel or chemistry, have capacity factors of 40-50% with over 99% availability. Fuel cells are scalable, and installation sizes can be very big; the sizes
shown here are typical numbers and in some cases reflect product sizes.

108 © Bloomberg Finance L.P. 2017. Developed in partnership with The Business Council for Sustainable Energy.
3.4 2.4 5.5 2.2 5.0 4.3 3.6
13.6
28.3
82.8
51.6
24.5 32.6
46.5
0
50
100
150
200
250
300
350
0
20
40
60
80
100
120
140
2003 2004 2005 2006 2007 2008 2009 2010 2011 2012 2013 2014 2015 2016*
Deployment: US stationary fuel cell build (MW)
Incremental Cumulative
● The 30% ITC for fuel cells was not extended beyond 2016 as part of the December 2015 budget bill.
● Fuel cell technology in the US has seen a decline in annual installs since reaching an all-time high in 2012. Installations did,
however, pick up between 2014 and 2016. Key developments in 2016 included:
˗ Bloom Energy announced a strategic alliance with PowerSecure to deploy 50MW of Bloom’s fuel cells at C&I sites through
long-term PPAs with customers such as Home Depot.
˗ FuelCell Energy’s 63.3MW Beacon Falls Connecticut project with O&G Industries and CT Energy & Technology is due to be
the largest fuel cell project in the US if completed. It did not secure a PPA under the state’s recent RFP but is continuing to
move forward on a separate development path and project permitting has been completed. FuelCell Energy also completed
the installation of a 5.6 MW facility at the Pfizer Research Center in Groton, Connecticut in 2016.
● Most fuel cell activity in the US is concentrated in five states: California, Connecticut, Delaware, New York and North Carolina.
● California’s Self-Generation Incentive Program (SGIP) historically subsidized many deployments in the state. But it will be reduced
starting 2017 (from $1.65/W for fuel cell CHP and $1.45/W for electric only in 2015 to $0.60/W for both). On the other hand, a bill
passed at the end of 2016 (AB 1637) extended a net energy metering program for fuel cells for an additional five years and lifted
the cap on eligible projects from 1MW to 5MW.
Source: Fuel Cells 2000, SGIP, Bloom Energy, Bloomberg New Energy Finance Notes: Fuel cells installed before 2003 are excluded due to their expected 10-year lifetime. *2016 data is preliminary.
Cumulative

109 © Bloomberg Finance L.P. 2017. Developed in partnership with The Business Council for Sustainable Energy.
Financing: Venture capital / private equity investment in US fuel cell companies ($m)
● In 2011, investment hit a peak of $390m, with $250m directed toward Bloom Energy.
● Venture capital investment fell after 2011 but generally remained higher than in prior years. Bloom once again led the pack in
2013, raising $130m from Credit Suisse. The other large investment in 2013 was a $36m round raised by ClearEdge Power;
that company was acquired by Doosan in July 2014, after raising $5m of VC funding earlier in the year.
● There was no venture capital / private equity investment in US-based fuel cell companies tracked in 2016 as of December
2016.
● Increased activities from companies like Bloom Energy, FuelCell Energy and acquisitions such as Korea-based Doosan’s
acquisition of United technologies Corp (UTC) in 2014 suggest bigger companies are using alternative forms of growth to
finance fuel cell project activities.
Source: Bloomberg New Energy Finance
Notes: Values include estimates for undisclosed deals and are in nominal dollars.
45 34 26
376
169 183
20
131
7
0
50
100
150
200
250
300
350
400
2008 2009 2010 2011 2012 2013 2014 2015 2016
PE
VC

110 © Bloomberg Finance L.P. 2017. Developed in partnership with The Business Council for Sustainable Energy.
Table of contents
8. Global context
1. Introduction
2. A look across
the US energy
sector
3. Natural gas
4. Large-scale
renewable
electricity and
CCS
2.1 Bird’s-eye view
2.2 Policy, finance, economics
4.1 Solar (PV, solar thermal)
4.2 Wind
4.3 Biomass, biogas, waste-to-
energy
4.4 Geothermal
4.5 Hydropower
4.6 CCS
5. Distributed
power and
storage
5.1 Small-scale solar
5.2 Small- and medium-scale wind
5.3 Small-scale biogas
5.4 Combined heat and power and
waste-heat-to-power
5.5 Fuel cells (stationary)
5.6 Energy storage
6. Demand-
side energy
efficiency
6.1 Energy efficiency
6.2 Smart grid and demand response
7. Sustainable
transportation
7.1 Electric vehicles
7.2 Natural gas vehicles
7.3 Biofuels
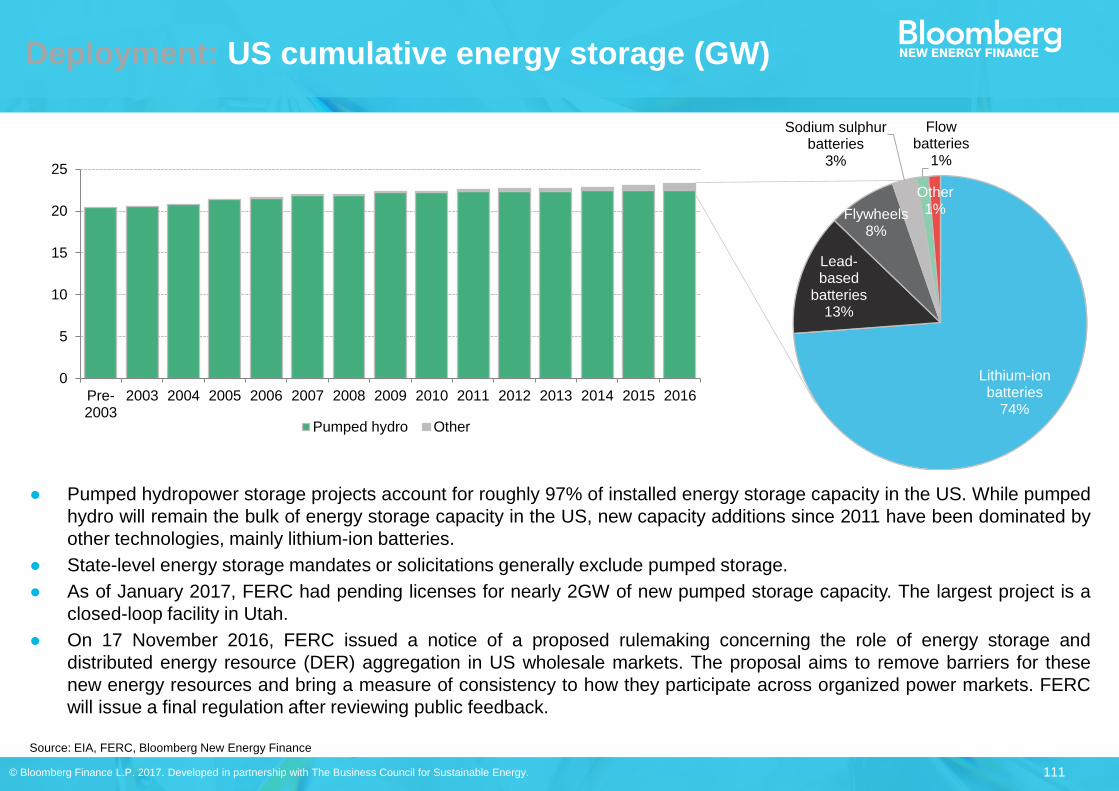
111 © Bloomberg Finance L.P. 2017. Developed in partnership with The Business Council for Sustainable Energy.
0
5
10
15
20
25
Pre-2003
2003 2004 2005 2006 2007 2008 2009 2010 2011 2012 2013 2014 2015 2016
Pumped hydro Other
Deployment: US cumulative energy storage (GW)
● Pumped hydropower storage projects account for roughly 97% of installed energy storage capacity in the US. While pumped
hydro will remain the bulk of energy storage capacity in the US, new capacity additions since 2011 have been dominated by
other technologies, mainly lithium-ion batteries.
● State-level energy storage mandates or solicitations generally exclude pumped storage.
● As of January 2017, FERC had pending licenses for nearly 2GW of new pumped storage capacity. The largest project is a
closed-loop facility in Utah.
● On 17 November 2016, FERC issued a notice of a proposed rulemaking concerning the role of energy storage and
distributed energy resource (DER) aggregation in US wholesale markets. The proposal aims to remove barriers for these
new energy resources and bring a measure of consistency to how they participate across organized power markets. FERC
will issue a final regulation after reviewing public feedback.
Source: EIA, FERC, Bloomberg New Energy Finance
Lithium-ion batteries
74%
Lead-based
batteries13%
Flywheels8%
Sodium sulphur batteries
3%
Flow batteries
1%
Other1%

112 © Bloomberg Finance L.P. 2017. Developed in partnership with The Business Council for Sustainable Energy.
Deployment: US announced and commissioned energy storage projects, as of December 2016 (MW)
Source: Bloomberg New Energy Finance Note: Does not include underground compressed air energy storage, pumped hydro, or lead-acid batteries for non-grid applications; minimum threshold for
projects is either 100kW or 100kWh, includes projects announced up through December 2016. Note that the whole Alevo’s 200MW project with Customized Energy Solutions is not included because its
exact locations are not yet announced.
0.4 AL
59.8 AK
31.0 AZ -
AR
1,209 CA
2.8 CO
1.7 CT
- DC
9.0 DE
9.5 FL
1.0 GA
61.9 HI
5.1 ID
239 IL
26.1 IN
-IA
0.1 KS
1.0 KY
0.5 LA
1.3 ME
10.5 MD
9.4 MA2.6 MI
2.4 MN
-MS
4.1 MO
0.1 MT
-NE
50.0 NV
0.6 NH
16.4 NJ
3.6 NM
90.5 NY
6.1 NC
-ND
76.3 OH
0.4 OK
10.7 OR
146 PA
- RI
-SC
-SD
0.1 TN
74.0 TX
5.2 UT
5.4 VT
0.2 VA
20.2 WA
67.0 WV
-WI-
WY
2,261 US
AL AZ CA CT DE GA ID IN KS LA MD MI MS MT NV NJ NY ND OK PA SC TN UT VA WV WY
< 5MW
5-55MW
> 55MW
No storage
CA: 1.3GW
storage
mandate by
2020
HI: KIUC
SolarCity 20-year
PPA 17MW solar
+ storage
HECO plans at
least 90MW
PJM: 265MW+
operational for
frequency regulation
NY: Brooklyn-
Queens Demand
Management
contracts storage
for distribution
deferral
IN: 20MW AES
Indiana project first
project in MISO
VT: 4.3MW
installed in
microgrid projects
MA: DOER
agrees to have an
energy storage
mandate
OR: 5MWh
procurement
target by 2020
for PGE and
PacificCorp
WA: $14.3m grant for
storage projects
AZ: TEP awarded two
10MW projects, APS
develops two 2MW
projects
FL: FPL BMW second life
Miami energy storage pilot
NC: Duke Energy
commits to
develop at least
5MW
1,229

113 © Bloomberg Finance L.P. 2017. Developed in partnership with The Business Council for Sustainable Energy.
Deployment: US non-hydropower announced energy storage capacity (MW)
● The US remains the most dynamic energy storage market globally, with a variety of new business and financing models being
deployed across the sector. Project activity has tended to be erratic, but new announced projects grew markedly in 2014-16.
● Most activity between 2009-2014 was policy-driven. The 2009 American Recovery and Reinvestment Act (ARRA) funded the
majority of projects commissioned between 2011 and 2014.
● Since 2014, however, energy storage procurements in California have focused on contracting projects to supply Resource
Adequacy (for system capacity) for the Californian grid, many of which will be delivered after 2019. In 2016, California
additionally contracted 67MW-196.6MWh of energy storage projects to mitigate expected gas shortages due to the earlier
leaks from the Aliso Canyon gas storage facility. These were delivered in four months, a record time from contracting to
delivery. Most were expected to be commissioned by December 31.
Incremental Cumulative
Source: Bloomberg New Energy Finance Notes: Does not include pumped hydropower, underground compressed air energy storage, or flooded lead-acid batteries. Minimum project size for inclusion in this
analysis is 100kW or 100kWh.
Announced Mix of applications for announced projects
(% by MW)
1 - 4
752
43 25
85 42
19 40
12 16 7
320
-
55
2 22
0 5 51
24 16
302
233
171 129
399
69 80 94
12
4,085
-
500
1,000
1,500
2,000
2,500
3,000
3,500
4,000
4,500
0
100
200
300
400
500
600
700
800
Q1
Q2
Q3
Q4
Q1
Q2
Q3
Q4
Q1
Q2
Q3
Q4
Q1
Q2
Q3
Q4
Q1
Q2
Q3
Q4
Q1
Q2
Q3
Q4
Q1
Q2
Q3
Q4
Q1
Q2
Q3
Q4
2009 2010 2011 2012 2013 2014 2015 2016
0%
10%
20%
30%
40%
50%
60%
70%
80%
90%
100%
2008 2009 2010 2011 2012 2013 2014 2015 2016
Other
End user
Distribution - Investmentdeferral
Transmission - Investmentdeferral
Renewables integration
System capacity
Frequency regulation
Price arbitrage

114 © Bloomberg Finance L.P. 2017. Developed in partnership with The Business Council for Sustainable Energy.
Deployment: US non-hydropower commissioned energy storage capacity (MW)
● Most of the commissioned energy storage capacity in the US since 2012 has been for the PJM frequency regulation market.
There is over 280MW of energy storage providing frequency regulation in the PJM RegD market, which saw a rush of projects
commissioned in 2015 and early 2016.
● In the end of 2016, at least 55MW/220MWh of energy storage projects were commissioned in California to support the gas
shortages expected from Aliso Canyon gas storage facility leak mitigation efforts.
● Beyond California and PJM, there have been many smaller projects commissioned in many other states such as Hawaii,
Washington, New York and Massachusetts.
Incremental Cumulative
Source: Bloomberg New Energy Finance Notes: Does not include pumped hydropower, underground compressed air energy storage, or flooded lead-acid batteries. Minimum project size for inclusion in
this analysis is 100kW or 100kWh.
Commissioned Mix of applications for commissioned projects
(% by MW)
0%
10%
20%
30%
40%
50%
60%
70%
80%
90%
100%
2008 2009 2010 2011 2012 2013 2014 2015 2016
Other
End-user
Distribution-level
Transmission-level
Renewables integration
System capacity
Frequency regulation
Price arbitrage
1 - - -6
- - 0 0 -
22
44
6 7
19 24
2
16
45
8 5
10 7
22
6
47
14
132
35 34
2
129
171
814
-
100
200
300
400
500
600
700
800
900
0
20
40
60
80
100
120
140
Q1
Q2
Q3
Q4
Q1
Q2
Q3
Q4
Q1
Q2
Q3
Q4
Q1
Q2
Q3
Q4
Q1
Q2
Q3
Q4
Q1
Q2
Q3
Q4
Q1
Q2
Q3
Q4
Q1
Q2
Q3
Q4
2009 2010 2011 2012 2013 2014 2015 2016

115 © Bloomberg Finance L.P. 2017. Developed in partnership with The Business Council for Sustainable Energy.
Deployment: Mix of technologies for US non-hydropower energy storage for announced projects (% by MW)
Source: Bloomberg New Energy Finance Notes: Pumped hydropower storage is not included in this chart as it would dwarf all other technologies. ‘Other’ refers to applications not represented in the
legend; many of these are government funded technology testing or pilot projects to prove concepts. The application categories have been revised since last year’s edition of the Factbook to better
represent market terminology and trends.
Announced Commissioned
● The lithium-ion battery has been the technology of choice for developers of projects of all sizes, because:
˗ It is widely available and mass produced all over the world;
˗ It can provide high power for short-duration applications (eg frequency regulation) and up to four hours of energy capacity
for longer-duration applications (eg investment deferral, arbitrage);
˗ It has a long track record of reliability and high performance;
˗ Projects using batteries produced by larger lithium-ion manufacturers are more bankable due to the perceived risk of
emerging companies. In 2014, two prominent pure-play companies (Xtreme Power, A123 System) filed for Chapter 11.
● New technologies are in the works, receiving some investment and securing a few commercial-scale contracts.
0%
20%
40%
60%
80%
100%
2008 2009 2010 2011 2012 2013 2014 2015 2016
Compressed air energy storage Sodium sulphur batteries Lithium-ion batteries Lead-based batteries Flow batteries
Flywheels Supercapacitors Sodium nickel chloride batteries Zinc Air Other
0%
10%
20%
30%
40%
50%
60%
70%
80%
90%
100%
2008 2009 2010 2011 2012 2013 2014 2015 20160%
10%
20%
30%
40%
50%
60%
70%
80%
90%
100%
2008 2009 2010 2011 2012 2013 2014 2015 2016

116 © Bloomberg Finance L.P. 2017. Developed in partnership with The Business Council for Sustainable Energy.
Financing: Venture capital / private equity investment in US energy storage companies ($m)
● There has been nearly $4bn invested by VC/PEs in US energy storage companies since 2006, including $352m in 2016
according to the latest available data.
● The top four disclosed investments for stationary storage in 2016 were:
˗ $36.5m for Sunverge, a California-based distributed solar and storage provider which received a third round of
investment from the Australian utility AGL Energy, as well as from Siemens Venture Capital, Softbank China Venture
Capital and Australian Renewable Energy Agency;
˗ $33.2m for Aquion Energy, a Pennsylvania-based saltwater battery manufacturer designed for daily deep cycling, which
received this funding from undisclosed investors;
˗ $23m in Eos Energy Storage, a zinc air battery company that received investment from Yorktown Partners and AltEnergy
˗ $16m for ViZn Energy Systems, a zinc-iron redox flow battery technology developer that also received its funding from
undisclosed investors.
● There was renewed interest in alternative technologies to lithium-ion throughout 2016. Energy storage software providers and
management companies also secured considerable funding over the same period, which underlined their growing
importance. These companies included Stem ($15m) and Geli ($7m). Source: Bloomberg New Energy Finance Note: Values include estimates for undisclosed deals and are in nominal dollars.
275
464
256 237
363
565
191 149
711
373 352
0
100
200
300
400
500
600
700
800
2006 2007 2008 2009 2010 2011 2012 2013 2014 2015 2016
PE
VC

117 © Bloomberg Finance L.P. 2017. Developed in partnership with The Business Council for Sustainable Energy.
Table of contents
8. Global context
1. Introduction
2. A look across
the US energy
sector
3. Natural gas
4. Large-scale
renewable
electricity and
CCS
2.1 Bird’s-eye view
2.2 Policy, finance, economics
4.1 Solar (PV, solar thermal)
4.2 Wind
4.3 Biomass, biogas, waste-to-
energy
4.4 Geothermal
4.5 Hydropower
4.6 CCS
5. Distributed
power and
storage
5.1 Small-scale solar
5.2 Small- and medium-scale wind
5.3 Small-scale biogas
5.4 Combined heat and power and
waste-heat-to-power
5.5 Fuel cells (stationary)
5.6 Energy storage
6. Demand-
side energy
efficiency
6.1 Energy efficiency
6.2 Smart grid and demand response
7. Sustainable
transportation
7.1 Electric vehicles
7.2 Natural gas vehicles
7.3 Biofuels

118 © Bloomberg Finance L.P. 2017. Developed in partnership with The Business Council for Sustainable Energy.
Policy: US states with EERS and decoupling legislation for electricity and natural gas, 2016 (number of states)
Electricity Natural Gas
● Energy efficiency resource standards (EERS) and decoupling are both key drivers for utility spending on energy efficiency,
which makes up the bulk of formal energy efficiency spending in the US.
● New Hampshire was the only state to introduce a new electricity EERS in 2016. Illinois raised the efficiency target of its
largest utility, Commonwealth Edison. New Hampshire introduced a natural gas EERS in 2016, and Vermont’s scheme is in
the implementation process. Ohio removed its EERS freeze, effective 2017.
● Unlike in 2014 and 2015, there were no states to turn their back on EERS targets in 2016. The uptake of EERS has slowed in
the past few years, but there is currently no momentum for its reversal either.
Source: ACEEE, Bloomberg New Energy Finance
Notes: Decoupling includes all lost revenue adjustment mechanisms, but no longer includes pending policies as per a methodology change in ACEEE reporting.
0
10
20
30
40
50
1990 1995 2000 2005 2010 2015
Decouplingonly
EERS only
EERS &decoupling
0
10
20
30
40
50
1990 1995 2000 2005 2010 2015
Decouplingonly
EERS only
EERS &decoupling
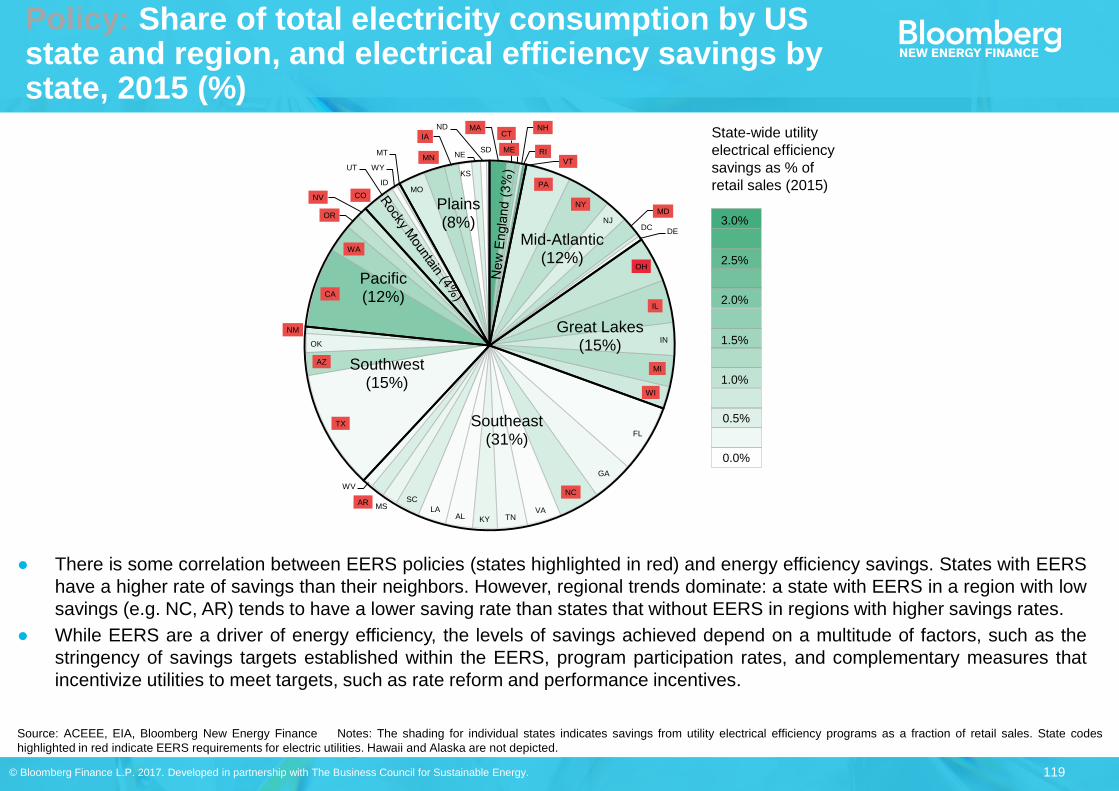
119 © Bloomberg Finance L.P. 2017. Developed in partnership with The Business Council for Sustainable Energy.
MACT
ME
NH
RI
VT
PA
NY
NJMD
DCDE
OH
IL
IN
MI
WI
FL
GA
NC
VATNKYAL
LA
SCMS
AR
WV
TX
AZ
OK
NM
CA
WA
OR
NV CO
UT
ID
WY
MT
MO
MN
IA
KS
NE
ND
SD
Plains(8%)
Mid-Atlantic(12%)
Great Lakes(15%)
Southeast(31%)
Southwest(15%)
Pacific(12%)
0.0%
0.5%
1.0%
1.5%
2.0%
2.5%
3.0%
Policy: Share of total electricity consumption by US state and region, and electrical efficiency savings by state, 2015 (%)
● There is some correlation between EERS policies (states highlighted in red) and energy efficiency savings. States with EERS
have a higher rate of savings than their neighbors. However, regional trends dominate: a state with EERS in a region with low
savings (e.g. NC, AR) tends to have a lower saving rate than states that without EERS in regions with higher savings rates.
● While EERS are a driver of energy efficiency, the levels of savings achieved depend on a multitude of factors, such as the
stringency of savings targets established within the EERS, program participation rates, and complementary measures that
incentivize utilities to meet targets, such as rate reform and performance incentives.
State-wide utility
electrical efficiency
savings as % of
retail sales (2015)
Source: ACEEE, EIA, Bloomberg New Energy Finance Notes: The shading for individual states indicates savings from utility electrical efficiency programs as a fraction of retail sales. State codes
highlighted in red indicate EERS requirements for electric utilities. Hawaii and Alaska are not depicted.
OH

120 © Bloomberg Finance L.P. 2017. Developed in partnership with The Business Council for Sustainable Energy.
MA CTME
NH RI
VT
PA
NY
NJ
MD
DC
DE
OH
IL
IN
MI
WI
FL
GA
NC
VA
TNKY
ALLA
SC
MS
AR
WV
TX
AZ
OK
NM
CA
WA
OR NV
CO
UT
ID
WY
MT
MO
MN
IA
KS
NE
ND
SD
Plains(6%)
Mid-Atlantic(14%)
Great Lakes(15%)
Southeast(26%)
Southwest(20%)
Pacific(12%)
0.00%
0.25%
0.50%
0.75%
1.00%
1.25%
1.50%
● The Southeast and Southwest, which account for 46% of US gas (end-use) consumption, have the lowest levels of savings.
● Interestingly, the regional trends identified on the previous slide for electricity are less dominant. EERS policies appear more
correlated with natural gas savings—states with EERS in a region with low savings (e.g. AZ, AR, KY) stand out from their
neighbors, as do states with no EERS in high-savings regions (e.g. PA, OH).
● The Great Lakes’ share of total natural gas consumption shrank one percentage-point between 2015 and 2016, while the
Southeast’s expanded by the same amount. The opposing direction of the changes in a region where EERS is popular (Great
Lakes) versus a region where it is not (Southeast) suggests that efficiency programs have a material impact.
State-wide natural
gas program
savings as % of
retail sales (2015)
Source: ACEEE, EIA, Bloomberg New Energy Finance Notes: The shading for individual states indicates savings from utility natural gas programs as a fraction of retail sales. State codes highlighted in
red indicate states with EERS requirements for natural gas utilities. Hawaii and Alaska are not depicted.
Policy: Share of total natural gas consumption by US state and region, and natural gas program savings by state, 2015 (%)
MACT
ME
NH
RI
VT
PA
NY
NJMD
DCDE
OH
IL
IN
MI
WI
FL
GA
NC
VATNKYAL
LA
SCMS
AR
WV
TX
AZ
OK
NM
CA
WA
OR
NV CO
UT
ID
WY
MT
MO
MN
IA
KS
NE
ND
SD
Plains(8%)
Mid-Atlantic(12%)
Great Lakes(15%)
Southeast(31%)
Southwest(15%)
Pacific(12%)
0.0%
0.5%
1.0%
1.5%
2.0%
2.5%
3.0%
MACT
ME
NH
RI
VT
PA
NY
NJMD
DCDE
OH
IL
IN
MI
WI
FL
GA
NC
VATNKYAL
LA
SCMS
AR
WV
TX
AZ
OK
NM
CA
WA
OR
NV CO
UT
ID
WY
MT
MO
MN
IA
KS
NE
ND
SD
Plains(8%)
Mid-Atlantic(12%)
Great Lakes(15%)
Southeast(31%)
Southwest(15%)
Pacific(12%)
0.0%
0.5%
1.0%
1.5%
2.0%
2.5%
3.0%
VT

121 © Bloomberg Finance L.P. 2017. Developed in partnership with The Business Council for Sustainable Energy.
Policy: US building floor space covered under state or local building energy use benchmarking / disclosure policies
Source: Institute for Market Transformation (IMT), US DOE’s Buildings Energy Data Book, Bloomberg New Energy Finance Notes: Accounts for overlap between cities and states (eg, no double-counting
between Seattle and Washington State numbers). Assumes that the Buildings Energy Data Book’s definition of floor space covered at least roughly corresponds to IMT’s definition. Shaded areas show
amount of floor space covered, diamonds represent percentage of US commercial sector floor space covered. Diamonds are spaced out in irregular intervals since data for the denominator (total
commercial sector floor space in the US) is available at irregular periods (2008, 2010, 2015e). The diamond for December 2014 assumes linear growth in the denominator over 2010-15. Previous editions of
the Factbook omitted Cambridge, MA as the floor space was still being tallied. Portland, ME is not shown this year for the same reason.
● States and cities have been creating building energy use policies, including building energy efficiency benchmarks and
mandates to disclose energy consumption.
● As of the end of 2016, 6.7bn square feet of commercial floor space, or around 8% of total US commercial sector floor space,
was covered by such policies. This represents an 3% uptick over the 2015 tally.
● In 2016, Pittsburgh and Portland, ME both enacted policies which will require large non-residential buildings to participate in
benchmarking and transparency programs (Portland, ME not shown in graph due to lack of data). City buildings are also
covered by the ordinances.
Floor space covered by benchmarking or
disclosure requirements (million sq ft) Percent of total US commercial sector floor space
covered by these requirements
0%
1%
2%
3%
4%
5%
6%
7%
8%
0
1,000
2,000
3,000
4,000
5,000
6,000
7,000Ja
n 0
7
Ju
n 0
7
No
v 0
7
Apr
08
Sep
08
Fe
b 0
9
Ju
l 09
De
c 0
9
Ma
y 1
0
Oct 1
0
Ma
r 1
1
Aug
11
Ja
n 1
2
Ju
n 1
2
No
v 1
2
Apr
13
Sep
13
Fe
b 1
4
Ju
l 14
De
c 1
4
Ma
y 1
5
Oct 1
5
Ma
r 1
6
Aug
16
Pittsburgh (PA)
Boulder (CO)
Portland (OR)
Atlanta (GA)
Berkeley (CA)
Cambridge (MA)
Montgomery County (MD)
Chicago (IL)
Boston (MA)
Minneapolis (MN)
Philadelphia (PA)
San Francisco (SF)
Seattle (WA)
New York City (NY)
Washington State
Austin (TX)
Washington DC
California
Percent covered
New York City
Washington DC
Chicago
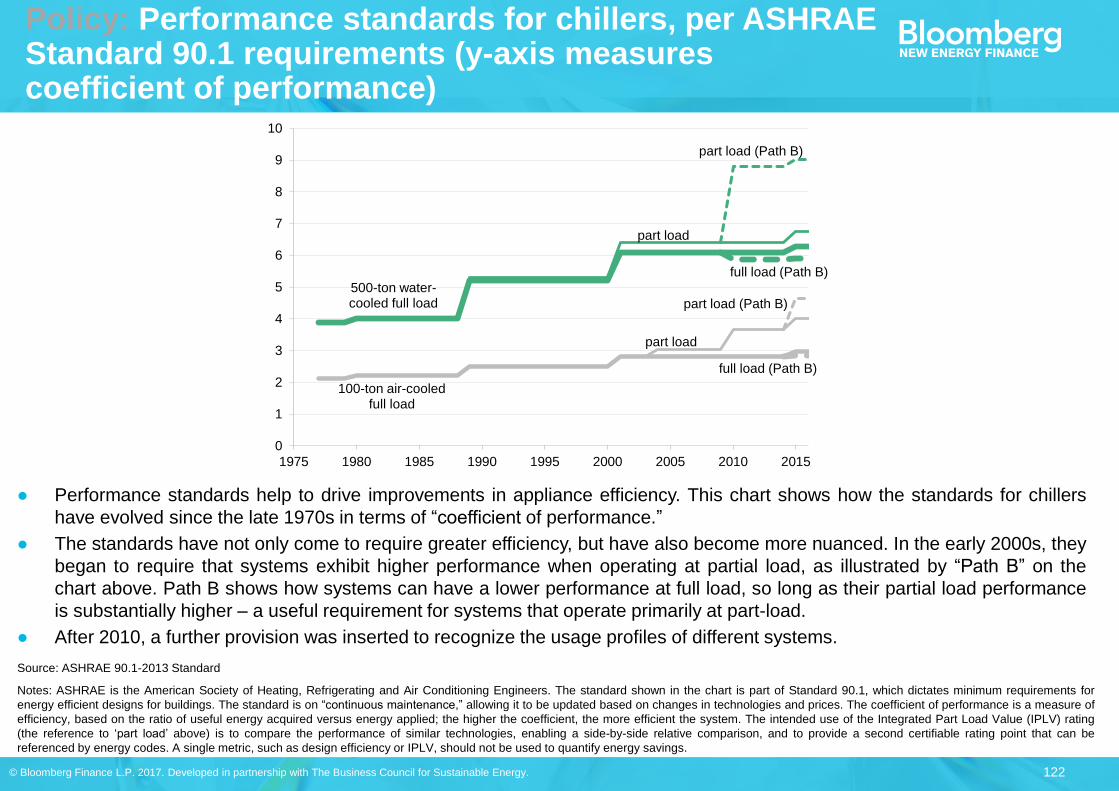
122 © Bloomberg Finance L.P. 2017. Developed in partnership with The Business Council for Sustainable Energy.
● Performance standards help to drive improvements in appliance efficiency. This chart shows how the standards for chillers
have evolved since the late 1970s in terms of “coefficient of performance.”
● The standards have not only come to require greater efficiency, but have also become more nuanced. In the early 2000s, they
began to require that systems exhibit higher performance when operating at partial load, as illustrated by “Path B” on the
chart above. Path B shows how systems can have a lower performance at full load, so long as their partial load performance
is substantially higher – a useful requirement for systems that operate primarily at part-load.
● After 2010, a further provision was inserted to recognize the usage profiles of different systems.
Policy: Performance standards for chillers, per ASHRAE Standard 90.1 requirements (y-axis measures coefficient of performance)
Source: ASHRAE 90.1-2013 Standard
Notes: ASHRAE is the American Society of Heating, Refrigerating and Air Conditioning Engineers. The standard shown in the chart is part of Standard 90.1, which dictates minimum requirements for
energy efficient designs for buildings. The standard is on “continuous maintenance,” allowing it to be updated based on changes in technologies and prices. The coefficient of performance is a measure of
efficiency, based on the ratio of useful energy acquired versus energy applied; the higher the coefficient, the more efficient the system. The intended use of the Integrated Part Load Value (IPLV) rating
(the reference to ‘part load’ above) is to compare the performance of similar technologies, enabling a side-by-side relative comparison, and to provide a second certifiable rating point that can be
referenced by energy codes. A single metric, such as design efficiency or IPLV, should not be used to quantify energy savings.
0
1
2
3
4
5
6
7
8
9
10
1975 1980 1985 1990 1995 2000 2005 2010 2015
500-ton water-cooled full load
100-ton air-cooled full load
part load
part load
part load (Path B)
full load (Path B)
part load (Path B)
full load (Path B)

123 © Bloomberg Finance L.P. 2017. Developed in partnership with The Business Council for Sustainable Energy.
● New buildings face increasingly stringent insulation requirements.
● There is also a growing effort to improve the energy efficiency of existing buildings. ICC and ASHRAE now require
insulation upgrades during the replacement of existing roofs. Due to the size of the market for “re-roofing,” this new focus
on existing buildings may impact building energy use more quickly than changes to new construction requirements.
● In 2016, six states adopted stricter residential and commercial building codes, including New York, Utah, Tennessee,
Massachusetts, Connecticut, and Ohio.
Policy: Thermal performance standards by building placement (R-values)
Source: PIMA (Polyisocyanurate Insulation Manufacturers Association), NAIMA (North American Insulation Manufacturers Association), based on standards from ASHRAE and ICC
Notes: Thermal performance standards as established by ASHRAE and ICC are given in R-values, a measure of a component’s resistance to heat transfer (greater R-value means more resistance – ie,
better insulation). ICC is the International Code Council. ASHRAE is the American Society of Heating, Refrigerating and Air Conditioning Engineers.
Residential buildings Commercial buildings
0
5
10
15
20
25
30
35
40
45
50
2006 2009 2012 2015
Ceilings
Above-gradewalls
Basementwalls
0
5
10
15
20
25
30
35
40
45
50
2006 2009 2012 2015
Roofs
Above-gradewalls
Steel-framedwalls

124 © Bloomberg Finance L.P. 2017. Developed in partnership with The Business Council for Sustainable Energy.
Policy: ACEEE state-by-state scorecard for energy efficiency policies, 2016
Source: ACEEE, EIA, Bloomberg New Energy Finance Notes: Numbers in parentheses at the bottom of the chart indicate 2015 ranking. Numbers in parenthesis at the top denote the change in score from
2015 levels. Diamond symbols indicate 2015 score within each category.
20
10
7
4
7
2
50
45 (
+1.5
)
45 (
+1)
40 (
+0.5
)
39.5
(+
3)
35.5
(+
0)
35.5
(+
3)
35 (
-1.5
)
34.5
(+
1)
32 (
-3)
31 (
+0)
27 (
+3.5
)
27 (
+3.5
)
26.5
(-4
.5)
24.5
(+
0)
24 (
+0.5
)
24 (
+2.5
)
24 (
-0.5
)
21 (
-1)
20.5
(-1
.5)
20 (
+3)
19.5
(+
0)
19 (
+2.5
)
19 (
+1)
17.5
(-1
.5)
16 (
+0.5
)
16 (
+3)
15.5
(+
2.5
)
15.5
(-0
.5)
15 (
-0.5
)
14.5
(+
0.5
)
14.5
(-2
)
13.5
(+
5)
13 (
-1)
13 (
+0)
12.5
(+
0)
12.5
(-0
.5)
12 (
-1)
12 (
-1)
11 (
+1.5
)
10.5
(+
0.5
)
10 (
+1)
9.5
(-1
.5)
9.5
(+
0.5
)
8 (
-3)
8 (
+0)
7 (
-0.5
)
6.5
(+
0.5
)
6 (
-2)
5 (
-1)
4.5
(-1
)
3 (
-1)
Ma
xim
um
1. C
A (
2)
1. M
A (
1)
3. V
T (
3)
4. R
I (4
)
5. C
T (
6)
5. N
Y (
9)
7. O
R (
4)
8. W
A (
8)
9. M
D (
7)
10. M
N (
10)
11. M
E (
14)
11. M
I (1
4)
13. IL
(10)
14. C
O (
12)
15. D
C (
14)
15. H
I (1
9)
15. IA
(12)
18. A
Z (
17)
19. P
A (
17)
20. U
T (
23)
21. N
H (
20)
22. D
E (
24)
22. W
I (2
2)
24. N
J (
21)
25. F
L (
27)
25. T
N (
31)
27. A
R (
31)
27. T
X (
26)
29. O
H (
27)
30. K
Y (
29)
30. N
C (
24)
32. M
O (
44)
33. ID
(29)
33. V
A (
31)
35. G
A (
37
)
35. N
M (
31)
37. M
T (
31)
37. N
V (
31)
39. A
L (
41)
40. S
C (
40)
41. A
K (
42)
42. IN
(38)
42. N
E (
42)
44. O
K (
38
)
44. W
V (
45
)
46. M
S (
47)
47. LA
(48)
48. K
S (
45)
49. S
D (
48)
50. W
Y (
50
)
51. N
D (
51)
Transportation Policies
Building energy codes
Combined Heat & Power
State Government
Initiatives
ApplianceStandards
Score
Utility & Public Benefits
Programs & Policies

125 © Bloomberg Finance L.P. 2017. Developed in partnership with The Business Council for Sustainable Energy.
40
289410
314
729
2,323
948
102
389
859
544404
750
'04 '05 '06 '07 '08 '09 '10 '11 '12 '13 '14 '15 '16
>$500m
$100m-$500m
$50m-$100m
$20m-$50m
<$20m
Policy: US federal ESPCs executed through the DOE’s umbrella agreement, by year and deal size
Number of ESPCs Total contract value of ESPCs ($m)
● The federal sector remains an important part of the energy-savings performance contract (ESPC) market, with long time
horizons and access to finance allowing ‘deep’ retrofits and cutting-edge projects.
● 2016 saw an uptick in contract values, no doubt in part due to President Obama’s target of completing $4bn in federal
performance-based energy efficiency deals by the end of 2016.
● Another noticeable trend in 2016 was the shift to larger individual projects. Fewer had a contract value below $50m than the
previous year and more were above $100m.
● Utility energy service contracts are another vehicle for federal energy efficiency, but data on their impact is limited.
Source: Federal Energy Management Program (FEMP), US Department of Energy (DOE), Bloomberg New Energy Finance
Notes: DOE’s umbrella agreement refers to indefinite-delivery, indefinite-quantity (IDIQ) contracts between the DOE and energy service companies. Totals here are summed in terms of calendar years in
order to facilitate comparison with government targets, as opposed to DOE sources which commonly sum over fiscal years. Values are in nominal dollars.
3
12
23
12
22
52
8 7 9
30
16
8 9
'04 '05 '06 '07 '08 '09 '10 '11 '12 '13 '14 '15 '16
>$500m
$100m-$500m
$50m-$100m
$20m-$50m
<$20m

126 © Bloomberg Finance L.P. 2017. Developed in partnership with The Business Council for Sustainable Energy.
Deployment: US commercial building energy intensity (kBtu/sq-ft)
● Between 1985 and 1995, the energy intensity of US commercial buildings decreased by an average of 0.6% year on year.
Between 1995 and 2005, energy intensity remained approximately constant. However, the fall in intensity picked up
momentum again between 2005 and 2015, when it shrank 0.4% on average year on year.
● The figures here are based on EIA data for overall consumption of the commercial sector; the latest information on total
commercial floor space; and other estimates on the consumption profile of the commercial sector based on previous editions
of the Commercial Buildings Energy Consumption Survey (CBECs).
Source: EIA, Bloomberg New Energy Finance
Notes: This analysis is based on (i) EIA data on US commercial building energy consumption and floor space for the years 1979, 1983, 1986,1989, 1992, 1995, 1999, 2003, 2012 and (ii) EIA data for total
US commercial sector energy consumption for every year between 1979-2013.
0
20
40
60
80
100
120
1980 1985 1990 1995 2000 2005 2010 2015
electricity
natural gas
other
kBtu/sq-foot

127 © Bloomberg Finance L.P. 2017. Developed in partnership with The Business Council for Sustainable Energy.
Deployment: Energy Star-certified floor space in US non-residential buildings by building type (bn sq-ft of floor space)
● As of 2016, 4.3bn sq-ft of US commercial building floor space was Energy Star-certified. This represents approximately 5% of
total floorspace in US commercial buildings.
● Although adoption of Energy Star certification has increased rapidly, year-on-year additions peaked in 2012 and have been
decreasing gradually since then. Likely reasons for this include the fact that some certified building are being re-certified, and
that there are fewer ‘easy wins’ in the form of uncertified large office buildings.
● Offices and educational buildings account for 74% of certified buildings. They are also the segments where certification is
growing most quickly, both in absolute terms (122 and 94 million sq-ft newly certified in 2016, respectively) and as a
proportion of their addressable market (new 2016 certifications accounted for 0.8% of total floorspace for those segments).
Certification in lodging is also picking up momentum, with 0.6% of the addressable market newly certified in 2016.
Source: EPA, Bloomberg New Energy Finance
0.0
0.5
1.0
1.5
2.0
2.5
3.0
3.5
4.0
4.5
'99 '00 '01 '02 '03 '04 '05 '06 '07 '08 '09 '10 '11 '12 '13 '14 '15 '16
Other
Mixed Use Property
Warehouse and Storage
Lodging
Healthcare
Mercantile
Education
Offices

128 © Bloomberg Finance L.P. 2017. Developed in partnership with The Business Council for Sustainable Energy.
Deployment: Energy Star-certified floor space and total floor space for US commercial buildings by sector and size, 2015
● Unsurprisingly, certification is concentrated in larger buildings. In offices, the majority of floorspace in buildings above 200,000
square feet are certified, meaning that new opportunities for certification must be found in smaller offices or other segments.
● A new trend in 2016 is the uptake of certification in lodgings. There is still a majority of large uncertified lodgings, so there is
room for Energy Star penetration to expand in this segment.
● There is a relatively high rate of certification in mid-size mercantile buildings. Larger mercantile buildings represent an as-yet
untapped opportunity.
Source: EPA, EIA, Bloomberg New Energy Finance
Notes: There is insufficient data for total US floor space of educational buildings in excess of 500,000ft2.
Total floorspace
Energy Star certified floorspace
Education
Healthcare
Warehouse and Storage
Offices
Mercantile
Lodging
1,000 -5,000 ft2
5,000 -10,000 ft2
10,000 -25,000 ft2
25,000 -50,000 ft2
50,000 -100,000 ft2
100,000 -200,000 ft2
200,000 -500,000 ft2
> 500,000ft2

129 © Bloomberg Finance L.P. 2017. Developed in partnership with The Business Council for Sustainable Energy.
95%
89%
56%
54%
46%
39%
39%
30%
24%
15%
5%
11%
44%
46%
54%
61%
61%
70%
76%
85%
0% 10% 20% 30% 40% 50% 60% 70% 80% 90% 100%
Laptops
Televisions
Clothes washers
Room air conditioners
Refrigerators
Air-source heat pumps
Desktops
Freezers
Central air conditioning
Clothes dryers
Energy Star certified Not Energy Star certified Certified 2014
Deployment: Percent of Energy Star-certified products sold by product type, 2015
● This chart shows a selection of energy-consuming products and the percent of units sold that were Energy Star-certified.
● Of the products considered, laptop computers have the highest rates of certification, 95%. This is in contrast to desktop
computers, where it is just 39%. Because energy efficiency also impacts laptop battery life, there is an additional incentive for
consumers to opt for an efficient option. This is a likely explanation for the difference.
● In most cases the uptake of certified products is increasing. However for clothes washers, room air-conditioners and
refrigerators this was not the case. Possible reasons for running contrary to the broader trend could include the introduction of
new, more stringent, certification standards and the introduction of new products that are not certified.
Source: Energy Star Note: Non-exhaustive selection of appliances; share of certified appliances sold is based on sales data compiled by Energy Star; “Lamps” refer to share of Energy-star certified lamps
out of the total lamps market, including incandescent and halogen lamps. Share of household consumption takes EIA data on household consumption by end-use in 2014.

130 © Bloomberg Finance L.P. 2017. Developed in partnership with The Business Council for Sustainable Energy.
7.89.9 10.6
13.1
18.422.9 23.0 24.4 25.4 26.5
0.0%
0.1%
0.2%
0.3%
0.4%
0.5%
0.6%
0.7%
0
5
10
15
20
25
30
35
2006 2007 2008 2009 2010 2011 2012 2013 2014 2015
Utility electricity savings (right-hand axis) % of savings as a percentage of retail sales (left-hand axis)
Savings (TWh) Proportion of retail sales
Deployment: Incremental annual energy efficiency achievements by electric utilities to date (TWh)
● Between 2006 and 2011, incremental annual energy efficiency savings by electric utilities grew 24% year on year. This
coincides with the uptake of both energy efficiency resource standards (EERS) and decoupling legislation in many states.
● Although savings continued to increase after 2011, it was at a slower rate. In 2015, savings grew 4% on 2014 levels. This
coincides with a slowdown in the number of new states adding EERS.
● States with the highest incremental savings as a percentage of total retail sales in 2015 were Rhode Island (2.9%),
Massachusetts (2.7%), Vermont (2.0%) and California (2.0%).
● States with notable increases in incremental savings were Washington (+0.4% as a fraction or retail sales, 39% year-on-year
growth), California (+0.4%, 23%) and Maine (+0.3%, 26%).
Source: ACEEE Note: The ACEEE Scorecard points to caveats in the energy efficiency savings data reported by states. Historically, ACEEE uses a standard factor of 0.9 to convert gross savings to net
savings for those states that report in gross rather than net terms. For 2016, ACEEE adjusted this to 0.817 based on the median net-to-gross ratio calculated from states that report both figures.

131 © Bloomberg Finance L.P. 2017. Developed in partnership with The Business Council for Sustainable Energy.
Deployment: GHG savings as a result of energy efficiency achievements by electric utilities to date, 2013-15 (MtCO2e)
● Electric utility energy efficiency programs saved a total of 34.2MtCO2e in greenhouse gas emissions from 2013 to 2015.
Nearly 16% of the savings were due to efforts made in California.
● Pennsylvania, Ohio and Illinois are the next largest savers, respectively, followed by Massachusetts and New York.
Source: Bloomberg New Energy Finance, ACEEE
Note: Uses ACEEE data on electric efficiency program savings and Bloomberg Terminal data on historical emissions factors. Emissions factors are calculated assuming that the displaced consumption
would have been generated by the marginal natural gas combined-cycle unit; data on historical power and natural gas prices are used to calculate an implied heat rate for the marginal unit.
0
1
2
3
4
5
6
Ala
ba
ma
Ala
ska
Arizo
na
Ark
ansa
sC
alif
orn
iaC
olo
rado
Co
nn
ecticut
De
law
are
Dis
tric
t o
f C
olu
mb
iaF
lorid
aG
eo
rgia
Ha
wa
iiId
ah
oIllin
ois
Ind
ian
aIo
wa
Kan
sa
sK
en
tucky
Lou
isia
na
Ma
ine
Ma
ryla
nd
Ma
ssa
chu
sett
sM
ichig
an
Min
neso
taM
issis
sip
pi
Mis
sou
riM
on
tan
aN
ebra
ska
Ne
vad
aN
ew
Ha
mp
shir
eN
ew
Jers
ey
Ne
w M
exic
oN
ew
York
No
rth
Caro
lina
No
rth
Dako
taO
hio
Okla
ho
ma
Ore
go
nP
en
nsylv
an
iaR
hod
e Isla
nd
Sou
th C
aro
lina
Sou
th D
ako
taT
enn
essee
Te
xas
Uta
hV
erm
ont
Virg
inia
Wa
sh
ing
ton
We
st
Vir
gin
iaW
iscon
sin
Wyo
min
g
2013 2014 2015

132 © Bloomberg Finance L.P. 2017. Developed in partnership with The Business Council for Sustainable Energy.
● Because producing aluminum from secondary sources (ie, recycled post-consumer and industrial scrap) consumes
significantly less energy than making new aluminum, the industry provides insights into industrial sector adoption of energy
efficiency.
● The share of aluminum pulled from secondary sources exceeded 70% for the first time in 2015, up from 48% in 2000 and only
25% in 1980.
● Scrap recycling rose 18% from the previous to the current decade, partly due to the addition of imported cans into the US
recycling stream.
Deployment: US aluminum recycling trends
US production of primary vs. secondary
aluminum
Average annual aluminum scrap recovery by
decade (billions of pounds)
Source: The Aluminum Association, US Geological Survey, US Department of Interior, US
Department of Commerce
Notes: Not shown here is the considerable share of aluminum imports consumed in the US,
which have historically met around 45% of US demand.
Source: The Aluminum Association, Can Manufacturers Institute, Institute of Scrap
Recycling Industries
0%
10%
20%
30%
40%
50%
60%
70%
80%
90%
100%
198
0
198
2
198
4
198
6
198
8
199
0
199
2
199
4
199
6
199
8
200
0
200
2
200
4
200
6
200
8
201
0
201
2
201
4Primary Secondary
0
1,000
2,000
3,000
4,000
5,000
6,000
1980s 1990s 2000s 2010s

133 © Bloomberg Finance L.P. 2017. Developed in partnership with The Business Council for Sustainable Energy.
By framework By sector
● Utility spending on energy efficiency remains the largest and fastest growing source of spending in this segment, accounting
for 59% of investment in energy efficiency through formal frameworks.
● Energy-savings performance contracts (ESPC) are predominantly focused on public buildings. In 2015, ESPC spending for
all measured sectors hit $5.3bn, bringing the five-year total to $26bn. Data from the Lawrence-Berkeley National Laboratory
(LBNL) suggest that the ESPC market also averaged an estimated $5.3bn per year from 2011 to 2015. Anecdotal evidence
collected by LBNL reveals that this figure may be incomplete, in part due to increased competition from smaller, non-
traditional energy service companies (ESCOs), which do not meet LBNL’s criteria for inclusion in the dataset graphed above.
Source: ACEEE, NAESCO, LBNL, CEE, IAEE, Bloomberg New Energy Finance Notes: The values for the 2015 ESPC market size shown here are estimates. The most recent published data from LBNL
puts reported revenues at $5.3bn in 2014. The $5.3bn estimate for 2015 is based on a continuation of 2011-14 growth rates.
Financing: US estimated investment in energy efficiency through formal frameworks ($bn nominal)
0
2
4
6
8
10
12
14
'90 '95 '00 '05 '10 '15
Other
Publicbuildings
Commercial& Industrial
Residential
0
2
4
6
8
10
12
14
'90 '95 '00 '05 '10 '15
ESPC
UtilityESPC
Utilityspending

134 © Bloomberg Finance L.P. 2017. Developed in partnership with The Business Council for Sustainable Energy.
● In line with the trend of EERS-driven utility efficiency programs, utility efficiency spending grew rapidly between 2006 and
2011. Growth continued after 2011, but at a slower rate.
● Growth appears to have picked up again in 2014 and 2015. It should be noted, however, that 2014 and 2015 data came from
different sources, since CEE data is currently not available for 2015. The 12% jump in 2015 is likely an exaggeration; the
ACEEE estimates a more modest 4% growth in 2015.
● Expenditure in California grew from $1,580m in 2013 to $1,715m in 2014, the largest upswing of any state.
Source: CEE, ACEEE, Bloomberg New Energy Finance. Note: *Data for 2010-14 was sourced from CEE, and for 2006-2009 and 2015 from the ACEEE.
Financing: US utility energy efficiency spending ($bn)
1.62.2
2.63.0
3.9
4.7 4.8 5.0
5.6
6.3
0.30.3
0.60.8
0.8
1.0 1.1 1.2
1.3
1.4
1.9
2.5
3.23.8
4.7
5.7 6.0 6.1
6.9
7.7
0
1
2
3
4
5
6
7
8
9
10
2006 2007 2008 2009 2010 2011 2012 2013 2014 2015
Naturalgas
Electric
+34%
+25%+18%
+26%
+20%+4%
+3% +13%
+12%*

135 © Bloomberg Finance L.P. 2017. Developed in partnership with The Business Council for Sustainable Energy.
Cost of energy savings under ESPCs Total contract value of the ESPCs ($m)
● The cost of energy saved under energy savings performance contracts (ESPCs) ranges widely, due to a number of factors
such as differences in the type of energy saved, differences in the price of energy saved and the fact that other necessary
infrastructure upgrades are sometimes added on top of energy savings projects, in a way that drives up cost.
● Having said this, it appears that in the past two years, the range for federal ESPCs has somewhat narrowed, with the majority
of projects and investment implicitly valuing saved energy in the range 10-20¢/kWh. This is roughly in line with the cost of
electricity, suggesting that more projects are being approved on the basis of energy-saving economics than in the past.
Source: Federal Energy Management Program (FEMP), US Department of Energy (DOE), Bloomberg New Energy Finance
Notes: DOE’s umbrella agreement refers to indefinite-delivery, indefinite-quantity (IDIQ) contracts between the DOE and energy service companies. LCOE is calculated using 5% discount rate.
Economics: US federal ESPC activity executed through the DOE’s umbrella agreement, grouped by cost of saved energy (x-axis), 1998-2015
2 3
46
108115
52
113
<1¢/k
Wh
1-2
¢/k
Wh
2-5
¢/k
Wh
5-1
0¢
/kW
h
10-2
0¢/k
Wh
20-5
0¢/k
Wh
50-1
00¢/k
Wh
>100¢/k
Wh
2016
2015
Pre 2015
Levelizedcost of saved energy
13 109
1,432
2,419
2,922
1,3991,146
21
<1¢/k
Wh
1-2
¢/k
Wh
2-5
¢/k
Wh
5-1
0¢
/kW
h
10-2
0¢/k
Wh
20-5
0¢/k
Wh
50-1
00¢/k
Wh
>100¢/k
Wh
2016
2015
Pre 2015
Levelizedcost of saved energy

136 © Bloomberg Finance L.P. 2017. Developed in partnership with The Business Council for Sustainable Energy.
Table of contents
8. Global context
1. Introduction
2. A look across
the US energy
sector
3. Natural gas
4. Large-scale
renewable
electricity and
CCS
2.1 Bird’s-eye view
2.2 Policy, finance, economics
4.1 Solar (PV, solar thermal)
4.2 Wind
4.3 Biomass, biogas, waste-to-
energy
4.4 Geothermal
4.5 Hydropower
4.6 CCS
5. Distributed
power and
storage
5.1 Small-scale solar
5.2 Small- and medium-scale wind
5.3 Small-scale biogas
5.4 Combined heat and power and
waste-heat-to-power
5.5 Fuel cells (stationary)
5.6 Energy storage
6. Demand-
side energy
efficiency
6.1 Energy efficiency
6.2 Smart grid and demand response
7. Sustainable
transportation
7.1 Electric vehicles
7.2 Natural gas vehicles
7.3 Biofuels

137 © Bloomberg Finance L.P. 2017. Developed in partnership with The Business Council for Sustainable Energy.
Deployment: Incentive-based demand response capacity by US ISO/RTO (GW), 2008/09–15/16
● Over 40% of US wholesale demand response (DR) is within the PJM capacity market – the largest opportunity for DR
worldwide. 2015/16 represents a peak year as new rules introduced by PJM have limited the role of DR within the market.
Volumes have subsequently declined in the three-year ahead auction; in the May 2016 auction, DR secured only 10.3GW.
● The bulk of MISO’s DR capacity is emergency resources that are not directly dispatchable but operated through utility
programs. CAISO’s capacity is also administered by utilities but includes a large share of real-time and day-ahead
dispatchable capacity.
● The resolution of FERC 745 has brought a measure of stability to the DR industry. Across the US, ISO/RTOs are exploring
reforms and mechanisms that will increase the penetration of DR and aggregated distributed energy resources within their
markets.
Source: Bloomberg New Energy Finance; ISO/RTOs
Notes: Capacity shown by delivery years which run June through May.
3.47.2 9.3 10.3
7.09.3
14.1 14.812.4
10.4
10.9 8.1 7.3
8.3
10.0
10.411.7
11.8
1.5
1.5 1.6 1.61.9
2.1
2.32.6
2.5
3.3
3.32.1 2.2
2.4
2.2
2.32.2
1.9
1.7
2.02.5 2.2
2.4
1.7
1.31.2
1.3
2.0
2.31.7 1.7
1.8
2.1
2.12.0
1.1
22.4
27.225.4 25.4
23.9
27.4
32.634.5
31.0
0.0
5.0
10.0
15.0
20.0
25.0
30.0
35.0
2008/09 2009/10 2010/11 2011/12 2012/13 2013/14 2014/15 2015/16 2016/17
ISO-NE
NYISO
CAISO
ERCOT
MISO
PJM

138 © Bloomberg Finance L.P. 2017. Developed in partnership with The Business Council for Sustainable Energy.
Deployment: US electric smart meter deployments
● Smart meter installations hit a peak in 2010 and 2011, supported by stimulus funding awarded in 2009. Most of the largest US
utilities took advantage of the Smart Grid Investment Grant to roll out smart meters across their territories. As grant funding
dried up, deployments slowed, hitting a trough in 2014. Smart metering activity has since increased as smaller utilities receive
regulatory approval to move forward with the technology.
● The greatest cost saving for utilities from smart metering is replacing the need for manual meter reads. Today, 44% of US
electricity customers now have a smart meter, while a further 29% have less advanced, automated meters. However, growing
penetration of distributed energy and a regulatory push for dynamic retail tariffs is creating additional need for the technology.
● For example, in New York, where smart meters have largely been ignored to date, utilities are now planning widespread
installations in order to achieve the goals of the Reforming the Energy Vision process. Smart meters will enable dynamic
tariffs, improve customer data and potentially support other residential energy technologies.
Incremental Cumulative
Source: Bloomberg New Energy Finance, EIA
Notes: Includes data for smart electricity meters, excludes automated meters. Smart meters are defined as those capable of two-way communication over a fixed network.
US smart meter deployments (million units) Smart meters deployed as a percentage of US
electricity customers
3.65.9
12.2 12.6
10.0
5.24.1
6.7 5.9
0
10
20
30
40
50
60
70
80
0
2
4
6
8
10
12
14
2008 2009 2010 2011 2012 2013 2014 2015 2016
CumulativeAnnual
0%
10%
20%
30%
40%
50%
2008 2009 2010 2011 2012 2013 2014 2015 2016

139 © Bloomberg Finance L.P. 2017. Developed in partnership with The Business Council for Sustainable Energy.
Financing: US smart grid spending by segment ($bn)
● Installation of smart meters accounted for over half of US smart grid investment until 2013, when it dropped off significantly.
Expenditure on smart meters has rebounded from its low in 2014, but remains less than half its 2011 peak.
● Distribution automation spending has steadily increased each year. These investments represent utility projects within the
distribution system to reduce outage frequency and durations and to more efficiently manage electricity flow within the grid.
As the penetration of distributed energy resources increases, some utilities are ramping up investment in automation to
manage the growing complexity of the distribution grid.
● Advanced smart grid projects account for a diminishing share of overall investment. Much of this expenditure went into pilot
projects funded by the Smart Grid Investment Grant, which provided $4.5bn to modernize the US electricity grid. As these
projects wind down, utilities are exploring opportunities to deploy successful technologies where appropriate.
Source: Bloomberg New Energy Finance
Notes: The ‘advanced smart grid’ category includes cross-cutting pilot projects, such as those involving load control, home energy management and EV charging.
0.71.7
3.0 3.12.6
1.3 0.91.5 1.5
0.6
0.8
1.0 1.21.3
1.41.5
1.6 1.7
0.50.8
1.0
0.70.3
1.3
2.6
4.65.1 4.9
3.5
2.8
3.4 3.4
2008 2009 2010 2011 2012 2013 2014 2015 2016
Advanced smart grid Distribution automation Smart metering

140 © Bloomberg Finance L.P. 2017. Developed in partnership with The Business Council for Sustainable Energy.
Economics: US average smart meter cost ($ per meter installed)
● So far this decade, metering costs have remained between $230 and $260 per meter, despite the installed base of meters
more than doubling during the same time frame.
● Unlike Europe, where extensive competition from Asian metering vendors has placed downwards pressure on prices, US
utilities have benefited from higher quality devices but at fairly level prices.
● Many meter vendors are using in-house development and acquisitions to offer new products and services such as data
analytics and asset management. These are billed on a subscription basis, so while the up-front cost of smart metering has
remained constant, ongoing utility expenditure on the technology is increasing.
Source: Bloomberg New Energy Finance
Notes: Cost per meter includes meters, communication infrastructure, associated IT spending and installation costs. Data based on total annual smart meter investment market size and total smart meters
installed in a given year; results may vary as many deployments are based on a fixed cost per meter, but the meters are deployed over several years. Values are in nominal dollars.
210
220
230
240
250
260
270
2010 2011 2012 2013 2014 2015 2016

141 © Bloomberg Finance L.P. 2017. Developed in partnership with The Business Council for Sustainable Energy.
Table of contents
8. Global context
1. Introduction
2. A look across
the US energy
sector
3. Natural gas
4. Large-scale
renewable
electricity and
CCS
2.1 Bird’s-eye view
2.2 Policy, finance, economics
4.1 Solar (PV, solar thermal)
4.2 Wind
4.3 Biomass, biogas, waste-to-
energy
4.4 Geothermal
4.5 Hydropower
4.6 CCS
5. Distributed
power and
storage
5.1 Small-scale solar
5.2 Small- and medium-scale wind
5.3 Small-scale biogas
5.4 Combined heat and power and
waste-heat-to-power
5.5 Fuel cells (stationary)
5.6 Energy storage
6. Demand-
side energy
efficiency
6.1 Energy efficiency
6.2 Smart grid and demand response
7. Sustainable
transportation
7.1 Electric vehicles
7.2 Natural gas vehicles
7.3 Biofuels

142 © Bloomberg Finance L.P. 2017. Developed in partnership with The Business Council for Sustainable Energy.
Source: Bloomberg New Energy Finance
Deployment: US electric vehicle and hybrid electric vehicle sales
● Sales of electric vehicles – a category that includes battery electric vehicles (BEV) and plug-in hybrid electric vehicles
(PHEV) – jumped 38% from just short of 115,000 units in 2015 to over 158,200 units in 2016.
● New SUV model additions – the BMW X5 or the Tesla Model X – together with widespread availability of the revamped
Chevrolet Volt contributed to the uptick in overall US EV sales.
● PHEV sales increased the most and were up 70% year-on-year, driven by renewed consumer interest in the upgraded
Chevrolet Volt and new PHEV model introductions like the BMW X5 xDrive. BEVs saw an 18% jump in sales and were able
to sustain their advantage over PHEVs by almost 12,400 units in 2016.
● Sales of hybrid electric vehicles (HEV) totalled short of 345,960 units in 2016 – a 10% decrease compared to 2015. The
market continues to suffer from low gasoline prices, which make the more expensive HEVs less attractive.
US EV sales US HEV sales
0%
1%
2%
3%
4%
5%
0
40
80
120
160
200
Q1
Q2
Q3
Q4
Q1
Q2
Q3
Q4
Q1
Q2
Q3
Q4
Q1
Q2
Q3
Q4
Q1
Q2
Q3
Q4
2012 2013 2014 2015 2016
BEV
PHEV
EV share in newvehicle sales
1,000 units Share (%)
0%
1%
2%
3%
4%
5%
0
40
80
120
160
200
Q1
Q2
Q3
Q4
Q1
Q2
Q3
Q4
Q1
Q2
Q3
Q4
Q1
Q2
Q3
Q4
Q1
Q2
Q3
Q4
2012 2013 2014 2015 2016
HEV
HEV share in new vehicle sales
1,000 units Share (%)

143 © Bloomberg Finance L.P. 2017. Developed in partnership with The Business Council for Sustainable Energy.
3 3 4 6 6 6 6 7 7 6 8 7 7 7 9 9 11 12 14 16 17 17 17 17 19 1821 22 24 25 25 25 25
28
1 1 1 12 3
3 35
5 5 6 7 78 10
911
1216
1922 22
24
1 1 11 1 1 1
2 2 22 2 2 2
2 22 2
22 2 2 2 2
3 33
33
43
3 3
3
1 14 4 5
7 7 7 79 9 8
11 10 10 1013 14
16 17
2123 24 25 26 26
30 3133
3639
4547
50 50
55
Q1 Q2 Q3 Q4 Q1 Q2 Q3 Q4 Q1 Q2 Q3 Q4 Q1 Q2 Q3 Q4 Q1 Q2 Q3 Q4 Q1 Q2 Q3 Q4 Q1 Q2 Q3 Q4 Q1 Q2 Q3 Q4 Q1 Q2 Q3 Q4
2008 2009 2010 2011 2012 2013 2014 2015 2016
FCV
PHEV
BEV
Source: Bloomberg New Energy Finance Note: FCV = fuel cell electric vehicles, PHEV = plug-in hybrid electric vehicles and BEV = battery electric vehicles. CAFE stands for Corporate Average Fuel
Economy standards. All models available in North America (Canada and US) are also available in the US.
Deployment: EV model availability in North America, 2008-2016 (number of models)
● By Q4 2016, 55 EV models were available to North American consumers, including three FCVs, 24 PHEVs and 28 BEVs.
● The growing number of PHEV models available in 2016 – making up 43% of total EV models in Q4 compared to 36% during the same time in
2015 – reflects a global shift towards partial electrification as automakers face stringent fuel efficiency requirements in their core markets (EU,
China and US).
˗ German automakers – mainly BMW, Daimler and VW – dominated PHEV offerings in North America in Q4 2016, offering 14 of the 24
available models. These vehicles are compliant with EU CO2 emission mandates and the US National Program (CAFE and GHG
emissions).
● Three new BEV models were launched in 2016: VW’s Passat GTE BEV, GM’s Chevrolet Bolt and Bolloré’s Bluecar (for carsharing schemes).
The Chevrolet Bolt launched in 2016 with availability only in California and Oregon, where BEVs are in high demand as a result of those states’
pledges to the Zero Emission Vehicle (ZEV) program. A step-by-step rollout to the rest of the US is scheduled for 2017.

144 © Bloomberg Finance L.P. 2017. Developed in partnership with The Business Council for Sustainable Energy.
Source: EPA, Bloomberg New Energy Finance, IHS
Deployment: Share of US vehicles sold with start-stop technologies, 2012-2016
0%
1%
2%
3%
4%
5%
6%
7%
8%
9%
10%
2012 2013 2014 2015 2016
● Start-stop systems automatically shut off the engine when the vehicle is stopped, thereby cutting fuel use and reducing idle emissions. A battery
continues to power lights and accessories while the engine is off. The engine automatically restarts when the driver releases the brake pedal.
● Start-stop systems deliver up to 5% fuel savings for conventional internal combustion engine vehicles, depending on driving conditions.
● In Europe, vehicles with start-stop systems made up 80% of new vehicles sales in 2016. Europe got a head start on adopting start-stop
technology a decade ago, in response to carbon reduction regulations.
● In the US there were at least 90 vehicle models with start-stop available in 2016, including the Ford Fusion and F-150, Chevy Malibu and
Impala, Jeep Cherokee, Chrysler 200, Kia Sol and Rio, Dodge Ram and others.

145 © Bloomberg Finance L.P. 2017. Developed in partnership with The Business Council for Sustainable Energy.
Deployment: Demand for lithium-ion batteries for passenger EVs by battery supplier
Source: Bloomberg New Energy Finance
MWh Share of batteries sold in EVs
● Demand for lithium-ion batteries from EVs in the US has nearly doubled since 2014, reaching 5,813MWh in 2016.
● Panasonic dominates the supply due to its close relationship with Tesla - it provides batteries to both the Tesla Model S and
the Model X. Strong sales of the two Tesla models in the US meant that Panasonic produced 74% of batteries sold in EVs
in the US in 2016.
376 424 383 433 453617 569
756 747959
1,353 1,259
126183 220 203 100
14094
89
87
104144
83107 132 95
9082
130 108
148
162 216
98
95
89
91
109 95
630
786 837 848738
978882
1,095989
1,309
1,761 1,754
Q1 Q2 Q3 Q4 Q1 Q2 Q3 Q4 Q1 Q2 Q3 Q4
2014 2015 2016
Panasonic AESC LG Chem Samsung SDI Other
60% 54%46% 51%
61% 63% 65% 69%76% 73% 77% 72%
20%23%
26%24%
14% 14% 11%8%
7% 7%6%
8%
13% 14%16% 11% 7%
9% 9%12%
11% 11% 9% 12%7% 8% 13% 7% 11%
8% 4% 7% 6% 5%6% 6% 5% 6% 5% 7% 5%
0%
10%
20%
30%
40%
50%
60%
70%
80%
90%
100%
Q1 Q2 Q3 Q4 Q1 Q2 Q3 Q4 Q1 Q2 Q3 Q4
2014 2015 2016
Panasonic AESC LG Chem Samsung SDI Other

146 © Bloomberg Finance L.P. 2017. Developed in partnership with The Business Council for Sustainable Energy.
Deployment: US public electric vehicle charging outlets (number of outlets)
● The number of public EV charging outlets has climbed steeply since 2008. In 2016 alone, the number of publicly available EV
charging outlets increased 29% compared to the previous year.
● Some 80% of public charging outlets in the US are Level 2 – ie, delivering 3.3kW to 7.2kW. Around 13% are almost equally
split between different rapid charging standards – CHAdeMO, CCS and Tesla Supercharger. Level 1 make up the remaining
7% of public charging outlets.
● Since most charging takes place at home, public EV chargers face low utilization rates that result in poor returns on
investment for those who own and operate them. However, early investments by regulated utilities, auto OEMs, EV charging
network solutions providers and governments are building out the infrastructure to support a larger EV fleet.
Source: Alternative Fuels Data Center, Bloomberg New Energy Finance
Notes: Does not include residential electric charging infrastructure.
430 465 8143,410
12,000
19,460
26,077
31,003
40,075
2008 2009 2010 2011 2012 2013 2014 2015 2016

147 © Bloomberg Finance L.P. 2017. Developed in partnership with The Business Council for Sustainable Energy.
Financing: Investment in US electric vehicle companies ($m)
Venture capital / private equity Public markets
● Venture capital and private equity firms have invested just short of $4.0bn of private capital in the US electrified transport
sector since 2008. Public markets investment stands at $8.0bn over the same period.
● Notable deals in 2016 included the following:
˗ Tesla raised $2.3bn via a secondary share placement to help pay for the expansion of production necessary to
accommodate the demand for the Model 3.
˗ ChargePoint raised $50m in a series F funding round. The lead investor, Linse Capital, was joined by Constellation
Technology Ventures, Draemar Energy Ventures, Statoil Energy Ventures, Envision Ventures and three private investors.
The proceeds were earmarked for the next phase of expansion outside North America.
Source: Bloomberg New Energy Finance
$244$79
$382 $314 $341
$1,081
$2,506
$771
$2,309
0
500
1,000
1,500
2,000
2,500
3,000
2008 2009 2010 2011 2012 2013 2014 2015 2016
$213$419
$982 $914
$655
$145 $206 $259 $193
0
500
1,000
1,500
2,000
2,500
3,000
2008 2009 2010 2011 2012 2013 2014 2015 2016
PE
VC

148 © Bloomberg Finance L.P. 2017. Developed in partnership with The Business Council for Sustainable Energy.
-20% -20% -7% -10% -35% -22%
1,000
800
642 599
540
350 273
2010 2011 2012 2013 2014 2015 2016
Source: Bloomberg New Energy Finance
Economics: Lithium-ion battery pack prices, 2010-2016 ($/kWh)
● Lithium-ion battery prices have fallen 73% since 2010. For the last two years, the change was propelled mostly by
technology improvements (largely in energy density) and factory overcapacity, which resulted in growing competition
between major battery manufacturers.
● The diminishing cost of lithium-ion battery packs is the driving factor behind the falling cost of BEVs.
● Stationary storage systems use similar cells, but the price of a fully installed stationary system can be twice the price
illustrated here due to the cost of inverters, engineering and installation.
● BNEF has tracked lithium-ion battery prices since 2010 through an annual market survey process. It collects, anonymizes
and aggregates price data for battery cells and packs. The numbers presented in the chart above include cell and pack
prices for electric vehicles.

149 © Bloomberg Finance L.P. 2017. Developed in partnership with The Business Council for Sustainable Energy.
-6,991
-4,983
-3,721
-4,654
-4,390
-12,783
-13,373
-5,379
-6,337
-5,385
-4,262
-5,104
-10,611
-4,568
-4,874
-4,728
-5,373
-6,063
-6,308
-28,358
-24,038
-14,943
40,256
25,824
16,748
23,454
21,558
81,894
86,135
31,199
38,091
31,241
23,160
29,222
68,837
20,003
21,341
20,704
23,528
26,548
27,623
124,167
105,253
65,429
6,765
6,378
5,998
6,286
6,351
8,089
8,501
6,632
8,150
7,286
6,637
7,218
10,056
8,505
9,442
8,700
8,925
9,631
9,629
14,939
13,302
11,643
0.79
0.54
0.38
0.50
0.47
1.53
1.61
0.64
0.79
0.66
0.51
0.62
1.35
0.47
0.51
0.49
0.54
0.60
0.61
2.19
1.87
1.23
BMW i3
Fiat 500e
Chevrolet Spark EV
Nissan Leaf
VW e-Golf
Tesla Model S
Tesla Model X
Chevrolet Volt
Audi A3 e-tron
Ford Fusion Energi
Toyota Prius
Ford C-Max Energi
BMW X5 xDrive40e
Honda Fit
Kia Soul
Toyota Corolla
Chevrolet Cruze
Toyota Camry
Honda Accord
Mercedes S Class
BMW 7 Series
Average ICE luxury SUV
Resale value Upfront cost Running cost
Source: Bloomberg New Energy Finance. Notes: Upfront cost includes down payment, financing and sales tax and is net of incentives; running costs consist of road tax, insurance, maintenance and
fuel. Calculations assume 10,100 miles driven per year, $2.6/gallon cost of gasoline and $0.105/kWh cost of electricity.
Economics: BEVs are as cheap or cheaper than many gasoline vehicles in the US, when using purchasing credit incentives
● With subsidies, battery electric vehicles cost up to 15% less than owning equivalent gasoline cars for all segments – small, medium and large.
˗ Capital costs are up to 14% lower for battery electric vehicles, when including state and federal purchasing incentives of up to $10,000.
˗ Fuel and running costs are up to 40% lower for a BEV.
● Plug-in hybrids cost more than midsize gasoline cars.
˗ Prices for PHEV are higher, incentives are lower and gasoline adds further fuel costs compared to BEVs.
BEV
PHEV
ICE
US 2016 models $/mile

150 © Bloomberg Finance L.P. 2017. Developed in partnership with The Business Council for Sustainable Energy.
-6,991
-4,983
-3,721
-4,654
-4,390
-12,783
-13,373
-5,379
-6,337
-5,385
-4,262
-5,104
-10,611
-4,568
-4,874
-4,728
-5,373
-6,063
-6,308
-28,358
-24,038
-14,943
50,256
35,824
26,748
33,454
31,558
91,894
96,135
38,699
45,591
38,741
30,660
36,722
76,337
20,003
21,341
20,704
23,528
26,548
27,623
124,167
105,253
65,429
6,765
6,378
5,998
6,286
6,351
8,089
8,501
6,632
8,150
7,286
6,637
7,218
10,056
8,505
9,442
8,700
8,925
9,631
9,629
14,939
13,302
11,643
0.99
0.74
0.57
0.69
0.66
1.73
1.81
0.79
0.94
0.80
0.65
0.77
1.50
0.47
0.51
0.49
0.54
0.60
0.61
2.19
1.87
1.23
BMW i3
Fiat 500e
Chevrolet Spark EV
Nissan Leaf
VW e-Golf
Tesla Model S
Tesla Model X
Chevrolet Volt
Audi A3 e-tron
Ford Fusion Energi
Toyota Prius
Ford C-Max Energi
BMW X5 xDrive40e
Honda Fit
Kia Soul
Toyota Corolla
Chevrolet Cruze
Toyota Camry
Honda Accord
Mercedes S Class
BMW 7 Series
Average ICE luxury SUV
Resale value Upfront cost Running cost
Economics: But BEVs are more expensive without purchasing credit incentives
● Without price subsidies:
˗ Current BEV models are up to a third more expensive than small and midsize gasoline cars, but cost the same to own and operate as large
gasoline cars and SUVs.
˗ Plug-in hybrids are ~40% more expensive than midsize cars due to their high purchase prices, but can be up to 15% cheaper than large
gasoline cars and SUVs.
Source: Bloomberg New Energy Finance. Notes: Upfront cost includes down payment, financing and sales tax and is net of incentives; running costs consist of road tax, insurance, maintenance and
fuel. Calculations assume 10,100 miles driven per year, $2.5/gallon cost of gasoline and $0.125/kWh cost of electricity.
BEV
PHEV
ICE
US 2016 models $/mile

151 © Bloomberg Finance L.P. 2017. Developed in partnership with The Business Council for Sustainable Energy.
Table of contents
8. Global context
1. Introduction
2. A look across
the US energy
sector
3. Natural gas
4. Large-scale
renewable
electricity and
CCS
2.1 Bird’s-eye view
2.2 Policy, finance, economics
4.1 Solar (PV, solar thermal)
4.2 Wind
4.3 Biomass, biogas, waste-to-
energy
4.4 Geothermal
4.5 Hydropower
4.6 CCS
5. Distributed
power and
storage
5.1 Small-scale solar
5.2 Small- and medium-scale wind
5.3 Small-scale biogas
5.4 Combined heat and power and
waste-heat-to-power
5.5 Fuel cells (stationary)
5.6 Energy storage
6. Demand-
side energy
efficiency
6.1 Energy efficiency
6.2 Smart grid and demand response
7. Sustainable
transportation
7.1 Electric vehicles
7.2 Natural gas vehicles
7.3 Biofuels
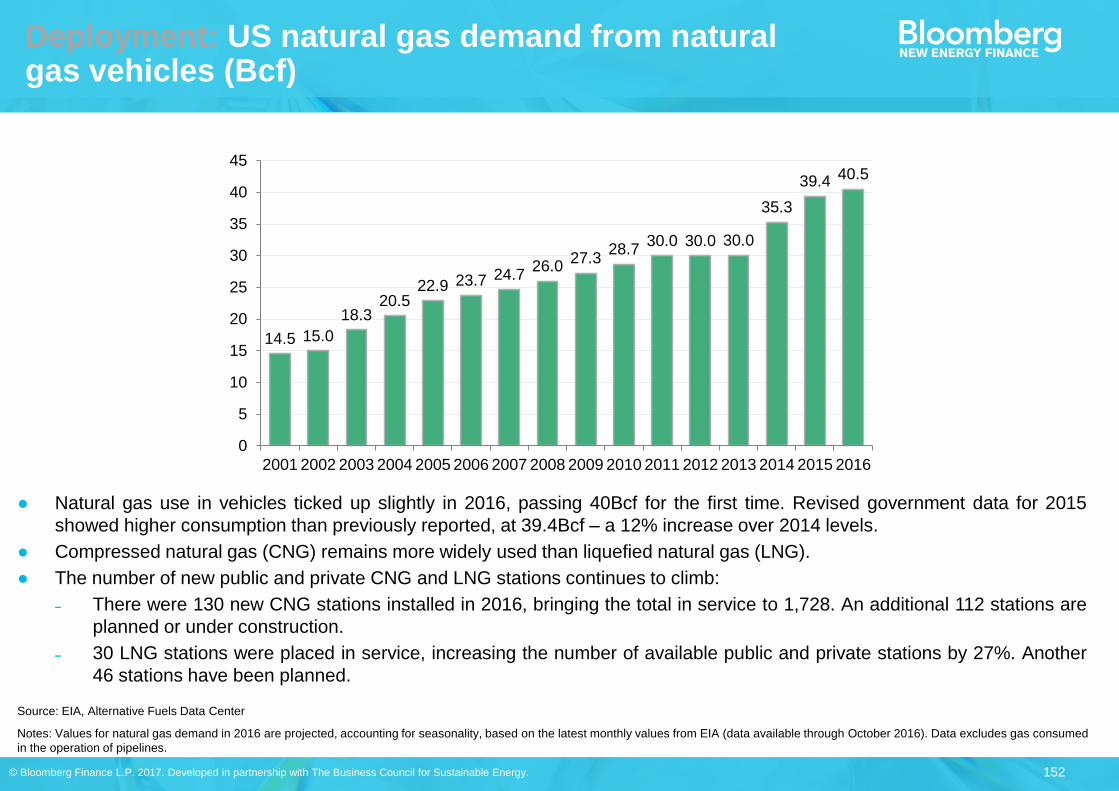
152 © Bloomberg Finance L.P. 2017. Developed in partnership with The Business Council for Sustainable Energy.
Deployment: US natural gas demand from natural gas vehicles (Bcf)
● Natural gas use in vehicles ticked up slightly in 2016, passing 40Bcf for the first time. Revised government data for 2015
showed higher consumption than previously reported, at 39.4Bcf – a 12% increase over 2014 levels.
● Compressed natural gas (CNG) remains more widely used than liquefied natural gas (LNG).
● The number of new public and private CNG and LNG stations continues to climb:
˗ There were 130 new CNG stations installed in 2016, bringing the total in service to 1,728. An additional 112 stations are
planned or under construction.
˗ 30 LNG stations were placed in service, increasing the number of available public and private stations by 27%. Another
46 stations have been planned.
Source: EIA, Alternative Fuels Data Center
Notes: Values for natural gas demand in 2016 are projected, accounting for seasonality, based on the latest monthly values from EIA (data available through October 2016). Data excludes gas consumed
in the operation of pipelines.
14.5 15.0
18.320.5
22.9 23.7 24.726.0
27.328.7
30.0 30.0 30.0
35.3
39.4 40.5
0
5
10
15
20
25
30
35
40
45
2001 2002 2003 2004 2005 2006 2007 2008 2009 2010 2011 2012 2013 2014 2015 2016

153 © Bloomberg Finance L.P. 2017. Developed in partnership with The Business Council for Sustainable Energy.
Financing: Capex investments by US-based Clean Energy Fuels Corp., mostly for new natural gas fuelling stations ($m)
● Clean Energy Fuels is a leading natural gas fuel supplier, owning, operating or supplying 31% of US retail and private CNG
and LNG fuelling stations as of the beginning of 2016. The company’s spending plans are used here as a proxy for financing
flows into the natural gas vehicle sector.
● The company directs most of its asset financing toward fuelling infrastructure. Spending plummeted in 2014 to $47m, less
than one-third of what it initially anticipated. Similarly, 2015 spending fell to only $34bn, less than the planned capex
investments of $58m, as the company sought to improve its cash position. In its 2015 Annual Report, Clean Energy Fuels
budgeted $25m in capex for 2016.
● Heavy-duty trucks provide the major market for LNG, but this has been slow to expand. As of the start of 2015, there was only
one major natural gas engine manufacturer for the medium- and heavy-truck market (Cummins Westport). Natural gas
engines cost more than comparable gasoline or diesel engines, and its fuel price advantage has been eroded by consistently
low oil prices.
Source: Clean Energy Fuels annual reports
Notes: Figures from 2009-15 reflect 'net cash used in investing activities' as per the company's cash flow statement. The amount for 2016 is based on company plans announced in its 2015 annual report
("Our capital expenditure budget for 2016 is approximately $25 million").
4362
166 164 155
47 34 250
20
40
60
80
100
120
140
160
180
2009 2010 2011 2012 2013 2014 2015 2016e

154 © Bloomberg Finance L.P. 2017. Developed in partnership with The Business Council for Sustainable Energy.
Economics: Average US gasoline, CNG and Henry Hub natural gas prices ($/GGE)
● Natural gas engines function almost identically to gasoline/diesel engines, but require new fuelling systems. A fuel price
discount is therefore needed to incentivize consumers to convert.
● CNG previously enjoyed a substantial fuel price discount to gasoline, in the range of $1.40-$1.70/GGE from 2011-14. But the
collapse of global crude oil prices erased this advantage, as gasoline prices at the pump dropped below the cost of retail
CNG in Q4 2015 – Q1 2016. However, an oil price rebound allowed CNG to regain a small advantage in late 2016.
● Retail CNG prices are much less volatile than that of retail gasoline.
Source: Bloomberg New Energy Finance, Alternative Fuels Data Center
0.0
0.5
1.0
1.5
2.0
2.5
3.0
3.5
4.0
4.5
Q1 2
00
7
Q3 2
00
7
Q1 2
008
Q3 2
00
8
Q1 2
00
9
Q3 2
00
9
Q1 2
01
0
Q3 2
010
Q1 2
01
1
Q3 2
01
1
Q1 2
01
2
Q3 2
01
2
Q1 2
01
3
Q3 2
01
3
Q1 2
01
4
Q3 2
01
4
Q1 2
01
5
Q3 2
01
5
Q1 2
01
6
Q3 2
016
Retail gasoline
Retail CNG
Henry Hub gas

155 © Bloomberg Finance L.P. 2017. Developed in partnership with The Business Council for Sustainable Energy.
Table of contents
8. Global context
1. Introduction
2. A look across
the US energy
sector
3. Natural gas
4. Large-scale
renewable
electricity and
CCS
2.1 Bird’s-eye view
2.2 Policy, finance, economics
4.1 Solar (PV, solar thermal)
4.2 Wind
4.3 Biomass, biogas, waste-to-
energy
4.4 Geothermal
4.5 Hydropower
4.6 CCS
5. Distributed
power and
storage
5.1 Small-scale solar
5.2 Small- and medium-scale wind
5.3 Small-scale biogas
5.4 Combined heat and power and
waste-heat-to-power
5.5 Fuel cells (stationary)
5.6 Energy storage
6. Demand-
side energy
efficiency
6.1 Energy efficiency
6.2 Smart grid and demand response
7. Sustainable
transportation
7.1 Electric vehicles
7.2 Natural gas vehicles
7.3 Biofuels

156 © Bloomberg Finance L.P. 2017. Developed in partnership with The Business Council for Sustainable Energy.
Deployment: Volumes of biofuels blended under the federal Renewable Fuels Standard
First-generation biofuels (billions of gallons) Next-generation biofuels (millions of gallons)
● The US’s Renewable Fuel Standard 2 mandates biofuel blending into gasoline and diesel through 2022. The EPA administers
the program and sets annual blending targets split by fuel type.
● The highest value biofuels under the RFS2 are cellulosic biofuels or ‘next-generation’ biofuels. These include cellulosic
ethanol, cellulosic diesel and cellulosic biogas, which are made from non-food feedstocks and possess low carbon footprints.
● Each biofuel receives a renewable identification number (RIN) upon blending, which the blender can count towards its annual
mandated targets, or sell to other blenders who otherwise would not meet targets. The most valuable RINs are the cellulosic
RINs (D3s), which fetched $2.35/gallon at the end of 2016.
● The biofuel blending targets for 2016 were 24bn gallons (of which 230m was the cellulosic target). For 2017 the mandate is
26bn gallons (of which 312m gallons is cellulosic). First-generation ethanol and cellulosic biogas are the primary fuels used to
meet these targets.
Source: Bloomberg New Energy Finance, EPA, Progressive Fuels Limited Notes: Fuels under the RFS2 are categorized by D codes, which indicate fuel type. D3 stands for Cellulosic Biofuels, D4 for
Biomass-based Diesel, D5 for Advanced Biofuel, D6 for Renewable Fuel, D7 for Cellulosic Diesel. See the EPA's website for more information.
0
20
40
60
80
100
120
140
160
180
200
Cellulosic biogas (D3) Cellulosic ethanol (D3)
0
2
4
6
8
10
12
14
16
First-generationethanol (D5,D6)
Biodiesel (D4,D6) Non-esterrenewable diesel
(D4,D5,D6)
0.02000.04000.06000.08000.0
10000.012000.014000.016000.0
First-
…
Non
-…
2014
2015
2016

157 © Bloomberg Finance L.P. 2017. Developed in partnership with The Business Council for Sustainable Energy.
Table of contents
8. Global context
1. Introduction
2. A look across
the US energy
sector
3. Natural gas
4. Large-scale
renewable
electricity and
CCS
2.1 Bird’s-eye view
2.2 Policy, finance, economics
4.1 Solar (PV, solar thermal)
4.2 Wind
4.3 Biomass, biogas, waste-to-
energy
4.4 Geothermal
4.5 Hydropower
4.6 CCS
5. Distributed
power and
storage
5.1 Small-scale solar
5.2 Small- and medium-scale wind
5.3 Small-scale biogas
5.4 Combined heat and power and
waste-heat-to-power
5.5 Fuel cells (stationary)
5.6 Energy storage
6. Demand-
side energy
efficiency
6.1 Energy efficiency
6.2 Smart grid and demand response
7. Sustainable
transportation
7.1 Electric vehicles
7.2 Natural gas vehicles
7.3 Biofuels

158 © Bloomberg Finance L.P. 2017. Developed in partnership with The Business Council for Sustainable Energy.
Global context: Total new investment in clean energy by country or region ($bn)
● Total global new investment in clean energy ebbed 18% in 2016 to $287.5bn, after hitting a record high of $348.5bn in 2015.
The dropoff partly reflects steep declines in equipment prices, especially for solar PV.
● The most significant retreat in absolute terms occurred in China, where investment shrank $31bn (-26%) from 2015 levels.
China is stepping back from building new utility-scale renewables and instead taking time to integrate existing renewable
capacity. Investment stayed roughly the same in India while falling $17bn (32%) in the rest of APAC.
● In the US, investment fell 7% to $59bn, after an exceptional 2015. For details, please see section 2.2.
● European clean energy investments climbed by $2.4bn (+3%) in 2016.
Source: Bloomberg New Energy Finance Notes: For definition of clean energy, see slide in Section 2.2 of this report tit led “Finance: US clean energy investment (1 of 2) – total new investment, all
asset classes ($bn)” . AMER is Americas; APAC is Asia-Pacific; EMEA is Europe, Middle East, and Africa. Investment figures are nominal.
10 17 35 47 44 35 47 63 53 45 52 63 593 911
17 26 3945
49 63 6792
11988
62
88
130
183205 207
276
317
291269
315
349
287
0
50
100
150
200
250
300
350
400
2004 2005 2006 2007 2008 2009 2010 2011 2012 2013 2014 2015 2016
Other EMEA
Other APAC
Other AMER
Europe
Brazil
India
China
United States
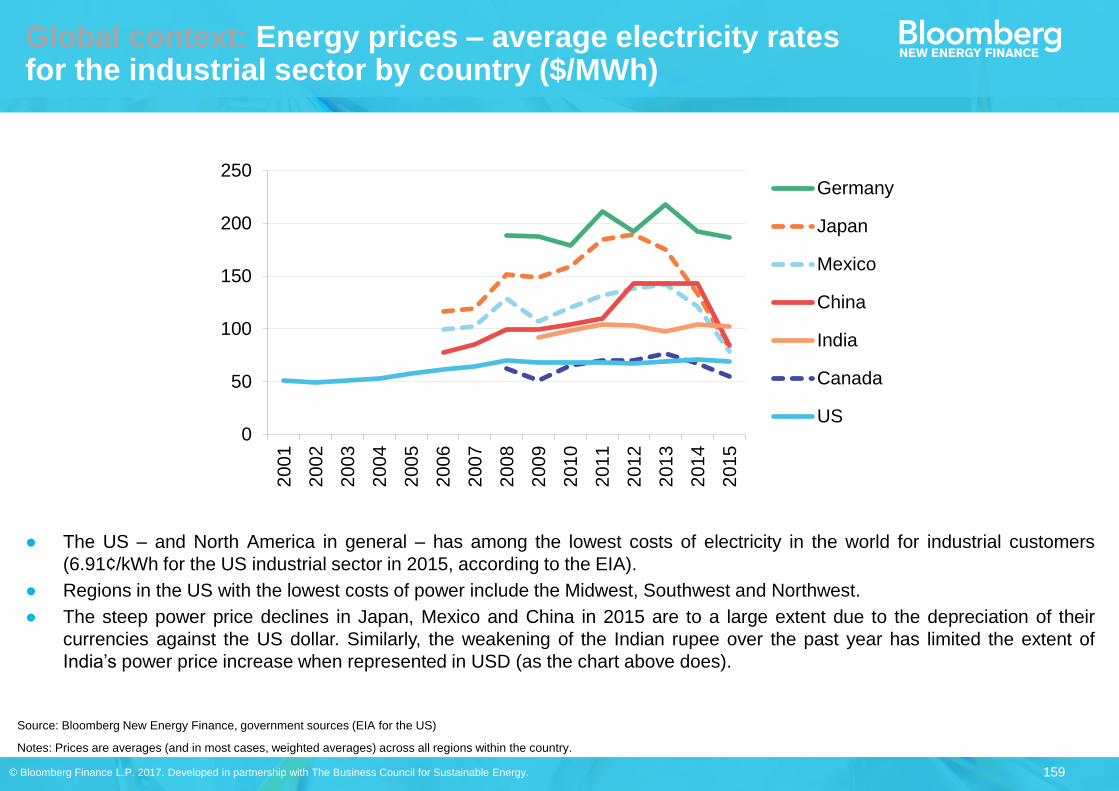
159 © Bloomberg Finance L.P. 2017. Developed in partnership with The Business Council for Sustainable Energy.
Global context: Energy prices – average electricity rates for the industrial sector by country ($/MWh)
● The US – and North America in general – has among the lowest costs of electricity in the world for industrial customers
(6.91¢/kWh for the US industrial sector in 2015, according to the EIA).
● Regions in the US with the lowest costs of power include the Midwest, Southwest and Northwest.
● The steep power price declines in Japan, Mexico and China in 2015 are to a large extent due to the depreciation of their
currencies against the US dollar. Similarly, the weakening of the Indian rupee over the past year has limited the extent of
India’s power price increase when represented in USD (as the chart above does).
Source: Bloomberg New Energy Finance, government sources (EIA for the US)
Notes: Prices are averages (and in most cases, weighted averages) across all regions within the country.
0
50
100
150
200
250
200
1
200
2
200
3
200
4
200
5
200
6
200
7
200
8
200
9
201
0
201
1
201
2
201
3
201
4
2015
Germany
Japan
Mexico
China
India
Canada
US

160 © Bloomberg Finance L.P. 2017. Developed in partnership with The Business Council for Sustainable Energy.
Global context: COP21 Paris Agreement
Source: Bloomberg New Energy Finance, UNFCCC, WRI.
Projected global emissions under Nationally Determined Contributions (NDCs)
● The Paris Agreement entered into force on 4 November 2016, one month after sign-offs by 74 countries including the US, China,
India, Brazil, Canada, Mexico and the EU took it over the ratification threshold.
● The Nationally Determined Contributions (NDCs) submitted by participating parties, which reflect their emission reduction goals,
would put global emissions on track to rise 20-30% by 2030. This is not enough to meet the agreement’s binding target of limiting
global temperature increases to 2ºC. But the COP21 framework lays out a path forward for ramping up abatement goals by
requiring five-year reviews of NDCs starting in 2020 and five-year global ‘stocktakes’ starting in 2023.
● Further, the deal includes a binding commitment to achieve “a balance between anthropogenic emissions by sources and removals
by sinks of greenhouse gases in the second half of the century,” which is not strong enough to assure a 2ºC outcome.
● COP22, which took place November 7-18, 2016 in Marrakesh, set a timetable for the next two years of negotiations.
0
10
20
30
40
50
60
70
1990 1995 2000 2005 2010
Other
South Korea
Australia
Iran
Mexico
Canada
Japan
Brazil
Indonesia
Russia
India
EU
US
China
Historical Projection
2015 2020 2025 2030
Projections based on lower &
upper ends of NDCs’ target ranges
+10.8-15.8Gt/yr
(23-33%)

161 © Bloomberg Finance L.P. 2017. Developed in partnership with The Business Council for Sustainable Energy.
Global context: US-related causes and implications of falling oil prices (1 of 2) – demand
US gasoline consumption (bn gallons per year) US average fuel-economy rating (weighted by
sales) of purchased new vehicles (MPG)
● Gasoline consumption rose for the second consecutive year, jumping 3.3% from 2015 levels to 136bn gallons. With the
increase, consumption is now only 1.5% below the all-time peak reached in 2005; it is 7.1% above the recent trough of 127bn
gallons seen in 2012.
● Average US vehicle fuel economy held steady for the third consecutive year at just over 25mpg. Continued improvements in
federal corporate average fuel economy regulations have been offset by consumer buying choices, as Americans have
purchased less fuel-efficient vehicles in light of falling prices at the pump.
Source: EIA
Notes: Analysis is based on daily averages of ‘total gasoline all sales / deliveries by prime supplier’.
Values for 2016 are projected, accounting for seasonality, based on latest monthly values from EIA
(data available through November 2016).
Source: UMTRI, Bloomberg New Energy Finance
Notes: Relies on combined city/highway EPA fuel economy ratings.
0
20
40
60
80
100
120
140
160
198
5
198
7
198
9
199
1
199
3
199
5
199
7
199
9
200
1
200
3
200
5
200
7
200
9
2011
201
3
201
5
15
17
19
21
23
25
27
Oct 07 Oct 08 Oct 09 Oct 10 Oct 11 Oct 12 Oct 13 Oct 14 Oct 15 Oct 16
Monthly fuel economy rating
Average fuel economy rating by MY

162 © Bloomberg Finance L.P. 2017. Developed in partnership with The Business Council for Sustainable Energy.
Global context: US-related causes and implications of falling oil prices (2 of 2) – supply
● US crude oil production declined but remains well above the levels produced in the 1990s and 2000s. For the first eleven
months of 2016, production averaged 8.9m barrels per day (bpd), down from the 9.4mbpd seen in 2015 but still above levels
seen since 1985. Output in October 2015 had marked an 85% upsurge from the low of 5.1mbpd reached in October 2007.
● As production tightened, oil prices recovered to $54/barrel by December 2016. This followed the extended freefall in 2015,
which stretched into the first quarter of 2016 and brought prices to a trough of $26/barrel in February 2016.
● Oil prices do not directly impact the majority of sustainable energy technologies in the US. Most of those technologies
operate in the power sector, while oil in the US is used mainly for transportation and only rarely for power. However, more
affordable gasoline at the pump has stalled gains in the average US vehicle fuel economy as consumers opted for less fuel-
efficient vehicles.
Source: EIA
Notes: Data through November 2016.
US monthly crude oil production (million barrels per month)
0
50
100
150
200
250
300
350
19
70
19
71
19
73
19
74
19
76
19
77
19
79
19
81
19
82
19
84
19
85
19
87
19
89
19
90
19
92
19
93
19
95
19
96
19
98
20
00
20
01
20
03
20
04
20
06
20
08
20
09
20
11
20
12
20
14
20
15

163 © Bloomberg Finance L.P. 2017. Developed in partnership with The Business Council for Sustainable Energy.
This publication is the copyright of Bloomberg New Energy Finance. Developed in partnership with The Business Council
for Sustainable Energy. No portion of this document may be photocopied, reproduced, scanned into an electronic system
or transmitted, forwarded or distributed in any way without attributing Bloomberg New Energy Finance and The Business
Council for Sustainable Energy.
The information contained in this publication is derived from carefully selected sources we believe are reasonable. We do
not guarantee its accuracy or completeness and nothing in this document shall be construed to be a representation of such
a guarantee. Any opinions expressed reflect the current judgment of the author of the relevant article or features, and does
not necessarily reflect the opinion of Bloomberg New Energy Finance, Bloomberg Finance L.P., Bloomberg L.P. or any of
their affiliates ("Bloomberg"). The opinions presented are subject to change without notice. Bloomberg accepts no
responsibility for any liability arising from use of this document or its contents. Nothing herein shall constitute or be
construed as an offering of financial instruments, or as investment advice or recommendations by Bloomberg of an
investment strategy or whether or not to "buy," "sell" or "hold" an investment.
Copyright and disclaimer

Subscription-based news, data and analysis to support
your decisions in clean energy, power and water and the
carbon markets
MARKETS Renewable Energy
Energy Smart Technologies
Advanced Transport
Gas
Carbon and RECs
SERVICES Americas Service
Asia Pacific Service
EMEA Service
Applied Research
Events and Workshops
Contributors:
Ethan Zindler
Colleen Regan
Rachel Jiang
Economics and Policy: Richard Chatterton,
Abraham Louw, Stephen Munro, Dan Shurey
Natural Gas: Anastacia Dialynas, Jacob
Fericy
Renewable Energy: Meredith Annex, Hugh
Bromley, Amy Grace, Kyle Harrison, Lela
Jgerenaia, Vertis McMillan, Alex Morgan, Dean
Robertson, Nathan Serota, Ben Vickers
Energy Smart Technologies and
Transportation: Claire Curry, Logan Goldie-
Scot, Colin McKerracher, Thomas Rowlands-
Rees, Aleksandra Rybczynska, Yayoi Sekine,
Nikolas Soulopoulos, James Sprinz, Alejandro
Zamorano-Cadavid