©2017 timo roehrs all rights reserved
TRANSCRIPT
©2017 Timo Roehrs
ALL RIGHTS RESERVED

ENCAPSULATION OF MESENCHYMAL STEM CELLS AS A POTENTIAL
TREATMENT FOR STROKE, MODELED AS AN OXYGEN GLUCOSE
DEPRIVED SYSTEM
BY
TIMO ROEHRS
A thesis submitted to
The Graduate School-New Brunswick
And
The Graduate School of Biomedical Sciences
Rutgers, The State University of New Jersey
In partial fulfillment of the requirements
For the degree of
Masters of Science
Graduate Program in Biomedical Engineering
Written under the direction of
David I. Shreiber, And Martin L. Yarmush,
And approved by
_____________________________________
_____________________________________
_____________________________________
_____________________________________
New Brunswick, New Jersey
January 2017

ii
ABSTRACT OF THE THESIS
Encapsulation of mesenchymal stem cells as a potential
treatment for stroke, modeled as an oxygen glucose
deprived system
by Timo Roehrs
Thesis Director:
David I. Shreiber, Ph.D. and Martin L. Yarmush Ph.D.
During a stroke there is a reduction of oxygen, glucose, and other nutrients to the
surrounding brain tissue causing neuronal death and astrocyte activation. Astrocytes are
responsible for protecting the neurons during an injury. Part of the astrocyte activation is the
release of various molecules as well as a change in morphology from a polygonal to a stellate
state. Astrocyte’s morphological change can eventually lead to a glial scar preventing neurons
from reforming connections. Obtaining an effective therapeutic to reduce the negative effects of
astrocyte activation could greatly enhance recovery after a stroke. Mesenchymal stem cells
(MSCs) have numerous anti-inflammatory and neuroprotective properties and with further
development may be developed into an effective therapeutic. MSCs have been shown to regulate
the immune response by reducing inflammatory molecules, such as TNF-α. However, there are
several limitations with MSCs that must be addressed first, such as low viability, differentiation,
and migration away from the injury site.
To overcome these limitations the MSCs are encapsulated in alginate. The encapsulation
still allows for soluble factors to interact with the MSCs and the host tissue while maintaining

iii
viability, keeping the MSCs undifferentiated, and allowing for localization to the injury site. In
previous experiments, using encapsulated MSCs, attenuation of neuro-inflammation was
achieved by PGE2 secreted by the MSCs. With the encapsulated MSCs, the MSCs can be used as a
therapeutic. Stroke is one injury that has few treatments where MSCs could be beneficial. In vitro
stroke is modeled as an oxygen glucose deprived system. Rat cerebral astrocytes are plated into
a 24 well plate and exposed to 1% O2 and no glucose for 2.5, 5, or 10 hours. Astrocytes are then
placed into normoxia conditions and recover for 24 hours.
Increased expression of GFAP and elongation of astrocytes, measured by perimeter over
area signify a change to a reactive state. There is a significant difference (p<0.05) in a perimeter
to area ratio when astrocytes are exposed to OGD compared to control. Both monolayer and
encapsulated MSC reduced the perimeter to area ratio of astrocytes exposed to OGD to a control
level. GFAP intensity increased after OGD exposure, but MSCs treatment did not significantly
reduce GFAP intensity.
Given that PGE2 was previously demonstrated to reduce LPS mediated neuro-
inflammation, it was hypothesized that PGE2 produced by the MSCs would also reduce GFAP
intensity reduction and morphological changes. Total PGE2 levels decreased with OGD, and
monolayer MSCs treatment restored PGE2 levels. Encapsulated MSCs increased the total PGE2
levels. However, these differences are not significantly different than control. There is no
difference in GFAP intensity with astrocytes exposed to exogenous PGE2 during recovery.
These in vitro studies demonstrate that encapsulated MSCs are a viable option for
reducing not only LPS mediated increase in neuro-inflammation, but also astrocyte activation.
However, PGE2 did not mediate astrocyte attenuation. The mechanism of reducing astrocyte
activation is still not understood and further studies are needed.

iv
ACKNOWLEDGEMENTS
I want to thank Dr. David Shreiber and Dr. Rene Schloss for their guidance during this thesis. Both
have given me valuable advice and support during my thesis. I would also like to thank Dr. Li Cai
and Dr. Martin Yarmush for being on my committee.
I would also like to thank my parents for their support and pushing me to continue through with
my education.

v
TABLE OF CONTENTS ABSTRACT OF THE THESIS……………………………………………..………………………………………………………..ii ACKNOWLEDGMENTS…………………………………………………………………………………………………………….iv TABLE OF CONTENTS……………………………………………………………………………………………………………….v LIST OF FIGURES……………………………………………………………………………………………………………………..vi CHAPTER 1: INTRODUCTION……………………………………………………………………………………………………1 1.1 Role of Astrocytes During An Injury……………………………………………………………………………………….1 1.2 Mesenchymal stem cells…………………………………………………………………………………………………….....2 1.3 Hypothesis…………………………………………………………………………………………………………………………….3 CHAPTER 2: MATERIALS AND METHODS………………………………………………………………………………….5 2.1 Primary Cell Culture………………………………………………………………………………………………………….…...5 2.2 Human Mesenchymal stem cells……………………………………………………………………………………….…..5 2.3 Mesenchymal stem cell alginate encapsulation……………………………………………………………………..6 2.4 OGD Injury………………………………………………………………………………………………………….…………………7 2.5 MSCS, PGE2, and BDNF treatment………………………………………………………….………………………………7 2.6 Cytokine analysis…………………………………………………………………………………….…………………………….8 2.7 Fixation and immunostaining…………………………………….…………………….……….…………………………..8 2.8 GFAP analysis………………………………………………………………………………………………………………………..8 2.9 HIF-1α……………………………………………………………………………………………………………………………………9 2.10 Morphology of Astrocytes……………………………………………………………………….…………………………..9 2.11 Statistical Analysis…………….………………………………………………………………………………………….…...10 CHAPTER 3: RESULTS………………………………………………………………………………………..……………………11 3.1 Base model characterized: Hif-1α…………………………………………………………………..……………………11 3.2 GFAP expression…………………………………………………………………………………………….……………………12 3.3 Morphological changes in astrocytes….……………………………………………………………..…………………14 3.4 Monolayer MSCS…………………………………………………………………………………………………………………16 3.5 Encapsulated MSCs……………………………………………………………………………………………..………………19 3.6 TNF-α……………………………………………………………………………………………………………………..……………21 3.7 PGE2……………………………………………………………………………………………………………………….……………21 CHAPTER 4: DISCUSSION/CONCLUSION…………………..…………………………………………………………….25 4.1 OGD………………………………………………………………………………………………………………………….…………25 4.2 Monolayer MSCs VS Encapsulated MScs………………………………………………………………………………26 4.3 PGE2 Response…………………………………………………………………………………………………………….………27 4.5 In Vivo Studies………………………………………………………………………………………………………………..……27 4.6 Future Studies……………………………………………………………………………………………………………………..29 REFERENCES………………………………………………………………………………………………………………….………31 APPENDIX…………………………………………………………………………………………………………………….……….33 Matlab Code……….…………………………………………………………………………………….………………………….33

vi
LIST OF FIGURES Figure 1. Diagram representing how the images for GFAP positive astrocytes were processed. A) Represents the original image, B) represents the mask, C) represents the multiplied image of A and B, and D) represents the intensity value of GFAP positive staining as a percent number…………9
Figure 2. HIF-1α immunostaining of rat astrocytes and analysis. A) HIF-1α (red) immunostaining of rat astrocytes exposed to hypoxia for 0 (control), 2.5, 5, and 10 Hrs with no recovery. Astrocytes also stained with DAPI (blue). B) Quantification of HIF-1α immunostaining by normalized percent nuclear positive cells. Images are representative images and quantification is an N=3 with each N having 3 triplicates. Error bars are standard deviation. * P≤0.05 compared to control………………………………………………………………………………………………………………………………………12
Figure 3. Immunoflorscent staining for GFAP (green) in astrocytes exposed to OGD with a 24 hr recovery period. Astrocytes were stained with nuclear stain DAPI (blue). These images are representative images for each condition: control, 2.5, 5, 10 hrs of OGD with 24 hr recovery……………………………………………………………………………………………………………………………………13
Figure 4. Histogram graph of control, 2.5, 5, 10 Hrs of OGD with recovery. GFAP positive pixels binned into a low and high intensity bin. OGD increases the percent of high intensity pixels compared to control for all durations. * P≤0.05 compared to control…………………………………………14
Figure 5. Astrocytes stained with GFAP (green) and DAPI (blue). A) Control astrocytes with a zoomed in view below. Astrocytes in a polygonal state. B) Astrocytes exposed to 10 hours of OGD with recovery with a zoomed in view below…………………………………………………………………….………..15
Figure 6. A) Average perimeter over area ratio for control. 2.5, 5, 10 hrs of OGD with recovery. B) Histogram of 270 cells per condition analyzed binned at 0.05 increments. * P≤0.05 compared to control………………………………………………………………………………………………………………………………………16
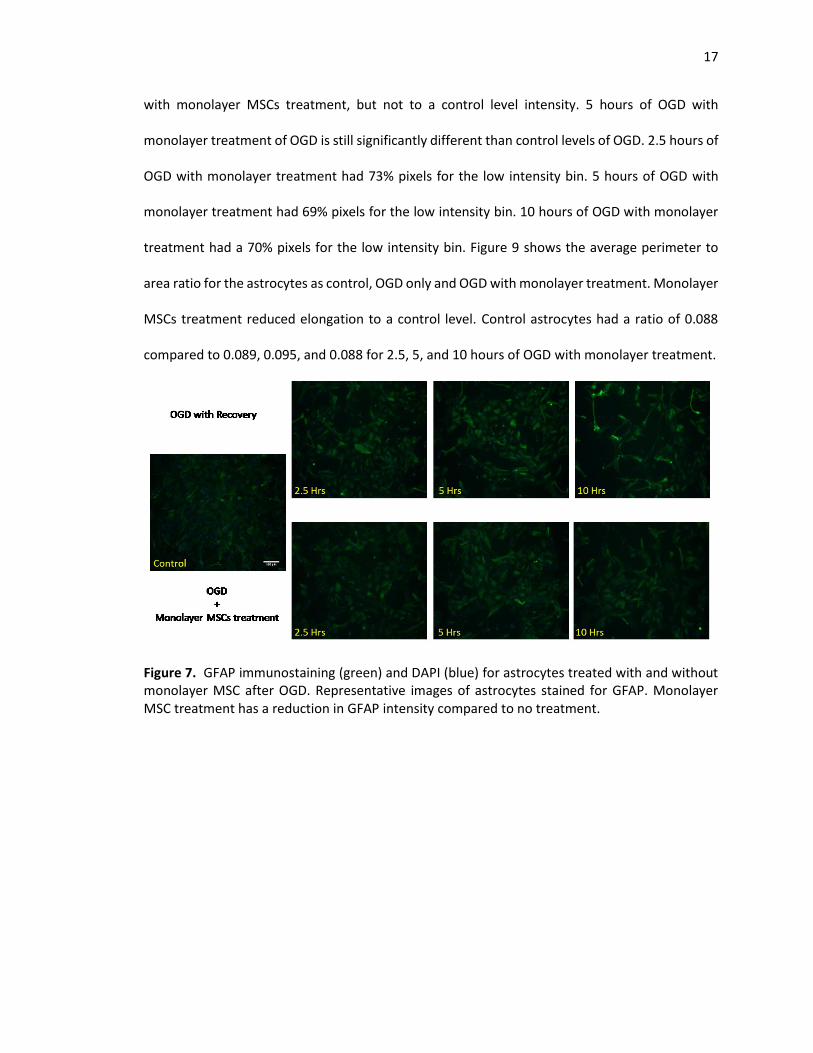
Figure 7. GFAP immunostaining (green) and DAPI (blue) for astrocytes treated with and without monolayer MSC after OGD. Representative images of astrocytes stained for GFAP. Monolayer MSC treatment has a reduction in GFAP intensity compared to no treatment…………………………….17
Figure 8. GFAP intensity analysis of control, OGD only, and OGD with monolayer MSC treatment for 2.5, 5, and 10 hours of OGD. For each duration of OGD there is a clear increase in low intensity GFAP with monolayer MSCs treatment. *P≤0.05 compared to control. ** P≤0.05 compared to OGD only…………………………………………………………………………………………………………………………………..18
Figure 9. Morphology analysis of astrocytes by perimeter over area exposed to 0, 2.5, 5, and hours of OGD with and without monolayer MSCs treatment. Monolayer MSCs treatment reduces perimeter over area ratio to that of a control level. *P≤0.05 compared to control. ** P≤0.05 compared to OGD only………………………………………………………………………………………………………………19
Figure 10. GFAP immunostaining (green) and DAPI (blue) for astrocytes treated with and without encapsulated MSC after OGD. Representative images of astrocytes stained for GFAP. Encapsulated MSCs treatment has a reduction in GFAP intensity compared to control………………………………………………………………………………………………………………………………………20
vii
Figure 11. GFAP intensity analysis of control, OGD only, and OGD with encapsulated MSC treatment for 2.5, 5, and 10 hours of OGD. *P≤0.05 compared to control. ** P≤0.05 compared to OGD only…………………………………………………………………………………………………………………………………..20
Figure 12. Morphology analysis of astrocytes by perimeter over area exposed to 0, 2.5, 5, and hours of OGD with and without encapsulated MSCs treatment. Monolayer MSCs treatment reduces perimeter over area ration to that of a control level. *P≤0.05 compared to control. ** P≤0.05 compared to OGD only………………………………………………………………………………………….………21
Figure 13. Total PGE2 levels for 2.5, 5, and 10 hours of OGD for control, monolayer MSCs, and encapsulated MSCs. PGE2 levels are normalized to control…………………………………………………………22
Figure 14. GFAP immunostaining (green) and DAPI (blue) for astrocytes treated with and without exogenous PGE2. Representative images for each condition are shown. Images for 2ng/ml of PGE2 were chosen since this was near the total PGE2 level seen in the supernatant…………………………….23
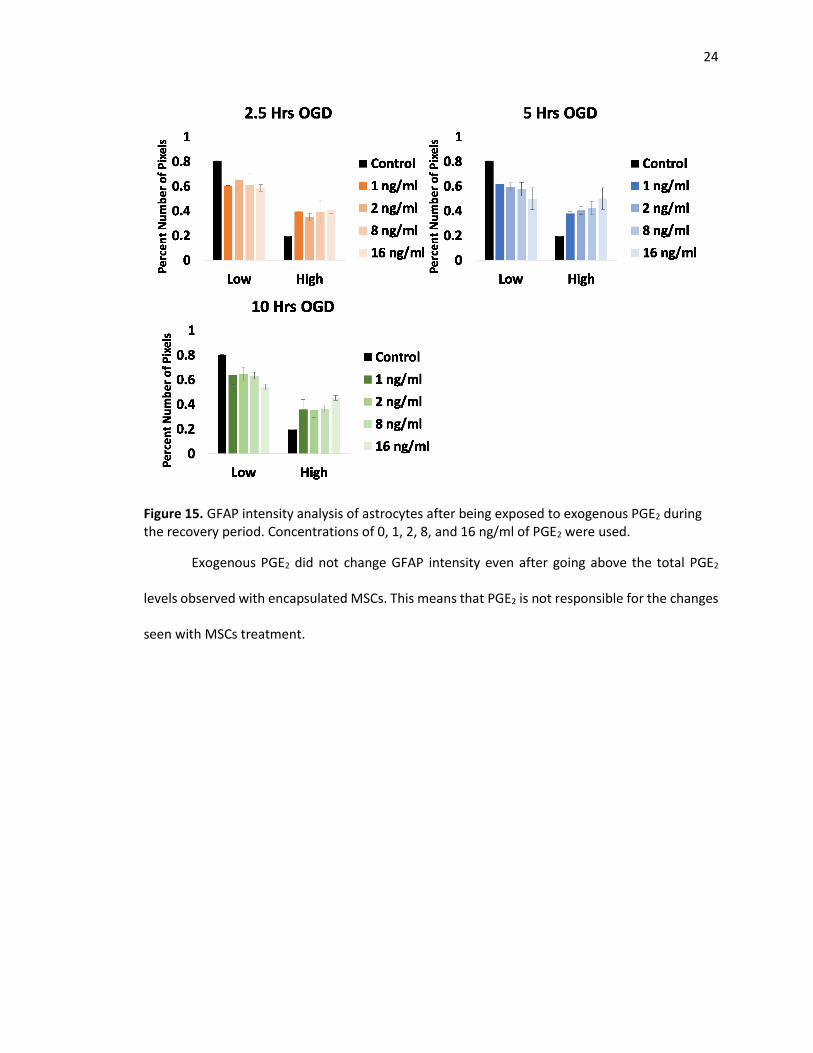
Figure 15. GFAP intensity analysis of astrocytes after being exposed to exogenous PGE2 during the recovery period. Concentrations of 0, 1, 2, 8, and 16 ng/ml of PGE2 was used……………………………..24
1
CHAPTER 1: INTRODUCTION
Stroke is a major concern for the elderly, and as the general population becomes more
obese, there is an increased chance of a stroke. Symptoms of a stroke are slurred speech, facial
droop, and loss of motor control1. A stroke occurs when plaque breaks off of the blood vessels
and forms a clot in a blood vessel in the brain. The clot creates an environment where there is
little to no oxygen and no nutrients present in the surrounding tissues. Additionally, there is little
blood flow, causing for cellular waste to build up. These all can then lead to neuronal cell death.
Along with neuronal death, there is activation of astrocytes, which are supporting cells to the
neurons. Astrocytes can become activated during injuries and form a glial scar, which prevents
the reformation of neuronal connections and hinders recovery2. Therefore, there is a need to
prevent the formation of the glial scar while maintaining the positive effects of the astrocytes
during injury.
1.1 ROLE OF ASTROCYTES DURING AN INJURY
The role of the astrocytes before, during, and after injury has become an area of interest
and target for treatments. When a neuron becomes injured, neurons release glutamate along
with other neurotransmitters. This creates an environment of excitotoxicity, to the other
surrounding neurons that might have previously been injured. However, due to this excitotoxicity,
a cascade is created where other neurons now become injured and release even more molecules.
Astrocytes help maintain the neurons by absorbing excessive neurotransmitters and calcium to
allow for the neurons to continue to function normally3. By absorbing the neurotransmitter,
astrocytes limit the area of the brain that is affected by the injury. However, the astrocytes also
undergo changes and release various molecules. The astrocytes change morphology from a
polygonal shape to a stellate shape. This change in the astrocytes is called astrogliosis4. This
change in morphology can eventually lead to a glial scar, which creates a barrier that can section

2
off an area of the brain preventing neurons from forming connections3. Furthermore, astrocytes
release various molecules, such as tumor necrosis factor alpha (TNF-α), brain derived
neurotrophic factor (BDNF), and molecules from the interleukin family, such as IL-6. Continued
secretion of these molecules can lead to further neuronal death. Therefore, there is a need to
reduce the duration of secretions of molecules, like TNF-α, which can help reduce the amount of
neuronal death5.
Another important molecule in astrocytes is glial fibrillary acidic protein (GFAP). GFAP is
an intermediate filament, specific for astrocytes, that provide structure to the astrocytes.
However, GFAP also plays a role in reactivity. There is an increase in GFAP expression during
astrogliosis allowing for GFAP to be used as common marker to define an astrocyte state1.
1.2 MESENCHYMAL STEM CELLS
Currently, the only treatment for a stroke is to break up the clot with tissue plasminogen
activator (tPA). TPA needs to be administered to the patient within the first 3-4.5 hours otherwise
it cannot be administered6. However, there is no effective treatment for the secondary effects
from the blood clot, but one possible treatment could be the use of mesenchymal stem cells
(MSCs). MSCs has several disadvantages when used by themselves, such as differentiation,
viability, and mobility away from the injury site. One solution to these disadvantages is to
encapsulate the MSCs in alginate. This has been extensively studied in the Yarmush lab group.
Briefly, the viability of the MSCs was assessed over time up to 60 days post encapsulation,
resulting in >90% viability in alginate8. Additionally, a panel of cytokines and growth factors was
evaluated between monolayer and encapsulated MSCs. At a 2.2% alginate concentration, there is
a small increase in cytokine production compared to monolayer MSCs. For example, after 2 days
of encapsulation, there is an increase in IL-2, IL-10, and VEGF6. Additionally, MSCs was shown to
modulate T-cell immunological responses through the production of PGE2 and when stimulated

3
by LPS or TNF-α could modulate macrophages through PGE29, 10. Furthermore, 1.7%, 2.2%, and
2.5% alginate capsules were tested. Using 2.2% alginate was able to maintain the current state of
the MSCs better than 2.5%. 1.7% were also able to maintain the MSCs, but was not chosen for
further evaluation because 2.2% was previously used in other experiments8.
Mesenchymal stem cells have previously been shown to modulate inflammation in the
nervous system7. Additional benefits of the alginate capsules are that they are inert to astrocytes,
keep the MSC localized, and provide a barrier keeping MSCs out of direct contact with the
astrocytes while still allowing for exchanges in oxygen, carbon dioxide and other wastes, and
various proteins such as PGE2. Additionally, MSCs have been extensively studied in regulating
macrophages. The base secretome of the MSC have been analyzed, including their response to
lipopolysaccharide (LPS) activated astrocytes11. In this study, astrocytes were activated with LPS
and then had a monolayer or alginate encapsulated MSCs co-culture in order to reduce the
amount of tumor necrosis factor alpha (TNF-α) produced by astrocytes11. TNF- α is an
inflammatory protein that is often produced in response to LPS. This signified that the MSCs was
producing something in response to the TNF- α. Upon further investigation, this factor was PGE2.
In this model and previous models, the alginate encapsulated MSCs performed better than
monolayer MSCs in regulating inflammatory molecules.
Current research on MSCs have shown that they improve viability in astrocytes via the
Bcl-2 pathway during OGD12. However, which paracrine factors the MSCs are producing to cause
this change has not been determined. There has been little focus on HIF-1α expression during
OGD, GFAP expression, or the changes in morphology to the astrocytes. HIF-1α has the potential
to quantify the extent of hypoxia.
1.3 HYPOTHESIS

4
One downfall with LPS, is that it is an artificial means of creating an inflammatory
response in astrocytes. Therefore, there is a need to examine the effectiveness of the MSCs in a
more relevant injury environment. This led to the examination of the effectiveness of the MSCs
on astrocytes in an OGD environment which models stroke in vitro. By determining that the MSCs
retain their effectiveness in an OGD model will allow for the use of MSCs to continue to even more
relevant models such as tri-culture with neurons, organotypic slice cultures, or an in vivo stroke
models. The hypothesis is that the MSCs will modulate the reactivity of the astrocytes and that
alginate encapsulated MSCs will perform equal to or better than a monolayer MSCs.

5
CHAPTER 2: MATERIALS AND METHODS
2.1 PRIMARY CELL CULTURE
All animal procedures were approved by Rutgers animal committee (Piscataway, NJ).
Astrocytes are obtained from Sprague-Dawley rat pups (Taconic Biosciences Inc.) postnatal 2-3
days as previously described13. In short, the rat pups were decapitated and the skin on top of the
skull was removed by using scissors. The brain was then lifted out with forceps and placed in a
petri dish with ice cold dissection media, Hanks’ balanced salt solution (Sigma-Aldrich). The two
hemispheres are then separated and the cerebral cortices isolated. The meninges are removed.
The tissue is then diced into small pieces and incubated with 0.1% trypsin (Sigma-Aldrich) and
0.02% DNase (Sigma-Aldrich) for 20 minutes. The tissue is then triturated several times until a cell
suspension is obtained. The cell suspension is washed twice with DMEM (Sigma-Aldrich) +10%FBS
(Atlanta Biologicals) and filtered through a 40um nylon mesh. The cell suspension is then
centrifuged at 1000 RPM for 5 minutes and then placed into a 75cm2 culture flask with 10ml
culture media (DMEM + 1% pen/strep (Sigma-Aldrich) + 1% L glutamine (Sigma-Aldrich) +
10%FBS). After 6-7 days the astrocytes become confluent and are trypsinized with 0.25% trypsin
EDTA (Sigma-Aldrich) and used for experiments or passaged. Passages 1 and 2 were used for
experiments.
2.2 HUMAN MESENCHYMAL STEM CELLS
Human bone-marrow mesenchymal stromal cells from donor 2 purchased from Texas
A&M and was previously characterized8. MSCs were thawed from passage 2. The frozen MSCs is
first thawed in a 37oC water bath until a small amount of ice remained. Then the MSCs was
removed and had 5ml of cold MEM-alpha (Gibco) with 10% FBS, 1% penicillin streptomycin, 1% L-
glutamine, and 1ng/ml human fibroblast growth factor (Gibco) added dropwise. 1ml of the
solution was added back to the cryovial to get all cells out. The MSCs was then centrifuged at 400

6
RCF for 5 minutes. MSCs was then plated into a 175cm2 flask with 20ml of culture media. After 3-
4 days the MSC would reach 70% confluency and was passage into two 225cm2 flasks. MSCs was
used between passages 3-6. Monolayer MSCs were plated 1 day prior to use in a transwells at a
density of 1.25x10⁴ cells. The final density of the monolayer MSCs was assumed to be 2.5x10⁴ at
the time of use.
2.3 MESENCHYMAL STEM CELL ALGINATE ENCAPSULATION
Mesenchymal stem cells were encapsulated in alginate poly-l-lysine (PLL) as previous
described7. A 2.2% (w/v) alginate solution was made with no glutamine, no calcium, high glucose
DMEM. Previously cultured MSCs were disassociated from the culture flask and re-suspended in
the 2.2% alginate solution with 90% alginate solution and 10% no calcium, no glutamine, high
glucose DMEM at a seeding density of 2x10⁶ cells/ml. This concentration and seeding density has
been previously determined to maintain cell viability and maintain the MSC in an un-
differentiated state6. The alginate solution was then extruded through a 500uM needle into a
crosslinking solution to create capsules of approximately 400uM. The crosslinking solution is
made up of D-+-Glucose (Sigma-Aldrich) 13.8mM, NaCl (Sigma-Aldrich) 145mM, MOPS (Sigma-
Aldrich) 10mM, CaCl2 (Sigma-Aldrich) 100mM, and DI water. The extruder was set at a flow rate
of 10ml per hour, and the electrode to 6.4kV. The capsules stay in the crosslinking solution for 10
minutes. The capsules are then washed with PBS (Gibco), filtered and washed with PLL (Sigma-
Aldrich) for 2 minutes. After the PLL wash, the capsules are washed with PBS, filtered and washed
with culture media. The capsules are filtered again and suspended in 5ml culture media in an
upright 25cm2 culture flask. MSCs capsules were then stained with propidium iodide (Molecular
Probes) and DAPI (Molecular Probes) to count number of live and dead cells. Propidium iodide is
a molecule that can only get into cells when the cell membrane is broken down, therefore making
it a marker for dead cells. DAPI is a molecule that binds to DNA, allowing for cells to be identified.
7
Any cell with DAPI and no propidium iodide stain is a live cell and any cell with both DAPI and
propidium iodide stain is a dead cell. Capsules were used 1 day after encapsulation. Encapsulated
MSCs are plated into a transwell at 2.5x10⁴ MSCs per well.
2.4 OGD INJURY
Astrocytes are used at passage 1 or 2 and are plated at 5x10⁴ cells per well in normal
culture media. After 48 hours, experimental wells are washed with glucose free, serum free
DMEM and control cells washed with normal culture media. After washing, experimental wells
had new glucose free, serum free DMEM added that has been deoxygenated for 5 minutes and
control wells had normal culture media. Deoxygenation was done by putting the culture media in
a vacuum with shaking. Experimental wells were placed into a hypoxic incubator set to 1% O2, 5%
CO2 and 94% N2. Experimental wells were left in a hypoxic chamber for 2.5, 5, 10 hours. Control
conditions were cultured in normoxia. After OGD duration, all media were collected and store for
further analysis. Some wells were fixed after OGD to be tested for HIF-1α. Experimental conditions
had serum free DMEM media added and control conditions had normal media. All conditions were
placed into normoxia for a 24 hour recovery period. After 24 hours, all media were collected and
the cells were fixed for further staining.
2.5 MSCS, PGE2, AND BDNF TREATMENT All treatments were added immediately after OGD for the full duration of recovery. MSCs
was added as a monolayer or encapsulated as previously described. Exogenous PGE2 (Cayman
Chemical) and BDNF (Peprotech) was added during the recovery period. PGE2 was dissolved in
sterile PBS and then diluted in serum free DMEM media to the appropriate concentration.
Concentrations of 1000, 2000, 4000, and 16000 pg/ml was used. BDNF was dissolved in sterile
PBS and diluted in serum free DMEM media to the appropriate concentration. Concentrations of
12.5, 25, 50, and 100 pg/ml were used.

8
2.6 CYTOKINE ANALYSIS
Media collected after OGD and after recovery was stored at -20oC. Samples were tested
for rat TNF-α (Biolegends) and total PGE2 (Cayman Chemicals) according to the manufacturer’s
instructions.
2.7 FIXATION AND IMMUNOSTAINING
All cells were fixed with 4% w/v paraformaldehyde (PFA) (Sigma-Aldrich) for 30 minutes.
After 30 minutes, cells were washed with immunobuffer (1x PBS + triton-x + BSA) (Sigma-Aldrich)
3 times for 5 minutes each time. After immunobuffer, the cells were blocked with 10% normal
goat serum (Sigma-Aldrich) made in immunobuffer for 1 hour. After blocking, primary antibody
for GFAP was added at 1:500 for 1 hour. GFAP made in rabbit (DAKO) and GFAP made in chicken
(Aves) was used. After the primary antibody, the cells were washed 3 times for 5 minutes with
immunobuffer. Next a secondary goat anti-rabbit 488 (Invitrogen) or goat anti-chicken 568
(Invitrogen) was added at 1:500 for 1 hour. The cells were then washed 3 times for 5 minutes with
immunobuffer. DAPI was added for 10 minutes at 2:500 and then washed 3 times for 5 minutes
with immunobuffer. All antibody dilutions were done in immunobuffer. HIF-1α was done in a
similar manner with the following changes. The cells were blocked for 2 hours and the primary
antibody is a monoclonal anti-HIF-1α produced in mouse clone ESEE122 (Sigma-Aldrich) at a
1:1000 dilution. The secondary antibody was goat anti-mouse 568 (Invitrogen) at 1:1000 dilution
for 2 hours.
2.8 GFAP ANALYSIS
Cells stained for GFAP were imaged under an inverted microscope at 10x. The intensity of
the GFAP stain was compared between conditions. This was done by first thresholding the images
to create a mask. The mask is then multiplied with the original image, retaining GFAP positive

9
stained pixel values and background values to 0. The intensity and number of pixels of positive
staining was recorded (Figure 1).
Figure 1. Diagram representing how the images for GFAP positive astrocytes were processed. A) Represents the original image, B) represents the mask, C) represents the multiplied image of A and B, and D) represents the intensity value of GFAP positive staining as a percent number.
9 images were captured for each condition and each experiment was repeated 3 times.
The intensity value for each GFAP positive pixel was binned into a low or high intensity bin. The
low intensity pixel bin is set by having 80% of the GFAP positive pixels from the control condition
falling into the low bin and the high bin having 20% of the GFAP positive pixels of control. This
was done for each image and then the images were averaged together for each condition.
2.9 HIF-1α ANALYSIS
Cells stained for HIF-1α were imaged under an inverted microscope at 10x. The number
of DAPI positive and nuclear HIF-1α positive cells were quantified. A percent positive number was
generated. This was done for 9 images for each condition repeated 3 times.
2.10 MORPHOLOGY OF ASTROCYTES

10
Using the GFAP images of the astrocytes, the perimeter and area of 10 cells per images
was obtained in order to create a morphology number. The morphology number is calculated by
dividing the perimeter by the area as previously done14.
2.11 Statistical Analysis
All statistical analysis was performed using MATLAB. An ANOVA was performed with a
post-hoc Turkey-HSD test. Groups are considered significantly different with a P value ≤ 0.05. All
results are a mean ± standard deviation unless otherwise noted. OGD only, monolayer MSC, and
encapsulated MSCs experiment was performed 3 times in triplicate. Exogenous PGE2 experiment
was performed in duplicate with triplicates.
11
CHAPTER 3: RESULTS
3.1 BASE MODEL CHARACTERIZED: HIF-1α
The literature has different ways of setting up an OGD system, so determining the base
response of the astrocytes in this OGD system was essential15, 16. To determine if a hypoxic
environment was created, the astrocytes were stained for HIF-1α. Immediately after OGD
exposure astrocytes were fixed and stained for HIF-1α. Under normoxia, HIF-1α is rapidly
degraded. However, under hypoxia, HIF-1α is translocated into the nucleus of the cell.
Interestingly, there was a small degree of nuclear staining in control astrocytes but a much
larger degree in hypoxic exposed astrocytes (Figure 2a). Additionally, there was a decrease in the
percent positive nuclear stained astrocytes with increasing hypoxic exposure (Figure 2b). 2.5
hours of OGD had 7.35 fold increase compared to control. 5 and 10 hours of OGD had a 5.29 and
3.35 fold change compared to control.

12
3.2 GFAP EXPRESSION
Having confirmed that the astrocytes were in a hypoxic environment, astrocyte GFAP
expression was evaluated. Astrocytes were stained for GFAP after OGD exposure and a 24 hour
recovery period. A 24 hour recovery period was chosen based on previous studies with LPS15.
Astrocytes were in an OGD environment for 2.5, 5, and 10 hours and then returned to normoxia
for a 24 hours recovery period. Control astrocytes were evaluated for GFAP to obtain a baseline
expression level as shown in Figure 3. With OGD there is an increase in GFAP expression as shown
by immunofluorescent staining.
Figure 2. HIF-1α immunostaining of rat astrocytes and analysis. A) HIF-1α (red) immunostaining of rat astrocytes exposed to hypoxia for 0 (control), 2.5, 5, and 10 Hrs with no recovery. Astrocytes also stained with DAPI (blue). B) Quantification of HIF-1α immunostaining by normalized percent nuclear positive cells. Images are representative images and quantification is an N=3 with each N having 3 triplicates. Error bars are standard deviation. * P≤0.05 compared to control.

13
Figure 3. Immunoflorscent staining for GFAP (green) in astrocytes exposed to OGD with a 24 hr recovery period. Astrocytes were stained with nuclear stain DAPI (blue). These images are representative images for each condition: control, 2.5, 5, 10 hrs of OGD with 24 hr recovery.
Visually there is a difference in GFAP intensity between control and OGD exposure. To
quantify this difference in GFAP staining, the GFAP positive cells were binned in a low or high
intensity bin as previously stated in methods. OGD conditions have a lower percent of pixels in
the low bin and a higher percent of pixels in the high bin (Figure 4). There is no time dependent
response to OGD when looking at GFAP intensity. The percent number of pixels for 2.5, 5, 10 hours
OGD are 0.629, 0.587, and 0.629 respectively, for the low intensity bin compared to 0.8 for
control.

14
Figure 4. Histogram graph of control, 2.5, 5, 10 hours of OGD with recovery. GFAP positive pixels binned into a low and high intensity bin. OGD increases the percent of high intensity pixels compared to control for all durations. * P≤0.05 compared to control
3.3 MORPHOLOGICAL CHANGES IN ASTORCYTES
Next the morphology of the astrocytes was analyzed. There is a change in the astrocytes
going from a polygonal state (Figure 5a) to a stellate state (Figure 5b) after OGD indicating
astrogliosis. With a zoomed in view, the astrocytes exposed to OGD have become elongated.

15
270 astrocytes per condition were analyzed and averaged. OGD conditions have a
significant increase in morphology compared to control and a time dependent increase although
not significantly. Figure 6a shows the average perimeter to area ratio and Figure 6b shows the
perimeter to area ratio binned at a bin size of 0.05. The increase in average perimeter to area
ratio is due to the increase in number of astrocytes having ratios larger than 0.1.
A B
Control 10 Hrs OGD
Figure 5. Astrocytes stained with GFAP (green) and DAPI (blue). A) Control astrocytes with a zoomed in view below. Astrocytes in a polygonal state. B) Astrocytes exposed to 10 hours of OGD with recovery with a zoomed in view below.

16
3.4 MONOLAYER MSCS
The GFAP expression of the astrocytes was examined after a 24 hour treatment of
monolayer MSCs. Figure 7 shows the images of the GFAP immunostaining with a clear decrease
in GFAP staining in monolayer treated astrocytes compared to OGD only. Figure 8 shows the GFAP
intensity of the various conditions grouped by OGD duration. There is a decrease in GFAP intensity
A
B
Figure 6. A) Average perimeter over area ratio for control. 2.5, 5, 10 hrs of OGD with recovery. B) Histogram of 270 cells per condition analyzed binned at 0.05 increments. * P≤0.05 compared to control.
17
with monolayer MSCs treatment, but not to a control level intensity. 5 hours of OGD with
monolayer treatment of OGD is still significantly different than control levels of OGD. 2.5 hours of
OGD with monolayer treatment had 73% pixels for the low intensity bin. 5 hours of OGD with
monolayer treatment had 69% pixels for the low intensity bin. 10 hours of OGD with monolayer
treatment had a 70% pixels for the low intensity bin. Figure 9 shows the average perimeter to
area ratio for the astrocytes as control, OGD only and OGD with monolayer treatment. Monolayer
MSCs treatment reduced elongation to a control level. Control astrocytes had a ratio of 0.088
compared to 0.089, 0.095, and 0.088 for 2.5, 5, and 10 hours of OGD with monolayer treatment.
Figure 7. GFAP immunostaining (green) and DAPI (blue) for astrocytes treated with and without monolayer MSC after OGD. Representative images of astrocytes stained for GFAP. Monolayer MSC treatment has a reduction in GFAP intensity compared to no treatment.

18
Figure 8. GFAP intensity analysis of control, OGD only, and OGD with monolayer MSC treatment for 2.5, 5, and 10 hours of OGD. For each duration of OGD there is a clear increase in low intensity GFAP with monolayer MSCs treatment. *P≤0.05 compared to control. ** P≤0.05 compared to OGD only.

19
Figure 9. Morphology analysis of astrocytes by perimeter over area exposed to 0, 2.5, 5, and hours of OGD with and without monolayer MSCs treatment. Monolayer MSCs treatment reduces the perimeter over area ratio to that of a control level. *P≤0.05 compared to control. ** P≤0.05 compared to OGD only.
3.5 ENCAPSULATED MSCs
Encapsulated MSCs was added after OGD during the recovery period for 24 hrs.
Encapsulated MSCs reduced the GFAP intensity as seen by immunostaining (Figure 10). Control
GFAP expression levels are lower than OGD only and OGD with encapsulated MSCs. Encapsulated
MSCs GFAP intensity was lower than OGD only. This was consistent across all durations of OGD
(Figure 11). Only 5 hours of OGD with encapsulated MSCs was significantly different than OGD
only. Additionally the perimeter to area ratio was reduced with encapsulated MSC treatment for
all durations of OGD (Figure 12). For each OGD duration, encapsulated MSCs reduced the
perimeter to area ratio to a control level.

20
Figure 10. GFAP immunostaining (green) and DAPI (blue) for astrocytes treated with and without encapsulated MSC after OGD. Representative images of astrocytes stained for GFAP. Encapsulated MSCs treatment has a reduction in GFAP intensity compared to control.
Figure 11. GFAP intensity analysis of control, OGD only, and OGD with encapsulated MSC treatment for 2.5, 5, and 10 hours of OGD. *P≤0.05 compared to control. ** P≤0.05 compared to OGD only.

21
Figure 12. Morphology analysis of astrocytes by perimeter over area exposed to 0, 2.5, 5, and hours of OGD with and without encapsulated MSCs treatment. Monolayer MSCs treatment reduces perimeter over area ration to that of a control level. *P≤0.05 compared to control. ** P≤0.05 compared to OGD only.
3.6 TNF-α
Astrocyte supernatants were tested for TNF-α. Supernatants collected immediately after
OGD and after OGD with recovery were tested. The levels of TNF-α were below the standard curve
and near zero for all controls, OGD conditions, monolayer MSCs conditions, and encapsulated
MSCs conditions for both immediately after OGD and those collected after the recovery period.
3.7 PGE2
Supernatants collected after the recovery period was tested for total PGE2 levels. Figure
13 shows the normalized levels of PGE2 for each duration of OGD, control, monolayer MSCs and
encapsulated MSCs treatment.

22
Figure 13. Total PGE2 levels for 2.5, 5, and 10 hours of OGD for control, monolayer MSCs, and encapsulated MSCs. PGE2 levels are normalized to control.
In OGD only, total PGE2 or PGE2 produced by astrocytes was reduced compared to
control. Monolayer MSCs treatment restored total PGE2 levels to control. Encapsulated MSCs
increased total PGE2 above control levels. Since total PGE2 was measured, the amount of PGE2 is
a combination of PGE2 produced by both the astrocytes and the MSCs. Therefore, monolayer
MSCs and encapsulated MSCs total PGE2 levels could be the addition of PGE2 that MSCs make.
To further determine if PGE2 produced by MSCs are responsible for the changes in
astrocytes, exogenous PGE2 was added during the recovery period instead of MSCs. Figure 14
shows the GFAP stained astrocytes with and without exogenous PGE2. Visually there does not
seem to be a difference in GFAP intensity or morphology between OGD only and exogenous PGE2.

23
Figure 14. GFAP immunostaining (green) and DAPI (blue) for astrocytes treated with and without exogenous PGE2. Representative images for each condition are shown. Images for 2ng/ml of PGE2 were chosen since this was near the total PGE2 level seen in the supernatant.
In order to see if there is a dose response to PGE2, exogenous PGE2 of 0, 1, 2, 8, and 16
ng/ml was added during the recovery period. For each duration, astrocytes were stained for
GFAP and analyzed. Figure 15 shows the GFAP intensity analysis. For each duration of OGD,
there is no significant difference in GFAP intensity with the different dosage compared to OGD
only.
24
Figure 15. GFAP intensity analysis of astrocytes after being exposed to exogenous PGE2 during the recovery period. Concentrations of 0, 1, 2, 8, and 16 ng/ml of PGE2 were used.
Exogenous PGE2 did not change GFAP intensity even after going above the total PGE2
levels observed with encapsulated MSCs. This means that PGE2 is not responsible for the changes
seen with MSCs treatment.

25
CHAPTER 4: DISCUSSION
4.1 OGD
As astrocytes become more and more of the focus in brain injuries, their role continues
to evolve and new information is gained. Astrocytes role during stroke is not one that is well
understood, however, there are previous experiments exposing astrocytes to a stroke
environment in vitro through an OGD system. However, the method of creating an OGD
environment is not consistent between research groups, creating a wealth of knowledge which
doesn’t always agree with each other15, 16. Therefore, it is currently necessary for each lab group
to create their own baseline OGD system. In this system a 1% O2 OGD system was used. With this
system we found several interesting characteristics of astrocytes during OGD which generally
agree with the literature.
The activation of astrocytes is an expected result of putting astrocytes into an OGD
environment which is supposed to mimic an injury. With the activation of astrocytes there is an
increase in GFAP expression. However, the unexpected result is that there is no time dependent
increase in GFAP as seen in Figure 3. There are several possible reasons for this. One reason
possible reason is the control over the actual O2 levels. All the time points were done in the same
incubator, however, even briefly opening the incubator to take samples in or out dramatically
increased the O2 percentage briefly. This intermediate increase in O2 could be a possible
explanation for the lack of a time dependent result. If greater control of the O2 level were possible
with our current system, it is hypothesized that a time dependent increase in GFAP would be
observed. Another possible reason is that the GFAP expression has reached a steady state after
2.5 hours and that if an earlier time point would be used then a time dependent GFAP expression
would be seen.

26
In our system, the astrocytes also went under a change in morphology. Astrocytes forming
glial scars during brain injury is known. In in vitro systems, this change in morphology is not well
documented. There are few papers trying to characterize the morphology of astrocytes during
injury. At most, papers will make note of the change in morphology, but will not try to characterize
it17. In this paper, we used a perimeter over area ratio to characterize the shape of the astrocytes
following a previous paper that used the same method18. Interestingly, with the morphology,
there was a time dependent change in the perimeter to area ratio with astrocytes although not
significantly different between OGD durations as seen in Figure 6. There is a need to establish a
common method for analyzing astrocyte morphology, which is not as simple as other cell types
do to the branching of astrocytes.
4.2 MONOLAYER MSCs VS ENCAPSULATED MSCs
The result of these experiments is the modulation of GFAP and morphology by the MSCs.
The expected result was that the MSCs would modulate GFAP and morphology changes because
in previous experiments of using MSCs were able too19. Monolayer and encapsulated MSCs
treatment worked on a similar level for both the GFAP reduction and the reduction in the
perimeter to area ratio. The interesting result here is that the encapsulated only worked as well
as the monolayer treatment. In previous experiments the encapsulated MSCs worked significantly
better than the monolayer19. This made us wonder what is different in this system compared to
the previous systems.
One the main differences was that the previous systems all had TNF-α in the system. This
is an inflammatory molecule to which the MSCs can react to. The astrocytes in the OGD system
were not producing any TNF-α. One possibility is that no molecule is attaching to the astrocyte
cell surface to tell the astrocyte to produce TNF-α. This OGD model is a simplified system without
neurons and other neuronal cells. In a more complex system with neurons, the neurons would

27
release various factors such as glutamate and other neurotransmitters which could cause for the
astrocytes to produce TNF-α. This in turn could cause for the MSCs to respond more strongly and
therefore respond as previously seen with other systems.
4.3 PGE2 RESPONSE
Even though the monolayer and encapsulated MSCs created a similar result, PGE2 was
investigated as the molecule of interest since PGE2 was the main molecule responsible in previous
systems. However, in the OGD system there was only a small fold increase in PGE2 levels compared
to monolayer and control as seen in Figure 13. In a system were the astrocytes were treated with
LPS, monolayer MSCs produced about 7 ng/ml and encapsulated MSCs produced about 8 ng/ml
of PGE219. To further confirm that PGE2 was not responsible for the changes that were observed,
exogenous PGE2 was added during the recovery phase. With the exogenous PGE2 there was no
change in the GFAP expression confirming that PGE2 is not responsible for the changes.
The mechanism of action of how the MSCs are affecting the astrocytes is still unknown.
Previous experiments have shown that the p38/ MAP JNK are downregulated when monolayer
MSCs are used as a treatment17. This pathway is activated by growth factors or inflammatory
molecules. Therefore, the MSCs must be producing something to either block this pathway or
reduce the production of a growth factor or molecule that the astrocytes are producing do to the
OGD injury.
4.4 IN VIVO STUDIES
There are two types of strokes modeled in in vivo, global and focal. Global involves
blocking carotid arteries or other major arteries leading to the brain while focal blocks the arteries
in the brain and the blockage is maintained for about 15 minutes20. However, the focus has shifted
towards focal stroke model because it mimics strokes more closely. There are several different
methods for inducing in vivo focal stroke. One common method is to clamp off the major arteries

28
such as the middle cerebral arterial occlusion (MCAo)21. This can be done by suturing the artery
or by tying it off with nylon string and lasting for about 2 hours. A more recent method is to use a
photosensitive chemical to create the stroke. When a light source at a specific wavelength is
aimed towards a region in the brain, the photosensitive chemical reacts creating a thrombosis22.
Evaluating the extent of the stroke and the secondary effects are critical for determining if a
treatment works. Histology is used to determine the size of the infarction as well as looking at the
composition of the tissue, such as, myelination, number of neurons, or neuronal stem cells as a
few examples. Cell type markers are also used to determine the types of cell present around the
injury. SDF-1/CXCR-4 have been used to determine the extent of migration of native neural stem
cells.6 Neuronal nuclei (NeuN), microtubule associated protein 2 (MAP2) and synapsin are other
markers used to characterize the injury site23.
MRI allows for physiological information to be directly linked to the anatomical
characteristics in the area of the injury. This can be done by tracking the energy demands of the
tissue. After a stroke, there will be a decrease in activity as the tissue dies and then a subsequent
increase as there is an infiltration of immune cells and neural stem cells23. Additional information
about the tissue can be obtained by combining MRI with other tools such as the use of manganese
to see synaptic connectivity23.
To determine effectiveness of treatment and the extent of the injury in vivo, behavioral
tests were done. These tests look to quantify the neurological condition of the animals along with
the motor function. Neurological tests are subjective at times and performed by looking at typical
animal behavior such as eating habits and other interactions with the environment. Examples of
motor function tests are rotarod test, beam walking, and grip strength21, 22, 24. Furthermore, the
size of infarction is examined via histology. The rotarod test is where the rodent is placed on a

29
rotating rod where the speed of rotation is slowly increased to 20 RPM and last 3 minutes. The
speed and duration were selected so that control animals would not fall off22.
In one study, while investigating the inflammatory response, the p38 and MAPK was
found to be upregulated after injury22. Another study found that there was an increase in neurite
outgrowth and myelin after stroke with MSCs treatment. This was attributed to an increase in
tissue plasminogen activator (tPA) in astrocytes25. MSCs also has the potential to differentiate
towards neuro-like cells. Additionally paracrine factors secreted by MSCs such as BDNF have
proven to help neurite outgrowth. Ischemic MSCs was compared against normal MSCs in order to
determine if MSCs could be obtained from a stroke patient. It was found that ischemic MSCs
performed as well as normal MSCs when looking at neuronal connection and increasing neuronal
survivability21.
Similar effects have been seen with MSCs with other central nervous system injuries. In
an experiment where the lumbar ventral roots of a rat were crushed, a MSCs treatment was
applied and increased the survivability of neurons and their connections compared to no
treatment. Furthermore, there was a decrease in GFAP expression in astrocytes at the injury site26.
In a spinal cord injury model, encapsulated MSCs were found to have modulate inflammatory
response by changing the phenotype of macrophages from a M1 to a M2 state which lead
promoted tissue regeneration8. These results suggest that MSCs can be an effective therapeutic
in a wide range of central nervous system injuries.
.
4.5 FUTURE STUDIES
This thesis shows that MSCs has an effect on GFAP and morphology of astrocytes that
have been exposed to OGD. However, I was unable to determine the mechanism of action of how
the MSCs was doing this. As previously stated, it is possible that a growth factor or cytokine that

30
the astrocytes produce are being reduced. However, what molecule or molecules that the MSCs
are producing this is still unknown. One possible way to reduce the number of possibilities is to
look at an array of common molecules produce by the MSCs and see if there are any significant
changes. This could also be applied to astrocytes in order to determine what growth factors or
cytokines are being reduced if any.
Additionally, this thesis used a very basic model. In order to fully gauge the potential of
the MSCs to help during stroke, a more complex model needs to be used such as a tri-culture with
neurons. This type of system might make the astrocytes produce TNF-α allowing for a greater
response from the MSCs as previously seen. Another step above this would be going to an
organotypic slice culture model. This type of model retains many of the neuronal cell types and
brain structure without doing an in vivo study. Ultimately, if there are still benefits seen in the
more complex models, in vivo studies would be performed to confirm efficacy of the encapsulated
MSCs.

31
REFERENCES 1. "Stroke Warning Signs and Symptoms." Stroke Warning Signs and Symptoms. N.p., n.d.
Web. 16 Oct. 2016. 2. Silver, Jerry, Miller, Jared. “Regeneration Beyond the Glial Scar”, Nature reviews
neuroscience, 5; 145-156, 2004 Feb. 3. Bélanger, Mireille, and Pierre J. Magistretti. “The Role of Astroglia in Neuroprotection.”
Dialogues in Clinical Neuroscience 11.3 (2009): 281–295. Print. 4. Sofroniew, Michael V. “Reactive Astrocytes in Neural Repair and Protection.”
Neuroscientist, 2005 11(5), 400-407. 5. Sofroniew MV, Vinters HV. Astrocytes: biology and pathology. Acta Neuropathologica.
2010;119(1):7-35. 6. Mayo Clinic Staff. "Treatment." Stroke, 10 Aug. 2016 7. Zhang, Run et al. “Anti-Inflammatory and Immunomodulatory Mechanisms of
Mesenchymal Stem Cell Transplantation in Experimental Traumatic Brain Injury.” Journal of Neuroinflammation 10 (2013): 106. PMC. Web. 16 Oct. 2016.
8. Barminko, J., Kim, J. H., Otsuka, S., Gray, A., Schloss, R., Grumet, M. and Yarmush, M. L. (2011), Encapsulated mesenchymal stromal cells for in vivo transplantation. Biotechnol. Bioeng. 108: 2747–2758. doi: 10.1002/bit.23233
9. Middeldorp, J, Hol, E.M., “GFAP in Health and Disease”, Progress in Neurobiology, 93(3), 2011 Mar, 421-443.
10. Yagi, Hiroshi et al. “Mesenchymal Stem Cells: Mechanisms of Immunomodulation and Homing.” Cell transplantation 19.6 (2010): 667–679. PMC. Web. 10 Nov. 2016.
11. Alginate micro-encapsulation of mesenchymal stromal cells enhances modulation of the neuro-inflammatory response
12. Gu, Y., et al. (2016). "Endogenous IL-6 of mesenchymal stem cell improves behavioral outcome of hypoxic-ischemic brain damage neonatal rats by suppressing apoptosis in astrocyte." Scientific Reports 6: 18587
13. Petroski RE, et al. “Basic fibroblast growth factor regulates the ability of astrocytes to support hypothalamic neuronal survival in vitro.” Developmental Biology 1991; 147:1–13.
14. Kai Murk, Elena M. Blanco Suarez, Louisa M. R. Cockbill, Paul Banks, Jonathan G. Hanley J Cell Sci 2013 126: 3873-3883
15. Wei, Shuyong, et al. “Pathways Involved in Oxygen Glucose deprivation Damage of Astrocytes.” Journal of Molecular Neuroscience 2016 Sep 6.
16. Wang, Liang, et al. “Neuroprotective Effect of Neuroserpin in Oxygen-Glucose Deprivation- and Reoxygenation-Treated Rat Astrocytes In Vitro.” PLoS ONE 10(4): e0123932. doi:10.1371/journal.pone.0123932
17. Huang, W., et al. “Paracrine Factors Secreted by MSCs Promote Astrocyte Survival Associated with GFAP Downregulation after Ischemic Stroke via p38 MAPK and JNK.” J. Cell. Physiol., 2015, 230: 2461–2475.
18. Murk, Kai, et al. “The Antagonistic modulation of Arp2/3 Activity by N-Wasp, Wave2 and PICK1 Defines Dynamic Changes in Astrocyte Morphology.” Journal of Cell Science 2013 126: 3873-3883
19. Stucky, EC, et al. “Alginate Micro-encapsulation of Mesenchymal Stromal cells Enhances Modulation of Neuro-inflammatory Response.” Cytotherapy. 2015 Oct; 17(10).
20. Tajiri, Naoki et al. “In Vivo Animal Stroke Models: A Rationale for Rodent and Non-Human Primate Models.” Translational stroke research 4.3 (2013): 308–321.

32
21. Tsai, May-Jywan et al. “Recovery of Neurological Function of Ischemic Stroke by Application of Conditioned Medium of Bone Marrow Mesenchymal Stem Cells Derived from Normal and Cerebral Ischemia Rats.” Journal of Biomedical Science 21.1 (2014): 5.
22. Choi, Y.-K., Urnukhsaikhan, E., Yoon, H.-H., Seo, Y.-K. and Park, J.-K. (2016), Effect of human mesenchymal stem cell transplantation on cerebral ischemic volume-controlled photothrombotic mouse model. Biotechnology Journal, 11: 1397–1404.
23. Gervois, P., Wolfs, E., Ratajczak, J., Dillen, Y., Vangansewinkel, T., Hilkens, P., Bronckaers, A., Lambrichts, I. and Struys, T. (2016), Stem Cell-Based Therapies for Ischemic Stroke: Preclinical Results and the Potential of Imaging-Assisted Evaluation of Donor Cell Fate and Mechanisms of Brain Regeneration. Med. Res. Rev., 36: 1080–1126.
24. Quittet, Marie-Sophie, et al. “Effects of mesenchymal stem cell therapy, in association with pharmacologically active microcarriers releasing VEGF, in an ischaemic stroke model in the rat”, Acta Biomaterialia, March 2015, 15: 77-88.
25. Xin, Hongqi et al. “Increasing tPA Activity in Astrocytes Induced by Multipotent Mesenchymal Stromal Cells Facilitate Neurite Outgrowth after Stroke in the Mouse.” Ed. Henning Ulrich. PLoS ONE 5.2 (2010): e9027.
26. Spejo, A. B., et al. “Neuroprotective effects of mesenchymal stem cells on spinal motoneurons following ventral root axotomy: Synapse stability and axonal regeneration.” Neuorscience, 2013-10-10, 250, 715-732.
33
APPENDIX
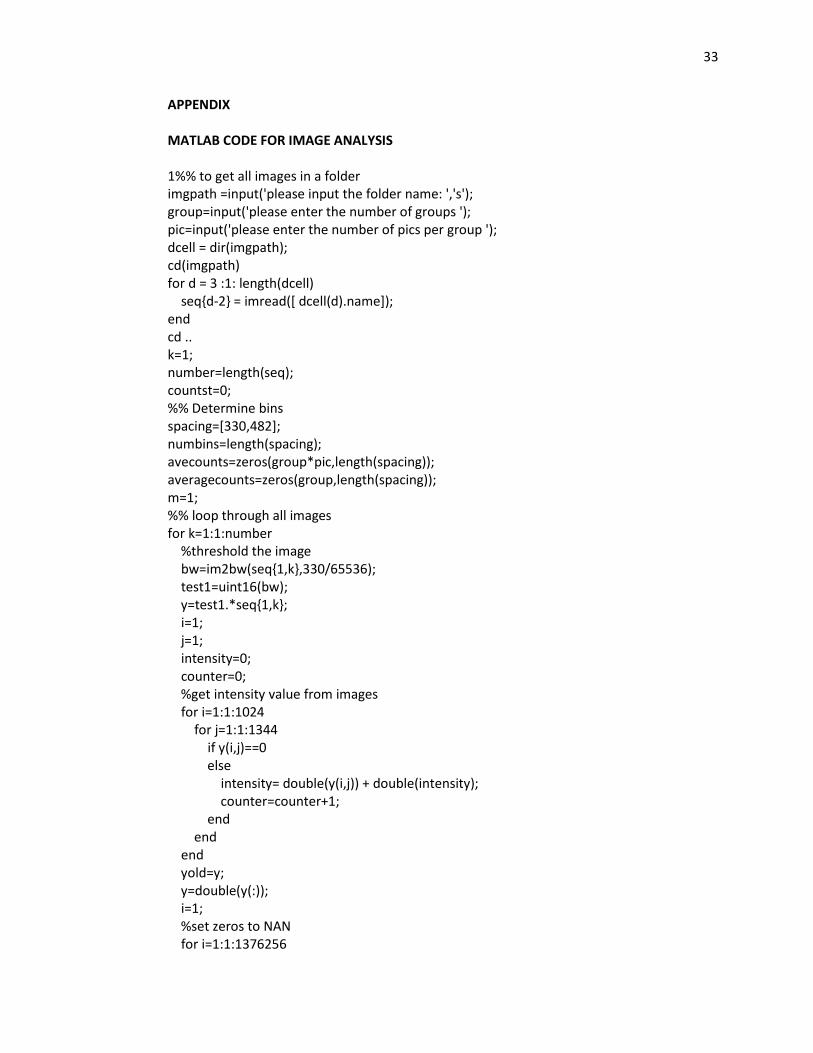
MATLAB CODE FOR IMAGE ANALYSIS
1%% to get all images in a folder imgpath =input('please input the folder name: ','s'); group=input('please enter the number of groups '); pic=input('please enter the number of pics per group '); dcell = dir(imgpath); cd(imgpath) for d = 3 :1: length(dcell) seq{d-2} = imread([ dcell(d).name]); end cd .. k=1; number=length(seq); countst=0; %% Determine bins spacing=[330,482]; numbins=length(spacing); avecounts=zeros(group*pic,length(spacing)); averagecounts=zeros(group,length(spacing)); m=1; %% loop through all images for k=1:1:number %threshold the image bw=im2bw(seq{1,k},330/65536); test1=uint16(bw); y=test1.*seq{1,k}; i=1; j=1; intensity=0; counter=0; %get intensity value from images for i=1:1:1024 for j=1:1:1344 if y(i,j)==0 else intensity= double(y(i,j)) + double(intensity); counter=counter+1; end end end yold=y; y=double(y(:)); i=1; %set zeros to NAN for i=1:1:1376256

34
if y(i,1)==0 y(i,1)=NaN; end end %% %find histogram of each threshold image, then add them up if k<=pic*m [counts bins]=hist(y(:),spacing); %normalize data totalpix(m)=sum(counts); avecounts(k,:)=counts./totalpix(m); %% gets data for statistical analysis stat(k-(pic*(m-1)),(1+numbins*(m-1)):(numbins*m))=counts./totalpix(m); %adds up the number of points per bin countst=counts+countst; if k==pic*m averagecounts(m,:)=mean(avecounts(k-(pic-1):k,:)); standardev(m,:)=std(avecounts(k-(pic-1):k,:)); m=m+1; end end intensityav=intensity/counter; final{1,j}= yold; intensityvalues(k,1)=intensityav; intensityvalues(k,2)=counter; if k==pic*(m-1) intsav(m-1,1)=mean(intensityvalues(k-(pic-1):k,1)); intsav(m-1,2)=std(intensityvalues(k-(pic-1):k,1)); end end %% getting stastistics [p,~,stats]=anova1(stat,[],'off'); c=multcompare(stats);