2017 to 2022 six year forecast -...
TRANSCRIPT

5/24/2016
2
Andy Cherullo, Finance Director
Tadd Wille, Budget Director
May 24, 2016
2017 to 2022 Six Year Forecast

5/24/2016
• Economic Conditions
• General Fund – Revenue Trends
– Expense Trends
• Supported Funds
• Major Other Funds
Overview
4
Economic Conditions

5/24/2016
The City’s economy benefits from the presence of large, stable employers in health care, education, retail sales, transportation and government.
Tacoma Economic Background
Higher Education
UW Tacoma, University of Puget Sound, Pacific Lutheran University
Strong Community & Technical College system
Health Care
Multi-Care, Franciscan, Group Health, Coordinated Care
Professional & Financial Services
State Farm, Columbia Bank, BNY Mellon
Retail Trade
Costco, Bass Pro Shop, Walmart, Auto Dealers
Hub of Transportation
Port of Tacoma, Marine Terminals Corp., Washington United (Targa), Olympic Container
New Partnership with Port of Seattle
Hub of Government – Federal, Military, State, County, & Local
LOCAL ECONOMY – STRENGTH THROUGH DIVERSITY CORPORATIONS WITH A MAJOR PRESENCE
Many companies have major business units, regional headquarters or their corporate headquarters located within or around the City of Tacoma:
Columbia Bank Korsmo Construction
Tacoma News Tribune BCRA Design
Neil Walter Company SiteCrafting
Brown and Haley Bradken
Sterling Health Care Services Topia Technology
Franciscan Health System True Blue
Multi-Care Health System TCF Architects
WestRock, Inc. Infoblox
Kidder Matthews Real Estate State Farm
5
• The national economy has been improving, but economic data remains mixed. Most economist believe that the economic recovery will continue but at a moderate pace.
• The labor market continues to improve slowly. Unemployment continues to trend lower. Wages are showing signs of increasing. Job growth continues but is weaker than expectations.
• Oil/Gas prices have remained relatively low, but recently have shown signs of increasing.
• Inflation remains low.
• Washington State exports declined in 2015 for the first time since 2009.
• Most forecasts call for moderate growth in GDP.
Economic Overview
6

5/24/2016
4.7%
9.9%
5.8%
5.3%
10.4%
6.6%
2.0%
4.0%
6.0%
8.0%
10.0%
WA StateUnemployemntRate
Pierce CountyUnemploymentRate
SOURCE: US BUREAU OF LABOR STATISTICS
Unemployment Rate
7
Labor Participation Rate

5/24/2016
Industry Peak - 2007 Low - 2012 2014 Change 2007-2014
Agriculture, Forestry, Utilities, Mining 33 3 9 (24)
Construction 3,565 2,341 2,760 (805)
Food & Fabric Manufacturing 837 652 718 (119)
Petroleum Refineries & Wood Product Manufacturing 4,257 3,235 3,221 (1,036)
Metal Products Manufacturing 3,377 2,263 2,456 (921)
Wholesale Trade 3,744 3,326 3,264 (480)
Retail Trade 7,441 6,529 6,201 (1,240)
General Merchandise stores, Book stores, Stores, hobby stores, warehouse stores 3,771 3,778 3,962 191
Air, Water, Rail Transportation 2,833 1,548 3,005 172
Information 1,681 1,000 912 (769)
Finance and Insurance 4,729 3,367 4,473 (256)
Real Estate and Rental and Leasing 1,482 1,384 1,371 (111)
Professional, Scientific and Technical Services 4,188 3,102 3,255 (933)
Management of Companies and Enterprises 764 483 469 (295)
Administrative and Support and Waste Management and Remediation Services 3,455 5,028 5,752 2,297
Educational Services 1,476 1,574 1,625 149
Health Care and Social Assistance 21,371 21,823 24,891 3,520
Arts, Entertainment and Recreation 745 1,033 1,088 343
Accommodation and Food Services 9,272 8,209 8,604 (668)
Other Services (except Public Administration) 5,597 6,259 3,780 (1,817)
Government 12,355 12,635 12,288 (67)
Education 5,900 5,984 6,201 301
Total 103,304 96,193 101,087 (2,217)
Tacoma Employment By Industry
SOURCE: PUGET SOUND ECONOMIC FORECASTER
9
$34,398
$43,561
$38,241
$49,551
$25,000
$30,000
$35,000
$40,000
$45,000
$50,000
2003 2004 2005 2006 2007 2008 2009 2010 2011 2012 2013 2014
Pierce County
WA State
Per Capita Personal Income
SOURCE: US BUREAU OF ECONOMIC ANALYSIS
10

5/24/2016
-12%
-9%
-6%
-3%
0%
3%
6%
9%
12%
Pierce County Personal Income and Retail Sales
SOURCE: PUGET SOUND ECONOMIC FORECASTER
11
Tacoma Gas Prices
12
5/24/2016
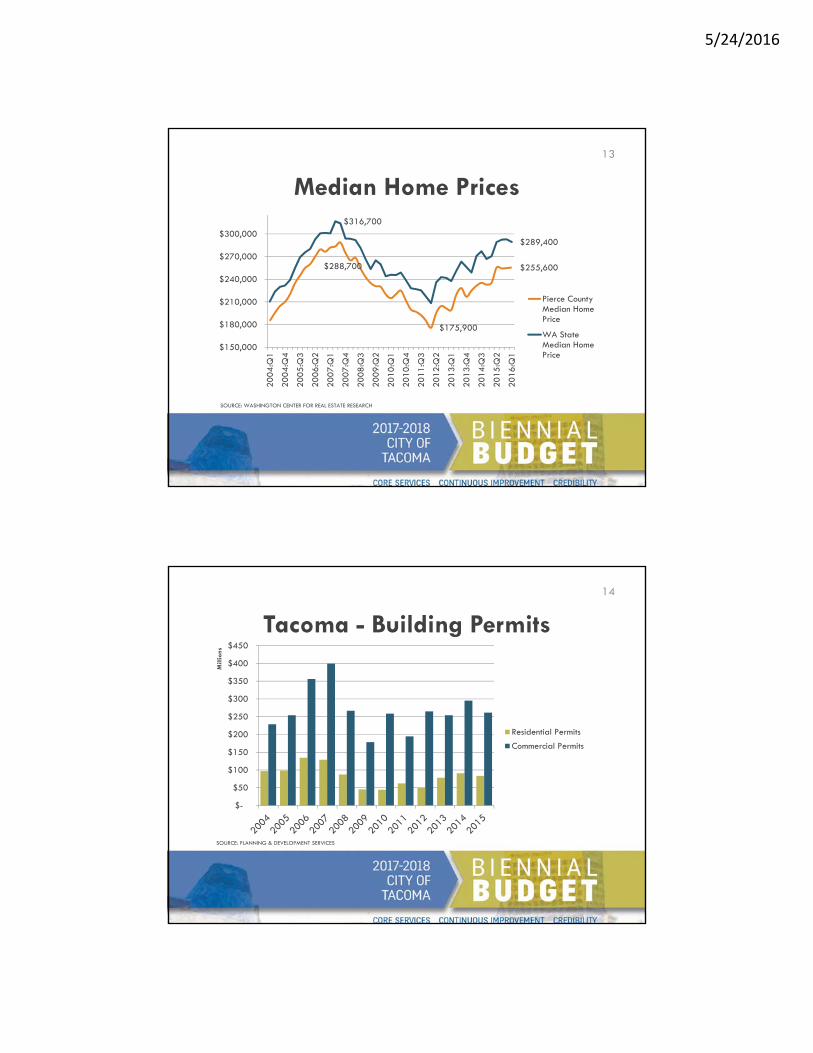
$288,700
$175,900
$255,600
$316,700
$289,400
$150,000
$180,000
$210,000
$240,000
$270,000
$300,000
20
04
:Q1
20
04
:Q4
20
05
:Q3
20
06
:Q2
20
07
:Q1
20
07
:Q4
20
08
:Q3
20
09
:Q2
20
10
:Q1
20
10
:Q4
20
11
:Q3
20
12
:Q2
20
13
:Q1
20
13
:Q4
20
14
:Q3
20
15
:Q2
20
16
:Q1
Pierce CountyMedian HomePrice
WA StateMedian HomePrice
Median Home Prices
SOURCE: WASHINGTON CENTER FOR REAL ESTATE RESEARCH
13
SOURCE: PLANNING & DEVELOPMENT SERVICES
Tacoma - Building Permits
$-
$50
$100
$150
$200
$250
$300
$350
$400
$450
Mill
ions
Residential Permits
Commercial Permits
14

5/24/2016
0.0%
0.5%
1.0%
1.5%
2.0%
2.5%
3.0%
1 mo 3 mo 6 mo 1 yr 2 yr 3 yr 5 yr 7 yr 10 yr 20 yr 30 yr
May 2015
May 2016
Interest Rates
SOURCE: US DEPARTMENT OF THE TREASURY
15
Consumer Confidence
16

5/24/2016
$1
$6
$11
$16
$21
2005 2006 2007 2008 2009 2010 2011 2012 2013 2014 2015
Billi
ons
China
Canada
Japan
South Korea
United Arab Emirates
Chile
Taiwan
Singapore
United Kingdom
Turkey
Saudi Arabia
Mexico
WA State Exports
17
SOURCE: INTERNATIONAL TRADE ADMINISTRATION – US DEPT. OF COMMERCE
17
Economic Overview SummaryOn the Negative Side:• Slow GDP Growth (.5% last quarter)
• China continues to slow
• Europe continues to slow
• Negative interest rates
• US dollar is strong
• Oil/gas prices are relatively low
• Low inflation
18
Summary - the economy is still trying to find its new normal after the Great Recession. There are many positive signs in the economy, but there remains some sluggishness and risks.
On the Positive Side:• Job growth continues• Unemployment numbers
stable/dropping • Oil/Gas prices relatively low• Housing market is growing, home
prices are increasing• Personal Income growing• Interest rates still relatively low• US dollar is strong

5/24/2016
19
2017-2022General Fund Forecast
• Forecast reflects funding to provide today’s level of City services
• $6.7M Gap projected for 2017-2018 Biennium• General Fund expenditures are growing at a faster
rate than revenues
General Fund Forecast
Annual % Growth from 2017-2022
Revenue 1.8%
Expense 2.7%
20

5/24/2016
General Fund Forecast ($ in millions)
21
$393.1$403.8 $423.6
$436.3
$453.1
$472.1
$386.7$378.8
$426.9
$442.9
$461.5
$484.7
$350
$370
$390
$410
$430
$450
$470
$490
$510
2011-2012 2013-2014 2015-2016 2017-2018 2019-2020 2021-2022
Revenues Expenditures
($6.7)Or 1.5%
Gap
($8.4)Or 1.8%
Gap
($12.6)Or 2.6%
Gap
2015 Actual
2016 Estimate
2017Projection
2018Projection
2019 Projection
2020 Projection
2021Projection
2022 Projection
Revenues $211.1 $212.5 $216.3 $220.0 $224.2 $228.9 $233.6 $238.5
Expenditures 203.8 223.1 218.3 224.6 228.2 233.3 239.5 245.2
Structural Balance
7.3 (10.6) (2.0) (4.6) (4.0) (4.5) (5.9) (6.7)
General Fund Forecast
($3.3) ($6.7) ($8.4) ($12.6)
($ in millions)
22

5/24/2016
23
General Fund Revenues
$190.2$202.9 $200.7 $203.1 $211.1 $212.5 $216.3$220.0 $224.2
$228.9 $233.6$238.5
$0
$50
$100
$150
$200
$250
$300
2011 2012 2013 2014 2015 2016 2017 2018 2019 2020 2021 2022
All General Fund Revenues
1.8%2.7% Average annual increase
($ in millions)
24

5/24/2016
$49.1$52.2 $51.9 $53.6 $54.9 $56.2
$57.6 $59.0 $60.5 $62.0 $63.5 $65.1
$0
$10
$20
$30
$40
$50
$60
$70
2011 2012 2013 2014 2015 2016 2017 2018 2019 2020
Property Tax
2.4%2.9% Average annual increase
($ in millions)
25
2021 2022
$40.9 $40.3$43.5 $44.5 $46.3 $46.3 $46.4 $46.5 $47.0 $47.5 $48.0 $48.7
$0
$10
$20
$30
$40
$50
$60
2011 2012 2013 2014 2015 2016 2017 2018 2019 2020 2021 2022
Business Tax($ in millions)
3.2% 0.7%Average annual increase
26

5/24/2016
$39.7 $41.5 $42.4 $43.4$45.9 $46.6
$48.2 $49.7 $51.3 $52.9 $54.4 $56.0
$0
$10
$20
$30
$40
$50
$60
2011 2012 2013 2014 2015 2016 2017 2018 2019 2020
Sales Tax($ in millions)
2.9%3.7% Average annual increase
27
2021 2022
$41.2
$43.4
$45.1
$41.7 $41.5$42.4
$43.2$44.1
$45.1$46.0
$47.0$47.9
$36
$38
$40
$42
$44
$46
$48
$50
2011 2012 2013 2014 2015 2016 2017 2018 2019 2020
Utility Tax
* In 2014, 2% of several Utility Tax revenues began to be directly deposited into the streets fund for dedicated street maintenance. The average annual increase after controlling for the movement in revenues is 3.4%
0.3%* 2.1%Average annual
increase
28
2021 2022
($ in millions)

5/24/2016
29
General Fund Expenditures
• Reflects funding needed to provide today’s level of City services
• Includes adjustments for employee healthcare
• Assumes salary increases based on contractual requirements and historical averages for represented and non-represented employees
• Includes inflators for fixed, operational, and maintenance cost increases
• Includes projected transfers needed to support other funds: Streets, Traffic Enforcement, Permitting, Convention Center, and Tacoma Dome
• Removed one-time adds from 2015-2016 Budget to develop base expenses
Expenditure Assumptions
30

5/24/2016
• Addition of General Fund support for the Streets Initiative ($3M per year)
• Reduced jail services costs
• Commitment of $2M for Eastside Community Center 2017-2018
Projected Expenses
31
$193.7 $193.0$176.8
$202.0 $203.8$223.1 $218.3 $224.6 $228.2 $233.3 $239.5 $245.2
$0
$50
$100
$150
$200
$250
$300
2011 2012 2013 2014 2015 2016 2017 2018 2019 2020 2021 2022
Total General Fund Expenses
2.7%1.6%
32
Average annual increase
($ in millions)

5/24/2016
$0
$20
$40
$60
$80
$100
$120
$140
$160
$180
2011 2012 2013 2014 2015 2016 2017 2018 2019 2020 2021 2022Personnel M&O and Fixed CostsOther/Non-Dept/Assessments/Transfers Debt Service
Personnel, Maintenance and Operations, Fixed, Debt and Other
33
($ in millions)
34
Deferred Maintenance and Other Items

5/24/2016
• Fleet
• Facilities
• Public Assembly Facilities (PAF)
Deferred Maintenance and Other Items
Deferred Maintenance
• Eastside Community Center
• Broadway Center for the Performing Arts Capital
• Link Light Rail
Other Items
35
General Fund Forecast ($ in millions)
36
$393.1$403.8 $423.6
$436.3
$453.1
$472.1
$386.7$378.8
$426.9
$485.4$494.6
$507.0
$350
$370
$390
$410
$430
$450
$470
$490
$510
$530
2011-2012 2013-2014 2015-2016 2017-2018 2019-2020 2021-2022
Revenues Expenditure Base Expenditures
($49.2)Or 10.1%
Gap
($41.5)Or 8.4%
Gap
($34.9)Or 6.9%
Gap
5/24/2016
37
Other Considerations
Other Considerations
• Project PEACE Recommendations• Property Crime Taskforce Recommendations • Billboard Enforcement • Behavioral Health Coalition• TERS Experience Study• Foss Waterway Development Authority • Public Safety Enhancements • Library Phase III - RFID
38

5/24/2016
39
Other Funds
Special Revenue Funds• Neighborhood and Community Services Special Revenue
Funds (Mental Health, Grant Funding, Building Fund)• Street Funds• Emergency Medial Services FundsEnterprise Funds • Permitting• Public Assembly Facilities• Environmental Services • ParkingInternal Service Funds
Other Major Funds
40
5/24/2016
41
Forecast Summary
SummaryEconomic Conditions– The economy is still trying to find its new normal. – While there are overall positive signs in the economy, there remains
some sluggishness and risks.
General Fund Fiscal Outlook (2017-2022)– Projected expenditure growth greater than revenue growth
(creating structural gap)– Deferred maintenance and new/expanded services further
increase the revenue and expenditure imbalance– Structural imbalances must be addressed with recurring savings,
efficiencies, and/or new/enhanced recurring revenues – One-time savings/revenues utilized for one-time expenses
42

5/24/2016
Going Forward
• Forecast based on history, economic indicators, and four (4) months of actual data through 2016
• City staff to monitor revenues and expenditures for changes in trends compared to forecasted estimates
• Labor and benefit trends to be closely monitored
• 2017-2018 Proposed Budget will provide recommendations to balance revenues and expenses
43
44
2017-2018 Budget Development

5/24/2016
• Infrastructure – Improve pedestrian and bike safety, energy efficiency, and streets conditions
• Safety – Address safety concerns and improve community based approaches (outreach, positive relationships, communication)
• Housing/Homelessness – Address the length of time of homelessness and repeated incidents of homelessness and increase affordable housing
• Economic Development – Facilitate increases in private investment
Summary of 2017-2018 Council and City Manager Priorities
45
• T-Town Event– Allocation Station
– Survey
• Budget Website– Information on current budget and forecast
– Survey
2017-2018 Community Input
46

5/24/2016
0 100 200 300 400 500 600 700 800
Fix streets in poor condition
Increase homeless services
Clean, green, and beautify the City
Make streets safer for bikes and pedestrians
Increase affordable housing
Improve community policing
Upgrade to energy efficient facilities,…
Invest in blighted areas of the City
Attract private investment
Allocation Station 780 participants each given 5 jewels
47
Budget Survey151 Survey Participants
Community PolicingPolice Services (Emergency
and Non-Emergency Response)
Fire Services (Suppression)
Ambulance or Emergency Medical Services
Library Services
Street Repair and Maintenance
Pedestrian and Bike Infrastructure
Senior Services and Centers
Housing Services and Services for Those
Experiencing Homelessness
Human Services
Youth Services
Code Enforcement and Community Based Services
Small Business Support
Arts and Cultural Program Funding
City-Sponsored Special Events
Attracting Private Investment
Streetlights and Signals
2.00
2.20
2.40
2.60
2.80
3.00
3.20
3.40
3.60
3.80
4.00
3.10 3.20 3.30 3.40 3.50 3.60 3.70 3.80 3.90
ImportantService
Very Important
Service
Fair Service Level
Excellent Service Level
48

5/24/2016
492017-2018 Budget Development Calendar of Events
Date Action
February • City Council Work Session – Set 2017-2018 Priorities
March • Departments 10-Year and Draft 2 –Year Goals
May • T-Town Event• Six-Year Financial Forecast
June • Departments Develop Budget Recommendations• Departments Meet with Budget Office to Review
Recommendations
July • Departments Meet with City Manager
August • 2017-2018 Preliminary Budget Developed
October • 2017-2018 Preliminary Budget Presented to City Council
• City Council Budget Work Sessions
November • City Council Budget Work Sessions• 2017-2018 Budget Adoption
49
50
Andy Cherullo, Finance Director
Tadd Wille, Budget Director
May 24, 2016
2017 to 2022 Six Year Forecast

5/24/2016
51
City Council Study Session
May 24th, 2016
2015 Year End and 1st Quarter 2016 Financials
52
2015 Year End
5/24/2016
53
2015 Year End Summary
• General Fund Revenues– Preliminary year-end revenues favorable over Mid-
Biennium Modification projection: $6.8 Million • Including one time revenues of $1.4 M
• General Fund Expenditures– Positive end of year variance due to delayed
payments and projects. – Anticipate that these expenditures will occur in 2016. – Departments re-planned their remaining biennial
budget (as reflected in the BTD reporting through the first quarter)
54
1st Quarter 2016 General Fund

5/24/2016
55
General Fund Revenue Variance(Millions)
Revenue SourceBTD 1st Q 2016 Plan
BTD 1st Q 2016 Actual
Variance
Property Tax $55.2 $55.9 $0.7
Business Tax 58.1 59.6 1.5
Utility Tax 52.8 53.3 0.5
Sales Tax 55.8 57.5 1.7
Other Revenue 26.4 30.7 4.3
Total 248.3 257.0 $8.7
56
General Fund Expenditure Variance (Millions)
DepartmentBTD 1st Q 2016 Plan
BTD 1st Q 2016 Actual
Variance
Finance $6.3 $5.9 $0.4
Neigh & Comm Svcs 12.5 11.4 1.1
Police 91.3 89.5 1.8
Non Departmental 34.9 34.3 0.6
Other Departments 109.4 109.7 -0.3
Total 254.4 251.8 3.6

5/24/2016
57
General Fund Supported Funds
58
General Fund Supported Funds• Traffic Enforcement• Permit Services• Streets Operations & Engineering• Parking• Public Assembly Facilities
– Convention Center– Tacoma Dome– Cheney Stadium

5/24/2016
59
Budget/Finance Condition Summary• Overall through March 2016, revenue
collections were above budget plan and expenditures were below budget plan
• Budget Office, Finance, and City Manager’s Office will continue to analyze revenue and expenditure trends each month
60
Mid-Year
June 7th Council Meeting• Grants & Capital Projects
• Reimbursements for Services Provided
• Accounting Adjustments
• Recognition of Positive Revenue Trends

5/24/2016
61
City Council Study Session
May 24th, 2016
2015 Year End and 1st Quarter 2016 Financials