2018 annual report - vitec software
TRANSCRIPT

2018 Annual Report

2 Vitec Annual Report 20182 Vitec Annual Report 2018
GROUP OPERATIONS
This is Vitec 3
2018 in brief 4
Comments from the CEO 6
Our position 8
Business model and growth strategy 9
Our segments 11
Sustainability Report 14
Our history 24
Shares and shareholders 26
Contents
Comments from the CEO
Page 6
Business model and growth strategy
Sustainability Report
Page 14Page 9
ANNUAL REPORT
Administration report 30
Corporate governance report 36
- Message from the Chairman of the Board 36
- Board members 39
- Members of Group Management 43
Multi-year overview 45
Proposed appropriation of profits 46
Financial statements 48
- Consolidated statement of profit/loss 48
- Consolidated statement of comprehensive income 49
- Consolidated statement of financial position 50
- Condensed consolidated statement of changes in equity
52
- Consolidated cash flow statement 53
- Parent Company income statement 54
- Parent Company balance sheet 56
- Parent Company changes in shareholders' equity 58
- Parent Company cash flow statement 59
Notes 60
Signatures 100
Auditor’s report 101
Auditor’s statement regarding the statutory sustainability report 104
Definitions of key indicators 105
Shareholder information 107
Text and production: Vitec.Images: Photographer Edel Puntonet, except for the pictures of Irene Appenholm and Bettina Bredkjær Hansen on page 19 taken by Pierre Bendayan and Steffen Stamp. The individ-uals depicted in the images comprise Vitec employees or their children.Cover image: Frode Knudsen and Jarle Osvik, Stavanger.Printing: Arkitektkopia, Umeå.Paper: Munken, eco-labeled.
Vitec Annual Report 2018 3
THIS IS VITEC
Vitec Annual Report 2018 3
THIS IS VITEC
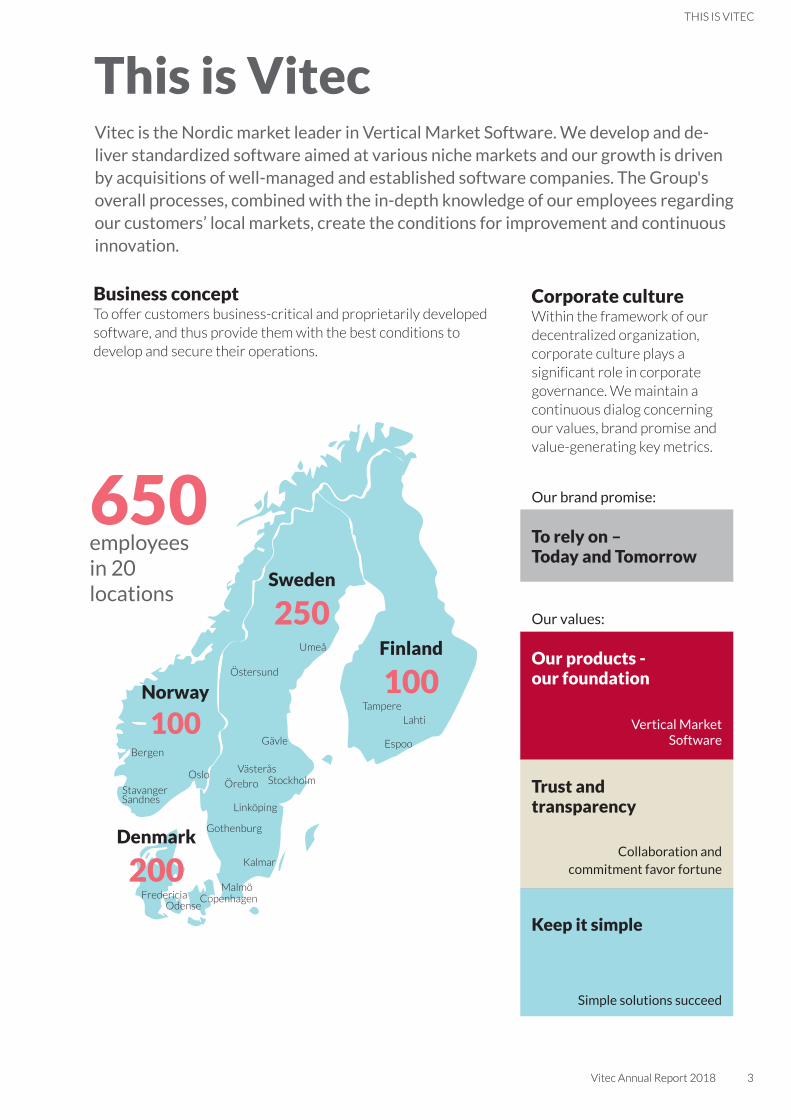
This is VitecVitec is the Nordic market leader in Vertical Market Software. We develop and de-liver standardized software aimed at various niche markets and our growth is driven by acquisitions of well-managed and established software companies. The Group's overall processes, combined with the in-depth knowledge of our employees regarding our customers’ local markets, create the conditions for improvement and continuous innovation.
Finland
100
Sweden
250
Norway
100
Denmark
200
Business concept
To offer customers business-critical and proprietarily developed software, and thus provide them with the best conditions to develop and secure their operations.
Corporate cultureWithin the framework of our decentralized organization, corporate culture plays a significant role in corporate governance. We maintain a continuous dialog concerning our values, brand promise and value-generating key metrics.
Our brand promise:
To rely on – Today and Tomorrow
Our values:
Our products - our foundation
Vertical Market Software
Trust and transparency
Collaboration and commitment favor fortune
Keep it simple
Simple solutions succeed
650employeesin 20 locations
Umeå
Östersund
Gävle
StockholmVästerås
Örebro
Linköping
Gothenburg
Kalmar
MalmöCopenhagenFredericia
Odense
Oslo
StavangerSandnes
BergenEspoo
TampereLahti
4 Vitec Annual Report 2018
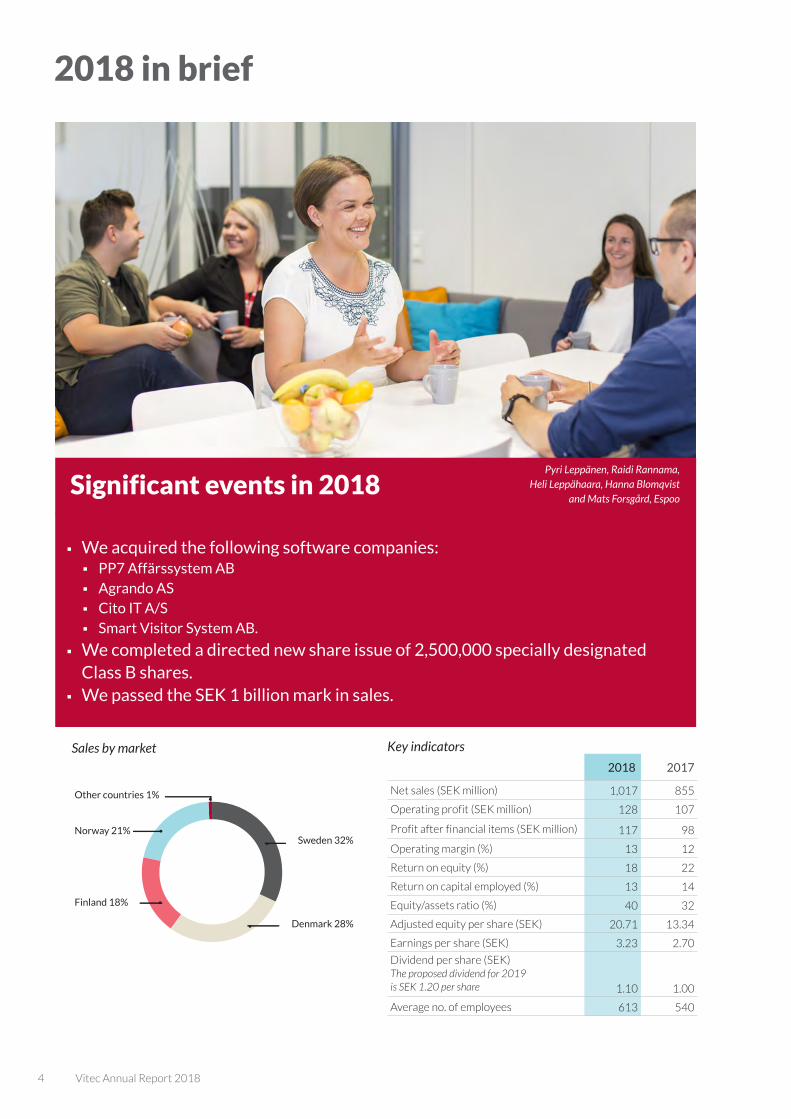
2018 in brief
2018 2017
Net sales (SEK million) 1,017 855
Operating profit (SEK million) 128 107
Profit after financial items (SEK million) 117 98
Operating margin (%) 13 12
Return on equity (%) 18 22
Return on capital employed (%) 13 14
Equity/assets ratio (%) 40 32
Adjusted equity per share (SEK) 20.71 13.34
Earnings per share (SEK) 3.23 2.70
Dividend per share (SEK) The proposed dividend for 2019 is SEK 1.20 per share 1.10 1.00
Average no. of employees 613 540
Sales by market Key indicators
Significant events in 2018
Significant events
� We acquired the following software companies: � PP7 Affärssystem AB � Agrando AS � Cito IT A/S � Smart Visitor System AB.
� We completed a directed new share issue of 2,500,000 specially designated Class B shares.
� We passed the SEK 1 billion mark in sales.
Pyri Leppänen, Raidi Rannama, Heli Leppähaara, Hanna Blomqvist
and Mats Forsgård, Espoo
SEK kurs Antal
Omsättning fördelning marknad
Other countries 1%
Norway 21%
Finland 18%
Sweden 32%
Denmark 28%
2018 i korthet
Vitec Annual Report 2018 5
2018 IN BRIEF
Patrik Ådahl, Tuomas Virtanen and Silva Virtanen, Espoo
6 Vitec Annual Report 2018
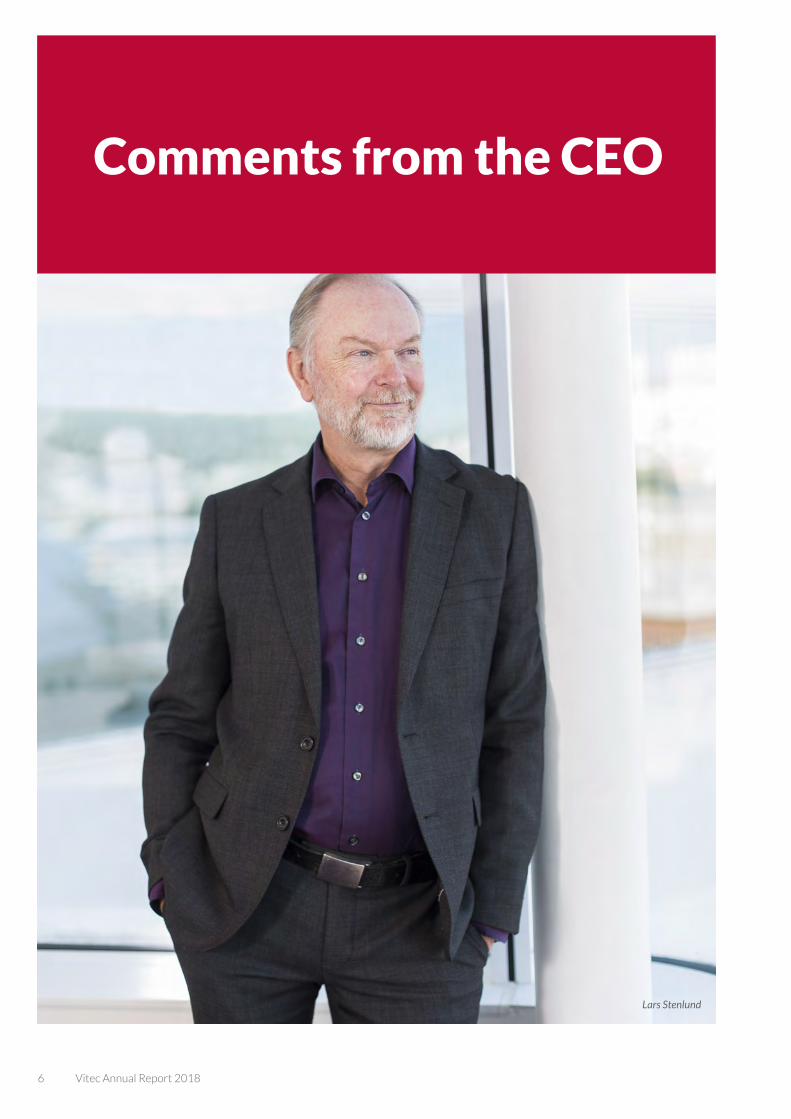
Comments from the CEO
Lars Stenlund
Vitec Annual Report 2018 7
COMMENTS FROM THE CEO
Sales in the billionsIn conjunction with the closing of our books for the year-end, we surpassed two
significant milestones: SEK 1,000 million in sales and SEK 100 million in profit
before tax. Looking back ten years ago, we passed the SEK 100-million mark
in sales and SEK 10 million in profits. Our performance has been favorable and
our business model has proven to be robust.
During the fourth quarter, we designated a directed new share issue to several major institutional investors, increas-ing our shareholders’ equity by nearly SEK 200 million. The placement is a building block for our continued growth and will provide us with financial vigor for the next few years.
During the year, we completed four acquisitions – two in Sweden, one in Norway and one in Denmark. The acquired companies have demonstrated solid profitability and a high percentage of recurring revenues, and collectively contribut-ed more than SEK 110 million in sales.
Growth in recurring revenuesWe are prioritizing growth in recurring revenues, to reduce our dependency on one-off license revenues and volatile service revenues. In 2018, our total growth in recurring revenues was 21.9 percent. Furthermore, we can confirm that organic growth in recurring revenues was slightly above 6 percent. This organic growth in recurring revenues rep-resents a greater contributor to earnings than other revenue types, and has provided consistent support to our business model.
Vertical software companiesVitec is the Nordic market leader in Vertical Market Software, which supports the business processes of specific niche markets. According to the renowned US consultancy firm Gartner, vertical software comprises the largest segment of the overall software industry by far, accounting for more than 25 percent. Most vertical software companies are relatively unknown and have fewer than 50 employees, and few are located within major IT clusters, and as a consequence, are seldom mentioned. Vertical software companies are char-acterized by cost efficiency, precision and a well-defined market. Consequently, while the overall market for vertical software is sizeable, individual vertical markets are relatively small.
Acquisition objectsTo appreciate the potential of continued acquisitions, we continuously survey the market for vertical software compa-nies in the Nordic region. Our current assessment is that the range of available companies matching our acquisition criteria
is somewhat greater than we had previously anticipated. For the past four years, Vitec has accounted for merely 10 per-cent of the acquisitions of vertical software companies in the Nordic region. The rest of the acquisitions were implemented by a large number of buyers of varying profiles, from purely financial players to major industrial enterprises in the process of acquiring suppliers. The competition for acquisition objects is thus fragmented. Vitec is the player with the most distinc-tive strategy. Market awareness of this fact has increased by the year, and we now have opportunities to target far more potential acquisition objects than five years ago.
Corporate culture and product investmentsWe consistently invest in our corporate culture, such as by ar-ranging three annual orientation seminars aimed at managers and new employees. These events are named CEO@Vitec, Leader@Vitec and New@Vitec, and are arranged in-house, featuring members of our management team as lecturers. Our objective is to develop and nurture an understanding of a culture that supports our continued growth and our delegat-ed decision-making structure. We also invested more than SEK 125 million in our product portfolio in 2018. We will continue to match these investment levels to ensure that we are a reliable and future-proofed supplier for our customers. This, combined with our employees’ capacity to persistently renew themselves and our business, will enable us to live up to our brand promise: “To rely on – Today and Tomorrow.”
Sustainable profitable growthThe number of active acquisition dialogs remains high, and we are continuously allocating resources to stay abreast of and advance these dialogs. Our financial position is solid and we are well prepared for future acquisitions and for continued acquisition-based growth. Supported by our acquisition of well-established companies and a high and increasing per-centage of recurring revenues, Vitec will stay its course – to be a vertical software company with excellent risk diversi-fication and sustainable, profitable growth – and thereby increase our dividends for the seventeenth consecutive year.
Lars Stenlund, CEO
8 Vitec Annual Report 2018
Our position in the software market
Vitec focus on vertical marketsVitec is the Nordic market leader in Vertical Market Software. We develop and deliver standardized software aimed at various niche markets. This entails adapting our offering to the unique needs and requirements of companies operating within specific niche markets, to enable the management and development of their business operations. Some of our soft-ware products comprise complete enterprise systems, while others provide support for specific aspects of our customers’ operations.
Vitec offers standardized productsOur standardized products are cost-efficient for our custom-ers, as they allow for the assimilation of developments and upgrades by all users. This enables us to provide our custom-ers with the optimal conditions to develop and future-proof their operations.
Vitec has a high percentage of proprietary developmentWe are specialized in adapting to the conditions and require-ments of various industries. The Group's overall processes,
combined with the longstanding in-depth knowledge of our employees with regard to our customers’ operations, create conditions favorable to improvement and continuous innovation. Genuine customer-centric product development generates long-term value and software sustainability.
A position with significant obstacles to market penetrationEach individual vertical market imposes stringent demands on specialization. The establishment of a new player requires major investments and frequently involves protracted lead times in product development. At the same time, vertical markets are relatively small and involve considerable yield costs for customers, which diminishes opportunities for new players to generate returns on their investments. Within each vertical market, there are usually a few minor players who specialize in industry-specific software. Generic software generally provides less cost-efficient solutions to the unique requirements of vertical markets. Vitec always strives to achieve a leading position within its vertical markets.
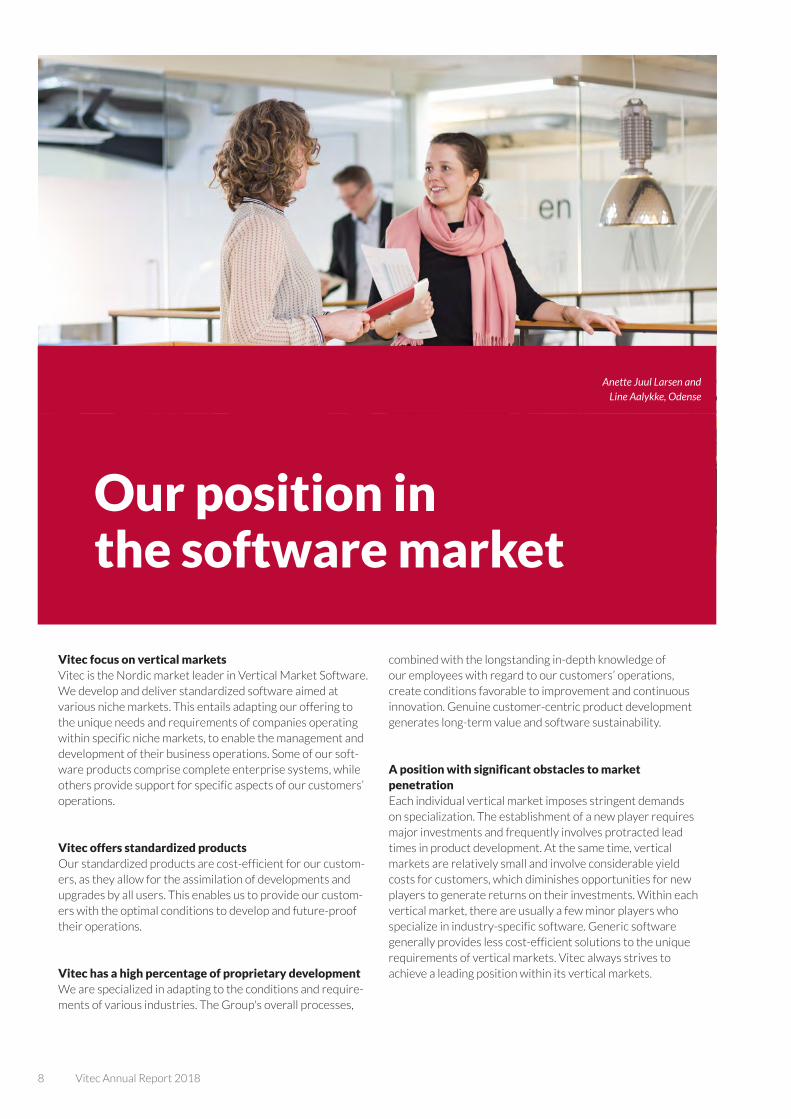
Anette Juul Larsen and Line Aalykke, Odense
Vitec Annual Report 2018 9
STRATEGIES
Business model and growth strategyHigh percentage of recurring revenuesOur business model is based on a high percentage of recur-ring revenues. Software is delivered through the Internet, by means of a subscription. This provides us with stable and predictable cash flows that create the prerequisites for a long-term approach. It also makes the Group less sensitive to temporary declines within individual business units. For customers, this entails minimal investment costs, ease with which to set up and start using our software, and the long-term security of having quick access to upgrades and new functions.
Growth by acquisitionVitec is an industry player with a long-term outlook. Our growth is mainly achieved through company acquisitions within the Nordic region. The companies we acquire are well-managed vertical software companies with products established in mature markets. Our acquisition work is governed by specific criteria that wholly determine whether a company is suitable for Vitec. One example of such crite-ria is that the company must offer software in the form of standardized proprietarily developed products aimed at a particular vertical market. Another example is that the acqui-sition must directly contribute to an increase in the Group’s earnings per share. Consequently, it is vital that the company demonstrate solid profitability and positive cash flows at the acquisition date. We do not invest in future expectations. Our continuous list of prospects comprises some 100 software companies of interest.
AcquireAt Vitec, we have longstanding experience and vast expertise in the development, sale and support of vertical software. This enables us to identify acquisition targets that are fully in line with our strategy, based on our criteria. Acquisi-tions implemented within our existing verticals contribute to increased market share, while acquisitions within new sectors increase our risk diversification. Before deciding on an acquisition, we invest a considerable amount of time and involvement in personal meetings with the people working at the company. It is crucial that we agree on fundamental values, business models and strategies, as our acquisitions are implemented with the aim of retaining the acquired compa-nies within the Group.
ImproveThe companies we acquire are profitable and well-managed. They have well-functioning operations and valuable industry know-how within their niche. We introduce post-acquisition changes at an appropriate pace, in close dialog with local management, who are supported by the Group’s processes and infrastructure. All of the companies are monitored using shared key metrics that steer their strategic focus toward a high percentage of recurring revenues and an emphasis on robust cash flow. We also apply Group-wide principles on how to plan and implement product development, so as to ensure that our offering will remain relevant in the future. Decentralized decision-making requires that all managers understand and act in accordance with the Group’s strategies and corporate culture.
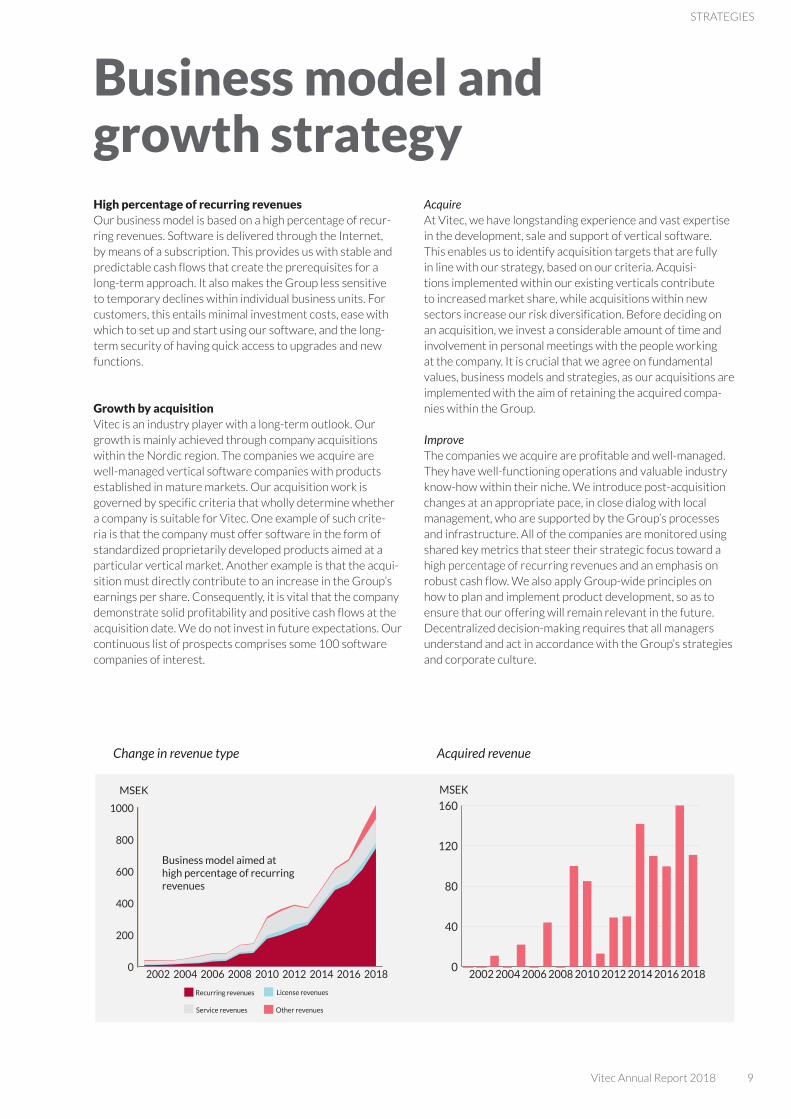
Change in revenue type Acquired revenue
0
200
400
600
800
1000
Other revenuesService revenues
License revenuesRecurring revenues
201820162014201220102008200620042002
MSEK
Affärsmodell och tillväxtstrategi
Business model aimed at high percentage of recurring revenues
MSEK
0
40
80
120
160
201820162014201220102008200620042002
0
200
400
600
800
1000
Other revenuesService revenues
License revenuesRecurring revenues
201820162014201220102008200620042002
MSEK
Affärsmodell och tillväxtstrategi
Business model aimed at high percentage of recurring revenues
MSEK
0
40
80
120
160
201820162014201220102008200620042002

10 Vitec Annual Report 2018
Strategy for acquisition-related brands and productsAll of the Group’s operations contribute to the strengthen-ing of the Vitec brand. We add “Vitec” to the legal corporate names of acquired companies and gradually switch to using the Vitec logotype exclusively. We retain the product names, which are then communicated to the market in tandem with the Vitec brand. Acquisitions may result in our offering prod-ucts with partly overlapping functionalities, or even compet-ing products, within a particular niche market. In these cases, we do not introduce any immediate changes, but assess, in conjunction with the development of new products, whether components can be created to support all of the product lines. This allows us to commence work on future-proofing the products and creating a new shared product line for all of our customers within the particular niche market.
Our suppliersA well-functioning procurement process is the key to cost-ef-ficient purchasing and ensuring that suppliers live up to our requirements on corporate social responsibility. Our Code of Conduct, which encompasses matters such as anticorrup-tion, human rights and conflicts of interest, serves as a guide to our relationships with suppliers. We choose between the suppliers that meet these requirements, based on business reasons. Read more about our supplier responsibilities in the sustainability report on pages 14-23.
Arne Huisman-Aase and Øystein Hodne, Stavanger Karin Liiw and Åsa Rosén, Stockholm

Vitec Annual Report 2018 11
STRATEGIES
AutoThe Auto segment includes our software for the automotive industry and machinery sector in Denmark, Finland, Norway and Sweden. Our products support work processes, such as vehicle sales, vehicle service centers, tire storage and the distribution of auto components. In Finland, our AutoFutur software is undergoing modernization, with the gradual introduction of updates, so as to maximize the benefits and minimize the risks for our customers. In Norway, we launched our new mobile client for workshop reporting and commenced the transition to a new optimized operating platform, which will result in a more open and flexible product for our customers. In Denmark, Stefan Hestbæk retired as CEO and was replaced by Henrik Johnsen, who formerly served as the acting CEO of MultiQ and Cleradium. In Denmark, we closed our office in Fredericia in order to concentrate our development resourc-es in Søborg. The change will enhance the efficiency of our product development.
EnergyThe Energy segment includes our advanced forecasting systems for electricity traders, as well as calculation and map-ping systems for owners of electricity and district-heating grids. In 2018, the fine-tuning of our Aiolos product’s forecast modeling achieved positive results, with every unit in preci-sion gained generating significant benefit for our customers. There continued to be considerable interest in our products, including from countries beyond the Nordic region, and we secured new customers in Italy, Germany, Slovenia and France. We also conducted a customer seminar in Belgium, which helped to secure new customers.
Real Estate The Real Estate segment was expanded during the year through the acquisition of PP7 Affärssystem AB, which develops software for project management companies in the Swedish construction and installation market. Its main prod-uct is cloud-based software for project and business support that optimizes project flows and procedures. The integration of PP7 Affärssystem proceeded according to plan during the year. The segment also includes complete enterprise systems for the construction and real estate sectors in Norway and Sweden, covering aspects such as leasing, sales, customer service, accounting, technical property management and energy-consumption monitoring. There was considerable demand for our products in Sweden during the year, as well as a notable increase in demand in Norway, where we signed new customer agreements. Recurring revenues were also increased in 2018 through a continued focus on our sub-scription-based business model and an ever-higher degree of automation.
Finance & InsuranceThe Finance & Insurance segment includes our software for banks, financial institutions and insurance companies in Denmark, Norway and Sweden. Major installation projects that were undertaken in 2017 within our Danish operations sharply increased our service revenues. In 2018, these instal-lations began to generate new recurring revenues. In Norway, we signed several new customer agreements that partly replaced the revenue drain stemming from a departing major customer in 2017. In Sweden, we established a third product area during the year with the launch of “Företagskalkyler”.
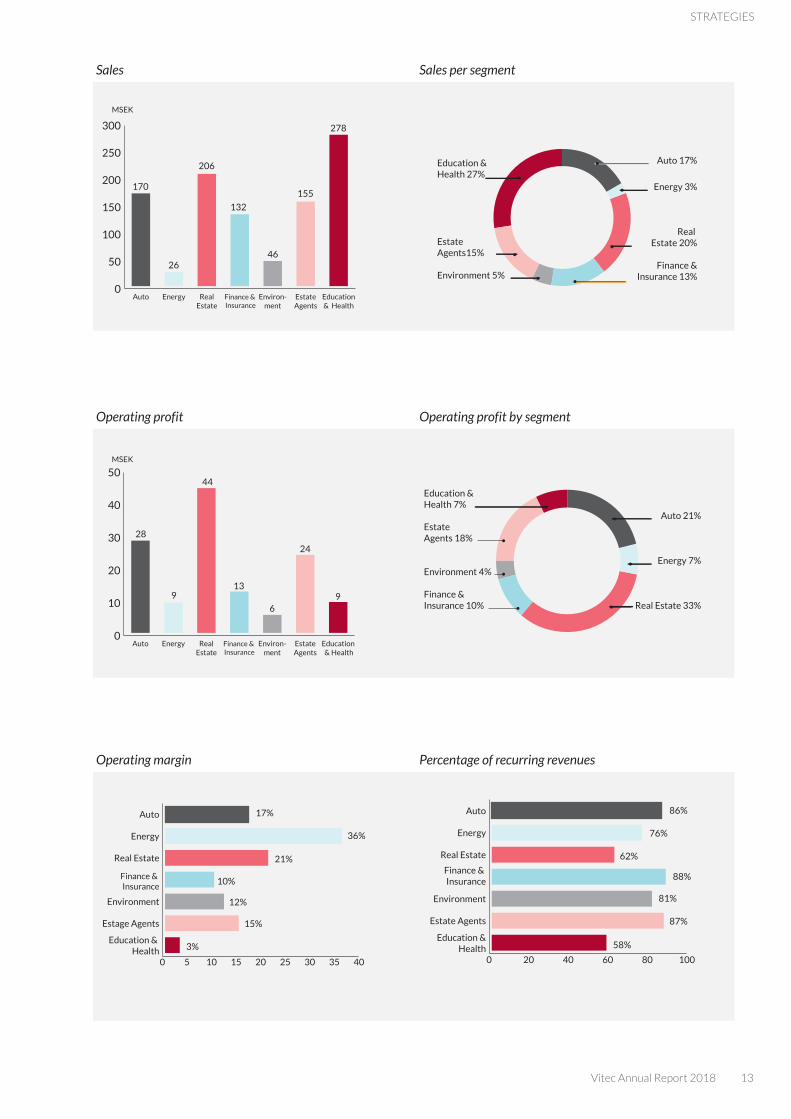
Our segments Vitec develops and delivers software aimed at various niche markets. Some of
our software products comprise complete enterprise systems, while others
provide support for specific aspects of our customers’ operations. We report
our operations under seven segments. These segments in turn comprise 18 in-
dependent business units – none of which account for more than 17% of sales,
this providing the Group with excellent risk diversification.
Software for schools
12 Vitec Annual Report 2018
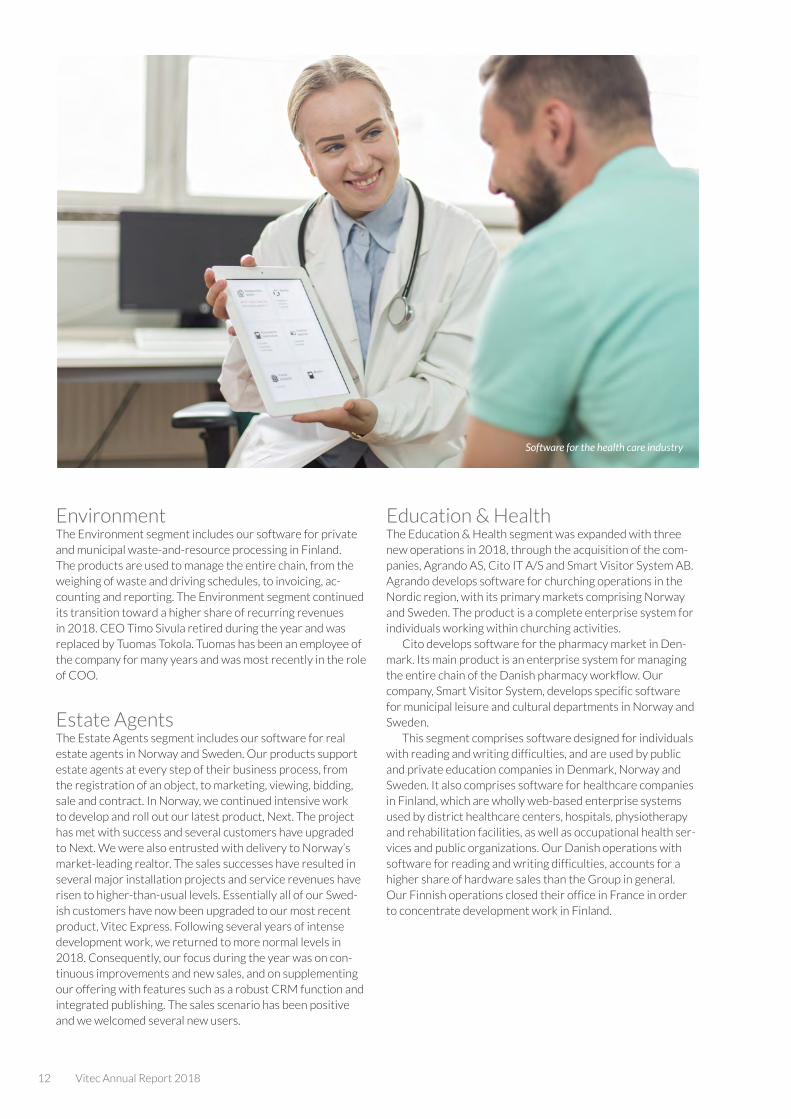
EnvironmentThe Environment segment includes our software for private and municipal waste-and-resource processing in Finland. The products are used to manage the entire chain, from the weighing of waste and driving schedules, to invoicing, ac-counting and reporting. The Environment segment continued its transition toward a higher share of recurring revenues in 2018. CEO Timo Sivula retired during the year and was replaced by Tuomas Tokola. Tuomas has been an employee of the company for many years and was most recently in the role of COO.
Estate AgentsThe Estate Agents segment includes our software for real estate agents in Norway and Sweden. Our products support estate agents at every step of their business process, from the registration of an object, to marketing, viewing, bidding, sale and contract. In Norway, we continued intensive work to develop and roll out our latest product, Next. The project has met with success and several customers have upgraded to Next. We were also entrusted with delivery to Norway’s market-leading realtor. The sales successes have resulted in several major installation projects and service revenues have risen to higher-than-usual levels. Essentially all of our Swed-ish customers have now been upgraded to our most recent product, Vitec Express. Following several years of intense development work, we returned to more normal levels in 2018. Consequently, our focus during the year was on con-tinuous improvements and new sales, and on supplementing our offering with features such as a robust CRM function and integrated publishing. The sales scenario has been positive and we welcomed several new users.
Education & HealthThe Education & Health segment was expanded with three new operations in 2018, through the acquisition of the com-panies, Agrando AS, Cito IT A/S and Smart Visitor System AB. Agrando develops software for churching operations in the Nordic region, with its primary markets comprising Norway and Sweden. The product is a complete enterprise system for individuals working within churching activities.
Cito develops software for the pharmacy market in Den-mark. Its main product is an enterprise system for managing the entire chain of the Danish pharmacy workflow. Our company, Smart Visitor System, develops specific software for municipal leisure and cultural departments in Norway and Sweden.
This segment comprises software designed for individuals with reading and writing difficulties, and are used by public and private education companies in Denmark, Norway and Sweden. It also comprises software for healthcare companies in Finland, which are wholly web-based enterprise systems used by district healthcare centers, hospitals, physiotherapy and rehabilitation facilities, as well as occupational health ser-vices and public organizations. Our Danish operations with software for reading and writing difficulties, accounts for a higher share of hardware sales than the Group in general. Our Finnish operations closed their office in France in order to concentrate development work in Finland.
Software for the health care industry
Vitec Annual Report 2018 13
STRATEGIES
Sales Sales per segment
Operating profit Operating profit by segment
Operating margin Percentage of recurring revenues
Omsättning, fördelning AO
Education &Health 27%
EstateAgents15%
Environment 5%
Auto 17%
Energy 3%
Real Estate 20%
Finance & Insurance 13%
RR, fördelning AO
Education &Health 7%
EstateAgents 18%
Environment 4%
Finance &Insurance 10%
Auto 21%
Energy 7%
Real Estate 33%
Rörelseresultat
Nettomsättning
Andel repetitiva intäkter av omsättningen
Rörelsemarginal
28
9
44
13
69
MSEK
17%
36%
21%
10%
3%
12%
15%
86%
76%
62%
88%
58%
81%
87%
24
AO-siffror
0
50
100
150
200
250
300
Education& Health
EstateAgents
Environ-ment
Finance & Insurance
RealEstate
EnergyAuto
170
26
206
132
46
155
278
MSEK
0
10
20
30
40
50
Education & Health
EstateAgents
Environ-ment
Finance & Insurance
RealEstate
EnergyAuto
0 20 40 60 80 100
Education & Health
Estate Agents
Environment
Finance & Insurance
Real Estate
Energy
Auto
0 5 10 15 20 25 30 35 40
Education & Health
Estate Agents
Environment
Finance & Insurance
Real Estate
Energy
Auto
0 20 40 60 80 100
Education &Health
Estate Agents
Environment
Finance & Insurance
Real Estate
Energy
Auto 86%
76%
62%
88%
58%
81%
87%
0 5 10 15 20 25 30 35 40
Education & Health
Estage Agents
Environment
Finance & Insurance
Real Estate
Energy
Auto 17%
36%
21%
10%
3%
12%
15%
14 Vitec Annual Report 2018
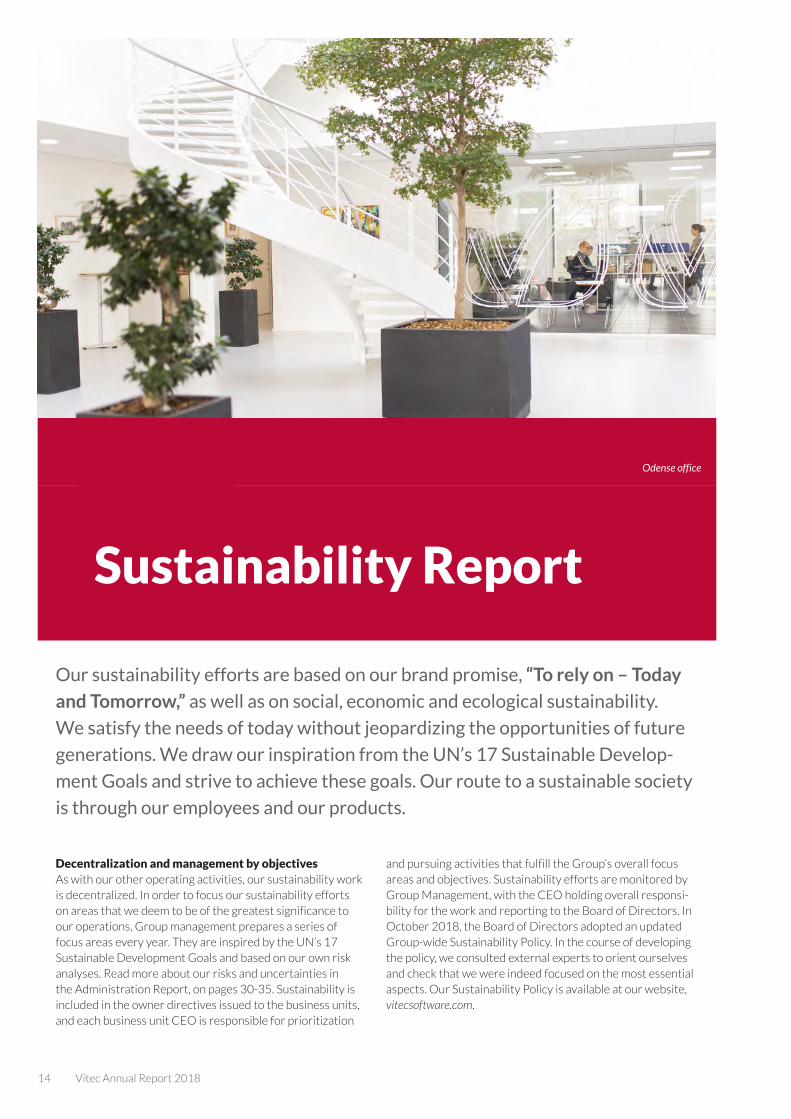
Our sustainability efforts are based on our brand promise, “To rely on – Today
and Tomorrow,” as well as on social, economic and ecological sustainability.
We satisfy the needs of today without jeopardizing the opportunities of future
generations. We draw our inspiration from the UN’s 17 Sustainable Develop-
ment Goals and strive to achieve these goals. Our route to a sustainable society
is through our employees and our products.
Decentralization and management by objectivesAs with our other operating activities, our sustainability work is decentralized. In order to focus our sustainability efforts on areas that we deem to be of the greatest significance to our operations, Group management prepares a series of focus areas every year. They are inspired by the UN’s 17 Sustainable Development Goals and based on our own risk analyses. Read more about our risks and uncertainties in the Administration Report, on pages 30-35. Sustainability is included in the owner directives issued to the business units, and each business unit CEO is responsible for prioritization
and pursuing activities that fulfill the Group’s overall focus areas and objectives. Sustainability efforts are monitored by Group Management, with the CEO holding overall responsi-bility for the work and reporting to the Board of Directors. In October 2018, the Board of Directors adopted an updated Group-wide Sustainability Policy. In the course of developing the policy, we consulted external experts to orient ourselves and check that we were indeed focused on the most essential aspects. Our Sustainability Policy is available at our website, vitecsoftware.com.
Sustainability Report
Odense office
Vitec Annual Report 2018 15
SUSTAINABILITy REPORT
”Our route to a sustainable society is through our employees and our products.
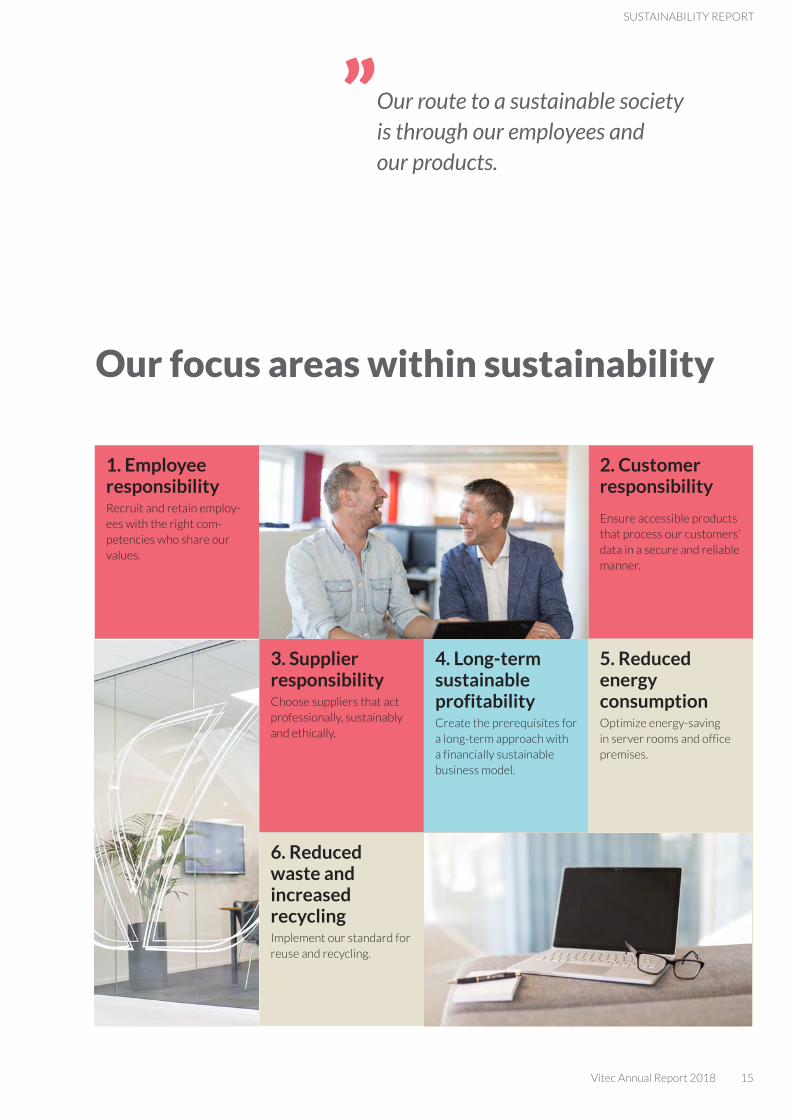
Our focus areas within sustainability
1. Employee responsibilityRecruit and retain employ-ees with the right com-petencies who share our values.
2. Customer responsibility
Ensure accessible products that process our customers’ data in a secure and reliable manner.
3. Supplier responsibility Choose suppliers that act professionally, sustainably and ethically.
4. Long-term sustainable profitabilityCreate the prerequisites for a long-term approach with a financially sustainable business model.
5. Reduced energy consumptionOptimize energy-saving in server rooms and office premises.
6. Reduced waste and increased recyclingImplement our standard for reuse and recycling.
16 Vitec Annual Report 2018
Social responsibility
Our internal and external relationships are based on trust and transparency. In 2018, we completed work on a Group-wide Code of Conduct, which was adopted by the Board of Directors in December 2018 and is available for your perusal at our web-site, vitecsoftware.com. The Code of Conduct provides us with an ethical framework supported by our foundational values, on which we are to base our decisions and behavior in the course of our day-to-day work. The Code of Conduct was introduced to all of our operations by the Group’s CEO in December 2018. The crucial work of creating awareness and understanding among all of our employees is ongoing in 2019.
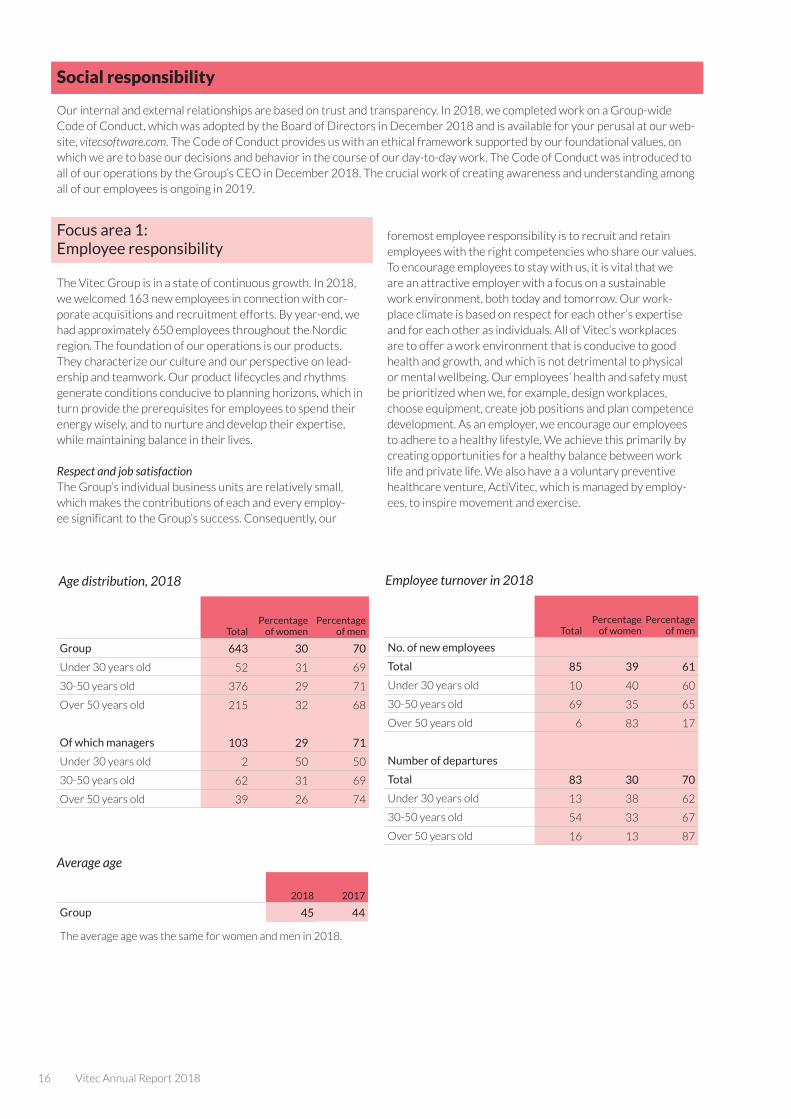
Focus area 1: Employee responsibility
The Vitec Group is in a state of continuous growth. In 2018, we welcomed 163 new employees in connection with cor-porate acquisitions and recruitment efforts. By year-end, we had approximately 650 employees throughout the Nordic region. The foundation of our operations is our products. They characterize our culture and our perspective on lead-ership and teamwork. Our product lifecycles and rhythms generate conditions conducive to planning horizons, which in turn provide the prerequisites for employees to spend their energy wisely, and to nurture and develop their expertise, while maintaining balance in their lives.
Respect and job satisfactionThe Group’s individual business units are relatively small, which makes the contributions of each and every employ-ee significant to the Group’s success. Consequently, our
foremost employee responsibility is to recruit and retain employees with the right competencies who share our values. To encourage employees to stay with us, it is vital that we are an attractive employer with a focus on a sustainable work environment, both today and tomorrow. Our work-place climate is based on respect for each other’s expertise and for each other as individuals. All of Vitec’s workplaces are to offer a work environment that is conducive to good health and growth, and which is not detrimental to physical or mental wellbeing. Our employees’ health and safety must be prioritized when we, for example, design workplaces, choose equipment, create job positions and plan competence development. As an employer, we encourage our employees to adhere to a healthy lifestyle. We achieve this primarily by creating opportunities for a healthy balance between work life and private life. We also have a a voluntary preventive healthcare venture, ActiVitec, which is managed by employ-ees, to inspire movement and exercise.
TotalPercentage
of womenPercentage
of men
Group 643 30 70
Under 30 years old 52 31 69
30-50 years old 376 29 71
Over 50 years old 215 32 68
Of which managers 103 29 71
Under 30 years old 2 50 50
30-50 years old 62 31 69
Over 50 years old 39 26 74
TotalPercentage
of womenPercentage
of men
No. of new employees
Total 85 39 61
Under 30 years old 10 40 60
30-50 years old 69 35 65
Over 50 years old 6 83 17
Number of departures
Total 83 30 70
Under 30 years old 13 38 62
30-50 years old 54 33 67
Over 50 years old 16 13 87
2018 2017
Group 45 44
The average age was the same for women and men in 2018.
Age distribution, 2018
Average age
Employee turnover in 2018
Vitec Annual Report 2018 17
SUSTAINABILITy REPORT
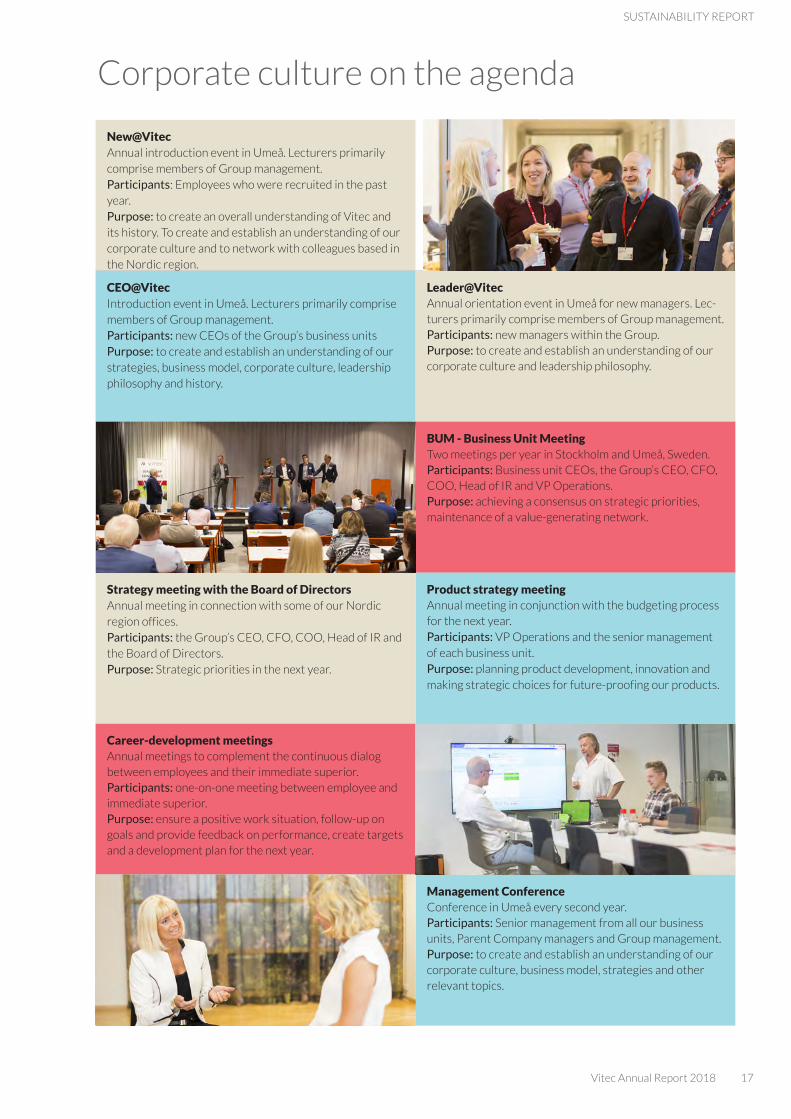
Corporate culture on the agenda
New@VitecAnnual introduction event in Umeå. Lecturers primarily comprise members of Group management.Participants: Employees who were recruited in the past year. Purpose: to create an overall understanding of Vitec and its history. To create and establish an understanding of our corporate culture and to network with colleagues based in the Nordic region.
CEO@VitecIntroduction event in Umeå. Lecturers primarily comprise members of Group management. Participants: new CEOs of the Group’s business unitsPurpose: to create and establish an understanding of our strategies, business model, corporate culture, leadership philosophy and history.
Leader@VitecAnnual orientation event in Umeå for new managers. Lec-turers primarily comprise members of Group management.Participants: new managers within the Group. Purpose: to create and establish an understanding of our corporate culture and leadership philosophy.
BUM - Business Unit MeetingTwo meetings per year in Stockholm and Umeå, Sweden. Participants: Business unit CEOs, the Group’s CEO, CFO, COO, Head of IR and VP Operations.Purpose: achieving a consensus on strategic priorities, maintenance of a value-generating network.
Strategy meeting with the Board of DirectorsAnnual meeting in connection with some of our Nordic region offices. Participants: the Group’s CEO, CFO, COO, Head of IR and the Board of Directors.Purpose: Strategic priorities in the next year.
Product strategy meetingAnnual meeting in conjunction with the budgeting process for the next year.Participants: VP Operations and the senior management of each business unit.Purpose: planning product development, innovation and making strategic choices for future-proofing our products.
Career-development meetingsAnnual meetings to complement the continuous dialog between employees and their immediate superior.Participants: one-on-one meeting between employee and immediate superior. Purpose: ensure a positive work situation, follow-up on goals and provide feedback on performance, create targets and a development plan for the next year.
Management ConferenceConference in Umeå every second year. Participants: Senior management from all our business units, Parent Company managers and Group management.Purpose: to create and establish an understanding of our corporate culture, business model, strategies and other relevant topics.

18 Vitec Annual Report 2018
Recruitment and career developmentRecruitment, salaries and career opportunities are impacted by the individual’s qualifications, such as education, expe-rience, expertise, capacity and performance. We work to promote multi-aspect diversity within the Group. Examples of such measures are the adaptation of job advertisements and the raising of awareness within the recruitment process. Another example is how our head office in Umeå provides assistance to individuals with difficulties penetrating the job market, by offering them fixed-term employment as office caretakers. This allows them to gain job experience, a boost to their self-esteem and potential references for future jobs.
To a great extent, we use internal HR specialists in recruit-ment processes, to ensure that we maintain a correct focus throughout. In 2018, we introduced a recruitment system to our Swedish operations, which resulted in an improved overview of the recruitment process and a streamlined dialog with the candidates seeking to work with us. The system will be introduced to our operations in other countries in 2019.
Salary and performance reviews are conducted between managers and employees annually. These conversations are crucial for feedback and for discussing future development, and proceed from the needs of the company and the em-ployee’s career preferences. As an employer, Vitec is tasked with continuously developing its employees. Our managers are frequently recruited internally. Our target scenario is for every employee at Vitec to recommend us as an employer.
Values-based activitiesOur managers are key culture bearers, who create an un-derstanding for and serve as a connection to our strategies and our values. Confident leaders encourage employees to develop in pace with our operations, while clear expectations facilitate a focus on tasks that generate value. Accordingly, we arrange annual orientation events for new managers at Vitec, through which we convey of the type of leadership we expect
at Vitec and the specific role of managers in creating condi-tions conducive to employee motivation and satisfaction, and optimal performance. We also conduct a leadership confer-ence every second year. In 2018, a two-day meeting was held in Umeå, Sweden, between all of our business unit manag-ers and Parent Company staff, under the theme of Vertical software, our business model and market position. During the year, we also held a networking event for our business unit managers. The lecturers at these events mainly com-prised members of Group Management. The 2018 manager introduction and manager conference events allowed for 85 managers to establish vital exchange networks to the benefit of the entire Group.
Since each Vitec employee is responsible for adhering to our shared corporate culture, once a year, we gather all em-ployees who were recruited to the Group within the past year for an official introduction to Vitec hosted by Group Manage-ment. The agenda includes information about the Group, and its corporate culture and fundamental values. Participants express that the introduction makes them feel welcome in the Group and creates an affinity with the business units and corporate staff. We have also noticed that the event facili-tates interpersonal contact and the sharing of experiences between participants when they return to their respective workplaces.
Convertible program Convertibles enable our employees to invest in a long-term partnership with Vitec. Historically, we have introduced a program every three years, with equal terms and conditions for all employees. The current program is the ninth to date. This provides all employees, regardless of their role, with the opportunity to partake of Vitec’s growth in value, while allowing for minimizing the consequences of any negative share-price movements.
Lars Nielsen, Odense
Vitec Annual Report 2018 19
SUSTAINABILITy REPORT
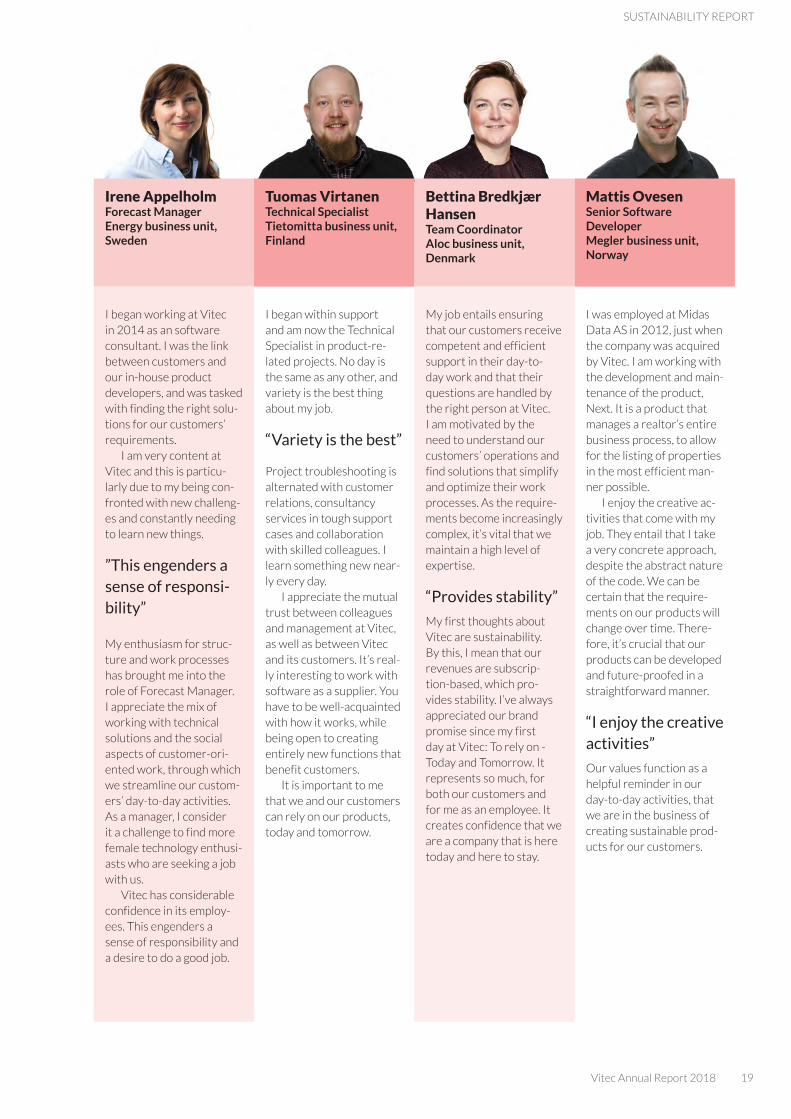
Irene Appelholm Forecast Manager Energy business unit, Sweden
Tuomas Virtanen Technical Specialist Tietomitta business unit, Finland
Bettina Bredkjær Hansen Team Coordinator Aloc business unit, Denmark
Mattis Ovesen Senior Software Developer Megler business unit, Norway
I began working at Vitec in 2014 as an software consultant. I was the link between customers and our in-house product developers, and was tasked with finding the right solu-tions for our customers’ requirements.
I am very content at Vitec and this is particu-larly due to my being con-fronted with new challeng-es and constantly needing to learn new things.
”This engenders a sense of responsi-bility”
My enthusiasm for struc-ture and work processes has brought me into the role of Forecast Manager. I appreciate the mix of working with technical solutions and the social aspects of customer-ori-ented work, through which we streamline our custom-ers’ day-to-day activities. As a manager, I consider it a challenge to find more female technology enthusi-asts who are seeking a job with us.
Vitec has considerable confidence in its employ-ees. This engenders a sense of responsibility and a desire to do a good job.
I began within support and am now the Technical Specialist in product-re-lated projects. No day is the same as any other, and variety is the best thing about my job.
“Variety is the best”
Project troubleshooting is alternated with customer relations, consultancy services in tough support cases and collaboration with skilled colleagues. I learn something new near-ly every day.
I appreciate the mutual trust between colleagues and management at Vitec, as well as between Vitec and its customers. It’s real-ly interesting to work with software as a supplier. you have to be well-acquainted with how it works, while being open to creating entirely new functions that benefit customers.
It is important to me that we and our customers can rely on our products, today and tomorrow.
My job entails ensuring that our customers receive competent and efficient support in their day-to-day work and that their questions are handled by the right person at Vitec. I am motivated by the need to understand our customers’ operations and find solutions that simplify and optimize their work processes. As the require-ments become increasingly complex, it’s vital that we maintain a high level of expertise.
“Provides stability”
My first thoughts about Vitec are sustainability. By this, I mean that our revenues are subscrip-tion-based, which pro-vides stability. I’ve always appreciated our brand promise since my first day at Vitec: To rely on - Today and Tomorrow. It represents so much, for both our customers and for me as an employee. It creates confidence that we are a company that is here today and here to stay.
I was employed at Midas Data AS in 2012, just when the company was acquired by Vitec. I am working with the development and main-tenance of the product, Next. It is a product that manages a realtor’s entire business process, to allow for the listing of properties in the most efficient man-ner possible.
I enjoy the creative ac-tivities that come with my job. They entail that I take a very concrete approach, despite the abstract nature of the code. We can be certain that the require-ments on our products will change over time. There-fore, it’s crucial that our products can be developed and future-proofed in a straightforward manner.
“I enjoy the creative activities”
Our values function as a helpful reminder in our day-to-day activities, that we are in the business of creating sustainable prod-ucts for our customers.
20 Vitec Annual Report 2018
Focus area 2: Customer responsibility Our products are critical to our customers’ operations. Therefore, our foremost customer responsibility is to ensure that our products are accessible, and that they manage our customers’ data securely and reliably. To an ever greater extent, our products are delivered via cloud services. This means that in addition to functionality, we are responsible for accessibility, energy-efficiency and security. We perform annual audits based on our security policy to be able to implement any required measures early on. We continuously monitor the energy-efficiency of server rooms and how the electricity we purchase is produced. Our Swedish business unit, Mäklarsystem, delivers all of our products by cloud. Cus-tomers have expressed that they feel safe and at-ease that we offer holistic solutions, as it allows them to focus on their core activities – being realtors. Simply put, they are supposed to be able to rely on an enterprise system that is accessible when they need it, to process data in a secure manner.
Our products are our foundation. They are pivotal to sus-tainability efforts, because they support necessary functions and enable the streamlining of customer processes, which often result in reduced resource consumption. One example is our product, Aiolos, which is an advanced forecasting tool for electricity traders. In 2018, the precision of its forecasting model was further finetuned to provide a value-generation effect for our customers, who can now further optimize their energy-production planning.
Another example is our product, Plania, an enterprise system for real estate companies in Norway. During the year, we focused on digitalizing yet more of our customers’ work processes, which is enabling them to enhance efficiency, while reducing resource consumption.
A third example is our product, Boplats Sverige, which enables property owners to publish apartments for rent through the website, boplatssverige.se. Everything is man-aged digitally, which streamlines the renting and allocation process for landlords, and also facilitates potential tenants in finding apartments. The service is completely free for apartment-seekers, who can easily create a personal profile to keep watch for available rental apartments throughout Sweden. Many of our products also support digital signatures and e-invoicing, which help to reduce the usage of paper considerably. Our products have also been developed in accordance with the EU’s General Data Protection Regula-tion (GDPR) framework, which provides our customers with an even higher level of data security. Read more about our products at vitecsoftware.com.
Focus area 3: Supplier responsibility
In late 2018, we adopted a purchasing checklist, which clarifies our expectations with regard to suppliers, which is based on a professional, sustainable and ethically correct approach. The checklist is derived from our Code of Conduct and Sustainability Policy, which was also adopted in autumn 2018. Although purchasing constitutes a very limited portion of the Group’s operations, it is vital that we choose suppliers based on our core values, those who, for example, consider human rights and anticorruption to be a matter of course. The checklist is a vital tool for procurement work and will be implemented throughout the Group in 2019. Our main purchases pertain to areas such as office premises, server rooms, electricity supply, information services, travel, elec-tronics, computers, telephony, office materials and software components. We do not lock ourselves to specific suppliers, which allows us to switch to other alternatives without major disruptions to our operations.
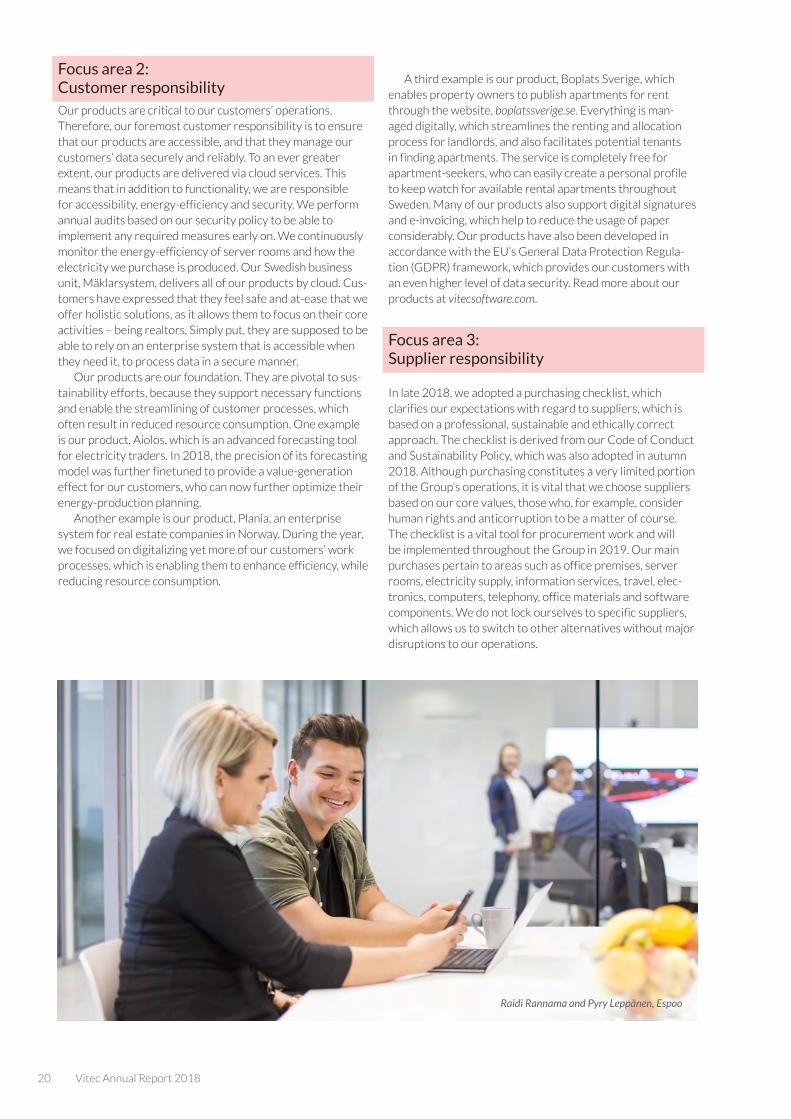
Raidi Rannama and Pyry Leppänen, Espoo

Vitec Annual Report 2018 21
SUSTAINABILITy REPORT
Sales Operating margin Earnings per share
Financial sustainability
One of our core values is to keep it simple. By choosing not to complicate things, but endeavoring instead to keep it simple, a sense of cost-consciousness is instilled in each individual. Our Code of Conduct also provides business-ethical guidelines for sustainable enterprise.
Focus area 4: Long-term sustainable profitability
Our business model is based on offering software based on a subscription model that is financially sustainable, and which provides the prerequisites for a long-term approach. This entails a safe offering for customers, while providing us with stable and predictable cash flows through recurring revenues. It also makes the Group less sensitive to temporary declines within individual business units. We have opted not to have a bonus system for senior executives, to ensure that the company is managed from a long-term perspective and to avoid a short-term approach. Instead, we enable all our employees to become co-owners of the company through recurring convertible programs.
The Group’s growth is essentially driven by acquisitions of well-managed and profitable software companies – with a de-
cisive parameter being that earnings per share must be pos-itively impacted by the acquisition. As shown in the diagram below, earnings per share has trended positively over time. All Group companies are monitored using shared key metrics that steer their strategic focus toward a high percentage of recurring revenues and an emphasis on robust cash flow. An overall objective is to achieve a minimum operating margin of 15%.
Another objective for long-term financial sustainability is that our dividend to shareholders must comprise at least one-third of the profits every year. These levels are based on our collective assessments of the specific resources needed to satisfy our stakeholders’ requirements. We shall continue to invest in product development and company acquisitions. We are to be an attractive employer to employees who share our values, and we are to be a good choice for shareholders with long-term interests.
Target: at least 15% Target: At least 33% of the profit is paid
out to the shareholders
MSEK
SEK
%
Hållbarhetsrapport
kWh/employee
kWh/processor core
%
0
50
100
150
200
250
20182017
457 448
59%
85%
109
215
0
20
40
60
80
100
20182017
OtherPeripheral equipment
ScreensDesktopSmartphoneServerTabletsHard drivePortable
2
51
93
84
10
0
14
40
9
0
14
0
22
0 2 0
19
0
200
400
600
800
1,000
1,200
20182017201620152014 0
5
10
15
20
20182017201620152014
0,0
0,5
1,0
1,5
2,0
2,5
3,0
3,5
20182017201620152014
Profit per share Dividend per share
38%34%
44% 41%37%*
Quantity
Quantity
* Proposed dividend SEK 1.20
Recycling divided by unit types
Recycled units, total
0
500
1000
1500
2000
201820170
100
200
300
400
500
20182017 0
20
40
60
80
100
20182017
1 386
1 548
22 Vitec Annual Report 2018
Environmental sustainability
Our products digitalize and enhance the efficiency of our customers’ processes. We have the opportunity to create the condi-tions for enhancing resource efficiency and reducing climate impact through our products. you can find examples of this under the focus area, Customer responsibility. We also strive to continuously improve our proprietary operations through sustainable and efficient resource utilization. This includes our power consumption in offices and server rooms, our business travel and electronics waste. Consequently, our environmental efforts are systematic and integrated into our operations, which should manifest as a continuous improvement of key metrics, such as power consumption per employee and the share of renewable energy in our electricity agreements.
Focus area 5: Reduced energy consumption
To progressively reduce our energy consumption, we are working to optimize the efficiency of our server rooms and office premises. We utilize “free cooling” in our largest server rooms, which entails the use of outdoor air to cool our server rooms. For 2018, this roughly corresponded to a 20% reduc-tion in electricity consumption. We collaborate with property owners, to use the waste heat from our server rooms to warm up other sections of the premises, which reduces the property’s overall consumption. One of our data centers has dedicated solar panels that produce 25% of the electricity used by the center.
During the year, we replaced several of our older serv-ers with new and more energy-efficient hardware. We will derive most of our benefits from this investment in 2019. An analysis of one of our data centers in Denmark indicates that energy savings of up to 88% can be expected when older hardware is replaced in their entirety. As part of our ongoing efforts at continuous improvement, server rooms that come into the Group’s disposal through company acquisitions are evaluated and, in many cases, moved to one of the Group’s shared data centers. In addition to optimizing energy efficien-cy, this enables us to safeguard the products’ accessibility and security.
We review energy-saving measures for our offices in conjunction with their renovation. In 2018, we persisted with efforts to convert our electricity contracts to comprise 100% renewable energy. The results were 85% in 2018, compared with 59% in 2017. The positive trend is mainly attributable to the percentage of coal in our Danish electricity contracts being switched for renewable energy.
Focus area 6: Reduced waste and increased recycling
In 2018, we completed the work to develop a Group-wide standard for recycling of electronic waste. During the year, this corresponded to environmental savings of 7,034 kg of CO2eq, which is comparable to circumnavigating the globe by car, twice. In 2018, several types of devices were collect-ed, such as portable computers, tablets and smartphones, entailing a 32% increase in the share of in reusable devices, compared with 2% in 2017.
We also continued efforts to minimize the number of busi-ness trips during the year, in order to reduce our carbon foot-print. Digital conferencing technology has now been installed in the conference rooms of all our Nordic region offices. To keep things simple for our employees, we use a Group-wide IT infrastructure, and our goal is to have the same type of equipment at all of our premises. Employees recognize and know how to use the technology, regardless of the particular office where the meeting takes place. In 2018, approximately 1,700 digital meetings per month were conducted, with an average of three participants. We have also updated our cus-tomer offering to include web-based training for several of our products. This has entailed fewer business trips, for both Vitec and our customers.
All day-to-day improvements are also crucial: for example, during the year, we adopt a standard for waste-sorting-at-source in our office premises. When introducing the new waste-sorting system, we simultaneously engage in dialogs with property owners who may, in some cases, need to up-date their waste management system to, for example, receive food waste.

Vitec Annual Report 2018 23
SUSTAINABILITy REPORT
Target: Continuously optimize energy consumption in our server rooms and office premises
Target: 100% renewable energy in our electricity contracts
Energy consumption server rooms
Energy consumption office premises
Percentage of energy from renewable sources
The summer of 2018 was unusually hot. The free-cooling systems in our data centers could not be used normally and office premises with in-house cooling systems and fans accounted for higher energy consumption than summers with normal temperatures.
Recycling of electronic waste
MSEK
SEK
%
Hållbarhetsrapport
kWh/employee
kWh/processor core
%
0
50
100
150
200
250
20182017
457 448
59%
85%
109
215
0
20
40
60
80
100
20182017
OtherPeripheral equipment
ScreensDesktopSmartphoneServerTabletsHard drivePortable
2
51
93
84
10
0
14
40
9
0
14
0
22
0 2 0
19
0
200
400
600
800
1,000
1,200
20182017201620152014 0
5
10
15
20
20182017201620152014
0,0
0,5
1,0
1,5
2,0
2,5
3,0
3,5
20182017201620152014
Profit per share Dividend per share
38%34%
44% 41%37%*
Quantity
Quantity
* Proposed dividend SEK 1.20
Recycling divided by unit types
Recycled units, total
0
500
1000
1500
2000
201820170
100
200
300
400
500
20182017 0
20
40
60
80
100
20182017
1 386
1 548
24 Vitec Annual Report 2018
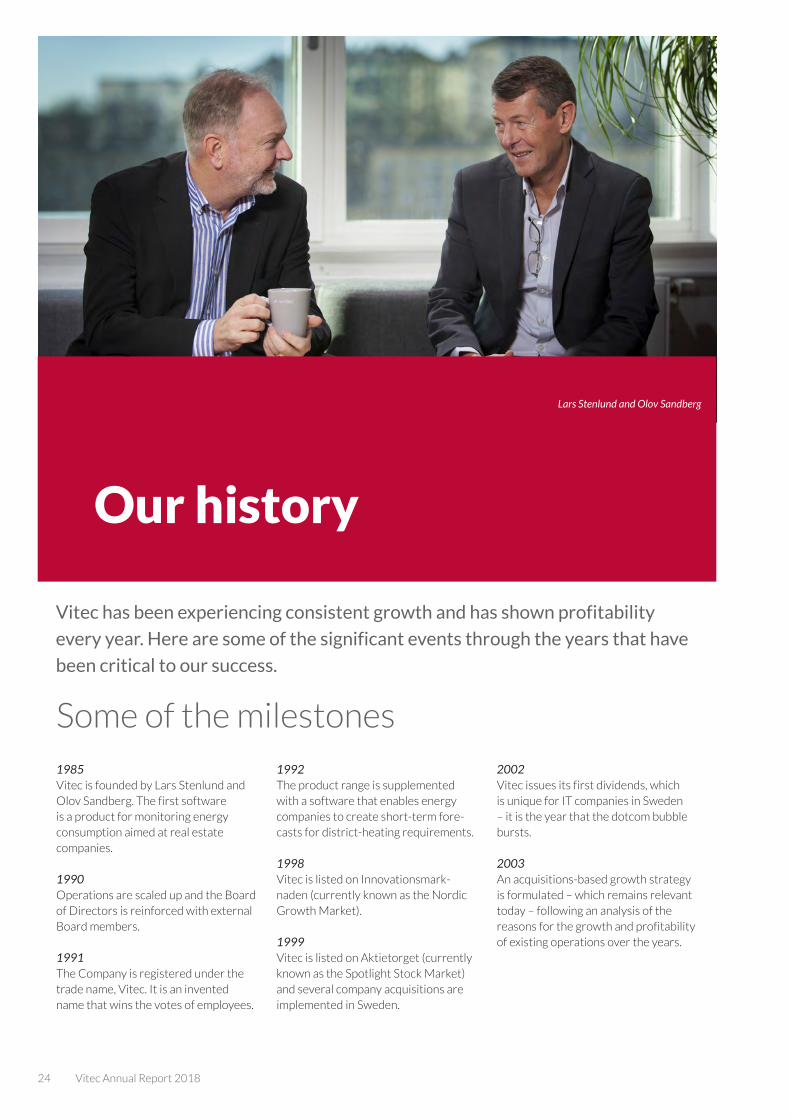
Vitec has been experiencing consistent growth and has shown profitability
every year. Here are some of the significant events through the years that have
been critical to our success.
Our history
Some of the milestones1985Vitec is founded by Lars Stenlund and Olov Sandberg. The first software is a product for monitoring energy consumption aimed at real estate companies.
1990 Operations are scaled up and the Board of Directors is reinforced with external Board members.
1991 The Company is registered under the trade name, Vitec. It is an invented name that wins the votes of employees.
1992 The product range is supplemented with a software that enables energy companies to create short-term fore-casts for district-heating requirements.
1998 Vitec is listed on Innovationsmark-naden (currently known as the Nordic Growth Market).
1999Vitec is listed on Aktietorget (currently known as the Spotlight Stock Market) and several company acquisitions are implemented in Sweden.
2002Vitec issues its first dividends, which is unique for IT companies in Sweden – it is the year that the dotcom bubble bursts.
2003An acquisitions-based growth strategy is formulated – which remains relevant today – following an analysis of the reasons for the growth and profitability of existing operations over the years.
Lars Stenlund and Olov Sandberg
Vitec Annual Report 2018 25
OUR HISTORy
2005 The Media segment is formed through the acquisition of Veriba AB, whose software is aimed at newsvendor com-panies. Vitec becomes the leading soft-ware supplier in the real estate industry in conjunction with the acquisition of IBS Vertex.
2007The Estate Agents segment is formed in conjunction with the acquisition of Svensk FastighetsData, a market-lead-ing supplier av software for realtors.
2010 The Finance & Insurance segment is formed with the acquisition of Capitex AB. The company develops calculation software for banks and insurance com-panies and software for realtors and real estate companies.
2011 Vitec is listed on the Nasdaq Stock-holm. The Estate Agents segment is supplemented with Norwegian opera-tions through Vitec’s first acquisition of a foreign company, IT-Makeriet AS.
2012The listed subsidiary, 3L System AB (publ), is acquired and thereby delisted from First North.
2013 The Health segment is formed in conjunction with the acquisition of the Finnish company, Acute FDS Oy, and its software for Finnish healthcare companies.
2014The Auto segment is formed through the acquisition of AutoData Norway AS, and its software for the Norwe-gian auto parts market. The Finance & Insurance segment is expanded to include Denmark, in conjunction with the acquisition of the Danish company, Aloc A/S.
2015The Auto segment is supplemented with Danish operations through the acquisition of the Danish company, Datamann A/S, and reinforced in Nor-way through the acquisition of Infoeasy AS. The Finance & Insurance segment is supplemented with operations in Norway through the acquisition of the Norwegian company, Nice AS.
2016The Media segment is discontinued in connection with the sale of Vitec Veriba AB to XLENT Consulting Holding AB. The new Environment segment is formed through the acquisition of the Finnish company, Tietomitta Oy. FuturSoft Oy in Finland and Plania AS in Norway are also acquired, to supplement the Auto and Real Estate segments, respectively.
2017Vitec is moved from the Small Cap to Mid Cap list on the Nasdaq Stock-holm. The Danish software company, MV-Nordic A/S, with its products for remediating reading and writing difficulties is acquired, and the Health segment changes its name to Educa-tion & Health. Olov Sandberg, one of the founders of Vitec, completes his final business assignment on behalf of the company and enters retirement. Olov remains as one of the company’s principal owner.
2018The Construction & Real Estate seg-ment is shored up with the acquisition of the Swedish company, PP7 Af-färssystem AB. The Education & Health segment is expanded with the acquisi-tion of the companies, Agrando AS, Cito IT A/S and Smart Visitor System AB.
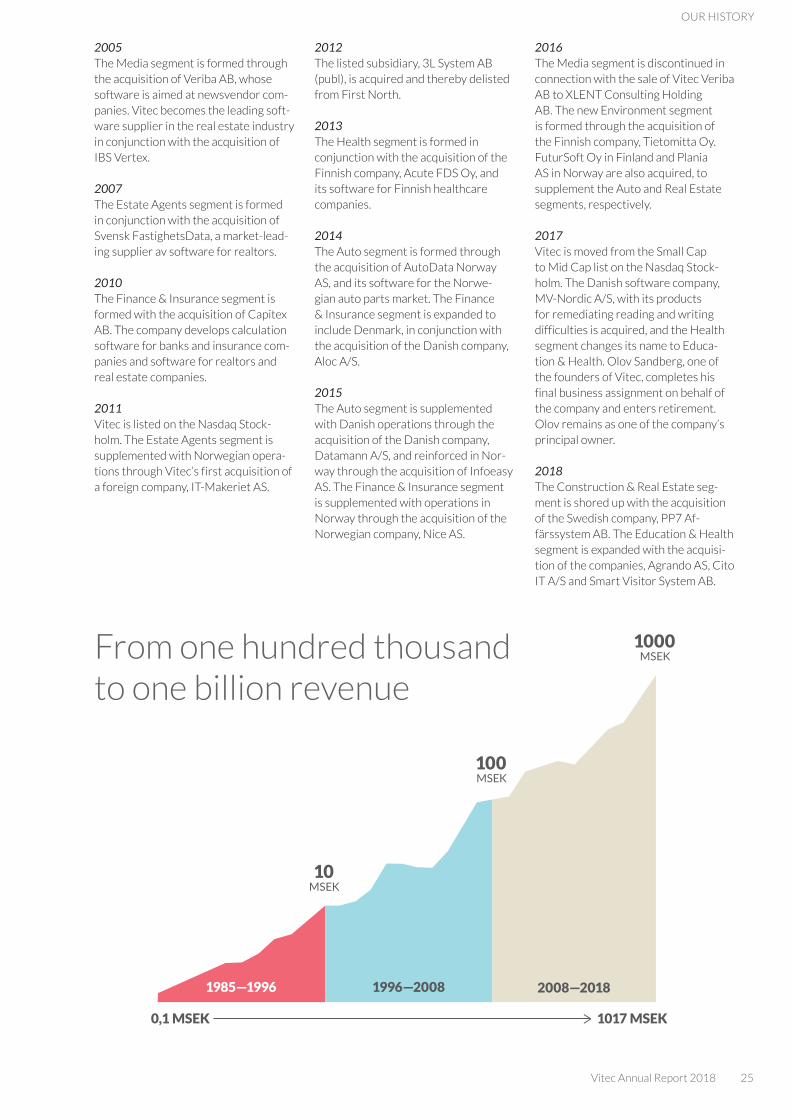
1985—1996 1996—2008
0,1 MSEK 1017 MSEK
2008—2018
10 MSEK
100 MSEK
1000 MSEKFrom one hundred thousand
to one billion revenue
26 Vitec Annual Report 2018
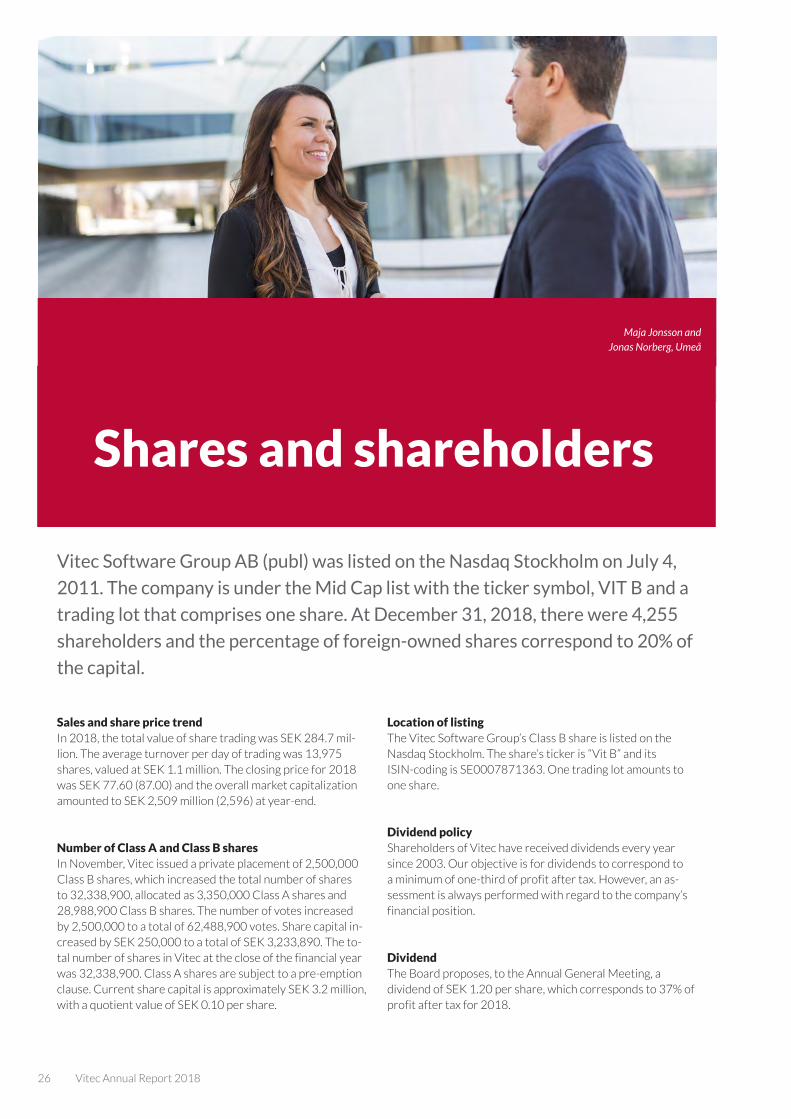
Vitec Software Group AB (publ) was listed on the Nasdaq Stockholm on July 4,
2011. The company is under the Mid Cap list with the ticker symbol, VIT B and a
trading lot that comprises one share. At December 31, 2018, there were 4,255
shareholders and the percentage of foreign-owned shares correspond to 20% of
the capital.
Sales and share price trendIn 2018, the total value of share trading was SEK 284.7 mil-lion. The average turnover per day of trading was 13,975 shares, valued at SEK 1.1 million. The closing price for 2018 was SEK 77.60 (87.00) and the overall market capitalization amounted to SEK 2,509 million (2,596) at year-end.
Number of Class A and Class B sharesIn November, Vitec issued a private placement of 2,500,000 Class B shares, which increased the total number of shares to 32,338,900, allocated as 3,350,000 Class A shares and 28,988,900 Class B shares. The number of votes increased by 2,500,000 to a total of 62,488,900 votes. Share capital in-creased by SEK 250,000 to a total of SEK 3,233,890. The to-tal number of shares in Vitec at the close of the financial year was 32,338,900. Class A shares are subject to a pre-emption clause. Current share capital is approximately SEK 3.2 million, with a quotient value of SEK 0.10 per share.
Location of listingThe Vitec Software Group’s Class B share is listed on the Nasdaq Stockholm. The share’s ticker is “Vit B” and its ISIN-coding is SE0007871363. One trading lot amounts to one share.
Dividend policyShareholders of Vitec have received dividends every year since 2003. Our objective is for dividends to correspond to a minimum of one-third of profit after tax. However, an as-sessment is always performed with regard to the company’s financial position.
DividendThe Board proposes, to the Annual General Meeting, a dividend of SEK 1.20 per share, which corresponds to 37% of profit after tax for 2018.
Shares and shareholders
Maja Jonsson and Jonas Norberg, Umeå

Vitec Annual Report 2018 27
SHARES AND SHAREHOLDERS
Share performance 2012–2018
Information to shareholdersVitec strives to provide shareholders and the stock market with rapid and comprehensive information about its perfor-mance and financial position on a continuous basis. Our web-site, vitecsoftware.com, is our primary channel for information, where we publish financial information and other potentially price-sensitive information, immediately following disclosure. The website also features presentations and video clips of Annual General Meetings, information about the company
and the Vitec share, our financial calendar and information about corporate governance. Visitors can also sign up for an e-mail subscription to receive our press releases.
Analyses of VitecVitec was monitored by ABG Sundal Collier during the year.
Dividend per share
Brief facts2018 2017
Number of Class B shares 28,988,900 26,488,900
Highest closing price, SEK 88.00 91.50
Lowest closing price, SEK 76.40 65.00
Closing price, SEK 77.60 87.00
Average daily turnover, SEK thousands 1,139 1,213
Average daily turnover, no. of shares 13,975 15,991
Market capitalization, SEK million 2,509 2,596
Marketplace Nasdaq Stockholm Nasdaq Stockholm
Segment Mid Cap Mid Cap
Ticker Vit B Vit B
ISIN code SE0007871363 SE0007871363
Share data
Earnings per share
2018 2017 2016 2015 2014
Adjusted equity per share (SEK) 20.71 13.34 11.37 9.24 8.85
Earnings per share (SEK) 3.23 2.70 2.27 2.66 1.75
Earnings per share after dilution (SEK) 3.22 2.70 2.25 2.64 1.68
Dividend paid per share (SEK) 1.10 1.00 0.90 0.67 0.55
Cash flow per share (SEK) 8.01 6.78 5.20 5.09 4.40
%
0
5
10
15
20
25
30
20182017201620152014
Kr
Aktien och ägare
0
25
50
75
100
OMX SEKVitec SEK
2012 2013 2014 2015 2016 2017 2018
SEK share price
*
Sverige
Övriga
Tyskland
Norge
Frankrike
Kanada
USA
Sweden USA Canada
Germany Other countriesNorway
France
0,0
0,2
0,4
0,6
0,8
1,0
1,2
201920172015201320112009200720052003
SEK
* Proposed dividend: 1,20
0,0
0,5
1,0
1,5
2,0
2,5
3,0
3,5Vinst per aktie
20182017201620152014
0,0
0,2
0,4
0,6
0,8
1,0
1,2
201920172015201320112009200720052003
*
SEK
Sverige
Övriga
Tyskland
Norge
Frankrike
Kanada
USA
Sverige, 80% USA Kanada
Tyskland ÖvrigaNorge
Frankrike, %
0
5
10
15
20
25
30
20182017201620152014
Kr
Aktien och ägare
0
25
50
75
100
OMX SEKVitec SEK
2012 2013 2014 2015 2016 2017 2018
SEK share price
*
Sverige
Övriga
Tyskland
Norge
Frankrike
Kanada
USA
Sweden USA Canada
Germany Other countriesNorway
France
0,0
0,2
0,4
0,6
0,8
1,0
1,2
201920172015201320112009200720052003
SEK
* Proposed dividend: 1,20
0,0
0,5
1,0
1,5
2,0
2,5
3,0
3,5Vinst per aktie
20182017201620152014
0,0
0,2
0,4
0,6
0,8
1,0
1,2
201920172015201320112009200720052003
*
SEK
Sverige
Övriga
Tyskland
Norge
Frankrike
Kanada
USA
Sverige, 80% USA Kanada
Tyskland ÖvrigaNorge
Frankrike,
%
0
5
10
15
20
25
30
20182017201620152014
Kr
Aktien och ägare
0
25
50
75
100
OMX SEKVitec SEK
2012 2013 2014 2015 2016 2017 2018
SEK share price
*
Sverige
Övriga
Tyskland
Norge
Frankrike
Kanada
USA
Sweden USA Canada
Germany Other countriesNorway
France
0,0
0,2
0,4
0,6
0,8
1,0
1,2
201920172015201320112009200720052003
SEK
* Proposed dividend: 1,20
0,0
0,5
1,0
1,5
2,0
2,5
3,0
3,5Vinst per aktie
20182017201620152014
0,0
0,2
0,4
0,6
0,8
1,0
1,2
201920172015201320112009200720052003
*
SEK
Sverige
Övriga
Tyskland
Norge
Frankrike
Kanada
USA
Sverige, 80% USA Kanada
Tyskland ÖvrigaNorge
Frankrike,
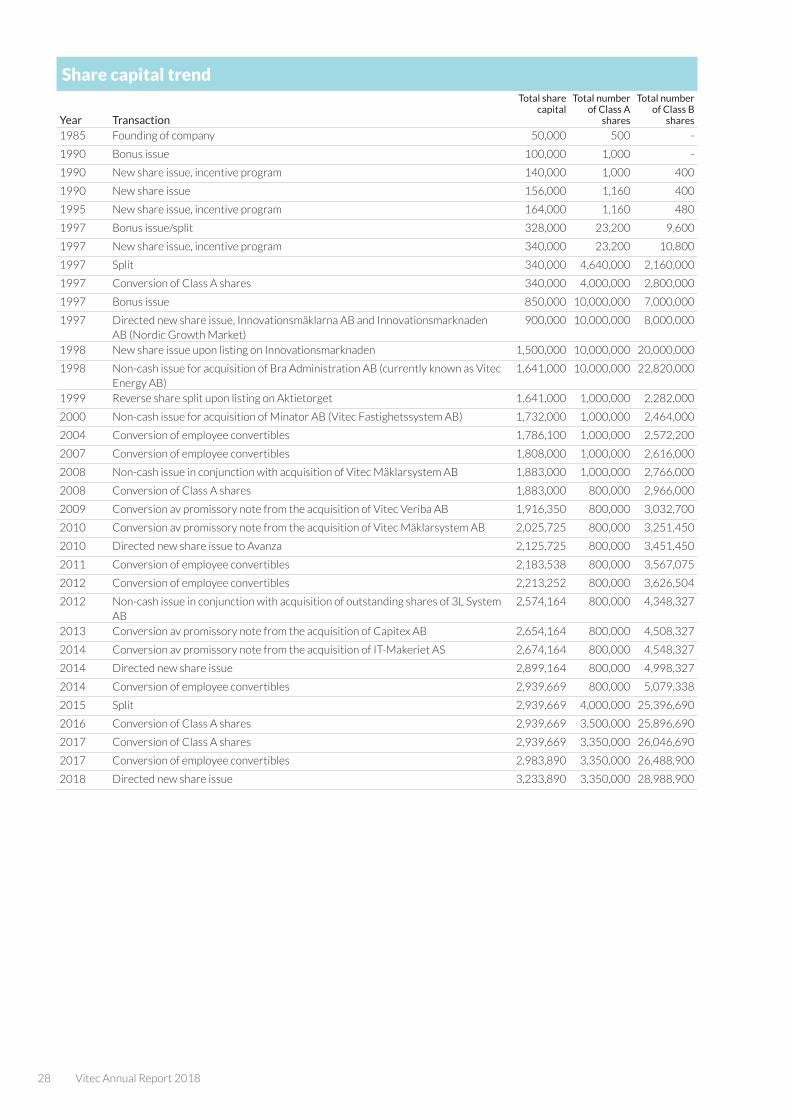
28 Vitec Annual Report 2018
Share capital trend
Year Transaction
Total share capital
Total number of Class A
shares
Total number of Class B
shares
1985 Founding of company 50,000 500 -
1990 Bonus issue 100,000 1,000 -
1990 New share issue, incentive program 140,000 1,000 400
1990 New share issue 156,000 1,160 400
1995 New share issue, incentive program 164,000 1,160 480
1997 Bonus issue/split 328,000 23,200 9,600
1997 New share issue, incentive program 340,000 23,200 10,800
1997 Split 340,000 4,640,000 2,160,000
1997 Conversion of Class A shares 340,000 4,000,000 2,800,000
1997 Bonus issue 850,000 10,000,000 7,000,000
1997 Directed new share issue, Innovationsmäklarna AB and Innovationsmarknaden AB (Nordic Growth Market)
900,000 10,000,000 8,000,000
1998 New share issue upon listing on Innovationsmarknaden 1,500,000 10,000,000 20,000,000
1998 Non-cash issue for acquisition of Bra Administration AB (currently known as Vitec Energy AB)
1,641,000 10,000,000 22,820,000
1999 Reverse share split upon listing on Aktietorget 1,641,000 1,000,000 2,282,000
2000 Non-cash issue for acquisition of Minator AB (Vitec Fastighetssystem AB) 1,732,000 1,000,000 2,464,000
2004 Conversion of employee convertibles 1,786,100 1,000,000 2,572,200
2007 Conversion of employee convertibles 1,808,000 1,000,000 2,616,000
2008 Non-cash issue in conjunction with acquisition of Vitec Mäklarsystem AB 1,883,000 1,000,000 2,766,000
2008 Conversion of Class A shares 1,883,000 800,000 2,966,000
2009 Conversion av promissory note from the acquisition of Vitec Veriba AB 1,916,350 800,000 3,032,700
2010 Conversion av promissory note from the acquisition of Vitec Mäklarsystem AB 2,025,725 800,000 3,251,450
2010 Directed new share issue to Avanza 2,125,725 800,000 3,451,450
2011 Conversion of employee convertibles 2,183,538 800,000 3,567,075
2012 Conversion of employee convertibles 2,213,252 800,000 3,626,504
2012 Non-cash issue in conjunction with acquisition of outstanding shares of 3L System AB
2,574,164 800,000 4,348,327
2013 Conversion av promissory note from the acquisition of Capitex AB 2,654,164 800,000 4,508,327
2014 Conversion av promissory note from the acquisition of IT-Makeriet AS 2,674,164 800,000 4,548,327
2014 Directed new share issue 2,899,164 800,000 4,998,327
2014 Conversion of employee convertibles 2,939,669 800,000 5,079,338
2015 Split 2,939,669 4,000,000 25,396,690
2016 Conversion of Class A shares 2,939,669 3,500,000 25,896,690
2017 Conversion of Class A shares 2,939,669 3,350,000 26,046,690
2017 Conversion of employee convertibles 2,983,890 3,350,000 26,488,900
2018 Directed new share issue 3,233,890 3,350,000 28,988,900
%
0
5
10
15
20
25
30
20182017201620152014
Kr
Aktien och ägare
0
25
50
75
100
OMX SEKVitec SEK
2012 2013 2014 2015 2016 2017 2018
SEK share price
*
Sverige
Övriga
Tyskland
Norge
Frankrike
Kanada
USA
Sweden USA Canada
Germany Other countriesNorway
France
0,0
0,2
0,4
0,6
0,8
1,0
1,2
201920172015201320112009200720052003
SEK
* Proposed dividend: 1,20
0,0
0,5
1,0
1,5
2,0
2,5
3,0
3,5Vinst per aktie
20182017201620152014
0,0
0,2
0,4
0,6
0,8
1,0
1,2
201920172015201320112009200720052003
*
SEK
Sverige
Övriga
Tyskland
Norge
Frankrike
Kanada
USA
Sverige, 80% USA Kanada
Tyskland ÖvrigaNorge
Frankrike,
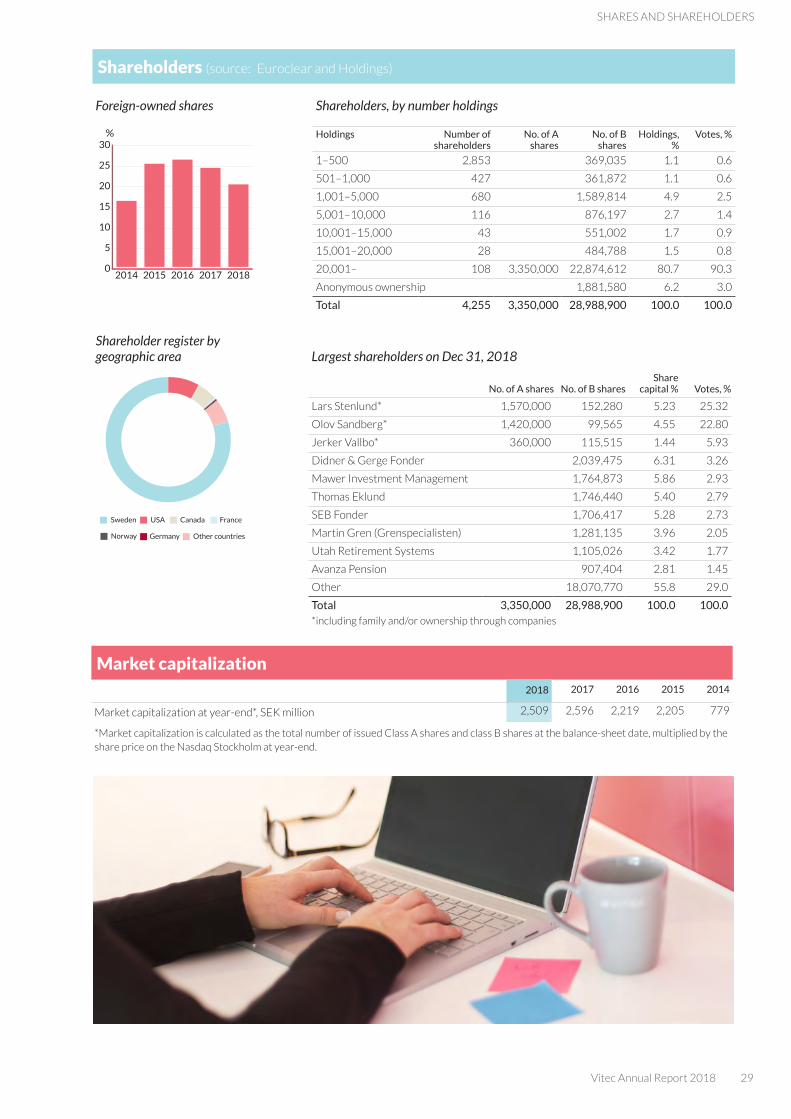
Vitec Annual Report 2018 29
SHARES AND SHAREHOLDERS
Shareholder register by geographic area Largest shareholders on Dec 31, 2018
No. of A shares No. of B sharesShare
capital % Votes, %
Lars Stenlund* 1,570,000 152,280 5.23 25.32
Olov Sandberg* 1,420,000 99,565 4.55 22.80
Jerker Vallbo* 360,000 115,515 1.44 5.93
Didner & Gerge Fonder 2,039,475 6.31 3.26
Mawer Investment Management 1,764,873 5.86 2.93
Thomas Eklund 1,746,440 5.40 2.79
SEB Fonder 1,706,417 5.28 2.73
Martin Gren (Grenspecialisten) 1,281,135 3.96 2.05
Utah Retirement Systems 1,105,026 3.42 1.77
Avanza Pension 907,404 2.81 1.45
Other 18,070,770 55.8 29.0
Total 3,350,000 28,988,900 100.0 100.0*including family and/or ownership through companies
Shareholders (source: Euroclear and Holdings)
Foreign-owned shares Shareholders, by number holdings
Holdings Number of shareholders
No. of A shares
No. of B shares
Holdings, %
Votes, %
1–500 2,853 369,035 1.1 0.6
501–1,000 427 361,872 1.1 0.6
1,001–5,000 680 1,589,814 4.9 2.5
5,001–10,000 116 876,197 2.7 1.4
10,001–15,000 43 551,002 1.7 0.9
15,001–20,000 28 484,788 1.5 0.8
20,001– 108 3,350,000 22,874,612 80.7 90.3
Anonymous ownership 1,881,580 6.2 3.0
Total 4,255 3,350,000 28,988,900 100.0 100.0
Market capitalization 2018 2017 2016 2015 2014
Market capitalization at year-end*, SEK million 2,509 2,596 2,219 2,205 779
*Market capitalization is calculated as the total number of issued Class A shares and class B shares at the balance-sheet date, multiplied by the share price on the Nasdaq Stockholm at year-end.
%
0
5
10
15
20
25
30
20182017201620152014
Kr
Aktien och ägare
0
25
50
75
100
OMX SEKVitec SEK
2012 2013 2014 2015 2016 2017 2018
SEK share price
*
Sverige
Övriga
Tyskland
Norge
Frankrike
Kanada
USA
Sweden USA Canada
Germany Other countriesNorway
France
0,0
0,2
0,4
0,6
0,8
1,0
1,2
201920172015201320112009200720052003
SEK
* Proposed dividend: 1,20
0,0
0,5
1,0
1,5
2,0
2,5
3,0
3,5Vinst per aktie
20182017201620152014
0,0
0,2
0,4
0,6
0,8
1,0
1,2
201920172015201320112009200720052003
*
SEK
Sverige
Övriga
Tyskland
Norge
Frankrike
Kanada
USA
Sverige, 80% USA Kanada
Tyskland ÖvrigaNorge
Frankrike,

30 Vitec Annual Report 2018
Administration reportThe Board of Directors and CEO of Vitec Software Group AB (publ), corp. reg. no. 556258-4804, with its registered office in Umeå, herewith present their annual report, sustainability report and consolidated financial statements for the 2018 financial year.
This English version of the annual report is a translation of the original Swedish version. In the event of differences, the Swedish version shall take precedence over the English translation. In accordance with Chap. 6 Sect. 11 of the Swed-ish Annual Accounts Act, Vitec has chosen to prepare the statutory sustainability report as a separate report from the annual report, the contents of which are presented on pages 14–23.
OperationsVitec is the Nordic market leader in Vertical Market Soft-ware. We develop and deliver standardized software aimed at various niche markets. We are active in Denmark, Finland, Norway and Sweden, and our operations grow through the acquisition of well-managed and established software com-panies. Among our customers are pharmacies, banks, auto parts dealers, construction and real estate companies, energy companies, realtors, insurance companies, healthcare com-panies, municipal culture and leisure departments, churches, education companies and waste management companies. Vitec is listed on the Nasdaq Stockholm and had sales of SEK 1,017 million in 2018.
We have a growth-oriented strategy and are continuously in search of new acquisition objects. Our objective is to be the market leader within niches where we are active. Our current geographic market comprises Sweden 32%, Denmark 28%, Finland 18%, Norway 21% and other countries 1%. Our oper-ations are governed based on the following seven segments:
� Auto: software for the automotive industry and machinery sector in Denmark, Finland, Norway and Sweden.
� Energy: advanced forecasting systems for electricity trad-ers, as well as calculation and mapping systems to own-
ers of electricity and district-heating grids. The geograph-ic market for this segment comprises the Nordic and Baltic countries, the rest of Europe and the Middle East.
� Real Estate: software for the construction and real-estate sectors in Norway and Sweden.
� Finance & Insurance: software for banks, financial institu-tions and insurance companies in Denmark, Norway and Sweden.
� Environment: software for private and municipal waste-and-resource processing in Finland.
� Estate Agents: software for real estate agents in Norway and Sweden.
� Education & Health: software to individuals with reading and writing difficulties in Denmark, Norway and Sweden, as well as software for healthcare companies in Finland. The segment also offers software for church operations in the Nordic region, with the primary markets comprising Norway and Sweden; software for the pharmacy market in Denmark, and software for municipal leisure and cultural departments in Norway and Sweden.
Net sales and earningsThe Group’s net sales in 2018 totaled SEK 1,016.8 million (855.0) – an increase of 19% compared with 2017. The increase in net sales is primarily attributable to acquisitions. Operating profit amounted to SEK 128.4 million (106.7), corresponding to an operating margin of 13% (12). Operating profit included depreciation/amortization and impairment of SEK 158.5 million (126.9).
Net financial items totaled a negative SEK 11.6 million (neg: 8.6) Financial income amounted to SEK 0.3 million (0.3) and comprised interest from bank accounts. Financial expens-es totaled a negative SEK 11.9 million (neg: 8.9) and consisted of interest on acquisition credits and convertible debentures.
Profit after tax for the year was SEK 96.9 million (79.4), of which SEK 96.9 million (79.4) was attributable to Parent Company shareholders.
Segment trendOur operations are divided into the following segments: Auto, Energy, Real Estate, Finance & Insurance, Environment, Estate Agents and Education & Health.
External net sales Growth, % Operating profit Operating margin, %
SEK million 2018 2017 2018 2018 2017 2018 2017
Auto 170.3 155.9 9 28.3 19.5 17 12
Energy 26.0 25.7 1 9.3 8.0 36 31
Real Estate 206.3 190.1 9 44.3 32.2 21 17
Finance & Insurance 132.2 142.3 -7 12.7 29.0 10 20
Environment 45.9 44.1 4 5.5 5.5 12 12
Estate Agents 155.4 138.0 13 23.9 5.5 15 4
Education & Health 278.3 157.9 76 9.5 11.2 3 7
Shared 2.2 1.0 120 0.0 0.0 0 0
Operating profit before acquisition-related costs* 1,016.8 855.0 19 133.5 110.9 13 13
Acquisition-related costs - - - -5.1 -4.2 - -
Operating profit after acquisition-related costs - - - 128.4 106.7 13 12
*Acquisition-related costs affecting comparability make it difficult to track the trend. For this reason, the above operating profit/loss is stated as before and after acquisition-related costs.
Vitec Annual Report 2018 31
ADMINISTRATION REPORT
Auto The Auto segment includes Vitec Autodata AS, Vitec Data-mann A/S, Vitec Infoeasy AS and Vitec Futursoft Oy. Total revenue amounted to SEK 170.3 million (155.9). Recurring revenues rose by 14% to SEK 146.3 million (128.6), license revenues declined 14%to SEK 5.2 million (6.1) and services revenues declined 18% to SEK 13.4 million (16.3). Other revenues increased 8% to a total of SEK 5.4 million (5.0). The percentage of recurring revenues in net sales was 86% (82). The operating margin increased to 17% (12%).
EnergyThis segment comprises Vitec Energy AB. Total revenue amounted to SEK 26.0 million (25.7) – a gain of 1%. Recurring revenues gained 4% to achieve SEK 19.9 million (19.1). Ser-vice revenues declined 10%, settling at SEK 5.9 million (6.5). The percentage of recurring revenues in net sales was 74% (74). The operating margin rose to 36% (31%).
Real EstateThis segment includes Vitec Förvaltningssystem AB, Vitec Fastighetssystem AB, Vitec Capifast AB, Vitec Software AB, Vitec Plania AS and Vitec PP7 AB. Vitec PP7’s operations were consolidated as of April 9, 2018. Total revenue amount-ed to SEK 206.3 million (190.1), corresponding to an increase of 9%. License revenues declined 25% to achieve SEK 6.5 million (8.6). Recurring revenues gained 18% to achieve a total of SEK 128.1 million (108.8). Service revenues declined 3% to SEK 68.0 million (69.8). Recurring revenues accounted for 62% (57) of net sales. The operating margin rose to 21% (17%).
Finance & InsuranceThe segment comprises Vitec Capitex AB, the Vitec Aloc A/S Group and Vitec Nice AS. Total revenue amounted to SEK 132.2 million (142.3), corresponding to a decline of 7%. Recurring revenues gained 11% to achieve SEK 116.3 million (104.4). License revenues declined 96% to SEK 0.3 million (7.5). Service revenues declined 50% to achieve SEK 15.1 mil-lion (29.9). The percentage of recurring revenues in net sales was 88% (73). The operating margin was 10% (20).
EnvironmentThis segment comprises Tietomitta Oy and 3L Media AB. Total revenue amounted to SEK 45.9 million (44.1) – a gain of 4%. Recurring revenues rose 13% to a total of SEK 37.0 million (32.6). Service revenues increased by 8% to a total of SEK 6.2 million (5.7). License revenues declined 58%, totaling SEK 1.5 million (3.5). Recurring revenues accounted for 81% (74) of net sales. The operating margin was unchanged, at 12% (12).
Estate AgentsThe segment comprises Vitec Mäklarsystem AB, Capitex AB, Vitec Megler AS, Vitec Megler AB and ADservice Scandinavia AB. The total revenue was SEK 155.4 million (138.0), represent-ing a gain of 13%. License revenues increased to SEK 0.1 million (0). Recurring revenues increased by 2% to achieve SEK 135.4 million (132.5). Service revenues increased 280% to a total of SEK 19.5 million (5.1). The share of recurring
revenues in net sales was 87% (96). The operating margin was 15% (4).
Education & HealthThe segment includes the Acuvitec Oy Group, the Vitec Agrando AS Group, Vitec Cito A/S, the Vitec MV A/S Group and Vitec Smart Visitor System AB. Vitec MV’s operations were consolidated as of July 6, 2017. Agrando’s operations in were consolidate as of April 19, 2018, Cito IT’s operations as of May 31, 2018 and Smart Visitor System’ operations as of November 9, 2018. During the year, Acuvitec Oy closed its office in France in order to concentrate development work in Finland. The move resulted in a nonrecurring adverse impact of SEK 4.7 million, but will generate savings in the long term.
The total revenue for the segment was SEK 278.3 million (157.9), representing a gain of 76%. Recurring revenues rose by 92% to SEK 160.9 million (83.7), service revenues rose 68% to SEK 20.4 million (12.2), while license revenues increased by 54% to achieve SEK 21.4 million (13.8). Other revenues rose by 57% to SEK 75.6 million (48.2) and com-prised sales of goods. The share of recurring revenues in net sales was 58% (53). The operating margin was 3% (7).
Acquisitions and changes to the legal structure during 2018In 2018, the following corporate acquisitions entailed chang-es to the legal structure:
� April 9, PP7 Affärssystem AB � April 19, Agrando AS � May 31, Cito IT A/S � November 6, Smart Visitor System AB
All of the acquisitions were consolidated as of the acquisition date.
On April 1, 2018, a new company, Vitec Financial Services AS, was launched. On June 1, Acute Sarl, a subsidiary of Acu-Vitec Oy, was divested. On November 23, Labora Software Oy, a subsidiary of Vitec Agrando AS, was divested.
ObjectivesVitec has a growth-oriented strategy and is continuously in search of new acquisition objects. For the past 10 years, our growth has been 18% per year. The Board of Directors has set a financial objective to achieve an operating margin of 15% while maintaining efforts focused on continuous growth.
OUTCOME:
% 2018 2017 2016 2015 2014
Sales growth 19 27 9 26 32
Operating margin 13 12 13 16 14
32 Vitec Annual Report 2018
Significant events in 2018April 9: Vitec acquired the software company, PP7 Affärssystem ABPP7 Affärssystem’s main product is a cloud-based software for project and business support that optimizes all project flows and procedures for the construction and installation market in Sweden. The company reported sales of nearly SEK 8 million, with an adjusted EBITDA of SEK 1.4 million for the 2017 financial year.
April 19: Vitec acquired the Norwegian software company, Agrando ASAgrando develops niche software for churching operations in the Nordic region, with Norway and Sweden as its primary markets. The company and its subsidiaries reported sales of SEK 42 million, with an EBITDA of SEK 5.5 million for the 2017 financial year.
May 31: Vitec acquired the Danish software company, Cito IT A/SCito’s primary product is niche software for the pharmacy market in Denmark. The product is used for managing the en-tire chain of the Danish pharmacy workflow, such as product inventory, cash operations and prescriptions processing. The company reported sales of DKK 25.5 million, with an adjusted EBITDA of DKK 7.6 million for the 2016/17 financial year.
August 31: Vitec signed a new agreement with SkanskaAmong the most significant developments in the agreement between Vitec and Skanska was a brand-new software from Vitec. The product was developed for construction compa-nies to manage newly built tenant-owner properties and single-family dwellings.
September 28: Vitec refinanced its acquisition-loan facility Vitec secured a SEK 500 million acquisition-loan facility with Nordea. It replaces two previous facilities of SEK 250 million and SEK 200 million at Nordea. The new facility increased the scope by SEK 50 million.
October 26: Vitec signed a new agreement with BostadenBostaden, a municipal-owned nonprofit housing corporation in Umeå Municipality, chose Vitec as the supplier of its new realtor system. Vitec’s software is a part of Bostaden’s efforts to digitalize and adapt to the rapid developments in technical solutions.
November 5: CFO announces her departure from Vitec Maria Kröger, CFO of Vitec since 2012, announced her departure from her post at Vitec. Recruitment of a new CFO commenced immediately. Maria Kröger will remain at her position until such time that a replacement is found, but by no later the 2019 AGM.
November 6: Vitec acquired the software company, Smart Visitor System ABSmart Visitor System develops specialized software for municipal leisure and cultural departments in Norway and Sweden. The product is a complete enterprise system for handling reservations, visitors and grants. The company reported sales of SEK 23.7 million, with an adjusted EBITDA of SEK 3.1 million for the 2017 financial year.
November 29: Vitec completed a directed new share issue With the support of the AGM’s issue-authorization of April 23, 2018, Vitec resolved to carry out a directed new share issue of 2,500,000 Class B shares at a subscription price of SEK 79 per share. The issue increased the company’s total the number of shares to 32,338,900, allocated as 3,350,000 Class A shares and 28,988,900 Class B shares. Share capital increased by SEK 250,000 to total SEK 3,233,890.
December 12: Vitec signed a new agreement with Collector BankVitec and Collector Bank signed an agreement pertaining to the product, Capitex Företagslån. It premiered in the Swedish market and in the near future, the new work method will also be introduced to Finland and Norway.
Events after the balance-sheet dateOn March 5, 2019, all shares of the Finnish software compa-ny, Avoine Oy, were acquired. Its product is aimed at sports clubs and labor unions in Finland. The product is delivered as Software as a Service (SaaS). The company reported sales of SEK 29.4 million, with an adjusted EBITDA of SEK 6.3 million for the 2018 financial year. A cash payment will be transacted on the date of the takeover.
Consolidation will commence as of the acquisition date. At the time of this report’s publication, there were no finan-cial statements available that could serve as the basis of a detailed description of the acquisition. For this reason, no information is presented about the fair value of acquired receivables, and acquired assets and liabilities. We expect the future items of a detailed acquisition analysis to comprise product rights, brands and goodwill. Goodwill is deemed to be attributable to anticipated profitability, complementary expertise requirements, as well as expected synergies, in the form of the joint development of our products.
Liquidity, cash flow and financial positionThe Group’s cash and cash equivalents, including current investments at the end of the period, totaled SEK 235.3 million (57.9). The increase is mainly attributable to the new share issue of SEK 194.9 million, which was implemented in late 2018. In addition to cash and cash equivalents, Vitec had overdraft facilities of SEK 20 million and SEK 53.3 million in unutilized portions of the credit facility totaling SEK 500 million.
� Cash flow from operating activities was SEK 197.1 million (187.6).
� Cash flow from investing activities was a negative SEK 276.9 million (neg: 198.1), comprising a negative SEK 134.3 million (neg: 88.8) for the acquisition of subsidiar-ies, negative SEK 128.3 million (neg: 101.5) for the acqui-sition of intangible fixed assets including capitalized work and negative SEK 14.3 million (neg: 7.8) for investments in property, plant and equipment.
� Cash flow from financing activities totaled SEK 254.0 (neg: 15.5), and comprised SEK 194.9 million (0) from new share issue, SEK 181.9 million (109.1) from new bank loans, negative SEK 32.8 million (neg: 29.4) from dividend payments and negative SEK 90.0 million (neg: 95.3) from loan repayments.
Vitec Annual Report 2018 33
ADMINISTRATION REPORT
At Monday, 31 December 2018, interest-bearing liabili-ties totaled SEK 509.3 million (406.1) and comprised SEK 503.6 million (374.9) in non-current interest-bearing lia-bilities and SEK 5.6 million (31.2) in current interest-bear-ing liabilities. During the period, a directed new share issue of SEK
194.9 million was completed, after deduction for issue costs.Our loans with Nordea were renegotiated. The two credit
facilities and two older loans were consolidated into a single credit facility totaling SEK 500 million. At the balance-sheet date, SEK 446.7 million of the credit facility was utilized. The facility is divided into tranches, that allow for us to autono-mously decide on the amount and timing of our repayments to the facility. Since we are yet to decide on any repayment, the entire loan is regarded as a non-current loan. Its terms and conditions, and covenant requirements, are in line with the previous agreements with the bank.
During the period, SEK 181.9 million of the credit facility was utilized to finance acquisitions and SEK 83.4 million pertaining to previous acquisitions was repaid to the credit facility. Amortization of bank loans amounted to SEK 6.6 million.
During the period, the supplementary purchase consid-erations for the acquisition of Futursoft Oy and Fox Publish AS were settled – SEK 22.9 million was paid with respect to Futursoft and SEK 1.4 million with respect to Fox Publish. The supplementary purchase consideration for PP7 Affärssystem AB was adjusted downward by SEK 4 million.
The Group’s net interest-bearing assets and interest-bear-ing liabilities totaled an expense of SEK 274.0 million (exp: 348.2).
Equity attributable to Vitec’s shareholders totaled SEK 669.6 million (398.2). The equity/assets ratio was 40% (32). Dividends of SEK 1.10 per share were issued following the Annual General Meeting of April, totaling SEK 32.8 million.
InvestmentsInvestments totaled to SEK 128.3 million in intangible fixed assets, distributed as SEK 127.5 million for capitalized work and SEK 0.7 million for software. SEK 14.3 million was invest-ed in tangible fixed assets. The acquisition of PP7 Affärssys-tem AB, Agrando AS, Cito IT A/S and Smart Visitor System AB generated SEK 177.2 million in product rights, brands, customer agreements and goodwill.
Research and developmentVitec develops and supplies niche-oriented software. Sustain-able development is essential to our strategy and a prerequi-site for long-term survival. Strategically focused development strengthens existing operations and enables the introduction of new products and services.
Intangible fixed assetsThe Group’s intangible fixed assets comprise goodwill, product rights, brands and customer agreements that arise from acquisitions, as well as capitalized development work and software. At December 31, 2018 the carrying amount was SEK 385.6 million (282.6) for goodwill, SEK 270.0 million (290.7) for product rights, SEK 269.0 million (197.9)
for capitalized development expenditure, SEK 122.9 million (94.8) for customer agreements and SEK 80.3 million (74.8) for brands.
Shareholders’ equityTotal shareholders' equity amounted to SEK 669.6 million (398.2) at December 31, 2018. Equity attributable to Vitec’s shareholders totaled SEK 669.6 million (398.2).
At December 31, there was an ongoing convertible program for employees, and a convertible bond signed in conjunction with an acquisition. These amounted to SEK 39.8 million and are convertible to a maximum of 434,605 class B shares, and increase share capital by SEK 0.04 million.
EmployeesIn 2018 Vitec had an average of 613 (540) employees, of which 182 (132) were women. At year-end, the number of employees was 643 (573).
Parent CompanyThe Parent Company’s net sales totaled SEK 63.4 million (79.9) and essentially comprised invoicing to subsidiaries for intra-Group services rendered, pertaining to premises, data communications and telephony, financial reporting, HR and management/operations development. Profit after tax amounted to SEK 68.7 million (64.9), including anticipated dividends from subsidiaries.
The Parent Company’s cash and cash equivalents totaled SEK 222.9 million (51.6). Cash and cash equivalents comprise a Group currency account, where the Parent Company holds a top (group) account with the bank. Consequently, subsidiary cash and cash equivalents comprise the receivables/liabilities of the Parent Company. The Parent Company has an agree-ment for overdraft facilities of SEK 20 million (20) and an acquisition loan facility of SEK 500 million, of which SEK 53.3 million was unutilized at the balance-sheet date.
Investments totaled to SEK 0.6 million (0.9) for intangible fixed assets, SEK 0.8 million (0.5) for tangible fixed assets, and SEK 214.1 (109.1) for participations in Group companies. The value of participations in subsidiaries during the year was reduced by SEK 2.4 million, due to the downward adjustment of the conditional contingent consideration for Futursoft Oy, and by SEK 4.0 million, due to the downward adjustment of the conditional contingent consideration for PP7 Af-färssystem AB. Current non-interest-bearing liabilities were reduced at a corresponding scope.
Non-current interest-bearing liabilities totaled SEK 503.5 million (374.6) in the form of SEK 463.7 million (335.8) bank loans and SEK 39.8 million (38.8) for convertible debentures. Current interest-bearing liabilities totaled SEK 5.6 million (31.2) and pertained entirely to bank loans. During the year, new loans of SEK 181.9 million were raised.
In April, dividends of SEK 32.8 million (29.4) were paid.
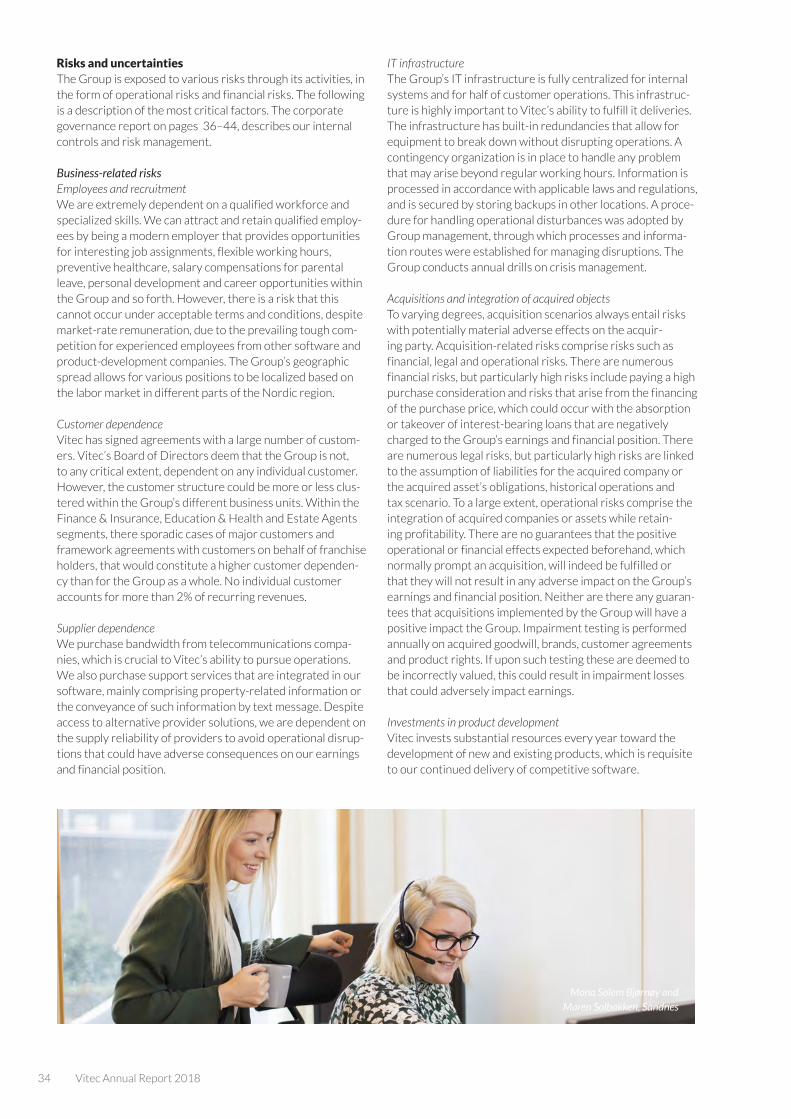
34 Vitec Annual Report 2018
Risks and uncertaintiesThe Group is exposed to various risks through its activities, in the form of operational risks and financial risks. The following is a description of the most critical factors. The corporate governance report on pages 36–44, describes our internal controls and risk management.
Business-related risksEmployees and recruitmentWe are extremely dependent on a qualified workforce and specialized skills. We can attract and retain qualified employ-ees by being a modern employer that provides opportunities for interesting job assignments, flexible working hours, preventive healthcare, salary compensations for parental leave, personal development and career opportunities within the Group and so forth. However, there is a risk that this cannot occur under acceptable terms and conditions, despite market-rate remuneration, due to the prevailing tough com-petition for experienced employees from other software and product-development companies. The Group’s geographic spread allows for various positions to be localized based on the labor market in different parts of the Nordic region.
Customer dependenceVitec has signed agreements with a large number of custom-ers. Vitec’s Board of Directors deem that the Group is not, to any critical extent, dependent on any individual customer. However, the customer structure could be more or less clus-tered within the Group’s different business units. Within the Finance & Insurance, Education & Health and Estate Agents segments, there sporadic cases of major customers and framework agreements with customers on behalf of franchise holders, that would constitute a higher customer dependen-cy than for the Group as a whole. No individual customer accounts for more than 2% of recurring revenues.
Supplier dependenceWe purchase bandwidth from telecommunications compa-nies, which is crucial to Vitec’s ability to pursue operations. We also purchase support services that are integrated in our software, mainly comprising property-related information or the conveyance of such information by text message. Despite access to alternative provider solutions, we are dependent on the supply reliability of providers to avoid operational disrup-tions that could have adverse consequences on our earnings and financial position.
IT infrastructureThe Group’s IT infrastructure is fully centralized for internal systems and for half of customer operations. This infrastruc-ture is highly important to Vitec’s ability to fulfill it deliveries. The infrastructure has built-in redundancies that allow for equipment to break down without disrupting operations. A contingency organization is in place to handle any problem that may arise beyond regular working hours. Information is processed in accordance with applicable laws and regulations, and is secured by storing backups in other locations. A proce-dure for handling operational disturbances was adopted by Group management, through which processes and informa-tion routes were established for managing disruptions. The Group conducts annual drills on crisis management.
Acquisitions and integration of acquired objectsTo varying degrees, acquisition scenarios always entail risks with potentially material adverse effects on the acquir-ing party. Acquisition-related risks comprise risks such as financial, legal and operational risks. There are numerous financial risks, but particularly high risks include paying a high purchase consideration and risks that arise from the financing of the purchase price, which could occur with the absorption or takeover of interest-bearing loans that are negatively charged to the Group’s earnings and financial position. There are numerous legal risks, but particularly high risks are linked to the assumption of liabilities for the acquired company or the acquired asset’s obligations, historical operations and tax scenario. To a large extent, operational risks comprise the integration of acquired companies or assets while retain-ing profitability. There are no guarantees that the positive operational or financial effects expected beforehand, which normally prompt an acquisition, will indeed be fulfilled or that they will not result in any adverse impact on the Group’s earnings and financial position. Neither are there any guaran-tees that acquisitions implemented by the Group will have a positive impact the Group. Impairment testing is performed annually on acquired goodwill, brands, customer agreements and product rights. If upon such testing these are deemed to be incorrectly valued, this could result in impairment losses that could adversely impact earnings.
Investments in product developmentVitec invests substantial resources every year toward the development of new and existing products, which is requisite to our continued delivery of competitive software.
Mona Solem Bjørnøy and Maren Solbakken, Sandnes
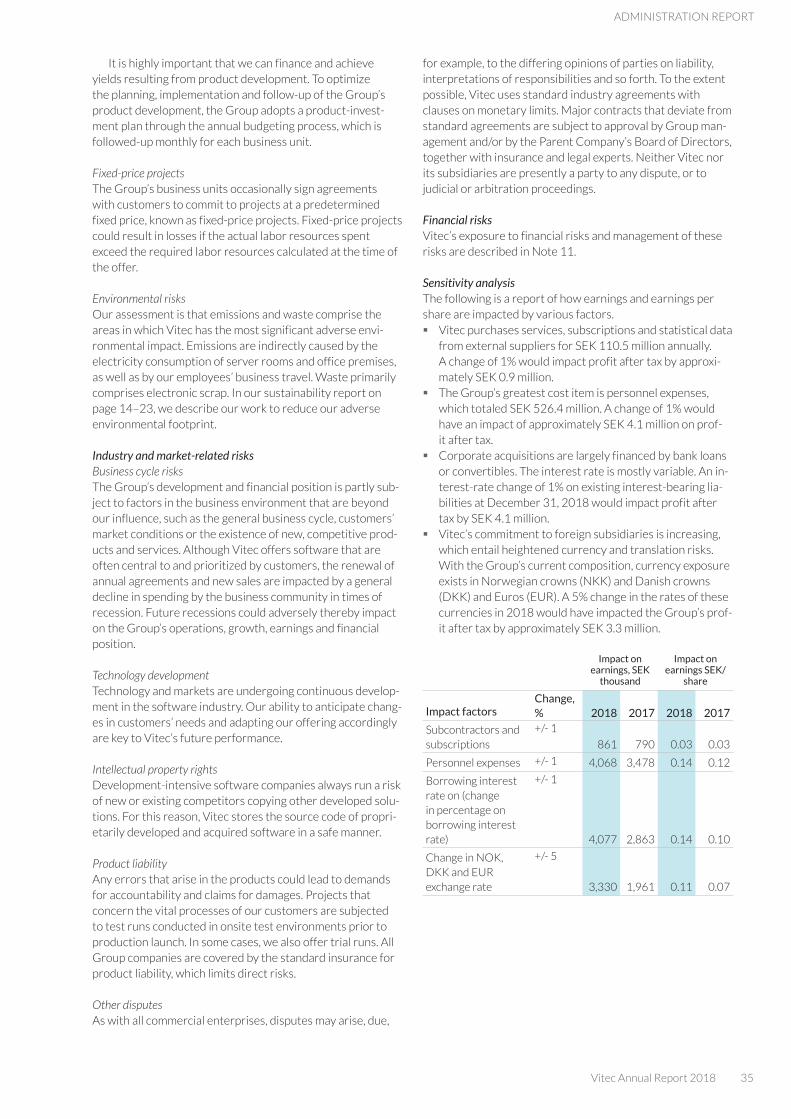
Vitec Annual Report 2018 35
ADMINISTRATION REPORT
It is highly important that we can finance and achieve yields resulting from product development. To optimize the planning, implementation and follow-up of the Group’s product development, the Group adopts a product-invest-ment plan through the annual budgeting process, which is followed-up monthly for each business unit.
Fixed-price projectsThe Group’s business units occasionally sign agreements with customers to commit to projects at a predetermined fixed price, known as fixed-price projects. Fixed-price projects could result in losses if the actual labor resources spent exceed the required labor resources calculated at the time of the offer.
Environmental risksOur assessment is that emissions and waste comprise the areas in which Vitec has the most significant adverse envi-ronmental impact. Emissions are indirectly caused by the electricity consumption of server rooms and office premises, as well as by our employees’ business travel. Waste primarily comprises electronic scrap. In our sustainability report on page 14–23, we describe our work to reduce our adverse environmental footprint.
Industry and market-related risksBusiness cycle risksThe Group’s development and financial position is partly sub-ject to factors in the business environment that are beyond our influence, such as the general business cycle, customers’ market conditions or the existence of new, competitive prod-ucts and services. Although Vitec offers software that are often central to and prioritized by customers, the renewal of annual agreements and new sales are impacted by a general decline in spending by the business community in times of recession. Future recessions could adversely thereby impact on the Group’s operations, growth, earnings and financial position.
Technology developmentTechnology and markets are undergoing continuous develop-ment in the software industry. Our ability to anticipate chang-es in customers’ needs and adapting our offering accordingly are key to Vitec’s future performance.
Intellectual property rightsDevelopment-intensive software companies always run a risk of new or existing competitors copying other developed solu-tions. For this reason, Vitec stores the source code of propri-etarily developed and acquired software in a safe manner.
Product liabilityAny errors that arise in the products could lead to demands for accountability and claims for damages. Projects that concern the vital processes of our customers are subjected to test runs conducted in onsite test environments prior to production launch. In some cases, we also offer trial runs. All Group companies are covered by the standard insurance for product liability, which limits direct risks.
Other disputesAs with all commercial enterprises, disputes may arise, due,
for example, to the differing opinions of parties on liability, interpretations of responsibilities and so forth. To the extent possible, Vitec uses standard industry agreements with clauses on monetary limits. Major contracts that deviate from standard agreements are subject to approval by Group man-agement and/or by the Parent Company’s Board of Directors, together with insurance and legal experts. Neither Vitec nor its subsidiaries are presently a party to any dispute, or to judicial or arbitration proceedings.
Financial risksVitec’s exposure to financial risks and management of these risks are described in Note 11.
Sensitivity analysisThe following is a report of how earnings and earnings per share are impacted by various factors.
� Vitec purchases services, subscriptions and statistical data from external suppliers for SEK 110.5 million annually. A change of 1% would impact profit after tax by approxi-mately SEK 0.9 million.
� The Group’s greatest cost item is personnel expenses, which totaled SEK 526.4 million. A change of 1% would have an impact of approximately SEK 4.1 million on prof-it after tax.
� Corporate acquisitions are largely financed by bank loans or convertibles. The interest rate is mostly variable. An in-terest-rate change of 1% on existing interest-bearing lia-bilities at December 31, 2018 would impact profit after tax by SEK 4.1 million.
� Vitec’s commitment to foreign subsidiaries is increasing, which entail heightened currency and translation risks. With the Group’s current composition, currency exposure exists in Norwegian crowns (NKK) and Danish crowns (DKK) and Euros (EUR). A 5% change in the rates of these currencies in 2018 would have impacted the Group’s prof-it after tax by approximately SEK 3.3 million.
Impact on earnings, SEK
thousand
Impact on earnings SEK/
share
Impact factorsChange, % 2018 2017 2018 2017
Subcontractors and subscriptions
+/- 1
861 790 0.03 0.03
Personnel expenses +/- 1 4,068 3,478 0.14 0.12
Borrowing interest rate on (change in percentage on borrowing interest rate)
+/- 1
4,077 2,863 0.14 0.10
Change in NOK, DKK and EUR exchange rate
+/- 5
3,330 1,961 0.11 0.07

36 Vitec Annual Report 2018
Corporate governance
Corporate governance defines and allocates responsibilities and roles between shareholders, the Board of Directors, Group management and other stakehold-ers.
Message from the Chairman of the BoardVitec’s Board of Directors comprises five directors – two women and three men. The Board members’ varying com-petencies and professional experiences are a guarantee of dynamic and proactive Board work. In 2018 the Board of Di-rectors held 12 meetings, of which some were by telephone and one was a strategy meeting. With a few exceptions, all of the Board members were present at all of the meetings. The calendar of meetings is mainly linked to quarterly reports, year-end reports and the Annual General Meeting. In addi-tion, decisions about acquisitions or financing are usually oc-casions for additional Board meetings. The agendas comprise a fixed reporting session, in addition to specific issues that require discussion and resolution.
Vitec has a well-devised growth strategy based on acquisi-tions. The Board of Directors continuously reviews the crite-ria that govern the choice of acquisition candidates, and stays abreast of the current list of prospects at any time. Although the company’s own cash flow is robust, external financing is
also required for acquisitions. In 2018, four acquisitions were completed and a large part of the Board’s work concerned the implementation and follow-up of acquisition processes, as well as issues about relevant financing.
At the annual strategy meeting, acquired companies are assessed, and the acquisition strategy is reviewed and supple-mented as needed. The constant acquisition of new opera-tions and strong growth also entails that the Group reorga-nize and adapt. Organization and recruitment are frequently recurring issues on the Board of Directors’ agenda. Remu-neration and auditing issues are managed in their entirety by the Board of Directors. The Chairman performs an annual assessment of the Board’s work and reports the results to the Nomination Committee.
Crister Stjernfelt, Chairman of the Board
Crister Stjernfelt
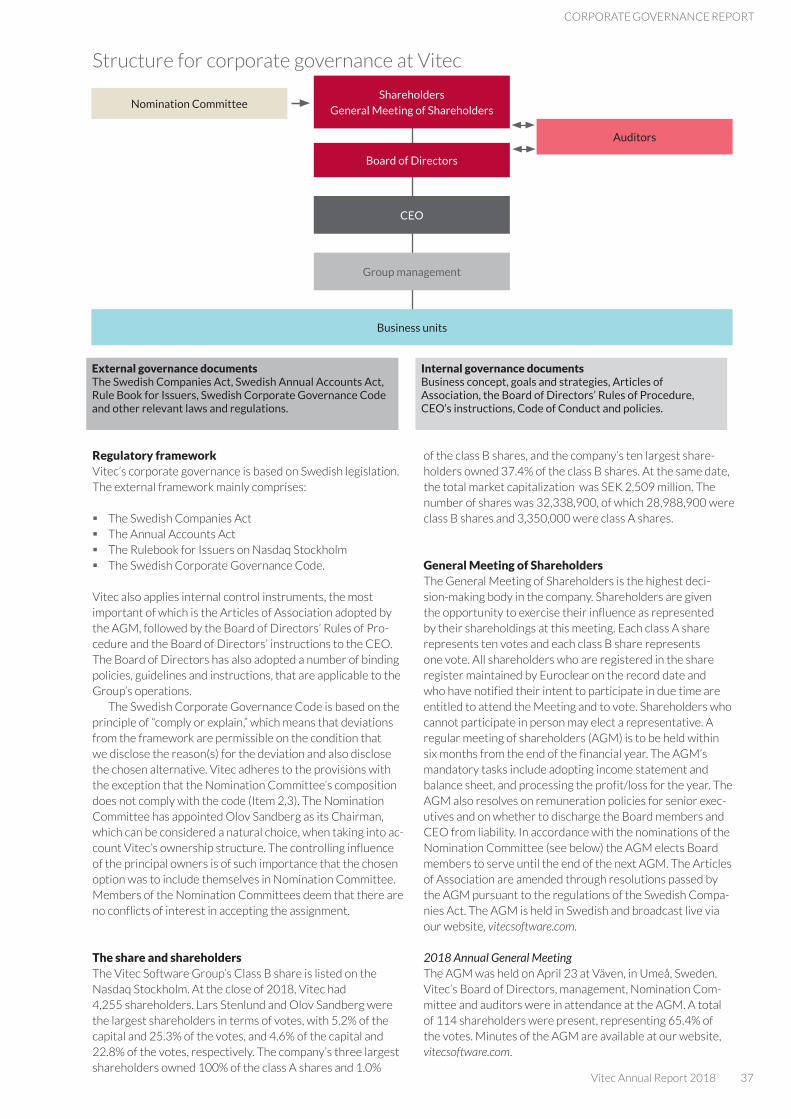
Vitec Annual Report 2018 37
CORPORATE GOVERNANCE REPORT
Structure for corporate governance at Vitec
Regulatory frameworkVitec’s corporate governance is based on Swedish legislation. The external framework mainly comprises:
� The Swedish Companies Act � The Annual Accounts Act � The Rulebook for Issuers on Nasdaq Stockholm � The Swedish Corporate Governance Code.
Vitec also applies internal control instruments, the most important of which is the Articles of Association adopted by the AGM, followed by the Board of Directors’ Rules of Pro-cedure and the Board of Directors’ instructions to the CEO. The Board of Directors has also adopted a number of binding policies, guidelines and instructions, that are applicable to the Group’s operations.
The Swedish Corporate Governance Code is based on the principle of “comply or explain,” which means that deviations from the framework are permissible on the condition that we disclose the reason(s) for the deviation and also disclose the chosen alternative. Vitec adheres to the provisions with the exception that the Nomination Committee’s composition does not comply with the code (Item 2,3). The Nomination Committee has appointed Olov Sandberg as its Chairman, which can be considered a natural choice, when taking into ac-count Vitec’s ownership structure. The controlling influence of the principal owners is of such importance that the chosen option was to include themselves in Nomination Committee. Members of the Nomination Committees deem that there are no conflicts of interest in accepting the assignment.
The share and shareholdersThe Vitec Software Group’s Class B share is listed on the Nasdaq Stockholm. At the close of 2018, Vitec had 4,255 shareholders. Lars Stenlund and Olov Sandberg were the largest shareholders in terms of votes, with 5.2% of the capital and 25.3% of the votes, and 4.6% of the capital and 22.8% of the votes, respectively. The company’s three largest shareholders owned 100% of the class A shares and 1.0%
of the class B shares, and the company’s ten largest share-holders owned 37.4% of the class B shares. At the same date, the total market capitalization was SEK 2,509 million. The number of shares was 32,338,900, of which 28,988,900 were class B shares and 3,350,000 were class A shares.
General Meeting of ShareholdersThe General Meeting of Shareholders is the highest deci-sion-making body in the company. Shareholders are given the opportunity to exercise their influence as represented by their shareholdings at this meeting. Each class A share represents ten votes and each class B share represents one vote. All shareholders who are registered in the share register maintained by Euroclear on the record date and who have notified their intent to participate in due time are entitled to attend the Meeting and to vote. Shareholders who cannot participate in person may elect a representative. A regular meeting of shareholders (AGM) is to be held within six months from the end of the financial year. The AGM’s mandatory tasks include adopting income statement and balance sheet, and processing the profit/loss for the year. The AGM also resolves on remuneration policies for senior exec-utives and on whether to discharge the Board members and CEO from liability. In accordance with the nominations of the Nomination Committee (see below) the AGM elects Board members to serve until the end of the next AGM. The Articles of Association are amended through resolutions passed by the AGM pursuant to the regulations of the Swedish Compa-nies Act. The AGM is held in Swedish and broadcast live via our website, vitecsoftware.com.
2018 Annual General MeetingThe AGM was held on April 23 at Väven, in Umeå, Sweden. Vitec’s Board of Directors, management, Nomination Com-mittee and auditors were in attendance at the AGM. A total of 114 shareholders were present, representing 65.4% of the votes. Minutes of the AGM are available at our website, vitecsoftware.com.
Shareholders
General Meeting of ShareholdersNomination Committee
Auditors
Board of Directors
CEO
Group management
Business units
External governance documentsThe Swedish Companies Act, Swedish Annual Accounts Act, Rule Book for Issuers, Swedish Corporate Governance Code and other relevant laws and regulations.
Internal governance documentsBusiness concept, goals and strategies, Articles of Association, the Board of Directors’ Rules of Procedure, CEO’s instructions, Code of Conduct and policies.

38 Vitec Annual Report 2018
2019 Annual General MeetingThe 2019 Annual General Meeting will be held on April 10 at 17:30 hrs., at Umeå Folkets Hus in Umeå, Sweden. Informa-tion on how to register for participation is available at our website, vitecsoftware.com.
Nomination CommitteeThe Nomination Committee’s primary task is to present nominees to the AGM for election as the Board’s members and Chairman, and nominees for auditors, in consultation with the Audit Committee.The Nomination Committee’s work is to be characterized by transparency and discussion to achieve a well-balanced Board of Directors. The Nomination Committee adopted regulation 4.1 of the Swedish Corporate Governance Code as its diversity policy when preparing the list of candidates for the Board, with the aim of creating a well-functioning Board composition with respect to diversity and broad representation, in terms of gender, nationality, age ad industry experience. The purpose of the Nomination Committee’s is to nominate a Board comprising members who complement each other with their experiences and ex-pertise, so as to enable the Board to contribute to the positive development of the company. The Nomination Committee consistently focuses on diversity, in order to ensure that the Board of Directors has varying perspectives on Board work and the considerations given. The Nomination Committee also considers the need for renewal and carefully investigates whether the nominated Board members are able to devote sufficient time and due attention to Board work. All share-holders have the opportunity to submit motions concerning prospective Board members to the Nomination Committee.
The Nomination Committee has participated in the evalu-ation of the Board. The Nomination Committee is also tasked with preparing nominees to Chair the AGM, proposals on the remuneration of the Board and any fees to committees and subcommittees, and auditor’s fees. The 2018 AGM resolved that each of the three largest shareholders be allowed to appoint their own member in the Nomination Committee. It was also resolved that the Nomination Committee should comprise the Chairman of the Board and three committee members. The members of the Nomination Committee serv-ing until the AGM on April 10, 2019 comprise:
� Crister Stjernfelt, Chairman of the Board, Vitec. Holder of 8,000 class B shares.
� Jerker Vallbo, CIO/CTO Vitec. Holder of 360,000 class A shares and 115,515 class B shares (incl. family members).
� Lars Stenlund, CEO Vitec. Holder of 1,570,000 class A shares and 152,280 class B shares (incl. family members).
� Olov Sandberg. Holder of 1,420,000 class A shares and 99,565 class B shares (incl. family members).
The Nomination Committee has held one meeting for the 2019 AGM. No fees were paid for the Nomination Commit-tee’s work.
Articles of AssociationThe Articles of Association stipulate that Vitec is a public limited liability company, whose activities comprise the purchase, management and sale of real estate and chattels, and other activities consistent therewith. The share capital shall be not less than SEK 1,600,000 and not more than SEK 6,400,000. The company’s shares are to be issuable in two series, referred to as Class A and Class B. When voting at the AGM, each Class A share carries ten votes and a Class B share carries one vote. If both classes of share are issued, the
total number of shares of each share class may not exceed 99 hundredths of the total number of shares in the company. The Articles of Association can be found in their entirety at our website, vitecsoftware.com.
Board of DirectorsThe Board’s duty is to manage the company’s affairs on behalf of the shareholders. Board work is governed by applicable laws and recommendations, and by the Board of Directors’ Rules of Procedure, which comprises rules for the division of duties between the Board and CEO, financial reporting, in-vestments and financing. The Rules of Procedure are adopted annually at the statutory Board meeting in direct connection to the AGM.
The Board’s responsibilityThe Board of Directors has overarching responsibility for the Group’s organization and management, and ensuring that the guidelines for the management of the company’s funds are appropriately formulated. The Board of Directors is responsible for ensuring that Vitec is managed pursuant to applicable laws and regulations, and adheres to the Rule Book for Issuers and the Swedish Corporate Governance Code, and the Group’s adopted internal regulations. The Board is also responsible for developing and ensuring compliance with the Group’s strategies through plans and goals, decisions re-garding acquisitions and divestments of business operations, major investments, appointments and remuneration of Group management, and the continuous monitoring of operations throughout the year. The Board of Directors adopts the annu-al accounts, current business plan, business-related policies and the CEO’s Rules of Procedure. The Board of Directors is also to adopt the requisite guidelines for company’s behavior in society, with the aim of ensuring long-term value creation and that guidelines are adhered to with respect to company’s behavior.
Board compositionAccording to the articles of association, Vitec’s Board is to comprise three to ten members, and a maximum of three dep-uty members. The Board of Directors consists of five regular members and no deputies, and no member is employed by the company. Board members are elected by shareholders at the AGM, with a one-year term of office. The CEO is not a member of the Board, but presents reports at all Board meet-ings, except for when the CEO’s work is under evaluation. The CEO reports to the Board about the Group’s operational activities and ensures that the Board receives objective and relevant decision data. Board meetings comply with the requirements of Nasdaq Stockholm and the Swedish Corpo-rate Governance Code with respect to independent Board members. Further information about each Board member is available at our website, vitecsoftware.com, under Investors/Corporate governance.
Chairman of the BoardThe Chairman of the Board, Crister Stjernfelt, manages Board work to ensure compliance with laws and regulations. The Chairman monitors operations through a dialog with the CEO, and is responsible for ensuring that other Board members receive the requisite information for high quality discussions and well-informed decisions. The Chairman also participates in the assessment and career development issues of the Group’s senior executives.
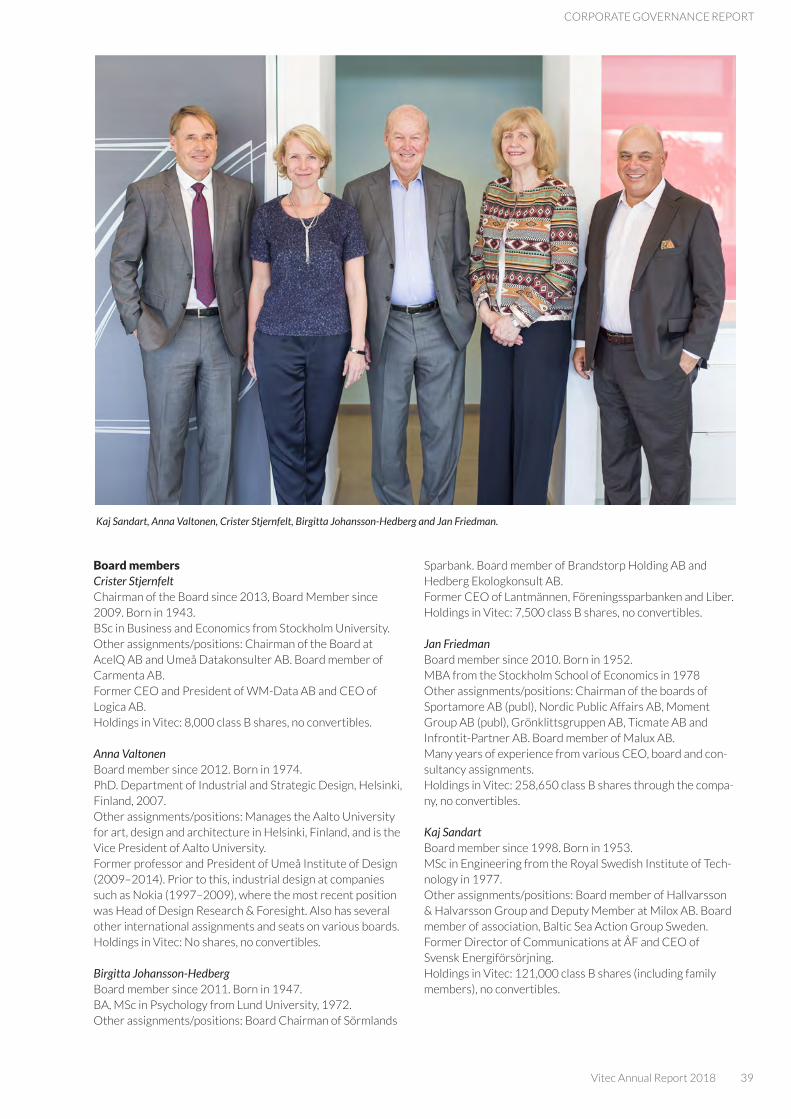
Vitec Annual Report 2018 39
CORPORATE GOVERNANCE REPORT
Board membersCrister StjernfeltChairman of the Board since 2013, Board Member since 2009. Born in 1943. BSc in Business and Economics from Stockholm University.Other assignments/positions: Chairman of the Board at AcelQ AB and Umeå Datakonsulter AB. Board member of Carmenta AB. Former CEO and President of WM-Data AB and CEO of Logica AB.Holdings in Vitec: 8,000 class B shares, no convertibles.
Anna Valtonen Board member since 2012. Born in 1974. PhD. Department of Industrial and Strategic Design, Helsinki, Finland, 2007.Other assignments/positions: Manages the Aalto University for art, design and architecture in Helsinki, Finland, and is the Vice President of Aalto University. Former professor and President of Umeå Institute of Design (2009–2014). Prior to this, industrial design at companies such as Nokia (1997–2009), where the most recent position was Head of Design Research & Foresight. Also has several other international assignments and seats on various boards. Holdings in Vitec: No shares, no convertibles.
Birgitta Johansson-HedbergBoard member since 2011. Born in 1947.BA, MSc in Psychology from Lund University, 1972.Other assignments/positions: Board Chairman of Sörmlands
Sparbank. Board member of Brandstorp Holding AB and Hedberg Ekologkonsult AB. Former CEO of Lantmännen, Föreningssparbanken and Liber.Holdings in Vitec: 7,500 class B shares, no convertibles.
Jan Friedman Board member since 2010. Born in 1952. MBA from the Stockholm School of Economics in 1978Other assignments/positions: Chairman of the boards of Sportamore AB (publ), Nordic Public Affairs AB, Moment Group AB (publ), Grönklittsgruppen AB, Ticmate AB and Infrontit-Partner AB. Board member of Malux AB. Many years of experience from various CEO, board and con-sultancy assignments.Holdings in Vitec: 258,650 class B shares through the compa-ny, no convertibles.
Kaj Sandart Board member since 1998. Born in 1953.MSc in Engineering from the Royal Swedish Institute of Tech-nology in 1977.Other assignments/positions: Board member of Hallvarsson & Halvarsson Group and Deputy Member at Milox AB. Board member of association, Baltic Sea Action Group Sweden. Former Director of Communications at ÅF and CEO of Svensk Energiförsörjning.Holdings in Vitec: 121,000 class B shares (including family members), no convertibles.
Kaj Sandart, Anna Valtonen, Crister Stjernfelt, Birgitta Johansson-Hedberg and Jan Friedman.

40 Vitec Annual Report 2018
The Board’s workIn the course of a financial year, Vitec holds a minimum of five regular Board meetings and a statutory Board meeting directly connected to the AGM. Extraordinary board meet-ings are held as needed. In 2018, a total of 12 Board meetings were held, including statutory meetings. All Board members elected by the AGM were present at all of the Board meet-ings, with the exception of Board members Jan Friedman and Anna Valtonen, who announced their absence for one meeting each. At minuted meetings, the Group’s earnings and financial position were processed, and interim reports and annual accounts were approved for publication. Issues pertaining to the future were processed, such as market assessments, potential acquisitions, the focus of business ac-tivities and organizational issues. All of the meetings adhered to an approved agenda that was, together with documenta-tion for each item on the agenda, communicated to all Board members about one week prior to the meeting.
Minutes of the meetings were sent to all Board members, in accordance with the Swedish Corporate Governance Code. At year-end, the Board’s work was evaluated.
EvaluationThe Board’s work is evaluated once a year, by having Board members answer a number of predefined questions about both formal and collaborative relationships. The Chairman compiles the answers, including comments, and presents them to the Nomination Committee. The evaluation for the 2018 financial year indicates well-functioning collaborations and solid efficiency within Board work. All of the Board mem-bers were positive about continued commitment.
Key decisionsIn September, Vitec secured a SEK 500 million acquisi-tion-loan facility with Nordea. It replaces two previous facilities of SEK 250 million and SEK 200 million at Nordea. The new facility increased the scope by SEK 50 million. The facility is used as financing for acquisitions and allows for Vitec to continue growing through acquisitions of vertically niched software companies.
In November, Vitec completed a directed new share issue of 2,500,000 Class B shares, at a subscription price of SEK 79 per share. The issue increased the company’s total the
number of shares to 32,338,900, allocated as 3,350,000 Class A shares and 28,988,900 Class B shares. Share capital increased by SEK 250,000 to total SEK 3,233,890.
In 2018, the following four corporate acquisitions were completed:
� PP7 Affärssystem AB, whose main product is a cloud-based software for project and business support that op-timizes project flows and procedures for the construction and installation market in Sweden. The company reported sales of nearly SEK 8 million, with an adjusted EBITDA of SEK 1.4 million for the 2017 financial year.
� Agrando AS develops niche software for churching opera-tions in the Nordic region, with Norway and Sweden as its primary markets. The company and its subsidiaries report-ed sales of SEK 42 million, with an EBITDA of SEK 5.5 mil-lion for the 2017 financial year.
� Cito IT A/S, whose main product is niched software for the pharmacy market in Denmark. The product is used for managing the entire chain of the Danish pharmacy work-flow, such as product inventory, cash operations and pre-scriptions processing. The company reported sales of DKK 25.5 million, with an adjusted EBITDA of DKK 7.6 million for the 2016/17 financial year.
� Smart Visitor System develops specialized software for municipal leisure and cultural departments in Norway and Sweden. Their product is a complete enterprise system for handling reservations, visitors and grants. The company reported sales of SEK 23.7 million, with an adjusted EBIT-DA of SEK 3.1 million for the 2017 financial year.
The Board’s Rules of ProcedureThe Board’s Rules of Procedure were adopted on April 23, 2018, and are to be revised annually at the statutory Board meeting, or revised as needed. The Rules of Procedure speci-fy, among other items, the Board of Directors’ responsibilities and assignments, the Chairman’s assignments and auditing issues, and also indicates specific reports and financial infor-mation that the Board of Directors’ should receive in advance of each regular Board meeting. The Rules of Procedure also comprise instructions to the CEO. The Rules of Procedure also define the Board’s work as part of the Remuneration Committee.
Annual cycle of Board work
%
Styrelsearbetets årscykel
Q1Board meetingEarningsYear-end-reportAudit CommitteeEvaluation of the BoardDocuments for the AGM
Q2Q3
Q4
Board meetingInterim report Q2
AGM and constituent meeting Company signatories appointedInterim report Q1Audit CommitteeBudget directivesInstructions for the CEO
Strategy meetingStrategic planOperating planFinancial goalsShareholders directivesProduct investments
Board meetingInterim report Q3Audit committee
Board meetingBudget
Jan
Feb
Okt
Sep
Aug
Jul Jun
May
Apr
Mar
Nov
Dec
Vitec Annual Report 2018 41
CORPORATE GOVERNANCE REPORT
Audit Committee and Remuneration CommitteeThe Board of Directors, as a whole, acts as both the Audit Committee and Remuneration Committee. The description of the Audit Committee’s assignments is attached as an appendix to the current Rules of Procedure. The Remuner-ation Committees work is regulated in the relevant rules of procedure. The Rules of Procedure and attachments were adopted at the statutory Board meeting held on April 23, 2018. In 2018, the Audit Committee held three meetings and the Remuneration Committee held meetings in conjunction with regular Board meetings.
CEO and Group managementThe CEO is appointed by the Board of Directors. Lars Stenlund is the CEO, while Lars Eriksson (M&A) and Patrik Fransson (IR Officer) are both appointed as Vice CEOs. The CEO is responsible for the daily management of the company and the Group’s activities in accordance with the Board’s instructions and regulations. This entails responsibility for financial reporting, preparing information and decision data, and ensuring that agreements and other measures do conflict with applicable laws and regulations. The Chairman of the Board holds annual assessment dialogs with the CEO, pursuant to the CEO’s instructions and the applicable specifi-cation of requirements.
Group management cooperates with the CEO and they are jointly responsible for day-to-day operations. Group management comprises the CEO, CFO, M&A and IR Officer. Group management normally convenes monthly to review the preceding month’s results, update plans and guidelines, make appropriate decisions and discuss strategic issues. A more comprehensive strategy meeting is held jointly with the Board of Directors once a year and as needed.
Group management makes decisions jointly on issues of a long-term and strategic nature, such as company develop-ment, marketing, financing, investments and environmental issues, pursuant to guidelines resolved by the Board of Directors’ and instructions on the division of responsibilities between the Board and CEO. Group management also pres-ents issues that are to be resolved by the Board.
AuditorsThe AGM elects one or two auditors annually, or one or two registered auditing firms, with a maximum of two deputy auditors. The auditors review the company’s annual report, accounts and the administration reports of the Board of Directors’ and CEO. At the 2018 AGM, PricewaterhouseC-oopers AB was elected, with Niklas Renström as auditor in charge. The Group’s auditors participate in all audit com-mittee meetings and in particular, provides a debriefing of its findings concerning internal controls, review of the third quarter interim report and the annual accounts. The audit plan is presented at the first Board meeting of the year.
Internal controlsThe Board is responsible for the internal controls pursuant to the Swedish Companies Act and the Swedish Corporate Governance Code. Reports on internal controls and risk management concerning the financial reporting for the 2018 financial year have been prepared and submitted by the Board pursuant to the Swedish Annual Accounts Act Chap. 6 Sect. 6, and Item 7.4 of the Swedish Corporate Governance Code.
The Board is responsible for corporate governance work
within Vitec and thus, for working with internal controls. The overarching aim is to protect the Group’s assets and thereby, the investments of shareholders. The Board is also responsible for ensuring that financial statements are prepared pursuant to applicable laws. The Group’s financial statements are subject to quality assurance, by means of the Board processing all critical accounting matters and financial statements submitted by Vitec. This requires that the Board process matters pertaining to internal controls, regulatory compliance, material uncertainties in recognized values, any uncorrected misstatements, events after the balance-sheet date, changes in estimations and assessments, any realized irregularities and other circumstances that impact the quality of financial reporting.
Control environmentProactive and committed Board work is the basis of effec-tive internal controls. The Board has established well-de-fined processes and rules of procedure for its work. A vital component of the Board’s work is to prepare and approve a number of fundamental policies, guidelines and frameworks pertaining to financial reporting. The company’s governing documents comprise the “Board of Directors’ Rules of Proce-dure” and the “CEO’s instructions.” The aim of these rules of procedure are to create the foundation for efficient internal controls. Follow-ups and revision are continuously under-taken and are communicated to all employees involved with financial reporting. The Board continuously evaluates the company’s performance and results by means of an appropri-ate reporting package that comprises the income statement and prepared key metrics, as well as other material opera-tional and financial information. The Board of Directors func-tions in its entirety as the Audit Committee. Thus, the Board of Directors in its entirety has monitored risk-management and internal-control systems in 2018. These systems are intended to ensure that operations are conducted pursuant to laws and regulations, as well as the efficiency of operations and reliability of financial reporting. The Board has reviewed and evaluated the procedures for financial accounting and reporting and followed this up with evaluations of the work performed by the external auditors, their qualifications and independence. Other adopted policies that provide the basis for Vitec’s internal controls include the Finance Policy, Infor-mation Policy and Information Security Policy.
All business units work within, or are preparing to work within, the same structure, accounting system, accounting plan and policies, which facilitates the creation of appropri-ate procedures and control systems. Every business unit has rules of procedure adopted by Group management and some business unit also have an working board appointed by Group management.
Risk assessmentAt Vitec, we apply a method of risk management and risk assessment to ensure that the risks to which the Group is exposed and which may impact internal controls and financial reporting, are managed by means of the adopted processes. Material risks that are considered include operational risks and risks pertaining to acquisitions and product develop-ment, sustainability risksand risks that impact financial reporting. A systematic and documented updating of all identified risks is undertaken annually.
For risks that impact financial statements, we work con-
42 Vitec Annual Report 2018
tinuously and proactively on their analyses, assessment and management, to ensure that the risks to which the company is exposed are managed appropriately within the adopted framework. Risk assessment takes into account, among other matters, the administrative procedures pertaining to invoicing and waste management. Material risks with a potential impact on financial reporting include items based on estimations and assessments, such as ongoing development projects, goodwill, etc.
Risk managementRisks are monitored in different ways and at different levels. At every meeting, Vitec’s Board of Directors receive a presentation of the Group’s earnings and financial position, liquidity, key metrics, etc. Group management jointly reviews the results of all reporting units monthly. All of the Group’s in-vestments are reviewed by Group management, with product investments constituting the single largest category. Product investments are subject to their own separate processes within budget work and monitoring. Monthly debriefing is un-dertaken and documented. A board is appointed for selected business units as needed. A business unit board comprises a minimum of one member from Group management and convenes two to four times annually, and minutes are taken. Financial risks such as liquidity, currency, credit and refinanc-ing risks are managed by Group management, subject to the governance of the Finance Policy adopted by the Board of Directors.
Control activitiesControl activities are designed to manage activities that the Board and Group management deem to be significant for operations, internal controls and financial reporting. Con-trol structures are designed to manage risks that the Board deems to be material to the internal controls of financial reporting. These control structures consist of an organization with a well-defined division of responsibilities, well-defined procedures and distinct roles. Examples of control activ-ities include the reporting of decision-making processes for substantial decisions (such as on new major customers, investments, agreements, etc.), as well as the review of all submitted financial reports. The regular analyses of financial reporting, combined with a Group-level analysis, are highly important in ensuring that the financial reports do not include any material errors.
In accordance with the Swedish Companies Act, the Board of Directors is to appoint an Audit Committee. The Board has found it appropriate for the Audit Committee to comprise the Board in its entirety. The relatively small size of the Board is deemed to facilitate such work. Auditing competencies exist among several Board members.
Information and communicationVitec’s governing documents, such as the Code of Conduct, policies, guidelines and manuals pertaining to internal and external communication, are subject to continuous updates and are communicated internally through relevant channels, such as internal meetings, internal newsletter e-mails and the Group’s intranet. Communication with external parties is gov-erned by a clearly established communication policy compris-ing all the guidelines on the dissemination of information. The aim of the policy is to ensure that all disclosure requirements pursuant to the applicable regulations on issuers of shares are correctly and fully complied with. Information about
the Code of Conduct, policies, guidelines and manuals are available on our intranet. There is also information available on financial reporting, in the form of instructions, manuals, schedules and checklists. The Group’s accounting handbook is also key to our financial reporting and is available on our intranet, and is continuously updated with new applicable regulatory frameworks, such as from IFRS and the Nasdaq Stockholm.
Follow-up and monitoringThe business units are followed up monthly by the VP Op-erations, together with the management of the respective business unit. Group management has appointed an working board for some operational units. For issues of strategic importance, projects are created, where Group management participates in the management group. Group management analyses the Group’s outcome compared with the preceding year, budget and forecasts. Group managements analyses and conclusions are communicated to the Board at every regular meeting.
We continuously assess internal controls on financial reporting and ensure the function of Board reports. This is mainly undertaken by asking questions about and participat-ing in the CFO’s work. The company’s auditors participate on three occasions annually and provide information about their observations of the company’s internal procedures and control systems, which allows for Board members to ask questions. On an annual basis, the Board takes decisions on significant risk areas and evaluates the internal controls.
Internal auditHaving taken into consideration the size and complexity of operations, combined with existing reports to the Board and Audit Committee, the Board of Directors has concluded that it is not financially justifiable to set up a separate internal audit function. The abovementioned internal controls are deemed to be sufficient for assuring the quality of financial reporting.
Guidelines for the remuneration of senior executivesThe 2018 AGM passed a resolution adopting the following guidelines for remuneration to the Group’s CEO senior and other senior executives at Vitec. The AGMs resolution concur with previously applied remuneration policies. The guidelines apply to agreements signed after the 2018 AGM, or to any subsequent cases of amendments to remuneration. The Board of Directors has not appointed a Remuneration Committee, but instead manages, in its entirety, issues pertaining to remuneration and other employment terms and conditions. The AGM resolved that remuneration of senior executives is to consist of a fixed salary and pension privi-leges. Pension benefits must be defined-contribution based. The total remuneration should be competitive in the market and be proportionate to each executive’s responsibility and authority. When determining salaries, consideration must be given to the individual’s field of responsibilities, expertise and experience, which are generally subject to annual reviews. The Board of Directors may deviate from these guidelines if there are specific reasons to do so in an individual case.
Prior to the 2019 AGM, the Board proposed that terms and conditions remain unchanged, pertaining to guidelines on remuneration to the Group’s CEO senior and other senior executives.

Vitec Annual Report 2018 43
CORPORATE GOVERNANCE REPORT
Members of Group ManagementLars Stenlund CEO and founder of the company, together with Olov Sand-berg. Lars was a Board member of Vitec from 1985 to 2009. Employed since 1985. Born in 1958.PhD in applied physics (1987) from Umeå University. Board member of Umeå University, Umeå Universitet Hold-ing AB, Railcare AB (publ) and C4 Contexture AB.Previous experience: Active at Umeå University.Holdings in Vitec: 1,570,000 class A shares, 152,280 class B shares (including family members). No convertibles. No warrants.
Lars Eriksson Vice President, M&A and Business Development. Employed since 2011. Born in 1955.MSc. Eng., Industrial Economics from Linköping University in 1979. Board member of Affärskonsulting Lars Eriksson AB.Previous experience: President and Board member of Före-tagsbyrån i Stockholm AB.
Holdings in Vitec: 25,640 class B shares 2,403 KV1801. No warrants.
Maria KrögerCFO. Employed since 2011. Born in 1968.MBA from Umeå University in 1990.Previous experience: Authorized Public Accountant, Ernst & youngHoldings in Vitec: 50,420 class B shares (including family members). 2,403 KV1801.
Patrik Fransson Vice President, IR Officer. Employed since 2011. Born in 1966.Computer science, Umeå University, 1990, MBA Executive Program, Stockholm School of Economics. Board member of Avtre AB.Previous experience: WM-data, Director Logica, CIO of H&M and CEO of CodeFactory AB. Holdings in Vitec: 107,572 class B shares. 2,403 KV1801. No warrants.
Lars Stenlund, Patrik Fransson, Maria Kröger and Lars Eriksson

44 Vitec Annual Report 2018
Share and ownership structureAt the close of the financial year, the total number of shares issued was 32,338,900, of which 3,350,000 were class A shares, (33,500,000 votes) and the remaining 28,988,900 were class B shares (28,988,900 votes). Current share capital is approximately SEK 3.2 million, with a quotient value of SEK 0.10 per share. The ownership structure and Board of Directors’ shares pertain to holdings at December 31, 2018, to the best of Vitec’s knowledge. The number of shareholders was 4,255.
Apart from a pre-emption clause for class A shares, there were no provisions limiting the right to share transfers. There are no limitations on the number of votes each shareholder is entitled to cast at the AGM or other general meetings. Board members and any deputy Board members are appointed for at the AGM the period until the next AGM. There are no rules in the Articles of Association regarding the appointment and dismissal of Board members. Vitec Software Group AB (publ) has not signed any agreements that could be impacted by any takeover bids. Vitec Software Group AB (publ) does not hold any treasury shares.
Employees of Vitec Software Group AB (publ) do not hold
shares that restrict them from the direct exercise of their voting rights. An ongoing convertibles program for employ-ees allows for conversion to a maximum of 200,288 class B shares. There is also a convertible debenture originating from the acquisition of Vitec MV A/S, valued at SEK 20.0 million, which, upon full conversion will increase the number of shares by 234,317 class B shares.
Authorization by the 2018 AGM which entitled the Board of Directors to pass one or more resolutions up to and in-cluding the date of the next AGM regarding the issue of up to 2,500,000 new class B shares deviating from the preferential rights of shareholders were utilized in their entirety through a directed new share issue in November 2018. Vitec is listed on the Nasdaq Stockholm Mid Cap list. At December 31, 2018, the share price was SEK 77.60 (87.00). At year-end, the total market capitalization of the issued shares was SEK 2,509 million (2,596).
The Vitec share was traded under the Mid Cap segment as of January 2, 2017. The Mid Cap segment includes compa-nies with a market capitalization of between EUR 150 million and EUR 1 billion.
Victor Naeslund, Ida Eriksson, Birgitta Knutsson-Hjelmze
and Mahmoud Oubaid, Stockholm
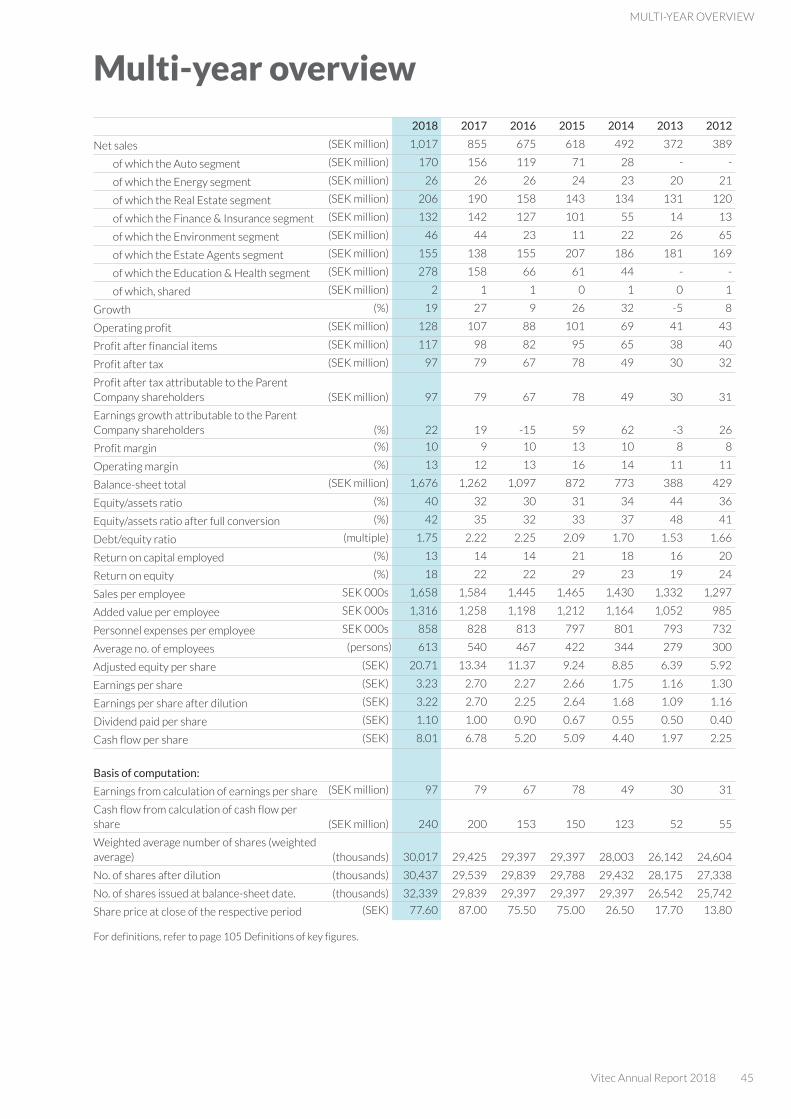
Vitec Annual Report 2018 45
MULTI-yEAR OVERVIEW
Multi-year overview
2018 2017 2016 2015 2014 2013 2012
Net sales (SEK million) 1,017 855 675 618 492 372 389
of which the Auto segment (SEK million) 170 156 119 71 28 - -
of which the Energy segment (SEK million) 26 26 26 24 23 20 21
of which the Real Estate segment (SEK million) 206 190 158 143 134 131 120
of which the Finance & Insurance segment (SEK million) 132 142 127 101 55 14 13
of which the Environment segment (SEK million) 46 44 23 11 22 26 65
of which the Estate Agents segment (SEK million) 155 138 155 207 186 181 169
of which the Education & Health segment (SEK million) 278 158 66 61 44 - -
of which, shared (SEK million) 2 1 1 0 1 0 1
Growth (%) 19 27 9 26 32 -5 8
Operating profit (SEK million) 128 107 88 101 69 41 43
Profit after financial items (SEK million) 117 98 82 95 65 38 40
Profit after tax (SEK million) 97 79 67 78 49 30 32
Profit after tax attributable to the Parent Company shareholders (SEK million) 97 79 67 78 49 30 31
Earnings growth attributable to the Parent Company shareholders (%) 22 19 -15 59 62 -3 26
Profit margin (%) 10 9 10 13 10 8 8
Operating margin (%) 13 12 13 16 14 11 11
Balance-sheet total (SEK million) 1,676 1,262 1,097 872 773 388 429
Equity/assets ratio (%) 40 32 30 31 34 44 36
Equity/assets ratio after full conversion (%) 42 35 32 33 37 48 41
Debt/equity ratio (multiple) 1.75 2.22 2.25 2.09 1.70 1.53 1.66
Return on capital employed (%) 13 14 14 21 18 16 20
Return on equity (%) 18 22 22 29 23 19 24
Sales per employee SEK 000s 1,658 1,584 1,445 1,465 1,430 1,332 1,297
Added value per employee SEK 000s 1,316 1,258 1,198 1,212 1,164 1,052 985
Personnel expenses per employee SEK 000s 858 828 813 797 801 793 732
Average no. of employees (persons) 613 540 467 422 344 279 300
Adjusted equity per share (SEK) 20.71 13.34 11.37 9.24 8.85 6.39 5.92
Earnings per share (SEK) 3.23 2.70 2.27 2.66 1.75 1.16 1.30
Earnings per share after dilution (SEK) 3.22 2.70 2.25 2.64 1.68 1.09 1.16
Dividend paid per share (SEK) 1.10 1.00 0.90 0.67 0.55 0.50 0.40
Cash flow per share (SEK) 8.01 6.78 5.20 5.09 4.40 1.97 2.25
Basis of computation:
Earnings from calculation of earnings per share (SEK million) 97 79 67 78 49 30 31
Cash flow from calculation of cash flow per share (SEK million) 240 200 153 150 123 52 55
Weighted average number of shares (weighted average) (thousands) 30,017 29,425 29,397 29,397 28,003 26,142 24,604
No. of shares after dilution (thousands) 30,437 29,539 29,839 29,788 29,432 28,175 27,338
No. of shares issued at balance-sheet date. (thousands) 32,339 29,839 29,397 29,397 29,397 26,542 25,742
Share price at close of the respective period (SEK) 77.60 87.00 75.50 75.00 26.50 17.70 13.80
For definitions, refer to page 105 Definitions of key figures.
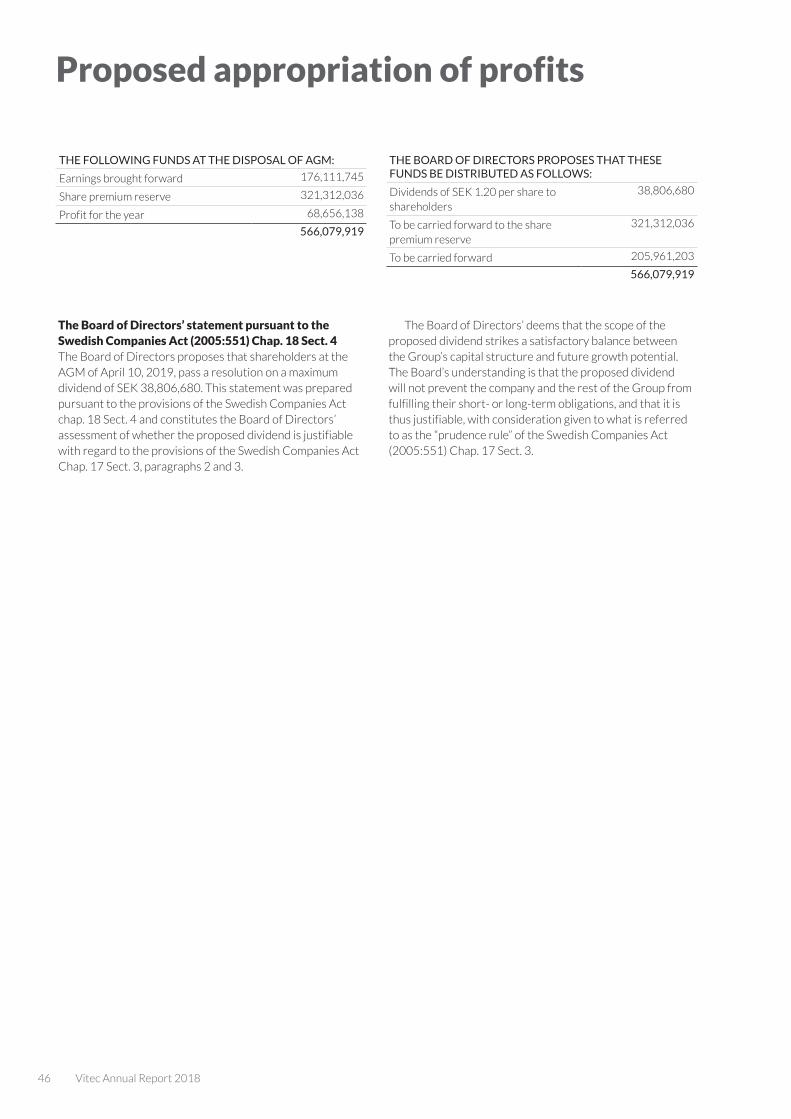
46 Vitec Annual Report 2018
Proposed appropriation of profits
THE FOLLOWING FUNDS AT THE DISPOSAL OF AGM:
Earnings brought forward 176,111,745
Share premium reserve 321,312,036
Profit for the year 68,656,138
566,079,919
THE BOARD OF DIRECTORS PROPOSES THAT THESE FUNDS BE DISTRIBUTED AS FOLLOWS:
Dividends of SEK 1.20 per share to shareholders
38,806,680
To be carried forward to the share premium reserve
321,312,036
To be carried forward 205,961,203
566,079,919
The Board of Directors’ statement pursuant to the Swedish Companies Act (2005:551) Chap. 18 Sect. 4The Board of Directors proposes that shareholders at the AGM of April 10, 2019, pass a resolution on a maximum dividend of SEK 38,806,680. This statement was prepared pursuant to the provisions of the Swedish Companies Act chap. 18 Sect. 4 and constitutes the Board of Directors’ assessment of whether the proposed dividend is justifiable with regard to the provisions of the Swedish Companies Act Chap. 17 Sect. 3, paragraphs 2 and 3.
The Board of Directors’ deems that the scope of the proposed dividend strikes a satisfactory balance between the Group’s capital structure and future growth potential. The Board’s understanding is that the proposed dividend will not prevent the company and the rest of the Group from fulfilling their short- or long-term obligations, and that it is thus justifiable, with consideration given to what is referred to as the “prudence rule” of the Swedish Companies Act (2005:551) Chap. 17 Sect. 3.
Vitec Annual Report 2018 47
Juuso Pitkänen and Anita van Gils, Tampere, Finland
Odense office
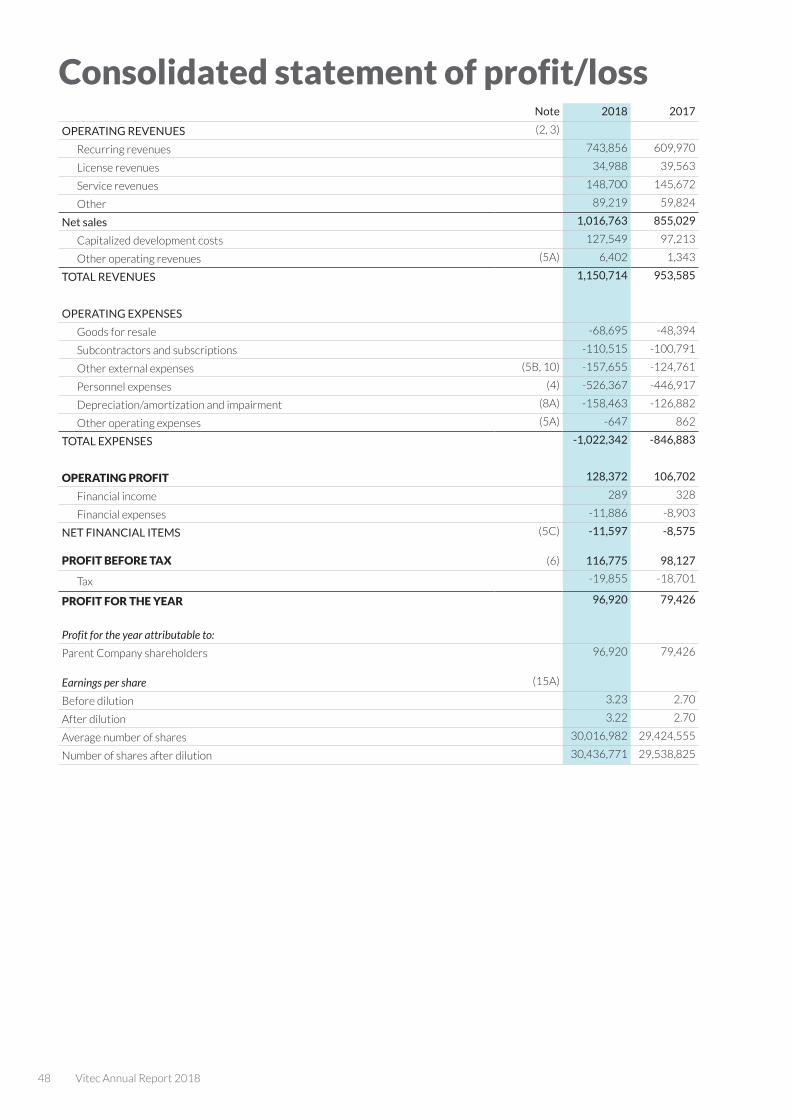
48 Vitec Annual Report 2018
Consolidated statement of profit/loss Note 2018 2017
OPERATING REVENUES (2, 3)
Recurring revenues 743,856 609,970
License revenues 34,988 39,563
Service revenues 148,700 145,672
Other 89,219 59,824
Net sales 1,016,763 855,029
Capitalized development costs 127,549 97,213
Other operating revenues (5A) 6,402 1,343
TOTAL REVENUES 1,150,714 953,585
OPERATING EXPENSES
Goods for resale -68,695 -48,394
Subcontractors and subscriptions -110,515 -100,791
Other external expenses (5B, 10) -157,655 -124,761
Personnel expenses (4) -526,367 -446,917
Depreciation/amortization and impairment (8A) -158,463 -126,882
Other operating expenses (5A) -647 862
TOTAL EXPENSES -1,022,342 -846,883
OPERATING PROFIT 128,372 106,702
Financial income 289 328
Financial expenses -11,886 -8,903
NET FINANCIAL ITEMS (5C) -11,597 -8,575
PROFIT BEFORE TAX (6) 116,775 98,127
Tax -19,855 -18,701
PROFIT FOR THE YEAR 96,920 79,426
Profit for the year attributable to:
Parent Company shareholders 96,920 79,426
Earnings per share (15A)
Before dilution 3.23 2.70
After dilution 3.22 2.70
Average number of shares 30,016,982 29,424,555
Number of shares after dilution 30,436,771 29,538,825
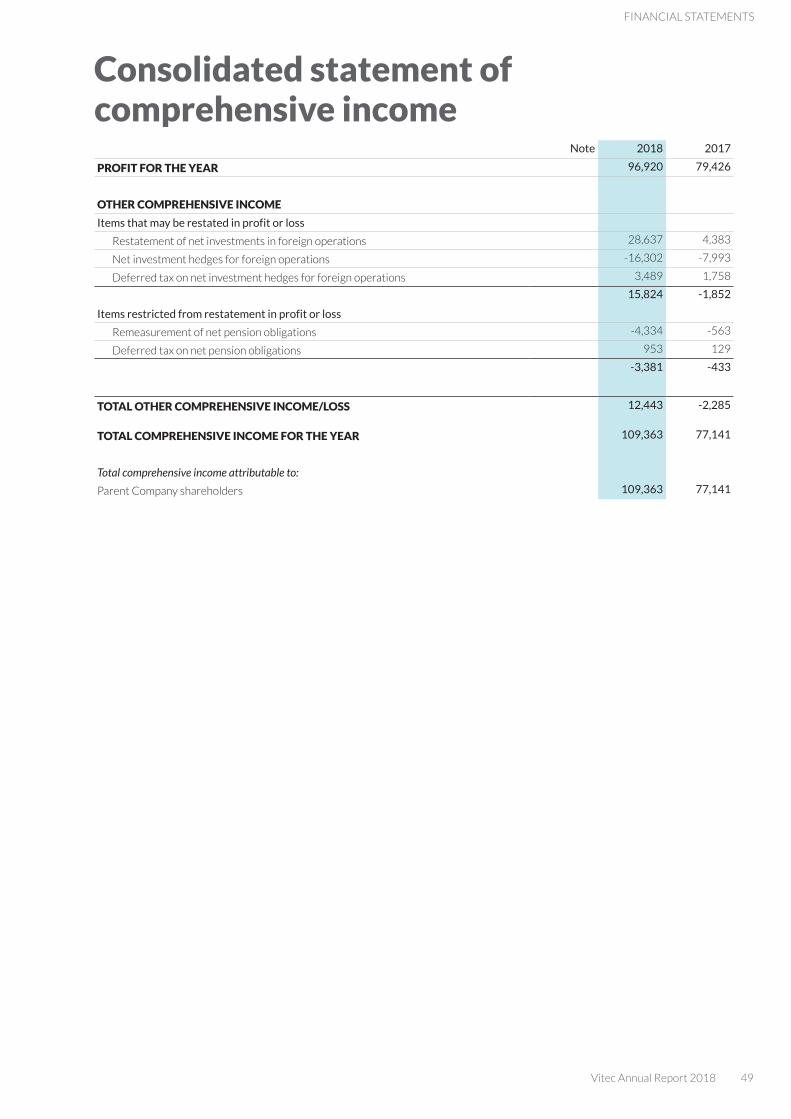
Vitec Annual Report 2018 49
FINANCIAL STATEMENTS
Consolidated statement of comprehensive income
Note 2018 2017
PROFIT FOR THE YEAR 96,920 79,426
OTHER COMPREHENSIVE INCOME
Items that may be restated in profit or loss
Restatement of net investments in foreign operations 28,637 4,383
Net investment hedges for foreign operations -16,302 -7,993
Deferred tax on net investment hedges for foreign operations 3,489 1,758
15,824 -1,852
Items restricted from restatement in profit or loss
Remeasurement of net pension obligations -4,334 -563
Deferred tax on net pension obligations 953 129
-3,381 -433
TOTAL OTHER COMPREHENSIVE INCOME/LOSS 12,443 -2,285
TOTAL COMPREHENSIVE INCOME FOR THE YEAR 109,363 77,141
Total comprehensive income attributable to:
Parent Company shareholders 109,363 77,141
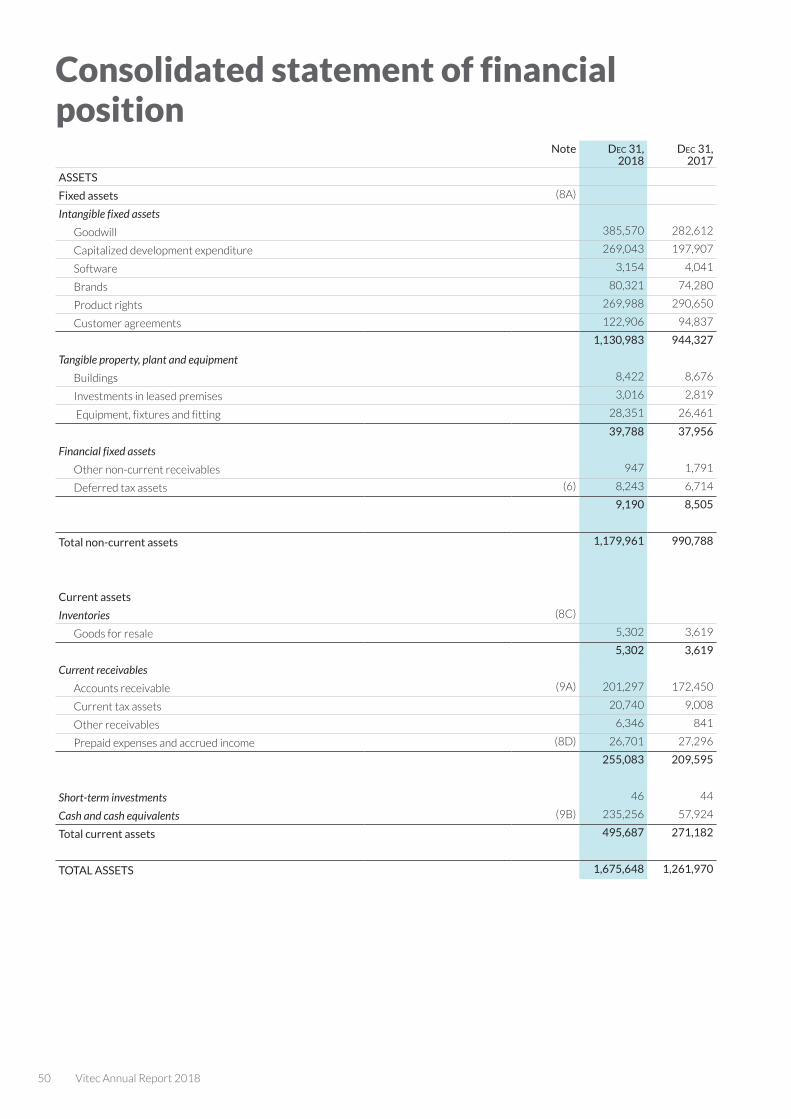
50 Vitec Annual Report 2018
Consolidated statement of financial position
Note Dec 31, 2018
Dec 31, 2017
ASSETS
Fixed assets (8A)
Intangible fixed assets
Goodwill 385,570 282,612
Capitalized development expenditure 269,043 197,907
Software 3,154 4,041
Brands 80,321 74,280
Product rights 269,988 290,650
Customer agreements 122,906 94,837
1,130,983 944,327
Tangible property, plant and equipment
Buildings 8,422 8,676
Investments in leased premises 3,016 2,819
Equipment, fixtures and fitting 28,351 26,461
39,788 37,956
Financial fixed assets
Other non-current receivables 947 1,791
Deferred tax assets (6) 8,243 6,714
9,190 8,505
Total non-current assets 1,179,961 990,788
Current assets
Inventories (8C)
Goods for resale 5,302 3,619
5,302 3,619
Current receivables
Accounts receivable (9A) 201,297 172,450
Current tax assets 20,740 9,008
Other receivables 6,346 841
Prepaid expenses and accrued income (8D) 26,701 27,296
255,083 209,595
Short-term investments 46 44
Cash and cash equivalents (9B) 235,256 57,924
Total current assets 495,687 271,182
TOTAL ASSETS 1,675,648 1,261,970
Note Dec 31, 2018
Dec 31, 2017
SHAREHOLDERS’ EQUITY AND LIABILITIES
Shareholders’ equity (12)
Share capital 3,234 2,984
Other capital contributions 316,637 121,963
Reserves 6,591 -5,852
Retained earnings including profit of the year 343,166 279,069
Equity attributable to Parent Company shareholders 669,628 398,164
Non-current liabilities
Convertible debentures (9D, 9E, 11) 39,828 38,789
Liabilities to credit institutions (9A, 9E, 11) 463,805 336,129
Post-employment remuneration of employees (10A) 4,792 8,225
Other non-current liabilities (9E, 11) 1,045 3,270
Deferred tax (6) 152,887 135,844
Total non-current liabilities 662,357 522,257
Current liabilities
Liabilities to credit institutions (9E, 11) 5,620 31,180
Accounts payable 39,910 31,902
Tax liabilities 12,923 8,961
Other liabilities (9C) 72,271 77,122
Accrued expenses and prepaid income (8E) 212,939 192,384
Total current liabilities 343,663 341,549
TOTAL SHAREHOLDERS’ EQUITY AND LIABILITIES 1,675,648 1,261,970
Pledged assets (15B) 803,118 350,975
Contingent liabilities - -

Vitec Annual Report 2018 51
FINANCIAL STATEMENTS
Note Dec 31, 2018
Dec 31, 2017
SHAREHOLDERS’ EQUITY AND LIABILITIES
Shareholders’ equity (12)
Share capital 3,234 2,984
Other capital contributions 316,637 121,963
Reserves 6,591 -5,852
Retained earnings including profit of the year 343,166 279,069
Equity attributable to Parent Company shareholders 669,628 398,164
Non-current liabilities
Convertible debentures (9D, 9E, 11) 39,828 38,789
Liabilities to credit institutions (9A, 9E, 11) 463,805 336,129
Post-employment remuneration of employees (10A) 4,792 8,225
Other non-current liabilities (9E, 11) 1,045 3,270
Deferred tax (6) 152,887 135,844
Total non-current liabilities 662,357 522,257
Current liabilities
Liabilities to credit institutions (9E, 11) 5,620 31,180
Accounts payable 39,910 31,902
Tax liabilities 12,923 8,961
Other liabilities (9C) 72,271 77,122
Accrued expenses and prepaid income (8E) 212,939 192,384
Total current liabilities 343,663 341,549
TOTAL SHAREHOLDERS’ EQUITY AND LIABILITIES 1,675,648 1,261,970
Pledged assets (15B) 803,118 350,975
Contingent liabilities - -

52 Vitec Annual Report 2018
Condensed consolidated statement of changes in equity
Share capitalOther capital contributions Reserves* Retained earnings
Total equity attributable to
parent company shareholders
OPENING EQUITY, JAN 1, 2017 2,940 121,963 -3,567 212,877 334,213
Profit for the year - - - 79,426 79,426
Other comprehensive income - - -2,285 - -2,285
Total comprehensive income/loss 2,940 121,963 -5,852 292,303 411,354
Convertible debenture with stock options - - - 2,221 2,221
Redemption of debentures 44 - - 13,942 13,986
Dividends paid - - - -29,397 -29,397
CLOSING EQUITY, DEC 31, 2017 2,984 121,963 -5,852 279,069 398,164
Profit for the year - - - 96,920 96,920
Other comprehensive income - 12,443 - 12,443
Total comprehensive income/loss 2,984 121,963 6,591 375,989 507,527
New share issue after issuing costs** 250 194,674 - - 194,924
Dividends paid - - - -32,823 -32,823
CLOSING EQUITY, 31 DECEMBER 2018 3,234 316,637 6,591 343,166 669,628
* Reserves comprise actuarial changes to pension liabilities and to translation differences when translating foreign operations, as well as hedge accounting of the same.
** New share issues were recognized in their net amounts after issuing costs of SEK 2,576,000.
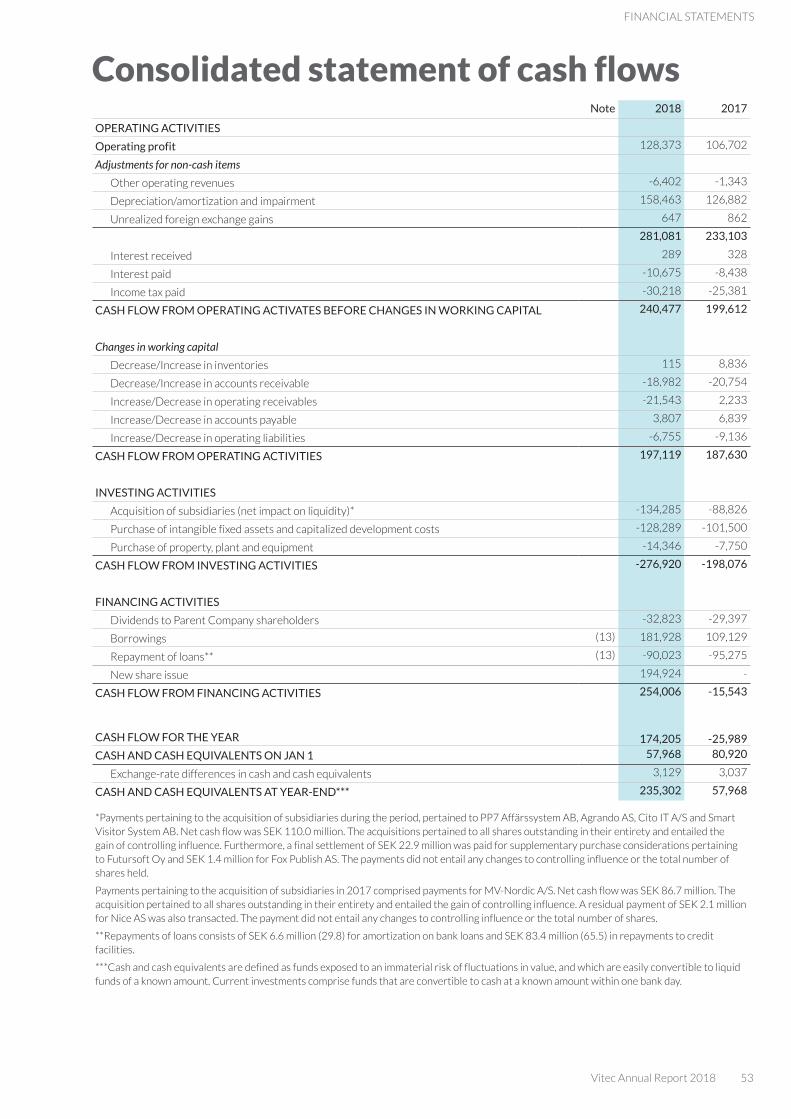
Vitec Annual Report 2018 53
FINANCIAL STATEMENTS
Consolidated statement of cash flowsNote 2018 2017
OPERATING ACTIVITIES
Operating profit 128,373 106,702
Adjustments for non-cash items
Other operating revenues -6,402 -1,343
Depreciation/amortization and impairment 158,463 126,882
Unrealized foreign exchange gains 647 862
281,081 233,103
Interest received 289 328
Interest paid -10,675 -8,438
Income tax paid -30,218 -25,381
CASH FLOW FROM OPERATING ACTIVATES BEFORE CHANGES IN WORKING CAPITAL 240,477 199,612
Changes in working capital
Decrease/Increase in inventories 115 8,836
Decrease/Increase in accounts receivable -18,982 -20,754
Increase/Decrease in operating receivables -21,543 2,233
Increase/Decrease in accounts payable 3,807 6,839
Increase/Decrease in operating liabilities -6,755 -9,136
CASH FLOW FROM OPERATING ACTIVITIES 197,119 187,630
INVESTING ACTIVITIES
Acquisition of subsidiaries (net impact on liquidity)* -134,285 -88,826
Purchase of intangible fixed assets and capitalized development costs -128,289 -101,500
Purchase of property, plant and equipment -14,346 -7,750
CASH FLOW FROM INVESTING ACTIVITIES -276,920 -198,076
FINANCING ACTIVITIES
Dividends to Parent Company shareholders -32,823 -29,397
Borrowings (13) 181,928 109,129
Repayment of loans** (13) -90,023 -95,275
New share issue 194,924 -
CASH FLOW FROM FINANCING ACTIVITIES 254,006 -15,543
CASH FLOW FOR THE YEAR 174,205 -25,989
CASH AND CASH EQUIVALENTS ON JAN 1 57,968 80,920
Exchange-rate differences in cash and cash equivalents 3,129 3,037
CASH AND CASH EQUIVALENTS AT YEAR-END*** 235,302 57,968
*Payments pertaining to the acquisition of subsidiaries during the period, pertained to PP7 Affärssystem AB, Agrando AS, Cito IT A/S and Smart Visitor System AB. Net cash flow was SEK 110.0 million. The acquisitions pertained to all shares outstanding in their entirety and entailed the gain of controlling influence. Furthermore, a final settlement of SEK 22.9 million was paid for supplementary purchase considerations pertaining to Futursoft Oy and SEK 1.4 million for Fox Publish AS. The payments did not entail any changes to controlling influence or the total number of shares held.
Payments pertaining to the acquisition of subsidiaries in 2017 comprised payments for MV-Nordic A/S. Net cash flow was SEK 86.7 million. The acquisition pertained to all shares outstanding in their entirety and entailed the gain of controlling influence. A residual payment of SEK 2.1 million for Nice AS was also transacted. The payment did not entail any changes to controlling influence or the total number of shares.
**Repayments of loans consists of SEK 6.6 million (29.8) for amortization on bank loans and SEK 83.4 million (65.5) in repayments to credit facilities.
***Cash and cash equivalents are defined as funds exposed to an immaterial risk of fluctuations in value, and which are easily convertible to liquid funds of a known amount. Current investments comprise funds that are convertible to cash at a known amount within one bank day.
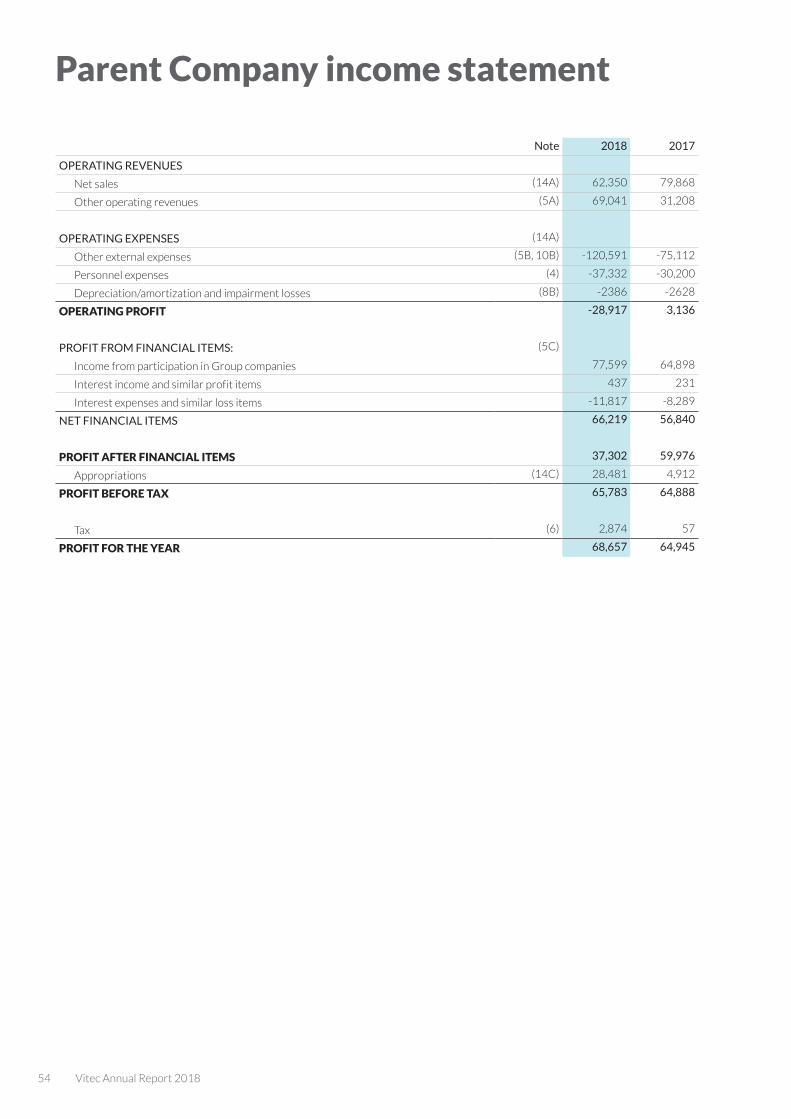
54 Vitec Annual Report 2018
Parent Company income statement
Note 2018 2017
OPERATING REVENUES
Net sales (14A) 62,350 79,868
Other operating revenues (5A) 69,041 31,208
OPERATING EXPENSES (14A)
Other external expenses (5B, 10B) -120,591 -75,112
Personnel expenses (4) -37,332 -30,200
Depreciation/amortization and impairment losses (8B) -2386 -2628
OPERATING PROFIT -28,917 3,136
PROFIT FROM FINANCIAL ITEMS: (5C)
Income from participation in Group companies 77,599 64,898
Interest income and similar profit items 437 231
Interest expenses and similar loss items -11,817 -8,289
NET FINANCIAL ITEMS 66,219 56,840
PROFIT AFTER FINANCIAL ITEMS 37,302 59,976
Appropriations (14C) 28,481 4,912
PROFIT BEFORE TAX 65,783 64,888
Tax (6) 2,874 57
PROFIT FOR THE YEAR 68,657 64,945
Vitec Annual Report 2018 55
FINANCIAL STATEMENTS
Bård Heiberg and Lill Bringaker, Oslo

56 Vitec Annual Report 2018
Balance sheet, Parent Company
Note Dec 31, 2018
Dec 31, 2017
ASSETS
Fixed assets
Intangible fixed assets (8B)
Software 2,419 3,301
2,419 3,301
Tangible property, plant and equipment (8B)
Buildings 8,423 8,609
Investments in leased premises 786 641
Equipment, fixtures and fitting 2,081 2,182
11,290 11,432
Financial fixed assets (8B)
Participations in subsidiaries 1,180,384 972,519
Receivables from Group companies 5,704 7,702
Deferred tax assets (6) 2,931 57
1,189,019 980,278
Total non-current assets 1,202,728 995,011
Current assets
Current receivables
Receivables from Group companies 87,380 81,349
Current tax assets 4,687 4,687
Other receivables 2,298 1,011
Prepaid expenses and accrued income (8D) 4,345 3,549
98,710 90,596
Cash and bank balances 222,908 51,616
Total current assets 321,618 142,212
TOTAL ASSETS 1,524,346 1,137,223
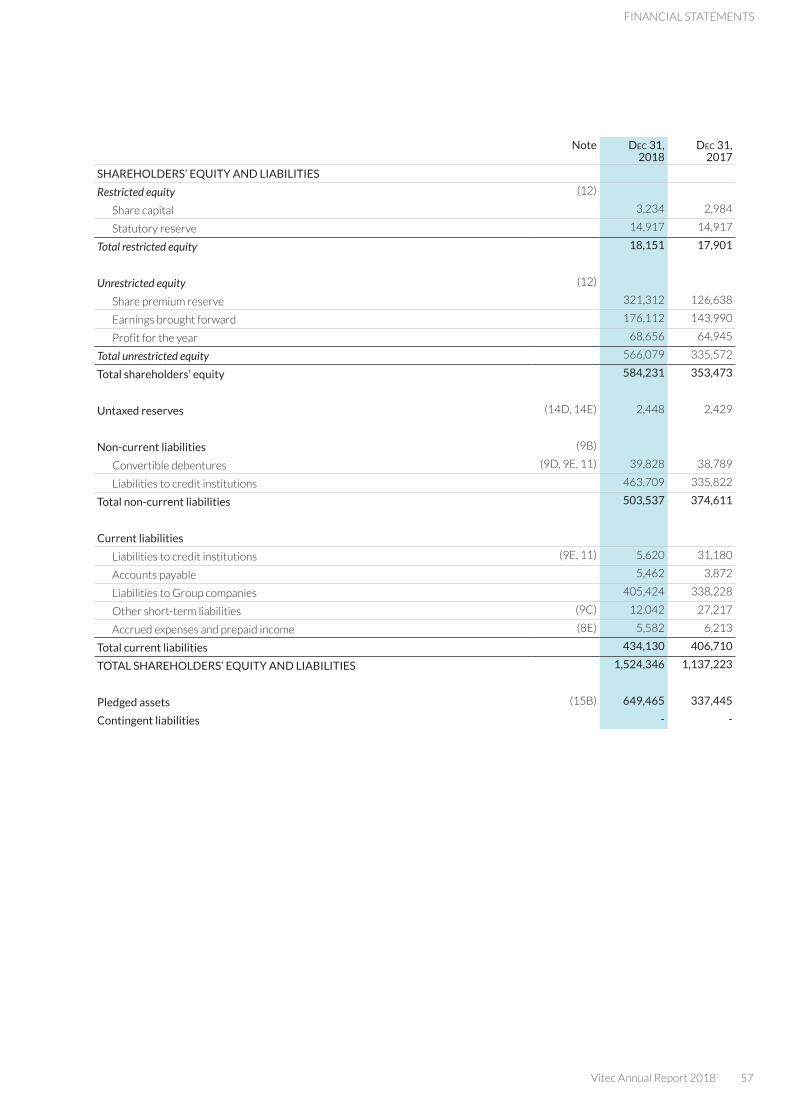
Vitec Annual Report 2018 57
FINANCIAL STATEMENTS
Note Dec 31, 2018
Dec 31, 2017
SHAREHOLDERS’ EQUITY AND LIABILITIES
Restricted equity (12)
Share capital 3,234 2,984
Statutory reserve 14,917 14,917
Total restricted equity 18,151 17,901
Unrestricted equity (12)
Share premium reserve 321,312 126,638
Earnings brought forward 176,112 143,990
Profit for the year 68,656 64,945
Total unrestricted equity 566,079 335,572
Total shareholders’ equity 584,231 353,473
Untaxed reserves (14D, 14E) 2,448 2,429
Non-current liabilities (9B)
Convertible debentures (9D, 9E, 11) 39,828 38,789
Liabilities to credit institutions 463,709 335,822
Total non-current liabilities 503,537 374,611
Current liabilities
Liabilities to credit institutions (9E, 11) 5,620 31,180
Accounts payable 5,462 3,872
Liabilities to Group companies 405,424 338,228
Other short-term liabilities (9C) 12,042 27,217
Accrued expenses and prepaid income (8E) 5,582 6,213
Total current liabilities 434,130 406,710
TOTAL SHAREHOLDERS’ EQUITY AND LIABILITIES 1,524,346 1,137,223
Pledged assets (15B) 649,465 337,445
Contingent liabilities - -
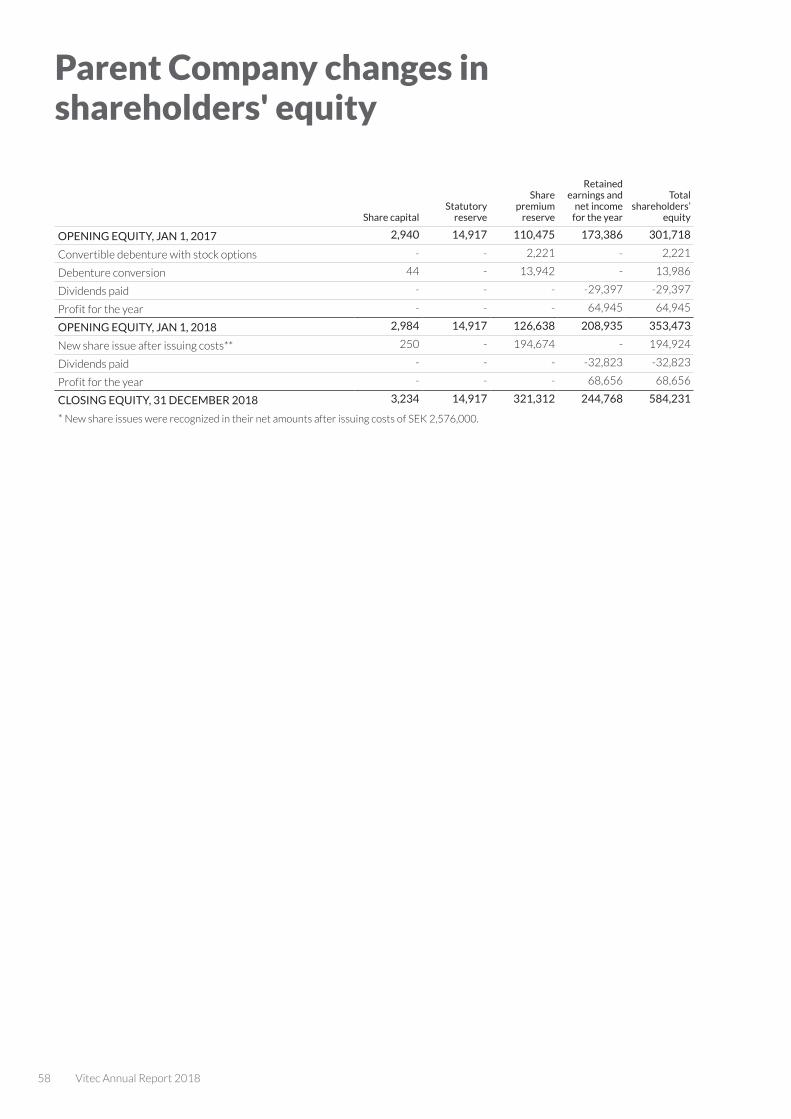
58 Vitec Annual Report 2018
Parent Company changes in shareholders' equity
Share capitalStatutory
reserve
Share premium
reserve
Retained earnings and
net income for the year
Total shareholders’
equity
OPENING EQUITY, JAN 1, 2017 2,940 14,917 110,475 173,386 301,718
Convertible debenture with stock options - - 2,221 - 2,221
Debenture conversion 44 - 13,942 - 13,986
Dividends paid - - - -29,397 -29,397
Profit for the year - - - 64,945 64,945
OPENING EQUITY, JAN 1, 2018 2,984 14,917 126,638 208,935 353,473
New share issue after issuing costs** 250 - 194,674 - 194,924
Dividends paid - - - -32,823 -32,823
Profit for the year - - - 68,656 68,656
CLOSING EQUITY, 31 DECEMBER 2018 3,234 14,917 321,312 244,768 584,231
* New share issues were recognized in their net amounts after issuing costs of SEK 2,576,000.
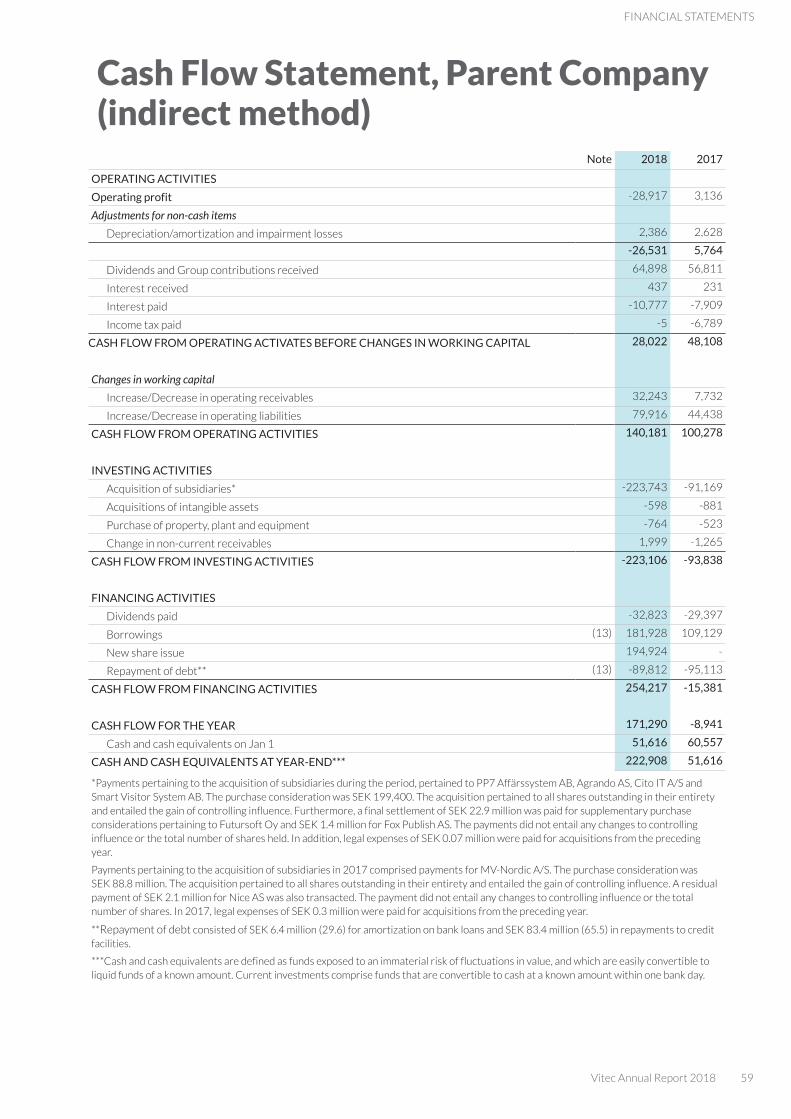
Vitec Annual Report 2018 59
FINANCIAL STATEMENTS
Note 2018 2017
OPERATING ACTIVITIES
Operating profit -28,917 3,136
Adjustments for non-cash items
Depreciation/amortization and impairment losses 2,386 2,628
-26,531 5,764
Dividends and Group contributions received 64,898 56,811
Interest received 437 231
Interest paid -10,777 -7,909
Income tax paid -5 -6,789
CASH FLOW FROM OPERATING ACTIVATES BEFORE CHANGES IN WORKING CAPITAL 28,022 48,108
Changes in working capital
Increase/Decrease in operating receivables 32,243 7,732
Increase/Decrease in operating liabilities 79,916 44,438
CASH FLOW FROM OPERATING ACTIVITIES 140,181 100,278
INVESTING ACTIVITIES
Acquisition of subsidiaries* -223,743 -91,169
Acquisitions of intangible assets -598 -881
Purchase of property, plant and equipment -764 -523
Change in non-current receivables 1,999 -1,265
CASH FLOW FROM INVESTING ACTIVITIES -223,106 -93,838
FINANCING ACTIVITIES
Dividends paid -32,823 -29,397
Borrowings (13) 181,928 109,129
New share issue 194,924 -
Repayment of debt** (13) -89,812 -95,113
CASH FLOW FROM FINANCING ACTIVITIES 254,217 -15,381
CASH FLOW FOR THE YEAR 171,290 -8,941
Cash and cash equivalents on Jan 1 51,616 60,557
CASH AND CASH EQUIVALENTS AT YEAR-END*** 222,908 51,616
*Payments pertaining to the acquisition of subsidiaries during the period, pertained to PP7 Affärssystem AB, Agrando AS, Cito IT A/S and Smart Visitor System AB. The purchase consideration was SEK 199,400. The acquisition pertained to all shares outstanding in their entirety and entailed the gain of controlling influence. Furthermore, a final settlement of SEK 22.9 million was paid for supplementary purchase considerations pertaining to Futursoft Oy and SEK 1.4 million for Fox Publish AS. The payments did not entail any changes to controlling influence or the total number of shares held. In addition, legal expenses of SEK 0.07 million were paid for acquisitions from the preceding year.
Payments pertaining to the acquisition of subsidiaries in 2017 comprised payments for MV-Nordic A/S. The purchase consideration was SEK 88.8 million. The acquisition pertained to all shares outstanding in their entirety and entailed the gain of controlling influence. A residual payment of SEK 2.1 million for Nice AS was also transacted. The payment did not entail any changes to controlling influence or the total number of shares. In 2017, legal expenses of SEK 0.3 million were paid for acquisitions from the preceding year.
**Repayment of debt consisted of SEK 6.4 million (29.6) for amortization on bank loans and SEK 83.4 million (65.5) in repayments to credit facilities.
***Cash and cash equivalents are defined as funds exposed to an immaterial risk of fluctuations in value, and which are easily convertible to liquid funds of a known amount. Current investments comprise funds that are convertible to cash at a known amount within one bank day.
Cash Flow Statement, Parent Company (indirect method)
60 Vitec Annual Report 2018
NOTE 1 ACCOUNTING AND MEASUREMENT POLICIES
GeneralThe consolidated accounts were prepared pursuant to the Swedish Annual Accounts Act, International Financial Report-ing Standards (IFRS) issued by the International Accounting Standards Board (IASB), as well as the interpretations of the International Financial Reporting Interpretations Committee (IFRIC), as adopted by the EU for application within the EU. Recommendation RFR 1, Supplementary accounting rules for corporate groups, issued by the Swedish Financial Reporting Board, has also been applied.
The Parent Company applies the same accounting policies as the Group, with the exception of entries specified in Note 14 of the Parent Company’s accounting policies.
The Annual Report and the consolidated financial statements were approved for publication by the Board of Directors on March 18, 2019. The consolidated statement of comprehensive income and the statement of financial posi-tion, and the Parent Company income statement and balance sheet, are subject to approval by the AGM on April 10, 2019.
Presentation of accounting policies and notesAs of 2019, notes have been moved into new groupings, where we have chosen to group together information about items that are subject to similar methods of measurement. The notes of the annual accounts are thus grouped into sev-eral principal areas, where accounting policies are collected for a group of notes. General accounting and measurement policies are presented in Note 1.
Note groupings:1. General accounting and measurement policies2. Segments3. Revenues from contracts with customers4. Remuneration of employees5. Other significant profit/loss items6. Tax7. The Group’s composition8. Non-financial assets and liabilities9. Financial assets and liabilities10. Leasing11. Financial risks and capital risk management12. Shareholders’ equity13. Cash flow14. Parent Company15. Miscellaneous information16. Events after the balance-sheet date
Prerequisites for preparing the financial reports Functional currency and reporting currencyThe Parent Company’s functional currency is SEK, which is also the presentation currency for the Parent Company and the Group. This means that the financial statements are pre-sented in SEK. All amounts are rounded off and recognized to the nearest thousand SEK (SEK thousand) unless otherwise indicated.
Valuation bases Assets and liabilities are measured at their historical cost. No financial assets or liabilities are recognized at a value that substantially deviates from their fair at December 31, 2018.
Classification of current and long-term itemsIn all significant respects, long-term receivables and liabilities are recognized in the amounts that are expected to fall due for payment after one year, counted from the close of the re-porting period. Current receivables and liabilities fall due for payment within one year of the close of the reporting period.
Receivables and liabilities in foreign currencyOperating receivables and liabilities in foreign currency are translated to the exchange rate at the end of the reporting period and exchange-rate differences are recognized in oper-ating profit/loss.
Estimates and assumptions
The preparation of financial statements in conformity with IFRS requires the use of critical accounting estimates and assumptions. The Board of Directors and Group management exercise their judgement in the process of applying the com-pany's accounting policies. These estimates and assumptions are based on historic experience and other factors that are deemed to be plausible under existing circumstances. If other assumptions are made or other circumstances influence the matter the actual outcome can differ from these assessments. The principles for estimates and assumptions are subject to regular testing. Up to and including the submission date of annual accounts, nothing has occurred to prompt any amend-ments.
The areas in which estimates and assumptions are of ma-terial significance to Vitec’s consolidated financial statements are:
� Capitalized development expenditure, product rights, cus-tomer agreements, brands and goodwill. These primarily pertain to the recovery of the value for development work, product rights and customer agreements, as well as im-pairment testing for brands and goodwill. The estimates and assumptions that are associated with a significant risk for material adjustments to the carrying amounts of assets and liabilities within the next financial year are discussed in Note 8, Non-financial assets and liabilities.
� Defined-benefit pension plans These primarily pertain to a pension plan in Norway and the actuarial assumptions used for the calculation. The assumptions are reported un-der Note 4, Remuneration of employees.
� Supplementary purchase considerations for corporate ac-quisitions. These pertain to acquisitions where the pur-chase consideration is divided into two or more parts. One part that is paid in conjunction with the acquisition and other parts that are paid in the event that specified terms and conditions are fulfilled within a specified peri-od of time following the acquisition. These may pertain to, for example, earnings growth, an improved percentage of
Vitec Annual Report 2018 61
NOTES
recurring revenues and/or guarantee commitments. Pur-chase considerations are measured at fair value at the ac-quisition date. An acquisition plan must be established within 12 months, after which adjustments to the pur-chase consideration are recognized in profit/loss for the year. At December 31, 2018, there was one supplementa-ry purchase consideration in the balance sheet subject to assessment. The supplementary purchase consideration concerns Cito IT A/S, which will entail a payment during the third quarter of 2019.
ProvisionsProvisions are recognized in the balance sheet when there is a formal or informal obligation as a result of a past event and it is likely that an outflow of resources will be necessary to settle the obligation and a reliable estimation of the amount can be made. In cases where part of or the entire amount re-quired for settling a provision is expected to be compensated for by a third party or parties, the compensation is recognized when, and only when, it is essentially ascertained that it will be paid for if the obligation is to be settled. The compensation is recognized as a separate asset in the balance sheet. The amount recognized for the compensation may not exceed the provision. The cost of a provision is recognized in profit or loss as net after deduction for any compensation from third parties.
New or amended accounting policies as of 2018A number of new or amended standards entered into force as of 2018. The standards that are significant to Vitec are IFRS 15 Revenue from Contracts with Customers and IFRS 9
Financial instruments. Their impact is explained in Note 3 and Note 9.
New or amended accounting policies as of 2019 A number of new or amended standards entered into force as of 2019. These have not been applied in advance by Vitec. To the extent that the anticipated impact of these amendments are not discussed below, they are not deemed to have any material impact on the Group’s accounts.
IFRS 16 Leasing comes into force on January 1, 2019. The new standard entails the elimination of any differences be-tween operational and financial leasing. Leasing agreements exceeding 12 months are to be recognized in the balance sheet. The standard will impact how we recognize future lease agreements pertaining to premises. As of January 1, 2019, our lease agreements will be recog-nized as assets and liabilities in the consolidated statement of financial position. Instead of leasing expenses, we will be recognizing depreciation/impairment and interest expenses in the consolidated statement of comprehensive income. The expected impact on the statement of financial position is approximately SEK 50 million in increased assets and liabilities. In the statement of comprehensive income, profit/loss after tax is expected to be reduced by approximately SEK 1 million in the next year. We will apply the new standard by using the modified retrospective approach, which entails that comparative data will not be restated. Outstanding leases as of January 1, 2019, will be reported in accordance with the new standard.
Mahmoud Obaid and Celina Norberg, Stockholm
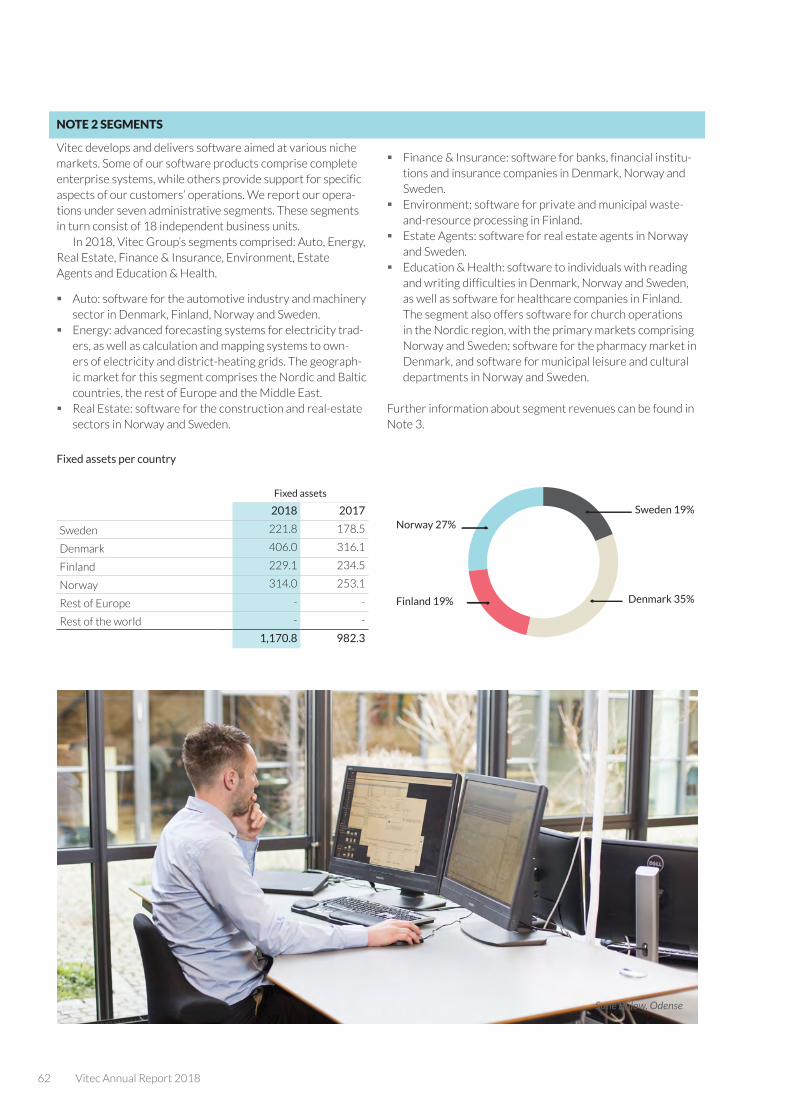
62 Vitec Annual Report 2018
NOTE 2 SEGMENTS
Vitec develops and delivers software aimed at various niche markets. Some of our software products comprise complete enterprise systems, while others provide support for specific aspects of our customers’ operations. We report our opera-tions under seven administrative segments. These segments in turn consist of 18 independent business units.
In 2018, Vitec Group’s segments comprised: Auto, Energy, Real Estate, Finance & Insurance, Environment, Estate Agents and Education & Health.
� Auto: software for the automotive industry and machinery sector in Denmark, Finland, Norway and Sweden.
� Energy: advanced forecasting systems for electricity trad-ers, as well as calculation and mapping systems to own-ers of electricity and district-heating grids. The geograph-ic market for this segment comprises the Nordic and Baltic countries, the rest of Europe and the Middle East.
� Real Estate: software for the construction and real-estate sectors in Norway and Sweden.
� Finance & Insurance: software for banks, financial institu-tions and insurance companies in Denmark, Norway and Sweden.
� Environment: software for private and municipal waste-and-resource processing in Finland.
� Estate Agents: software for real estate agents in Norway and Sweden.
� Education & Health: software to individuals with reading and writing difficulties in Denmark, Norway and Sweden, as well as software for healthcare companies in Finland. The segment also offers software for church operations in the Nordic region, with the primary markets comprising Norway and Sweden; software for the pharmacy market in Denmark, and software for municipal leisure and cultural departments in Norway and Sweden.
Further information about segment revenues can be found in Note 3.
Fixed assets per country
Fixed assets
2018 2017
Sweden 221.8 178.5
Denmark 406.0 316.1
Finland 229.1 234.5
Norway 314.0 253.1
Rest of Europe - -
Rest of the world - -
1,170.8 982.3
SEK kurs Antal
Omsättning fördelning marknad
Other countries 1%
Norway 21%
Finland 18%
Sweden 32%
Denmark 28%
2018 i korthet
Föreslagen utdelning: 1,20Kr
Norway 27%
Finland 19%
Sweden 19%
Denmark 35%
Anläggningstillgångarnas fördelning per land
Sune Bülow, Odense

Vitec Annual Report 2018 63
NOTES
OPERATING SEGMENTS
Auto Energy Real EstateFinance & Insurance Environment
2018 2017 2018 2017 2018 2017 2018 2017 2018 2017
Per operating segment (SEK million)
Net sales 170.6 156.2 26.1 25.7 206.7 190.1 133.1 143.9 47.8 23.2
Capitalized own work 19.0 14.0 2.6 2.9 23.6 19.0 24.9 20.3 2.6 2.3
Depreciation/amortization and impairment losses -23.4 -20.4 -1.9 -2.1 -17.9 -16.7 -23.4 -20.8 -3.7 -3.2
Operating profit 28.3 19.5 9.3 8.0 44.3 32.2 12.7 29.0 5.5 5.5
Net financial items - - - - -0.1 - - - - -
Consolidated profit/loss before tax
Fixed assets
Investments in fixed assets for the year 20.1 16.2 2.6 2.9 36.1 19.9 28.1 20.6 2.8 34.8
Fixed assets by segment
Goodwill and brands 112.8 110.8 0.0 0.0 61.6 40.7 36.7 51.9 12.1 11.6
Product rights and customer agreements 77.5 89.3 0.0 0.0 19.0 21.0 48.5 55.9 19.3 21.4
Capitalized development expenditure 39.3 27.4 6.9 6.3 49.0 36.1 66.1 51.5 5.4 3.3
Other tangible and intangible fixed assets 2.7 2.7 0.0 0.0 0.5 0.5 4.6 2.6 0.2 0.1
Total fixed assets by segment 232.3 230.2 6.9 6.3 130.1 98.3 155.9 161.9 37.0 36.4
OPERATING SEGMENTS, CONT’D
Estate Agents Education & Health Group-wide Eliminations Total
2018 2017 2018 2017 2018 2017 2018 2017 2018 2017
Per operating segment (SEK million)
Net sales 161.8 142.6 277.3 161.5 131.2 111.0 -137.6 -120.7 1,016.8 855.0
Capitalized own work 26.2 22.7 28.8 16.0 - - - - 127.6 97.2
Depreciation/amortization and impairment losses
-25.5 -28.8 -47.0 -25.3 -9.5 -8.4 0.2 0.3 -152.1 -125.5
Operating profit 23.9 5.5 9.5 11.2 -5.1 -4.2 - - 128.4 106.7
Net financial items 0.0 0.0 -0.1 -0.4 -11.5 -8.2 - - -11.6 -8.6
Consolidated profit/loss before tax 116.8 98.1
Fixed assets
Total investments in fixed assets for the year 26.2 23.6 203.8 169.5 7.7 11.5 - - 327.4 266.5
Fixed assets by segment
Goodwill and brands 94.0 93.2 148.7 48.7 0.0 0.0 - - 465.9 356.9
Product rights and customer agreements 27.0 34.2 201.6 163.7 0.0 0.0 - - 392.9 385.5
Capitalized development expenditure53.7 47.4 48.6 26.0 0.0 0.0 - - 269.0 197.9
Other tangible and intangible fixed assets 1.9 6.6 4.0 3.0 29.0 26.5 - - 42.9 42.0
Total fixed assets by segment176.6 181.4 402.9 241.4 29.1 26.5 0.0 0.0 1,170.8 982.3
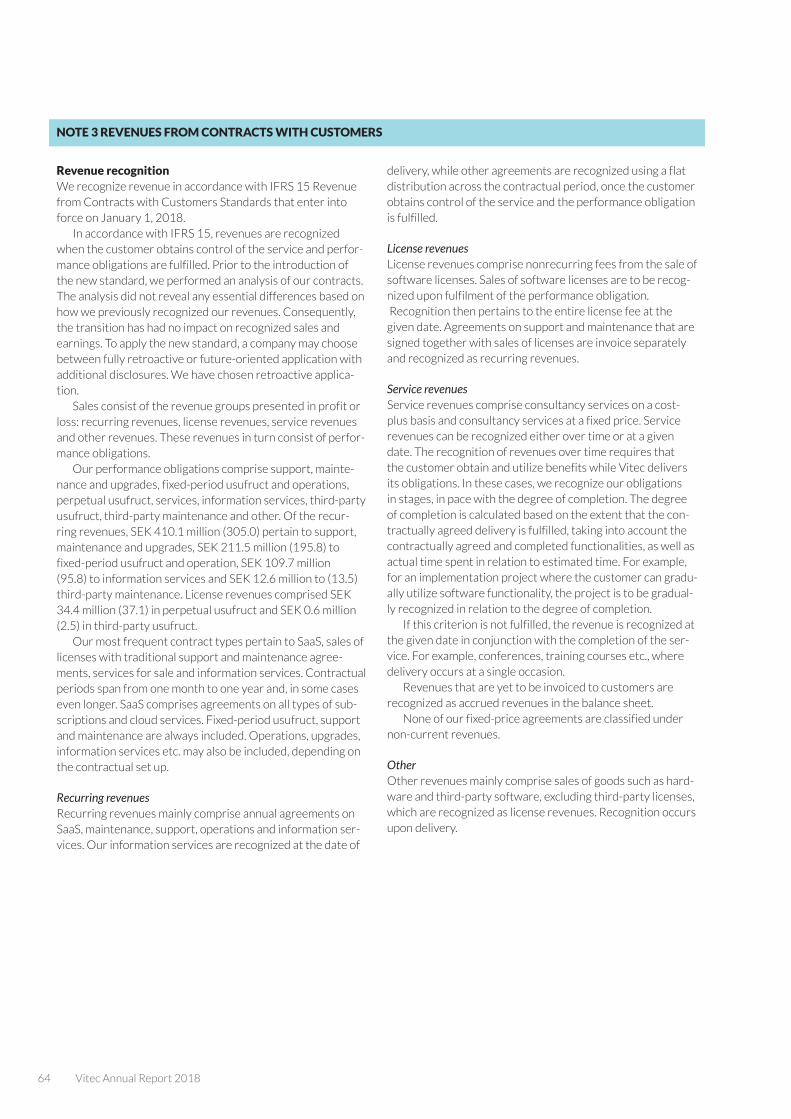
64 Vitec Annual Report 2018
NOTE 3 REVENUES FROM CONTRACTS WITH CUSTOMERS
Revenue recognitionWe recognize revenue in accordance with IFRS 15 Revenue from Contracts with Customers Standards that enter into force on January 1, 2018.
In accordance with IFRS 15, revenues are recognized when the customer obtains control of the service and perfor-mance obligations are fulfilled. Prior to the introduction of the new standard, we performed an analysis of our contracts. The analysis did not reveal any essential differences based on how we previously recognized our revenues. Consequently, the transition has had no impact on recognized sales and earnings. To apply the new standard, a company may choose between fully retroactive or future-oriented application with additional disclosures. We have chosen retroactive applica-tion.
Sales consist of the revenue groups presented in profit or loss: recurring revenues, license revenues, service revenues and other revenues. These revenues in turn consist of perfor-mance obligations.
Our performance obligations comprise support, mainte-nance and upgrades, fixed-period usufruct and operations, perpetual usufruct, services, information services, third-party usufruct, third-party maintenance and other. Of the recur-ring revenues, SEK 410.1 million (305.0) pertain to support, maintenance and upgrades, SEK 211.5 million (195.8) to fixed-period usufruct and operation, SEK 109.7 million (95.8) to information services and SEK 12.6 million to (13.5) third-party maintenance. License revenues comprised SEK 34.4 million (37.1) in perpetual usufruct and SEK 0.6 million (2.5) in third-party usufruct.
Our most frequent contract types pertain to SaaS, sales of licenses with traditional support and maintenance agree-ments, services for sale and information services. Contractual periods span from one month to one year and, in some cases even longer. SaaS comprises agreements on all types of sub-scriptions and cloud services. Fixed-period usufruct, support and maintenance are always included. Operations, upgrades, information services etc. may also be included, depending on the contractual set up.
Recurring revenuesRecurring revenues mainly comprise annual agreements on SaaS, maintenance, support, operations and information ser-vices. Our information services are recognized at the date of
delivery, while other agreements are recognized using a flat distribution across the contractual period, once the customer obtains control of the service and the performance obligation is fulfilled.
License revenuesLicense revenues comprise nonrecurring fees from the sale of software licenses. Sales of software licenses are to be recog-nized upon fulfilment of the performance obligation. Recognition then pertains to the entire license fee at the given date. Agreements on support and maintenance that are signed together with sales of licenses are invoice separately and recognized as recurring revenues.
Service revenuesService revenues comprise consultancy services on a cost-plus basis and consultancy services at a fixed price. Service revenues can be recognized either over time or at a given date. The recognition of revenues over time requires that the customer obtain and utilize benefits while Vitec delivers its obligations. In these cases, we recognize our obligations in stages, in pace with the degree of completion. The degree of completion is calculated based on the extent that the con-tractually agreed delivery is fulfilled, taking into account the contractually agreed and completed functionalities, as well as actual time spent in relation to estimated time. For example, for an implementation project where the customer can gradu-ally utilize software functionality, the project is to be gradual-ly recognized in relation to the degree of completion.
If this criterion is not fulfilled, the revenue is recognized at the given date in conjunction with the completion of the ser-vice. For example, conferences, training courses etc., where delivery occurs at a single occasion.
Revenues that are yet to be invoiced to customers are recognized as accrued revenues in the balance sheet.
None of our fixed-price agreements are classified under non-current revenues.
OtherOther revenues mainly comprise sales of goods such as hard-ware and third-party software, excluding third-party licenses, which are recognized as license revenues. Recognition occurs upon delivery.
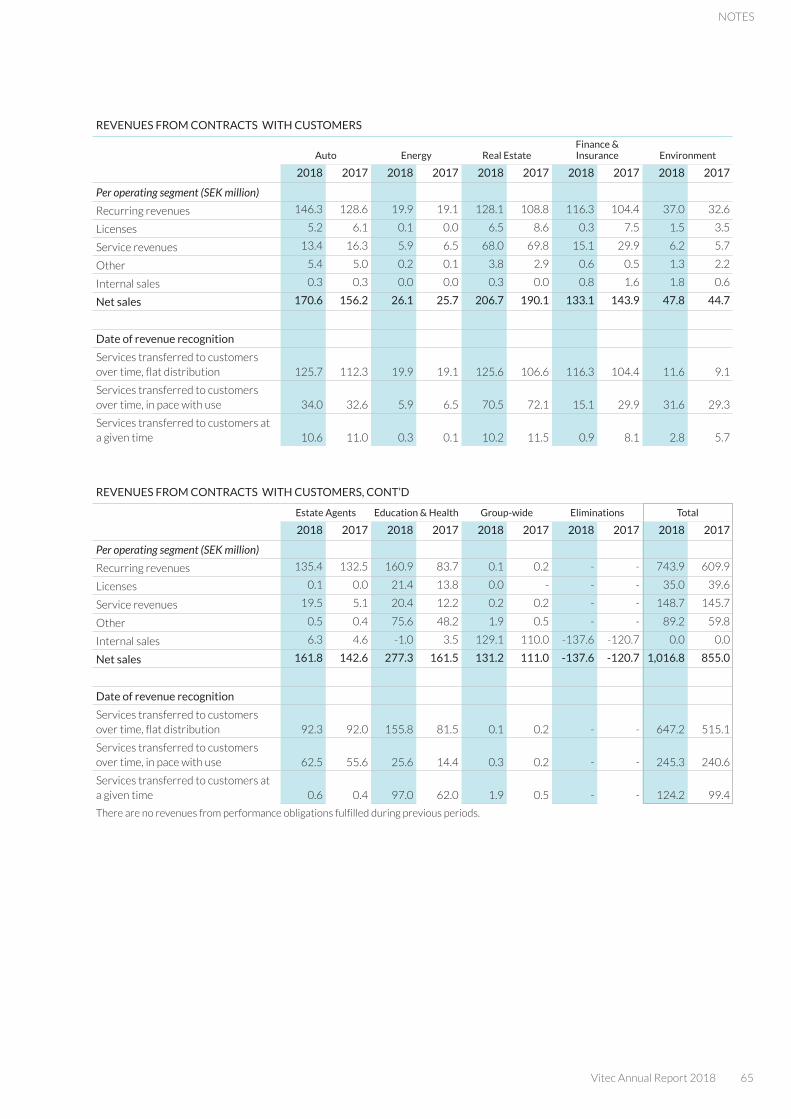
Vitec Annual Report 2018 65
NOTES
REVENUES FROM CONTRACTS WITH CUSTOMERS
Auto Energy Real EstateFinance & Insurance Environment
2018 2017 2018 2017 2018 2017 2018 2017 2018 2017
Per operating segment (SEK million)
Recurring revenues 146.3 128.6 19.9 19.1 128.1 108.8 116.3 104.4 37.0 32.6
Licenses 5.2 6.1 0.1 0.0 6.5 8.6 0.3 7.5 1.5 3.5
Service revenues 13.4 16.3 5.9 6.5 68.0 69.8 15.1 29.9 6.2 5.7
Other 5.4 5.0 0.2 0.1 3.8 2.9 0.6 0.5 1.3 2.2
Internal sales 0.3 0.3 0.0 0.0 0.3 0.0 0.8 1.6 1.8 0.6
Net sales 170.6 156.2 26.1 25.7 206.7 190.1 133.1 143.9 47.8 44.7
Date of revenue recognition
Services transferred to customers over time, flat distribution 125.7 112.3 19.9 19.1 125.6 106.6 116.3 104.4 11.6 9.1
Services transferred to customers over time, in pace with use 34.0 32.6 5.9 6.5 70.5 72.1 15.1 29.9 31.6 29.3
Services transferred to customers at a given time 10.6 11.0 0.3 0.1 10.2 11.5 0.9 8.1 2.8 5.7
REVENUES FROM CONTRACTS WITH CUSTOMERS, CONT’D
Estate Agents Education & Health Group-wide Eliminations Total
2018 2017 2018 2017 2018 2017 2018 2017 2018 2017
Per operating segment (SEK million)
Recurring revenues 135.4 132.5 160.9 83.7 0.1 0.2 - - 743.9 609.9
Licenses 0.1 0.0 21.4 13.8 0.0 - - - 35.0 39.6
Service revenues 19.5 5.1 20.4 12.2 0.2 0.2 - - 148.7 145.7
Other 0.5 0.4 75.6 48.2 1.9 0.5 - - 89.2 59.8
Internal sales 6.3 4.6 -1.0 3.5 129.1 110.0 -137.6 -120.7 0.0 0.0
Net sales 161.8 142.6 277.3 161.5 131.2 111.0 -137.6 -120.7 1,016.8 855.0
Date of revenue recognition
Services transferred to customers over time, flat distribution 92.3 92.0 155.8 81.5 0.1 0.2 - - 647.2 515.1
Services transferred to customers over time, in pace with use 62.5 55.6 25.6 14.4 0.3 0.2 - - 245.3 240.6
Services transferred to customers at a given time 0.6 0.4 97.0 62.0 1.9 0.5 - - 124.2 99.4
There are no revenues from performance obligations fulfilled during previous periods.
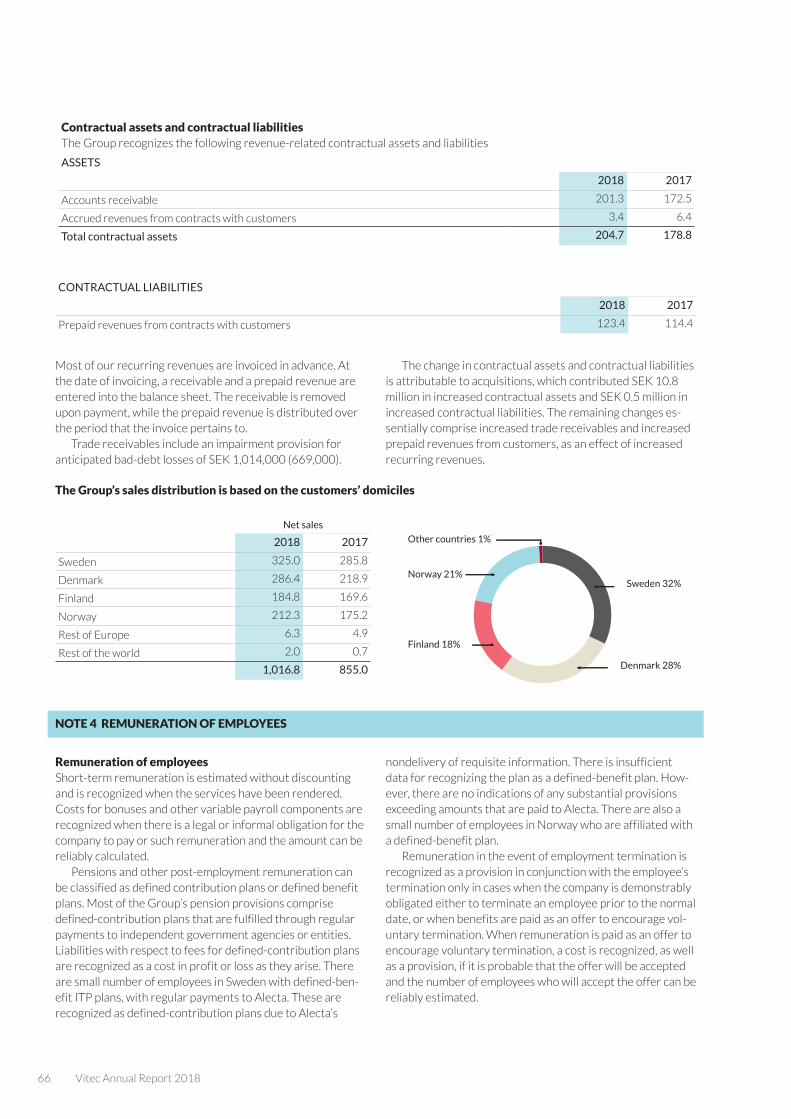
66 Vitec Annual Report 2018
Contractual assets and contractual liabilitiesThe Group recognizes the following revenue-related contractual assets and liabilities
ASSETS
2018 2017
Accounts receivable 201.3 172.5
Accrued revenues from contracts with customers 3.4 6.4
Total contractual assets 204.7 178.8
CONTRACTUAL LIABILITIES
2018 2017
Prepaid revenues from contracts with customers 123.4 114.4
Most of our recurring revenues are invoiced in advance. At the date of invoicing, a receivable and a prepaid revenue are entered into the balance sheet. The receivable is removed upon payment, while the prepaid revenue is distributed over the period that the invoice pertains to.
Trade receivables include an impairment provision for anticipated bad-debt losses of SEK 1,014,000 (669,000).
The change in contractual assets and contractual liabilities is attributable to acquisitions, which contributed SEK 10.8 million in increased contractual assets and SEK 0.5 million in increased contractual liabilities. The remaining changes es-sentially comprise increased trade receivables and increased prepaid revenues from customers, as an effect of increased recurring revenues.
The Group’s sales distribution is based on the customers’ domiciles
Net sales
2018 2017
Sweden 325.0 285.8
Denmark 286.4 218.9
Finland 184.8 169.6
Norway 212.3 175.2
Rest of Europe 6.3 4.9
Rest of the world 2.0 0.7
1,016.8 855.0
NOTE 4 REMUNERATION OF EMPLOYEES
Remuneration of employeesShort-term remuneration is estimated without discounting and is recognized when the services have been rendered. Costs for bonuses and other variable payroll components are recognized when there is a legal or informal obligation for the company to pay or such remuneration and the amount can be reliably calculated.
Pensions and other post-employment remuneration can be classified as defined contribution plans or defined benefit plans. Most of the Group’s pension provisions comprise defined-contribution plans that are fulfilled through regular payments to independent government agencies or entities. Liabilities with respect to fees for defined-contribution plans are recognized as a cost in profit or loss as they arise. There are small number of employees in Sweden with defined-ben-efit ITP plans, with regular payments to Alecta. These are recognized as defined-contribution plans due to Alecta’s
nondelivery of requisite information. There is insufficient data for recognizing the plan as a defined-benefit plan. How-ever, there are no indications of any substantial provisions exceeding amounts that are paid to Alecta. There are also a small number of employees in Norway who are affiliated with a defined-benefit plan.
Remuneration in the event of employment termination is recognized as a provision in conjunction with the employee’s termination only in cases when the company is demonstrably obligated either to terminate an employee prior to the normal date, or when benefits are paid as an offer to encourage vol-untary termination. When remuneration is paid as an offer to encourage voluntary termination, a cost is recognized, as well as a provision, if it is probable that the offer will be accepted and the number of employees who will accept the offer can be reliably estimated.
SEK kurs Antal
Omsättning fördelning marknad
Other countries 1%
Norway 21%
Finland 18%
Sweden 32%
Denmark 28%
2018 i korthet

Vitec Annual Report 2018 67
NOTES
NOTE 4A EMPLOYEES, PERSONNEL EXPENSES AND REMUNERATION OF SENIOR EXECUTIVES
AVERAGE NO. OF EMPLOYEES
Women Men Total
2018 2017 2018 2017 2018 2017
Parent Company
Sweden 18 17 9 8 27 25
Subsidiaries
Sweden 61 41 159 146 220 187
Denmark 49 38 119 97 168 135
Finland 24 22 73 69 97 91
France 0 1 0 5 0 6
Norway 30 25 71 71 101 96
Group total 182 144 431 396 613 540
At year-end, the number of employees was 643 (573).
GENDER DISTRIBUTION AMONG SENIOR EXECUTIVES
The Parent Company’s Board of Directors comprises five directors, of which two are women. The Group’s senior man-agement comprises four individuals, of which one is a woman.
The senior management and CEOs of subsidiaries comprise two women and 19 men.
SALARIES AND OTHER REMUNERATION
Salaries and other remuneration Social security expenses
(of which, pension contributions)
2018 2017 2018 2017 2018 2017
Parent Company 21,582 18,785 11,810 9,542 4,260 * 3,064 *
Subsidiaries 355,688 303,080 98,881 86,668 37,932 33,510
Group total 377,270 321,865 110,691 96,210 42,192 ** 36,574 **
* Of the Parent Company’s pension contributions, SEK 2,034,000 (1,669) pertains to the senior management group.
** Of the Group’s pension contributions, SEK 4,668,000 (3,958) pertains to the senior management group.
SALARIES AND OTHER REMUNERATION DISTRIBUTED BETWEEN BOARD MEMBERS, SENIOR EXECUTIVES AND OTHER EMPLOYEES
Senior executives (of which bonus payments and similar.) Other employees
2018 2017 2018 2017
Parent Company 8,179 (0) 8,119 (0) 13,403 10,666
Subsidiaries 23,834 (0) 19,220 (0) 331,854 283,860
Group total 32,013 (0) 27,339 (0) 345,257 294,526
Senior executivesSenior executives of the Parent Company comprise its Board of Directors and the Group’s senior management.
Senior executives in subsidiaries comprise the CEOs of the subsidiaries, who constitute separate reporting units.
Remuneration of Board members and senior executives of the Parent CompanyAll remuneration is considered competitive. External Board members are paid board fees.
No variable remuneration is paid. There are no consultan-cy agreements for any Board members or senior executives.
Board fees are paid in accordance with resolutions passed by the AGM. The Chairman of the Board is paid a fee of SEK 270,000 annually. The other four Board members who are not employees of the Group are paid fees totaling SEK 540,000 annually. In both cases, the remuneration level applies as of the date of the AGM.
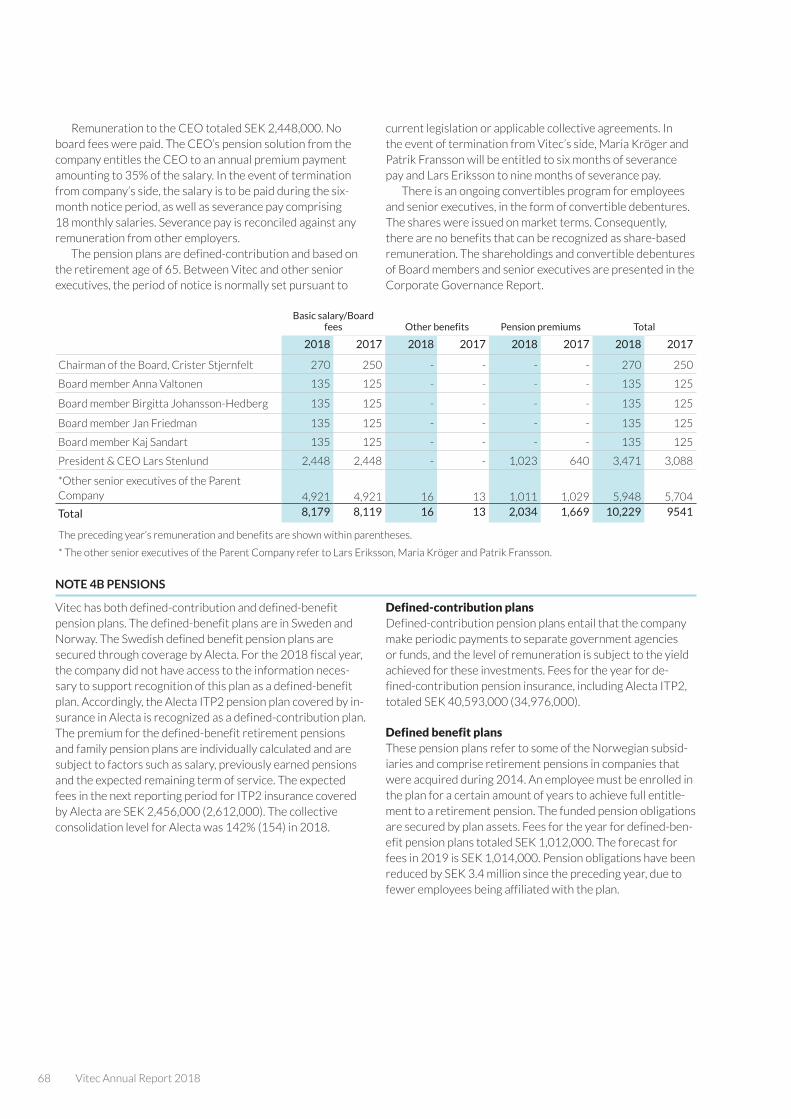
68 Vitec Annual Report 2018
Remuneration to the CEO totaled SEK 2,448,000. No board fees were paid. The CEO’s pension solution from the company entitles the CEO to an annual premium payment amounting to 35% of the salary. In the event of termination from company’s side, the salary is to be paid during the six-month notice period, as well as severance pay comprising 18 monthly salaries. Severance pay is reconciled against any remuneration from other employers.
The pension plans are defined-contribution and based on the retirement age of 65. Between Vitec and other senior executives, the period of notice is normally set pursuant to
current legislation or applicable collective agreements. In the event of termination from Vitec’s side, Maria Kröger and Patrik Fransson will be entitled to six months of severance pay and Lars Eriksson to nine months of severance pay.
There is an ongoing convertibles program for employees and senior executives, in the form of convertible debentures. The shares were issued on market terms. Consequently, there are no benefits that can be recognized as share-based remuneration. The shareholdings and convertible debentures of Board members and senior executives are presented in the Corporate Governance Report.
Basic salary/Board fees Other benefits Pension premiums Total
2018 2017 2018 2017 2018 2017 2018 2017
Chairman of the Board, Crister Stjernfelt 270 250 - - - - 270 250
Board member Anna Valtonen 135 125 - - - - 135 125
Board member Birgitta Johansson-Hedberg 135 125 - - - - 135 125
Board member Jan Friedman 135 125 - - - - 135 125
Board member Kaj Sandart 135 125 - - - - 135 125
President & CEO Lars Stenlund 2,448 2,448 - - 1,023 640 3,471 3,088
*Other senior executives of the Parent Company 4,921 4,921 16 13 1,011 1,029 5,948 5,704
Total 8,179 8,119 16 13 2,034 1,669 10,229 9541
The preceding year’s remuneration and benefits are shown within parentheses.
* The other senior executives of the Parent Company refer to Lars Eriksson, Maria Kröger and Patrik Fransson.
NOTE 4B PENSIONS
Vitec has both defined-contribution and defined-benefit pension plans. The defined-benefit plans are in Sweden and Norway. The Swedish defined benefit pension plans are secured through coverage by Alecta. For the 2018 fiscal year, the company did not have access to the information neces-sary to support recognition of this plan as a defined-benefit plan. Accordingly, the Alecta ITP2 pension plan covered by in-surance in Alecta is recognized as a defined-contribution plan. The premium for the defined-benefit retirement pensions and family pension plans are individually calculated and are subject to factors such as salary, previously earned pensions and the expected remaining term of service. The expected fees in the next reporting period for ITP2 insurance covered by Alecta are SEK 2,456,000 (2,612,000). The collective consolidation level for Alecta was 142% (154) in 2018.
Defined-contribution plansDefined-contribution pension plans entail that the company make periodic payments to separate government agencies or funds, and the level of remuneration is subject to the yield achieved for these investments. Fees for the year for de-fined-contribution pension insurance, including Alecta ITP2, totaled SEK 40,593,000 (34,976,000).
Defined benefit plansThese pension plans refer to some of the Norwegian subsid-iaries and comprise retirement pensions in companies that were acquired during 2014. An employee must be enrolled in the plan for a certain amount of years to achieve full entitle-ment to a retirement pension. The funded pension obligations are secured by plan assets. Fees for the year for defined-ben-efit pension plans totaled SEK 1,012,000. The forecast for fees in 2019 is SEK 1,014,000. Pension obligations have been reduced by SEK 3.4 million since the preceding year, due to fewer employees being affiliated with the plan.
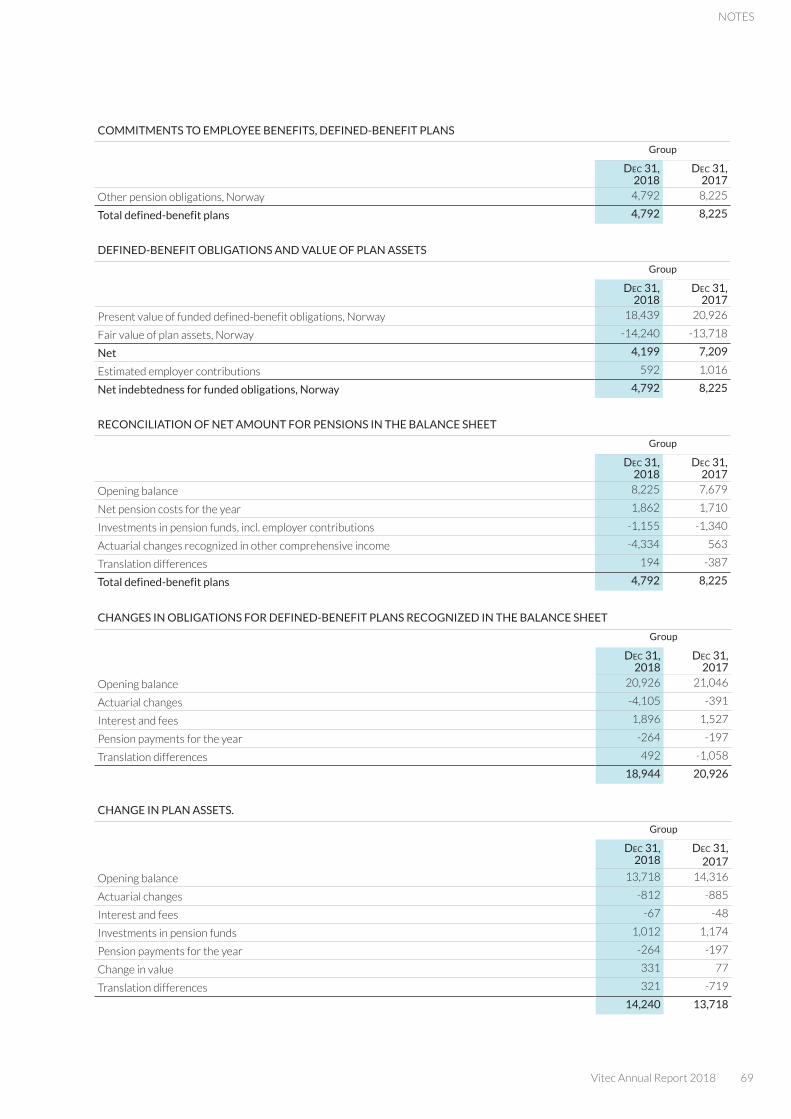
Vitec Annual Report 2018 69
NOTES
COMMITMENTS TO EMPLOYEE BENEFITS, DEFINED-BENEFIT PLANS
Group
Dec 31, 2018
Dec 31, 2017
Other pension obligations, Norway 4,792 8,225
Total defined-benefit plans 4,792 8,225
DEFINED-BENEFIT OBLIGATIONS AND VALUE OF PLAN ASSETS
Group
Dec 31, 2018
Dec 31, 2017
Present value of funded defined-benefit obligations, Norway 18,439 20,926
Fair value of plan assets, Norway -14,240 -13,718
Net 4,199 7,209
Estimated employer contributions 592 1,016
Net indebtedness for funded obligations, Norway 4,792 8,225
RECONCILIATION OF NET AMOUNT FOR PENSIONS IN THE BALANCE SHEET
Group
Dec 31, 2018
Dec 31, 2017
Opening balance 8,225 7,679
Net pension costs for the year 1,862 1,710
Investments in pension funds, incl. employer contributions -1,155 -1,340
Actuarial changes recognized in other comprehensive income -4,334 563
Translation differences 194 -387
Total defined-benefit plans 4,792 8,225
CHANGES IN OBLIGATIONS FOR DEFINED-BENEFIT PLANS RECOGNIZED IN THE BALANCE SHEET
Group
Dec 31, 2018
Dec 31, 2017
Opening balance 20,926 21,046
Actuarial changes -4,105 -391
Interest and fees 1,896 1,527
Pension payments for the year -264 -197
Translation differences 492 -1,058
18,944 20,926
CHANGE IN PLAN ASSETS.
Group
Dec 31, 2018
Dec 31, 2017
Opening balance 13,718 14,316
Actuarial changes -812 -885
Interest and fees -67 -48
Investments in pension funds 1,012 1,174
Pension payments for the year -264 -197
Change in value 331 77
Translation differences 321 -719
14,240 13,718

70 Vitec Annual Report 2018
ACTUARIAL ASSUMPTIONS
Group
% Dec 31, 2018
Dec 31, 2017
Discount rate 2.60 2.30
Expected return on pension fund assets 2.60 2.30
Future pay increases 2.75 2.50
Future increase of pensions 2.50 2.25
Future increases in base amounts 2.50 2.25
Employee turnover, % 0.00 0.00
Payroll tax 14.10 14.10
NOTE 5 OTHER SIGNIFICANT PROFIT/LOSS ITEMS
NOTE 5A OTHER OPERATING INCOME AND OTHER OPERATING EXPENSES
Other operating income in the Group mainly comprises adjustments to expensed supplementary contingent consid-erations, which are recognized pursuant to IFRS.
During the period, the expensed contingent purchase considerations for Futursoft Oy and PP7 Affärssystem AB were adjusted downward by SEK 2.4 and SEK 4.0 million, respectively. Pursuant to IFRS 3:58, the adjustment was recognized as Other operating revenues. An amortization of
intangible assets for the corresponding amount was recog-nized simultaneously.
The Parent Company’s other operating revenues consist in their entirety of unrealized exchange gains/losses.
Other operating expenses pertained in their entirety to exchange-rate gains/losses attributable to receivables and liabilities from operations.
NOTE 5B FEES AND REIMBURSEMENT OF COSTS TO AUDITORS
Group Parent Company
2018 2017 2018 2017
PwC, audit assignment 2,367 1,847 1,052 684
PWC, auditing activities beyond auditing assignment 146 300 25 -
PWC, tax advisory services 238 52 0 -
PWC, other assignments 11 149 11 149
Deloitte, audit assignment 108 - - -
Deloitte, auditing activities beyond auditing assignment - - - -
Deloitte, tax advisory services - - - -
Deloitte, other assignments - - - -
Other auditors, audit assignment 114 363 - -
Other auditors, auditing activities beyond auditing assignment - - - -
Other auditors, tax consultancy services and other assignments 84 94 - -
Total auditing fees 3,068 2,805 1,088 833
Of the audit assignments, SEK 1,052,000 pertained to PwC Sweden; of other statutory assignments, SEK 25,000 pertained to PwC Sweden; of the fees for tax advisory services, SEK 0 pertained to PwC Sweden; and of other assignments, SEK 11,000 pertained to PwC Sweden.
Of the audit assignments, SEK 613,000 pertained to PwC Norway; of other statutory assignments, SEK 0 pertained to PwC Norway; of the fees for tax advisory services, SEK 97,000 pertained to PwC Norway; and of other assignments, SEK 0 pertained to PwC Norway.
Of the audit assignments, SEK 322,000 pertained to PwC Denmark; of other statutory assignments, SEK 121,000 pertained to PwC Denmark; of the fees for tax advisory services, SEK 141,000 pertained to PwC Denmark; and of other assignments, SEK 0 pertained to PwC Denmark.
Of the audit assignments, SEK 380,000 pertained to PwC Finland; of other statutory assignments, SEK 0 pertained to PwC Finland; of the fees for tax advisory services, SEK 0 pertained to PwC Finland; and of other assignments, SEK 0 pertained to PwC Finland.

Vitec Annual Report 2018 71
NOTES
NOTE 5C NET FINANCIAL ITEMS
Financial income and expensesFinancial income exclusively comprises interest income from financial investments in the form of fixed-interest invest-ments, as well as dividend income for the Parent Company. Dividend income is recognized when the right to receive the dividend has been established. Anticipated dividends are recognized in Parent Company only when the contributing company is a wholly owned subsidiary. Financial expenses
comprise interest expenses on borrowings and accounts payable. Borrowing expenses are recognized in profit/loss applying the effective-interest-rate method, apart from cases that are directly attributable to purchasing, construction or production of a qualifying asset, since this is included in the cost of the asset. Any profit or loss from the divestment of subsidiaries are recognized as a financial expense or income, since the amounts are unsubstantial.
NET FINANCIAL ITEMS
Group Parent Company
2018 2017 2018 2017
Interest income 636 328 437 231
Dividends from subsidiaries - - 77,599 64,898
Other financial expenses -32 -63 - -
Interest expenses -12,202 -8,840 -11,817 -8,289
Net financial items 11,597 -8,575 66,219 56,840
Cathrine Frostfjord and Svein Flatekval, Oslo
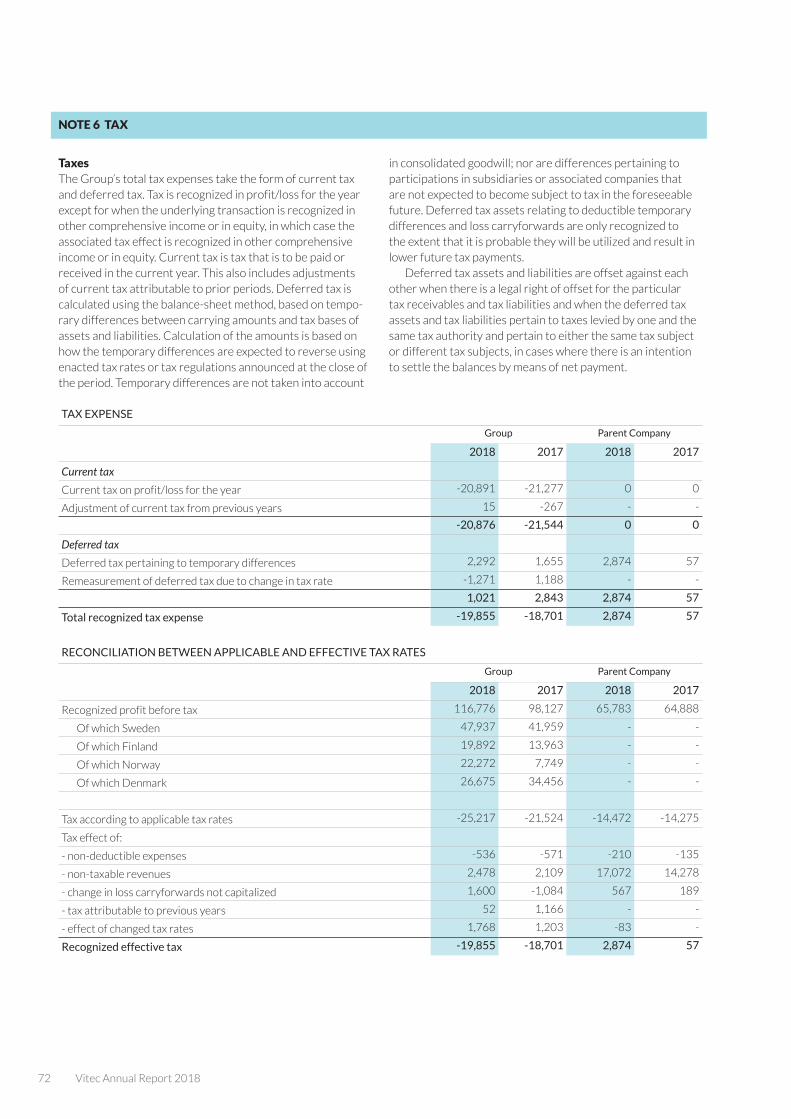
72 Vitec Annual Report 2018
NOTE 6 TAX
TaxesThe Group’s total tax expenses take the form of current tax and deferred tax. Tax is recognized in profit/loss for the year except for when the underlying transaction is recognized in other comprehensive income or in equity, in which case the associated tax effect is recognized in other comprehensive income or in equity. Current tax is tax that is to be paid or received in the current year. This also includes adjustments of current tax attributable to prior periods. Deferred tax is calculated using the balance-sheet method, based on tempo-rary differences between carrying amounts and tax bases of assets and liabilities. Calculation of the amounts is based on how the temporary differences are expected to reverse using enacted tax rates or tax regulations announced at the close of the period. Temporary differences are not taken into account
in consolidated goodwill; nor are differences pertaining to participations in subsidiaries or associated companies that are not expected to become subject to tax in the foreseeable future. Deferred tax assets relating to deductible temporary differences and loss carryforwards are only recognized to the extent that it is probable they will be utilized and result in lower future tax payments.
Deferred tax assets and liabilities are offset against each other when there is a legal right of offset for the particular tax receivables and tax liabilities and when the deferred tax assets and tax liabilities pertain to taxes levied by one and the same tax authority and pertain to either the same tax subject or different tax subjects, in cases where there is an intention to settle the balances by means of net payment.
TAX EXPENSE
Group Parent Company
2018 2017 2018 2017
Current tax
Current tax on profit/loss for the year -20,891 -21,277 0 0
Adjustment of current tax from previous years 15 -267 - -
-20,876 -21,544 0 0
Deferred tax
Deferred tax pertaining to temporary differences 2,292 1,655 2,874 57
Remeasurement of deferred tax due to change in tax rate -1,271 1,188 - -
1,021 2,843 2,874 57
Total recognized tax expense -19,855 -18,701 2,874 57
RECONCILIATION BETWEEN APPLICABLE AND EFFECTIVE TAX RATES
Group Parent Company
2018 2017 2018 2017
Recognized profit before tax 116,776 98,127 65,783 64,888
Of which Sweden 47,937 41,959 - -
Of which Finland 19,892 13,963 - -
Of which Norway 22,272 7,749 - -
Of which Denmark 26,675 34,456 - -
Tax according to applicable tax rates -25,217 -21,524 -14,472 -14,275
Tax effect of:
- non-deductible expenses -536 -571 -210 -135
- non-taxable revenues 2,478 2,109 17,072 14,278
- change in loss carryforwards not capitalized 1,600 -1,084 567 189
- tax attributable to previous years 52 1,166 - -
- effect of changed tax rates 1,768 1,203 -83 -
Recognized effective tax -19,855 -18,701 2,874 57

Vitec Annual Report 2018 73
NOTES
RECOGNIZED DEFERRED TAX ASSETS
Group Parent Company
2018 2017 2018 2017
Deferred tax on tax-loss carryforwards 7,624 6,297 2,874 57
Differences between book value and taxable value of fixed assets 619 417 - -
Closing balance 8,243 6,714 2,874 57
RECOGNIZED DEFERRED TAX LIABILITIES
Group Parent Company
2018 2017 2018 2017
Product rights, customer agreements and brands 95,881 95,303 - -
Capitalized development expenditure 57,972 43,010 - -
Pension liabilities -1,054 -1,892 - -
Untaxed reserves 88 -577 - -
Deferred tax liabilities 152,847 135,844 0 0
CHANGE IN DEFERRED TAX ON TEMPORARY DIFFERENCES
Jan 1, 2018
Recognized in total
comprehensive income for the
year
Recognized in other
comprehensive income for the
year
Recognized in shareholders’
equity Dec 31, 2018
Acquired net assets 91,664 -16,824 3,295 16,216 94,351
Effects of changes in tax rates 1,747 -1,271 - - 476
Net investment hedge - 3,489 - -3,489 0
Accumulated depreciation/amortization -577 665 - - 88
Capitalized development expenditure 43,010 14,962 - - 57,972
135,844 1,021 3,295 12,727 152,887
All deferred tax assets with respect to loss carry-forwards were capitalized.
CHANGE IN DEFERRED TAX ON TEMPORARY DIFFERENCES
Jan 1, 2018
Recognized in total
comprehensive income for the
year
Recognized in other
comprehensive income for the
year
Recognized in shareholders’
equity Dec 31, 2018
Accumulated depreciation/amortization 6,714 1,529 - - 8,243
6,714 1,529 0 0 8,243
74 Vitec Annual Report 2018
NOTE 7 THE GROUP’S COMPOSITION
Consolidated financial statementsThe Group comprises all companies over which the Group holds a controlling influence. The Group controls a company when it is exposed to or has the right to a variable return from its holding in the company and has the possibility to influence this return through its influence in the company. Subsidiaries are included in the consolidated accounts as from the date when control passes to the Group. They are excluded from the consolidated accounts as from the date when this control no longer exists.
The acquisition of a subsidiary is viewed as a transaction through which the Group indirectly acquires the assets of the subsidiary and assumes its liabilities. An acquisition analysis determines the fair value of acquired assets and assumed liabilities on the acquisition date. The value of any non-con-trolling interests is also determined. Transaction fees that arise are recognized directly in profit/loss for the year.
In the case of business acquisitions where the consider-ation transferred, any non-controlling interests and the fair value of previously held participations (step acquisitions) exceed the fair value of the acquired assets and assumed liabilities that are to be recognized separately, the difference is recognized as goodwill. Should the difference be negative, which is known as a bargain purchase, it is recognized directly in net profit. Consideration transferred in conjunction with the acquisition does not include payments pertaining to settlement of previous business relationships. This type of settlement is recognized through profit or loss.
Conditional purchase considerations/supplementary purchase considerations are recognized at fair value at the acquisition date. If the contingent consideration is classified as an equity instrument, no remeasurement takes place and
settlement is directly recognized in equity. Other contingent considerations are remeasured for each financial statement and the difference is recognized in net profit. Acquisitions from non-controlling interests are recognized as a transac-tion in equity, meaning a transaction between the sharehold-ers of Parent Company (in profit brought forward) and the non-controlling interest. Changes in non-controlling interests are based on their proportionate share of net assets. This is the reason why goodwill does not arise from these transac-tions. Goodwill is not amortized, but is instead subject to im-pairment testing on an annual basis. The financial statements of subsidiaries are consolidated from the date of acquisition until the date when the controlling influence ceases.
Intra-Group assets and liabilities, income and expenses are eliminated, as are unrealized gains and losses between Group companies. Unrealized losses are eliminated in the same manner as unrealized gains, but only insofar as no impairment requirement exists. The Group’s equity includes only parts of the subsidiary’s equity that were added following acquisition.
Transfer pricingWhen invoicing between Group companies, prices are set corresponding to market terms, where the end customer is an external customer. In cases where invoicing pertains to intra-Group services within the same country, invoicing are priced on a cost-plus basis. Decisions about what prices shall apply are made by Group Management. In cases of invoicing to foreign subsidiaries or between foreign subsidiaries, appli-cation of the cost-plus method is prioritized.
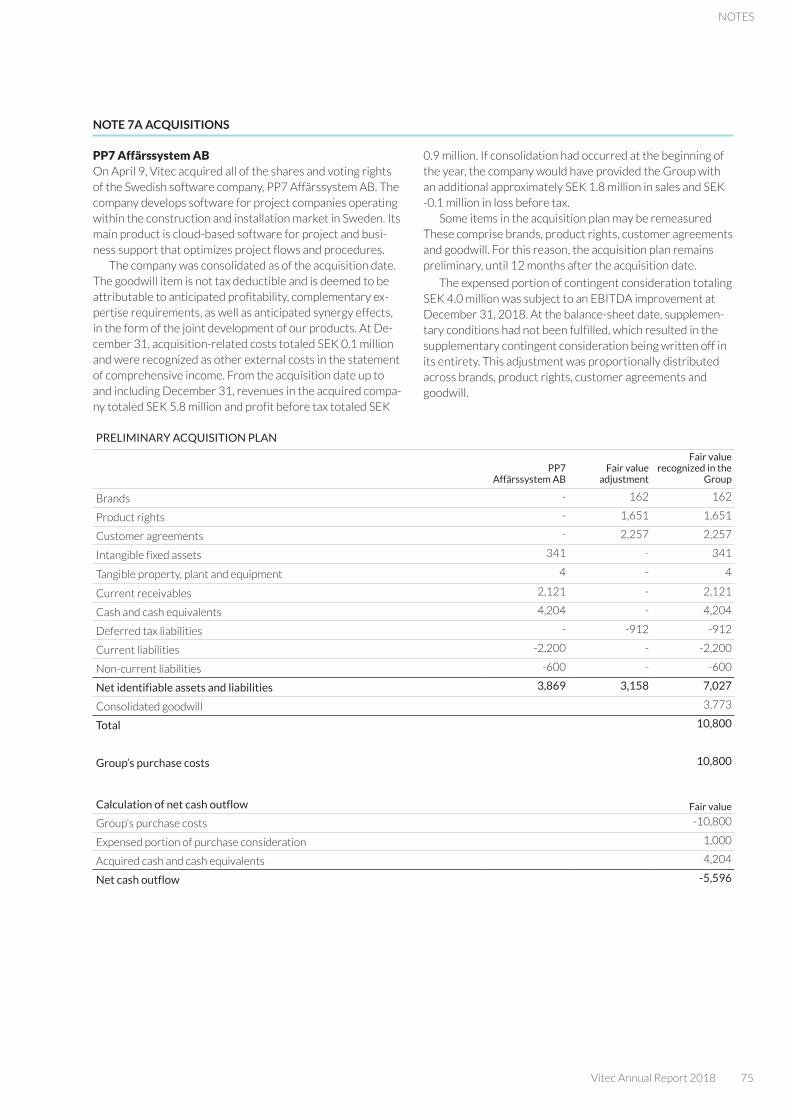
Vitec Annual Report 2018 75
NOTES
NOTE 7A ACQUISITIONS
PP7 Affärssystem ABOn April 9, Vitec acquired all of the shares and voting rights of the Swedish software company, PP7 Affärssystem AB. The company develops software for project companies operating within the construction and installation market in Sweden. Its main product is cloud-based software for project and busi-ness support that optimizes project flows and procedures.
The company was consolidated as of the acquisition date. The goodwill item is not tax deductible and is deemed to be attributable to anticipated profitability, complementary ex-pertise requirements, as well as anticipated synergy effects, in the form of the joint development of our products. At De-cember 31, acquisition-related costs totaled SEK 0.1 million and were recognized as other external costs in the statement of comprehensive income. From the acquisition date up to and including December 31, revenues in the acquired compa-ny totaled SEK 5.8 million and profit before tax totaled SEK
0.9 million. If consolidation had occurred at the beginning of the year, the company would have provided the Group with an additional approximately SEK 1.8 million in sales and SEK -0.1 million in loss before tax.
Some items in the acquisition plan may be remeasured These comprise brands, product rights, customer agreements and goodwill. For this reason, the acquisition plan remains preliminary, until 12 months after the acquisition date.
The expensed portion of contingent consideration totaling SEK 4.0 million was subject to an EBITDA improvement at December 31, 2018. At the balance-sheet date, supplemen-tary conditions had not been fulfilled, which resulted in the supplementary contingent consideration being written off in its entirety. This adjustment was proportionally distributed across brands, product rights, customer agreements and goodwill.
PRELIMINARY ACQUISITION PLAN
PP7 Affärssystem AB
Fair value adjustment
Fair value recognized in the
Group
Brands - 162 162
Product rights - 1,651 1,651
Customer agreements - 2,257 2,257
Intangible fixed assets 341 - 341
Tangible property, plant and equipment 4 - 4
Current receivables 2,121 - 2,121
Cash and cash equivalents 4,204 - 4,204
Deferred tax liabilities - -912 -912
Current liabilities -2,200 - -2,200
Non-current liabilities -600 - -600
Net identifiable assets and liabilities 3,869 3,158 7,027
Consolidated goodwill 3,773
Total 10,800
Group’s purchase costs 10,800
Calculation of net cash outflow Fair value
Group’s purchase costs -10,800
Expensed portion of purchase consideration 1,000
Acquired cash and cash equivalents 4,204
Net cash outflow -5,596

76 Vitec Annual Report 2018
Agrando ASOn April 19, Vitec acquired 97.2% of the shares and voting rights of the Norwegian software Group, Agrando AS. Shortly thereafter, its remaining shares and votes were acquired. The company's product is an industry-specific software for churching activities in the Nordic region, with Norway and Sweden comprising the primary markets.
The Group was consolidated as of the acquisition date. The goodwill item is not tax deductible and is deemed to be attributable to anticipated profitability, complementary ex-pertise requirements, as well as anticipated synergy effects, in the form of the joint development of our products. At De-cember 31, acquisition-related costs totaled SEK 2.0 million
and were recognized as other external costs in the statement of comprehensive income. From the acquisition date up to and including December 31, the revenues of the acquired Group totaled SEK 31.0 million and profit before tax was SEK 4.0 million. If consolidation had occurred at the beginning of the year, the Group would have been provided with a further approximately SEK 14.7 million in sales and SEK 0.6 million in profit before tax.
Some items in the acquisition plan may be remeasured These comprise brands, product rights, customer agreements and goodwill. For this reason, the acquisition plan remains preliminary, until 12 months after the acquisition date.
PRELIMINARY ACQUISITION PLAN
Agrando ASFair value
adjustment
Fair value recognized in the
Group
Brands - 1,501 1,501
Product rights - 13,709 13,709
Customer agreements - 21,160 21,160
Tangible property, plant and equipment 214 - 214
Financial fixed assets 45 - 45
Current receivables 3,481 - 3,481
Cash and cash equivalents 61,174 - 61,174
Deferred tax liabilities - -8,365 -8,365
Current liabilities -34,774 -1,522 -36,297
Net identifiable assets and liabilities 30,140 26,483 56,622
Consolidated goodwill 21,936
Total 78,558
Group’s purchase costs 78,558
Calculation of net cash outflow Fair value
Group’s purchase costs -78,558
Acquired cash and cash equivalents 61,174
Net cash outflow -17,385
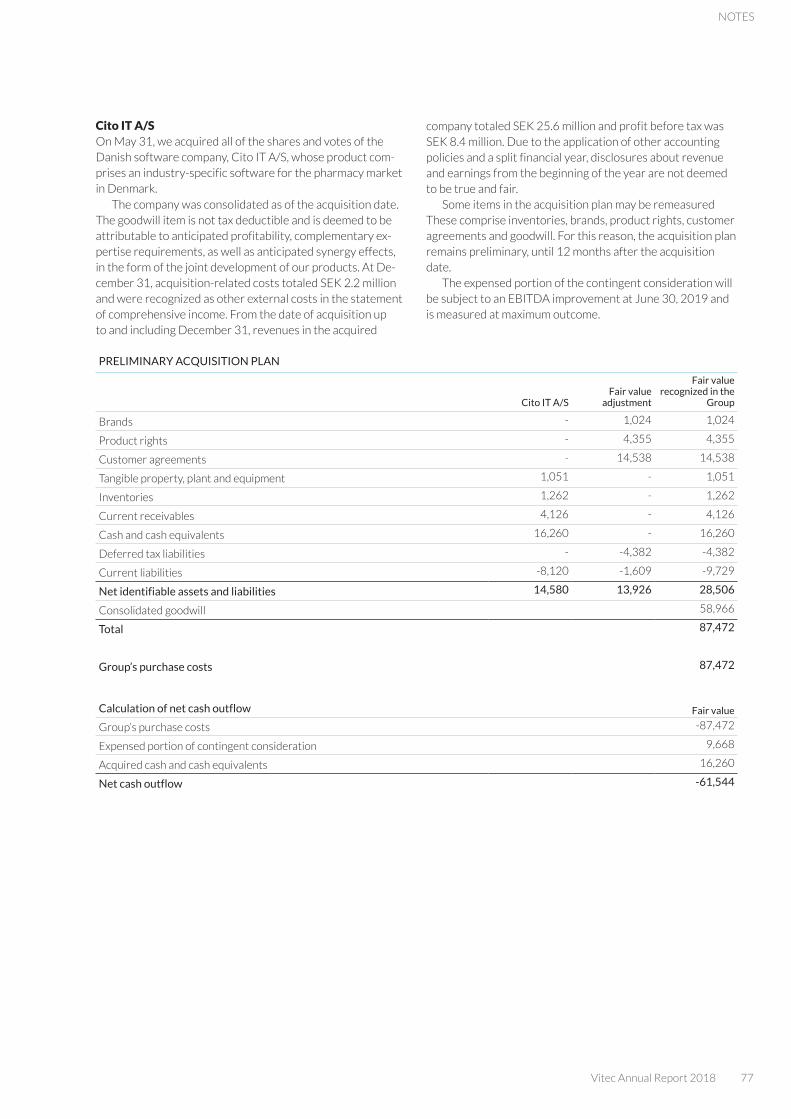
Vitec Annual Report 2018 77
NOTES
Cito IT A/SOn May 31, we acquired all of the shares and votes of the Danish software company, Cito IT A/S, whose product com-prises an industry-specific software for the pharmacy market in Denmark.
The company was consolidated as of the acquisition date. The goodwill item is not tax deductible and is deemed to be attributable to anticipated profitability, complementary ex-pertise requirements, as well as anticipated synergy effects, in the form of the joint development of our products. At De-cember 31, acquisition-related costs totaled SEK 2.2 million and were recognized as other external costs in the statement of comprehensive income. From the date of acquisition up to and including December 31, revenues in the acquired
company totaled SEK 25.6 million and profit before tax was SEK 8.4 million. Due to the application of other accounting policies and a split financial year, disclosures about revenue and earnings from the beginning of the year are not deemed to be true and fair.
Some items in the acquisition plan may be remeasured These comprise inventories, brands, product rights, customer agreements and goodwill. For this reason, the acquisition plan remains preliminary, until 12 months after the acquisition date.
The expensed portion of the contingent consideration will be subject to an EBITDA improvement at June 30, 2019 and is measured at maximum outcome.
PRELIMINARY ACQUISITION PLAN
Cito IT A/SFair value
adjustment
Fair value recognized in the
Group
Brands - 1,024 1,024
Product rights - 4,355 4,355
Customer agreements - 14,538 14,538
Tangible property, plant and equipment 1,051 - 1,051
Inventories 1,262 - 1,262
Current receivables 4,126 - 4,126
Cash and cash equivalents 16,260 - 16,260
Deferred tax liabilities - -4,382 -4,382
Current liabilities -8,120 -1,609 -9,729
Net identifiable assets and liabilities 14,580 13,926 28,506
Consolidated goodwill 58,966
Total 87,472
Group’s purchase costs 87,472
Calculation of net cash outflow Fair value
Group’s purchase costs -87,472
Expensed portion of contingent consideration 9,668
Acquired cash and cash equivalents 16,260
Net cash outflow -61,544
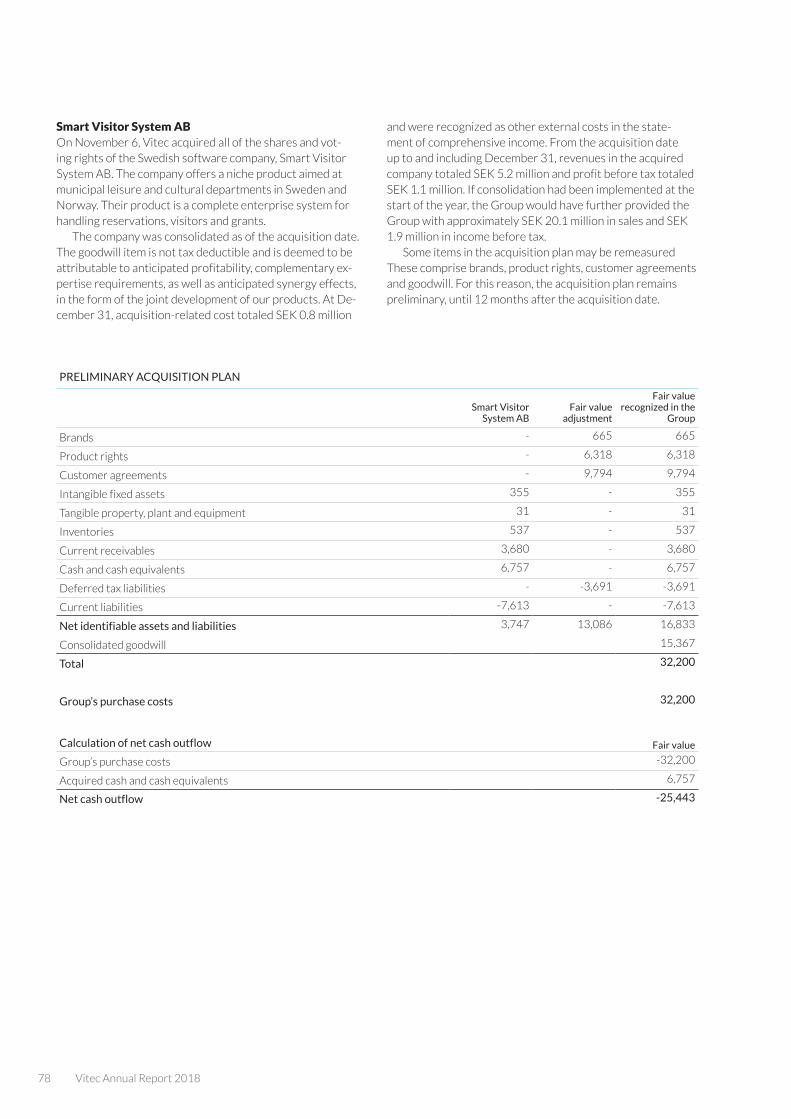
78 Vitec Annual Report 2018
Smart Visitor System ABOn November 6, Vitec acquired all of the shares and vot-ing rights of the Swedish software company, Smart Visitor System AB. The company offers a niche product aimed at municipal leisure and cultural departments in Sweden and Norway. Their product is a complete enterprise system for handling reservations, visitors and grants.
The company was consolidated as of the acquisition date. The goodwill item is not tax deductible and is deemed to be attributable to anticipated profitability, complementary ex-pertise requirements, as well as anticipated synergy effects, in the form of the joint development of our products. At De-cember 31, acquisition-related cost totaled SEK 0.8 million
and were recognized as other external costs in the state-ment of comprehensive income. From the acquisition date up to and including December 31, revenues in the acquired company totaled SEK 5.2 million and profit before tax totaled SEK 1.1 million. If consolidation had been implemented at the start of the year, the Group would have further provided the Group with approximately SEK 20.1 million in sales and SEK 1.9 million in income before tax.
Some items in the acquisition plan may be remeasured These comprise brands, product rights, customer agreements and goodwill. For this reason, the acquisition plan remains preliminary, until 12 months after the acquisition date.
PRELIMINARY ACQUISITION PLAN
Smart Visitor System AB
Fair value adjustment
Fair value recognized in the
Group
Brands - 665 665
Product rights - 6,318 6,318
Customer agreements - 9,794 9,794
Intangible fixed assets 355 - 355
Tangible property, plant and equipment 31 - 31
Inventories 537 - 537
Current receivables 3,680 - 3,680
Cash and cash equivalents 6,757 - 6,757
Deferred tax liabilities - -3,691 -3,691
Current liabilities -7,613 - -7,613
Net identifiable assets and liabilities 3,747 13,086 16,833
Consolidated goodwill 15,367
Total 32,200
Group’s purchase costs 32,200
Calculation of net cash outflow Fair value
Group’s purchase costs -32,200
Acquired cash and cash equivalents 6,757
Net cash outflow -25,443
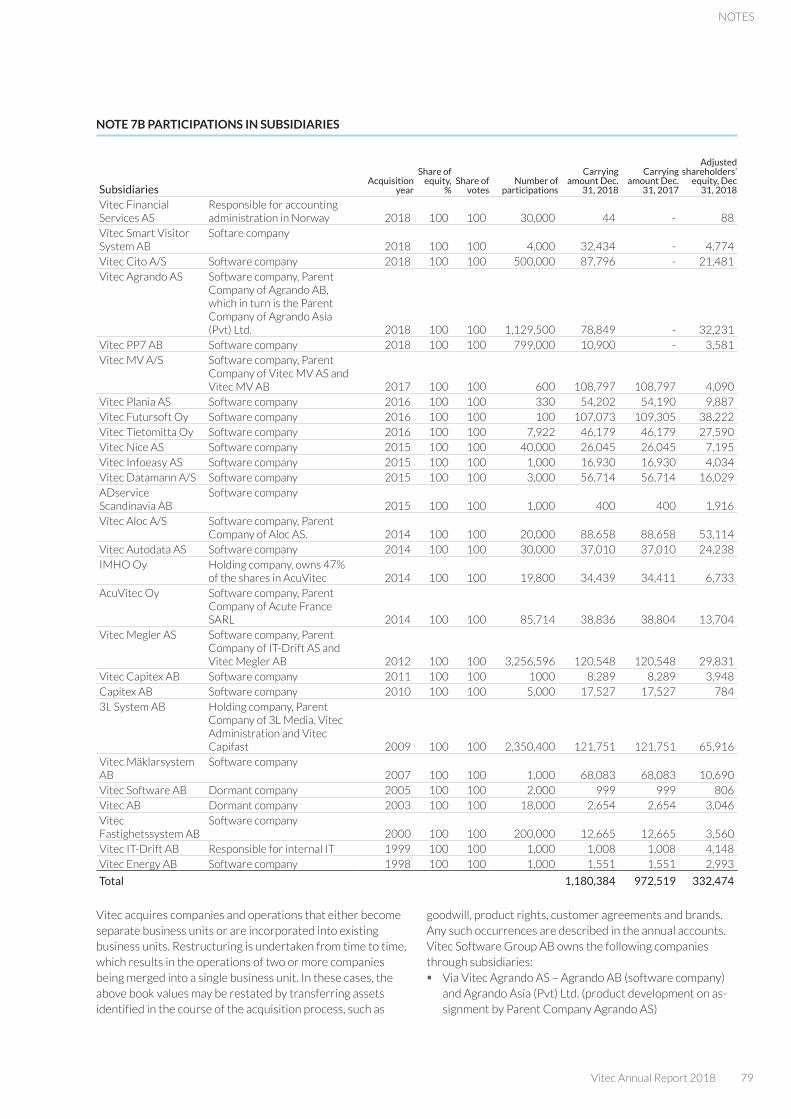
Vitec Annual Report 2018 79
NOTES
NOTE 7B PARTICIPATIONS IN SUBSIDIARIES
SubsidiariesAcquisition
year
Share of equity,
%Share of
votesNumber of
participations
Carrying amount Dec.
31, 2018
Carrying amount Dec.
31, 2017
Adjusted shareholders’
equity, Dec 31, 2018
Vitec Financial Services AS
Responsible for accounting administration in Norway 2018 100 100 30,000 44 - 88
Vitec Smart Visitor System AB
Softare company2018 100 100 4,000 32,434 - 4,774
Vitec Cito A/S Software company 2018 100 100 500,000 87,796 - 21,481Vitec Agrando AS Software company, Parent
Company of Agrando AB, which in turn is the Parent Company of Agrando Asia (Pvt) Ltd. 2018 100 100 1,129,500 78,849 - 32,231
Vitec PP7 AB Software company 2018 100 100 799,000 10,900 - 3,581Vitec MV A/S Software company, Parent
Company of Vitec MV AS and Vitec MV AB 2017 100 100 600 108,797 108,797 4,090
Vitec Plania AS Software company 2016 100 100 330 54,202 54,190 9,887Vitec Futursoft Oy Software company 2016 100 100 100 107,073 109,305 38,222Vitec Tietomitta Oy Software company 2016 100 100 7,922 46,179 46,179 27,590Vitec Nice AS Software company 2015 100 100 40,000 26,045 26,045 7,195Vitec Infoeasy AS Software company 2015 100 100 1,000 16,930 16,930 4,034Vitec Datamann A/S Software company 2015 100 100 3,000 56,714 56,714 16,029ADservice Scandinavia AB
Software company2015 100 100 1,000 400 400 1,916
Vitec Aloc A/S Software company, Parent Company of Aloc AS. 2014 100 100 20,000 88,658 88,658 53,114
Vitec Autodata AS Software company 2014 100 100 30,000 37,010 37,010 24,238IMHO Oy Holding company, owns 47%
of the shares in AcuVitec 2014 100 100 19,800 34,439 34,411 6,733AcuVitec Oy Software company, Parent
Company of Acute France SARL 2014 100 100 85,714 38,836 38,804 13,704
Vitec Megler AS Software company, Parent Company of IT-Drift AS and Vitec Megler AB 2012 100 100 3,256,596 120,548 120,548 29,831
Vitec Capitex AB Software company 2011 100 100 1000 8,289 8,289 3,948Capitex AB Software company 2010 100 100 5,000 17,527 17,527 7843L System AB Holding company, Parent
Company of 3L Media, Vitec Administration and Vitec Capifast 2009 100 100 2,350,400 121,751 121,751 65,916
Vitec Mäklarsystem AB
Software company2007 100 100 1,000 68,083 68,083 10,690
Vitec Software AB Dormant company 2005 100 100 2,000 999 999 806Vitec AB Dormant company 2003 100 100 18,000 2,654 2,654 3,046Vitec Fastighetssystem AB
Software company2000 100 100 200,000 12,665 12,665 3,560
Vitec IT-Drift AB Responsible for internal IT 1999 100 100 1,000 1,008 1,008 4,148Vitec Energy AB Software company 1998 100 100 1,000 1,551 1,551 2,993
Total 1,180,384 972,519 332,474
Vitec acquires companies and operations that either become separate business units or are incorporated into existing business units. Restructuring is undertaken from time to time, which results in the operations of two or more companies being merged into a single business unit. In these cases, the above book values may be restated by transferring assets identified in the course of the acquisition process, such as
goodwill, product rights, customer agreements and brands. Any such occurrences are described in the annual accounts. Vitec Software Group AB owns the following companies through subsidiaries:
� Via Vitec Agrando AS – Agrando AB (software company) and Agrando Asia (Pvt) Ltd. (product development on as-signment by Parent Company Agrando AS)
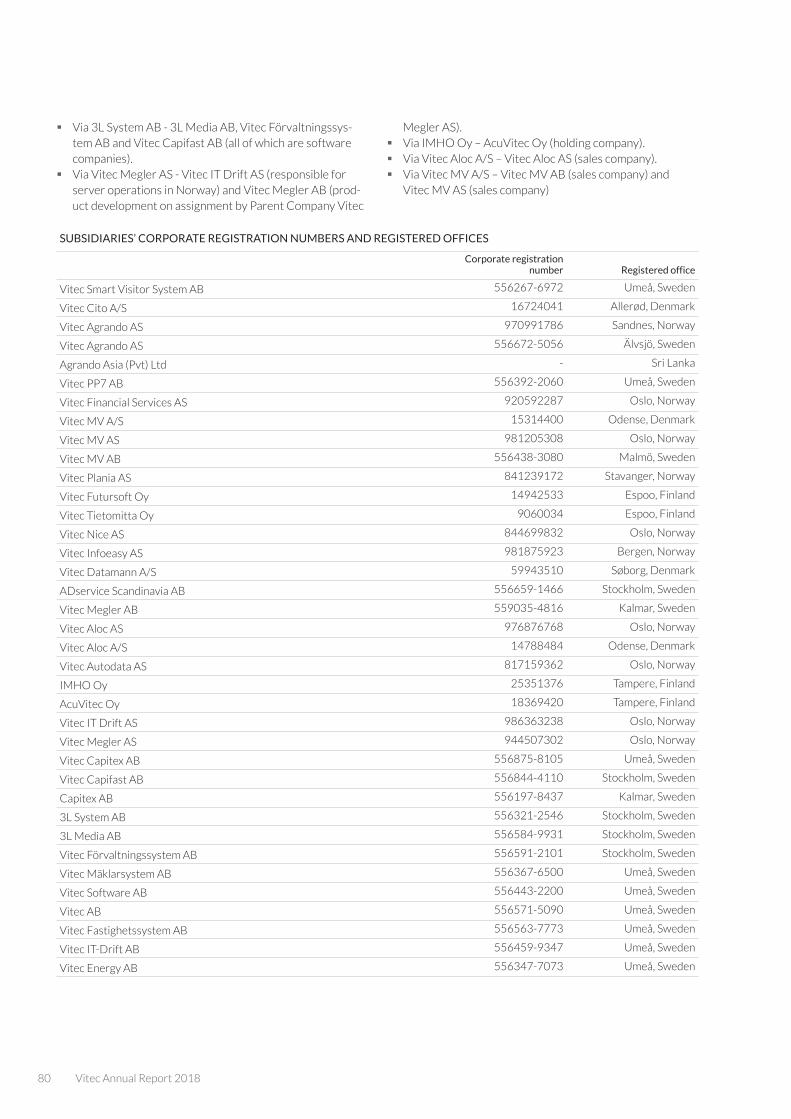
80 Vitec Annual Report 2018
� Via 3L System AB - 3L Media AB, Vitec Förvaltningssys-tem AB and Vitec Capifast AB (all of which are software companies).
� Via Vitec Megler AS - Vitec IT Drift AS (responsible for server operations in Norway) and Vitec Megler AB (prod-uct development on assignment by Parent Company Vitec
Megler AS). � Via IMHO Oy – AcuVitec Oy (holding company). � Via Vitec Aloc A/S – Vitec Aloc AS (sales company). � Via Vitec MV A/S – Vitec MV AB (sales company) and
Vitec MV AS (sales company)
SUBSIDIARIES’ CORPORATE REGISTRATION NUMBERS AND REGISTERED OFFICES
Corporate registration number Registered office
Vitec Smart Visitor System AB 556267-6972 Umeå, Sweden
Vitec Cito A/S 16724041 Allerød, Denmark
Vitec Agrando AS 970991786 Sandnes, Norway
Vitec Agrando AS 556672-5056 Älvsjö, Sweden
Agrando Asia (Pvt) Ltd - Sri Lanka
Vitec PP7 AB 556392-2060 Umeå, Sweden
Vitec Financial Services AS 920592287 Oslo, Norway
Vitec MV A/S 15314400 Odense, Denmark
Vitec MV AS 981205308 Oslo, Norway
Vitec MV AB 556438-3080 Malmö, Sweden
Vitec Plania AS 841239172 Stavanger, Norway
Vitec Futursoft Oy 14942533 Espoo, Finland
Vitec Tietomitta Oy 9060034 Espoo, Finland
Vitec Nice AS 844699832 Oslo, Norway
Vitec Infoeasy AS 981875923 Bergen, Norway
Vitec Datamann A/S 59943510 Søborg, Denmark
ADservice Scandinavia AB 556659-1466 Stockholm, Sweden
Vitec Megler AB 559035-4816 Kalmar, Sweden
Vitec Aloc AS 976876768 Oslo, Norway
Vitec Aloc A/S 14788484 Odense, Denmark
Vitec Autodata AS 817159362 Oslo, Norway
IMHO Oy 25351376 Tampere, Finland
AcuVitec Oy 18369420 Tampere, Finland
Vitec IT Drift AS 986363238 Oslo, Norway
Vitec Megler AS 944507302 Oslo, Norway
Vitec Capitex AB 556875-8105 Umeå, Sweden
Vitec Capifast AB 556844-4110 Stockholm, Sweden
Capitex AB 556197-8437 Kalmar, Sweden
3L System AB 556321-2546 Stockholm, Sweden
3L Media AB 556584-9931 Stockholm, Sweden
Vitec Förvaltningssystem AB 556591-2101 Stockholm, Sweden
Vitec Mäklarsystem AB 556367-6500 Umeå, Sweden
Vitec Software AB 556443-2200 Umeå, Sweden
Vitec AB 556571-5090 Umeå, Sweden
Vitec Fastighetssystem AB 556563-7773 Umeå, Sweden
Vitec IT-Drift AB 556459-9347 Umeå, Sweden
Vitec Energy AB 556347-7073 Umeå, Sweden
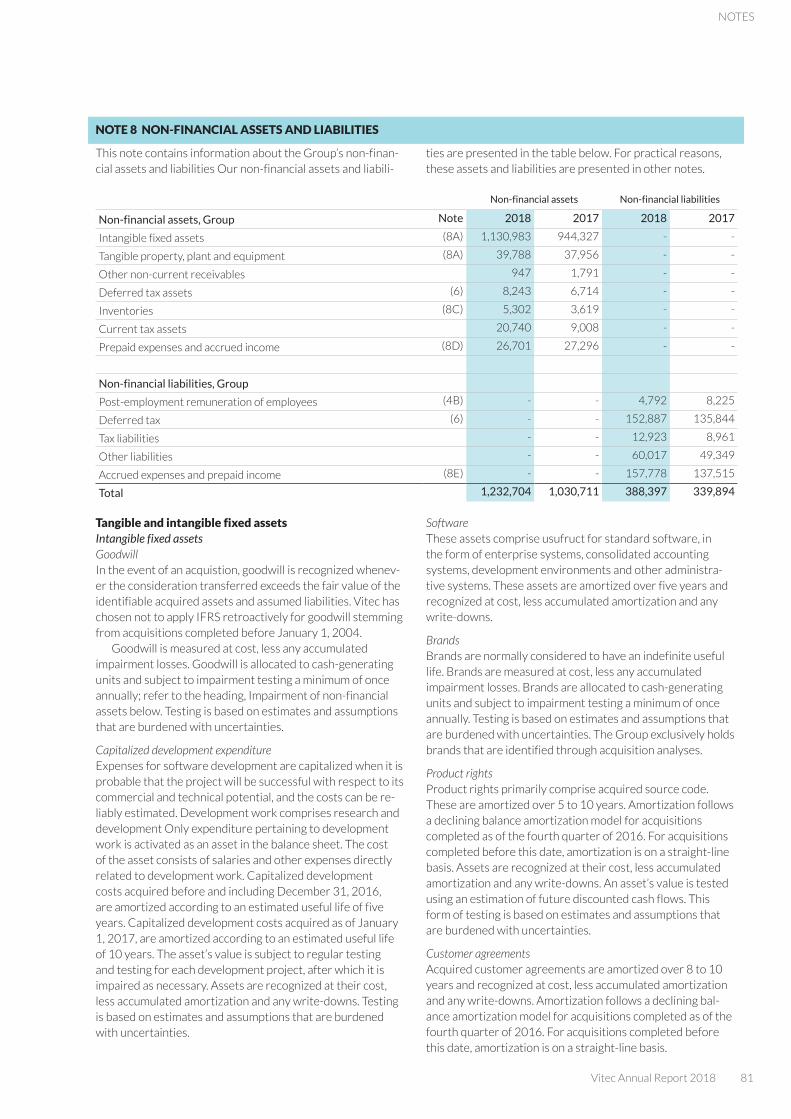
Vitec Annual Report 2018 81
NOTES
NOTE 8 NON-FINANCIAL ASSETS AND LIABILITIES
This note contains information about the Group’s non-finan-cial assets and liabilities Our non-financial assets and liabili-
ties are presented in the table below. For practical reasons, these assets and liabilities are presented in other notes.
Non-financial assets Non-financial liabilities
Non-financial assets, Group Note 2018 2017 2018 2017
Intangible fixed assets (8A) 1,130,983 944,327 - -
Tangible property, plant and equipment (8A) 39,788 37,956 - -
Other non-current receivables 947 1,791 - -
Deferred tax assets (6) 8,243 6,714 - -
Inventories (8C) 5,302 3,619 - -
Current tax assets 20,740 9,008 - -
Prepaid expenses and accrued income (8D) 26,701 27,296 - -
Non-financial liabilities, Group
Post-employment remuneration of employees (4B) - - 4,792 8,225
Deferred tax (6) - - 152,887 135,844
Tax liabilities - - 12,923 8,961
Other liabilities - - 60,017 49,349
Accrued expenses and prepaid income (8E) - - 157,778 137,515
Total 1,232,704 1,030,711 388,397 339,894
Tangible and intangible fixed assetsIntangible fixed assetsGoodwillIn the event of an acquistion, goodwill is recognized whenev-er the consideration transferred exceeds the fair value of the identifiable acquired assets and assumed liabilities. Vitec has chosen not to apply IFRS retroactively for goodwill stemming from acquisitions completed before January 1, 2004.
Goodwill is measured at cost, less any accumulated impairment losses. Goodwill is allocated to cash-generating units and subject to impairment testing a minimum of once annually; refer to the heading, Impairment of non-financial assets below. Testing is based on estimates and assumptions that are burdened with uncertainties.
Capitalized development expenditureExpenses for software development are capitalized when it is probable that the project will be successful with respect to its commercial and technical potential, and the costs can be re-liably estimated. Development work comprises research and development Only expenditure pertaining to development work is activated as an asset in the balance sheet. The cost of the asset consists of salaries and other expenses directly related to development work. Capitalized development costs acquired before and including December 31, 2016, are amortized according to an estimated useful life of five years. Capitalized development costs acquired as of January 1, 2017, are amortized according to an estimated useful life of 10 years. The asset’s value is subject to regular testing and testing for each development project, after which it is impaired as necessary. Assets are recognized at their cost, less accumulated amortization and any write-downs. Testing is based on estimates and assumptions that are burdened with uncertainties.
SoftwareThese assets comprise usufruct for standard software, in the form of enterprise systems, consolidated accounting systems, development environments and other administra-tive systems. These assets are amortized over five years and recognized at cost, less accumulated amortization and any write-downs.
BrandsBrands are normally considered to have an indefinite useful life. Brands are measured at cost, less any accumulated impairment losses. Brands are allocated to cash-generating units and subject to impairment testing a minimum of once annually. Testing is based on estimates and assumptions that are burdened with uncertainties. The Group exclusively holds brands that are identified through acquisition analyses.
Product rightsProduct rights primarily comprise acquired source code. These are amortized over 5 to 10 years. Amortization follows a declining balance amortization model for acquisitions completed as of the fourth quarter of 2016. For acquisitions completed before this date, amortization is on a straight-line basis. Assets are recognized at their cost, less accumulated amortization and any write-downs. An asset’s value is tested using an estimation of future discounted cash flows. This form of testing is based on estimates and assumptions that are burdened with uncertainties.
Customer agreementsAcquired customer agreements are amortized over 8 to 10 years and recognized at cost, less accumulated amortization and any write-downs. Amortization follows a declining bal-ance amortization model for acquisitions completed as of the fourth quarter of 2016. For acquisitions completed before this date, amortization is on a straight-line basis.
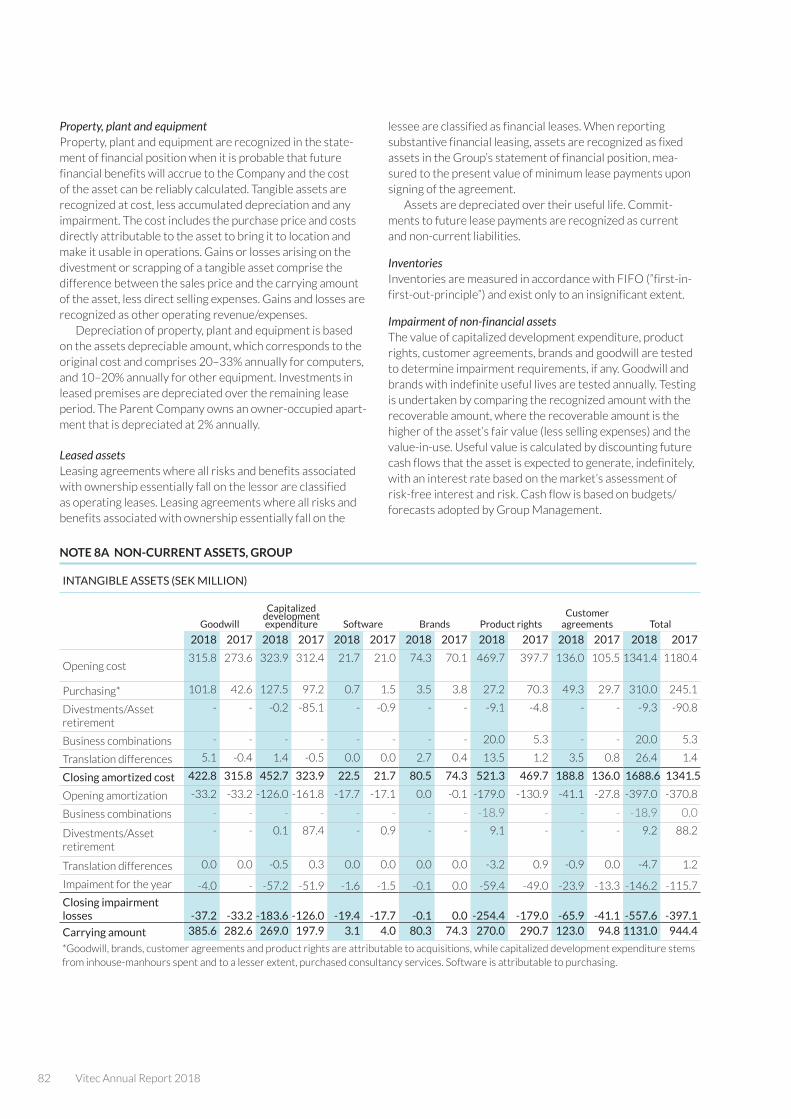
82 Vitec Annual Report 2018
Property, plant and equipmentProperty, plant and equipment are recognized in the state-ment of financial position when it is probable that future financial benefits will accrue to the Company and the cost of the asset can be reliably calculated. Tangible assets are recognized at cost, less accumulated depreciation and any impairment. The cost includes the purchase price and costs directly attributable to the asset to bring it to location and make it usable in operations. Gains or losses arising on the divestment or scrapping of a tangible asset comprise the difference between the sales price and the carrying amount of the asset, less direct selling expenses. Gains and losses are recognized as other operating revenue/expenses.
Depreciation of property, plant and equipment is based on the assets depreciable amount, which corresponds to the original cost and comprises 20–33% annually for computers, and 10–20% annually for other equipment. Investments in leased premises are depreciated over the remaining lease period. The Parent Company owns an owner-occupied apart-ment that is depreciated at 2% annually.
Leased assetsLeasing agreements where all risks and benefits associated with ownership essentially fall on the lessor are classified as operating leases. Leasing agreements where all risks and benefits associated with ownership essentially fall on the
lessee are classified as financial leases. When reporting substantive financial leasing, assets are recognized as fixed assets in the Group’s statement of financial position, mea-sured to the present value of minimum lease payments upon signing of the agreement.
Assets are depreciated over their useful life. Commit-ments to future lease payments are recognized as current and non-current liabilities.
InventoriesInventories are measured in accordance with FIFO (”first-in-first-out-principle”) and exist only to an insignificant extent.
Impairment of non-financial assetsThe value of capitalized development expenditure, product rights, customer agreements, brands and goodwill are tested to determine impairment requirements, if any. Goodwill and brands with indefinite useful lives are tested annually. Testing is undertaken by comparing the recognized amount with the recoverable amount, where the recoverable amount is the higher of the asset’s fair value (less selling expenses) and the value-in-use. Useful value is calculated by discounting future cash flows that the asset is expected to generate, indefinitely, with an interest rate based on the market’s assessment of risk-free interest and risk. Cash flow is based on budgets/forecasts adopted by Group Management.
NOTE 8A NON-CURRENT ASSETS, GROUP
INTANGIBLE ASSETS (SEK MILLION)
Goodwill
Capitalized development expenditure Software Brands Product rights
Customer agreements Total
2018 2017 2018 2017 2018 2017 2018 2017 2018 2017 2018 2017 2018 2017
Opening cost315.8 273.6 323.9 312.4 21.7 21.0 74.3 70.1 469.7 397.7 136.0 105.5 1341.4 1180.4
Purchasing* 101.8 42.6 127.5 97.2 0.7 1.5 3.5 3.8 27.2 70.3 49.3 29.7 310.0 245.1
Divestments/Asset retirement
- - -0.2 -85.1 - -0.9 - - -9.1 -4.8 - - -9.3 -90.8
Business combinations - - - - - - - - 20.0 5.3 - - 20.0 5.3
Translation differences 5.1 -0.4 1.4 -0.5 0.0 0.0 2.7 0.4 13.5 1.2 3.5 0.8 26.4 1.4
Closing amortized cost 422.8 315.8 452.7 323.9 22.5 21.7 80.5 74.3 521.3 469.7 188.8 136.0 1688.6 1341.5
Opening amortization -33.2 -33.2 -126.0 -161.8 -17.7 -17.1 0.0 -0.1 -179.0 -130.9 -41.1 -27.8 -397.0 -370.8
Business combinations - - - - - - - - -18.9 - - - -18.9 0.0
Divestments/Asset retirement
- - 0.1 87.4 - 0.9 - - 9.1 - - - 9.2 88.2
Translation differences 0.0 0.0 -0.5 0.3 0.0 0.0 0.0 0.0 -3.2 0.9 -0.9 0.0 -4.7 1.2
Impaiment for the year -4.0 - -57.2 -51.9 -1.6 -1.5 -0.1 0.0 -59.4 -49.0 -23.9 -13.3 -146.2 -115.7
Closing impairment losses -37.2 -33.2 -183.6 -126.0 -19.4 -17.7 -0.1 0.0 -254.4 -179.0 -65.9 -41.1 -557.6 -397.1
Carrying amount 385.6 282.6 269.0 197.9 3.1 4.0 80.3 74.3 270.0 290.7 123.0 94.8 1131.0 944.4
*Goodwill, brands, customer agreements and product rights are attributable to acquisitions, while capitalized development expenditure stems from inhouse-manhours spent and to a lesser extent, purchased consultancy services. Software is attributable to purchasing.
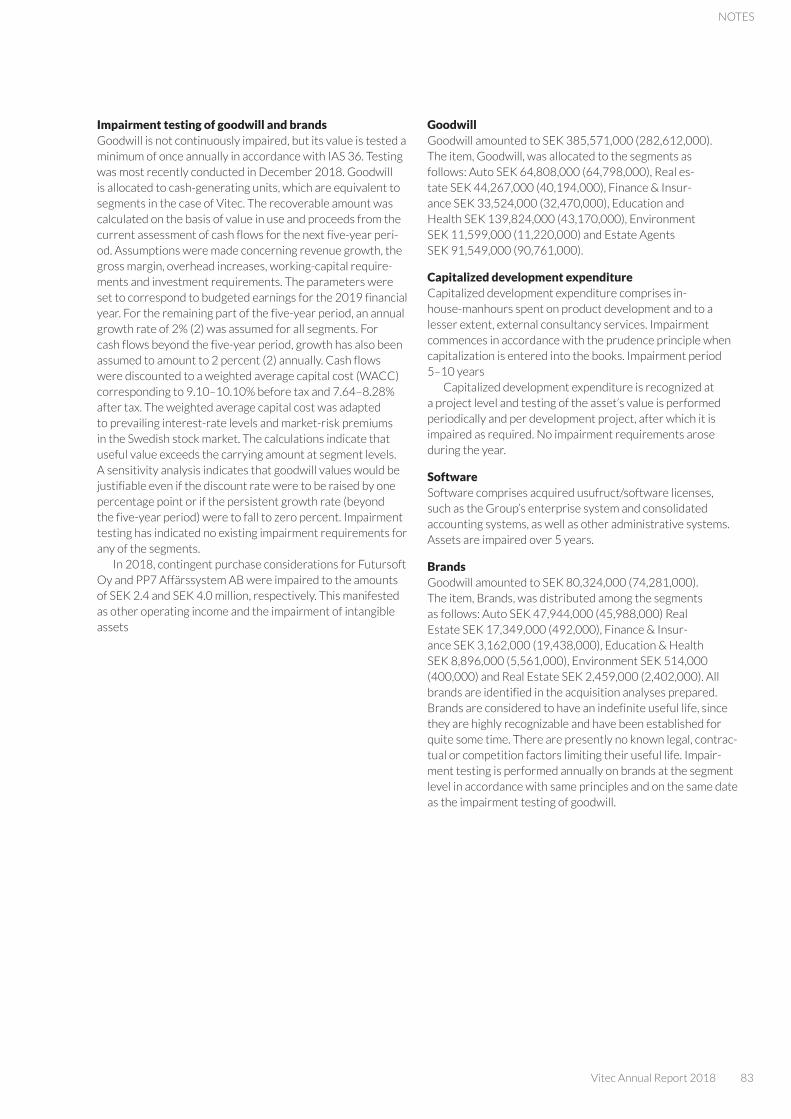
Vitec Annual Report 2018 83
NOTES
Impairment testing of goodwill and brandsGoodwill is not continuously impaired, but its value is tested a minimum of once annually in accordance with IAS 36. Testing was most recently conducted in December 2018. Goodwill is allocated to cash-generating units, which are equivalent to segments in the case of Vitec. The recoverable amount was calculated on the basis of value in use and proceeds from the current assessment of cash flows for the next five-year peri-od. Assumptions were made concerning revenue growth, the gross margin, overhead increases, working-capital require-ments and investment requirements. The parameters were set to correspond to budgeted earnings for the 2019 financial year. For the remaining part of the five-year period, an annual growth rate of 2% (2) was assumed for all segments. For cash flows beyond the five-year period, growth has also been assumed to amount to 2 percent (2) annually. Cash flows were discounted to a weighted average capital cost (WACC) corresponding to 9.10–10.10% before tax and 7.64–8.28% after tax. The weighted average capital cost was adapted to prevailing interest-rate levels and market-risk premiums in the Swedish stock market. The calculations indicate that useful value exceeds the carrying amount at segment levels. A sensitivity analysis indicates that goodwill values would be justifiable even if the discount rate were to be raised by one percentage point or if the persistent growth rate (beyond the five-year period) were to fall to zero percent. Impairment testing has indicated no existing impairment requirements for any of the segments.
In 2018, contingent purchase considerations for Futursoft Oy and PP7 Affärssystem AB were impaired to the amounts of SEK 2.4 and SEK 4.0 million, respectively. This manifested as other operating income and the impairment of intangible assets
GoodwillGoodwill amounted to SEK 385,571,000 (282,612,000). The item, Goodwill, was allocated to the segments as follows: Auto SEK 64,808,000 (64,798,000), Real es-tate SEK 44,267,000 (40,194,000), Finance & Insur-ance SEK 33,524,000 (32,470,000), Education and Health SEK 139,824,000 (43,170,000), Environment SEK 11,599,000 (11,220,000) and Estate Agents SEK 91,549,000 (90,761,000).
Capitalized development expenditure Capitalized development expenditure comprises in-house-manhours spent on product development and to a lesser extent, external consultancy services. Impairment commences in accordance with the prudence principle when capitalization is entered into the books. Impairment period 5–10 years
Capitalized development expenditure is recognized at a project level and testing of the asset’s value is performed periodically and per development project, after which it is impaired as required. No impairment requirements arose during the year.
SoftwareSoftware comprises acquired usufruct/software licenses, such as the Group’s enterprise system and consolidated accounting systems, as well as other administrative systems. Assets are impaired over 5 years.
BrandsGoodwill amounted to SEK 80,324,000 (74,281,000). The item, Brands, was distributed among the segments as follows: Auto SEK 47,944,000 (45,988,000) Real Estate SEK 17,349,000 (492,000), Finance & Insur-ance SEK 3,162,000 (19,438,000), Education & Health SEK 8,896,000 (5,561,000), Environment SEK 514,000 (400,000) and Real Estate SEK 2,459,000 (2,402,000). All brands are identified in the acquisition analyses prepared. Brands are considered to have an indefinite useful life, since they are highly recognizable and have been established for quite some time. There are presently no known legal, contrac-tual or competition factors limiting their useful life. Impair-ment testing is performed annually on brands at the segment level in accordance with same principles and on the same date as the impairment testing of goodwill.

84 Vitec Annual Report 2018
Customer agreementsCustomer agreements are identified through acquisition analyses. Their impairment period is 8–10 years. The useful life of customer agreements is based on how long net pay-ments can be expected to be received from these agree-ments, taking into account legal and economic factors. The amortized cost of customer agreements, residual values and remaining impairment period amounted to:
CUSTOMER AGREEMENTS
Amortized cost (SEK
thousand)
Residual value (SEK thousand)
Remaining im-pairment period
(years)
Auto
Autodata 10,950 4,258 3.3
Infoeasy 1,378 866 6.5
Datamann 11,472 8,298 6.5
Futursoft 14,277 12,070 7.7
Real Estate
PP7 3,818 1,713 9.3
Plania 6,761 4,985 7.9
Finance & Insurance
Aloc 8,550 4,173 3.5
Nice 4,435 3,118 6.9
Environment
Tietomitta 4,936 4,046 7.5
Estate Agents
Megler 11,284 4,737 6.2
Adservice 204 126 6.2
Education & Health
AcuVitec 21,392 11,750 3.2
MV 29676 23,224 8.5
Agrando 21,160 17,179 9.3
Cito 14,538 12,879 9.4
Actor 9,794 9,484 9.8
Product rightsProduct rights comprise acquired product rights. Their impairment period is 5–10 years. The previously adopted useful life of five years for product rights has been deemed to be unfair. Although our history demonstrates that useful lives exceed ten years, we have found a logical conformity between our proprietarily developed software/capitalized development expenditure and the software/product rights that we acquire, and have therefore adopted an impairment period 10 years for both classes of assets. Impairment is implemented in accordance with a declining-balance amortization model, which is deemed to reflect actual usage in a more relevant manner, since product rights consist of several components, with each component presumably has a service life of 3 to 20 years. The declining-balance amortization model entails a higher impairment rate at the beginning of useful life. The declining balance amortization method has been applied as of the fourth quarter of 2016. For acquisitions completed before this date, amortization is on a straight-line basis.
The cost, residual value and remaining impairment period for product rights of material value amounted to:
PRODUCT RIGHTS
Amortized cost (SEK
thousand)
Residual value (SEK thousand)
Remaining impairment
period (years)
Auto
Autodata 17,873 8,893 5.3
Infoeasy 10,739 6,744 6.5
Datamann 30,589 22,126 6.5
Futursoft 21,377 12,999 7.7
Real Estate
PP7 2,794 1,253 9.3
Plania 15,822 8,644 7.9
3L System 25,500 1,351 1
Capitex 5,859 878 1.5
Finance & Insurance
Capitex 8,091 1,217 1.5
Aloc 47,914 29,392 5.5
Nice 15,019 10,558 6.9
Environment
Tietomitta 18,061 14,802 7.5
Estate Agents
Mäklarsystem 15,700 0 0
Capitex 13,950 2,090 1.5
Megler 59,728 20,083 6.2
Education & Health
AcuVitec 72,763 51,578 5.2
MV 67,509 52,833 8.5
Agrando 13,709 11,130 9.3
Cito 4,355 3,858 9.4
Actor 6,318 6,118 9.8
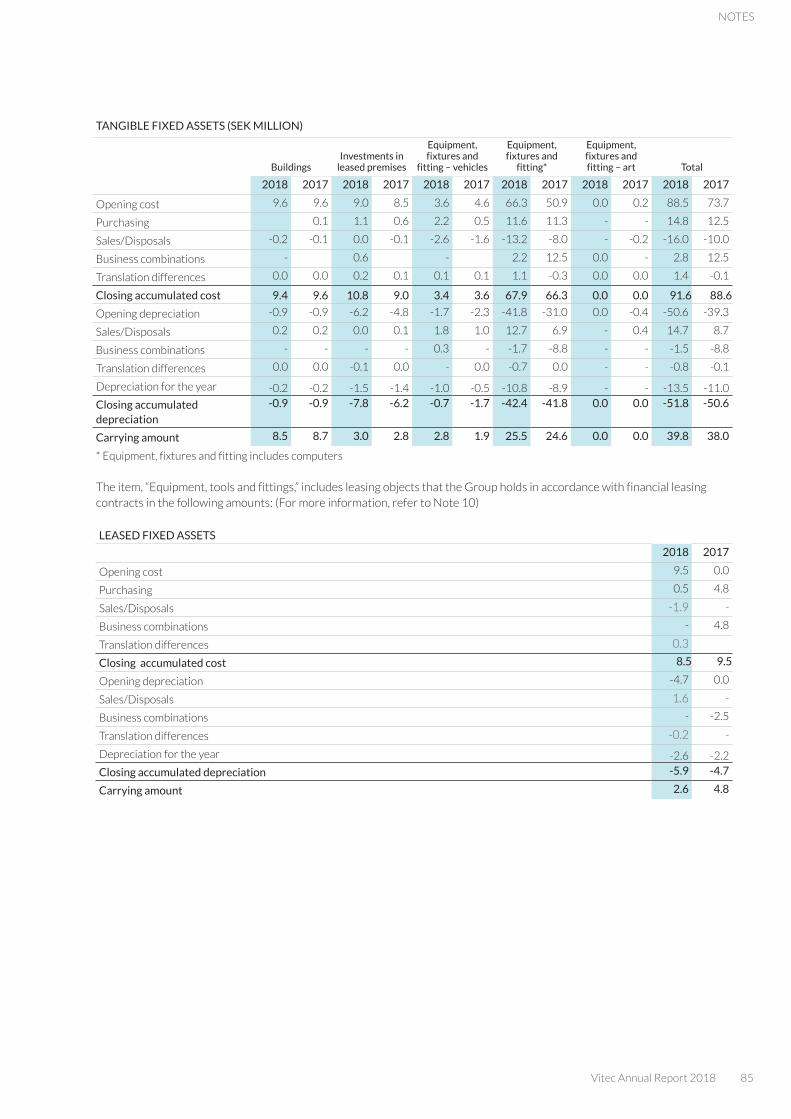
Vitec Annual Report 2018 85
NOTES
TANGIBLE FIXED ASSETS (SEK MILLION)
BuildingsInvestments in
leased premises
Equipment, fixtures and
fitting – vehicles
Equipment, fixtures and
fitting*
Equipment, fixtures and fitting – art Total
2018 2017 2018 2017 2018 2017 2018 2017 2018 2017 2018 2017
Opening cost 9.6 9.6 9.0 8.5 3.6 4.6 66.3 50.9 0.0 0.2 88.5 73.7
Purchasing 0.1 1.1 0.6 2.2 0.5 11.6 11.3 - - 14.8 12.5
Sales/Disposals -0.2 -0.1 0.0 -0.1 -2.6 -1.6 -13.2 -8.0 - -0.2 -16.0 -10.0
Business combinations - 0.6 - 2.2 12.5 0.0 - 2.8 12.5
Translation differences 0.0 0.0 0.2 0.1 0.1 0.1 1.1 -0.3 0.0 0.0 1.4 -0.1
Closing accumulated cost 9.4 9.6 10.8 9.0 3.4 3.6 67.9 66.3 0.0 0.0 91.6 88.6
Opening depreciation -0.9 -0.9 -6.2 -4.8 -1.7 -2.3 -41.8 -31.0 0.0 -0.4 -50.6 -39.3
Sales/Disposals 0.2 0.2 0.0 0.1 1.8 1.0 12.7 6.9 - 0.4 14.7 8.7
Business combinations - - - - 0.3 - -1.7 -8.8 - - -1.5 -8.8
Translation differences 0.0 0.0 -0.1 0.0 - 0.0 -0.7 0.0 - - -0.8 -0.1
Depreciation for the year -0.2 -0.2 -1.5 -1.4 -1.0 -0.5 -10.8 -8.9 - - -13.5 -11.0
Closing accumulated depreciation
-0.9 -0.9 -7.8 -6.2 -0.7 -1.7 -42.4 -41.8 0.0 0.0 -51.8 -50.6
Carrying amount 8.5 8.7 3.0 2.8 2.8 1.9 25.5 24.6 0.0 0.0 39.8 38.0
* Equipment, fixtures and fitting includes computers
The item, “Equipment, tools and fittings,” includes leasing objects that the Group holds in accordance with financial leasing contracts in the following amounts: (For more information, refer to Note 10)
LEASED FIXED ASSETS
2018 2017
Opening cost 9.5 0.0
Purchasing 0.5 4.8
Sales/Disposals -1.9 -
Business combinations - 4.8
Translation differences 0.3
Closing accumulated cost 8.5 9.5
Opening depreciation -4.7 0.0
Sales/Disposals 1.6 -
Business combinations - -2.5
Translation differences -0.2 -
Depreciation for the year -2.6 -2.2
Closing accumulated depreciation -5.9 -4.7
Carrying amount 2.6 4.8

86 Vitec Annual Report 2018
NOTE 8B PARENT COMPANY NON-CURRENT ASSETS
INTANGIBLE ASSETS (SEK MILLION)
Software Product rights Total
2018 2017 2018 2017 2018 2017
Opening cost 9.7 8.9 9.7 9.7 19.5 18.6
Purchasing 0.6 0.9 - - 0.6 0.9
Divestments/Asset retirement - - -9.1 - -9.1 -
Closing cost 10.3 9.7 0.6 9.7 10.9 19.5
Opening impairment losses -6.4 -5.0 -9.7 -9.7 -16.2 -14.7
Sales/Asset retirement - - 9.1 - 9.1 -
Impairment for the year -1.5 -1.4 - -0.1 -1.5 -1.5
Closing impairment losses -7.9 -6.4 -0.6 -9.7 -8.5 -16.2
Carrying amount 2.4 3.3 0.0 0.0 2.4 3.3
TANGIBLE ASSETS (SEK MILLION)
BuildingsInvestments in leased
premisesEquipment, fixtures and
fitting* Total
2018 2017 2018 2017 2018 2017 2018 2017
Opening cost 9.3 9.3 2.8 2.5 3.7 3.6 15.9 15.4
Purchasing - - 0.5 0.4 0.3 0.1 0.8 0.5
Closing accumulated cost 9.3 9.3 3.3 2.8 4.0 3.7 16.6 15.9
Opening depreciation -0.7 -0.5 -2.2 -1.6 -1.5 -1.2 -4.4 -3.3
Depreciation for the year -0.2 -0.2 -0.3 -0.6 -0.4 -0.3 -0.9 -1.1
Closing depreciation -0.9 -0.7 -2.5 -2.2 -1.9 -1.5 -5.3 -4.4
Carrying amount 8.4 8.6 0.8 0.6 2.1 2.2 11.3 11.4
* Equipment, fixtures and fitting includes computers.
FINANCIAL ASSETS (SEK MILLION)
Participations in subsidiaries 2018 2017
Opening cost 972.5 864.8
Acquisitions for the year 214.1 109.1
Adjustments to purchase consideration -6.2 -1.3
Divested - -
1,180.4 972.5
Other financial fixed assets
Deferred tax assets 2.9 0.1
Other financial receivables 5.7 7.7
Carrying amount 1,189.0 980.3
NOTE 8C INVENTORIES
Inventories comprise goods for resale and exist to an immaterial extent. The value at December 31, 2018 was SEK 5,302,000 (3,619,000).
Vitec Annual Report 2018 87
NOTES
NOTE 8D PREPAID EXPENSES AND ACCRUED INCOME
Group Parent Company
Dec 31, 2018
Dec 31, 2017
Dec 31, 2018
Dec 31, 2017
Deferred income 2,217 6,673 - -
Prepaid rent 5,571 4,307 2,203 2,062
Other prepaid expenses 18,914 16,316 2,142 1,487
Total 26,701 27,296 4,345 3,549
NOTE 8E ACCRUED EXPENSES AND PREPAID INCOME
Group Parent Company
Dec 31, 2018
Dec 31, 2017
Dec 31, 2018
Dec 31, 2017
Accrued salaries 40,548 37,590 2,894 2,385
Accrued special payroll tax 5,116 3,662 895 695
Prepaid income 135,805 117,061 - -
Social security expenses 16,857 16,792 909 749
Other accrued expenses 14,613 17,279 884 2,384
Total 212,939 192,384 5,582 6,213
Accrued salaries and other accrued expenses are classified as financial liabilities.
Odense officeGunvor Levik Berge, Sandnes

88 Vitec Annual Report 2018
NOTE 9 FINANCIAL ASSETS AND LIABILITIES
NoteFinancial assets measured at
amortized cost
Financial liabilities measured at fair value in the income
statementOther financial liabilities are measured at amortized cost
2018 2017 2018 2017 2018 2017
Financial assets, Group
Accounts receivable (9B) 201,297 172,450 - - - -
Other receivables 6,346 841 - - - -
Cash and cash equivalents (9C) 235,302 57,968 - - - -
Financial liabilities, Group
Convertible debentures (non-current) (9E) - - - - 39,828 38,789
Liabilities to credit institutions, non-current
(9F) - - - - 463,805 336,129
Liabilities to credit institutions, current (9F) - - - - 5,620 31,180
Other liabilities (non-current) - - - - 1,045 3,270
Other liabilities (current) - - 9,632 25,925 2,622 1,848
Accounts payable - - - - 39,910 31,902
Accrued expenses (8) - - - - 55,161 54,869
Total 442,945 231,259 9,632 25,925 607,991 497,987
Financial assetsThe Group’s financial assets comprise accounts receivable, other receivables, and cash and cash equivalents. Other receivables comprise tax accounts, current receivables for employees and other current assets.
Financial liabilitiesFinancial liabilities comprise convertible debentures, liabili-ties to credit institutions, other liabilities, accounts payable and components of accrued expenses.
Other liabilities comprise supplementary purchase con-siderations from acquisitions and financial leasing. Accounts payable are unsecured and are normally paid within 30 days. The fair value of accounts payable and other liabilities are deemed to correspond their carrying amount, since by na-ture, they are current. Financial accrued expenses comprise accrued salaries and other accrued expenses.
Recognition of financial assets and liabilitiesA financial asset or financial liability is recognized in the statement of financial position when the company becomes a contracting party in accordance with the instrument’s contractual conditions. A receivable is recognized when the company has performed and a contractual obligation exists for the counterparty to pay, even if an invoice has not yet been sent. Accounts receivable are recognized in the statement of financial position when an invoice has been sent. A liability is recognized when the counterparty has per-formed and a contractual obligation exists for the company to pay, even if an invoice has not yet been received. Accounts payable are recognized when an invoice has been received. A financial asset is derecognized from the statement of financial position when the contractual rights are realized, expire or the company loses control of them. The same applies to a portion of a financial asset. A financial liability is derecognized from the statement of financial position when the contractual obligation is met or terminated in another manner. The same
applies to portions of a financial liability.IFRS 9 Financial instruments came into force in 2018 and
deals with the recognition of financial liabilities and assets. Vitec has been applying the standard as of January 1, 2018. The standard comprises other measurement categories for financial assets and a new model for impairment testing. The primary impact of the standard pertains to a partially new process with respect to loan losses. Vitec has applied the transition prospectively. Having taken into account historical bad-debt losses over a business cycle, we can state that the new standard does not materially impact the consolidated financial statements.
Classification and measurement
In accordance with IFRS 9, a company must either classify financial assets at their amortized cost, at fair value through comprehensive income or at fair value through profit or loss, on the basis of both:
a) The company’s business model of administering financial assets.
b) The nature of contractual cash flows from the financial as-set.
Our financial assets comprise accounts receivable, other re-ceivables, and cash and cash equivalents. These are measured at amortized cost. We have no financial assets measured at fair value.
In accordance with IFRS 9, a company must classify financial liabilities at their amortized cost, with the exception of contingent considerations, which are to be classified at fair value.
Of our financial liabilities, accounts payable, accrued expenses and loan liabilities are classified as amortized costs. Supplementary contingent consideration from acquisitions are classified at fair value.
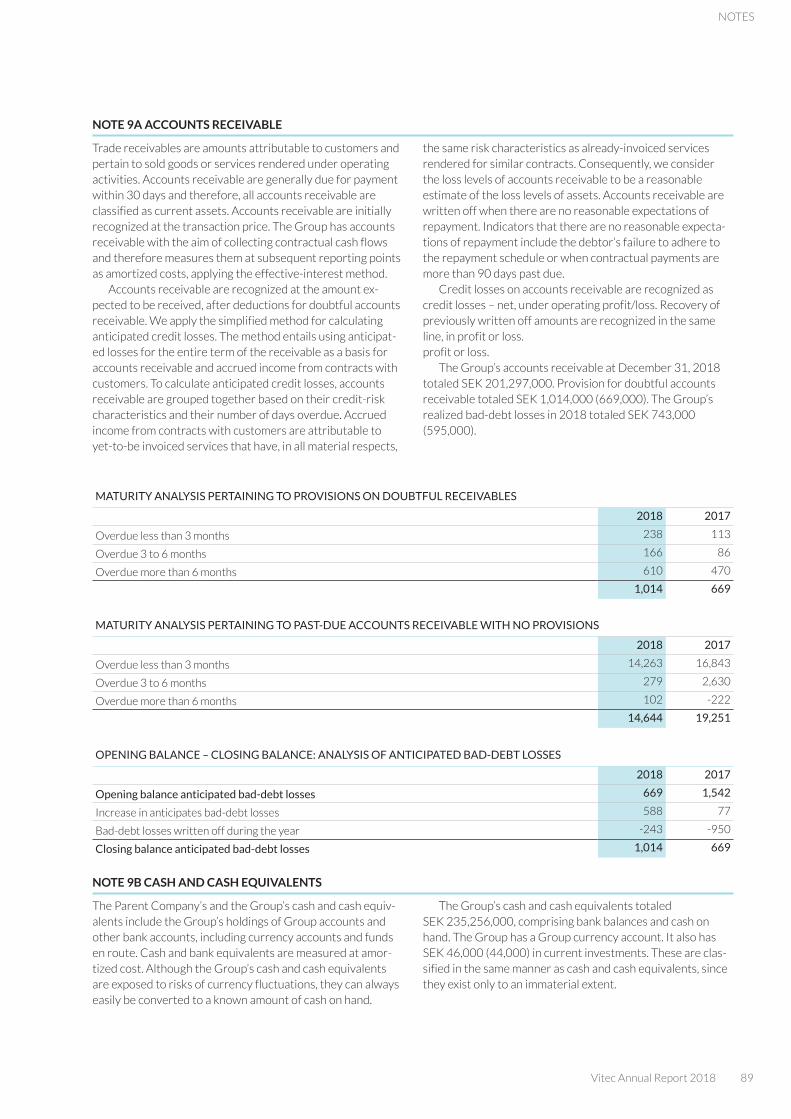
Vitec Annual Report 2018 89
NOTES
NOTE 9A ACCOUNTS RECEIVABLE
Trade receivables are amounts attributable to customers and pertain to sold goods or services rendered under operating activities. Accounts receivable are generally due for payment within 30 days and therefore, all accounts receivable are classified as current assets. Accounts receivable are initially recognized at the transaction price. The Group has accounts receivable with the aim of collecting contractual cash flows and therefore measures them at subsequent reporting points as amortized costs, applying the effective-interest method.
Accounts receivable are recognized at the amount ex-pected to be received, after deductions for doubtful accounts receivable. We apply the simplified method for calculating anticipated credit losses. The method entails using anticipat-ed losses for the entire term of the receivable as a basis for accounts receivable and accrued income from contracts with customers. To calculate anticipated credit losses, accounts receivable are grouped together based on their credit-risk characteristics and their number of days overdue. Accrued income from contracts with customers are attributable to yet-to-be invoiced services that have, in all material respects,
the same risk characteristics as already-invoiced services rendered for similar contracts. Consequently, we consider the loss levels of accounts receivable to be a reasonable estimate of the loss levels of assets. Accounts receivable are written off when there are no reasonable expectations of repayment. Indicators that there are no reasonable expecta-tions of repayment include the debtor’s failure to adhere to the repayment schedule or when contractual payments are more than 90 days past due.
Credit losses on accounts receivable are recognized as credit losses – net, under operating profit/loss. Recovery of previously written off amounts are recognized in the same line, in profit or loss.profit or loss.
The Group’s accounts receivable at December 31, 2018 totaled SEK 201,297,000. Provision for doubtful accounts receivable totaled SEK 1,014,000 (669,000). The Group’s realized bad-debt losses in 2018 totaled SEK 743,000 (595,000).
MATURITY ANALYSIS PERTAINING TO PROVISIONS ON DOUBTFUL RECEIVABLES
2018 2017
Overdue less than 3 months 238 113
Overdue 3 to 6 months 166 86
Overdue more than 6 months 610 470
1,014 669
MATURITY ANALYSIS PERTAINING TO PAST-DUE ACCOUNTS RECEIVABLE WITH NO PROVISIONS
2018 2017
Overdue less than 3 months 14,263 16,843
Overdue 3 to 6 months 279 2,630
Overdue more than 6 months 102 -222
14,644 19,251
OPENING BALANCE – CLOSING BALANCE: ANALYSIS OF ANTICIPATED BAD-DEBT LOSSES
2018 2017
Opening balance anticipated bad-debt losses 669 1,542
Increase in anticipates bad-debt losses 588 77
Bad-debt losses written off during the year -243 -950
Closing balance anticipated bad-debt losses 1,014 669
NOTE 9B CASH AND CASH EQUIVALENTS
The Parent Company’s and the Group’s cash and cash equiv-alents include the Group’s holdings of Group accounts and other bank accounts, including currency accounts and funds en route. Cash and bank equivalents are measured at amor-tized cost. Although the Group’s cash and cash equivalents are exposed to risks of currency fluctuations, they can always easily be converted to a known amount of cash on hand.
The Group’s cash and cash equivalents totaled SEK 235,256,000, comprising bank balances and cash on hand. The Group has a Group currency account. It also has SEK 46,000 (44,000) in current investments. These are clas-sified in the same manner as cash and cash equivalents, since they exist only to an immaterial extent.
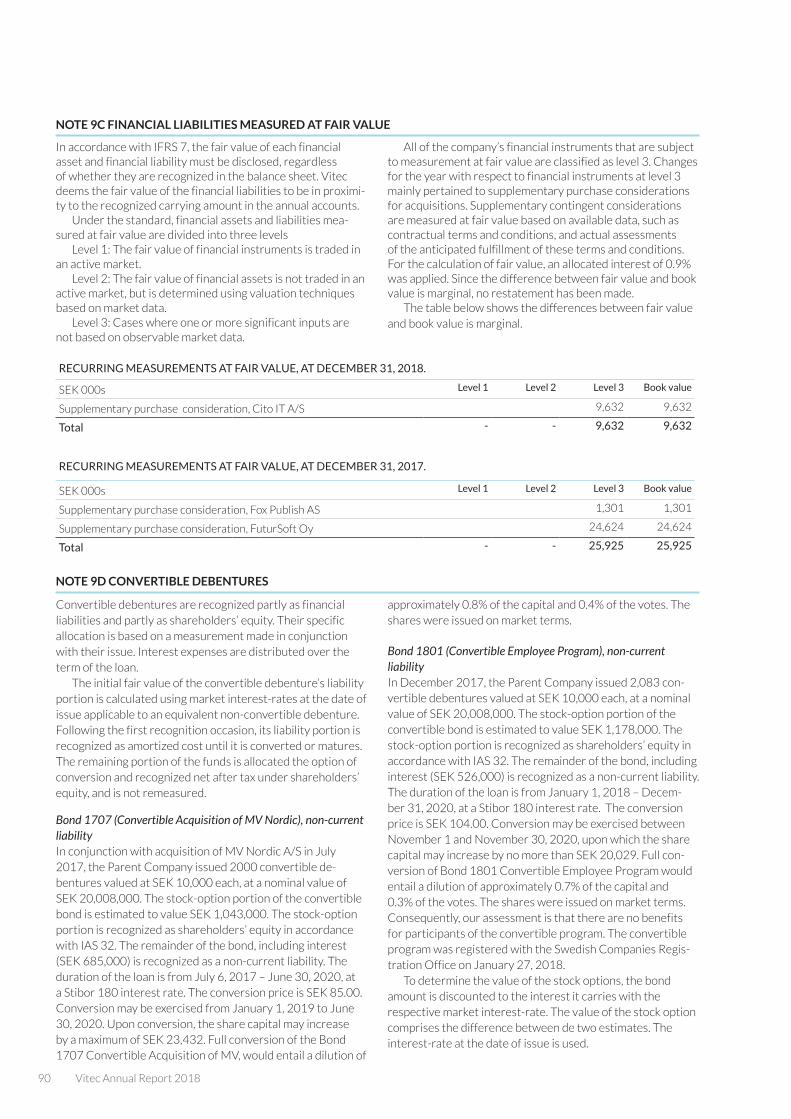
90 Vitec Annual Report 2018
NOTE 9C FINANCIAL LIABILITIES MEASURED AT FAIR VALUE
In accordance with IFRS 7, the fair value of each financial asset and financial liability must be disclosed, regardless of whether they are recognized in the balance sheet. Vitec deems the fair value of the financial liabilities to be in proximi-ty to the recognized carrying amount in the annual accounts.
Under the standard, financial assets and liabilities mea-sured at fair value are divided into three levels
Level 1: The fair value of financial instruments is traded in an active market.
Level 2: The fair value of financial assets is not traded in an active market, but is determined using valuation techniques based on market data.
Level 3: Cases where one or more significant inputs are not based on observable market data.
All of the company’s financial instruments that are subject to measurement at fair value are classified as level 3. Changes for the year with respect to financial instruments at level 3 mainly pertained to supplementary purchase considerations for acquisitions. Supplementary contingent considerations are measured at fair value based on available data, such as contractual terms and conditions, and actual assessments of the anticipated fulfillment of these terms and conditions. For the calculation of fair value, an allocated interest of 0.9% was applied. Since the difference between fair value and book value is marginal, no restatement has been made.
The table below shows the differences between fair value and book value is marginal.
RECURRING MEASUREMENTS AT FAIR VALUE, AT DECEMBER 31, 2018.
SEK 000s Level 1 Level 2 Level 3 Book value
Supplementary purchase consideration, Cito IT A/S 9,632 9,632
Total - - 9,632 9,632
RECURRING MEASUREMENTS AT FAIR VALUE, AT DECEMBER 31, 2017.
SEK 000s Level 1 Level 2 Level 3 Book value
Supplementary purchase consideration, Fox Publish AS 1,301 1,301
Supplementary purchase consideration, FuturSoft Oy 24,624 24,624
Total - - 25,925 25,925
NOTE 9D CONVERTIBLE DEBENTURES
Convertible debentures are recognized partly as financial liabilities and partly as shareholders’ equity. Their specific allocation is based on a measurement made in conjunction with their issue. Interest expenses are distributed over the term of the loan.
The initial fair value of the convertible debenture’s liability portion is calculated using market interest-rates at the date of issue applicable to an equivalent non-convertible debenture. Following the first recognition occasion, its liability portion is recognized as amortized cost until it is converted or matures. The remaining portion of the funds is allocated the option of conversion and recognized net after tax under shareholders’ equity, and is not remeasured.
Bond 1707 (Convertible Acquisition of MV Nordic), non-current liabilityIn conjunction with acquisition of MV Nordic A/S in July 2017, the Parent Company issued 2000 convertible de-bentures valued at SEK 10,000 each, at a nominal value of SEK 20,008,000. The stock-option portion of the convertible bond is estimated to value SEK 1,043,000. The stock-option portion is recognized as shareholders’ equity in accordance with IAS 32. The remainder of the bond, including interest (SEK 685,000) is recognized as a non-current liability. The duration of the loan is from July 6, 2017 – June 30, 2020, at a Stibor 180 interest rate. The conversion price is SEK 85.00. Conversion may be exercised from January 1, 2019 to June 30, 2020. Upon conversion, the share capital may increase by a maximum of SEK 23,432. Full conversion of the Bond 1707 Convertible Acquisition of MV, would entail a dilution of
approximately 0.8% of the capital and 0.4% of the votes. The shares were issued on market terms.
Bond 1801 (Convertible Employee Program), non-current liability In December 2017, the Parent Company issued 2,083 con-vertible debentures valued at SEK 10,000 each, at a nominal value of SEK 20,008,000. The stock-option portion of the convertible bond is estimated to value SEK 1,178,000. The stock-option portion is recognized as shareholders’ equity in accordance with IAS 32. The remainder of the bond, including interest (SEK 526,000) is recognized as a non-current liability. The duration of the loan is from January 1, 2018 – Decem-ber 31, 2020, at a Stibor 180 interest rate. The conversion price is SEK 104.00. Conversion may be exercised between November 1 and November 30, 2020, upon which the share capital may increase by no more than SEK 20,029. Full con-version of Bond 1801 Convertible Employee Program would entail a dilution of approximately 0.7% of the capital and 0.3% of the votes. The shares were issued on market terms. Consequently, our assessment is that there are no benefits for participants of the convertible program. The convertible program was registered with the Swedish Companies Regis-tration Office on January 27, 2018.
To determine the value of the stock options, the bond amount is discounted to the interest it carries with the respective market interest-rate. The value of the stock option comprises the difference between de two estimates. The interest-rate at the date of issue is used.
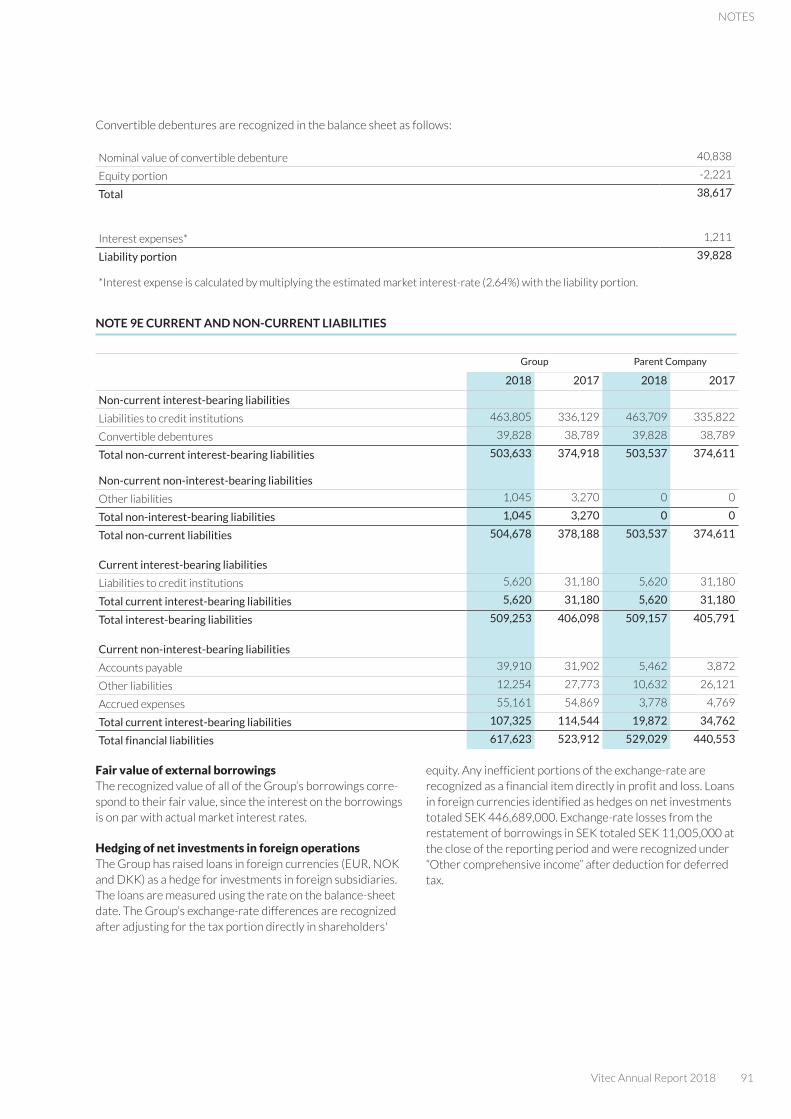
Vitec Annual Report 2018 91
NOTES
Convertible debentures are recognized in the balance sheet as follows:
Nominal value of convertible debenture 40,838
Equity portion -2,221
Total 38,617
Interest expenses* 1,211
Liability portion 39,828
*Interest expense is calculated by multiplying the estimated market interest-rate (2.64%) with the liability portion.
NOTE 9E CURRENT AND NON-CURRENT LIABILITIES
Group Parent Company
2018 2017 2018 2017
Non-current interest-bearing liabilities
Liabilities to credit institutions 463,805 336,129 463,709 335,822
Convertible debentures 39,828 38,789 39,828 38,789
Total non-current interest-bearing liabilities 503,633 374,918 503,537 374,611
Non-current non-interest-bearing liabilities
Other liabilities 1,045 3,270 0 0
Total non-interest-bearing liabilities 1,045 3,270 0 0
Total non-current liabilities 504,678 378,188 503,537 374,611
Current interest-bearing liabilities
Liabilities to credit institutions 5,620 31,180 5,620 31,180
Total current interest-bearing liabilities 5,620 31,180 5,620 31,180
Total interest-bearing liabilities 509,253 406,098 509,157 405,791
Current non-interest-bearing liabilities
Accounts payable 39,910 31,902 5,462 3,872
Other liabilities 12,254 27,773 10,632 26,121
Accrued expenses 55,161 54,869 3,778 4,769
Total current interest-bearing liabilities 107,325 114,544 19,872 34,762
Total financial liabilities 617,623 523,912 529,029 440,553
Fair value of external borrowingsThe recognized value of all of the Group’s borrowings corre-spond to their fair value, since the interest on the borrowings is on par with actual market interest rates.
Hedging of net investments in foreign operationsThe Group has raised loans in foreign currencies (EUR, NOK and DKK) as a hedge for investments in foreign subsidiaries. The loans are measured using the rate on the balance-sheet date. The Group’s exchange-rate differences are recognized after adjusting for the tax portion directly in shareholders'
equity. Any inefficient portions of the exchange-rate are recognized as a financial item directly in profit and loss. Loans in foreign currencies identified as hedges on net investments totaled SEK 446,689,000. Exchange-rate losses from the restatement of borrowings in SEK totaled SEK 11,005,000 at the close of the reporting period and were recognized under “Other comprehensive income” after deduction for deferred tax.
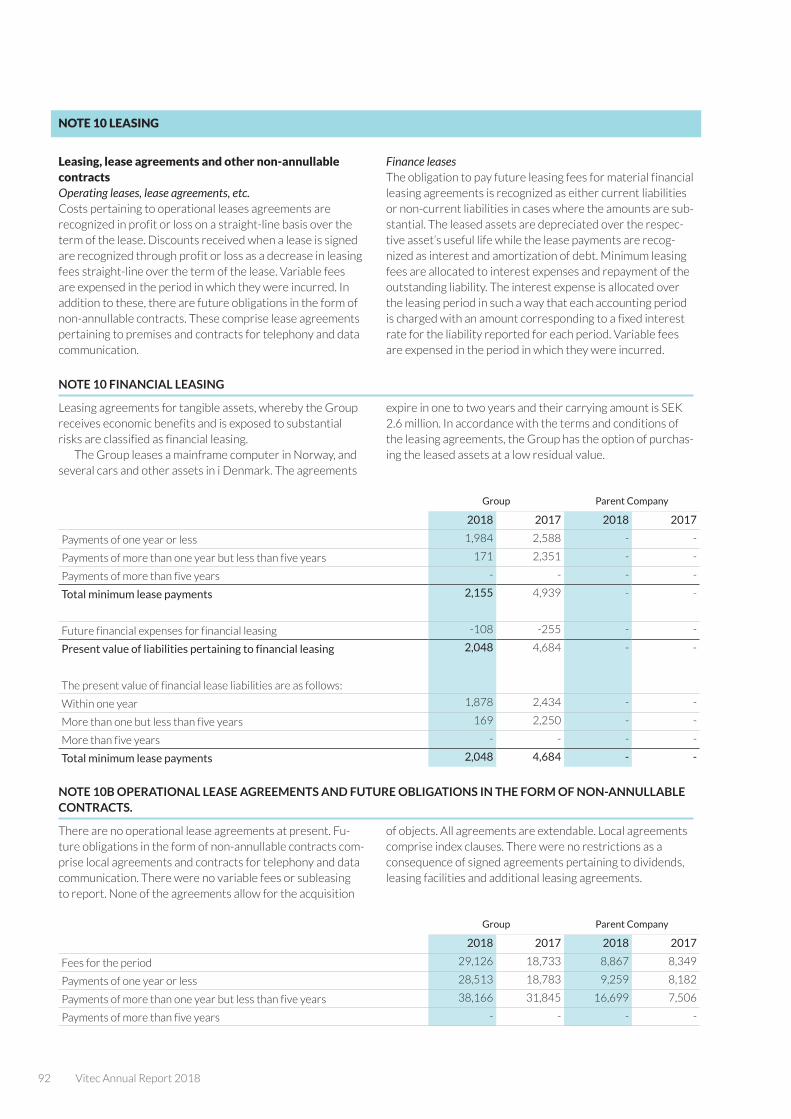
92 Vitec Annual Report 2018
NOTE 10 LEASING
Leasing, lease agreements and other non-annullable contractsOperating leases, lease agreements, etc. Costs pertaining to operational leases agreements are recognized in profit or loss on a straight-line basis over the term of the lease. Discounts received when a lease is signed are recognized through profit or loss as a decrease in leasing fees straight-line over the term of the lease. Variable fees are expensed in the period in which they were incurred. In addition to these, there are future obligations in the form of non-annullable contracts. These comprise lease agreements pertaining to premises and contracts for telephony and data communication.
Finance leases The obligation to pay future leasing fees for material financial leasing agreements is recognized as either current liabilities or non-current liabilities in cases where the amounts are sub-stantial. The leased assets are depreciated over the respec-tive asset’s useful life while the lease payments are recog-nized as interest and amortization of debt. Minimum leasing fees are allocated to interest expenses and repayment of the outstanding liability. The interest expense is allocated over the leasing period in such a way that each accounting period is charged with an amount corresponding to a fixed interest rate for the liability reported for each period. Variable fees are expensed in the period in which they were incurred.
NOTE 10 FINANCIAL LEASING
Leasing agreements for tangible assets, whereby the Group receives economic benefits and is exposed to substantial risks are classified as financial leasing.
The Group leases a mainframe computer in Norway, and several cars and other assets in i Denmark. The agreements
expire in one to two years and their carrying amount is SEK 2.6 million. In accordance with the terms and conditions of the leasing agreements, the Group has the option of purchas-ing the leased assets at a low residual value.
Group Parent Company
2018 2017 2018 2017
Payments of one year or less 1,984 2,588 - -
Payments of more than one year but less than five years 171 2,351 - -
Payments of more than five years - - - -
Total minimum lease payments 2,155 4,939 - -
Future financial expenses for financial leasing -108 -255 - -
Present value of liabilities pertaining to financial leasing 2,048 4,684 - -
The present value of financial lease liabilities are as follows:
Within one year 1,878 2,434 - -
More than one but less than five years 169 2,250 - -
More than five years - - - -
Total minimum lease payments 2,048 4,684 - -
NOTE 10B OPERATIONAL LEASE AGREEMENTS AND FUTURE OBLIGATIONS IN THE FORM OF NON-ANNULLABLE CONTRACTS.
There are no operational lease agreements at present. Fu-ture obligations in the form of non-annullable contracts com-prise local agreements and contracts for telephony and data communication. There were no variable fees or subleasing to report. None of the agreements allow for the acquisition
of objects. All agreements are extendable. Local agreements comprise index clauses. There were no restrictions as a consequence of signed agreements pertaining to dividends, leasing facilities and additional leasing agreements.
Group Parent Company
2018 2017 2018 2017
Fees for the period 29,126 18,733 8,867 8,349
Payments of one year or less 28,513 18,783 9,259 8,182
Payments of more than one year but less than five years 38,166 31,845 16,699 7,506
Payments of more than five years - - - -
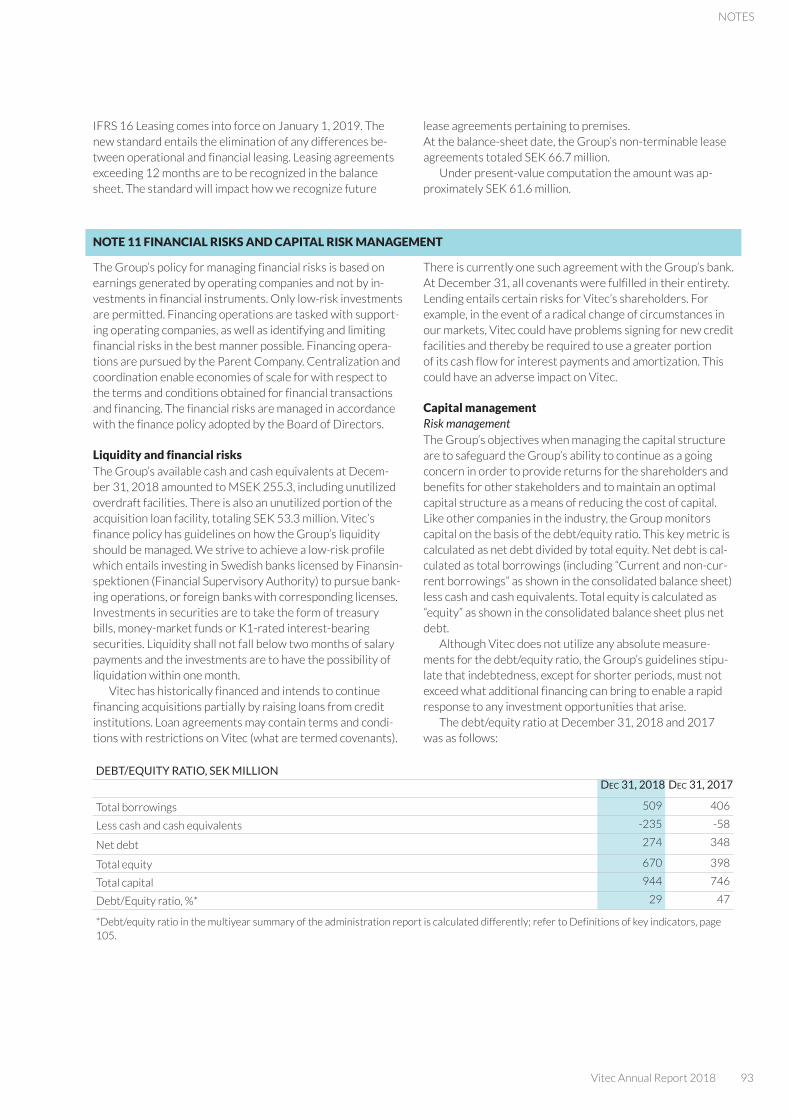
Vitec Annual Report 2018 93
NOTES
IFRS 16 Leasing comes into force on January 1, 2019. The new standard entails the elimination of any differences be-tween operational and financial leasing. Leasing agreements exceeding 12 months are to be recognized in the balance sheet. The standard will impact how we recognize future
lease agreements pertaining to premises. At the balance-sheet date, the Group’s non-terminable lease agreements totaled SEK 66.7 million.
Under present-value computation the amount was ap-proximately SEK 61.6 million.
NOTE 11 FINANCIAL RISKS AND CAPITAL RISK MANAGEMENT
The Group’s policy for managing financial risks is based on earnings generated by operating companies and not by in-vestments in financial instruments. Only low-risk investments are permitted. Financing operations are tasked with support-ing operating companies, as well as identifying and limiting financial risks in the best manner possible. Financing opera-tions are pursued by the Parent Company. Centralization and coordination enable economies of scale for with respect to the terms and conditions obtained for financial transactions and financing. The financial risks are managed in accordance with the finance policy adopted by the Board of Directors.
Liquidity and financial risksThe Group’s available cash and cash equivalents at Decem-ber 31, 2018 amounted to MSEK 255.3, including unutilized overdraft facilities. There is also an unutilized portion of the acquisition loan facility, totaling SEK 53.3 million. Vitec’s finance policy has guidelines on how the Group’s liquidity should be managed. We strive to achieve a low-risk profile which entails investing in Swedish banks licensed by Finansin-spektionen (Financial Supervisory Authority) to pursue bank-ing operations, or foreign banks with corresponding licenses. Investments in securities are to take the form of treasury bills, money-market funds or K1-rated interest-bearing securities. Liquidity shall not fall below two months of salary payments and the investments are to have the possibility of liquidation within one month.
Vitec has historically financed and intends to continue financing acquisitions partially by raising loans from credit institutions. Loan agreements may contain terms and condi-tions with restrictions on Vitec (what are termed covenants).
There is currently one such agreement with the Group’s bank. At December 31, all covenants were fulfilled in their entirety. Lending entails certain risks for Vitec’s shareholders. For example, in the event of a radical change of circumstances in our markets, Vitec could have problems signing for new credit facilities and thereby be required to use a greater portion of its cash flow for interest payments and amortization. This could have an adverse impact on Vitec.
Capital managementRisk managementThe Group’s objectives when managing the capital structure are to safeguard the Group’s ability to continue as a going concern in order to provide returns for the shareholders and benefits for other stakeholders and to maintain an optimal capital structure as a means of reducing the cost of capital. Like other companies in the industry, the Group monitors capital on the basis of the debt/equity ratio. This key metric is calculated as net debt divided by total equity. Net debt is cal-culated as total borrowings (including “Current and non-cur-rent borrowings” as shown in the consolidated balance sheet) less cash and cash equivalents. Total equity is calculated as “equity” as shown in the consolidated balance sheet plus net debt.
Although Vitec does not utilize any absolute measure-ments for the debt/equity ratio, the Group’s guidelines stipu-late that indebtedness, except for shorter periods, must not exceed what additional financing can bring to enable a rapid response to any investment opportunities that arise.
The debt/equity ratio at December 31, 2018 and 2017 was as follows:
DEBT/EQUITY RATIO, SEK MILLIONDec 31, 2018 Dec 31, 2017
Total borrowings 509 406
Less cash and cash equivalents -235 -58
Net debt 274 348
Total equity 670 398
Total capital 944 746
Debt/Equity ratio, %* 29 47
*Debt/equity ratio in the multiyear summary of the administration report is calculated differently; refer to Definitions of key indicators, page 105.

94 Vitec Annual Report 2018
DIVIDENDS
2018 2017
Dividends paid totaled SEK 1.10 per share (1.00). 32,823 29,397
Total dividends expensed or paid 32,823 29,397
For the 2018 financial year, the Board of Directors has proposed a dividend of SEK 1.20 per share (1.10).
Det total amount of the proposed dividend was not recognized as a liability at December 31, 2018, but is expected to be settled with retained earnings in April 2019. 38,807 32,823
38,807 32,823
Credit riskAccounts receivable are associated with a certain amount of credit risk. Vitec’s business model frequently entails advance payments and credit controls. Vitec has no significant concen-trations of credit risks among its accounts receivable. In cases where Vitec’s customers are unable to pay their invoices on time, or at all, Vitec faces the risk of impact by credit losses. It cannot be guaranteed that future credit losses will not increase, which would adversely impact Vitec’s operations, financial position and earnings. The maximum exposure to credit risk corresponds to the Group’s carrying amount for accounts receivable which totaled SEK 201,297,000 at De-cember 31, 2018, after provisions for estimated losses. For further information about accounts receivable, refer to Note 9. The Parent Company did not have any external credit risks at the close of the year.
Currency risksCurrency risks can be divided into transaction exposure and translation risk. Through its ownership of foreign subsidiar-ies in Denmark, Finland and Norway, as well as transactions through Vitec Energy AB, Vitec’s operations entail a certain amount of sales transactions in different currencies and thereby, transaction exposure, mainly to Norwegian crowns (NKK), Danish crowns (DKK) and Euros (EUR). The Group did not utilize any currency hedging in 2018.
Translation risk arises upon restatement of our sub-sidiaries’ income statements and balance sheets into SEK from other currencies. Since our subsidiaries report in local currency, the Group is exposed to exchange-rate fluctuations upon consolidation of these companies. The acquisitions of
AcuVitec Oy, Autodata AS, Aloc A/S, Datamann A/S, Tietomit-ta Oy, Futursoft Oy, Plania AS, MV-Nordic A/S, Agrando AS and Cito IT A/S were financed through loans in local currency in order to reduce translation exposure.
The following exchange rates were used when translating the currencies of balance-sheet items on the balance-sheet date, December 31, 2018:
NOK 1.0245
DKK 1.3760
EUR 10.2753
A change of 5% in foreign-currency rates in 2018 would impact profit/loss for the year and shareholders' equity by approximately SEK 3.3 million, distributed as: NOK SEK 0.8 million, DKK 1.2 million and EUR 1.4 million.
Interest-rate riskVitec regulates the interest-rate risk of its interest-bearing assets by investing cash and cash equivalents to allow for the dates of maturity of fixed-interest terms and other invest-ments to match known outflows and/or the amortization of debts. Long-term financing is secured through loans from banks and financing institutions, as well as convertibles. Interest rates for loans from banks and financing institutions are floating, while interest rates for convertibles are normally fixed for intervals of 180 days or, in exceptional cases, fixed for the entire term. A change of 1% in the existing loan port-folio would impact profit/loss for the year and shareholders' equity by approximately SEK 4.1 million.
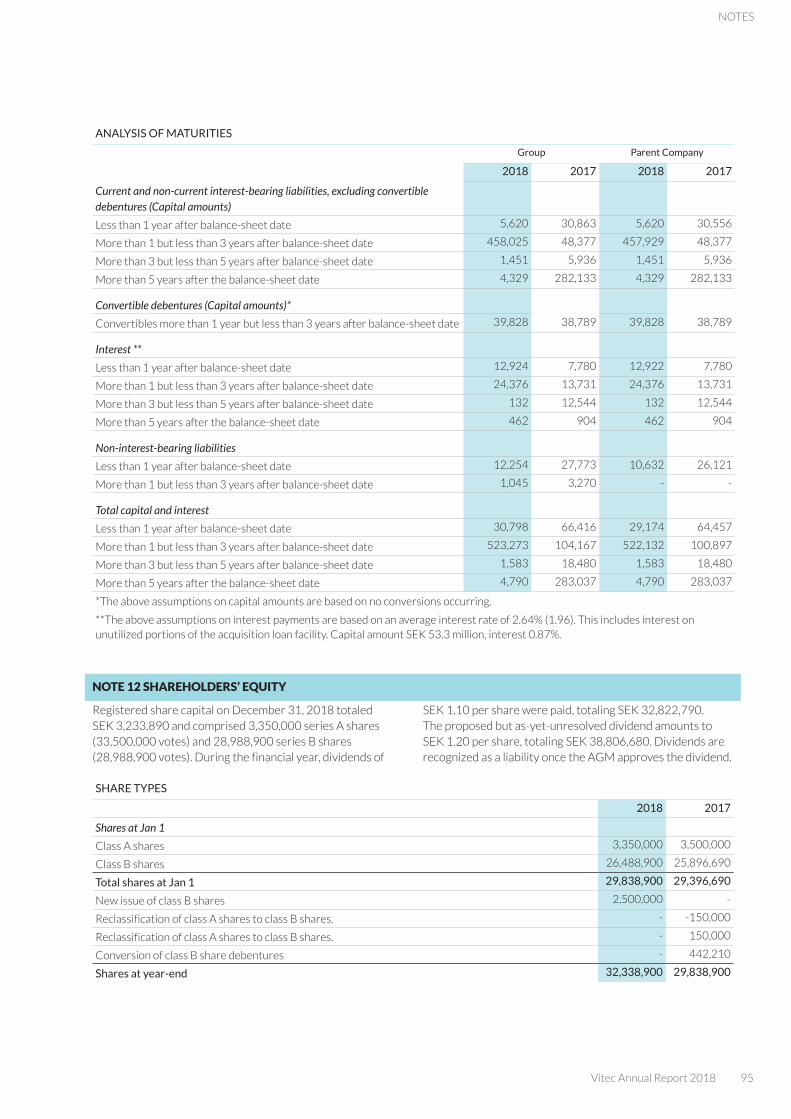
Vitec Annual Report 2018 95
NOTES
ANALYSIS OF MATURITIES
Group Parent Company
2018 2017 2018 2017
Current and non-current interest-bearing liabilities, excluding convertible debentures (Capital amounts)
Less than 1 year after balance-sheet date 5,620 30,863 5,620 30,556
More than 1 but less than 3 years after balance-sheet date 458,025 48,377 457,929 48,377
More than 3 but less than 5 years after balance-sheet date 1,451 5,936 1,451 5,936
More than 5 years after the balance-sheet date 4,329 282,133 4,329 282,133
Convertible debentures (Capital amounts)*
Convertibles more than 1 year but less than 3 years after balance-sheet date 39,828 38,789 39,828 38,789
Interest **
Less than 1 year after balance-sheet date 12,924 7,780 12,922 7,780
More than 1 but less than 3 years after balance-sheet date 24,376 13,731 24,376 13,731
More than 3 but less than 5 years after balance-sheet date 132 12,544 132 12,544
More than 5 years after the balance-sheet date 462 904 462 904
Non-interest-bearing liabilities
Less than 1 year after balance-sheet date 12,254 27,773 10,632 26,121
More than 1 but less than 3 years after balance-sheet date 1,045 3,270 - -
Total capital and interest
Less than 1 year after balance-sheet date 30,798 66,416 29,174 64,457
More than 1 but less than 3 years after balance-sheet date 523,273 104,167 522,132 100,897
More than 3 but less than 5 years after balance-sheet date 1,583 18,480 1,583 18,480
More than 5 years after the balance-sheet date 4,790 283,037 4,790 283,037
*The above assumptions on capital amounts are based on no conversions occurring.
**The above assumptions on interest payments are based on an average interest rate of 2.64% (1.96). This includes interest on unutilized portions of the acquisition loan facility. Capital amount SEK 53.3 million, interest 0.87%.
NOTE 12 SHAREHOLDERS’ EQUITY
Registered share capital on December 31, 2018 totaled SEK 3,233,890 and comprised 3,350,000 series A shares (33,500,000 votes) and 28,988,900 series B shares (28,988,900 votes). During the financial year, dividends of
SEK 1.10 per share were paid, totaling SEK 32,822,790. The proposed but as-yet-unresolved dividend amounts to SEK 1.20 per share, totaling SEK 38,806,680. Dividends are recognized as a liability once the AGM approves the dividend.
SHARE TYPES
2018 2017
Shares at Jan 1
Class A shares 3,350,000 3,500,000
Class B shares 26,488,900 25,896,690
Total shares at Jan 1 29,838,900 29,396,690
New issue of class B shares 2,500,000 -
Reclassification of class A shares to class B shares. - -150,000
Reclassification of class A shares to class B shares. - 150,000
Conversion of class B share debentures - 442,210
Shares at year-end 32,338,900 29,838,900

96 Vitec Annual Report 2018
Shares at year-end 2018 2017
Class A shares 3,350,000 3,350,000
Class B shares 28,988,900 26,488,900
Total shares at year-end 32,338,900 29,838,900
The administration of shareholders’ equity is aimed at en-suring Vitec’s financial stability, managing financial risks and securing the Group’s short- and long-term requirements on share capital. Vitec shall not, except for short periods, have higher borrowings than what can be raised through addi-tional financing. The Group’s capital structure is managed and adjusted according to changes in financial conditions. The Group monitors its capital deployment using various key metrics, such as net indebtedness, return on capital employed
and equity/assets ratios. Vitec’s policy on dividends stipu-lates that the company shall strive to distribute a minimum of one-third of net profit after tax as dividends annually. However, when assessing the scope, the company’s financing requirements, capital structure and general financial position must always be taken into consideration. Vitec encourages employees to become shareholders by issuing convertible debentures. Refer to the administration report for further detail.
NOTE 13 CASH FLOW
CHANGE IN LIABILITIES FOR FINANCING ACTIVITIES, GROUP
Long-term liabilities to credit institutions
Short-term liabilities to credit institutions
Convertible debentures
2018 2017 2018 2017 2018 2017
OPENING BALANCE 336,129 339,396 31,180 30,340 38,789 13,786
Cash flow 91,905 44,280 - -51,256 - 20,830
Change in non-cash items
Exchange-rate fluctuations 10,211 4,342 - 208 - -
Acquisition financing - - - - - 20,008
Conversion - - - - - -13,994
Other - - - - 1,039 -1,841
Reclassifications long-/short-term 25,560 -51,889 -25,560 51,889 - -
CLOSING BALANCE 463,805 336,129 5,620 31,180 39,828 38,789
CHANGE IN LIABILITIES FOR FINANCING ACTIVITIES, PARENT COMPANY
Long-term liabilities to credit institutions
Short-term liabilities to credit institutions
Convertible debentures
2018 2017 2018 2017 2018 2017
OPENING BALANCE 335,822 338,941 31,180 30,340 38,789 13,786
Cash flow 92,116 44,442 - -51,256 - 20,830
Change in non-cash items
Exchange-rate fluctuations 10,211 4,328 208
Acquisition financing - - - - - 20,008
Conversion - - - - - -13,994
Other - - - - 1,039 -1,841
Reclassifications long-/short-term 25,560 -51,889 -25,560 51,889 - -
CLOSING BALANCE 463,709 335,822 5,620 31,180 39,828 38,789
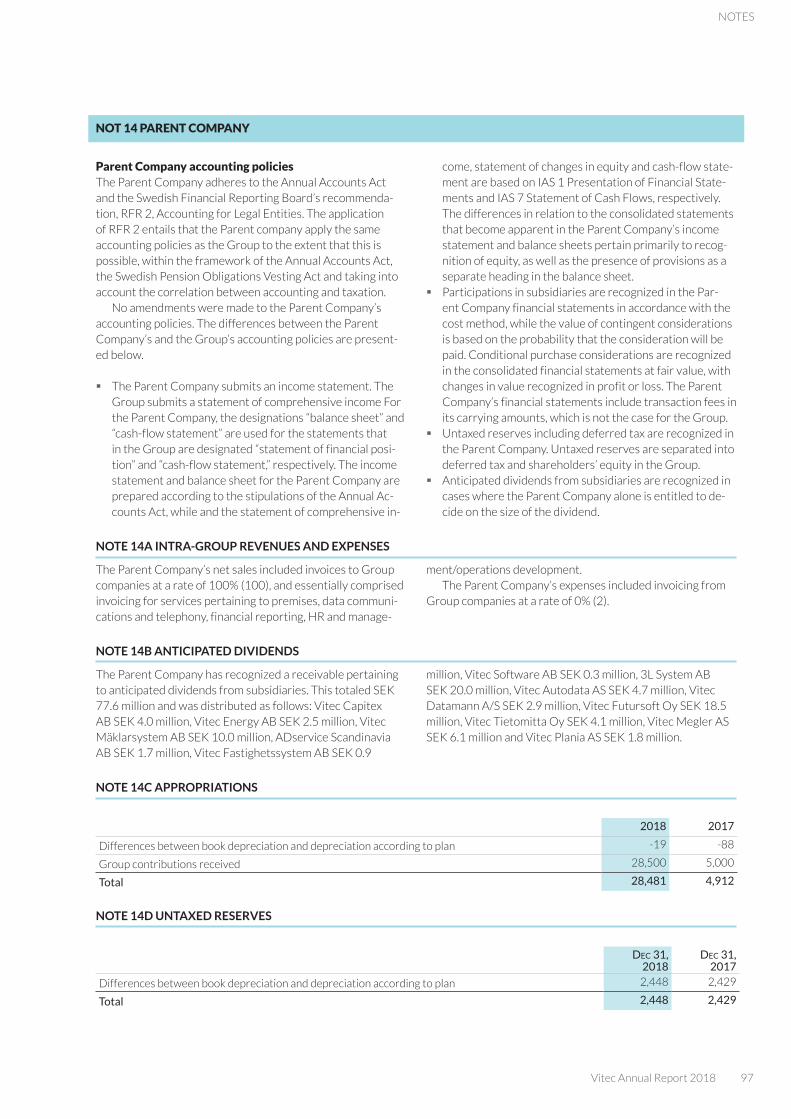
Vitec Annual Report 2018 97
NOTES
NOT 14 PARENT COMPANY
Parent Company accounting policiesThe Parent Company adheres to the Annual Accounts Act and the Swedish Financial Reporting Board’s recommenda-tion, RFR 2, Accounting for Legal Entities. The application of RFR 2 entails that the Parent company apply the same accounting policies as the Group to the extent that this is possible, within the framework of the Annual Accounts Act, the Swedish Pension Obligations Vesting Act and taking into account the correlation between accounting and taxation.
No amendments were made to the Parent Company’s accounting policies. The differences between the Parent Company’s and the Group’s accounting policies are present-ed below.
� The Parent Company submits an income statement. The Group submits a statement of comprehensive income For the Parent Company, the designations “balance sheet” and “cash-flow statement” are used for the statements that in the Group are designated “statement of financial posi-tion” and “cash-flow statement,” respectively. The income statement and balance sheet for the Parent Company are prepared according to the stipulations of the Annual Ac-counts Act, while and the statement of comprehensive in-
come, statement of changes in equity and cash-flow state-ment are based on IAS 1 Presentation of Financial State-ments and IAS 7 Statement of Cash Flows, respectively. The differences in relation to the consolidated statements that become apparent in the Parent Company’s income statement and balance sheets pertain primarily to recog-nition of equity, as well as the presence of provisions as a separate heading in the balance sheet.
� Participations in subsidiaries are recognized in the Par-ent Company financial statements in accordance with the cost method, while the value of contingent considerations is based on the probability that the consideration will be paid. Conditional purchase considerations are recognized in the consolidated financial statements at fair value, with changes in value recognized in profit or loss. The Parent Company’s financial statements include transaction fees in its carrying amounts, which is not the case for the Group.
� Untaxed reserves including deferred tax are recognized in the Parent Company. Untaxed reserves are separated into deferred tax and shareholders’ equity in the Group.
� Anticipated dividends from subsidiaries are recognized in cases where the Parent Company alone is entitled to de-cide on the size of the dividend.
NOTE 14A INTRA-GROUP REVENUES AND EXPENSES
The Parent Company’s net sales included invoices to Group companies at a rate of 100% (100), and essentially comprised invoicing for services pertaining to premises, data communi-cations and telephony, financial reporting, HR and manage-
ment/operations development.The Parent Company’s expenses included invoicing from
Group companies at a rate of 0% (2).
NOTE 14B ANTICIPATED DIVIDENDS
The Parent Company has recognized a receivable pertaining to anticipated dividends from subsidiaries. This totaled SEK 77.6 million and was distributed as follows: Vitec Capitex AB SEK 4.0 million, Vitec Energy AB SEK 2.5 million, Vitec Mäklarsystem AB SEK 10.0 million, ADservice Scandinavia AB SEK 1.7 million, Vitec Fastighetssystem AB SEK 0.9
million, Vitec Software AB SEK 0.3 million, 3L System AB SEK 20.0 million, Vitec Autodata AS SEK 4.7 million, Vitec Datamann A/S SEK 2.9 million, Vitec Futursoft Oy SEK 18.5 million, Vitec Tietomitta Oy SEK 4.1 million, Vitec Megler AS SEK 6.1 million and Vitec Plania AS SEK 1.8 million.
NOTE 14C APPROPRIATIONS
2018 2017
Differences between book depreciation and depreciation according to plan -19 -88
Group contributions received 28,500 5,000
Total 28,481 4,912
NOTE 14D UNTAXED RESERVES
Dec 31, 2018
Dec 31, 2017
Differences between book depreciation and depreciation according to plan 2,448 2,429
Total 2,448 2,429
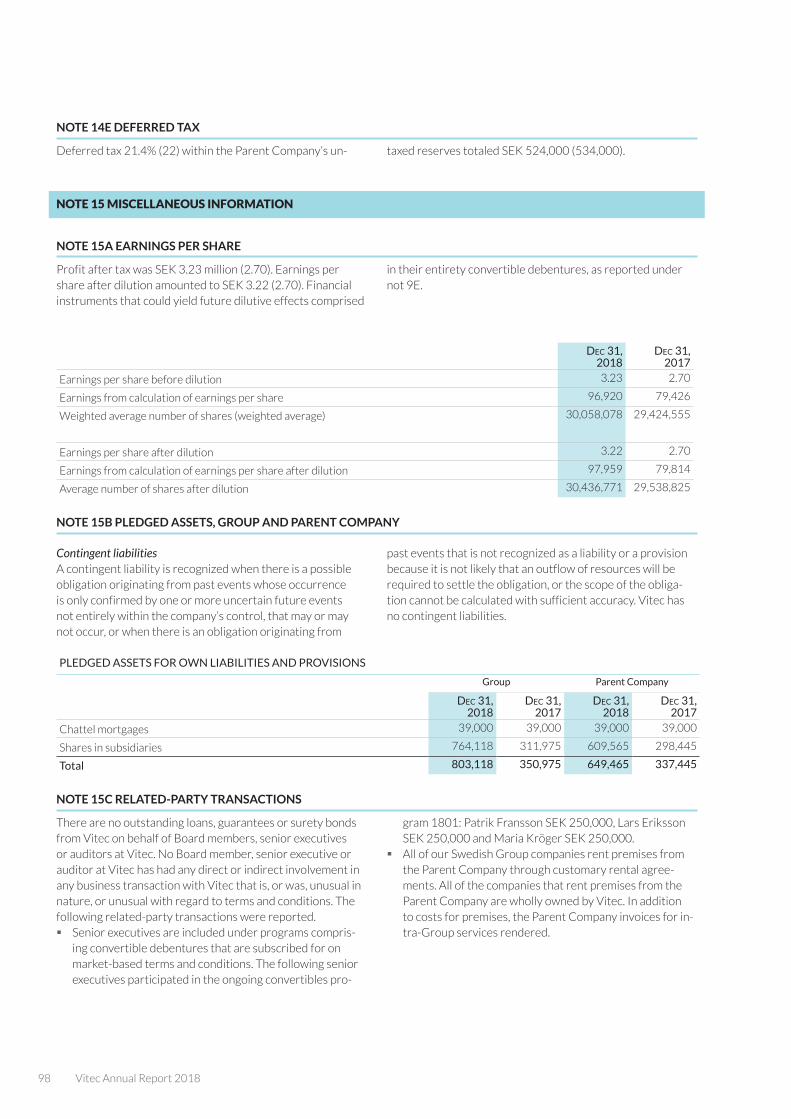
98 Vitec Annual Report 2018
NOTE 14E DEFERRED TAX
Deferred tax 21.4% (22) within the Parent Company’s un- taxed reserves totaled SEK 524,000 (534,000).
NOTE 15 MISCELLANEOUS INFORMATION
NOTE 15A EARNINGS PER SHARE
Profit after tax was SEK 3.23 million (2.70). Earnings per share after dilution amounted to SEK 3.22 (2.70). Financial instruments that could yield future dilutive effects comprised
in their entirety convertible debentures, as reported under not 9E.
Dec 31, 2018
Dec 31, 2017
Earnings per share before dilution 3.23 2.70
Earnings from calculation of earnings per share 96,920 79,426
Weighted average number of shares (weighted average) 30,058,078 29,424,555
Earnings per share after dilution 3.22 2.70
Earnings from calculation of earnings per share after dilution 97,959 79,814
Average number of shares after dilution 30,436,771 29,538,825
NOTE 15B PLEDGED ASSETS, GROUP AND PARENT COMPANY
Contingent liabilities A contingent liability is recognized when there is a possible obligation originating from past events whose occurrence is only confirmed by one or more uncertain future events not entirely within the company’s control, that may or may not occur, or when there is an obligation originating from
past events that is not recognized as a liability or a provision because it is not likely that an outflow of resources will be required to settle the obligation, or the scope of the obliga-tion cannot be calculated with sufficient accuracy. Vitec has no contingent liabilities.
PLEDGED ASSETS FOR OWN LIABILITIES AND PROVISIONS
Group Parent Company
Dec 31, 2018
Dec 31, 2017
Dec 31, 2018
Dec 31, 2017
Chattel mortgages 39,000 39,000 39,000 39,000
Shares in subsidiaries 764,118 311,975 609,565 298,445
Total 803,118 350,975 649,465 337,445
NOTE 15C RELATED-PARTY TRANSACTIONS
There are no outstanding loans, guarantees or surety bonds from Vitec on behalf of Board members, senior executives or auditors at Vitec. No Board member, senior executive or auditor at Vitec has had any direct or indirect involvement in any business transaction with Vitec that is, or was, unusual in nature, or unusual with regard to terms and conditions. The following related-party transactions were reported.
� Senior executives are included under programs compris-ing convertible debentures that are subscribed for on market-based terms and conditions. The following senior executives participated in the ongoing convertibles pro-
gram 1801: Patrik Fransson SEK 250,000, Lars Eriksson SEK 250,000 and Maria Kröger SEK 250,000.
� All of our Swedish Group companies rent premises from the Parent Company through customary rental agree-ments. All of the companies that rent premises from the Parent Company are wholly owned by Vitec. In addition to costs for premises, the Parent Company invoices for in-tra-Group services rendered.
Vitec Annual Report 2018 99
NOTES
NOTE 16 EVENTS AFTER THE BALANCE-SHEET DATE
On March 5, 2019, all shares of the Finnish software compa-ny, Avoine Oy, were acquired. Its product is aimed at sports clubs and labor unions in Finland. The product is delivered as Software as a Service (SaaS). The company reported sales of SEK 29.4 million, with an adjusted EBITDA of SEK 6.3 million for the 2018 financial year. A cash payment will be transacted on the date of the takeover.
Consolidation will commence as of the acquisition date. At the time of this report’s publication, there were no financial statements available that could serve as the basis of a
detailed description of the acquisition. For this reason, no information is presented about the fair value of acquired receivables, and acquired assets and liabilities. We expect the future items of a detailed acquisition analysis to comprise product rights, brands and goodwill. Goodwill is deemed to be attributable to anticipated profitability, complementary expertise requirements, as well as expected synergies, in the form of the joint development of our products.
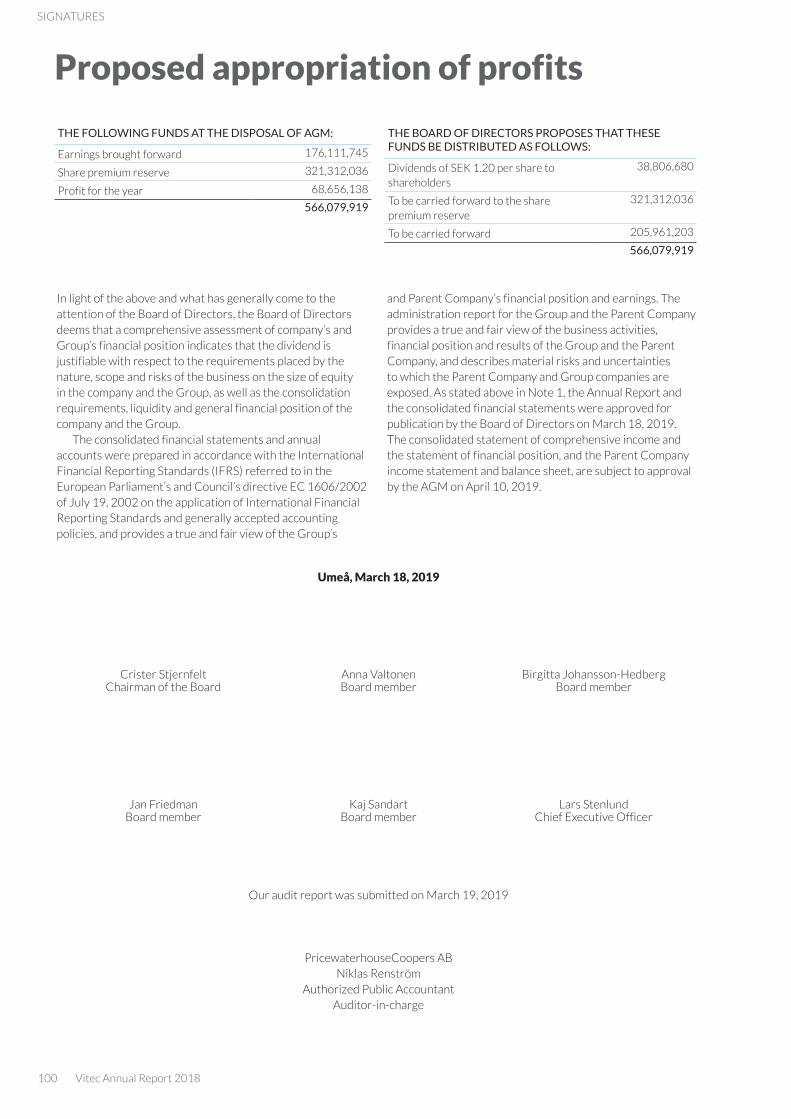
100 Vitec Annual Report 2018
Umeå, March 18, 2019
Crister Stjernfelt Chairman of the Board
Anna Valtonen Board member
Birgitta Johansson-HedbergBoard member
Jan Friedman Board member
Kaj Sandart Board member
Lars Stenlund Chief Executive Officer
Our audit report was submitted on March 19, 2019
PricewaterhouseCoopers ABNiklas Renström
Authorized Public AccountantAuditor-in-charge
Proposed appropriation of profits
THE FOLLOWING FUNDS AT THE DISPOSAL OF AGM:
Earnings brought forward 176,111,745
Share premium reserve 321,312,036
Profit for the year 68,656,138
566,079,919
In light of the above and what has generally come to the attention of the Board of Directors, the Board of Directors deems that a comprehensive assessment of company’s and Group’s financial position indicates that the dividend is justifiable with respect to the requirements placed by the nature, scope and risks of the business on the size of equity in the company and the Group, as well as the consolidation requirements, liquidity and general financial position of the company and the Group.
The consolidated financial statements and annual accounts were prepared in accordance with the International Financial Reporting Standards (IFRS) referred to in the European Parliament’s and Council’s directive EC 1606/2002 of July 19, 2002 on the application of International Financial Reporting Standards and generally accepted accounting policies, and provides a true and fair view of the Group’s
and Parent Company’s financial position and earnings. The administration report for the Group and the Parent Company provides a true and fair view of the business activities, financial position and results of the Group and the Parent Company, and describes material risks and uncertainties to which the Parent Company and Group companies are exposed. As stated above in Note 1, the Annual Report and the consolidated financial statements were approved for publication by the Board of Directors on March 18, 2019. The consolidated statement of comprehensive income and the statement of financial position, and the Parent Company income statement and balance sheet, are subject to approval by the AGM on April 10, 2019.
THE BOARD OF DIRECTORS PROPOSES THAT THESE FUNDS BE DISTRIBUTED AS FOLLOWS:
Dividends of SEK 1.20 per share to shareholders
38,806,680
To be carried forward to the share premium reserve
321,312,036
To be carried forward 205,961,203
566,079,919
SIGNATURES
Vitec Annual Report 2018 101
AUDITOR’S REPORT
Auditor´s report
Unofficial translation
Report on the annual accounts and consolidated accountsOpinionsWe have audited the annual accounts and consolidated ac-counts of Vitec Software Group AB (publ) for the year 2018 except for the corporate governance statement on pages 36-44. The annual accounts and consolidated accounts of the company are included on pages 30-99 in this document.
In our opinion, the annual accounts have been prepared in accordance with the Annual Accounts Act and present fairly, in all material respects, the financial position of parent company as of 31 December 2018 and its financial perfor-mance and cash flow for the year then ended in accordance with the Annual Accounts Act. The consolidated accounts have been prepared in accordance with the Annual Accounts Act and present fairly, in all material respects, the financial position of the group as of 31 December 2018 and their fi-nancial performance and cash flow for the year then ended in accordance with International Financial Reporting Standards (IFRS), as adopted by the EU, and the Annual Accounts Act. Our opinions do not cover the corporate governance state-ment on pages 36-44. The statutory administration report is consistent with the other parts of the annual accounts and consolidated accounts.
We therefore recommend that the general meeting of shareholders adopts the income statement and balance sheet for the parent company and the consolidated statement of profit or loss and the consolidated balance sheet the group.
Our opinions in this report on the annual accounts and consolidated accounts are consistent with the content of the additional report that has been submitted to the parent company’s Board of Directors in accordance with the Audit Regulation (537/2014) Article 11.
Basis for OpinionsWe conducted our audit in accordance with International Standards on Auditing (ISA) and generally accepted auditing standards in Sweden. Our responsibilities under those stan-dards are further described in the Auditor’s Responsibilities section. We are independent of the parent company and the group in accordance with professional ethics for accoun-tants in Sweden and have otherwise fulfilled our ethical responsibilities in accordance with these requirements. This includes that, based on the best of our knowledge and belief, no prohibited services referred to in the Audit Regulation (537/2014) Article 5.1 have been provided to the audited company or, where applicable, its parent company or its con-trolled companies within the EU.
We believe that the audit evidence we have obtained is sufficient and appropriate to provide a basis for our opinions.
Our audit approachAudit scopeVitec has an expressed growth strategy whereby growth is primarily achieved through the acquisition of mature soft-ware companies in the Nordic region. Through these acqui-sitions, Vitec secures, amongst other things, client relation-ships and established brands and software specific to certain industries. Company management works on an ongoing basis with the identification and evaluation of appropriate acquisi-tion targets on the basis of a clearly defined specification of requirements. As at year-end, 31 December 2018, the group
was comprised of 37 subsidiaries within 7 segments. Of the subsidiaries, there are five companies reporting net sales in excess of MSEK 70 and which, in total, represent approxi-mately 55% of the group’s net sales. Vitec’s business model is based, primarily, on the sale of subscription agreements which are recognized in income on a straight-line basis over the tenor of the agreement, so-called recurring revenues. In 2018, recurring revenues accounted for 73 percent of the group’s reported net sales.
In addition to five larger subsidiaries, the audit of the con-solidated accounts has included, this year, the parent com-pany, Vitec Software Group AB and the larger subsidiaries in Sweden, Norway and Denmark, equivalent to approximately 75 percent of the group’s total external sales. In addition, all companies in the Group with external sales are subject to statutory audit that is carried out in connection with the Group audit.
We designed our audit by determining materiality and as-sessing the risks of material misstatement in the consolidated financial statements. In particular, we considered where man-agement made subjective judgements; for example, in respect of significant accounting estimates that involved making assumptions and considering future events that are inherent-ly uncertain. As in all of our audits, we also addressed the risk of management override of internal controls, including among other matters consideration of whether there was evidence of bias that represented a risk of material misstatement due to fraud.
We tailored the scope of our audit in order to perform sufficient work to enable us to provide an opinion on the con-solidated financial statements as a whole, taking into account the structure of the Group, the accounting processes and controls, and the industry in which the group operates.
MaterialityThe scope of our audit was influenced by our application of materiality. An audit is designed to obtain reasonable assur-ance whether the financial statements are free from material misstatement. Misstatements may arise due to fraud or error. They are considered material if individually or in aggregate, they could reasonably be expected to influence the economic decisions of users taken on the basis of the consolidated financial statements.
Based on our professional judgement, we determined certain quantitative thresholds for materiality, including the overall group materiality for the consolidated financial state-ments as a whole as set out in the table below. These, togeth-er with qualitative considerations, helped us to determine the scope of our audit and the nature, timing and extent of our audit procedures and to evaluate the effect of misstatements, both individually and in aggregate on the financial statements as a whole.
Key audit mattersKey audit matters of the audit are those matters that, in our professional judgment, were of most significance in our audit of the annual accounts and consolidated accounts of the current period. These matters were addressed in the context of our audit of, and in forming our opinion thereon, the annual accounts and consolidated accounts as a whole, but we do not provide a separate opinion on these matters.
102 Vitec Annual Report 2018
Key audit matter How our audit addressed the key audit matter
AcquisitionsDuring the year, Vitec completed four acquisitions in Sweden, Norway and Denmark.
For each business combination, company management prepares an acquisition analysis in which the difference between the net assets in the acquired company and the purchase price is allocated to iden-tify intangible assets in the acquired company. The intangible fixed assets in acquired companies are comprised of product rights, client relationships and brands. Any excess value which does not refer to intangible assets is reported as goodwill.
In order to determine the value of e identified intangible assets, company management is required to undertake estimations and fore-casts regarding the future development of the acquired companies. Client relationships and product rights are written off, in contrast to goodwill and brands, over their expected lifetimes. An incorrect allo-cation of the excess value in an acquisition analysis can, consequently, have a major impact on the financial reporting.
The company acquisitions are complex in nature and the reporting of these is dependent on the manner in which the acquisition agree-ment is formulated, and the reporting involves significant estimations on behalf of management. This is the reason we have deemed that the preparation of the acquisition analyses is a key audit area.
As regards the above-stated accounting principles, refer to pages 75-78 and Note 1 in the 2018 annual report.
We have examined and evaluated the acquisition analyses with a special focus on the manner in which company management identify goodwill and other intangible assets, such as brands and product rights.
We have undertaken this by, amongst other things, performing the following audit activities:
� Obtaining copies of the acquisition agreements and evaluating the terms of those agreements from an accounting perspective.
� Confirmed the paid purchase price against bank account excerpts.
� Assessed the company’s methods and assump-tions to identify intangible assets, such as prod-uct rights, brands and goodwill, and examined the allocation of the excess values of these items.
� Checked acquisition-related costs against under-lying invoices.
� Verified the digressive model for depreciation against historical product lifetimes.
� Based on materiality, we have confirmed that ap-propriate disclosures regarding the acquisition have been provided in the annual report.
Impairment testingThe group’s balance sheet reports acquisition-related excess values and goodwill in a total amount of MSEK 861.
Goodwill and acquisition-related excess values are equivalent to the difference between the value of net assets and the purchase price paid for the acquisition. In contrast with other fixed assets, there is no write-down of goodwill and brands, rather these items are tested annually for impairment or when there is an indication of an impair-ment requirement. Other acquisition-related fixed assets are written off over their calculated useful lifetimes.
Testing, and thereby the reported values, are dependent on the Board of Directors’ and management’s assessments and assumptions regarding, amongst other things, growth and future profitability, and as regards the discount rate. Further events and new information can change these assessments and estimations and it is, therefore, partic-ularly important that company management evaluates, on an ongoing basis, the reported value of acquisition-related intangible assets to ensure that such values can be motivated in consideration of any new information or circumstances. Company management’s calculation of the useful lifetimes of the assets is based on the forthcoming year’s budget and forecasts for the subsequent four years. A closer descrip-tion of these assumptions is found in Note 8.
Impairment testing involves, naturally, a large component of esti-mations and judgments on behalf of company management, which is the reason we have deemed this to comprise a key audit matter in our audit.
As regards the above-stated accounting principles, refer to pages 82-84 and Note 1 in the 2018 annual report.
In our audit, we have placed a special focus on the manner in which the company management’s testing of impairment requirements has been performed.Amongst other things, we have executed the follow-ing audit activities:
� We have evaluated Vitec’s process for testing any impairment requirement of goodwill.
� We have examined the manner in which compa-ny management identified cash generating units and compared them with how Vitec follows up goodwill internally.
� We evaluated the reasonability of the applied as-sumptions and executed sensitivity analyses as regards changed assumptions.
� We compared the calculated value in use with the stock exchange value as at 31 December 2018.
� We evaluated management’s forecast capacity through comparing previously undertaken fore-casts against actual outcome.
� Based on materiality, we confirmed that suffi-cient disclosures had been provided in the Notes in the Annual Report.
Vitec Annual Report 2018 103
Other Information than the annual accounts and consolidated accountsThis document also contains other information than the annual accounts and consolidated accounts and is found on pages 1-29 and 105-107. The Board of Directors and the Managing Director are responsible for this other information.
Our opinion on the annual accounts and consolidated accounts does not cover this other information and we do not express any form of assurance conclusion regarding this other information.
In connection with our audit of the annual accounts and consolidated accounts, our responsibility is to read the information identified above and consider whether the infor-mation is materially inconsistent with the annual accounts and consolidated accounts. In this procedure we also take into account our knowledge otherwise obtained in the audit and assess whether the information otherwise appears to be materially misstated.
If we, based on the work performed concerning this infor-mation, conclude that there is a material misstatement of this other information, we are required to report that fact. We have nothing to report in this regard.
Responsibilities of the Board of Directors and the Managing DirectorThe Board of Directors and the Managing Director are responsible for the preparation of the annual accounts and consolidated accounts and that they give a fair presentation in accordance with the Annual Accounts Act and, concern-ing the consolidated accounts, in accordance with IFRS as adopted by the EU. The Board of Directors and the Managing Director are also responsible for such internal control as they determine is necessary to enable the preparation of annual accounts and consolidated accounts that are free from mate-rial misstatement, whether due to fraud or error.
In preparing the annual accounts and consolidated accounts, The Board of Directors and the Managing Director are responsible for the assessment of the company’s and the group’s ability to continue as a going concern. They disclose, as applicable, matters related to going concern and using the going concern basis of accounting. The going concern basis of accounting is however not applied if the Board of Directors and the Managing Director intend to liquidate the company, to cease operations, or has no realistic alternative but to do so.
Auditor’s responsibilityOur objectives are to obtain reasonable assurance about whether the annual accounts and consolidated accounts as a whole are free from material misstatement, whether due to fraud or error, and to issue an auditor’s report that includes our opinions. Reasonable assurance is a high level of assur-ance, but is not a guarantee that an audit conducted in accor-dance with ISAs and generally accepted auditing standards in Sweden will always detect a material misstatement when it exists. Misstatements can arise from fraud or error and are considered material if, individually or in the aggregate, they could reasonably be expected to influence the economic
decisions of users taken on the basis of these annual accounts and consolidated accounts.
A further description of our responsibility for the audit of the annual accounts and consolidated accounts is available on Revisorsinspektionen’s website: www.revisorsinspektionen.se/revisornsansvar. This description is part of the auditor´s report.
Report on other legal and regulatory requirementsOpinionsIn addition to our audit of the annual accounts and consoli-dated accounts, we have also audited the administration of the Board of Directors and the Managing Director of Vitec Software Group AB (publ) for the year 2018 and the pro-posed appropriations of the company’s profit or loss.We recommend to the general meeting of shareholders that the profit be appropriated in accordance with the proposal in the statutory administration report and that the members of the Board of Directors and the Managing Director be discharged from liability for the financial year.
Basis for OpinionsWe conducted the audit in accordance with generally accepted auditing standards in Sweden. Our responsibilities under those standards are further described in the Auditor’s Responsibilities section. We are independent of the parent company and the group in accordance with professional ethics for accountants in Sweden and have otherwise fulfilled our ethical responsibilities in accordance with these require-ments.
We believe that the audit evidence we have obtained is sufficient and appropriate to provide a basis for our opinions.
Responsibilities of the Board of Directors and the Managing DirectorThe Board of Directors is responsible for the proposal for appropriations of the company’s profit or loss. At the propos-al of a dividend, this includes an assessment of whether the dividend is justifiable considering the requirements which the company’s and the group’s type of operations, size and risks place on the size of the parent company’s and the group’ equity, consolidation requirements, liquidity and position in general.
The Board of Directors is responsible for the company’s organization and the administration of the company’s affairs. This includes among other things continuous assessment of the company’s and the group’s financial situation and ensur-ing that the company´s organization is designed so that the accounting, management of assets and the company’s finan-cial affairs otherwise are controlled in a reassuring manner. The Managing Director shall manage the ongoing adminis-tration according to the Board of Directors’ guidelines and instructions and among other matters take measures that are necessary to fulfill the company’s accounting in accordance with law and handle the management of assets in a reassuring manner.
REVISIONSBERÄTTELSE

104 Vitec Annual Report 2018
Auditor’s responsibilityOur objective concerning the audit of the administration, and thereby our opinion about discharge from liability, is to obtain audit evidence to assess with a reasonable degree of assurance whether any member of the Board of Directors or the Managing Director in any material respect:
� has undertaken any action or been guilty of any omission which can give rise to liability to the company, or
� in any other way has acted in contravention of the Compa-nies Act, the Annual Accounts Act or the Articles of Asso-ciation.
Our objective concerning the audit of the proposed appro-priations of the company’s profit or loss, and thereby our opinion about this, is to assess with reasonable degree of assurance whether the proposal is in accordance with the Companies Act.
Reasonable assurance is a high level of assurance, but is not a guarantee that an audit conducted in accordance with generally accepted auditing standards in Sweden will always detect actions or omissions that can give rise to liability to the company, or that the proposed appropriations of the compa-ny’s profit or loss are not in accordance with the Companies Act.
A further description of our responsibility for the audit of the administration is available on Revisorsinspektionen’s website: www.revisorsinspektionen.se/revisornsansvar. This description is part of the auditor’s report.
The auditor’s examination of the corporate governance statementThe Board of Directors is responsible for that the corporate
governance statement on pages 36-44 has been prepared in accordance with the Annual Accounts Act.Our examination of the corporate governance statement is conducted in accordance with FAR’s auditing standard RevU 16 The auditor’s examination of the corporate governance statement. This means that our examination of the corporate governance statement is different and substantially less in scope than an audit conducted in accordance with Interna-tional Standards on Auditing and generally accepted auditing standards in Sweden. We believe that the examination has provided us with sufficient basis for our opinions.
A corporate governance statement has been prepared. Disclosures in accordance with chapter 6 section 6 the second paragraph points 2-6 of the Annual Accounts Act and chapter 7 section 31 the second paragraph the same law are consistent with the other parts of the annual accounts and consolidated accounts and are in accordance with the Annual Accounts Act.PricewaterhouseCoopers AB, Torsgatan 21, 1139 97 Stock-holm, was appointed auditor of Vitec Software Group AB (publ) by the general meeting of the shareholders on the 23 April 2018 and has been the company’s auditor since the 6 May 2015.
Stockholm March 19, 2019PricewaterhouseCoopers AB
Niklas RenströmAuthorized Public Accountant
Auditor’s report on the statutory sustainability reportTo the general meeting of the shareholders in Vitec Software Group AB (publ), corporate identity number 556258-4804
Engagement and responsibilityIt is the board of directors who is responsible for the statu-tory sustainability report for the year 2018 on pages 14-23 and that it has been prepared in accordance with the Annual Accounts Act.
The scope of the auditOur examination has been conducted in accordance with FAR’s auditing standard RevR 12 The auditor’s opinion regarding the statutory sustainability report. This means that our examination of the statutory sustainability report is sub-
stantially different and less in scope than an audit conducted in accordance with International Standards on Auditing and generally accepted auditing standards in Sweden. We believe that the examination has provided us with sufficient basis for our opinion.
OpinionA statutory sustainability report has been prepared.
Stockholm March 19, 2019PricewaterhouseCoopers AB
Niklas RenströmAuthorized Public Accountant

Vitec Annual Report 2018 105
DEFINITIONS OF KEy FIGURES
Definitions of key indicators
This annual report refers to several financial measurements that are not defined under IFRS, known as “alternative perfor-mance measures,” in accordance with ESMA’s guidelines. These measurements provide senior management and investors with significant information for analyzing trends in the company’s business operations. Alternative performance measures are not always comparable with measurements used by other companies. They are intended to complement, not replace, financial measurements presented in accordance with IFRS. The key figures presented in the multiyear overview on page 45 are defined as follows:
Non-IFRS key indicators Definition Description of usage
Recurring revenues Recurring contractual revenues with no direct relationship between our work efforts and the contracted price. The con-tractual amount is usually billed in advance and the revenues are recognized during the contract’s term.
A key indicator for the manage-ment of operational activities.
Percentage of recurring revenues
Recurring revenues in relation to net sales. A key indicator for the manage-ment of operational activities.
Growth The trend of the company’s net sales in relation to correspond-ing year-earlier period.
Used to monitor the company’s sales trend.
Growth in recurring reve-nues
Trend in recurring revenues in relation to the corresponding year-earlier period.
A key indicator for the manage-ment of operational activities.
Organic growth in recurring revenues
Development of the company’s recurring revenues, excluding acquired companies during the period, in relation to the corre-sponding year-earlier period.
Used to monitor the compa-ny’s sales trend and transition toward recurring revenues.
Earnings growth attribut-able to the Parent Company shareholders
The trend of the company’s profit after tax in relation to the corresponding year-earlier period.
Used to monitor the company’s earnings trend.
Profit margin Profit after tax for the period, in relation to net sales. Used to monitor the company’s earnings trend.
Operating margin Operating profit in relation to net sales. Used to monitor the company’s earnings trend.
EBITDA Earnings before interest, tax, depreciation and amortization for the period.
Indicates the company’s operat-ing profit before depreciation/amortization and interest.
Equity/assets ratio Shareholders' equity, including equity attributable to non-con-trolling interests as a percentage of total assets.
This measurement is an indica-tor of the company’s financial stability.
Equity/assets ratio after full conversion
Shareholders’ equity and convertible debentures as a percent-age of total assets.
This measurement is an indica-tor of the company’s financial stability.
Debt/equity ratio Average debt in relation to average shareholders’ equity and non-controlling interests.
This measurement is an indica-tor of the company’s financial stability.
Average shareholders’ equity
The average between shareholders’ equity for the period attributable to Parent Company shareholders and sharehold-ers’ equity for the preceding period attributable to Parent Company shareholders.
An underlying measurement on which the calculation of other key indicators is based.
Return on capital employed Profit after net financial items plus interest expenses, as a percentage of average capital employed. Capital employed is defined as total assets less interest-free liabilities and deferred tax.
This measurement is an indica-tor of the company’s profit-ability in relation to externally financed capital and sharehold-ers’ equity.
Return on equity Reported profit/loss after tax in relation to average equity attributable to Parent Company shareholders.
This measurement is an indica-tor of the company’s profitabil-ity and gauges the return on shareholders’ equity.
Sales per employee Net sales in relation to the average number of employees. This metric is used to assess the company’s efficiency.
Added value per employee Operating profit/loss plus depreciation/amortization and per-sonnel expenses in relation to average number of employees.
This metric is used to assess the company’s efficiency.
Personnel expenses per employee
Personnel expenses in relation to average number of employ-ees.
A key indicator used to measure operational efficiency.
Average no. of employees Average number of employees in the Group during the finan-cial year.
An underlying measurement on which the calculation of other key indicators is based.
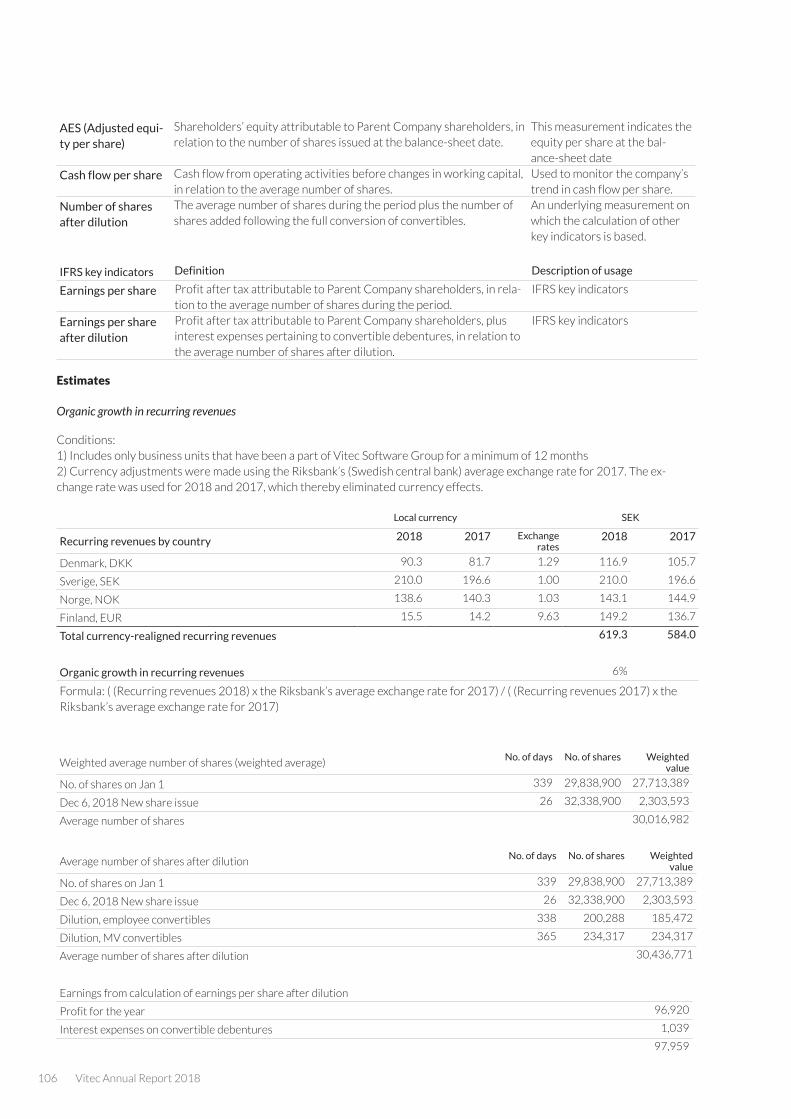
106 Vitec Annual Report 2018
AES (Adjusted equi-ty per share)
Shareholders’ equity attributable to Parent Company shareholders, in relation to the number of shares issued at the balance-sheet date.
This measurement indicates the equity per share at the bal-ance-sheet date
Cash flow per share Cash flow from operating activities before changes in working capital, in relation to the average number of shares.
Used to monitor the company’s trend in cash flow per share.
Number of shares after dilution
The average number of shares during the period plus the number of shares added following the full conversion of convertibles.
An underlying measurement on which the calculation of other key indicators is based.
IFRS key indicators Definition Description of usage
Earnings per share Profit after tax attributable to Parent Company shareholders, in rela-tion to the average number of shares during the period.
IFRS key indicators
Earnings per share after dilution
Profit after tax attributable to Parent Company shareholders, plus interest expenses pertaining to convertible debentures, in relation to the average number of shares after dilution.
IFRS key indicators
Estimates
Organic growth in recurring revenues
Conditions:1) Includes only business units that have been a part of Vitec Software Group for a minimum of 12 months2) Currency adjustments were made using the Riksbank’s (Swedish central bank) average exchange rate for 2017. The ex-change rate was used for 2018 and 2017, which thereby eliminated currency effects.
Local currency SEK
Recurring revenues by country 2018 2017 Exchange rates
2018 2017
Denmark, DKK 90.3 81.7 1.29 116.9 105.7
Sverige, SEK 210.0 196.6 1.00 210.0 196.6
Norge, NOK 138.6 140.3 1.03 143.1 144.9
Finland, EUR 15.5 14.2 9.63 149.2 136.7
Total currency-realigned recurring revenues 619.3 584.0
Organic growth in recurring revenues 6%
Formula: ( (Recurring revenues 2018) x the Riksbank’s average exchange rate for 2017) / ( (Recurring revenues 2017) x the Riksbank’s average exchange rate for 2017)
Weighted average number of shares (weighted average)No. of days No. of shares Weighted
value
No. of shares on Jan 1 339 29,838,900 27,713,389
Dec 6, 2018 New share issue 26 32,338,900 2,303,593
Average number of shares 30,016,982
Average number of shares after dilutionNo. of days No. of shares Weighted
value
No. of shares on Jan 1 339 29,838,900 27,713,389
Dec 6, 2018 New share issue 26 32,338,900 2,303,593
Dilution, employee convertibles 338 200,288 185,472
Dilution, MV convertibles 365 234,317 234,317
Average number of shares after dilution 30,436,771
Earnings from calculation of earnings per share after dilution
Profit for the year 96,920
Interest expenses on convertible debentures 1,039
97,959
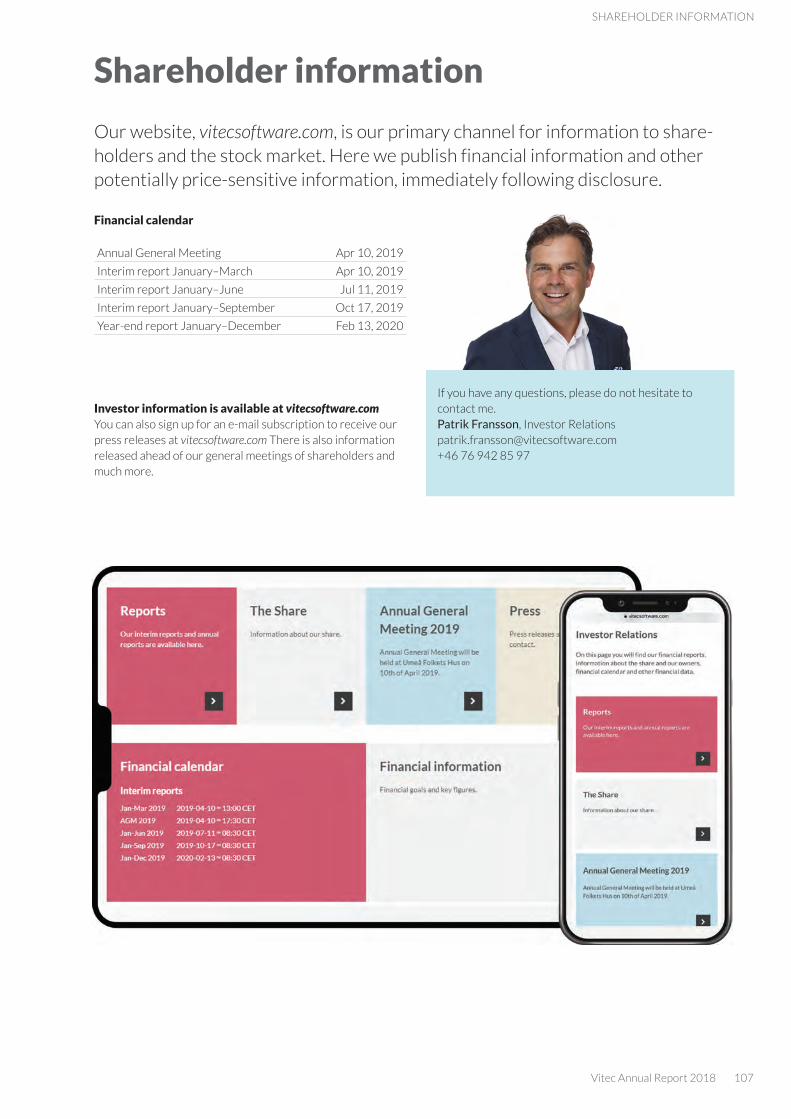
Vitec Annual Report 2018 107
SHAREHOLDER INFORMATION
Shareholder information Our website, vitecsoftware.com, is our primary channel for information to share-holders and the stock market. Here we publish financial information and other potentially price-sensitive information, immediately following disclosure.
Financial calendar
Annual General Meeting Apr 10, 2019
Interim report January–March Apr 10, 2019
Interim report January–June Jul 11, 2019
Interim report January–September Oct 17, 2019
year-end report January–December Feb 13, 2020
Investor information is available at vitecsoftware.comyou can also sign up for an e-mail subscription to receive our press releases at vitecsoftware.com There is also information released ahead of our general meetings of shareholders and much more.
If you have any questions, please do not hesitate to contact me. Patrik Fransson, Investor Relations [email protected]+46 76 942 85 97
Sender: Vitec, Tvistevägen 47A, SE-907 29 Umeå, Sweden
Tel +46 (0)90 15 49 00 vitecsoftware.com