2018 - chicago · figure 1: energy benchmarking reporting rate, 2016 to 2018 as of december 17,...
TRANSCRIPT
CHICAGO ENERGYBENCHMARKING
2018R E P O R T
2018 Chicago Energy Benchmarking Report
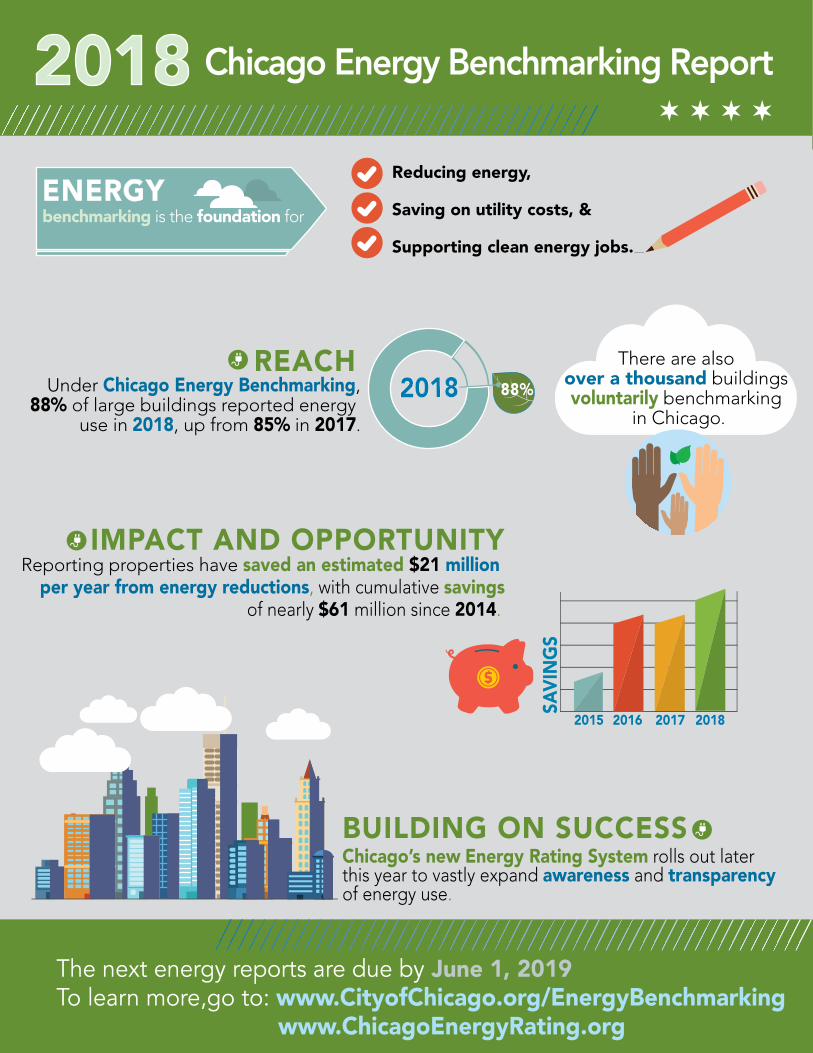
The next energy reports are due by June 1, 2019To learn more,go to: www.CityofChicago.org/EnergyBenchmarking www.ChicagoEnergyRating.org
Chicago’s new Energy Rating System rolls out later this year to vastly expand awareness and transparency of energy use.
BUILDING ON SUCCESS
2018Under Chicago Energy Benchmarking,88% of large buildings reported energy
use in 2018, up from 85% in 2017.
REACH There are also over a thousand buildings voluntarily benchmarking
in Chicago.
Reporting properties have saved an estimated $21 million per year from energy reductions, with cumulative savings
of nearly $61 million since 2014.
IMPACT AND OPPORTUNITY
2015 2016 2017 2018
ENERGYbenchmarking is the foundation for
Reducing energy,
Saving on utility costs, &
Supporting clean energy jobs.
88%
SAVI
NGS

nergy benchmarking is built around a simple idea – that knowledge and awareness can support
informed decisions about energy use. Saving energy in all kinds of buildings – from offices, to schools, to hotels, to houses of worship – is a key strategy to address harmful carbon pollution. But saving energy doesn’t just help reduce emissions; energy efficiency also drives economic development through reduced costs and increased job opportunities for clean, 21st century green jobs.
After five years of implementing the Chicago Energy Benchmarking Ordinance, this idea continues to prove successful. During a time when carbon emissions are going up nationally, we in Chicago are steadfast in our commitment to aggressively reduce our carbon footprint. In the past year, we continued to see improvements in energy performance for large buildings across all neighborhoods in the city. Notably, the buildings with the most experience with benchmarking (3 or more years in a row) appear to be the most successful in reducing their energy use. In addition, over a thousand property owners in Chicago are voluntarily benchmarking energy use.
Later this year, we will implement the new Chicago Energy Rating System. The first of its kind in the
United States, this new Rating System will make it even easier to find and understand how buildings are using energy, and how they could find energy saving opportunities. In addition, we are rolling out a new, voluntary financing program for energy efficiency and renewable energy known as PACE (Property Assessed Clean Energy). More details are found in the pages that follow.
None of this work would be possible without the partnership of many committed groups, from building owners to property managers to operating engineers. We appreciate your daily attention to ensuring that Chicago continues to lead the world on cutting energy waste as we transition to a more sustainable future.
Sincerely,
Rahm EmanuelMayor, City of Chicago
EDEAR FELLOW CHICAGOANS,


TABLE OF CONTENTS
I. Executive Summary 6
II. REACH: Chicago Energy Benchmarking Background and Compliance 8
III. IMPACT: 2018 Benchmarking Results 11
IV. OPPORTUNITY: Ways to Save Energy 17
V. BUILDING ON SUCCESS: Coming in 2019 - the Chicago Energy Rating System 20
VI. ACKNOWLEDGEMENTS 23
VII. APPENDIX 24
2018 CHICAGO ENERGY BENCHMARKING REPORT www.CityOfChicago.org/EnergyBenchmarking

Energy Benchmarking is based on a simple idea – that regularly tracking and reporting energy use and performance metrics is the first step to identifying opportunities to reduce energy use and save on utility bills. The City of Chicago requires large buildings – those over 50,000 square feet – to report their energy use once per year, and to perform additional data verification every three years. The City encourages, but does not require, property owners to make improvements, and the City provides numerous communications to building owners and their representatives on how to get started on saving energy.
In place since 2014, energy benchmarking continues to prove its value. From 2015 to 2018 alone, the median carbon emissions per square foot for reporting buildings has fallen by 22% while median energy use per square foot has fallen by 10% (after adjusting for weather differences from year to year). The property teams making these improvements are collectively saving millions of dollars a year on their utility costs.
I. EXECUTIVE SUMMARY
KEY TAKEAWAYS: Energy benchmarking continues to provide the foundation for saving energy, reducing utility costs, and supporting clean energy jobs throughout the city. In addition, over a thousand buildings across the City are benchmarking on a voluntary basis due to the many benefits of regularly tracking energy performance.
1 REACHCompliance with the Chicago Energy Benchmarking Ordinance is high and continues to steadily increase every year.
• In 2018, 2,849 properties spanning over 705 million square feet tracked and reported energy use, an increase of 69 properties over 2017
• The 2018 reporting rate by number of properties was 88%, which is 3% higher than the 2017 reporting rate of 85%.
• Over a thousand buildings are voluntarily benchmarking in the City of Chicago.
IMPACTThe bulk of Chicago properties required to benchmark continue to perform well above national averages, based on a median ENERGY STAR score of 63 out of 100. Those that consistently benchmark for two or more years in a row continue to find ways to improve energy performance.
• Energy use per square foot for all reporting buildings has dropped by 10 percent from the 2015 to 2018 reporting years.
• Properties reporting for two or more years in a row have saved 1-2% energy use per year, and estimated savings for these properties equal $21.1 million per year and nearly $61 million cumulative savings since 2014.
• These savings are equivalent to taking nearly 400,000 cars off the road.
2
2018 CHICAGO ENERGY BENCHMARKING REPORT www.CityOfChicago.org/EnergyBenchmarking6
I. EXECUTIVE SUMMARY
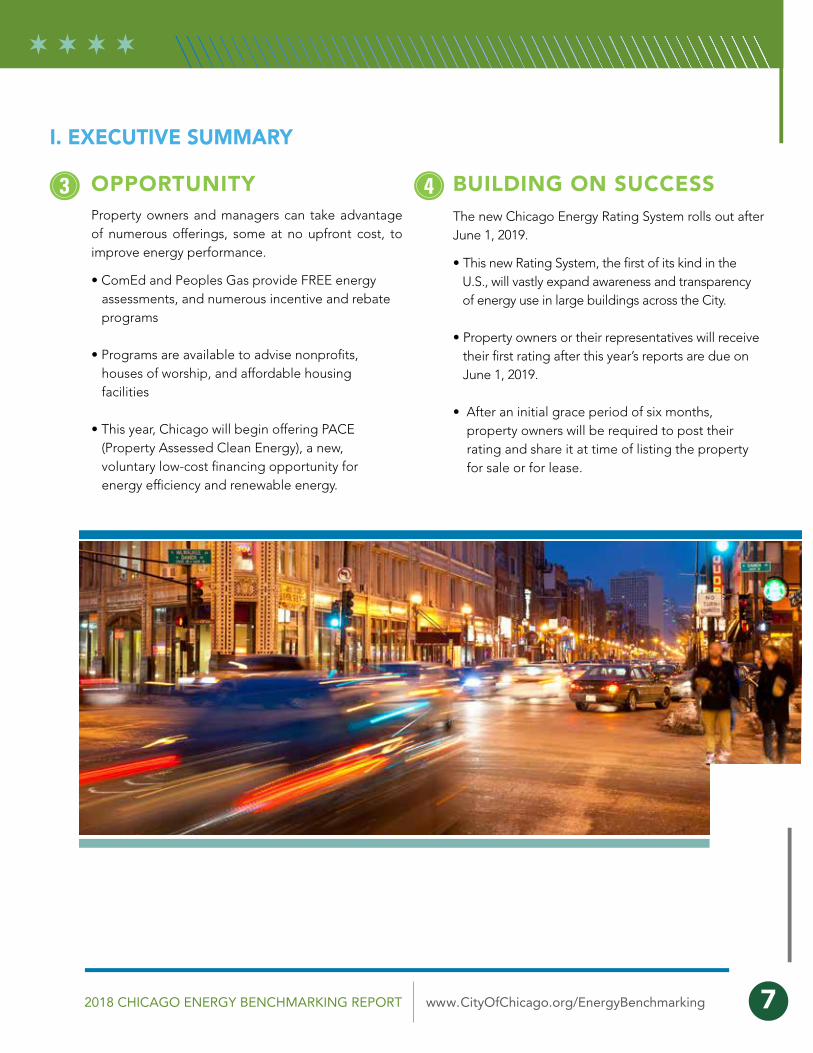
OPPORTUNITYProperty owners and managers can take advantage of numerous offerings, some at no upfront cost, to improve energy performance.
• ComEd and Peoples Gas provide FREE energy assessments, and numerous incentive and rebate programs
• Programs are available to advise nonprofits, houses of worship, and affordable housing facilities
• This year, Chicago will begin offering PACE (Property Assessed Clean Energy), a new, voluntary low-cost financing opportunity for energy efficiency and renewable energy.
BUILDING ON SUCCESSThe new Chicago Energy Rating System rolls out after June 1, 2019.
• This new Rating System, the first of its kind in the U.S., will vastly expand awareness and transparency of energy use in large buildings across the City.
• Property owners or their representatives will receive their first rating after this year’s reports are due on June 1, 2019.
• After an initial grace period of six months, property owners will be required to post their rating and share it at time of listing the property for sale or for lease.
3 4
2018 CHICAGO ENERGY BENCHMARKING REPORT www.CityOfChicago.org/EnergyBenchmarking 7
OVERVIEWThe goal of the Chicago Energy Benchmarking Ordinance (adopted in 2013 and first implemented in 2014) is to increase awareness of energy performance through information and transparency. Approximately 3,500 buildings that are 50,000 square feet or greater are required to measure and report energy use once per year and also complete additional data verification every three years.
COMPLIANCE SUMMARYCompliance with the Chicago Energy Benchmarking Ordinance is high and continues to steadily increase every year. The 2018 reporting rate by number of properties was 88%, which is 3% higher than the 2017 reporting rate of 85%.
2018 Reporting, by the Numbers:• 2,849 total reporting properties, 69 more than in 2017• ~20% of citywide carbon emissions represented by reporting properties• 88% reporting rate, 3% higher than in 2017
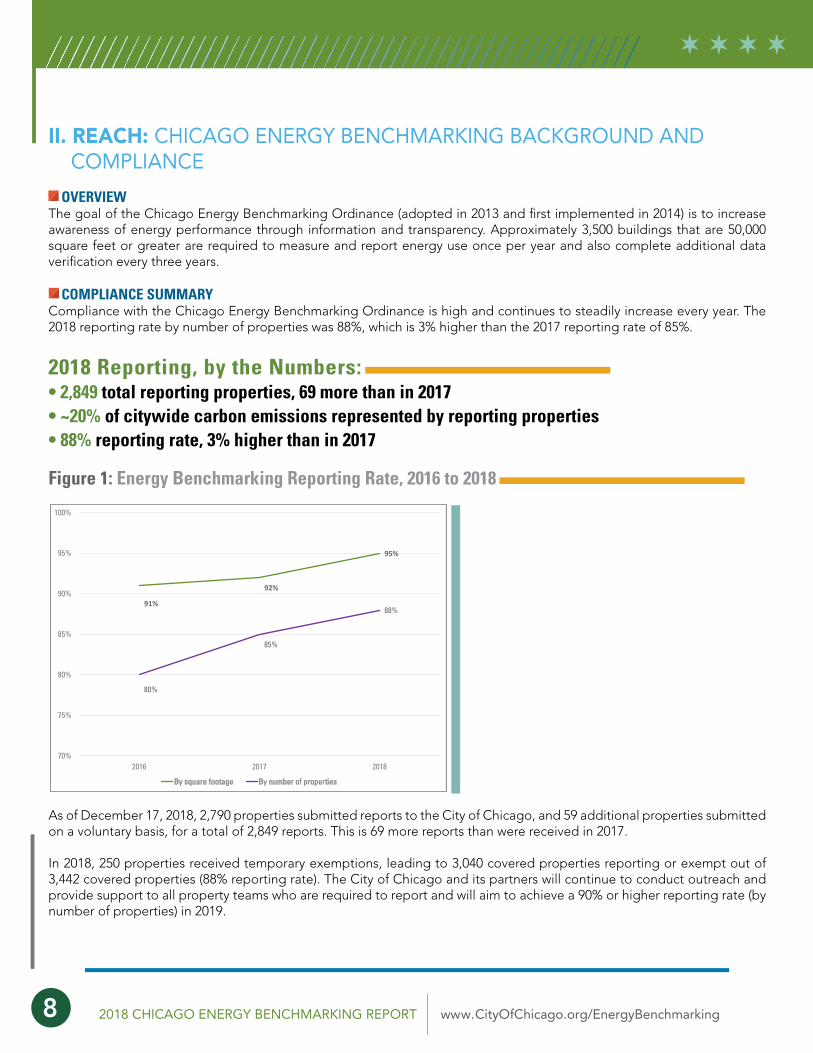
Figure 1: Energy Benchmarking Reporting Rate, 2016 to 2018
As of December 17, 2018, 2,790 properties submitted reports to the City of Chicago, and 59 additional properties submitted on a voluntary basis, for a total of 2,849 reports. This is 69 more reports than were received in 2017.
In 2018, 250 properties received temporary exemptions, leading to 3,040 covered properties reporting or exempt out of 3,442 covered properties (88% reporting rate). The City of Chicago and its partners will continue to conduct outreach and provide support to all property teams who are required to report and will aim to achieve a 90% or higher reporting rate (by number of properties) in 2019.
II. REACH: CHICAGO ENERGY BENCHMARKING BACKGROUND AND COMPLIANCE
91%
92%
95%
80%
85%
88%
70%
75%
80%
85%
90%
95%
100%
2016 2017 2018
By square footage By number of properties
8 2018 CHICAGO ENERGY BENCHMARKING REPORT www.CityOfChicago.org/EnergyBenchmarking

VOLUNTARY BENCHMARKING – SPREADING IMPACT TO ALL PROPERTIES
2018 CHICAGO ENERGY BENCHMARKING REPORT www.CityOfChicago.org/EnergyBenchmarking 9
Figure 2: Required and Voluntary Benchmarking in the City of Chicago, 2018 (Approximate)
There are over a thousand properties that voluntarily benchmark and are not required to report to the City, according to information provided by the U.S. Environmental Protection Agency (which maintains the ENERGY STAR Portfolio Manager benchmarking tool). In Chicago, over 4,400 properties are using Portfolio Manager to benchmark their properties, as of November 2018. Of those 4,400, over 1,800 are not required to benchmark but choose to (possibly due to the many benefits from tracking energy use). The City of Chicago commends those who are voluntarily benchmarking and will encourage additional building owners to do so.
Required (64%)
Buildings less than 25,000 sq ft (23%)
Buildings 25,000 - 49,999 sq ft (7%)
Non covered space uses (6%)
Voluntary (36%)
Based on Chicago Energy Benchmarking results and information provided by the U.S. Environmental Protection Agency (EPA). Please note that data in Portfolio Manager is voluntarily submitted and self-reported. While EPA applied filters to remove likely test and duplicate properties, the Agency did not review and verify data at the individual building level.
10 2018 CHICAGO ENERGY BENCHMARKING REPORT www.CityOfChicago.org/EnergyBenchmarking
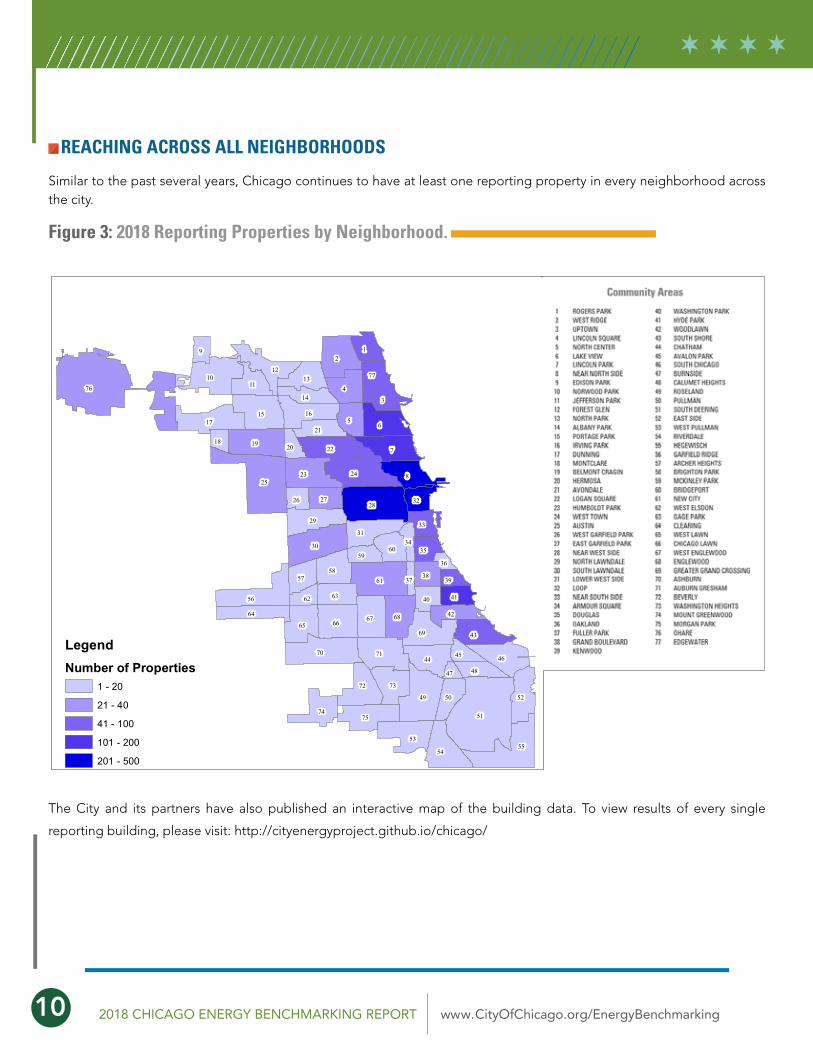
REACHING ACROSS ALL NEIGHBORHOODS
Similar to the past several years, Chicago continues to have at least one reporting property in every neighborhood across the city.
Figure 3: 2018 Reporting Properties by Neighborhood.
The City and its partners have also published an interactive map of the building data. To view results of every single
reporting building, please visit: http://cityenergyproject.github.io/chicago/
76
51
25
28
2
55
70
61
49
7
6
30
10
24
56
8
15
19
4
71
17
23
22
53
6966
54
3
46
75
16
29
12
72
67 68
5
52
65
44
43
31
73
1
58
74
64
1311
63
50
60
42
57
21
27
14
33
48
77
38
9
32
35
4140
59
26
45
62
20
39
18
47
34
37
36
LegendNumber of Properties
1 - 20
21 - 40
41 - 100
101 - 200
201 - 500

2018 CHICAGO ENERGY BENCHMARKING REPORT www.CityOfChicago.org/EnergyBenchmarking 11
PROPERTIES ANALYZED IN 2018
Energy benchmarking reports from 2,532 properties are included in this analysis, and these buildings are referred to as “analyzed properties.” (For more details on the analysis methodology, please see the Appendix.) Each property is assigned to one of eight property groups.
The total square footage of all analyzed properties is over 705 million square feet (including both buildings and parking). A breakdown of the square footage by type of building is shown in Figure 4, and the breakdown of energy use by type of building is shown in Figure 5. Multifamily housing continues to be the largest by both square footage and percentage of energy use, followed by offices and then “other” space uses.
Figure 4: Square Footage by Property Type
III. IMPACT: 2018 BENCHMARKING RESULTS
K-12 School7%
Lodging6% Higher Education
2%
Multifamily Housing42%
Healthcare 4%
Office 25%
Retail4%
Other10%
n=2,532
0%
10%
20%
30%
40%
50%
60%
70%
80%
90%
100%
Percentage of Total Site Energy Use
Healthcare
K-12 School
Lodging
Mutifamily Housing
Office
Other
Retail
Higher Education
n=2,532
Figure 5: Percentage of Site Energy Use by Property Type
12 2018 CHICAGO ENERGY BENCHMARKING REPORT www.CityOfChicago.org/EnergyBenchmarking
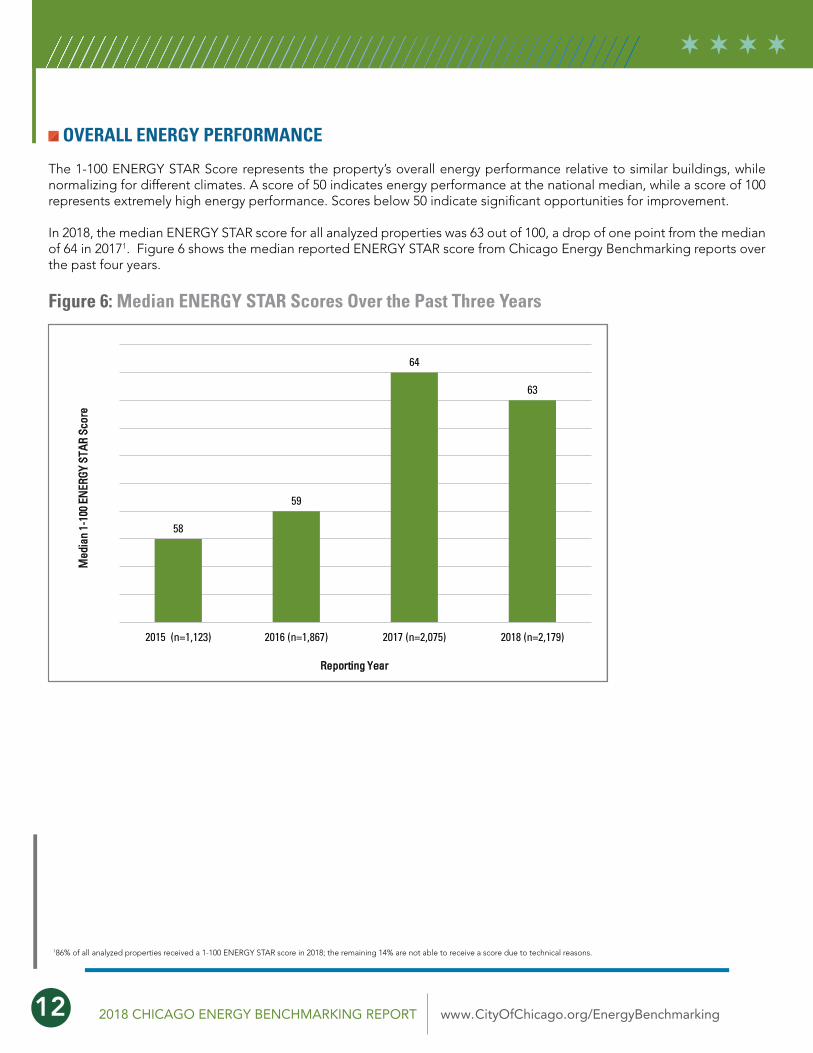
OVERALL ENERGY PERFORMANCE
The 1-100 ENERGY STAR Score represents the property’s overall energy performance relative to similar buildings, while normalizing for different climates. A score of 50 indicates energy performance at the national median, while a score of 100 represents extremely high energy performance. Scores below 50 indicate significant opportunities for improvement.
In 2018, the median ENERGY STAR score for all analyzed properties was 63 out of 100, a drop of one point from the median of 64 in 20171. Figure 6 shows the median reported ENERGY STAR score from Chicago Energy Benchmarking reports over the past four years.
Figure 6: Median ENERGY STAR Scores Over the Past Three Years
186% of all analyzed properties received a 1-100 ENERGY STAR score in 2018; the remaining 14% are not able to receive a score due to technical reasons.
58
59
64
63
2015 (n=1,123) 2016 (n=1,867) 2017 (n=2,075) 2018 (n=2,179)
Med
ian
1-10
0 EN
ERGY
STA
R Sc
ore
Reporting Year

2018 CHICAGO ENERGY BENCHMARKING REPORT www.CityOfChicago.org/EnergyBenchmarking 13
Mirroring the very slight decline of one point for all analyzed properties, the median ENERGY STAR score either remained the same or decreased slightly for most of the eight property sectors from 2015 to 2018. (See Figure 7). A median score of 63 is still well above the national median of 50, indicating the Chicago properties over 50,000 square feet are performing better than the majority of buildings in the U.S. However, median scores are expected to drop in the 2019 reporting year due to regular updates implemented to the ENERGY STAR Portfolio Manager system in August 2018.
Figure 7: ENERGY STAR Scores by Building Sector Reported from 2015-2018
TREND ANALYSIS
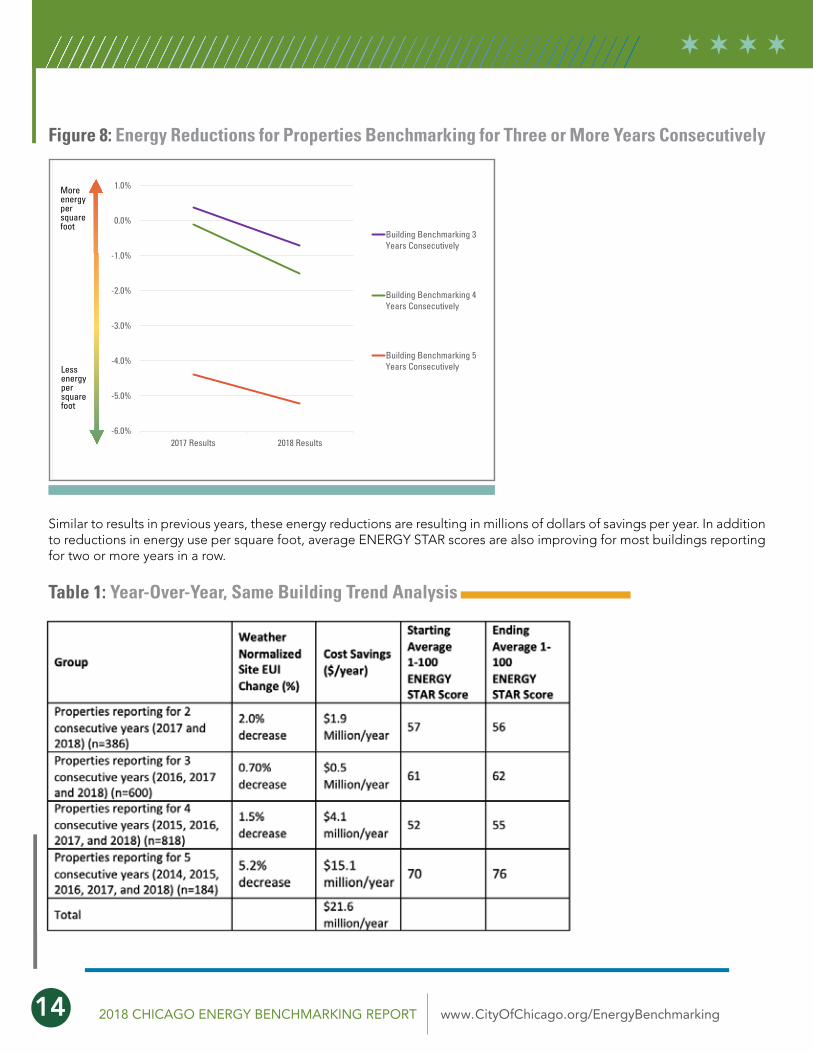
The properties that measure and report energy use for two or more years in a row continue to see energy reductions and cost savings. On average, properties that have been benchmarking two, three, four or five years consecutively are reducing energy use per square foot by 0.5 to 2% per year, based on weather normalized energy use per square foot (which takes into account changes in weather from year to year, as well as changes in the property size).
Properties with three or more years of consecutive reporting all show energy savings (as measured by declines in energy use per square foot) in the past year, as shown in Figure 8. These results suggest that properties with more years of consecutive benchmarking and reporting are saving more energy, possibly due to increased experience with managing energy over time.
80
55
63
61
60
46
43
79
57
63
63
61
47
42
79
67
59
59
55
41
36
74
66
64
54
43
35
37
0 10 20 30 40 50 60 70 80 90
Office
Other
Retail
K-12 school
Multifamily Housing
Healthcare
Lodging
ENERGY STAR Score
Bui
ldin
g Se
ctor
2015 Median ENERGYSTAR Score
2016 Median ENERGYSTAR Score
2017 Median ENERGYSTAR Score
2018 Median ENERGYSTAR Score
14 2018 CHICAGO ENERGY BENCHMARKING REPORT www.CityOfChicago.org/EnergyBenchmarking
Figure 8: Energy Reductions for Properties Benchmarking for Three or More Years Consecutively
Similar to results in previous years, these energy reductions are resulting in millions of dollars of savings per year. In addition to reductions in energy use per square foot, average ENERGY STAR scores are also improving for most buildings reporting for two or more years in a row.
Table 1: Year-Over-Year, Same Building Trend Analysis
-6.0%
-5.0%
-4.0%
-3.0%
-2.0%
-1.0%
0.0%
1.0%
2017 Results 2018 Results
Building Benchmarking 3Years Consecutively
Building Benchmarking 4Years Consecutively
Building Benchmarking 5Years Consecutively
More energy per square foot
Less energy per square foot
2018 CHICAGO ENERGY BENCHMARKING REPORT www.CityOfChicago.org/EnergyBenchmarking 15
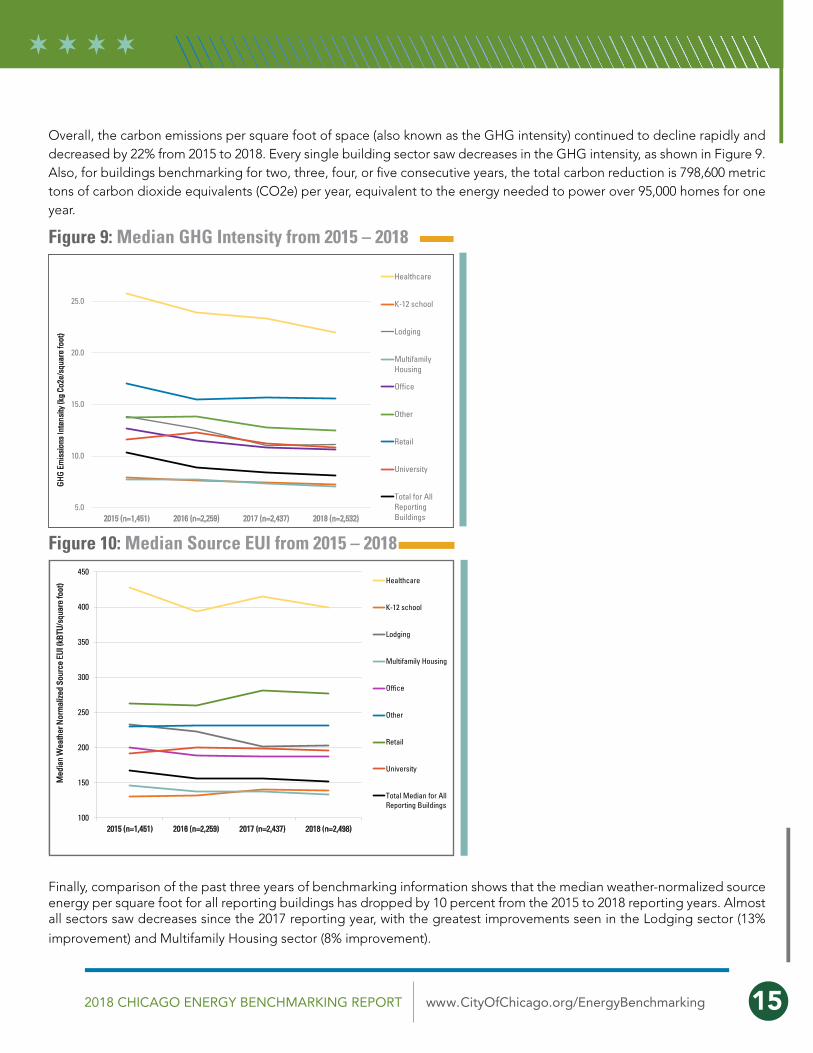
Overall, the carbon emissions per square foot of space (also known as the GHG intensity) continued to decline rapidly and decreased by 22% from 2015 to 2018. Every single building sector saw decreases in the GHG intensity, as shown in Figure 9. Also, for buildings benchmarking for two, three, four, or five consecutive years, the total carbon reduction is 798,600 metric tons of carbon dioxide equivalents (CO2e) per year, equivalent to the energy needed to power over 95,000 homes for one year.
Figure 9: Median GHG Intensity from 2015 – 2018
Figure 10: Median Source EUI from 2015 – 2018
Finally, comparison of the past three years of benchmarking information shows that the median weather-normalized source energy per square foot for all reporting buildings has dropped by 10 percent from the 2015 to 2018 reporting years. Almost all sectors saw decreases since the 2017 reporting year, with the greatest improvements seen in the Lodging sector (13%
improvement) and Multifamily Housing sector (8% improvement).
5.0
10.0
15.0
20.0
25.0
2015 (n=1,451) 2016 (n=2,259) 2017 (n=2,437) 2018 (n=2,532)
GH
G E
mis
sion
s In
tens
ity (k
g Co
2e/s
quar
e fo
ot)
Healthcare
K-12 school
Lodging
MultifamilyHousing
Office
Other
Retail
University
Total for AllReportingBuildings
100
150
200
250
300
350
400
450
2015 (n=1,451) 2016 (n=2,259) 2017 (n=2,437) 2018 (n=2,498)
Med
ian
Wea
ther
Nor
mal
ized
Sou
rce
EUI (
kBTU
/squ
are
foot
) Healthcare
K-12 school
Lodging
Multifamily Housing
Office
Other
Retail
University
Total Median for AllReporting Buildings
16 2018 CHICAGO ENERGY BENCHMARKING REPORT www.CityOfChicago.org/EnergyBenchmarking
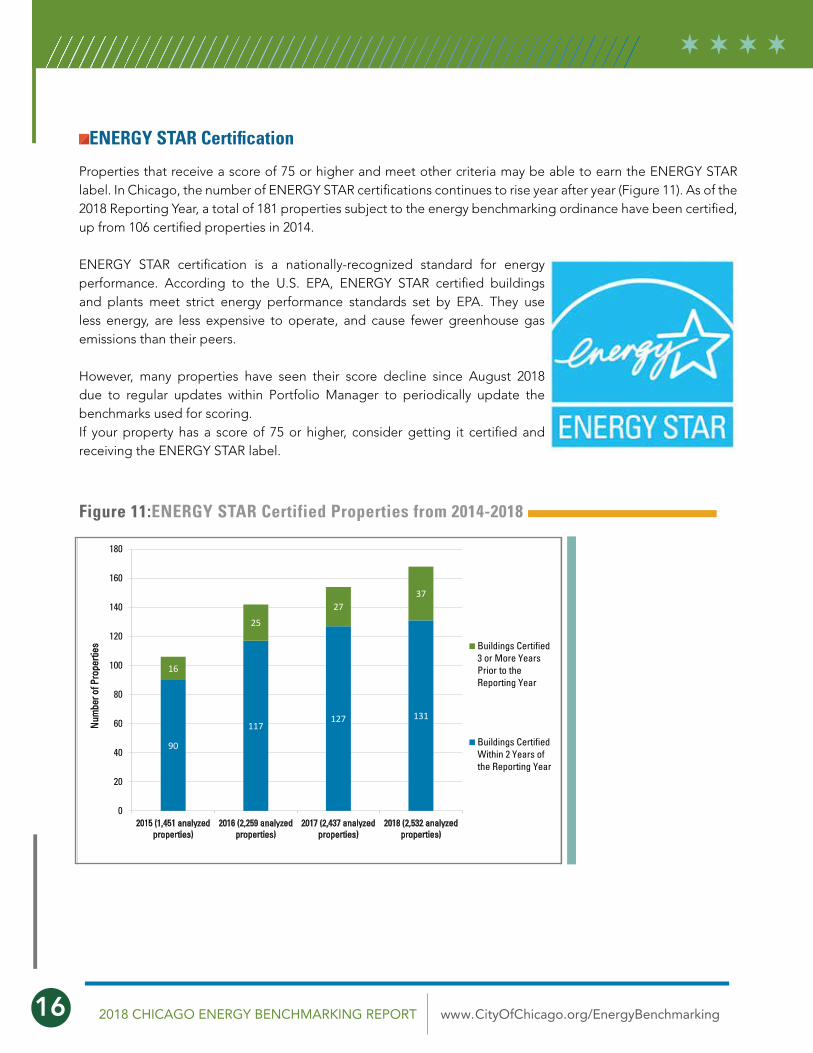
Properties that receive a score of 75 or higher and meet other criteria may be able to earn the ENERGY STAR label. In Chicago, the number of ENERGY STAR certifications continues to rise year after year (Figure 11). As of the 2018 Reporting Year, a total of 181 properties subject to the energy benchmarking ordinance have been certified, up from 106 certified properties in 2014.
ENERGY STAR certification is a nationally-recognized standard for energy performance. According to the U.S. EPA, ENERGY STAR certified buildings and plants meet strict energy performance standards set by EPA. They use less energy, are less expensive to operate, and cause fewer greenhouse gas emissions than their peers.
However, many properties have seen their score decline since August 2018 due to regular updates within Portfolio Manager to periodically update the benchmarks used for scoring. If your property has a score of 75 or higher, consider getting it certified and receiving the ENERGY STAR label.
ENERGY STAR Certification
90
117127 131
16
25
2737
0
20
40
60
80
100
120
140
160
180
2015 (1,451 analyzedproperties)
2016 (2,259 analyzedproperties)
2017 (2,437 analyzedproperties)
2018 (2,532 analyzedproperties)
Num
ber o
f Pro
perti
es Buildings Certified3 or More YearsPrior to theReporting Year
Buildings CertifiedWithin 2 Years ofthe Reporting Year
Figure 11:ENERGY STAR Certified Properties from 2014-2018

2018 CHICAGO ENERGY BENCHMARKING REPORT www.CityOfChicago.org/EnergyBenchmarking 17
COMED AND PEOPLES GAS INCENTIVE AND REBATE PROGRAMS
Both Commonwealth Edison (ComEd) and Peoples Gas offer free programs to help you save energy, which are funded through a small fee on all ratepayers’ energy bills.
CONDUCT AN ENERGY ASSESSMENT
One way to get started is to ask ComEd and/or Peoples Gas to conduct a FREE energy assessment, which can provide reviews of energy-consuming equipment and operations to help you gain a better understanding of possible improvements. Start by conducting an energy assessment if you have not done so in the last two to three years; most properties are eligible. The process will help you identify low-cost and no-cost opportunities specific to your property. To find out more, contact the utilities today:
• ComEd: Phone: 855.433.2700 Website: https://www.comed.com/WaysToSave/ ForYourBusiness/Pages/FacilityAssessments.aspx
• Peoples Gas: Phone: 855.849.8928 Website: http://www.peoplesgasdelivery.com/ business/rebates.aspx
UTILITY INCENTIVE AND REBATE PROGRAMS
If you have already conducted an assessment or audit, or you have already identified specific projects to retrofit your property, be sure to consider using one of the utility rebate and incentive programs to help finance your project:
Commercial, Institutional, and Public Buildings:
• ComEd’s Energy Efficiency program can help reduce building energy use. Incentives and support programs help businesses drive energy savings and an improved bottom line. For more information, please visit: https://www.comed.com/ WaysToSave/ForYourBusiness/Pages/Default.aspx
• Peoples Gas Natural Gas Savings Program offers incentives to encourage business customers make energy-efficient improvements to reduce energy use and enhance workplace comfort. For more information, please visit: https://accel. peoplesgasdelivery.com/business/rebates.aspx
Multifamily Residential Buildings:
• ComEd and Peoples Gas offer building managers and owners energy efficiency upgrades and incentives through the Multi-Family Comprehensive Energy Efficiency Program: https://accel.peoplesgasdelivery.com/home/ rebates_multifamily.aspx
• ComEd’s Marketplace Website: Current listings of product offerings and discounts: https://www. comedmarketplace.com/
IV. OPPORTUNITY: WAYS TO SAVE ENERGY
18 2018 CHICAGO ENERGY BENCHMARKING REPORT www.CityOfChicago.org/EnergyBenchmarking
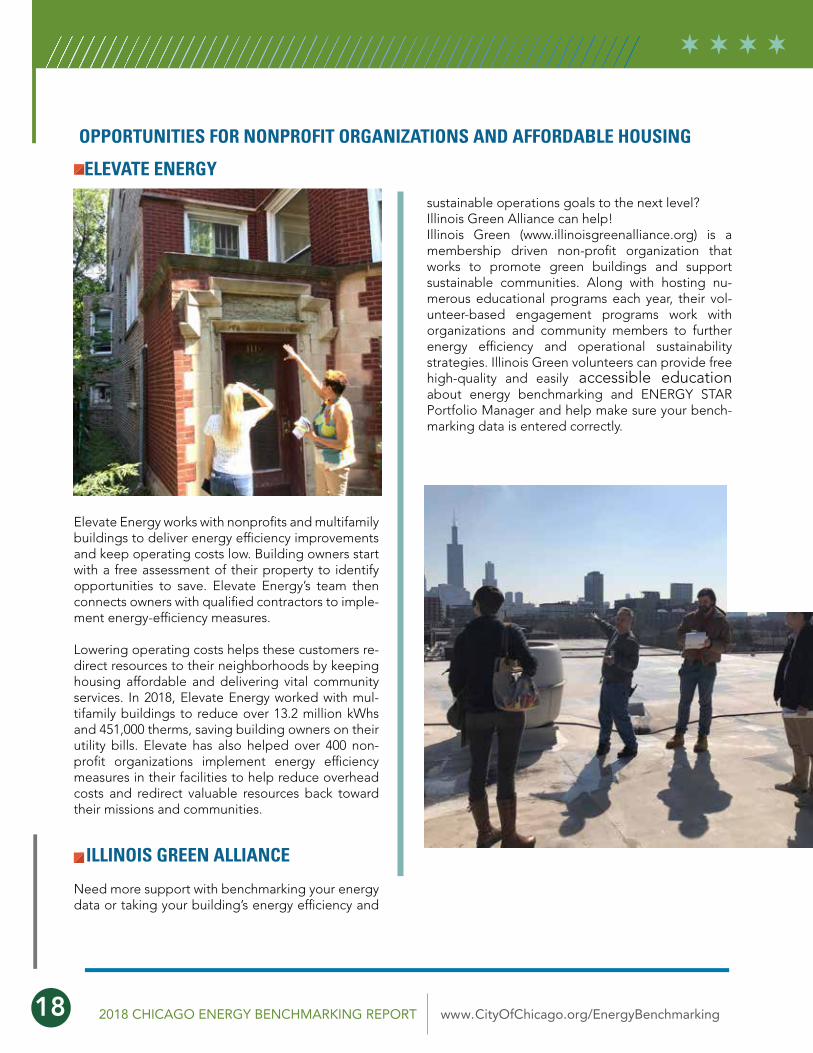
Elevate Energy works with nonprofits and multifamily buildings to deliver energy efficiency improvements and keep operating costs low. Building owners start with a free assessment of their property to identify opportunities to save. Elevate Energy’s team then connects owners with qualified contractors to imple-ment energy-efficiency measures.
Lowering operating costs helps these customers re-direct resources to their neighborhoods by keeping housing affordable and delivering vital community services. In 2018, Elevate Energy worked with mul-tifamily buildings to reduce over 13.2 million kWhs and 451,000 therms, saving building owners on their utility bills. Elevate has also helped over 400 non-profit organizations implement energy efficiency measures in their facilities to help reduce overhead costs and redirect valuable resources back toward their missions and communities.
ILLINOIS GREEN ALLIANCE
Need more support with benchmarking your energy data or taking your building’s energy efficiency and
sustainable operations goals to the next level? Illinois Green Alliance can help! Illinois Green (www.illinoisgreenalliance.org) is a membership driven non-profit organization that works to promote green buildings and support sustainable communities. Along with hosting nu-merous educational programs each year, their vol-unteer-based engagement programs work with organizations and community members to further energy efficiency and operational sustainability strategies. Illinois Green volunteers can provide free high-quality and easily accessible education about energy benchmarking and ENERGY STAR Portfolio Manager and help make sure your bench-marking data is entered correctly.
OPPORTUNITIES FOR NONPROFIT ORGANIZATIONS AND AFFORDABLE HOUSING
ELEVATE ENERGY

2018 CHICAGO ENERGY BENCHMARKING REPORT www.CityOfChicago.org/EnergyBenchmarking 19
Efficient Chicago is an Illinois Green program that supports non-profit organizations, affordable housing properties, houses of worship, and public sector buildings (including public schools) to advance efficiency in their facilities and achieve their operational sustainability goals. Illinois Green staff and volunteers work with an organization to understand what they would like to accomplish in their building and can provide pro-bono support or direction to available resources, as needed. For example, Illinois Green and its partners can conduct a walkthrough to better understand how a facility can improve their
water or energy use or provide education to building occupants or the community about energy efficiency or environmental sustainability topics.
Efficiency and sustainability are important initiatives to consider for any building (small or large, newly built or older construction) to help save energy and money on utility bills and strengthen local communities. If you would like to learn more about Illinois Green Alliance and the Efficient Chicago program, or request more information and support, please visit their webpage at www.illinoisgreenalliance.org/initiatives/efficient-chicago, or contact Laurel Kruke (Program Manager) at [email protected] or (312) 245-8300. Illinois Green looks forward to helping make Chicago and Illinois buildings more efficient and sustainable!
NEW FINANCING OPPORTUNITY: PROPERTY ASSESSED CLEAN ENERGY (PACE)
Following upon successes in other cities and states, the Illinois State Legislature authorized local municipalities to set up Property Assessed Clean Energy (PACE) programs in 2017. The Chicago City Council then voted on October 31, 2018 to create and launch the Chicago PACE program, to be available citywide. Chicago PACE is expected to launch by late spring 2019.
PACE is a new, voluntary financing program available to the following types of properties:• Commercial and industrial properties• Multifamily residential apartment buildings or cooperative housing properties with 5 or more units• Nonprofit properties
Chicago PACE makes it possible for owners and developers of eligible properties to obtain low-cost, long-term financing for energy efficiency, sustainability and/or renewable energy projects in new or existing buildings. Up to 100% of the “green” infrastructure elements and associated soft costs (permitting, engineering studies, etc.) can be financed with no money down and then repaid as a special assessment on the property tax bill over a term that matches the useful life of improvements (often as long as 20-30 years). The financing offers a fixed interest rate, and projects typically have a net positive cash flow in the first year. Additional advantages include the assessment transfers on sale to the new owner.
For more information, please visit: www.ChicagoPACE.org

20 2018 CHICAGO ENERGY BENCHMARKING REPORT www.CityOfChicago.org/EnergyBenchmarking
In November 2017, the Chicago City Council voted to update the existing Chicago Energy Benchmarking Ordinance and create a new Chicago Energy Rating System, which improves the visibility and transparency of the reported information, while also making the information easier to understand. The new system is a zero to four star rating. Each building over 50,000 square feet that is subject to the Chicago Energy Benchmarking ordinance will receive a rating between zero and four stars, starting after June 1, 2019. These properties will be required to post their rating in a prominent location on the property and share this information at the time of sale or lease listing.
2019The first ratings will be assigned after energy benchmarking reports are due on June 1, 2019, likely by August 1, 2019. Once the first ratings are assigned in 2019, building owners will receive an initial six-month grace period, and then will be required to post their Chicago Energy Rating Placard after the end of this initial grace period. Property owners may voluntarily choose to post their Placards during this initial six-month grace period.
2020 and BeyondStarting in 2020, the Ratings will be assigned shortly after the June 1st energy benchmarking deadline. Building owners will not receive a grace period in 2020 or any following year and will be required to post their Placard(s) as soon as they are available.
HOW RATINGS ARE ASSIGNEDProperties in compliance with benchmarking reporting will receive between one and four stars on a four-star rating system, based on their 1-100 ENERGY STAR score. Properties with one, two, or three stars will be able to earn an additional star if they have improved by at least 10 points in the past two reporting years. Properties that are not eligible to receive a 1-100 ENERGY STAR score (between ten and fifteen percent of reporting properties) will receive a rating based on energy use per square foot in comparison to national medians for properties of a similar size and type. Properties that have not submitted energy benchmarking information will receive zero out of four stars.
The initial ratings will be based on the following scale:
V. BUILDING ON SUCCESS: COMING IN 2019 - THE CHICAGO ENERGY RATING SYSTEM
TIM
EL
INE

2018 CHICAGO ENERGY BENCHMARKING REPORT www.CityOfChicago.org/EnergyBenchmarking 21
WHY THE CITY OF CHICAGO ADOPTED THE CHICAGO ENERGY RATING SYSTEM
The original Chicago Energy Benchmarking ordinance allows the City to publicly share the ENERGY STAR scores and other metrics for each property subject to the energy benchmarking requirements. However, the information may not always be simple to understand to those outside of the real estate industry and is not highly visible at each building site. Many tenants, visitors, building engineers, and even property managers may not know their score, or may not know what it means. The goal of the new Chicago Energy Rating System is to improve the transparency of the information and make it easier to understand.
The new four star system is designed to help translate the 1-100 score into a form that is easier to understand by all building stakeholders. Consider this example. If you took a test and received a score of 50 out of 100, you might be disappointed in your performance. However, a 50 on the 1-100 ENERGY STAR score scale represents an average building for energy performance, earning 2 out of 4 stars. Similarly, if you took a test and received a score of 75 out of 100, you might be still disappointed in your performance. Yet, a 75 on the 1-100 ENERGY STAR score scale represents a fairly high performer, earning 3.5 out of 4 stars.
NEW WATER DATA NOW AVAILABLEThe City is also now authorized to collect each building’s water usage information from the Department of Water Management and/or the Department of Finance, and then to publish that information, along with each building’s reported energy use information. It is important to note that building owners are not required to gather and report water usage information using the ENERGY STAR Portfolio Manager energy benchmarking tool, although they can voluntarily choose to do so.
Data on water costs will not be shared, and only the total water usage data will be collected and published for each property. In addition, building owners will be able to opt out of having their water data shared publicly.
Similar to 2017 results, approximately 20% of property teams are voluntarily using ENERGY STAR Portfolio Manager to track water use. The median water use for these properties was about 18 gallons per square foot annually, similar but slightly lower than the national median of 20 gallons per square foot annually. More accurate data is expected to be available after the new water transparency provisions go into effect later this year.
Example: Chicago Energy Rating Placard

22 2018 CHICAGO ENERGY BENCHMARKING REPORT www.CityOfChicago.org/EnergyBenchmarking
WHAT YOU NEED TO DOThere is no new reporting requirement under the Chicago Energy Rating System. In 2019, the City will issue the first Energy Rating to each property subject to the energy benchmarking ordinance, and the property owner will be required to post their rating in a prominent location, as well as share the rating at the time the property is listed for sale or lease after an initial six month grace period.
1. Ensure you are in compliance with energy benchmarking: Building owners should ensure they are in full compliance with the Chicago Energy Benchmarking Ordinance by June 1, 2019. Any building owner out of compliance will receive zero out of four stars in the new Chicago Energy Rating System. Detailed instructions on how to comply are found online at: www.CityofChicago.org/EnergyBenchmarking
2. Make sure you receive a Chicago Energy Rating Placard: Starting in summer 2019, building owners or property managers will receive their Chicago Energy Rating Placard by mail. If you do not receive it by mail, you will be able to go online to download your placard for printing.
3. Post the Chicago Energy Rating Placard and share at time of listing for sale or lease after the initial grace period: The first ratings will be assigned and provided in summer 2019. For 2019 only, building owners will have a six-month grace period. Once this grace period ends, building owners will be required to post their Chicago Energy Rating Placard in a prominent location. Building owners will also be required to share the Placard at time of listing for lease or sale after the grace period ends. Building owners may also voluntarily post their Placard(s) during the grace period.

2018 CHICAGO ENERGY BENCHMARKING REPORT www.CityOfChicago.org/EnergyBenchmarking 23
VI. ACKNOWLEDGEMENTS
CHICAGO ENERGY BENCHMARKING / CHICAGO ENERGY RATING SYSTEM PARTNERS
• ABOMA• ASHRAE – Illinois• American Institute of Architects – Chicago Chapter• BOMA - Chicago• C40 Cities Climate Leadership Group• Chicagoland Apartment Association• Chicago Association of REALTORS• City Energy Project• Elevate Energy • Enterprise Community Partners• Illinois Environmental Council• Institute for Market Transformation• Midwest Energy Efficiency Alliance• Natural Resources Defense Council• Seventhwave• Sierra Club• Illinois Green Alliance (formerly known as the U.S. Green Building Council – Illinois Chapter)• U.S. Environmental Protection Agency• ComEd and Peoples Gas
The 2018 Chicago Energy Benchmarking Report and the initiatives / programs described herein werecreated with input, analysis, and other support from the following organizations and individuals:
OFFICE OF THE MAYOR, CITY OF CHICAGOCara Bader, Chief of PolicyRanjani Prabhakar, Energy Policy Manager
CITY ENERGY PROJECTAmy Jewel
ELEVATE ENERGY AND THE HELP CENTER TEAMJohn BlaserAntonia OrnelasJoanna RachoRachel Scheu
And a special thanks to ComEd and Peoples Gas for ongoing support in providing energy use data for the benchmarking requirements, as well as information regarding appropriate energy saving opportunities.
Document design by:City of Chicago
The City of Chicago is grateful for the assistance and input of several partnering organizations that have supported implementation of the Chicago Energy Benchmarking Ordinance, as well as the new Chicago Energy Rating System.
The Chicago Energy Benchmarking Working Group, initially convened to design the original Chicago Energy Benchmarking Ordinance in 2013, continues to work with the City to support its implementation. Additional partners have joined the collaboration, and contribute to ordinance implementation, or assist with development of the new Chicago Energy Rating System.

24 2018 CHICAGO ENERGY BENCHMARKING REPORT www.CityOfChicago.org/EnergyBenchmarking
VII. APPENDIX
USEFUL BENCHMARKING METRICS AND HOW TO USE THEM• ENERGY STAR Score: A 1-100 ENERGY STAR score shows the property’s overall energy performance relative to similar buildings. A score of 50 indicates energy performance at the national median, while a score of 100 represents extremely high energy performance. Scores below 50 indicate significant opportunities for improvement.2
-The 1-100 ENERGY STAR rating allows comparisons across property types, and across different geographies because it normalizes for differences in energy use (such as climate or annual weather patterns, building space uses, operating characteristics, and other variables).
-A score of 75 or above represents a top performer, and properties with scores of 75 or above may be eligible for the national ENERGY STAR recognition. Learn more at: www.EnergyStar.gov/Buildings
• EUI: Energy Use Intensity (EUI) is the energy use per square foot of gross floor area in the property. There are two types of EUI metrics:
- Site EUI refers to the total energy per square foot that is actually consumed in the building, including all electricity, natural gas, and other fuels in all building spaces (including common areas and tenant spaces).
- Source EUI includes the energy per square foot that is actually consumed in the building (i.e.
site EUI), plus additional energy that is generated and consumed ‘upstream’ of the building at power plants, or energy lost through transmission and distribution.
The ENERGY STAR Portfolio Manager tool can also be used to track energy costs, as well as water consumption and water costs, solid waste generation, and many other metrics.
MULTI-YEAR BUILDING COMPARISONS If you have two or more years of benchmarking results, determine the property’s performance over time by using the ENERGY STAR score and/or weather normalized metrics. Weather-normalized metrics account for changes in weather from year to year (such as an extremely hot summer or a very cold winter) and allow comparisons of the same building to itself across different years.3
2 For more details about how to interpret your property’s ENERGY STAR score, please visit:
https://www.energystar.gov/buildings/facility-owners-and-managers/existing-buildings/use-portfolio-manager/interpret-your-results/what
3 Two key weather normalized metrics include weather normalized site energy use and weather normalized source energy use, both expressed in kBTU.
These include the site and/or source energy (kBTU) that a property would have consumed under 30-year average weather conditions, based on actual
energy use for a given time period. For more information on weather normalization, see the ENERGY STAR Portfolio Manager Technical Reference
on Climate and Weather: https://portfoliomanager.energystar.gov/pdf/reference/Climate%20and%20Weather.pdf

2018 CHICAGO ENERGY BENCHMARKING REPORT www.CityOfChicago.org/EnergyBenchmarking 25
ADDITIONAL TERMS•ENERGY STAR Portfolio Manager: Free, online software developed by the U.S. EPA to help buildings benchmark, verify, and report energy use and property information (www.EnergyStar.gov/PortfolioManager).
•Greenhouse Gas (GHG) Emissions: Carbon dioxide (CO2) and other gases released as a result of energy generation, transmission, and consumption. GHG emissions contribute to climate change and are expressed in metric tons of carbon dioxide equivalent (CO2e). GHG emissions are also released due to other activities in buildings, such as refrigeration and cooling, but those emissions are not calculated from energy benchmarking.
•Gross Floor Area (Building Size): Total interior floor space between the outside surfaces of a building’s enclosing walls, expressed in square feet (ft2). This includes tenant space, common areas, stairwells, basements, storage, and interior parking.
•Site Energy Use: Energy consumed on-site at a building, as measured by utility bills, and expressed in thousands of British Thermal Units (kBTU).
•Source Energy Use: Energy required to operate a property, including on-site consumption, as well as energy used for energy generation, transmission, and distribution; expressed in kBTU.
DATA VERIFICATIONUnder the Chicago Energy Benchmarking Ordinance, all covered properties are required to complete data verification once every three years, starting with the first year that the property is required to comply with the ordinance. Data verification is required to ensure that reported information is being tracked and reported correctly.
Data verification may be completed by in-house staff, and the use of a third party is not required. However, data verification must be completed by an individual holding a City-recognized license or training credential.4 City of Chicago-recognized credential programs must include training that covers benchmarking and the use of ENERGY STAR Portfolio Manager, as well as energy-efficient operations, measures, and technology.
Data verification takes the form of a signed Data Verification Checklist, a standard report generated automatically by the ENERGY STAR Portfolio Manager tool. It is important to note that verifiers are not required to complete the Indoor Environmental Standards section of the Data Verification Checklist, but are required to complete all other sections. Covered properties are not required to submit the signed Checklist, but they are required to include data verifier contact and credential details in the Property Notes field of their reported ENERGY STAR Portfolio Manager data. The ordinance requires covered properties to maintain benchmarking and data verification records for three years and to produce a copy of the signed Data Verification Checklist upon request by the City.
In 2018, any building team that had verified data in 2015, as well as any building team that had not ever verified data in the past, was required to conduct official verification. For the teams that submitted reports this year, 62% of the building teams that had never verified in the past did so this year. However, of those teams that had verified in 2015, only 47% completed the required verification (and submitted the associated documentation) in 2018. The City has followed up with all teams that were required to complete verification and did not do so, and will also continue to conduct outreach to building teams about the data verification requirement.
4 See www.CityofChicago.org/EnergyBenchmarking for additional information
VII. APPENDIX
26 2018 CHICAGO ENERGY BENCHMARKING REPORT www.CityOfChicago.org/EnergyBenchmarking
Type of Values 2015 2016 2017 2018
Temporary Values 5% 4% 3% 2%
Estimated Values – Energy 9% 9% 5% 5%
Default Values 40% 31% 24% 22%
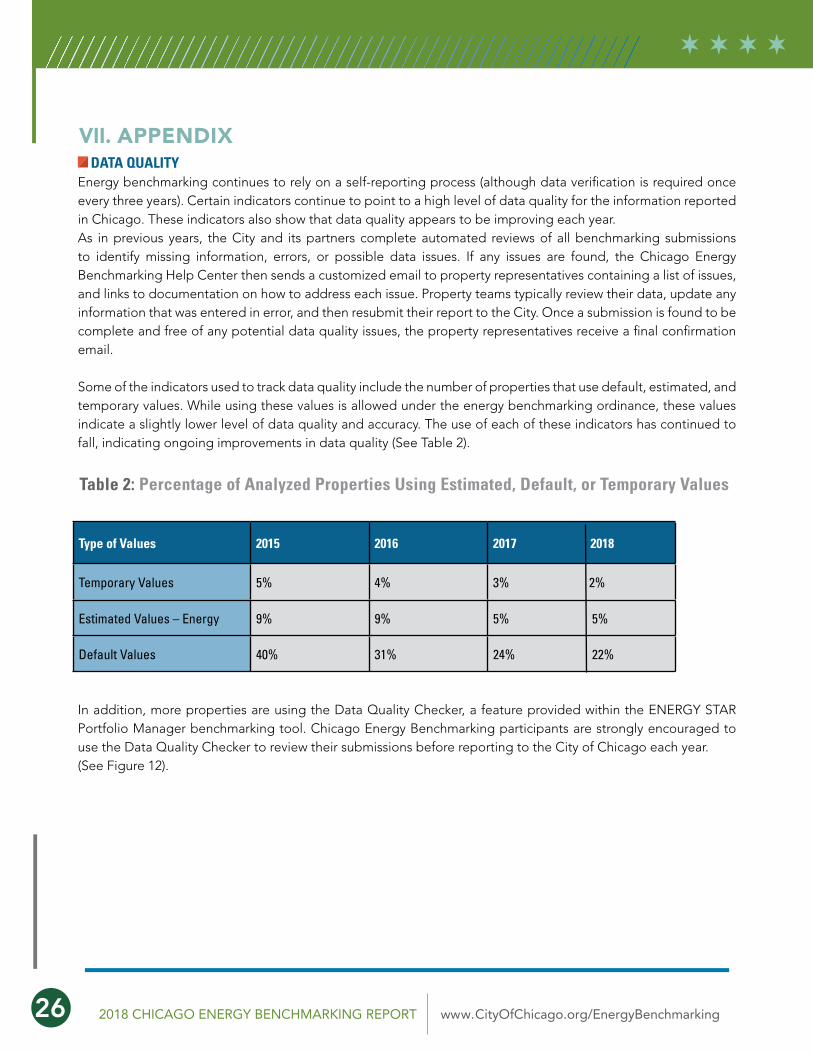
Table 2: Percentage of Analyzed Properties Using Estimated, Default, or Temporary Values
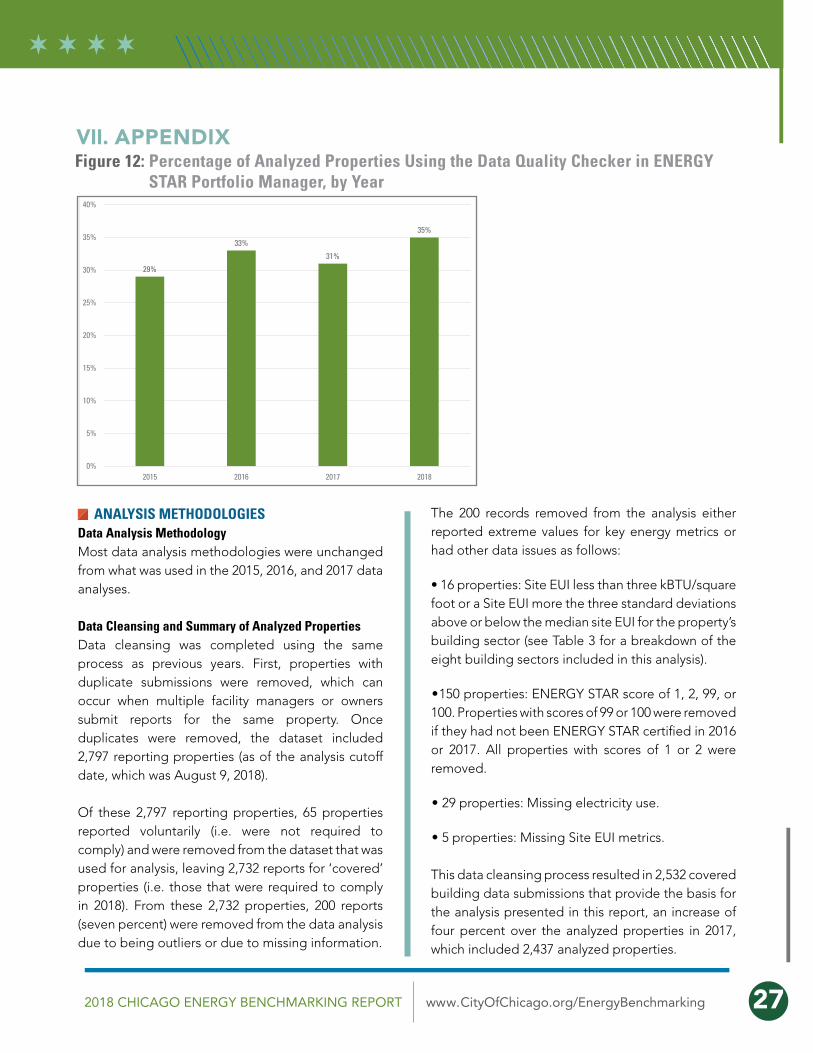
In addition, more properties are using the Data Quality Checker, a feature provided within the ENERGY STAR Portfolio Manager benchmarking tool. Chicago Energy Benchmarking participants are strongly encouraged to use the Data Quality Checker to review their submissions before reporting to the City of Chicago each year. (See Figure 12).
DATA QUALITYEnergy benchmarking continues to rely on a self-reporting process (although data verification is required once every three years). Certain indicators continue to point to a high level of data quality for the information reported in Chicago. These indicators also show that data quality appears to be improving each year. As in previous years, the City and its partners complete automated reviews of all benchmarking submissions to identify missing information, errors, or possible data issues. If any issues are found, the Chicago Energy Benchmarking Help Center then sends a customized email to property representatives containing a list of issues, and links to documentation on how to address each issue. Property teams typically review their data, update any information that was entered in error, and then resubmit their report to the City. Once a submission is found to be complete and free of any potential data quality issues, the property representatives receive a final confirmation email.
Some of the indicators used to track data quality include the number of properties that use default, estimated, and temporary values. While using these values is allowed under the energy benchmarking ordinance, these values indicate a slightly lower level of data quality and accuracy. The use of each of these indicators has continued to fall, indicating ongoing improvements in data quality (See Table 2).
VII. APPENDIX
2018 CHICAGO ENERGY BENCHMARKING REPORT www.CityOfChicago.org/EnergyBenchmarking 27
Figure 12: Percentage of Analyzed Properties Using the Data Quality Checker in ENERGY STAR Portfolio Manager, by Year
ANALYSIS METHODOLOGIESData Analysis MethodologyMost data analysis methodologies were unchanged from what was used in the 2015, 2016, and 2017 data analyses.
Data Cleansing and Summary of Analyzed PropertiesData cleansing was completed using the same process as previous years. First, properties with duplicate submissions were removed, which can occur when multiple facility managers or owners submit reports for the same property. Once duplicates were removed, the dataset included 2,797 reporting properties (as of the analysis cutoff date, which was August 9, 2018).
Of these 2,797 reporting properties, 65 properties reported voluntarily (i.e. were not required to comply) and were removed from the dataset that was used for analysis, leaving 2,732 reports for ‘covered’ properties (i.e. those that were required to comply in 2018). From these 2,732 properties, 200 reports (seven percent) were removed from the data analysis due to being outliers or due to missing information.
The 200 records removed from the analysis either reported extreme values for key energy metrics or had other data issues as follows:
• 16 properties: Site EUI less than three kBTU/square foot or a Site EUI more the three standard deviations above or below the median site EUI for the property’s building sector (see Table 3 for a breakdown of the eight building sectors included in this analysis).
•150 properties: ENERGY STAR score of 1, 2, 99, or 100. Properties with scores of 99 or 100 were removed if they had not been ENERGY STAR certified in 2016 or 2017. All properties with scores of 1 or 2 were removed.
• 29 properties: Missing electricity use.
• 5 properties: Missing Site EUI metrics.
This data cleansing process resulted in 2,532 covered building data submissions that provide the basis for the analysis presented in this report, an increase of four percent over the analyzed properties in 2017, which included 2,437 analyzed properties.
VII. APPENDIX
29%
33%
31%
35%
0%
5%
10%
15%
20%
25%
30%
35%
40%
2015 2016 2017 2018
28 2018 CHICAGO ENERGY BENCHMARKING REPORT www.CityOfChicago.org/EnergyBenchmarking
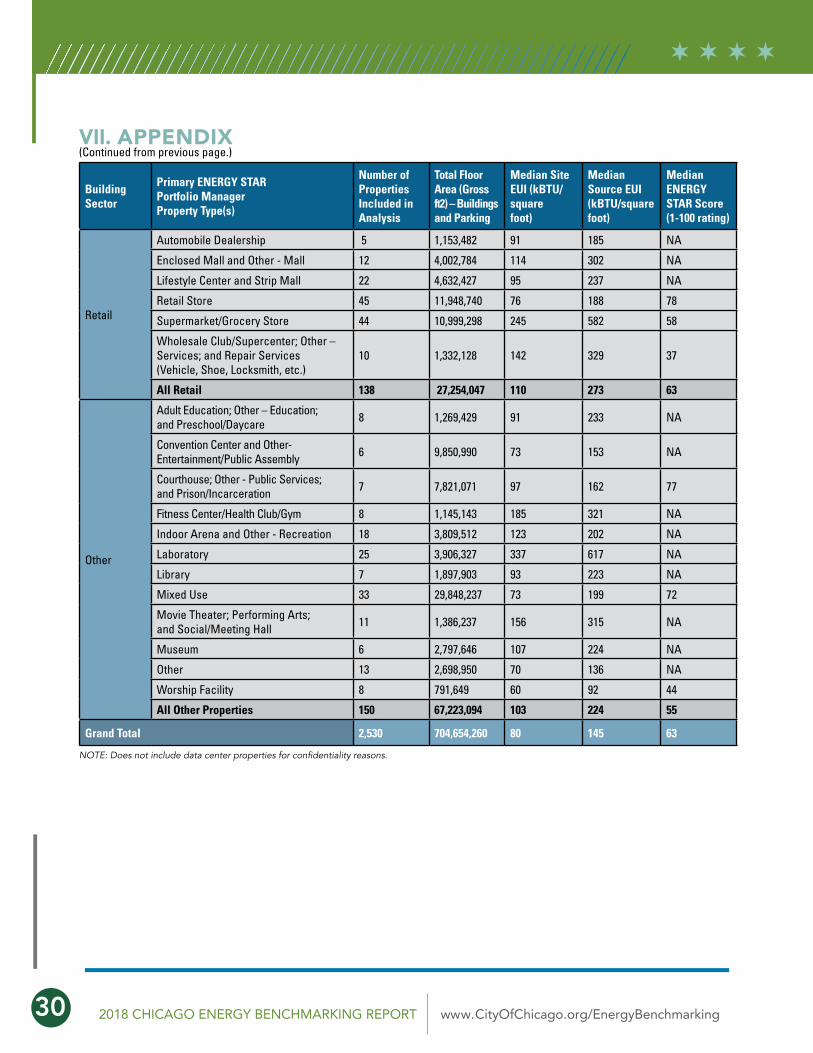
BUILDING SECTORSTable 3 shows the eight building sectors included in this report’s analysis and the ENERGY STAR Portfolio Manager property types included in each sector. The number of properties analyzed, total floor area, median ENERGY STAR scores, and median site and source EUI values are also provided for each Portfolio Manager property type or property type grouping.
Properties with multiple uses are typically assigned to the space use that comprises 50% or more of the total floor area. If no single space use makes up 50% or more of the property’s floor area, then the property is considered to be Mixed Use, which is included in the “Other” property type category.
VII. APPENDIX

2018 CHICAGO ENERGY BENCHMARKING REPORT www.CityOfChicago.org/EnergyBenchmarking 29
Building Sector
Primary ENERGY STAR Portfolio Manager Property Type(s)
Number ofProperties Included in Analysis
Total Floor Area (Gross ft2) – Buildings and Parking
Median SiteEUI (kBTU/square foot)
MedianSource EUI (kBTU/square foot)
Median ENERGYSTAR Score (1-100 rating)
Office
Bank Branch and Financial Office 6 4,580,069 88 234 60
Office, 50,000 ft2 – 99,999 ft2 71 5,318,973 76 178 72
Office, 100,000 ft2 - 249,999 ft2 91 14,853,462 81 189 76
Office, ≥ 250,000 ft2 161 152,282,474 71 178 83
All Offices 329 177,034,978 76 185 80
Multifamily Housing
Multifamily Housing, 50,000 ft2 – 99,999 ft2 428 30,360,152 76 119 68
Multifamily Housing,100,000 ft2 - 249,999 ft2 415 66,796,188 76 129 60
Multifamily Housing, ≥ 250,000 ft2 393 200,491,295 77 134 51
All Multifamily Housing 1,236 297,647,635 76 127 60
K-12Schools
K-12 School, 50,000 ft2 – 99,999 ft2 204 15,206,494 74 137 62
K-12 School, 100,000 ft2 - 249,999 ft2 146 20,947,155 69 129 63
K-12 School, ≥ 250,000 ft2 24 8,611,667 78 141 69
All K-12 Schools 384 47,269,170 72 129 61
Healthcare
Ambulatory Surgical Center; Outpatient Rehabilitation/Physical Therapy; and Urgent Care/Clinic/Other Outpatient
3 699,169 201 426 NA
Hospital (General Medical & Surgical) 28 23,959,816 231 423 53
Medical Office 15 3,505,884 117 283 41
Other - Specialty Hospital 4 538,546 183 365 NA
All Healthcare 50 28,703,415 201 393 46
Higher Education
College/University, 50,000 ft2 – 99,999 ft2 21 1,505,052 97 205 NA
College/University, 100,000 ft2 - 249,999 ft2 35 5,454,346 91 190 NA
College/University, ≥ 250,000 ft2 20 11,044,035 78 174 NA
All College/University 76 18,003,433 91 190 NA
Lodging
Hotel 80 30,285,237 107 233 42
Other - Lodging/Residential andResidence Hall/Dormitory 26 5,103,140 83 163 63
Residential Care Facility 10 1,178,544 153 260 NA
Senior Care Community 51 6,229,102 93 166 37
All Lodging 167 42,796,023 100 199 43
Table 3: Detailed Building Sector Description andEnergy Performance Metrics by Sector for Analyzed Properties
(Continued on following page.)
VII. APPENDIX
30 2018 CHICAGO ENERGY BENCHMARKING REPORT www.CityOfChicago.org/EnergyBenchmarking
Building Sector
Primary ENERGY STAR Portfolio Manager Property Type(s)
Number ofProperties Included in Analysis
Total Floor Area (Gross ft2) – Buildings and Parking
Median SiteEUI (kBTU/square foot)
MedianSource EUI (kBTU/square foot)
Median ENERGYSTAR Score (1-100 rating)
Retail
Automobile Dealership 5 1,153,482 91 185 NA
Enclosed Mall and Other - Mall 12 4,002,784 114 302 NA
Lifestyle Center and Strip Mall 22 4,632,427 95 237 NA
Retail Store 45 11,948,740 76 188 78
Supermarket/Grocery Store 44 10,999,298 245 582 58
Wholesale Club/Supercenter; Other – Services; and Repair Services (Vehicle, Shoe, Locksmith, etc.)
10 1,332,128 142 329 37
All Retail 138 27,254,047 110 273 63
Other
Adult Education; Other – Education;and Preschool/Daycare 8 1,269,429 91 233 NA
Convention Center and Other-Entertainment/Public Assembly 6 9,850,990 73 153 NA
Courthouse; Other - Public Services; and Prison/Incarceration 7 7,821,071 97 162 77
Fitness Center/Health Club/Gym 8 1,145,143 185 321 NA
Indoor Arena and Other - Recreation 18 3,809,512 123 202 NA
Laboratory 25 3,906,327 337 617 NA
Library 7 1,897,903 93 223 NA
Mixed Use 33 29,848,237 73 199 72
Movie Theater; Performing Arts; and Social/Meeting Hall 11 1,386,237 156 315 NA
Museum 6 2,797,646 107 224 NA
Other 13 2,698,950 70 136 NA
Worship Facility 8 791,649 60 92 44
All Other Properties 150 67,223,094 103 224 55
Grand Total 2,530 704,654,260 80 145 63
(Continued from previous page.)
NOTE: Does not include data center properties for confidentiality reasons.
VII. APPENDIX
2018 CHICAGO ENERGY BENCHMARKING REPORT www.CityOfChicago.org/EnergyBenchmarking 31
TREND ANALYSIS METHODOLOGY
The trend analysis presented in this report applies to individual properties that reported consecutively over the past two, three, four, or five years. Thus, properties included in the trend analysis for the past three years reported in 2016, 2017, and 2018. Those properties included in the trend analysis for the past two years reported in 2017 and 2018. Weather-normalized site energy use per square foot was used for the trend analysis to control for weather variations between the calendar years of the comparison, as well as any changes in the properties’ square footage. 5
Trend Analysis for Properties Reporting in the Past Five Consecutive Years
In 2015, 212 properties were included in the multi-year analysis for properties that had reported in both 2014 and 2015. Of these 212 properties, 12 were removed for the analysis in 2016, and an additional 16 were removed in 2017, while none were removed this year in 2018 for a total cohort of 184 properties that have reported for five consecutive years since 2014.
Trend Analysis for Properties Reporting in the Past Four Consecutive Years
For the trend analysis covering four consecutive years, a total of 1,083 properties reported for the first time in 2015 and reported again in 2016. Of these 1,083 properties, 76 were removed from the trend analysis in 2016, an additional 108 were removed in 2017, and 81 were removed in 2018.
In 2018, there were 18 properties that did not report (which had previously reported in 2015, 2016, and 2017). Another 12 properties received a permanent or temporary exemption, and 10 were identified as an outlier or had missing information. A total of
41 properties showed a 50% or greater increase or decrease in weather normalized site EUI. Removing these 81 properties left 818 properties in the trend analysis for buildings reporting for four consecutive years.
Trend Analysis for Properties Reporting in the Past Three Consecutive Years
In 2017, a total of 960 properties reported that had also submitted reports in 2016 for the first time. Of these 960, a total of 323 reports were excluded from the trend analysis in 2017, and 37 additional reports were excluded in 2018.
Of the 30 reports excluded, 7 properties did not report in 2018 (which had previously reported in 2017). Another 4 properties received temporary exemptions, and 26 properties showed a 50% or greater increase or decrease in weather normalized site EUI. Removing these 37 properties left 600 properties in the trend analysis for buildings reporting for three consecutive years.
Trend Analysis for Properties Reporting in the Past Two Consecutive YearsIn 2018, a total of 482 properties reported that had also submitted reports in 2017 for the first time. Of these 482, a total of 96 reports were excluded from the trend analysis. The majority of reports excluded, 68 reports, were not analyzed in 2018 due to being identified as outliers or containing missing information. An additional 28 reports showed a 50% or greater increase or decrease in weather normalized site EUI. Once these 96 reports were removed, a total of 386 properties were included in the trend analysis for buildings reporting for two consecutive years.
5 For more information, see the ENERGY STAR Portfolio Manager Technical Reference on Weather and Climate:
https://portfoliomanager.energystar.gov/pdf/reference/Climate%20and%20Weather.pdf
VII. APPENDIX
32 2018 CHICAGO ENERGY BENCHMARKING REPORT www.CityOfChicago.org/EnergyBenchmarking
CALCULATION METHODOLOGIES
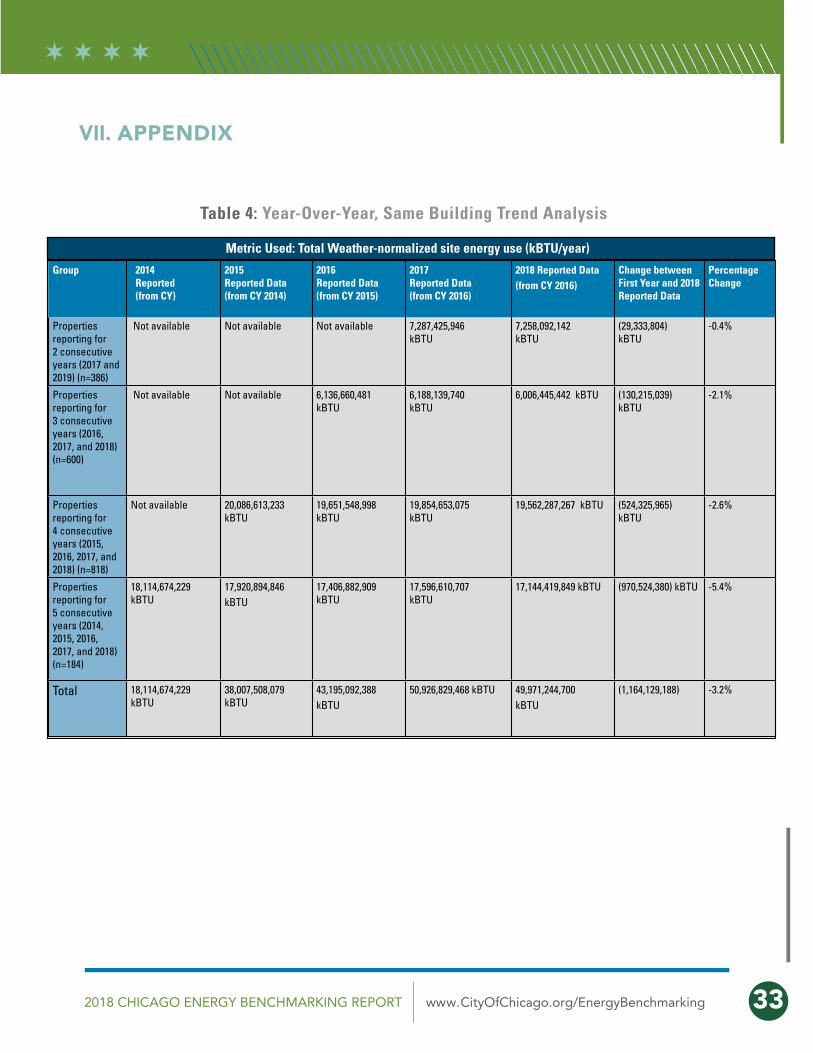
The total weather normalized site energy use (in kBtu) for the sample properties was summed for the years included in each analysis. The total for 2018 was then subtracted from the total in the earliest year available. These calculations indicate a decrease in total weather-normalized site energy use for all four of the groups of properties analyzed.
Table 4 shows the total weather-normalized site energy use (in KBtu) for each calendar year included in the analysis for these four groups of buildings, and the total percentage reductions achieved for weather normalized site energy use.
The metrics for cost savings (shown in Table 1) are based on the percentage reduction of average weather normalized site energy use intensity (also shown in Table 1). This percentage reduction in average weather normalized site energy use intensity was applied to electricity and natural gas use in the baseline year to calculate the annual reduction of these two fuels across each cohort of buildings.
These potential electricity and natural gas reductions were multiplied by estimated Chicago energy costs for each fuel and building type. Estimated energy rates are based on the average January – December 2017 commercial electricity and natural gas costs in the State of Illinois, as published by the U.S. Department of Energy’s Energy Information Administration.6 To reflect local Chicago energy market conditions (including some properties’ ability to negotiate lower energy rates), the 2017 average state commercial energy prices were reduced by 15%.
GHG emission reductions were calculated directly from ENERGY STAR Portfolio Manager results.
6 U.S. Department of Energy Information Administration average 2015 electricity and natural gas rates for the State of Illinois:
http://www.eia.gov/electricity/monthly/epm_table_grapher.cfm?t=epmt_5_6_a,
http://www.eia.gov/dnav/ng/ng_sum_lsum_dcu_sIL_m.htm
VII. APPENDIX
2018 CHICAGO ENERGY BENCHMARKING REPORT www.CityOfChicago.org/EnergyBenchmarking 33
VII. APPENDIX
Table 4: Year-Over-Year, Same Building Trend Analysis
Group 2014 Reported (from CY)
2015Reported Data (from CY 2014)
2016Reported Data (from CY 2015)
2017Reported Data (from CY 2016)
2018 Reported Data (from CY 2016)
Change between First Year and 2018 Reported Data
Percentage Change
Properties reporting for 2 consecutive years (2017 and 2019) (n=386)
Not available Not available Not available 7,287,425,946kBTU
7,258,092,142kBTU
(29,333,804)kBTU
-0.4%
Properties reporting for 3 consecutive years (2016, 2017, and 2018) (n=600)
Not available Not available 6,136,660,481kBTU
6,188,139,740kBTU
6,006,445,442 kBTU (130,215,039)kBTU
-2.1%
Properties reporting for 4 consecutive years (2015, 2016, 2017, and 2018) (n=818)
Not available 20,086,613,233 kBTU
19,651,548,998kBTU
19,854,653,075kBTU
19,562,287,267 kBTU (524,325,965)kBTU
-2.6%
Properties reporting for 5 consecutive years (2014, 2015, 2016, 2017, and 2018) (n=184)
18,114,674,229 kBTU
17,920,894,846kBTU
17,406,882,909 kBTU
17,596,610,707kBTU
17,144,419,849 kBTU (970,524,380) kBTU -5.4%
Total 18,114,674,229 kBTU
38,007,508,079 kBTU
43,195,092,388kBTU
50,926,829,468 kBTU 49,971,244,700kBTU
(1,164,129,188) -3.2%
Metric Used: Total Weather-normalized site energy use (kBTU/year)


CHICAGO ENERGYBENCHMARKING
2018R E P O R T
C I T Y O F C H I C A G O • M AY O R R A H M E M A N U E L