2018 corporate operating plan · 2018. 2. 20. · operational excellence . we drive operational...
TRANSCRIPT

2018 Corporate Operating Plan

2018 CORPORATE OPERATING PLAN

2018 CORPORATE OPERATING PLAN
TABLE OF CONTENTS
Page
Management Letter ................................................................................................................................................................................................................ 1
Corporate Strategic Planning ............................................................................................................................................................................................ 2
Executive Summary ................................................................................................................................................................................................................. 7
Assumptions ................................................................................................................................................................................................................................ 9
2018 Corporate Operating Plan Financial Statements
Income Statement .................................................................................................................................................................................................................. 13 Coverage Ratios ..................................................................................................................................................................................................................... 15 Debt and Financing Data ........................................................................................................................................................................................................ 17 Cash Flow Analysis ................................................................................................................................................................................................................. 19
Energy Sales and Revenues Electric Energy Sales and Electric Customers ......................................................................................................................................................................... 21 Operating Revenues ............................................................................................................................................................................................................... 23 Average Cents/kWh ............................................................................................................................................................................................................... 25
Generation Net System Requirements ..................................................................................................................................................................................................... 27
Operation and Maintenance Expense and Decommissioning Expenditures
Operation and Maintenance Expense and Decommissioning Expenditures ......................................................................................................................... 29

2018 Capital and Deferred Expenditure PlanCapital and Deferred Expenditures ............................................................................................................................................................................................. 31
NewGen Strategies and Solutions, LLC - Review
Prepared by Business Analysis and Pricing Division

MANAGEMENT LETTER

1

CORPORATE STRATEGIC PLANNING

2018 CORPORATE OPERATING PLAN CORPORATE STRATEGIC PLANNING
Today is a time of monumental change in the electric utility industry. To provide clear and transparent direction on behalf of OPPD
customer owners, OPPD’s publicly elected Board of Directors established fifteen strategic direction (SD) policies to which OPPD is
accountable. The policies guide OPPD’s 2018 strategic and operational planning efforts to address current and future trends, mitigate
risks, pursue strategic opportunities, and prioritize resources to efficiently and effectively provide energy services to the District. They
align the organization to clear performance expectations to serve OPPD’s customer-owners.
Ou
r St
rate
gic
Fou
nd
atio
n (
SD-1
)
Mission: To provide affordable, reliable and environmentally sensitive energy services to our customers.
Vision: “Leading the Way We Power the Future” In implementing this vision, OPPD shall adhere to these principles: • Strengthen the public power advantage of affordable and reliable electricity;
• Exemplify fiscal, social and environmental responsibility to optimize value to our customer-owners;
• Proactively engage and communicate with our stakeholders;
• Act transparently and with accountability for the best interest of our customer-owners;
• Collaborate, when appropriate, with partners; and
• Leverage OPPD’s leadership to achieve these goals.
Ou
r V
alu
es • We have a PASSION to serve
• We HONOR our community
• We CARE about each other
2

2018 CORPORATE OPERATING PLAN CORPORATE STRATEGIC PLANNING
The strategic direction policies leverage industry benchmarks to drive performance as a top utility, and provide the basis for a
scorecard to which the organization manages its performance.
Board Strategic Direction Policies & 2018 Performance Targets
Policy Measure Definition 2018
Target Strategic
Goal
Rates (SD-2) % Below Regional Retail Average
Retail rate target of West North Central Regional average published rates on a system average basis
14.1%* 20%*
Access to Credit Markets (SD-3)
Debt Coverage Ratio Revenues less expenses divided by total annual senior and subordinate lien debt interest and principal payments.
2.0 2.0
Reliability (SD-4)
SAIDI System Average Interruption Duration Index <90 <90
Equivalent Availability
% of actual generation potential to a unit’s maximum rated output over a period of time
90% 90%
Customer Satisfaction (SD-5)
Absolute Satisfaction Score
JD Power’s annual Electric Utility Residential Customer Satisfaction Study
Top Quartile Top Quartile
Safety (SD-6) DART Days Away, Restricted or Transferred <0.50 <0.50
Environmental Stewardship (SD-7)
% Renewables % of retail energy sales shall be supplied from renewable energy sources
>30% >30%
Employee Relations (SD-8)
Employee Engagement
Composite score of employee engagement 80 85
Resource Planning (SD-9), Ethics (SD-10), Economic Development (SD-11), Information Management & Security (SD-12), Stakeholder Outreach & Communication (SD-13), Retirement Plan Funding (SD-14), Enterprise Risk Management (SD-15)
*In addition to the rate target, SD-2: Rates specifies there will be “no general rate increase for a 5-year period starting January 1,
2017 and ending December 31, 2021.”
3

2018 CORPORATE OPERATING PLAN CORPORATE STRATEGIC PLANNING
Industry Trends Assessment & Strategic Focus
Industry trends are driving transformational change, creating significant pressures on the industry’s traditional strategies and
business models. Changing customer expectations, increasing adoption of renewable and distributed energy, potential new
competitors, and evolving regulations require OPPD to embrace innovative approaches to navigate new regulatory, operational,
environmental, cyber and technological challenges while at the same time achieve operational excellence in traditional energy
services in order to achieve its strategic direction policies.
Throughout OPPD’s 2018 strategic planning, OPPD leadership met with leading industry experts to assess industry trends and
identify strategic implications for action. With a focus on OPPD’s strategic direction policies, industry trends and potential risks,
OPPD identified five long-term guiding principles for strategic and operational planning.
TRUSTED ENERGY PARTNER Our customers and communities can count on us to bring them value, caring and excellence as their trusted energy partner.
OPERATIONAL EXCELLENCE We drive operational excellence by focusing on safety, reliability, cost, environmental stewardship and innovation.
TECHNOLOGY SOLUTIONS Through partnerships, we provide innovative and value added technology in a secure and reliable manner to achieve strategic initiatives and operational goals.
POWERED THROUGH PEOPLE
We know employees drive our success. We provide a safe, healthy environment where our diverse and highly skilled workforce can do their best work.
FINANCIAL STEWARDSHIP We are stewards of financial resources creating strength & flexibility benefitting our customer owners & communities.
4

2018 CORPORATE OPERATING PLAN CORPORATE STRATEGIC PLANNING
Enterprise Risk Management
Fundamental to effective planning is an understanding of enterprise level risks and development and implementation of initiatives and mitigation plans. The District’s Enterprise Risk Management (“ERM”) program helps to ensure strategic objectives are achieved. The program specifies risk management standards, management responsibilities, and controls to help ensure risk exposures are properly identified and managed within agreed upon risk tolerance levels. Specific risk mitigation plans and procedures are maintained and reviewed periodically to provide focused and consistent efforts to mitigate various risk exposures. In support of its 2018 corporate planning efforts, OPPD leveraged risk assessments and mitigation plans to prioritize resources.
Theme OPPD’s Risk Management Focus
Retail revenues & off-system sales
Persistently pursue customer and economic development to achieve economies of scale and strengthen top quartile energy competitive rates. Maximize off-system sales to further benefit our customer owners.
Generation reliability Maintain highly available generation units and a diverse fuel supply to provide power whenever our customer-owners need it
Environmental regulation
Ensure the District is well-positioned to respond to the ever-changing landscape of environmental regulation to meet our goal to provide environmentally sensitive energy services.
Decommission Fort Calhoun Station
Realize the economic savings potential from ceasing operations at Fort Calhoun Station. Ensure decommissioning funds are wholly adequate to return the facility to green field status.
Cyber & physical security
Vigorously defend customer information and District assets from potential security threats to our infrastructure.
Infrastructure investment
Continue sufficient investment into transmission and distribution assets to ensure reliable and resilient energy services.
Workplace safety Promote safety as a top priority to ensure every employee going home as healthy as they came into work.
Community partnership Honor and support the communities in which we operate and fulfill the promise of public power.
5

2018 CORPORATE OPERATING PLAN CORPORATE STRATEGIC PLANNING
2018 Strategic Planning
The 2018 Strategic Planning identified seven corporate initiatives critical to help achieve OPPD’s strategic direction policies, address
changing industry dynamics and support the mitigation of enterprise risks.
Customer Experience: Develop a customer experience strategy roadmap to ensure our customers and communities can count
on us as their trusted energy partner that understands, cares for, enables and honors the diverse energy needs of our
customers and communities.
Integrated Energy Marketplace: Use a holistic approach to identify, monitor, analyze, and make recommendations for an
adaptable future state, including traditional and non-traditional solutions, which will drive the customer value proposition and
shape OPPD’s business model. This future state will leverage the public power advantage to improve customer choice, ensure
high reliability, affordability, and environmentally sensitive solutions to optimize portfolio value within the evolving energy
ecosystem.
Cost & Process: Utilize Lean principles across the enterprise to assess, identify and implement process improvements and cost
savings, cultivate a culture to sustain continuous improvement, and deliver value to our customers in the most cost effective
manner.
Innovation: Create the structure and process for identifying, analyzing and deploying disruptive and continuous innovation.
Best Places to Work for You: Transform the employee experience, create a workplace where employees have clarity, feel
connected, cared for, and enabled to bring their best every day for our customers, our communities and each other.
Accountable Management System: Align OPPD’s leadership culture, structure, role relationships, policies, Human Capital
processes, and managerial practices in a manner that frees employees to work at their full potential, increasing efficiency,
effectiveness and employee satisfaction.
Financial Sustainability: Create a comprehensive financial management framework that enables management to make timely,
informed business plans and decisions to ensure effective allocation of resources to enable business transformation. The
framework will include enhanced processes, controls, procedures, systems and training to provide more accessible, consistent
financial information.
In addition to corporate strategic initiatives, 2018 corporate planning resulted in business plans and the 2018 O&M and Capital
Budgets.
6

EXECUTIVE SUMMARY

2018 CORPORATE OPERATING PLAN EXECUTIVE SUMMARY
Introduction
The Corporate Operating Plan (COP) is an integral part of a comprehensive strategic business planning process for the Omaha Public Power District (OPPD). OPPD’s Strategic Plan is reviewed annually and serves as a guide for the COP.
The COP is comprised of financial information and analysis covering the 2018 budget. It documents how OPPD will financially move towards achieving its corporate objectives. The budget summary is supported by an income statement, statement of cash flow, statement of capital and deferred expenditures and supporting schedules.
Key Issues for 2018
A key input into the budget process is the analysis of trends and future economic conditions that OPPD may face during 2018. During this process, the following key issues were identified.
• Fort Calhoun Station – SAFSTOR• Low load growth as a result of changes in customer usage trends and improving energy efficiencies• Construction of transmission facilities• Maintaining safe and reliable service• Changing regulations
• Environmental• Transmission
• Managing operating expenditures• Strategic Cost and Process Initiative• Generation outage planning• Continued funding for Fort Calhoun Station Decommissioning• Continued amortization of Fort Calhoun Station Restart and Recovery expenses
7

2018 Proposed Rate Action
OPPD’s 2018 budget requires no General rate increase.
Implemented rate mitigation strategies: a. Excess energy sold into the wholesale marketb. Cost reduction initiatives driven by the strategic planning processc. Implementing corporate Accountable Management System philosophies
Total 2018 Budget
The total 2018 Budget is $1.1 billion.
8

ASSUMPTIONS

2018 CORPORATE OPERATING PLAN ASSUMPTIONS
General
2017 Projected Operations and maintenance, capital and deferred expenditures reflect the 2017 budget adjusted for revisions submitted through September 30, 2017. Other values reflect actual charges through September plus forecast revisions for the remainder of the year.
Financing / Investing
Financing The outstanding Revenue Bond balance will not be impacted by the 2018 Financing Plan, which provides flexibility to capitalize on market conditions.
Investment Yield on the Revenue and Construction Funds Average investment earnings rates used for 2018 are 1.2%.
Energy Sales / Revenues
Load Forecast The plan assumes 0.1% increase in general business energy sales and a 0.8% increase in the number of customers in 2018, as compared to the 2017 projections.
Revenue Adjustments
OPPD’s 2018 budget requires no increase in the General Rates.
9

2018 CORPORATE OPERATING PLAN ASSUMPTIONS
Generation, Purchased Power, and Fuel Budget
A twenty-three day fall outage for North Omaha Unit No. 5 (September 22 to October 14) has been scheduled. A twelve day spring outage has been scheduled for both Cass County Station Unit Nos. 1 and 2. A twelve day fall outage has been scheduled for both Sarpy County Station Unit Nos. 4 and 5. Additionally there are several shorter outages for the peaking units. The purchased power budget includes generation supplied from 812 megawatts of wind capability.
Department Operation and Maintenance Budget
Department and division level budgets were proposed in August 2017. These plans were reviewed with Senior Management for compliance with the strategic objectives before submitting them for final approval.
Capital Budget and Deferred Expenditures
The capital portfolio prioritization and allocation process implemented in 2016 continues to enhance the effectiveness of capital planning. The process enables better alignment with the strategic directives and provides more transparency of capital spending through improved project review and approval processes.
10

BUDGET BUDGET INCREASE /
2017 2018 (DECREASE) % CHANGE
Fuel Costs and Purchased Power $291,451 $319,149 $27,698 9.5%
Non-fuel Operations & Maintenance 329,403 327,425 (1,978) -0.6%
Total Debt Service and Other Expenses 139,533 134,362 (5,171) -3.7%
Payments in Lieu of Taxes 33,894 34,036 142 0.4%
Capitalized Interest 4,728 3,649 (1,079) -22.8%Capital Projects 130,272 144,000 13,728 10.5%
15,500 8,770 (6,730) …Regulatory Amortization 14,835 14,837 2 …
Decommissioning Expenditures 174,351 136,187 (38,164) …
TOTAL BUDGET $1,133,967 $1,122,415 ($11,552) -1.0%
CORPORATE OPERATING PLAN
2018 BUDGET SUMMARY
(DOLLARS IN THOUSANDS)
2017 BUDGET COMPARED TO 2018 BUDGET
Components of the 2018 Budget
Contributions to Rate Stabilization & Decommissioning & Benefit Reserve
28.3%
29.2%
12.0%
3.0%
13.2%
0.8%
13.5%Fuel Costs and Purchased Power
Non-fuel Operations & Maintenance
Total Debt Service and Other Expenses
Payments in Lieu of Taxes
Capital Expenditures
Contributions to Decommissioning & Benefit Reserve
Decommissioning Expenditures/Amortization
11
BUDGET BUDGET INCREASE /
2017 2018 (DECREASE) % CHANGE
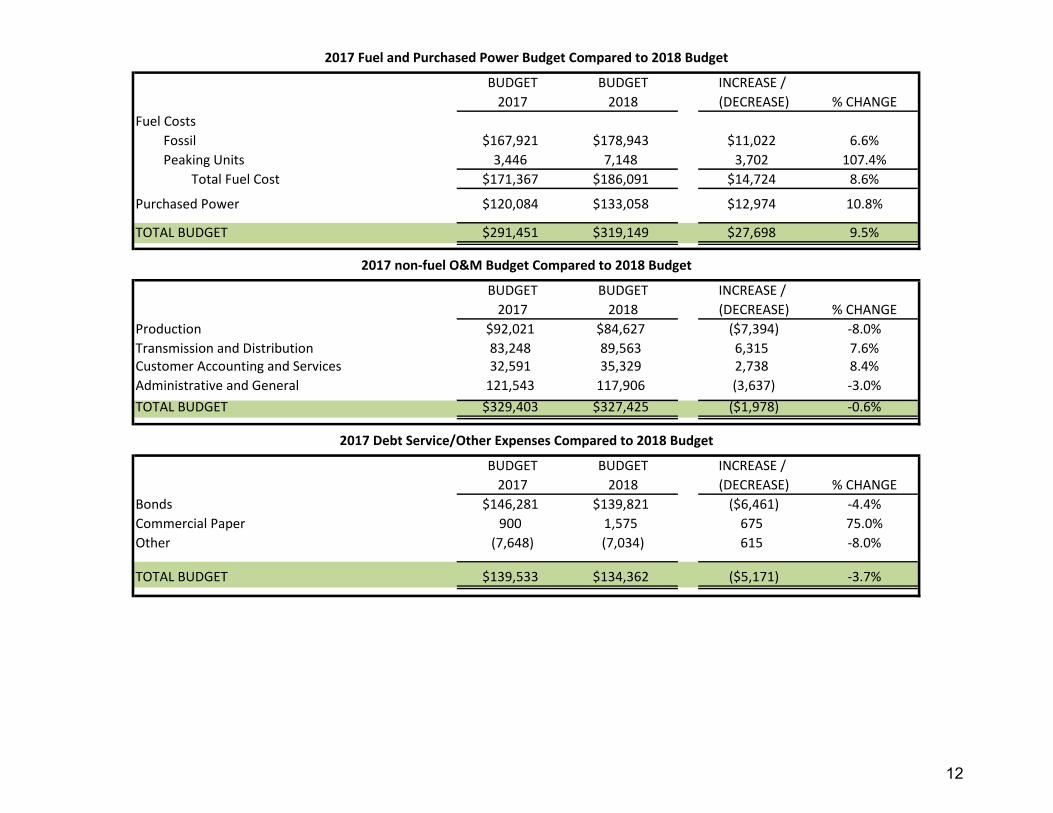
Fuel Costs
Fossil $167,921 $178,943 $11,022 6.6%
Peaking Units 3,446 7,148 3,702 107.4%
Total Fuel Cost $171,367 $186,091 $14,724 8.6%
Purchased Power $120,084 $133,058 $12,974 10.8%
TOTAL BUDGET $291,451 $319,149 $27,698 9.5%
BUDGET BUDGET INCREASE /
2017 2018 (DECREASE) % CHANGE
Production $92,021 $84,627 ($7,394) -8.0%
Transmission and Distribution 83,248 89,563 6,315 7.6%Customer Accounting and Services 32,591 35,329 2,738 8.4%
Administrative and General 121,543 117,906 (3,637) -3.0%
TOTAL BUDGET $329,403 $327,425 ($1,978) -0.6%
BUDGET BUDGET INCREASE /
2017 2018 (DECREASE) % CHANGE
Bonds $146,281 $139,821 ($6,461) -4.4%
Commercial Paper 900 1,575 675 75.0%
Other (7,648) (7,034) 615 -8.0%
TOTAL BUDGET $139,533 $134,362 ($5,171) -3.7%
2017 Fuel and Purchased Power Budget Compared to 2018 Budget
2017 non-fuel O&M Budget Compared to 2018 Budget
2017 Debt Service/Other Expenses Compared to 2018 Budget
12

2018 CORPORATE OPERATING PLAN

FINANCIAL STATEMENTS

2018 CORPORATE OPERATING PLAN INCOME STATEMENT
Projected net income for 2017 is $75.9 million, which is $9.4 million over budget, and includes funding of $8.0 million for the Rate Stabilization Reserve Fund and $24.4 million for the Decommissioning and Benefits Reserve Fund. Operating revenues are projected to be $14.3 million over budget.
Net income for 2018 is projected to be $79.6 million, which is $3.7 million or 4.8% higher than the 2017 projected net income. When compared to the 2017 budget, net income for 2018 is $13.1 million or 19.7% higher.
Major factors contributing to the change in 2018 net income are:
1) Operating revenue is budgeted to be $14.7 million higher than 2017 projections and $29.0 million higher than the 2017budget. The budget increase is primarily due to a smaller funding of the Decommissioning and Benefits Reserve Fund.Wholesale revenues are projected to decrease $18.0 million from 2017 projections and increase $17.1 million whencompared to the 2017 budget.
2) Operation and maintenance expense is budgeted to be $8.0 million higher than the 2017 projected amount and $25.7million higher than the 2017 budget amount.
3) Other income is projected to be $2.2 million higher than the 2017 projected amount. Other income budgeted for 2018 is$15.8 million higher than 2017 budget amount.
4) Interest expense on bonds is projected to be $2.3 million lower than the 2017 projected amount and $2.3 million lowerthan the 2017 budget amount.
5) Decommissioning expense represents funding of the Decommissioning Fund and is budgeted to be $156.0 million in 2018.
13

ACTUAL ACTUAL PROJECTED BUDGET VARIANCE BUDGET
2015 2016 2017 2017 2017 2018 $ CHANGE % CHANGE
OPERATING REVENUES $1,131,234 $1,126,476 $1,089,721 $1,075,454 $14,267 $1,104,413 $14,692 1.3
OPERATING EXPENSES
O&M EXPENSE * $841,938 $823,858 $638,524 $620,853 $17,671 $646,575 $8,051 1.3
PAYMENTS IN LIEU OF TAXES 32,241 34,138 33,748 33,894 (146) 34,036 288 0.9
DECOMMISSIONING EXPENSE 5,161 17,576 147,469 147,469 (0) 156,000 8,531 5.8
REGULATORY AMORTIZATION 0 1,854 14,833 14,836 (3) 14,836 3 0.0
DEPRECIATION EXPENSE 151,033 147,691 127,328 127,000 328 125,274 (2,054) (1.6)
TOTAL OPERATING EXPENSE $1,030,373 $1,025,118 $961,902 $944,051 $17,851 $976,720 $14,818 1.5
OPERATING INCOME $100,861 $101,359 $127,819 $131,403 ($3,584) $127,693 ($126) (0.1)
INTEREST INCOME $5,349 $23,199 $12,965 $9,828 $3,137 $19,312 $6,347 49.0
DECOMMISSIONING INTEREST TRANSFER (3,523) (24,241) 0 0 0 0 0 …
ALLOWANCE FOR FUNDS USED 8,474 7,380 3,564 4,728 (1,164) 3,649 85 2.4
PRODUCTS AND SERVICES - NET 4,287 3,739 3,515 1,788 1,727 3,450 (65) (1.9)
MISC. NON OPERATING INCOME** 8,342 2,229 12,250 2,376 9,874 8,100 (4,150) (33.9)
TOTAL OTHER INCOME $22,929 $12,305 $32,294 $18,720 $13,574 $34,511 $2,217 6.9
TOTAL INCOME LESS OPERATING EXPENSE $123,790 $113,664 $160,113 $150,123 $9,990 $162,203 $2,090 1.3
INCOME DEDUCT. & INT. CHARGES
INTEREST EXPENSE ON BONDS $95,669 $93,039 $90,390 $90,392 ($2) $88,083 ($2,307) (2.6)
INTEREST EXPENSE ON NOTES 1,462 1,484 1,515 1,513 2 1,544 29 …
INTEREST EXPENSE ON COMM. PAPER 228 773 1,255 900 355 1,575 320 25.5
AMORTIZATION (6,535) (8,209) (9,687) (9,736) 49 (9,179) 508 (5.2)
OTHER INCOME DEDUCTIONS 645 827 735 576 159 600 (135) (18.4)
TOTAL INCOME & DEDUCTIONS $91,468 $87,914 $84,208 $83,646 $562 $82,624 ($1,585) (1.9)
NET INCOME $32,322 $25,750 $75,905 $66,477 $9,428 $79,579 $3,674 4.8
NOTES: Some columns may not foot exactly due to the method used for individual line item rounding.
*Excluding Fort Calhoun Station restart and recovery expense of $2.3 million in 2015.
**Excluding the Special Item that resulted from the Fort Calhoun Station Decommissioning Decision in 2016.
2018 CORPORATE OPERATING PLAN
INCOME STATEMENT
(DOLLARS IN THOUSANDS)
18 BUDGET VS. 17 PROJ.
$32.3 $25.8
$75.9
$66.5
$79.6
$0.0
$10.0
$20.0
$30.0
$40.0
$50.0
$60.0
$70.0
$80.0
$90.0
2015 ACTUAL 2016 ACTUAL 2017 PROJECTED 2017 BUDGET 2018 BUDGET
Net Income ($ in Millions)
14

2018 CORPORATE OPERATING PLAN COVERAGE RATIOS
The debt service (Senior Lien) coverage ratio is projected to be 3.43 times in 2017 and 3.50 times in 2018. Net receipts for 2018 are expected to increase by $8.4 million or 2.2% from 2017 projected levels. Debt service requirements for 2018 are expected to increase $0.01 million over 2017 projections.
The total debt service coverage ratio is projected to be 2.00 times in 2018.
The fixed charge ratio is projected to be 1.74 times in 2018.
15

ACTUAL ACTUAL PROJECTED BUDGET VARIANCE BUDGET
2015 2016 2017 2017 2017 2018 $ CHANGE % CHANGE
OPERATING REVENUES (EXCL. NC2) $1,066,948 $1,054,650 $1,019,332 $1,007,680 $11,652 $1,036,750 $17,418 1.7
INTEREST INCOME - BONDS RESERVE ACCOUNT 1,250 1,317 1,109 3,740 (2,631) 843 (266) (24.0)
O&M EXPENSE (EXCL. NC2 PARTICIPANT SHARE) (789,080) (770,066) (596,245) (578,629) (17,616) (604,695) (8,450) 1.4
PAYMENTS IN LIEU OF TAXES (32,241) (34,138) (33,748) (33,894) 146 (34,038) (290) 0.9
NET RECEIPTS $246,877 $251,764 $390,448 $398,897 ($8,449) $398,860 $8,412 2.2
DEBT SERVICE REQUIREMENTS (SENIOR LIEN) $114,139 $114,363 $113,780 $113,783 ($3) $113,823 $43 0.0
DEBT SERVICE (SENIOR LIEN) COVERAGE RATIO 2.16 2.20 3.43 3.50 3.50
MEMO: OTHER COVERAGE RATIOS:
TOTAL DEBT SERVICE COVERAGE RATIO 2.00 2.00 2.00 2.00 2.00
.
FIXED CHARGE RATIO 1.73 1.74 1.74 1.74 1.74
NOTES: Some columns may not foot exactly due to the method used for individual line item rounding.
2018 CORPORATE OPERATING PLAN
COVERAGE RATIOS
(DOLLARS IN THOUSANDS)
18 BUDGET VS. 17 PROJ.
2.16 2.20
3.43 3.50 3.50
2.00 2.00 2.00 2.00 2.00 1.73 1.74 1.74 1.74 1.74
0.00
1.00
2.00
3.00
4.00
2015 ACTUAL 2016 ACTUAL 2017 PROJECTED 2017 BUDGET 2018 BUDGET
Coverage Ratios (Times)
Debt Service Coverage Ratio Total Debt Service Coverage Ratio Fixed Charge Ratio
16

2018 CORPORATE OPERATING PLAN DEBT AND FINANCING DATA
Total revenue bonds outstanding at year-end 2018 are projected to equal $1,365.3 million. The 2018 budget does not anticipate the issuance of new revenue bonds but does have revenue bond maturities of $47.5 million. The outstanding Revenue Bond balance will not be impacted by the 2018 Financing Plan, which provides flexibility to capitalize on market conditions.
Total subordinated bonds outstanding at year-end 2018 are projected to equal $336.0 million. The 2018 budget does not anticipate the issuance of new subordinated bonds but does have subordinated bond maturities of $1.1 million.
Total minibonds and other notes outstanding at year-end 2018 are budgeted to be $31.0 million.
Total NC2 revenue bonds outstanding at year-end 2018 are projected to equal $212.0 million. The 2018 budget does not anticipate the issuance of new NC2 revenue bonds but does have NC2 revenue bond maturities of $3.2 million.
The total interest rate on existing debt will average 4.33% at the end of 2017 and 4.35% at the end of 2018. The debt to capitalization ratio is projected to be 62% for 2018.
17

ACTUAL ACTUAL PROJECTED BUDGET VARIANCE BUDGET
2015 2016 2017 2017 2017 2018 $ CHANGE % CHANGE
REVENUE BONDS-1788
BALANCE - BEGINNING OF YEAR $1,471,830 $1,513,725 $1,458,365 $1,458,365 $0 $1,412,770 ($45,595) (3.1)
MATURITIES / RETIREMENTS (40,465) (43,065) (45,595) (47,495) 1,900 (47,495) (1,900) 4.2
NEW ISSUES 82,360 (12,295) 0 0 0 0 -
BALANCE - END OF YEAR $1,513,725 $1,458,365 $1,412,770 $1,410,870 $1,900 $1,365,275 ($47,495) (3.4)
AVERAGE INTEREST RATE (END OF YEAR) 4.69% 4.68% 4.70% 4.71% 4.71%
SUBORDINATED
BALANCE - BEGINNING OF YEAR $337,375 $337,375 $337,280 $337,280 $0 $337,120 ($160) (0.0)
MATURITIES / RETIREMENTS 0 (95) (160) (1,095) 935 (1,095) (935) 584.4
NEW ISSUES 0 0 0 0 0 0 0 -
BALANCE - END OF YEAR $337,375 $337,280 $337,120 $336,185 $935 $336,025 ($1,095) (0.3)
AVERAGE INTEREST RATE (END OF YEAR) 3.97% 3.97% 3.97% 3.98% 3.97%
MINIBONDS
BALANCE - BEGINNING OF YEAR $28,915 $29,338 $29,816 $29,816 $0 $30,295 $479 1.6
MATURITIES / RETIREMENTS (135) (127) (125) 0 (125) 0 125 (100.0)
ACCRETED INTEREST 558 605 604 649 (45) 678 74 12.3
BALANCE - END OF YEAR $29,338 $29,816 $30,295 $30,465 ($170) $30,973 $678 2.2
AVERAGE INTEREST RATE (END OF YEAR) 5.44% 5.01% 4.99% 4.97% 4.99%
COMMERCIAL PAPER
BALANCE - BEGINNING OF YEAR $150,000 $150,000 $150,000 $150,000 $0 $150,000 $0 0.0
MATURITIES / RETIREMENTS 0 0 0 0 0 0 0 -
NEW ISSUES 0 0 0 0 0 0 0 -
BALANCE - END OF YEAR $150,000 $150,000 $150,000 $150,000 $0 $150,000 $0 0.0
AVERAGE INTEREST RATE (END OF YEAR) 0.23% 0.73% 0.60% 0.60% 1.05%
REVENUE BONDS-NC2 (SEPARATE ELEC. SYS.)
BALANCE - BEGINNING OF YEAR $236,725 $225,910 $218,460 $218,460 $0 $215,215 ($3,245) (1.5)
MATURITIES / RETIREMENTS (3,080) (3,190) (3,245) (3,220) (25) (3,220) 25 (0.8)
NEW ISSUES (7,735) (4,260) 0 0 0 0 0 -
BALANCE - END OF YEAR $225,910 $218,460 $215,215 $215,240 ($25) $211,995 ($3,220) (1.5)
AVERAGE INTEREST RATE (END OF YEAR) 4.81% 4.88% 4.91% 4.91% 4.93%
TOTAL AVERAGE INTEREST RATE (END OF YEAR) 4.31% 4.43% 4.33% 4.33% 4.35%
TOTAL INTEREST EXPENSE (ON DEBT) $91,468 $87,914 $84,208 $83,646 $562 $82,624 ($1,584) (1.9)
DEBT TO CAPITALIZATION RATIO 51% 66% 64% 64% 62%
NOTES: Some columns may not foot exactly due to the method used for individual line item rounding.
2018 CORPORATE OPERATING PLAN
DEBT & FINANCING DATA
(DOLLARS IN THOUSANDS)
18 BUDGET VS. 17 PROJ.
18

2018 CORPORATE OPERATING PLAN CASH FLOW ANALYSIS
Projected cash receipts for 2017 are $1,148.6 million, which is $117.1 million over budget. Cash disbursements are projected to be $1,148.3 million in 2017 or $62.7 million over the budget amount primarily due to higher O&M expense of $20.4 million and contributions to Reserve Funds.
In 2018, cash receipts are expected to decrease by $10.7 million to $1,137.8 million. This decrease is primarily related to wholesale revenues.
Cash disbursements in 2018 are anticipated to decrease by $26.4 million to $1,121.9 million. The decreases in cash disbursements for 2018 include O&M expense of $19.8 million or 4.2% and lower contributions to Reserve Funds.
The budget values of cash receipts and disbursements result in a projected year-end cash balance of $385.7 million in 2018. Net operating cash flow for 2018 is projected to be $15.9 million.
19

ACTUAL ACTUAL PROJECTED BUDGET VARIANCE BUDGET
2015 2016 2017 2017 2017 2018 $ CHANGE % CHANGE
CASH BEGINNING OF PERIOD $336,300 $364,418 $369,493 $337,817 $31,676 $369,775 $282 0.1
RECEIPTS
GENERAL BUSINESS REVENUES $903,816 $946,413 $939,314 $940,303 ($989) $946,077 $6,763 0.7
WHOLESALE REVENUES (INCL. NC2) 195,505 174,995 155,525 52,629 102,896 140,860 (14,665) (9.4)
OTHER ELECTRIC REVENUES 30,929 29,917 30,310 29,017 1,293 31,599 1,289 4.3
INTEREST INCOME 10,166 6,511 19,900 7,737 12,163 15,862 (4,038) (20.3)
PRODUCTS & SERVICES 4,288 3,739 3,515 1,788 1,727 3,450 (65) (1.8)
USE OF RESERVE ACCOUNTS 21,000 0 0 0 0 0 0 -
TOTAL RECEIPTS $1,165,704 $1,161,575 $1,148,564 $1,031,474 $117,090 $1,137,848 ($10,716) (0.9)
DISBURSEMENTS
O&M EXPENSE (W/O FUEL) $650,436 $619,520 $469,444 $449,046 $20,398 $449,661 ($19,783) (4.2)
DECOMMISSIONING EXPENSE 5,160 17,576 147,469 143,000 4,469 156,000 8,531 5.8
PAYMENTS IN LIEU OF TAXES 32,240 32,301 33,749 33,894 (145) 34,017 268 0.8
DEBT SERVICE 144,996 144,044 143,300 144,367 (1,067) 145,018 1,718 1.2
CAPITAL EXPENDITURES 199,979 142,650 123,000 130,000 (7,000) 144,000 21,000 17.1
FOSSIL FUEL 174,299 164,852 169,075 169,799 (724) 195,988 26,913 15.9
NUCLEAR FUEL 19,255 21,768 0 0 0 0 0 -
CHANGES IN OTHER NET ASSETS 6,221 (12,211) 29,892 0 29,892 (11,550) (41,442) (138.6)
CONTRIBUTIONS TO RESERVE ACCOUNTS 0 26,000 32,353 15,500 16,853 8,770 (23,583) (72.9)
TOTAL DISBURSEMENTS $1,232,586 $1,156,500 $1,148,282 $1,085,606 $62,676 $1,121,904 ($26,378) (2.3)
NET OPERATING CASH FLOW ($66,882) $5,075 $282 ($54,132) $54,414 $15,944 $15,662 5,553.9
FINANCING $100,000 $0 $0 $0 $0 $0 $0 -
FINANCING COST / RESERVE AMOUNT (5,000) 0 0 0 0 0 0 -
COMMERCIAL PAPER - NET 0 0 0 0 0 0 0 -
OTHER 0 0 0 0 0 0 0 -
NC2 PARTICIPANT CONTRIBUTION 0 0 0 0 0 0 0 -
TOTAL FINANCING $95,000 $0 $0 $0 $0 $0 $0 -
TOTAL CHANGE IN CASH $28,118 $5,075 $282 ($54,132) $54,414 $15,944 $15,662 5,553.9
CASH END OF PERIOD $364,418 $369,493 $369,775 $283,685 $86,090 $385,719 $15,943 4.3
DECOMMISSIONING FUND $373,334 $382,000 $420,000 $386,208 $33,792 $449,000 $29,000 6.9
NOTES: Some columns may not foot exactly due to the method used for individual line item rounding.
2018 CORPORATE OPERATING PLAN
CASH FLOW ANALYSIS
(DOLLARS IN THOUSANDS)
18 BUDGET VS. 17 PROJ.
20

ENERGY SALES AND REVENUES

2018 CORPORATE OPERATING PLAN ELECTRIC ENERGY SALES AND ELECTRIC CUSTOMERS
Electric energy sales for 2018 are projected to be 15,850,316 MWh or 1.8% lower than the 2017 projected energy sales. General business sales are expected to increase 12,777 MWh in 2018. Wholesale sales (including NC2 participation sales) are budgeted to decrease 295,572 MWh or 5.3% from 2017 projected levels.
In 2018, the average number of general business customers is expected to increase by 3,030 or 0.8% above 2017 projections.
Average kWh usage per customer is expected to decrease by 0.7% in 2018.
21

ACTUAL ACTUAL PROJECTED BUDGET VARIANCE BUDGET
2015 2016 2017 2017 2017 2018 MWh CHANGE % CHANGE
ELECTRIC ENERGY SALES (MWh)
RESIDENTIAL 3,470,523 3,588,933 3,555,770 3,564,975 (9,205) 3,560,129 4,359 0.1
COMMERCIAL 3,630,557 3,683,821 3,635,932 3,641,346 (5,414) 3,683,863 47,931 1.3
INDUSTRIAL 3,301,175 3,328,290 3,390,440 3,432,257 (41,817) 3,351,143 (39,297) (1.2)
SUBTOTAL 10,402,255 10,601,044 10,582,142 10,638,578 (56,436) 10,595,135 12,993 0.1
UNBILLED SALES (26,640) 63,638 (7,272) 1,706 (8,978) (7,488) (216) 3.0
GENERAL BUSINESS SALES 10,375,615 10,664,682 10,574,870 10,640,284 (65,414) 10,587,647 12,777 0.1
NC2 PARTICIPANT 1,956,626 2,535,796 2,185,164 2,178,800 6,364 2,523,173 338,009 15.5
OTHER 5,884,058 4,702,471 3,373,078 1,739,712 1,633,366 2,739,496 (633,582) (18.8)
WHOLESALE SALES 7,840,683 7,238,266 5,558,242 3,918,512 1,639,730 5,262,670 (295,572) (5.3)
TOTAL MWh SALES 18,216,298 17,902,948 16,133,112 14,558,796 1,574,316 15,850,316 (282,796) (1.8)
ELECTRIC CUSTOMERS (12 MONTH AVG.)
RESIDENTIAL 319,501 323,784 326,857 322,607 4,250 329,631 2,774 0.8
COMMERCIAL 45,105 45,537 46,036 45,953 83 46,295 259 0.6
INDUSTRIAL 174 164 162 175 (13) 159 (3) (1.9)
TOTAL GEN. BUS. CUSTOMERS 364,779 369,485 373,055 368,735 4,320 376,085 3,030 0.8
kWh / CUSTOMER
RESIDENTIAL 10,862 11,084 10,879 11,051 (172) 10,800 (78) (0.7)
COMMERCIAL 80,492 80,898 78,980 79,240 (260) 79,574 593 0.8
INDUSTRIAL 18,990,461 20,243,021 20,928,642 19,612,897 1,315,745 21,076,371 147,729 0.7
AVERAGE kWh / CUSTOMER 28,517 28,691 28,366 28,852 (485) 28,172 (194) (0.7)
NOTES: Some columns may not foot exactly due to the method used for individual line item rounding.
2018 CORPORATE OPERATING PLAN
ELECTRIC ENERGY SALES AND CUSTOMERS
18 BUDGET VS. 17 PROJ.
22

2018 CORPORATE OPERATING PLAN OPERATING REVENUES
Total electric operating revenues for 2017 are projected to be $1,089.7 million, which is $14.3 million or 1.3% over budget. Increases are primarily due to wholesale revenues that are projected to be $35.1 million over budget. The retail revenues reflect funding an additional $8.0 million into the Rate Stabilization Fund and $24.4 million into the Decommissioning and Benefits Reserve Fund (DABR).
Total electric operating revenues for 2018 are expected to be $1,104.4 million, which is $14.7 million or 1.3% over the 2017 projected operating revenues. The increase is primarily due to the 2018 reduced funding to the Reserve Funds.
23

ACTUAL ACTUAL PROJECTED BUDGET VARIANCE BUDGET
2015 2016 2017 2017 2017 2018 $ CHANGE % CHANGE
ELECTRIC OPERATING REVENUES
RESIDENTIAL $383,050 $410,958 $402,274 $405,217 ($2,943) $406,571 $4,297 1.1
COMMERCIAL 315,079 324,545 322,091 319,276 2,815 324,810 2,719 0.8
INDUSTRIAL 201,805 210,912 214,949 217,004 (2,055) 214,071 (878) (0.4)
SUBTOTAL $899,935 $946,415 $939,314 $941,498 ($2,184) $945,452 $6,138 0.7
FPPA TRUE-UP ($19,166) (6,115) ($1,620) $0 ($1,620) ($625) $995 (61.4)
PROVISION FOR DABR 0 0 (24,353) 0 (24,353) (8,770) 15,583 (64.0)
PROVISION FOR RATE STABILIZATION 25,000 (26,000) (8,000) (15,500) 7,500 0 8,000 (100.0)
UNBILLED REVENUES/ADJUSTMENTS (976) 6,753 (1,455) 35 (1,490) (765) 690 (47.4)
SUBTOTAL $4,858 ($25,363) ($35,428) ($15,465) ($19,963) ($10,160) $25,268 (71.3)
NC2 PARTICIPANTS $64,287 $71,826 $70,389 $67,775 $2,614 $67,665 ($2,724) (3.9)
OTHER 131,226 103,680 85,136 52,630 32,506 69,857 (15,279) (17.9)
TOTAL WHOLESALE REVENUES 195,512 $175,506 $155,525 $120,405 $35,120 $137,522 ($18,003) (11.6)
TOTAL SALES OF ELECTRIC ENERGY $1,100,305 $1,096,558 $1,059,411 $1,046,437 $12,974 $1,072,814 13,403 1.3
OTHER ELECTRIC REVENUES
CUSTOMER FORFEITED DISCOUNTS $4,555 $4,638 $4,596 $4,646 ($50) $4,739 $143 3.1
RENT FROM ELECTRIC PROPERTY 3,832 3,818 3,509 3,151 358 2,816 (693) (19.7)
MISC. SERVICE REVENUE 5,784 5,747 6,595 4,643 1,952 4,566 (2,029) (30.8)
TRANSMISSION WHEELING FEES 9,448 9,393 9,324 9,235 89 8,447 (877) (9.4)
DISTRIBUTION WHEELING FEES 1,421 1,766 1,915 1,848 67 2,139 224 11.7
TRANSMISSION - SPP 5,889 4,557 4,371 5,494 (1,123) 8,891 4,520 103.4
TOTAL OTHER ELECTRIC REVENUES $30,930 $29,918 $30,310 $29,017 $1,293 $31,599 $1,289 4.3
TOTAL ELECTRIC OPERATING REVENUES $1,131,234 $1,126,476 $1,089,721 $1,075,454 $14,267 $1,104,413 $14,692 1.3
NOTES: Some columns may not foot exactly due to the method used for individual line item rounding.
2018 CORPORATE OPERATING PLAN
OPERATING REVENUES
(DOLLARS IN THOUSANDS)
18 BUDGET VS. 17 PROJ.
24

2018 CORPORATE OPERATING PLAN AVERAGE CENTS/kWh
The average price per kWh for total general business customers is projected to be 8.92 cents for 2018. This is 0.05 cents or a 0.5% increase from the 8.88 cents that is projected for 2017.
25

ACTUAL ACTUAL PROJECTED BUDGET VARIANCE BUDGET
2015 2016 2017 2017 2017 2018 $ CHANGE % CHANGE
RESIDENTIAL 11.04 11.45 11.31 11.37 (0.05) 11.42 0.11 0.9
COMMERCIAL 8.68 8.81 8.86 8.77 0.09 8.82 (0.04) (0.5)
INDUSTRIAL 6.11 6.34 6.34 6.32 0.02 6.39 0.05 0.8
TOTAL 8.65 8.93 8.88 8.85 0.03 8.92 0.05 0.5
* * * * * *
NOTES: Some columns may not foot exactly due to the method used for individual line item rounding.
* Average rates are from the revenue recognized on the Income Statement. These rates differ from customer billed rates due to timing differences.
2018 CORPORATE OPERATING PLAN
AVERAGE CENTS/kWh
18 BUDGET VS. 17 PROJ.
8.65
8.93
8.88 8.85
8.92
8.50
8.55
8.60
8.65
8.70
8.75
8.80
8.85
8.90
8.95
2015 ACTUAL 2016 ACTUAL 2017 PROJECTED 2017 BUDGET 2018 BUDGET
Average Cents/kWh
26

GENERATION

2018 CORPORATE OPERATING PLAN NET SYSTEM REQUIREMENTS
Net system requirements for 2018 are anticipated to be 11,100,272 MWh, an increase of 0.8% from the 2017 projected amount. The major components of net system requirements are detailed below by demand and supply components.
Total demand from the customers is expected to decrease 282,796 MWh or 1.8%. Retail general business sales are budgeted to increase 12,777 MWh. Wholesale sales, excluding NC2 participation sales, are expected to decrease by 633,582 MWh or 18.8%.
Net generation is budgeted to increase 9.4% in 2018 to 12,315,329 MWh and firm/participation purchases are budgeted to increase 3.6%. Wholesale purchases are budgeted to decrease 1,397,943 MWh in 2018.
PROJECTED BUDGET INCREASE /
2017 2018 (DECREASE) % CHANGE
Demand Components
Retail General Business Sales 10,574,870 10,587,647 12,777 0.1%
NC2 Participation Sales 2,185,164 2,523,173 338,009 15.5%
Wholesale Sales 3,373,078 2,739,496 (633,582) -18.8%
Total 16,133,112 15,850,316 (282,796) -1.8%
Supply Components
Net Generation 11,256,909 12,315,329 1,058,420 9.4%
Firm/Participation Purchases 3,560,231 3,689,964 129,733 3.6%
Wholesale Purchases 1,755,592 357,649 (1,397,943) -79.6%
Lost or Unaccounted For (439,620) (512,625) (73,005) 16.6%
Total 16,133,112 15,850,316 (282,796) -1.8%
Net System Requirements
Demand and Supply Components (MWh)
27

ACTUAL ACTUAL PROJECTED BUDGET VARIANCE BUDGET
2015 2016 2017 2017 2017 2018 MWh CHANGE % CHANGE
NET GENERATION (MWh)
TOTAL NET GENERATION 15,440,026 14,726,292 11,256,909 11,430,200 (173,291) 12,315,329 1,058,420 9.4
FIRM/PARTICIPATION PURCHASES 2,044,268 2,401,362 3,560,231 2,809,542 750,689 3,689,964 129,733 3.6
WHOLESALE PURCHASES 1,152,604 1,245,993 1,755,592 740,400 1,015,192 357,649 (1,397,943) (79.6)
TOTAL PURCHASES 3,196,872 3,647,355 5,315,823 3,549,942 1,765,881 4,047,613 (1,268,210) (23.9)
TOTAL INPUT 18,636,898 18,373,648 16,572,732 14,980,142 1,592,590 16,362,942 (209,790) (1.3)
WHOLESALE SALES
NC2 PARTICIPANT 1,956,626 2,535,796 2,185,164 2,178,800 6,364 2,523,173 338,009 15.5
OTHER 5,884,058 4,702,471 3,373,078 1,739,712 1,633,366 2,739,496 (633,582) (18.8)
TOTAL WHOLESALE SALES 7,840,683 7,238,266 5,558,242 3,918,512 1,639,730 5,262,670 (295,572) (5.3)
NET SYSTEM REQUIREMENTS 10,796,215 11,135,381 11,014,490 11,061,630 (47,140) 11,100,272 85,782 0.8
TOTAL GENERAL BUSINESS SALES 10,375,615 10,664,682 10,574,870 10,640,284 (65,414) 10,587,647 12,777 0.1
ENERGY LOST OR UNACCOUNTED FOR 420,600 470,699 439,620 421,345 18,275 512,625 73,005 16.6
TOTAL GEN. BUS. SALES 10,796,215 11,135,381 11,014,490 11,061,630 (47,140) 11,100,272 85,782 0.8
PEAK LOAD (MW)
EXCLUDES DSM 2,315 2,354 2,427 2,417 10 2,346 (81) (3.3)
INCLUDES DSM 2,315 2,354 2,427 2,297 130 2,223 (204) (8.4)
LOAD FACTOR (%) - REFLECTS DSM 53.2 54.0 51.8 52.2 (0.4) 54.0 2.2 4.3
NOTES: Some columns may not foot exactly due to the method used for individual line item rounding.
2018 CORPORATE OPERATING PLAN
NET SYSTEM REQUIREMENTS
18 BUDGET VS. 17 PROJ.
28

OPERATION AND MAINTENANCE EXPENSE

2018 CORPORATE OPERATING PLAN OPERATION AND MAINTENANCE EXPENSE AND DECOMMISSIONING EXPENDITURES
The District's 2018 total budgeted operation and maintenance (O&M) expense is $646.6 million, which is $8.1 million or 1.3% more than the 2017 projected amount.
Fuel expense is the largest category of O&M expense, representing 28.8% of total O&M expense. Fuel expense is budgeted at $186.1 million for 2018, an increase of $17.0 million or 10.1% more than the 2017 projected amount.
Production expense represents 13.1% of the total and is budgeted to be $84.6 million in 2018, which is $2.7 million or 3.2% more than the 2017 projected amount.
Purchased power, including wind purchases, represents 20.6% of total O&M expense and is budgeted at $133.1 million for 2018. This represents a decrease of $16.0 million or 10.7% below the 2017 projected amount.
Transmission and distribution expense represents 13.9% of total O&M expense and is budgeted at $89.6 million, which is $0.9 million or 1.0% less than the 2017 projected amount.
Customer accounting and services expense represents 5.5% of total O&M expense and is budgeted at $35.3 million for 2018. This represents an increase of $4.8 million or 15.7% more than the 2017 projected amount.
Administrative and general expense represents 18.1% of total O&M expense and is budgeted at $117.9 million for 2018. This category reflects an increase of $0.4 million or 0.4% more than the 2017 projected amount.
Decommissioning expenditures represents anticipated expenditures for decommissioning and is budgeted to be $136.2 million in 2018.
29

ACTUAL ACTUAL PROJECTED BUDGET VARIANCE BUDGET
2015 2016 2017 2017 2017 2018 $ CHANGE % CHANGE
FUEL $197,079 $186,766 $169,081 $171,367 ($2,286) $186,091 $17,010 10.1
PRODUCTION 282,149 252,312 81,963 92,020 (10,057) 84,626 2,663 3.2
PURCHASED POWER 107,672 119,511 149,056 120,084 28,972 133,058 (15,998) (10.7)
TRANSMISSION AND DISTRIBUTION 75,909 80,431 90,440 83,248 7,192 89,564 (876) (1.0)
CUSTOMER ACCOUNTING AND SERVICES 31,785 31,924 30,526 32,591 (2,065) 35,329 4,803 15.7
ADMINISTRATIVE AND GENERAL 147,344 152,914 117,458 121,544 (4,086) 117,906 448 0.4
TOTAL $841,938 $823,858 $638,524 $620,855 $17,669 $646,575 $8,051 1.3
DECOMMISSIONING EXPENDITURES $0 $19,701 $134,879 $174,352 ($39,473) $136,188 $1,309 1.0
NOTES: Some columns may not foot exactly due to the method used for individual line item rounding.
2018 CORPORATE OPERATING PLAN
OPERATION AND MAINTENANCE EXPENSE AND DECOMMISSIONING EXPENDITURES
18 BUDGET VS. 17 PROJ.
(DOLLARS IN THOUSANDS)
$842 $824
$639 $621 $647
$0
$100
$200
$300
$400
$500
$600
$700
$800
$900
2015 ACTUAL 2016 ACTUAL 2017 PROJECTED 2017 BUDGET 2018 BUDGET
Operations & Maintenance Expense ($ in Millions)
Fuel Production Purchased Power T&D Customer Accounts A&G
30

2018 CAPITAL AND DEFERRED EXPENDITURE PLAN

CAPITAL AND DEFERRED EXPENDITURES

2018 CORPORATE OPERATING PLAN CAPITAL AND DEFERRED EXPENDITURES
Capital expenditures for 2018 are budgeted at $147.6 million, which is $24.6 million more than the 2017 projected capital expenditures.
Production Plant expenditures for 2018 are budgeted at $18.0 million, which is $12.0 million or 40.0% less than the 2017 projected expenditures.
Transmission and Distribution Plant expenditures for 2018 are budgeted at $94.0 million, which is $19.0 million or 25.3% higher than the 2017 projected expenditures.
General Plant and other expenditures for 2018 are budgeted at $35.6 million, which is $17.6 million or 97.8% higher than the 2017 projected expenditures.
31
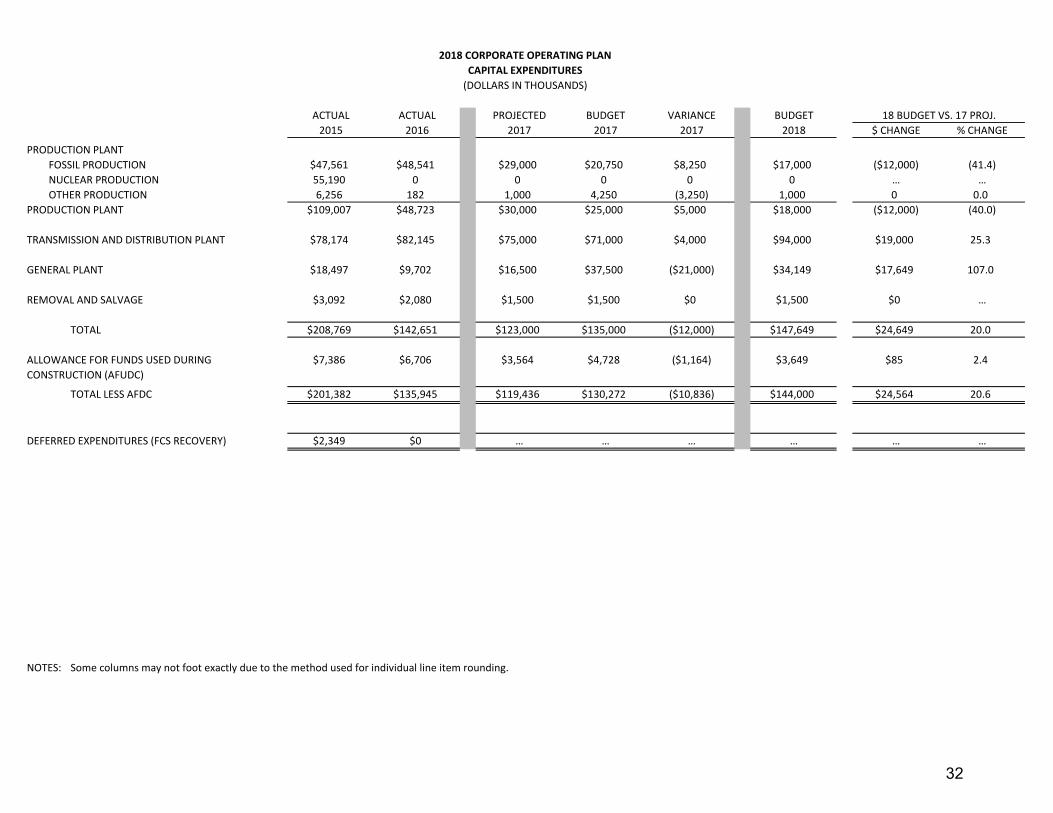
ACTUAL ACTUAL PROJECTED BUDGET VARIANCE BUDGET
2015 2016 2017 2017 2017 2018 $ CHANGE % CHANGE
PRODUCTION PLANT
FOSSIL PRODUCTION $47,561 $48,541 $29,000 $20,750 $8,250 $17,000 ($12,000) (41.4)
NUCLEAR PRODUCTION 55,190 0 0 0 0 0 … …
OTHER PRODUCTION 6,256 182 1,000 4,250 (3,250) 1,000 0 0.0
PRODUCTION PLANT $109,007 $48,723 $30,000 $25,000 $5,000 $18,000 ($12,000) (40.0)
TRANSMISSION AND DISTRIBUTION PLANT $78,174 $82,145 $75,000 $71,000 $4,000 $94,000 $19,000 25.3
GENERAL PLANT $18,497 $9,702 $16,500 $37,500 ($21,000) $34,149 $17,649 107.0
REMOVAL AND SALVAGE $3,092 $2,080 $1,500 $1,500 $0 $1,500 $0 …
TOTAL $208,769 $142,651 $123,000 $135,000 ($12,000) $147,649 $24,649 20.0
ALLOWANCE FOR FUNDS USED DURING $7,386 $6,706 $3,564 $4,728 ($1,164) $3,649 $85 2.4
CONSTRUCTION (AFUDC)
TOTAL LESS AFDC $201,382 $135,945 $119,436 $130,272 ($10,836) $144,000 $24,564 20.6
DEFERRED EXPENDITURES (FCS RECOVERY) $2,349 $0 … … … … … …
NOTES: Some columns may not foot exactly due to the method used for individual line item rounding.
2018 CORPORATE OPERATING PLAN
CAPITAL EXPENDITURES
(DOLLARS IN THOUSANDS)
18 BUDGET VS. 17 PROJ.
32

$208.8
$142.7
$123.0
$135.0
$147.6
$0.0
$50.0
$100.0
$150.0
$200.0
$250.0
2015 ACTUAL 2016 ACTUAL 2017 PROJECTED 2017 BUDGET 2018 BUDGET
Construction Expenditures($ in Millions)
Fossil Production Nuclear Production Transmission Other
33
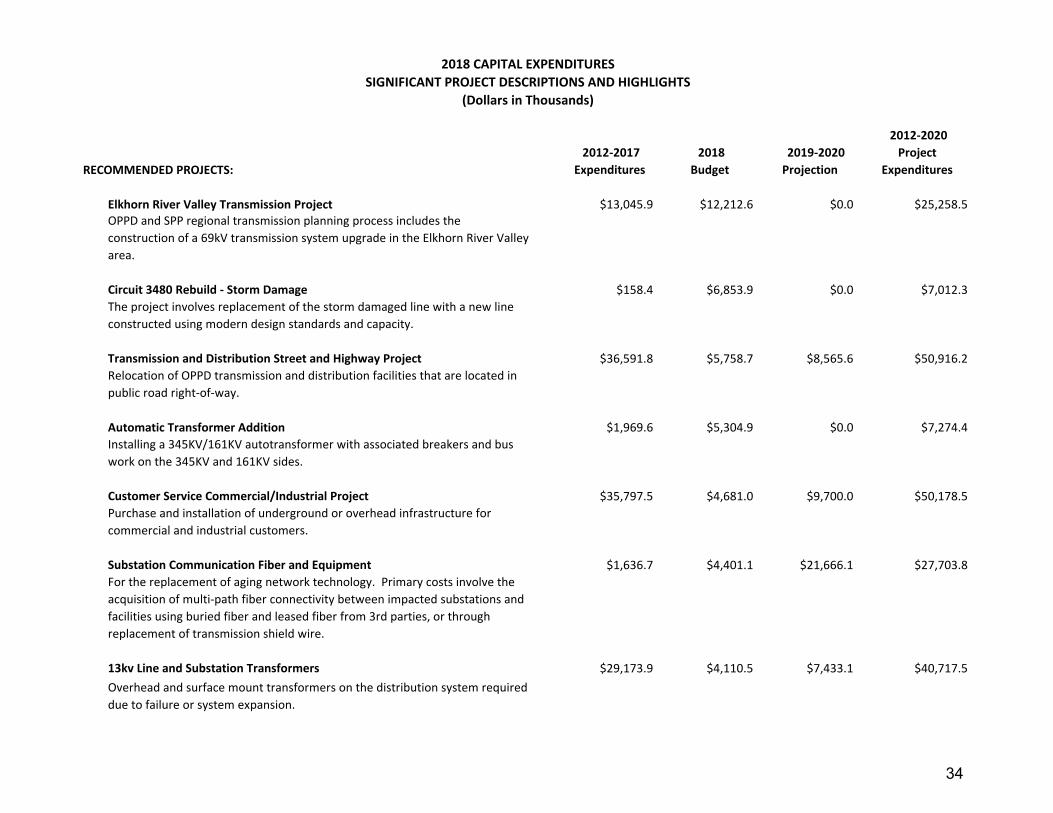
RECOMMENDED PROJECTS:
2012-2017
Expenditures
2018
Budget
2019-2020
Projection
2012-2020
Project
Expenditures
Elkhorn River Valley Transmission Project $13,045.9 $12,212.6 $0.0 $25,258.5OPPD and SPP regional transmission planning process includes the
construction of a 69kV transmission system upgrade in the Elkhorn River Valley
area.
Circuit 3480 Rebuild - Storm Damage $158.4 $6,853.9 $0.0 $7,012.3
The project involves replacement of the storm damaged line with a new line
constructed using modern design standards and capacity.
Transmission and Distribution Street and Highway Project $36,591.8 $5,758.7 $8,565.6 $50,916.2
Relocation of OPPD transmission and distribution facilities that are located in
public road right-of-way.
Automatic Transformer Addition $1,969.6 $5,304.9 $0.0 $7,274.4
Installing a 345KV/161KV autotransformer with associated breakers and bus
work on the 345KV and 161KV sides.
Customer Service Commercial/Industrial Project $35,797.5 $4,681.0 $9,700.0 $50,178.5
Purchase and installation of underground or overhead infrastructure for
commercial and industrial customers.
Substation Communication Fiber and Equipment $1,636.7 $4,401.1 $21,666.1 $27,703.8
For the replacement of aging network technology. Primary costs involve the
acquisition of multi-path fiber connectivity between impacted substations and
facilities using buried fiber and leased fiber from 3rd parties, or through
replacement of transmission shield wire.
13kv Line and Substation Transformers $29,173.9 $4,110.5 $7,433.1 $40,717.5
Overhead and surface mount transformers on the distribution system required
due to failure or system expansion.
2018 CAPITAL EXPENDITURES
SIGNIFICANT PROJECT DESCRIPTIONS AND HIGHLIGHTS
(Dollars in Thousands)
34

RECOMMENDED PROJECTS:
2012-2017
Expenditures
2018
Budget
2019-2020
Projection
2012-2020
Project
Expenditures
2018 CAPITAL EXPENDITURES
SIGNIFICANT PROJECT DESCRIPTIONS AND HIGHLIGHTS
(Dollars in Thousands)
Customer Service Residential Project $27,899.0 $4,000.0 $8,280.8 $40,179.8
Purchase and installation of underground or overhead infrastructure to new
residential developments.
NC2 Lime Optimization $46.4 $3,690.0 $3,450.0 $7,186.4NC2 utilizes a Spray Dryer Absorber (SDA) system to meet EPA regulations
which limit SO2 emission. This project will optimize lime usage improving
plant process controls and the ash recycling system.
Medium/Heavy Truck Replacement $16,800.8 $3,638.3 $4,754.3 $25,193.4
Replace eighteen medium duty trucks planned.
Construction Equipment Replace $7,342.2 $3,285.5 $6,731.9 $17,359.6
Replacement of construction equipment and trailers.
2018 Orion Radio System Master Site Equipment Move $0.0 $3,100.0 $0.0 $3,100.0
To move the master site equipment for the ORION regional radio system from
OPPDs Energy Control Center (ECC) to Douglas Countys newly built 911
dispatch center (DC911) at 156th & West Maple Road.
Enterprise Voice Over Internet Protocol (VOIP) Platform $948.0 $3,000.0 $800.0 $4,748.0OPPD’s current voice communications environment consists of a mix of over
seven different telecommunications systems. OPPD’s strategy is to evolve
from the mix of the infrastructure, to a common communications platform.
Part of migration requires an upgrade of the cabling and network
infrastructure as engineered on a site by site basis.
35

RECOMMENDED PROJECTS:
2012-2017
Expenditures
2018
Budget
2019-2020
Projection
2012-2020
Project
Expenditures
2018 CAPITAL EXPENDITURES
SIGNIFICANT PROJECT DESCRIPTIONS AND HIGHLIGHTS
(Dollars in Thousands)
Nebraska City Station Unit #2 Functional Work $9,192.2 $2,300.0 $4,809.0 $16,301.2
Nebraska City Station Unit 2 repairs from plant equipment as required for
reliability and maintenance.
Nebraska City Station Unit #1 Functional Work $13,102.4 $2,300.0 $4,809.0 $20,211.4
Nebraska City Unit 1 repairs from plant equipment as required for reliability
and maintenance.
TDIP Planned Cable Replacement $9,311.8 $2,077.7 $4,299.8 $15,689.3
This project replaces the worst performing underground distribution cable on
a performance driven basis. The project in 2018 will focus on planned rural
replacement of 46 miles of distribution wire in the North and South Rural
areas.
Transmission and Distribution Street Lights $13,030.6 $1,901.0 $3,928.6 $18,860.3Relocation, reinstallation and installation of OPPD streetlight facilities that are
located in public road right-of-way.
New Line 172 $611.2 $1,894.9 $7,382.4 $9,888.5
Build a 161kV Transmission Line from Substation 1255 (8905 S114th Street) to
Substation 1260 (12280 Hwy 50)
End User Device Refresh $1,408.0 $1,648.3 $0.0 $3,056.3
To replace 1800 end user devices (office computers) over a two year period
with the Windows 10 operating system.
North Omaha Station Functional Work $12,120.0 $1,500.0 $4,120.0 $17,740.0
North Omaha Station repairs from plant equipment as required for reliability
and maintenance.
36

NewGen Strategies and Solutions, LLC
REVIEW