2018 franchise landscape - natwest · there are 935 franchise systems operating in the uk the last...
TRANSCRIPT

2018 Franchise landscape Brought to you by the bfa and NatWest

This report looks at the results of the 31st survey amongst franchisors and franchisees in the UK, conducted on behalf of the British Franchise Association (bfa), in partnership with NatWest. Overall, UK franchising remains in good health and the sector continues to expand and mature.
Contents
02 Introduction
03 Keyfindings
04 The size and scale of franchising in the UK
11 Dynamics within the franchise industry
13 The economic contribution of franchising
16 Regional distribution of franchising in the UK
17 The international dimension of franchising
18 Franchisee recruitment
22 Costs, fees and ongoing charges
24 Franchisor/franchisee relationships
26 Background to the survey
27 Technical appendix: survey method
Introduction
2
Introduction/ contents
Keyfindings
The size and scale of franchising in the UK
Dynamics within the franchise industry
The economic contribution of franchising
Regional distribution of franchising in the UK
The international dimension of franchising
Franchisee recruitment
Costs, fees and ongoing charges
Franchisor/franchisee relationships
Background to the survey
Technical appendix: survey method

93% of franchisees claimed profitabilityin2018
6 in 10 franchised units turn over more than
£250,000
Theoverallfindingsofthereportareverypositive,withrecordgrowth in numerous areas.
The total contribution of franchising to the UK economy is reckoned to be in excess of £17 billion, up over £2 billion since the previous stats in 2015. Furthermore, there has been asignificantincreaseintheestimatedoverallnumberofpeopleworking in franchising, with over 700,000 people employed in the sector, with a little over half in full-time employment.
While around 70% of franchisees are male, the indications are that around 65% of those employed within franchise units are female. Furthermore, more females are becoming franchisees, with a 20% jump since the 2015 report.
More under 30s are also getting into franchising by becoming franchise business owners, with 18% of all franchisees now under 30. Of the new franchisees under 30, 52% are female, with 37% of all new franchisees in the last 2 years being female.
There are an estimated 48,600 franchised units in the UK, the highest number ever and nearly two times more than 25 years ago, with the number of franchisees reckoned to be around 20,000. That’s because around a third of franchisees own and run multiple units.
One in three franchisors also have international operations. Of those who do not currently operate internationally, 4% have adefinitebusinessplantodoso,andafurther30%are considering it an as option.
The biggest growth areas for franchising remain personal services and hotel and catering, although store retailing also shows some growth, despite a challenging environment for retail.
Franchiseesclaimedprofitabilityremainshighat93%,and over two-thirds of franchised units that have been running for fiveyearsormorereportbeingeitherquiteorhighlyprofitable. 60% of franchised units turn over more than £250,000. Failure rates for franchises remain very low, with fewer than 1% per year closing due to commercial failure.
Keyfindings
18% of all franchises are under 30
Source: The British Franchise Association/NatWest Franchise Survey 2017.
65%
of people employed in franchisee businesses are women
37%of new franchisees are women
+20% since 2015
Multi-unit franchising is on the up at
36%+7% since 2015
£17.2bnTurnover generatedUp 2.1 bn since 2015
+14%
710,000People employed in franchisingUp 89,000 since 2015
+14%
48,600Franchised units in the UKUp 4,400 since 2015
+10%
3
Introduction/ contents
Keyfindings
The size and scale of franchising in the UK
Dynamics within the franchise industry
The economic contribution of franchising
Regional distribution of franchising in the UK
The international dimension of franchising
Franchisee recruitment
Costs, fees and ongoing charges
Franchisor/franchisee relationships
Background to the survey
Technical appendix: survey method

There are 935 franchise systems operating in the UKThe last time the survey was conducted in 2015, the bfa made a substantial revision to make sure that all active franchise systems were included and all those that were no longer active were removed. This resulted in a reduction in system numbers but an increase in unit numbers overall. When a further revision took place this year, a net 34 systems were added. Figure 1 shows that in the 22 years since 1996, the number of active UK franchise systems has doubled.
The size and scale of franchising in the UK
950
850
750
650
550
450
350
250
150
50
-50
1988
1989
1990
1991
1992
1993
1994
1995
1996
1997
1998
1999
2000
2001
2002
2003
2004
2005
2006
2007
2008
2009
2010
2011
2013
2015
2018
Source: bfa/NatWest list of all UK franchise systems
Figure 1: Number of UK franchise systems over time
244
396
597
695
838
930 935
474
4
Keyfindings
The size and scale of franchising in the UK
Dynamics within the franchise industry
The economic contribution of franchising
Regional distribution of franchising in the UK
The international dimension of franchising
Franchisee recruitment
Costs, fees and ongoing charges
Franchisor/franchisee relationships
Background to the survey
Technical appendix: survey method
Introduction/ contents

Figure 2: Ownership of franchise systems
5
The franchise sector is evolving
In the past 7 years, the number of systems has only increased slightly, from 929 to 935 (about 0.6%), whereas the number of franchised units has increased by almost 25%. The main driver of this has been increased growth amongst the very largest franchise systems in the hotel and catering sector and the personal services sector over the past 5 to 10 years.
Franchising systems in the UK continue to be predominantly UK-owned and run
4 in 5 of UK franchise systems are run by the owner of the system. The remainder are split evenly between subsidiaries and master licence holder (Figure 2).
Coffee Shops
Costa Coffee had just over 170 units 10 years ago, and now has 2,300.
Similarly, there are around 400 franchised Starbucks stores in the UK.
Fast Food
KFC has also tripled in size with regards to the number of franchised units over the same period.
Subway was estimated to have around 1,500 units 10 years ago and now has around 2,200.
Gyms and Fitness
AnytimeFitnessfirst appeared in 2013 with 8 units and now has 133 units.
% based on 3-year rolling averages
2007 2008 2009 2010 2011 2013 2015 2018
No. % No. % No. % No. % No. % No. % No. %% No. %%
Ultimate owner of the system 604 75 626 75 648 77 700 78 710 77 760 82 730 81 747 79
Subsidiary of parent company that owns the system
89 11 100 12 101 12 107 12 117 13 87 9 90 9 87 12
Master licensee of another company that owns the system
113 14 109 13 93 11 90 10 99 11 80 9 81 10 96 10
Source: Q1a Base: All franchisors
Care Homes
Bluebird Care has grown from 35 to 188 units over the past 10 years.
Home Instead has grown from 18 to 190 units over the same period.
Keyfindings
The size and scale of franchising in the UK
Dynamics within the franchise industry
The economic contribution of franchising
Regional distribution of franchising in the UK
The international dimension of franchising
Franchisee recruitment
Costs, fees and ongoing charges
Franchisor/franchisee relationships
Background to the survey
Technical appendix: survey method
Introduction/ contents

There are now estimated to be 48,600 franchised units in the UK
It’s estimated that the number of franchised units has nearly doubled in the past 25 years. In recent years (Figure 3) much of this increase can be accounted for by the hotel & catering sector. This is home to some of the largest systems such as the big pub chains, fast food chains and coffee shop chains. The top 10 franchise systems account for around a third of the total number of franchised units.
Figure 3: Number of franchised units (000s)
50
45
40
35
30
25
20
15
10
5
0
1993
1994
1995
1996
1997
1998
1999
2000
2001
2002
2003
2004
2005
2006
2007
2008
2009
2010
2011
2013
2015
2018
24.9
30
33.8
36.6
44.2
48.6
The number of personal services franchised units has more than doubled in the past
years106
We monitored six business categories within franchising
Forthepast17years,wehaveclassifiedfranchisedbusinesses according to categories developed by the European Franchise Federation (EFF). While we can see that the EFF are (experimentally) movingtowardstheuseoftheNACEclassificationsystem,wedonotthinkthisisagoodfitatthistime.
The categories we use are as follows:
Hotel & catering: which includes hotels, coffee houses, fast food chains etc.
Store retailing: everything from travel agencies and shoe shops to bathroom centres.
Personal services: entertainment and tutoring for children, personal trainers, pet services etc.
Property services: including estate agencies as well as plumbing, cleaning and gardening etc.
Transport & vehicle services: couriers, car rental, vehicle repair.
Business & commercial services:printing,officesupplies,training,recruitment, accountancy.
Inthisdocumentwefrequentlyrefertothedifferencesbetweenthese categories in terms of performance, structure and other characteristics.
Keyfindings
The size and scale of franchising in the UK
Dynamics within the franchise industry
The economic contribution of franchising
Regional distribution of franchising in the UK
The international dimension of franchising
Franchisee recruitment
Costs, fees and ongoing charges
Franchisor/franchisee relationships
Background to the survey
Technical appendix: survey method
Introduction/ contents
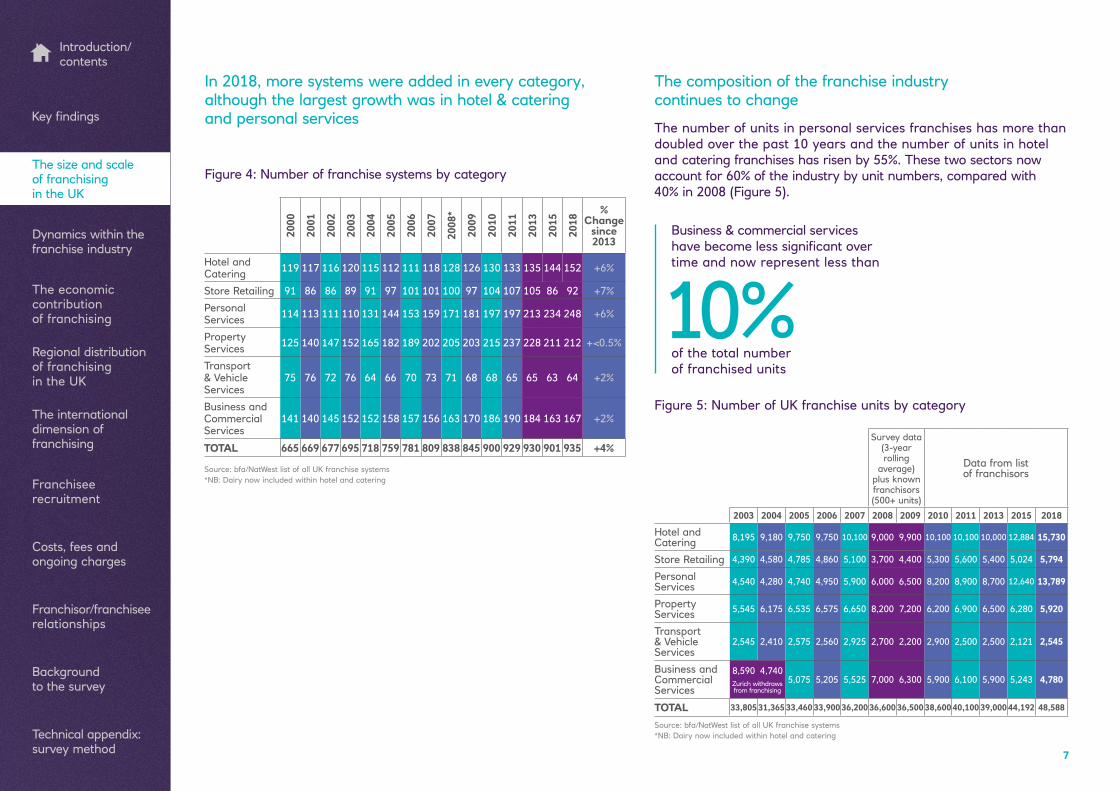
Business & commercial services havebecomelesssignificantovertime and now represent less than
of the total number of franchised units
10%
7
Survey data (3-year rolling
average) plus known franchisors (500+ units)
Data from list of franchisors
2003 2004 2005 2006 2007 2008 2009 2010 2011 2013 2015 2018
Hotel and Catering 8,195 9,180 9,750 9,750 10,100 9,000 9,900 10,100 10,100 10,000 12,884 15,730
Store Retailing 4,390 4,580 4,785 4,860 5,100 3,700 4,400 5,300 5,600 5,400 5,024 5,794
Personal Services 4,540 4,280 4,740 4,950 5,900 6,000 6,500 8,200 8,900 8,700 12,640 13,789
Property Services 5,545 6,175 6,535 6,575 6,650 8,200 7,200 6,200 6,900 6,500 6,280 5,920
Transport & Vehicle Services
2,545 2,410 2,575 2,560 2,925 2,700 2,200 2,900 2,500 2,500 2,121 2,545
Business and Commercial Services
8,590 4,7405,075 5,205 5,525 7,000 6,300 5,900 6,100 5,900 5,243 4,780
TOTAL 33,805 31,365 33,460 33,900 36,200 36,600 36,500 38,600 40,100 39,000 44,192 48,588
Figure 5: Number of UK franchise units by category
Source: bfa/NatWest list of all UK franchise systems *NB: Dairy now included within hotel and catering
Zurich withdraws from franchising
The composition of the franchise industry continues to change
The number of units in personal services franchises has more than doubled over the past 10 years and the number of units in hotel and catering franchises has risen by 55%. These two sectors now account for 60% of the industry by unit numbers, compared with 40% in 2008 (Figure 5).
In 2018, more systems were added in every category, although the largest growth was in hotel & catering and personal services
2000
2001
2002
2003
2004
2005
2006
2007
2008
*
2009
2010
2011
2013
2015
2018
% Change
since 2013
Hotel and Catering 119 117 116 120 115 112 111 118 128 126 130 133 135 144 152 +6%
Store Retailing 91 86 86 89 91 97 101 101 100 97 104 107 105 86 92 +7%
Personal Services 114 113 111 110 131 144 153 159 171 181 197 197 213 234 248 +6%
Property Services 125 140 147 152 165 182 189 202 205 203 215 237 228 211 212 +<0.5%
Transport & Vehicle Services
75 76 72 76 64 66 70 73 71 68 68 65 65 63 64 +2%
Business and Commercial Services
141 140 145 152 152 158 157 156 163 170 186 190 184 163 167 +2%
TOTAL 665 669 677 695 718 759 781 809 838 845 900 929 930 901 935 +4%
Source: bfa/NatWest list of all UK franchise systems *NB: Dairy now included within hotel and catering
Figure 4: Number of franchise systems by category
Keyfindings
The size and scale of franchising in the UK
Dynamics within the franchise industry
The economic contribution of franchising
Regional distribution of franchising in the UK
The international dimension of franchising
Franchisee recruitment
Costs, fees and ongoing charges
Franchisor/franchisee relationships
Background to the survey
Technical appendix: survey method
Introduction/ contents

Around
of franchisees now operate multiple units
1/3
8
It might appear surprising that in a time of relative austerity, these service-based businesses, which could be considered a luxury, have thrived. However, purchasing from a franchised brand could be seen as less risky to a customer, due to perceived reliability and consistency.
Incomparison,thenumberofunitsinstoreretailingappearflat over time. However, this should be viewed in the context of a highly challenging business environment, where many of the high street’s biggest names (Toys “R” Us, BHS and more recently House of Fraser), have struggled to compete with online retailers.
Franchising is a completely different model for retail in that the popularity of stores tends to rise and fall more organically based on supply and demand, rather than being dictated by a head officestrategyontheopeningorclosingofstores.
Multi-unit ownership is on the up
In 2013, once starting to notice an increasing trend of multi-unit ownership,wespecificallystartedaskingfranchiseeswhether they owned a single unit or multiple units.
In 2013, 25% said that they owned more than one unit. By 2015, this had risen to 29%, and in this year’s survey, 36% said they owned more than one unit.
There are some interesting dynamics here which will be worth watching over time:
As multi-unit franchises become more common, the bargaining powerandinfluenceofthemulti-franchiseewhencompared with the franchisor is likely to increase.
Multi-unit franchisees are (presumably) in a prime position to acquirethemostprofitablefranchisedunitsasthesebecomeavailable,furtherentrenchingthedegreeofinfluencetheyhold.
A note of caution should be added around the relatively small base size on this measure. It now appears likely that around one in three franchisees operate more than one franchised unit (Figure 6), with 19 of the 198 franchisees we spoke with running six or more units. This indicates that the actual number of franchisees is stable (at around 20,000) or perhaps even falling as the more successful franchisees take on more units.
All units %
All units% (2015)
Hotel & Catering
%
Store Retailing*
%
Personal Services
%
Property Services
%
Transport Vehicle
services*%
Business/ comms
services* (%)
Single units 64 71 40 63 81 86 75 76
Multiple units 36 29 60 37 19 14 25 24
Mean number of other units 4.87 5.34 6.56 3.90 2.33 1.40 2.00 1.20
Source: Q6a/b, Base: All franchisees*Base below 30
Figure 6: Franchise unit ownership by unit status
Keyfindings
The size and scale of franchising in the UK
Dynamics within the franchise industry
The economic contribution of franchising
Regional distribution of franchising in the UK
The international dimension of franchising
Franchisee recruitment
Costs, fees and ongoing charges
Franchisor/franchisee relationships
Background to the survey
Technical appendix: survey method
Introduction/ contents
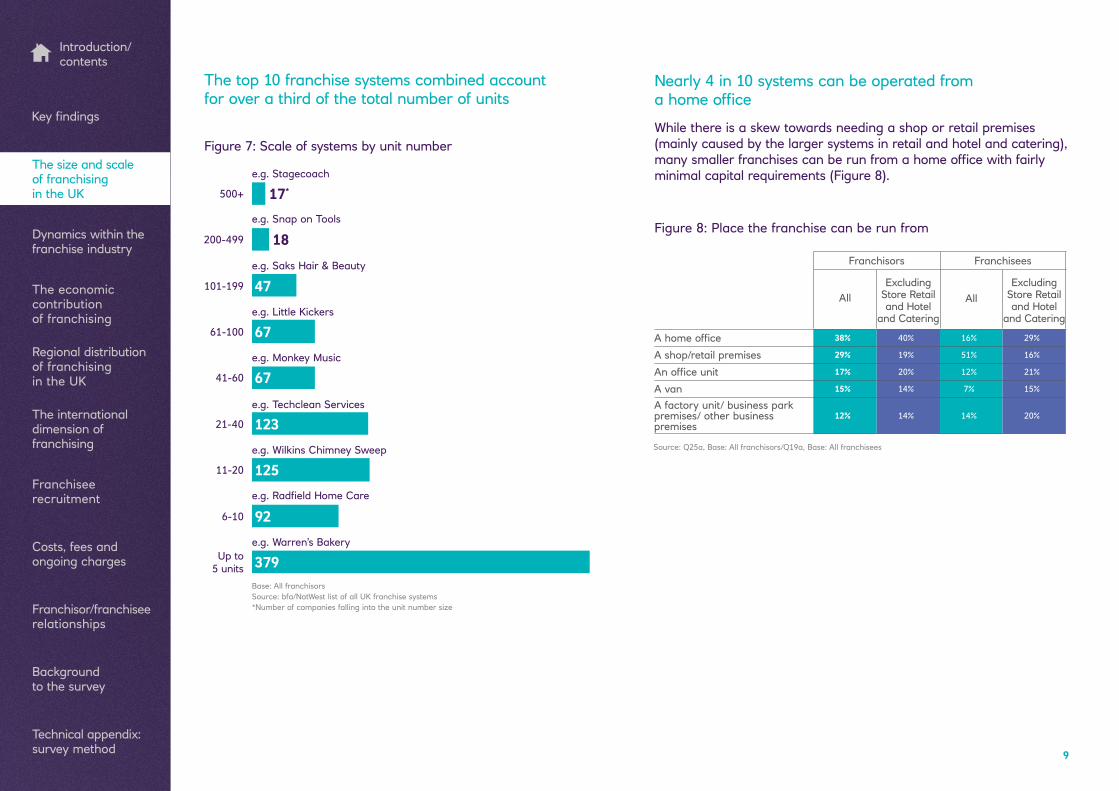
The top 10 franchise systems combined account for over a third of the total number of units
e.g. Stagecoach
e.g. Snap on Tools
e.g. Saks Hair & Beauty
e.g. Little Kickers
e.g. Monkey Music
e.g. Techclean Services
e.g. Wilkins Chimney Sweep
e.g.RadfieldHomeCare
e.g. Warren’s Bakery
Figure 7: Scale of systems by unit number
17*500+
18200-499
47101-199
6761-100
6741-60
12321-40
12511-20
926-10
379Up to 5 units
Base: All franchisors Source: bfa/NatWest list of all UK franchise systems *Number of companies falling into the unit number size
9
Nearly 4 in 10 systems can be operated from ahomeoffice
While there is a skew towards needing a shop or retail premises (mainly caused by the larger systems in retail and hotel and catering), manysmallerfranchisescanberunfromahomeofficewithfairlyminimalcapitalrequirements(Figure8).
Franchisors Franchisees
All Excluding
Store Retail and Hotel
and Catering
AllExcluding
Store Retail and Hotel
and Catering
Ahomeoffice 38% 40% 16% 29%
A shop/retail premises 29% 19% 51% 16%
Anofficeunit 17% 20% 12% 21%
A van 15% 14% 7% 15%
A factory unit/ business park premises/ other business premises
12% 14% 14% 20%
Figure 8: Place the franchise can be run from
Source: Q25a, Base: All franchisors/Q19a, Base: All franchisees
Keyfindings
The size and scale of franchising in the UK
Dynamics within the franchise industry
The economic contribution of franchising
Regional distribution of franchising in the UK
The international dimension of franchising
Franchisee recruitment
Costs, fees and ongoing charges
Franchisor/franchisee relationships
Background to the survey
Technical appendix: survey method
Introduction/ contents

* Figures rounded to nearest thousand**Zurich withdrawal from franchising
2015 and 2018 = Three year rolling averages
2001
2002
2003
2004
**
2005
2006
2007
2008
2009
2010
2011
2013
2015
2018
191
407
219
363
221
384
225
323
223
365
217
431
224
480
235
467
222
465
222
521
228
594
256
561
321
621
358
710
All Full-time
of franchisees are male
70%of those employed within franchise units are female
65%10
Figure 9: Total number employed in UK franchising (000s)
Figure 10: Number of part-time and full-time employees
Threequartersoffranchiseeunitsemploystaff and 30% employ six or more staff
Source: Q25a, Base: All franchisors/Q19a, Base: All franchisees 11+ 6-10 3-5 2 1 0
2006
2006
2007
2007
2008
2008
2009
2009
2010
2010
2011
2011
2013
2013
2015
2015
2018
2018
Part-time Full-time
5
9
15
12
21
38 36 40 3541
35 3932 32 30 27
3529 31 31 27 22 24
9
12
25
15
15
13
11
19
16
19
13
14
21
11
14
13
16
18
8
14
14
14
21
8
12
16
14
21
11
9
11
11
19
13
12
15
13
21
10
14
15
10
22
12
11
12
9
21
16
11
11
10
19
13
16
13
10
16
10
11
14
10
16
11
13
13
8
18
11
10
16
14
16
8
9
16
11
14
10
8
15
15
13
11
9
710,000 people are now employed in UK franchising
There does appear to be a trend towards higher numbers employed in UK franchising and, importantly, there is a mix of both part and full-timejobs,suitablefordifferentworkingrequirements(Figure9).
Keyfindings
The size and scale of franchising in the UK
Dynamics within the franchise industry
The economic contribution of franchising
Regional distribution of franchising in the UK
The international dimension of franchising
Franchisee recruitment
Costs, fees and ongoing charges
Franchisor/franchisee relationships
Background to the survey
Technical appendix: survey method
Introduction/ contents

After an edit of the list of franchise systems in 2015, fewer revisions wererequiredin2018andonlysevensystemshavebeenremoved(Figure 11).
Dynamics within the franchise industry
11
New entrants
Withdrawals
2004
+23Net Position
2005
+41
2006
+32
2007
+28
2008
+32
2009
+7
2010
+57
2011
+29
2013
+1
2015
-33
2018
+36
106
83100
59
80
5873
45 51
19
87 80 85
28
64
35
73 72
279
312
41
7
There’s little or no evidence that franchisees are being forced out of businessLevels of churn at a unit level (reported by franchisors) remain low, with just over 2% experiencing forced change during the past few years (Figure 12).
Forced (%) Voluntary (%)
1995
1996
1997
1998
1999
2000
2001
2002
2003
2004
2005
2006
2007
2008
2009
2010
2011
2013
2015
2018
5.3
7.4 7.0
4.65.3
6.24.8
3.7
2.1 1.7 1.5 1.8
4.6 5.0
3.13.7 4.1 4.6
2.2 2.1
3.42.4
5.4
3.25.1
3.6
5.97.1
7.26.8
4.8
6.4
5.24.0
5.8
3.4
3.2
3.03.6
4.1
Figure 12: Proportion of UK franchised units experiencing change Figure 11: System level churn: new entrants and withdrawals
Keyfindings
The size and scale of franchising in the UK
Dynamics within the franchise industry
The economic contribution of franchising
Regional distribution of franchising in the UK
The international dimension of franchising
Franchisee recruitment
Costs, fees and ongoing charges
Franchisor/franchisee relationships
Background to the survey
Technical appendix: survey method
Introduction/ contents
12
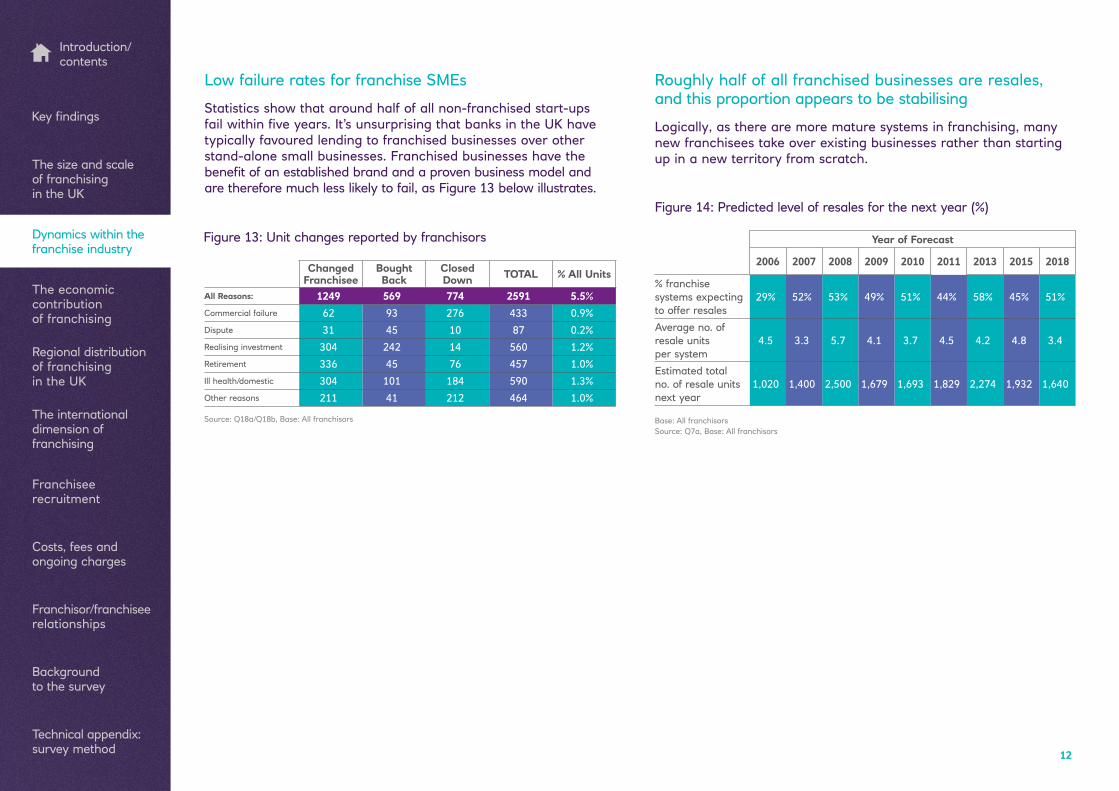
Low failure rates for franchise SMEs
Statistics show that around half of all non-franchised start-ups failwithinfiveyears.It’sunsurprisingthatbanksintheUKhavetypically favoured lending to franchised businesses over other stand-alone small businesses. Franchised businesses have the benefitofanestablishedbrandandaprovenbusinessmodeland are therefore much less likely to fail, as Figure 13 below illustrates.
Roughly half of all franchised businesses are resales, and this proportion appears to be stabilising
Logically, as there are more mature systems in franchising, many new franchisees take over existing businesses rather than starting up in a new territory from scratch.
Changed Franchisee
Bought Back
Closed Down TOTAL % All Units
All Reasons: 1249 569 774 2591 5.5%Commercial failure 62 93 276 433 0.9%Dispute 31 45 10 87 0.2%Realising investment 304 242 14 560 1.2%Retirement 336 45 76 457 1.0%Ill health/domestic 304 101 184 590 1.3%Other reasons 211 41 212 464 1.0%
Source: Q18a/Q18b, Base: All franchisors
Figure 13: Unit changes reported by franchisors
Figure 14: Predicted level of resales for the next year (%)
Year of Forecast
2006 2007 2008 2009 2010 2011 2013 2015 2018
% franchise systems expecting to offer resales
29% 52% 53% 49% 51% 44% 58% 45% 51%
Average no. of resale units per system
4.5 3.3 5.7 4.1 3.7 4.5 4.2 4.8 3.4
Estimated total no. of resale units next year
1,020 1,400 2,500 1,679 1,693 1,829 2,274 1,932 1,640
Base: All franchisorsSource: Q7a, Base: All franchisors
Keyfindings
The size and scale of franchising in the UK
Dynamics within the franchise industry
The economic contribution of franchising
Regional distribution of franchising in the UK
The international dimension of franchising
Franchisee recruitment
Costs, fees and ongoing charges
Franchisor/franchisee relationships
Background to the survey
Technical appendix: survey method
Introduction/ contents

Theoverallfigureforthecontributionoffranchisingiscalculatedbased on the average turnover for franchisees, multiplied by the number of units (adjusted for franchisor businesses themselves and the dairy industry). The steep rise is therefore directly related to the somewhat larger franchised businesses we are seeing on average in the survey.
Over half of franchised businesses now turn overmorethanaquarterofamillionpounds
In 2018, 6 of the franchisees we spoke to reported turnover in excess of £2m (Figure 16). 2 in 5 stated that their turnover was more than their franchisor led them to expect.
The economic contribution of franchising
Figure 16: Franchise unit turnover
Over £500k £250k–£499k £50k–£249k Less than £50k
Source: Q28a-h, Base: All franchisees providing their turnover
Franchising’s contribution to UK plc is now estimated to be over
£17bn19
8419
8519
8619
8719
8819
8919
9019
9119
9219
9319
9419
9519
9619
9719
9819
9920
0020
0120
0220
0320
0420
0520
0620
0720
0820
0920
1020
1120
1220
1320
15*
2018
*
*Rolling for past 3 data points used in 2015 and 2018
18
16
14
12
10
8
6
4
2
0
Figure 15: Franchising industry turnover (£bn)
0.9
4.75.3
8.99.1
11.8
17.2
13
2001
%
Mean
£292
,000
£299
,000
£297
,000
£291
,000
£318
,000
£323
,000
£360
,000
£326
,000
£335
,000
£335
,000
£349
,000
£356
,500
£378
,400
£400
,000
2002 2003 2004 2005 2006 2007 2008 2009 2010 2011 2013 2015 2018
22
42
13
23
26
38
14
22
25
34
21
20
26
40
19
16
27
35
13
24
19
44
14
22
20
37
17
26
19
37
16
28
20
34
21
23
18
37
20
24
17
35
19
30
15
39
19
26
12
34
19
35
11
29
21
40
Keyfindings
The size and scale of franchising in the UK
Dynamics within the franchise industry
The economic contribution of franchising
Regional distribution of franchising in the UK
The international dimension of franchising
Franchisee recruitment
Costs, fees and ongoing charges
Franchisor/franchisee relationships
Background to the survey
Technical appendix: survey method
Introduction/ contents

14
Businesssector,predictably,isakeyinfluencer on typical revenues
While this data is based on averages and is therefore subject to variation (between the mix of larger and smaller businesses in each sector), it does illustrate that most franchised businesses are sizeable enterprises.
Profitabilitylevelsremainhighandtheproportionof thoseclaimingtobehighlyprofitableisthelargest on record at 14%
Thesayinggoesthatwhileturnoverisvanity,profitissanity. Looking at the more established franchises that have been going for5yearsormore,2in5arehighlyprofitableandonly2% are loss-making (Figure 18).
Figure 17: Annual turnover of franchise units by sector Figure18:Franchiseeclaimedunitprofitability
Source: Q28a-h, Base: All franchisees providing their turnover
Over £500k £250k–£499k £50k–£249k Less than £50k
%
Mean
£627,363
Hotel & Catering
£625,570
Store Retailing
£282,847
Business & communications
services
21
27
5058
15
20
814
49
18
21
£344,288
Personal Services
15
32
27
29
£292,707
Transport & Vehicle
19
43
21
19
£240,278
Property Services
23
41
16
22
3
Loss-makingMarginallyprofitableQuiteprofitableHighlyprofitable
Source; Q17, Base: All franchisees providing their turnover
-23-12 -9 -5
-12 -8 -7 -9 -10 -12 -10 -9 -8 -7-15
-8-3 -2
4149 44 48
37 43 43 48 50 44 44 45 48 43 44 40 46 52
32
88 10 6 6 8 8
814
9
12 19
3850 37 39
39 35 42 37 3739 44 44
39 2932
473326
27
2
4
4 45
105
-30
1990Total
Profitable
1991 1992 2002 2003 2004 2005 2006 2007 2008 2009 2010 2011 2013 2015 2018Up to 2 yrs
3-4 yrs
2018 Time Held Franchise
5+ yrs
70 79 87 91 95 88 92 93 91 90 89 90 91 92 97 93 85 92 98
Keyfindings
The size and scale of franchising in the UK
Dynamics within the franchise industry
The economic contribution of franchising
Regional distribution of franchising in the UK
The international dimension of franchising
Franchisee recruitment
Costs, fees and ongoing charges
Franchisor/franchisee relationships
Background to the survey
Technical appendix: survey method
Introduction/ contents

15
Therearenosignificantdifferencesbetweensmaller andlargerbusinessesintermsofprofitability
Whenwelookatprofitabilityatasectorlevelweseethat:
96%ofhotel&cateringfranchisesareprofitable.
Businessservicesandretailhave76%and78%profitabilityrespectively.
93% of businesses operating from a shop or retail premises areprofitable(andalmosthalfofthesearequiteorhighlyprofitable).73%ofbusinessesoperatingfromahomeor homeofficeareprofitable.
Franchisees running multiple units tend to report higher profitabilityingeneral.
Whiletherearenosignificantdifferencesbetweensmallerandlargerbusinessesintermsofprofitability,thosewhohaveinvestedmore than £20k when setting up the business tend to have higher profitabilitythanthosewhohaveinvestedless.
Overallthisisaveryencouragingsetoffiguresforthesector, with only 3 of 198 businesses surveyed saying that they were definitely'loss-making'.
Brexit nerves? Franchisees and franchisors remain confidentintheirownbusinessesbutarelessconfidentabout the economy
The data shows that it’s not unusual for those in the franchise industry tofeelmoreconfidentabouttheirownbusinessesthanabouttheeconomy in general. However, it is a bit unusual to see a rise in one measure and a fall in the other (Figure 19).
Source: Q15a/Q16, Base: All franchisees; Source: Q16/Q17, Base: All franchisors
1994
1995
1996
1997
1998
1999
2000
2001
2002
2003
2004
2005
2006
2007
2008
2009
2010
2011
2012
2015
2018
100
90
80
70
60
50
40
30
20
10
0
Franchisors – economy generally
Franchisees – economy generally
Franchisors – own business
Franchisees – own business
Figure19:Businessandeconomicconfidence% expecting improvements over next 12 months
Keyfindings
The size and scale of franchising in the UK
Dynamics within the franchise industry
The economic contribution of franchising
Regional distribution of franchising in the UK
The international dimension of franchising
Franchisee recruitment
Costs, fees and ongoing charges
Franchisor/franchisee relationships
Background to the survey
Technical appendix: survey method
Introduction/ contents

16
Franchising is becoming more widespreadHistorically, franchising was highly concentrated around the South East and West Midlands, but over the past two decades it has become more widespread across the country (Figure 20). However, franchises continue to be focused around the main urban centres, where a greater population density makes for a larger potential marketplace (Figure 21).
Scotland 5%
North East 5%
West Midlands 10%
Yorkshire & Humberside 6%
125+
<85
85-99
100-124
Wales 3%
Northern Ireland 2%
Regional distribution of franchising in the UK
Figure 20: Regional distribution of franchised units Figure 21: Indexed to UK population
East Midlands 7%
London 18%
South East 19%
South West 9%
North West 10%
East Anglia 6%
Source: Q5, Base: All franchisors
Keyfindings
The size and scale of franchising in the UK
Dynamics within the franchise industry
The economic contribution of franchising
Regional distribution of franchising in the UK
The international dimension of franchising
Franchisee recruitment
Costs, fees and ongoing charges
Franchisor/franchisee relationships
Background to the survey
Technical appendix: survey method
Introduction/ contents

171717
Figure 22: Franchised businesses continue to make an important contribution to the local economy of all UK regions
Presence of All
Franchise Systems in Region
Regional Distribution
of Franchise Units
2015 Implied Annual
Turnover from
Franchising£ Billion
2018 Implied Annual
Turnover from
Franchising£ Billion
% Change in Implied Annual
Turnover from
Franchising£ Billion
Average2013-2018
%
Average2013-2018
%
Indexed onUK
Popn.*%
London 72% 18% 150 2.8 3.1 +8%
Other South East 82% 19% 140 2.9 3.2 +11%
South West 64% 9% 111 1.4 1.6 +10%
East Anglia 56% 6% 64 1.0 1.0 +1%
West Midlands 64% 10% 111 1.5 1.7 +8%
East Midlands 52% 7% 102 1.0 1.2 +14%
North West 62% 10% 87 1.6 1.7 +7%
Yorkshire 51% 6% 70 0.9 1.0 +11%
North/North East 46% 5% 107 0.7 0.8 +7%
Wales 40% 3% 66 0.4 0.5 +18%
Scotland 39% 5% 53 0.8 0.8 -2%
Northern Ireland 26% 2% 76 0.3 0.4 +21%
Source: Q5. Base: All Franchisors
*Indices are based on the regional spread of the UK population
One in three UK franchisors also have international operations
A third of franchisors award the master licences or control the franchising of units outside the UK in addition to their UK operations.
The regional distribution of international franchise export shows:
22% operate in Europe (including Republic of Ireland)
4% operate in the US
15% operate in other locations worldwide
The majority grant a master licence or licences to international franchisees, although a number also use alternative methods to allow operations abroad:
60% issue a master licence in one or more markets
23% direct operations from the UK in one or more markets
7%openanofficeabroadand8%havejointventuresin one or more markets
Of those who do not currently operate internationally, 4% have adefinitebusinessplantodoso,andafurther30%areconsidering it as an option.
For those looking to expand internationally, most have ambitions in Europe (including Republic of Ireland), or English-speaking countries (USA/Canada/Australia/New Zealand).
The international dimension of franchisingKeyfindings
The size and scale of franchising in the UK
Dynamics within the franchise industry
The economic contribution of franchising
Regional distribution of franchising in the UK
The international dimension of franchising
Franchisee recruitment
Costs, fees and ongoing charges
Franchisor/franchisee relationships
Background to the survey
Technical appendix: survey method
Introduction/ contents

181818
Country-specificlegislationisanincreasingbarrier to international franchising
Legislation has overtaken language differences as the primary barrier of international expansion, with a lack of suitable franchisees also emerging as a more prominent barrier to growth outside of the UK. Otherbarrierstointernationalfranchisingincludealackoffinanceand management resource, as well as broader concerns about economic conditions (Figure 23).
Figure 23: Primary barriers to growth in international franchised units
Figure24:Profilecharacteristicsoffranchisees(%)
Legislation in some countries
Language barrier
Lack of suitable franchisees
Lackoffinance
Lack of management resource in own company
Poor economic conditions generally
Wish to expand steadily/slowly
Lack of suitable sites for franchisees
33
17
16
15
14
11
11
11
22
29
8
20
9
10
10
7
Source: Q15c, Base: All franchisors with/planning international operations
2018 (%)
2015 (%)
The proportion of female franchisees in 2018 is the highest since the survey stats began, with 30% of all franchisees being female.
This looks likely to rise even further in the future, with 37% of franchiseerecruitsinthepasttwoyearsbeingfemale,asignificantrise of 20% since 2015 (Figure 24). Although there has been an increase in the proportion of under-30s becoming franchisees, the average age for newer franchisees remains consistent over time at around 40 years old. The typical franchisee is in their mid-40s.
Franchisee recruitment
Profilecharacteristics of franchisees
New recruits – all held franchise 2yrs or less
2005 2011 2015 2018 2005 2011 2015 2018
Age % % % % % % % %
Up to 30 10 5 3 18 17 14 19 27
31 – 40 20 15 18 24 27 31 22 30
41 – 50 32 31 35 27 35 39 49 24
Over 50 37 49 43 35 20 19 14 19
Typical (mean) age
46 49 49 44 41 41 41 40
Male 80 72 77 70 84 62 83 63
Female 20 28 23 30 16 38 17 37
Source: Q32, Base: All franchisees
Keyfindings
The size and scale of franchising in the UK
Dynamics within the franchise industry
The economic contribution of franchising
Regional distribution of franchising in the UK
The international dimension of franchising
Franchisee recruitment
Costs, fees and ongoing charges
Franchisor/franchisee relationships
Background to the survey
Technical appendix: survey method
Introduction/ contents

19
Franchisors experience a wide range of challenges when looking to recruit new franchisees
The main reasons for not granting a franchise include the candidate nothavingsufficientcapital,havingalackofbusinessacumen or performing badly at the interview stage. Somewhat alarmingly, over one in three mentioned candidates failing to attend scheduled appointments (Figure 25).
Insufficientcapital
Performance at interview
Lack of business acumen
Seemed to be just buying a job
Failure to turn up for appointments
Poor credit history
Inability to complete application forms
Lack of sales/marketing experience
Lack of experience in our sector
Not suitable
61
57
52
38
35
33
28
21
17
7Source: Q8, Base: All franchisors
Figure 25: Main reasons for not granting a franchise
A broad range of recruitment channels are used by franchisors
The method of recruiting new franchisees is changing. Over the past 10 years, the two most consistent methods of recruiting new franchisees have been the franchisor’s website and word of mouth/networking (Figure 26).
Aside from these two key methods, the importance of other recruitment channels has notably changed over the past few years. For example, 10 years ago, magazine advertising was stillsignificant,withoneinthreefranchisorsmentioningthisas useful. However, in the most recent survey, only 16% mentioned this. In contrast, social media, which wasn’t even measured 10 years ago, was mentioned by 40% of franchisors as particularly useful in 2018.
There was a period when third-party brokers, intermediaries andmatchmakingservicesweresignificanttorecruitment, but this seemed to peak around 5 years ago, when 4 in 10 franchisors found this useful. In 2018, only 1 in 10 said this was a useful method.
The survey also asked franchisors which websites they have used to recruit new franchisees in the past 12 months. The bfa website, whichfranchise.com and franchisedirect.co.uk, have been relatively consistent performers at the top of the list during the past 10 years. However, in a sector where there are now at least 15 websites dedicated to the sector, there are bound to be some winners and losers. As witnessed in other sectors, it seems to be the case that greater competition favours the market leader.
The median amount spent by franchisors externally on recruiting franchisees (advertising vacancies) is just over £9,500.
Keyfindings
The size and scale of franchising in the UK
Dynamics within the franchise industry
The economic contribution of franchising
Regional distribution of franchising in the UK
The international dimension of franchising
Franchisee recruitment
Costs, fees and ongoing charges
Franchisor/franchisee relationships
Background to the survey
Technical appendix: survey method
Introduction/ contents

20
Figure 26: Franchisors’ most useful recruitment channels
Figure 27: Working status prior to taking on a franchise (those not previously employed by a franchise)
Own system’s website
Word of mouth
Social networking sites, e.g. Facebook, LinkedIn, Twitter
Other franchise website
Exhibitions
bfa website
Mail shots
Franchising seminars/open days
Magazine advertising
48
48
41
37
30
27
22
20
16Source: Q9, Base: All franchisors
The path towards becoming a franchiseeUp until 2015, the proportion of new franchisees coming from inside the industry had steadily risen. However, 2018 sees this trend reverse, as more franchisees enter from previous unemployment/having been made redundant (Figure 27).
Source: Q20b, Base: All new to franchising
2000
2001
2002
2003
2004
2005
2006
2007
2008
2009
2010
2011
2013
2015
2018
80
70
60
%
50
40
30
20
10
0
Employed full-time
Self-employed (not a franchise)
Self-employed (a franchise)
Unemployed/redundant
Other
Keyfindings
The size and scale of franchising in the UK
Dynamics within the franchise industry
The economic contribution of franchising
Regional distribution of franchising in the UK
The international dimension of franchising
Franchisee recruitment
Costs, fees and ongoing charges
Franchisor/franchisee relationships
Background to the survey
Technical appendix: survey method
Introduction/ contents

21
In 2018, amongst those new to franchising in the last four years:
28% had worked within the industry, 10% had worked for a franchisor and 19% had worked for a franchisee.
Of those new to franchising, 64% had been employed and 13% had been self-employed. 9% had been unemployed/made redundant.
Awareness of franchising was most likely to have come from a friend or relative (21%), with 15% hearing about it from a colleague and8%atanexhibition.Specificfranchisebrand awareness tends to come from similar sources.
Just over half (56%) only looked at one franchisebeforemakingtheirfinaldecision,although 2.6 brands are considered on average. The majority look at franchises within the same sector (60%), although 40% considered brands from more than one industry.
Beforeacquiringtheirfranchise,mostdidawiderangeofresearch, with 69% assessing whether the franchise fees were fair and value for money, 62% seeking advice from existing franchisees about their businessprofitabilityand58%askingforopinionsofthefranchisor. Over half (57%) also considered the impact of running the business on their family.
Havingapersonalinterestinthebusinessfieldiskeywhenchoosingbetween franchise brands, with growth potential also important
Figure 28: Reasons for selecting franchise brand
Interestinfieldofbusiness
Growth potential
Liked the people
Available territory
Well-known brand
Existing franchises successful
Location of the business
More affordable
Low risk
Specialist business knowledge of franchise
Recommendation from friend/family
27
20
16
16
14
13
11
10
8
7
7
Source: Q24c, Base: All franchisees who considered more than one franchise
Keyfindings
The size and scale of franchising in the UK
Dynamics within the franchise industry
The economic contribution of franchising
Regional distribution of franchising in the UK
The international dimension of franchising
Franchisee recruitment
Costs, fees and ongoing charges
Franchisor/franchisee relationships
Background to the survey
Technical appendix: survey method
Introduction/ contents
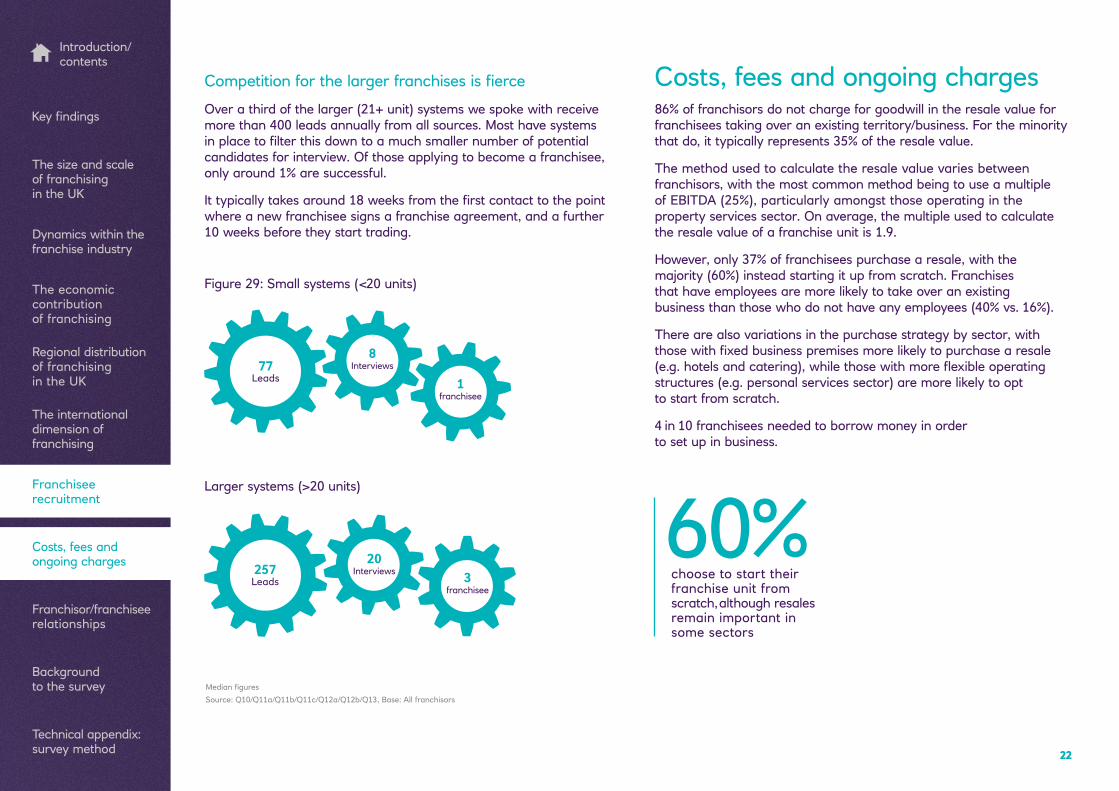
choose to start their franchise unit from scratch, although resales remain important in some sectors
60%
2222
Competitionforthelargerfranchisesisfierce
Over a third of the larger (21+ unit) systems we spoke with receive more than 400 leads annually from all sources. Most have systems inplacetofilterthisdowntoamuchsmallernumberofpotentialcandidates for interview. Of those applying to become a franchisee, only around 1% are successful.
Ittypicallytakesaround18weeksfromthefirstcontacttothepointwhere a new franchisee signs a franchise agreement, and a further 10 weeks before they start trading.
86% of franchisors do not charge for goodwill in the resale value for franchisees taking over an existing territory/business. For the minority that do, it typically represents 35% of the resale value.
The method used to calculate the resale value varies between franchisors, with the most common method being to use a multiple of EBITDA (25%), particularly amongst those operating in the property services sector. On average, the multiple used to calculate the resale value of a franchise unit is 1.9.
However, only 37% of franchisees purchase a resale, with the majority (60%) instead starting it up from scratch. Franchises that have employees are more likely to take over an existing business than those who do not have any employees (40% vs. 16%).
There are also variations in the purchase strategy by sector, with thosewithfixedbusinesspremisesmorelikelytopurchasearesale(e.g.hotelsandcatering),whilethosewithmoreflexibleoperatingstructures (e.g. personal services sector) are more likely to opt to start from scratch.
4 in 10 franchisees needed to borrow money in order to set up in business.
1 franchisee
3 franchisee
77 Leads
8 Interviews
Figure 29: Small systems (<20 units)
Larger systems (>20 units)
Medianfigures
Source: Q10/Q11a/Q11b/Q11c/Q12a/Q12b/Q13, Base: All franchisors
Costs, fees and ongoing charges
20 Interviews257
Leads
Keyfindings
The size and scale of franchising in the UK
Dynamics within the franchise industry
The economic contribution of franchising
Regional distribution of franchising in the UK
The international dimension of franchising
Franchisee recruitment
Costs, fees and ongoing charges
Franchisor/franchisee relationships
Background to the survey
Technical appendix: survey method
Introduction/ contents

23
The franchise licence fee is the most common cost encountered by new franchisees
Figure 30: Financial consideration when starting a franchise (%)
Franchise fee
Training
Stock
Equipment
Working capital
Mean total start up cost (new unit)
% of resale fee to account for goodwill
*Mean total sum invested on start-up
85
20
16
16
14
£56,500
12%
£100,000
Source: Q20a/Q20b/Q21a Base: Franchisors (excludes ‘don’t knows’) / All making each charge
*Q27 Base: Franchisees (excludes ‘don’t knows’ and ‘refused’)
Mean scores only provide a very rough illustration of set-up costs; it’s better to consider some examples
Whilethemeanfigureforstart-upcostsforfranchiseesisabout £100k, this conceals wide variation. Logically, the most expensive franchisestosetup(ortakeover)arethosewhichrequireconsiderableexpense,suchasrefittingabuildingasabranded coffee shop or taking over a hotel.
To provide some examples from the franchisee survey:
Thecostofsettingupafranchisedgymbusinesswasquoted at £450,000 and the cost of setting up a care home business was given as £200,000.
Whereas, the cost of setting up a business which offers dancing for toddlers was given as about £5,000 in total.
From the franchisors we spoke to, more than half told us that the initial costs to a franchisee wanting to set up a franchised business with them was less than £40,000, so there are plenty of opportunities out there for franchisees to start a business with a relatively modest outlay.
Again,whilethehigherfiguresareskewedtowardslocation-basedbusinessesandthoserequiringalotofcollateral(signs,machineryetc.) or stock, there are lower-cost options available within every sector, including hotel & catering and store retail.
Keyfindings
The size and scale of franchising in the UK
Dynamics within the franchise industry
The economic contribution of franchising
Regional distribution of franchising in the UK
The international dimension of franchising
Franchisee recruitment
Costs, fees and ongoing charges
Franchisor/franchisee relationships
Background to the survey
Technical appendix: survey method
Introduction/ contents

242424
The relationship between franchisor and franchiseesisoftenmutuallybeneficialThe franchise structure allows access to a business model that has proven successful, as well as the tools needed to achieve this, such as training, marketing materials and ancillary services.
Toprovidethese,however,manyfranchisorsrequiretheir franchisees to contribute towards the costs incurred, totalling to an average of 12% of their sales. The most common fees charged by franchisors to franchisees include:
Management service fee
Contribution to advertising
IT support fee
In addition, just over half of franchisors (56%) supply their franchiseeswiththestockorsuppliesrequiredtocarryout their business, with 4 in 10 applying a mark-up for these (on average 9%).
In most cases, however, the franchisor does not own the premises from which their franchisees operate, with only 11% having some or all of their franchisees as tenants.
There is generally a strong and ongoing relationship between the franchisee and franchisor
The vast majority of franchisees have contact with their franchisor’s support staff at least monthly (90%), with a third having contact most days. Franchisees are largely happy with the support provided, with 48% rating it as excellent, and a further 31% rating it as good. Just 5% rate the support received from the franchisor as poor.
In addition to ongoing contact, 91% of franchisors report that at least some of their franchisees discuss their long-term business plans with them, most commonly around:
Local marketing/advertising
Expansion plans
Retirement/exit strategy
The individual franchisees are less likely to report discussing long-term plans with their franchisor (58%), although the topics of discussion are largely similar to those highlighted by franchisors.
Theminoritywhoarenotsatisfiedwiththerelationshipthey have with the franchisors cite a lack of direct support and original promises not being met.
Franchisor/franchisee relationshipsKeyfindings
The size and scale of franchising in the UK
Dynamics within the franchise industry
The economic contribution of franchising
Regional distribution of franchising in the UK
The international dimension of franchising
Franchisee recruitment
Costs, fees and ongoing charges
Franchisor/franchisee relationships
Background to the survey
Technical appendix: survey method
Introduction/ contents

252525
The franchisee/franchisor relationship tends to be good,particularlyforfranchiseesmakingaprofit
Figure 31: Net satisfaction with franchisor relationships ('Definitely/MainlySatisfied'minus'Definitely/MainlyDissatisfied)
Figure32:Perceivedbenefitsofbeingafranchisee(2018)
Source: Q13a, Base: All Franchisees
Pleasenotethebasefor'Negativeprofitably'isasmallsamplesizeof15
All franchisees
Highprofitability
Marginalprofitability
Negativeprofitability
2000
2001
2002
2003
2004
2005
2006
2007
2008
2009
2010
2011
2013
2015
2018
100
90
80
70
60
50
40
30
20
10
0
%
Anumberofbenefitsareidentifiedforbeingpartof a franchise system rather than being a non-franchised small-medium enterprise
Thetopthreebenefitsidentifiedarethesupportprovided, apre-existingperceptionofqualityandbeingabletoadopt apredefined,standardisedproduct/service(Figure32). Despite this, not all franchisees choose to promote themselves as a franchise, with 39% deciding not to emphasise this to either suppliers or customers.
The support provided
Quality expectation
Having a standardised product/service
Appearing to be a larger business
Having a sustainable business
Competitive advantage
The reduced risk from not doing it alone
Limitedfinancialliabilities
78
76
75
66
59
56
55
31
Source: Q11, Q12, Base: All Franchisees
Keyfindings
The size and scale of franchising in the UK
Dynamics within the franchise industry
The economic contribution of franchising
Regional distribution of franchising in the UK
The international dimension of franchising
Franchisee recruitment
Costs, fees and ongoing charges
Franchisor/franchisee relationships
Background to the survey
Technical appendix: survey method
Introduction/ contents

Primary research was conducted using computer-aided telephone interviewing (CATI) between the end of 2018 and the beginning of 2017. Interviews were completed with both franchisees and franchisors, speaking to directors and managers of franchise systems in addition to owners/partners of franchise units. This report combines these primary survey results with external industry experts and statistical sources.
The authors, the bfa and NatWest, would like to thank all those franchisors and franchisees for their time in completing the survey with our interviewers. Without the continued engagement of these audiences, the survey would not be possible.
Within the research agency BVA BDRC Continental, the principal authors of this report are Richard Smith, Director of BVA BDRC and Bethan Cooke, Associate Director.
The publishers have tried their best to ensure the accuracy of the report, but do not guarantee the accuracy of the data provided, nor do they accept liability for any error contained in or omission from the report, or any loss directly or indirectly arising from it.
Background to the survey
26
Keyfindings
The size and scale of franchising in the UK
Dynamics within the franchise industry
The economic contribution of franchising
Regional distribution of franchising in the UK
The international dimension of franchising
Franchisee recruitment
Costs, fees and ongoing charges
Franchisor/franchisee relationships
Background to the survey
Technical appendix: survey method
Introduction/ contents

27
What constitutes a franchise system?
Businesses included in the bfa NatWest Franchise Survey are based on the following criteria:
1. Businesses that involve a trademark, a method of trading and a licence to use the trademark, which all franchisees must adopt and pay for.
2. The franchisee is able to sell the business on to a third party withthebenefitofthegoodwillderivedfromdevelopingthebusiness over time.
3. The system is actively franchising – we exclude those who have announced plans to franchise, but do not currently operate any functioning (franchised) units, as well as those that have withdrawn from the franchising format, but continue to trade exclusively via company-owned outlets.
Within unit numbers we exclude the estimated 14,000 units that are owned and run directly by the franchisor (and therefore are not franchised).
Calculating the size and scale of the franchising industry
In order to understand the health of the industry, it’s important to have an accurate measure of the ‘total number of franchised units’. Identifying this number is not straightforward due to varyingavailabilityandunitfigurespublishedonlineorin franchise directories.
Inordertobridgethisgapininformation,thefiguresdetailedin this document are produced by combining our own sample database with database sources that are available for the largest franchises. Sources used to compile our database are diverse and include www.franchiseinfo.co.uk and other online lists of systems known to be operating in the UK and the proprietary databases of the bfa and NatWest.
From these sources and from information built up over previous years, a ‘long list’ is compiled. This list is then subject to intensive review by industry experts at the British Franchise Association andNatWest’sFranchiseSection,untilallpartiesaresatisfiedthat only active systems are included. The authors of this report would like to thank these sources for their assistance.
In addition to this, over recent years, we have been able to populate our own sample database with reported unit numbers from the survey, making it the most accurate and reliable measure available of the actual number of franchised units in the UK.
Statisticalconfidence
Noteonstatisticalconfidence
Muchofthisreportisbaseduponthefindingsofsurveyresearchstudies,towhichstatisticalconfidencelimitsapply.
Takingthe95%confidenceinterval,thefollowingindicative rangesapplytothesurveyfindings:
5%/95% 20%/80% 50%
Franchisor survey (n=133) +/-3% +/-5% +/-7%
Franchisor survey (n=198) +/-3% +/-6% +/-7%
Notethatthefinitepopulationcorrectionappliestothefranchisorsample. Since the sample is a substantial proportion (16%) of the population,thisenhancesourstatisticalconfidenceinthe surveyfindings.
Surveyfindingsatorabout
Technical appendix: survey methodKeyfindings
The size and scale of franchising in the UK
Dynamics within the franchise industry
The economic contribution of franchising
Regional distribution of franchising in the UK
The international dimension of franchising
Franchisee recruitment
Costs, fees and ongoing charges
Franchisor/franchisee relationships
Background to the survey
Technical appendix: survey method
Introduction/ contents

28
This report was commissioned by the British Franchise Association in partnership with NatWest.
About the British Franchise Association (bfa)
The bfa is the voice of ethical franchising in the UK. As well as providing information and advice to businesses planning a franchise, the bfa work closely with their members to help develop expertise in the industry.
The bfa was formed to act in the interests of the industry and to assess and accredit franchising companies against strict criteria. They look at the structure of the franchise business, terms of contracts between franchisor and franchisee, and test business systems to encourage future success as a franchise.
The bfa engage with franchisees by:
Developing awareness campaigns to consumers
Launchingindustryrecognisedqualifications–i.e.theQualifiedFranchise Professional (QFP)
Developing nationally recognised educational franchise seminars
LaunchingthefirstUKFranchiseTrustwhosetrusteeshelptoeducate individuals and develop the necessary skills and capabilities
For more information, just visit www.thebfa.org
Commissioned by: In partnership with: Conducted by:
Keyfindings
The size and scale of franchising in the UK
Dynamics within the franchise industry
The economic contribution of franchising
Regional distribution of franchising in the UK
The international dimension of franchising
Franchisee recruitment
Costs, fees and ongoing charges
Franchisor/franchisee relationships
Background to the survey
Technical appendix: survey method
Introduction/ contents