2018 full year results - capgemini
TRANSCRIPT

February 14th, 2019
2018 Full Year Results
2© Capgemini 2019. All rights reserved |2018 Full Year Results | February 14th, 2019
Disclaimer
This presentation may contain forward-looking statements. Such statements may include projections, estimates, assumptions,statements regarding plans, objectives, intentions and/or expectations with respect to future financial results, events, operationsand services and product development, as well as statements, regarding future performance or events. Forward-lookingstatements are generally identified by the words “expects”, “anticipates”, “believes”, “intends”, “estimates”, “plans”, “projects”,“may”, “would” “should” or the negatives of these terms and similar expressions. Although Capgemini’s management currentlybelieves that the expectations reflected in such forward-looking statements are reasonable, investors are cautioned that forward-looking statements are subject to various risks and uncertainties (including without limitation risks identified in Capgemini’sRegistration Document available on Capgemini’s website), because they relate to future events and depend on futurecircumstances that may or may not occur and may be different from those anticipated, many of which are difficult to predict andgenerally beyond the control of Capgemini. Actual results and developments may differ materially from those expressed in,implied by or projected by forward-looking statements. Forward-looking statements are not intended to and do not give anyassurances or comfort as to future events or results. Other than as required by applicable law, Capgemini does not undertake anyobligation to update or revise any forward-looking statement.
This presentation does not contain or constitute an offer of securities for sale or an invitation or inducement to invest in securitiesin France, the United States or any other jurisdiction.
3© Capgemini 2019. All rights reserved |2018 Full Year Results | February 14th, 20192018 Full Year Results | February 14th, 2019 | © Capgemini 2019. All rights reserved
PaulHERMELINChairman and CEO
4© Capgemini 2019. All rights reserved |2018 Full Year Results | February 14th, 2019
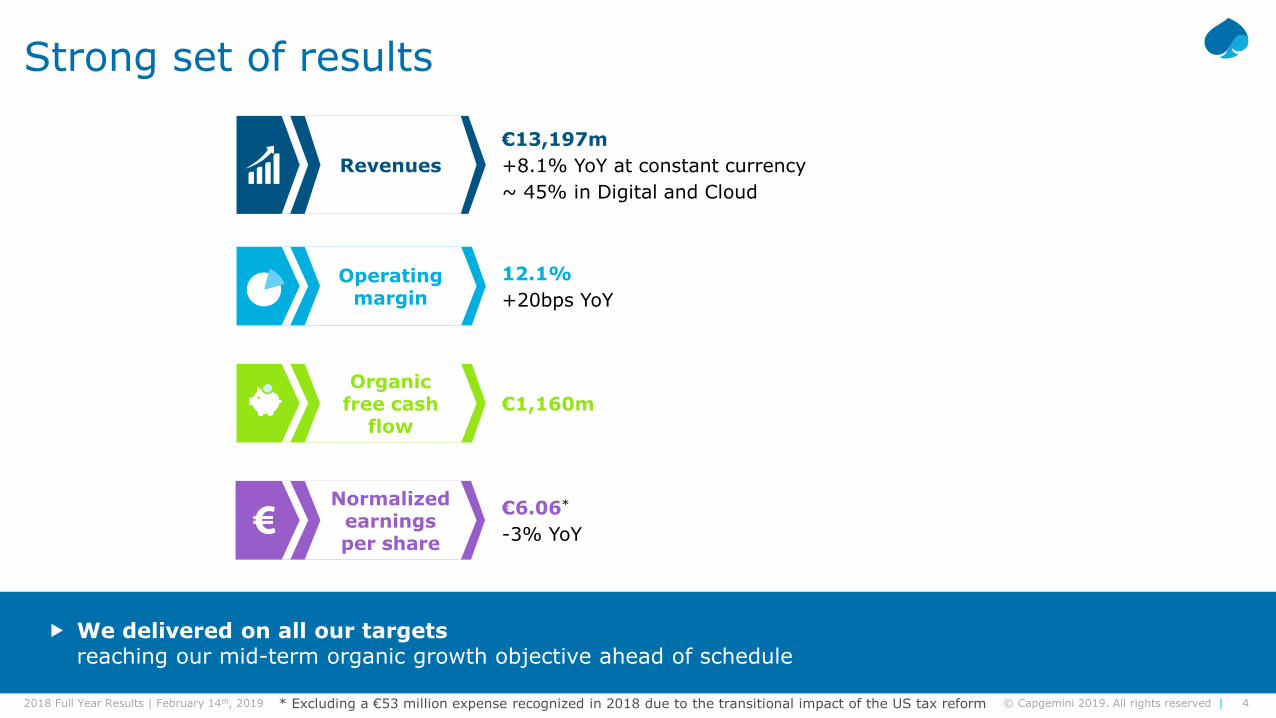
Strong set of results
€13,197m +8.1% YoY at constant currency~ 45% in Digital and Cloud
Revenues
12.1%+20bps YoY
Operating margin
€6.06*
-3% YoY
€1,160mOrganic
free cash flow
Normalized earnings per share
We delivered on all our targetsreaching our mid-term organic growth objective ahead of schedule
* Excluding a €53 million expense recognized in 2018 due to the transitional impact of the US tax reform
5© Capgemini 2019. All rights reserved |2018 Full Year Results | February 14th, 2019
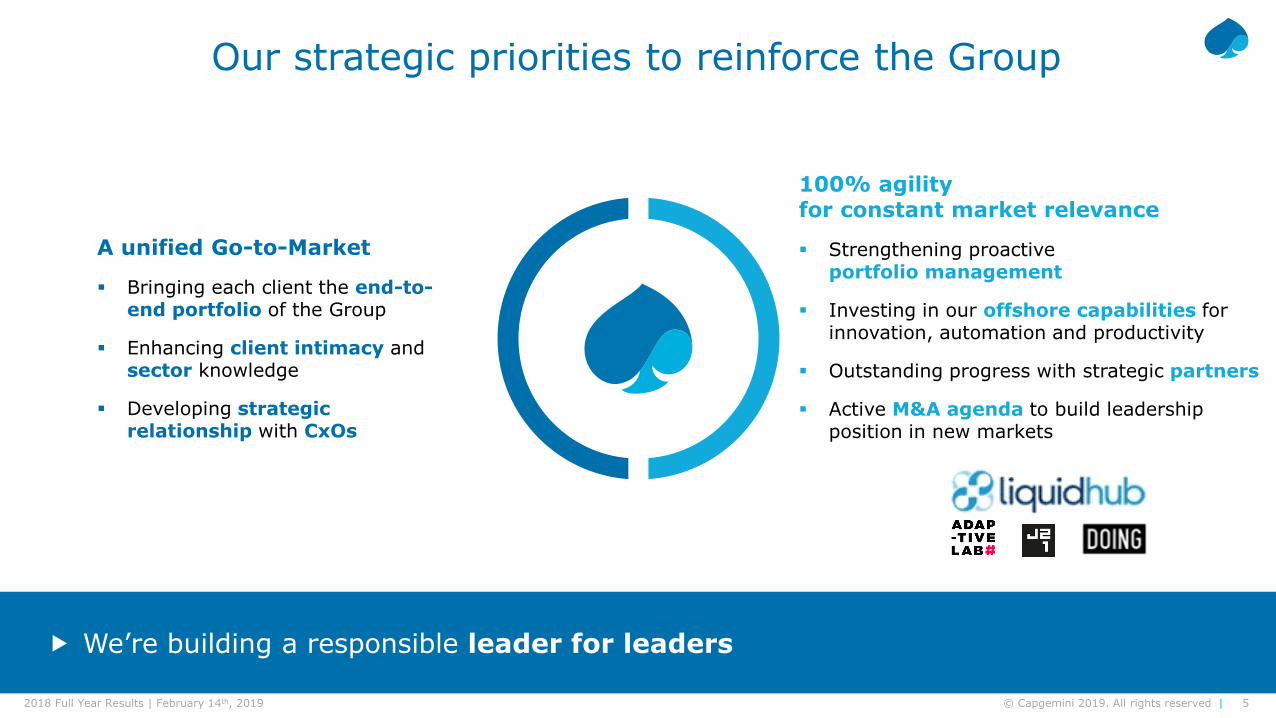
A unified Go-to-Market
Bringing each client the end-to-end portfolio of the Group
Enhancing client intimacy and sector knowledge
Developing strategic relationship with CxOs
We’re building a responsible leader for leaders
100% agility for constant market relevance
Strengthening proactiveportfolio management
Investing in our offshore capabilities for innovation, automation and productivity
Outstanding progress with strategic partners
Active M&A agenda to build leadership position in new markets
Our strategic priorities to reinforce the Group
6© Capgemini 2019. All rights reserved |2018 Full Year Results | February 14th, 2019
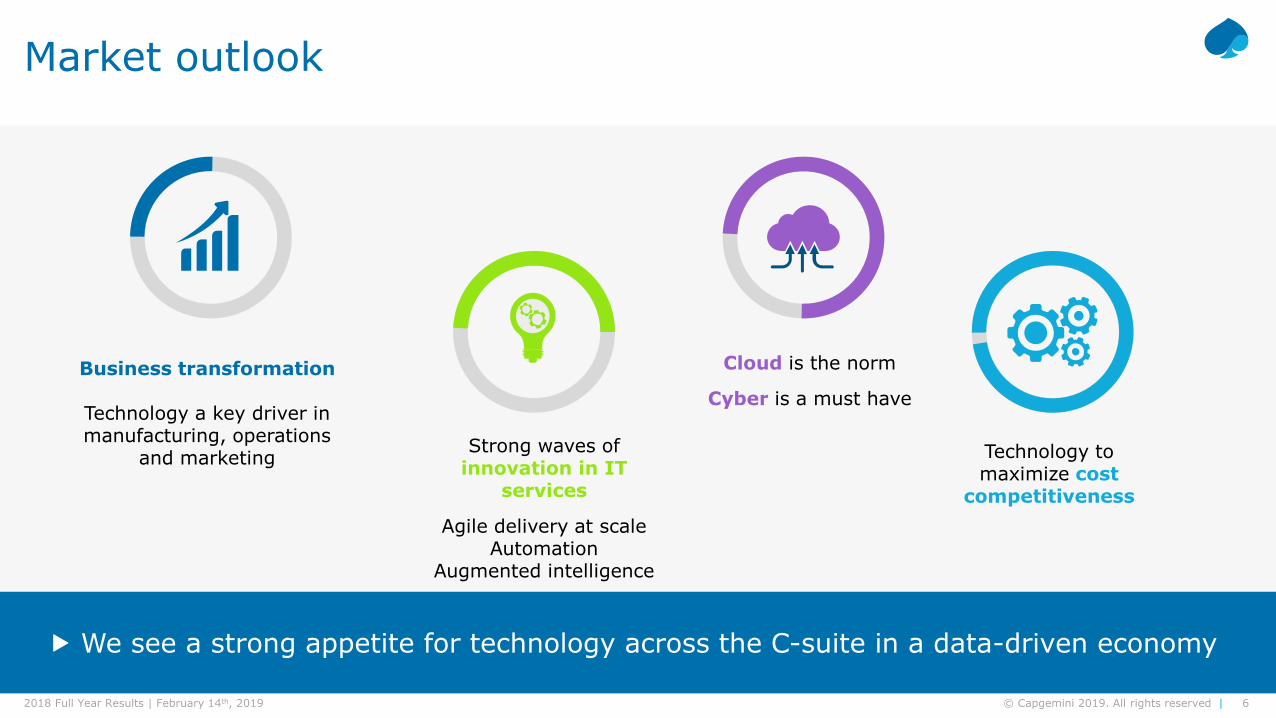
Cloud is the norm
Cyber is a must have
Technology to maximize cost
competitiveness
Business transformation
Technology a key driver in manufacturing, operations
and marketing Strong waves of innovation in IT
services
Agile delivery at scaleAutomation
Augmented intelligence
We see a strong appetite for technology across the C-suite in a data-driven economy
Market outlook
7© Capgemini 2019. All rights reserved |2018 Full Year Results | February 14th, 2019
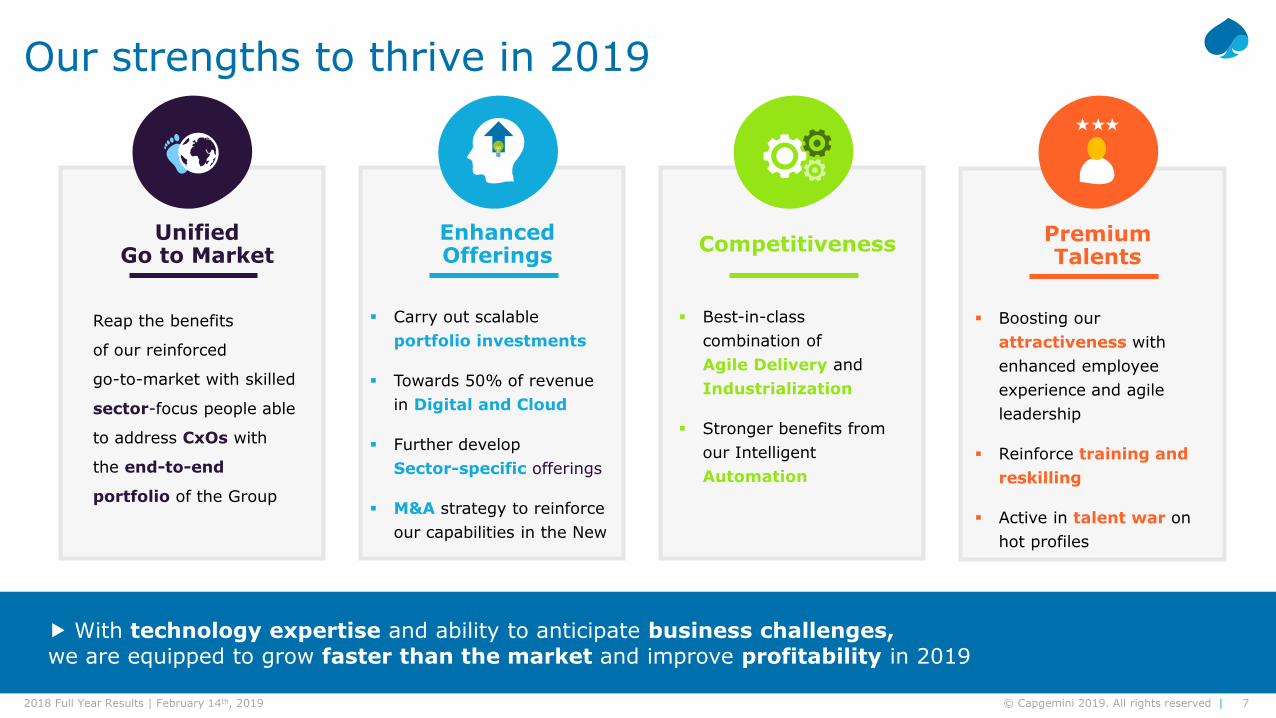
With technology expertise and ability to anticipate business challenges,we are equipped to grow faster than the market and improve profitability in 2019
Unified Go to Market
Reap the benefits
of our reinforced
go-to-market with skilled
sector-focus people able
to address CxOs with
the end-to-end
portfolio of the Group
EnhancedOfferings
Carry out scalable portfolio investments
Towards 50% of revenue in Digital and Cloud
Further develop Sector-specific offerings
M&A strategy to reinforce our capabilities in the New
Competitiveness
Best-in-class combination of Agile Delivery and Industrialization
Stronger benefits from our IntelligentAutomation
PremiumTalents
Boosting our attractiveness with enhanced employee experience and agile leadership
Reinforce training and reskilling
Active in talent war on hot profiles
Our strengths to thrive in 2019
8© Capgemini 2019. All rights reserved |2018 Full Year Results | February 14th, 2019
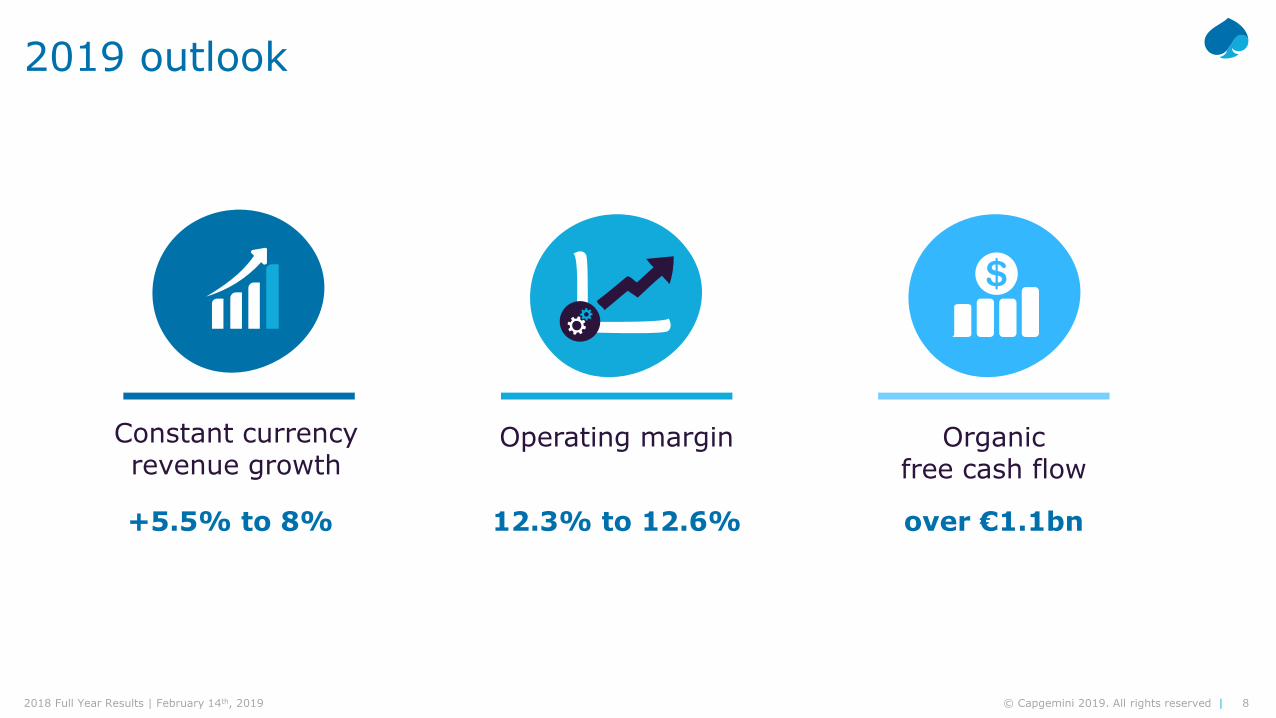
2019 outlook
Constant currency revenue growth
Operating margin Organic free cash flow
+5.5% to 8% 12.3% to 12.6% over €1.1bn
9© Capgemini 2019. All rights reserved |2018 Full Year Results | February 14th, 20192018 Full Year Results | February 14th, 2019 | © Capgemini 2019. All rights reserved
RosemarySTARKChief Sales Officer
10© Capgemini 2019. All rights reserved |2018 Full Year Results | February 14th, 2019
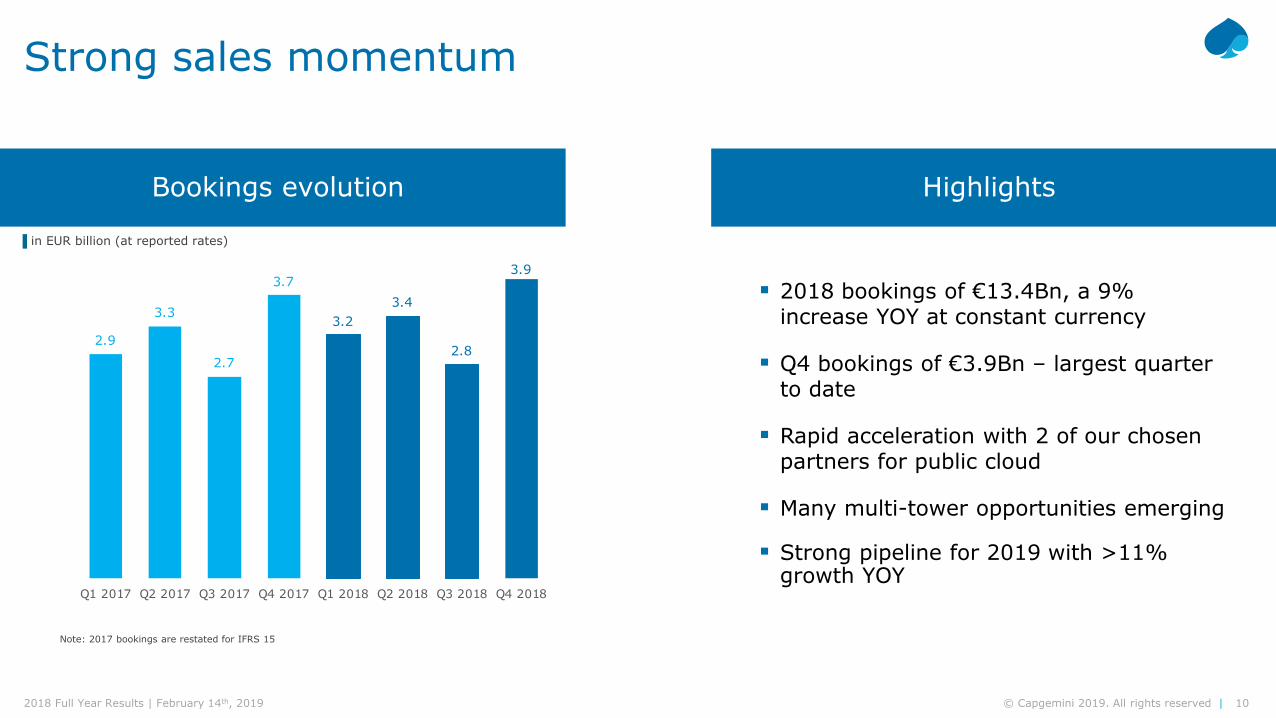
Strong sales momentum
Highlights
2018 bookings of €13.4Bn, a 9% increase YOY at constant currency
Q4 bookings of €3.9Bn – largest quarter to date
Rapid acceleration with 2 of our chosen partners for public cloud
Many multi-tower opportunities emerging
Strong pipeline for 2019 with >11% growth YOY
Bookings evolution
▐ in EUR billion (at reported rates)
Note: 2017 bookings are restated for IFRS 15
2.9
3.3
2.7
3.7
3.23.4
2.8
3.9
Q1 2017 Q2 2017 Q3 2017 Q4 2017 Q1 2018 Q2 2018 Q3 2018 Q4 2018
11© Capgemini 2019. All rights reserved |2018 Full Year Results | February 14th, 2019
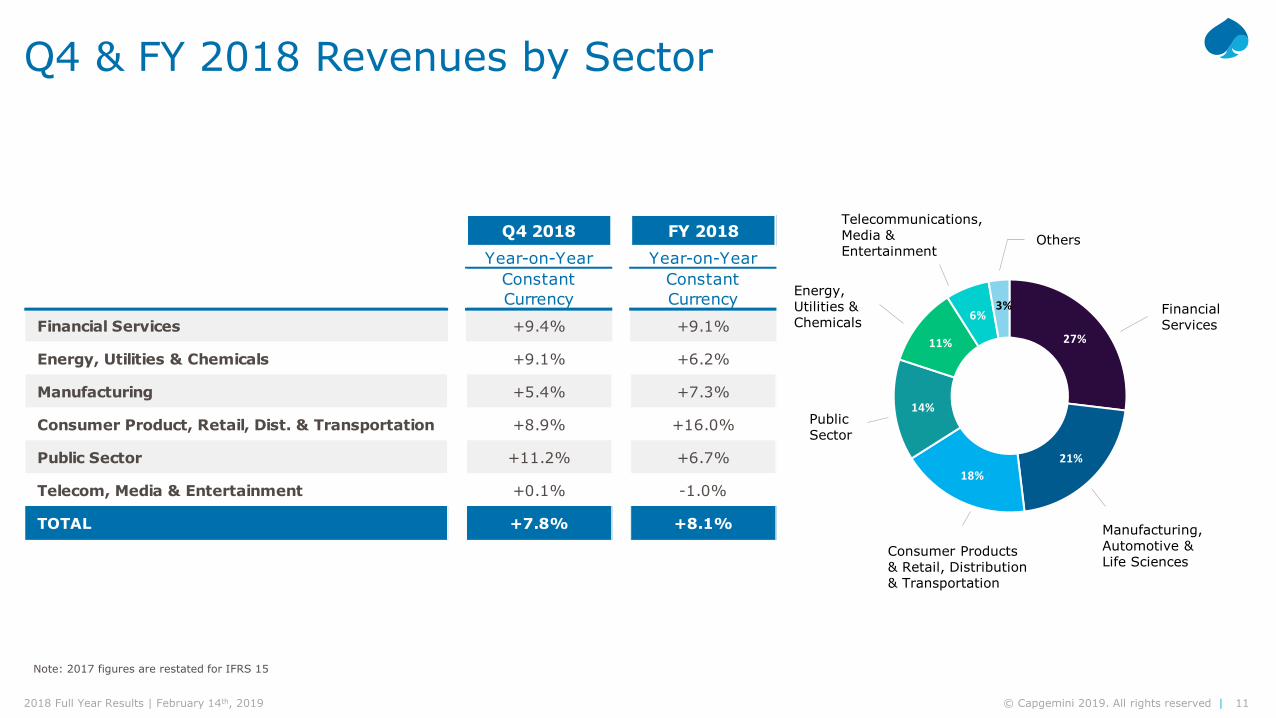
Q4 & FY 2018 Revenues by Sector
Financial Services
Manufacturing, Automotive & Life Sciences
Consumer Products & Retail, Distribution & Transportation
Public Sector
Energy, Utilities & Chemicals
Telecommunications, Media & Entertainment
Others
Note: 2017 figures are restated for IFRS 15
Q4 2018 FY 2018Year-on-Year Year-on-Year
Constant Currency
Constant Currency
Financial Services +9.4% +9.1%
Energy, Utilities & Chemicals +9.1% +6.2%
Manufacturing +5.4% +7.3%
Consumer Product, Retail, Dist. & Transportation +8.9% +16.0%
Public Sector +11.2% +6.7%
Telecom, Media & Entertainment +0.1% -1.0%
TOTAL +7.8% +8.1%
27%
21%18%
14%
11%
6%3%
12© Capgemini 2019. All rights reserved |2018 Full Year Results | February 14th, 2019
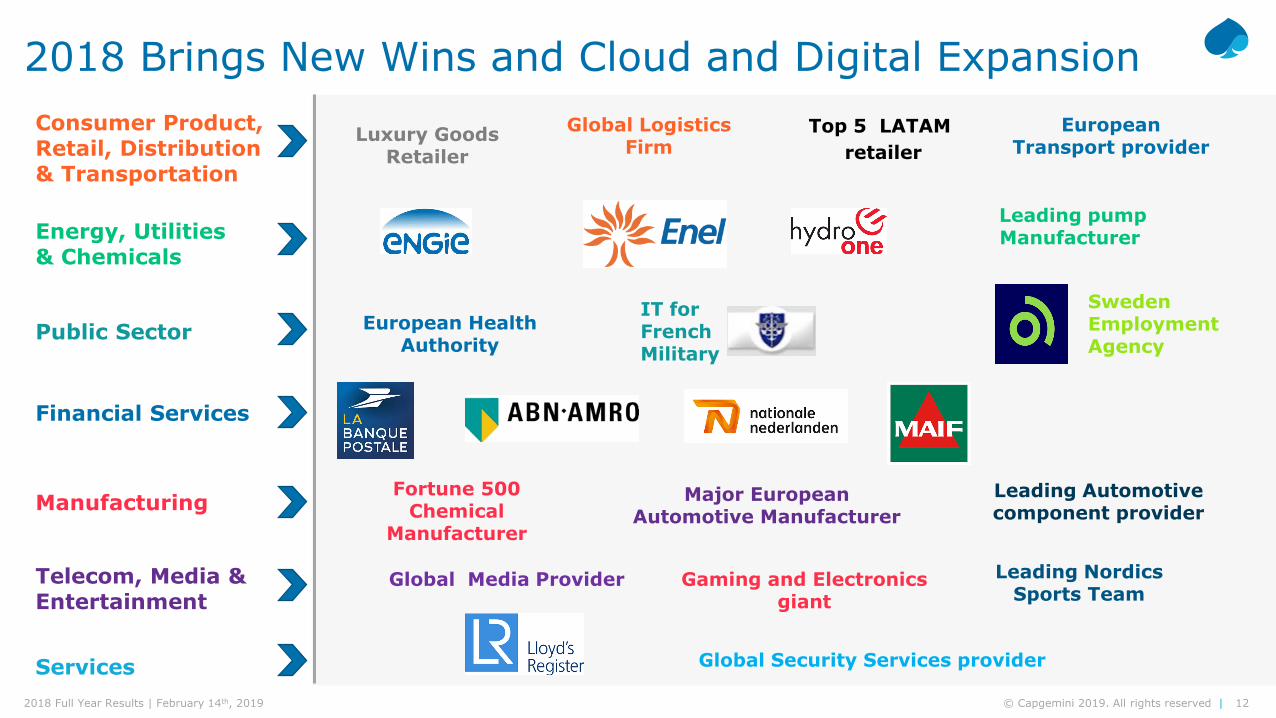
Consumer Product, Retail, Distribution & Transportation
Energy, Utilities& Chemicals
Public Sector
Financial Services
Manufacturing
Telecom, Media & Entertainment
Services
2018 Brings New Wins and Cloud and Digital Expansion
Luxury Goods Retailer
IT for French Military
Fortune 500 Chemical
Manufacturer
Major European Automotive Manufacturer
Global Security Services provider
Sweden EmploymentAgency
European Health Authority
Global Logistics Firm
European Transport provider
Leading Automotive component provider
Top 5 LATAMretailer
Leading pump Manufacturer
Global Media Provider Leading Nordics Sports Team
Gaming and Electronics giant

13© Capgemini 2019. All rights reserved |2018 Full Year Results | February 14th, 2019
Cloud migrationDelivering agility and speed to market
Facial recognition for seamless in-store and on-line insight
Customer LoyaltyRewards and gamification eCommerce
omni-channel transformation
Sales and serviceImpeccable customer experience
Global Rollout5 brands in 80 countries
Customer engagementPre and post sale
Brand analytics powered by AI
Capgemini works with 7 of the world’s top 10 Luxury Goods Brands
Our unified approach delivers benefits in the Luxury Goods Market
CHECKOUT
14© Capgemini 2019. All rights reserved |2018 Full Year Results | February 14th, 20192018 Full Year Results | February 14th, 2019 | © Capgemini 2019. All rights reserved
CaroleFERRANDChief Financial Officer
15© Capgemini 2019. All rights reserved |2018 Full Year Results | February 14th, 2019
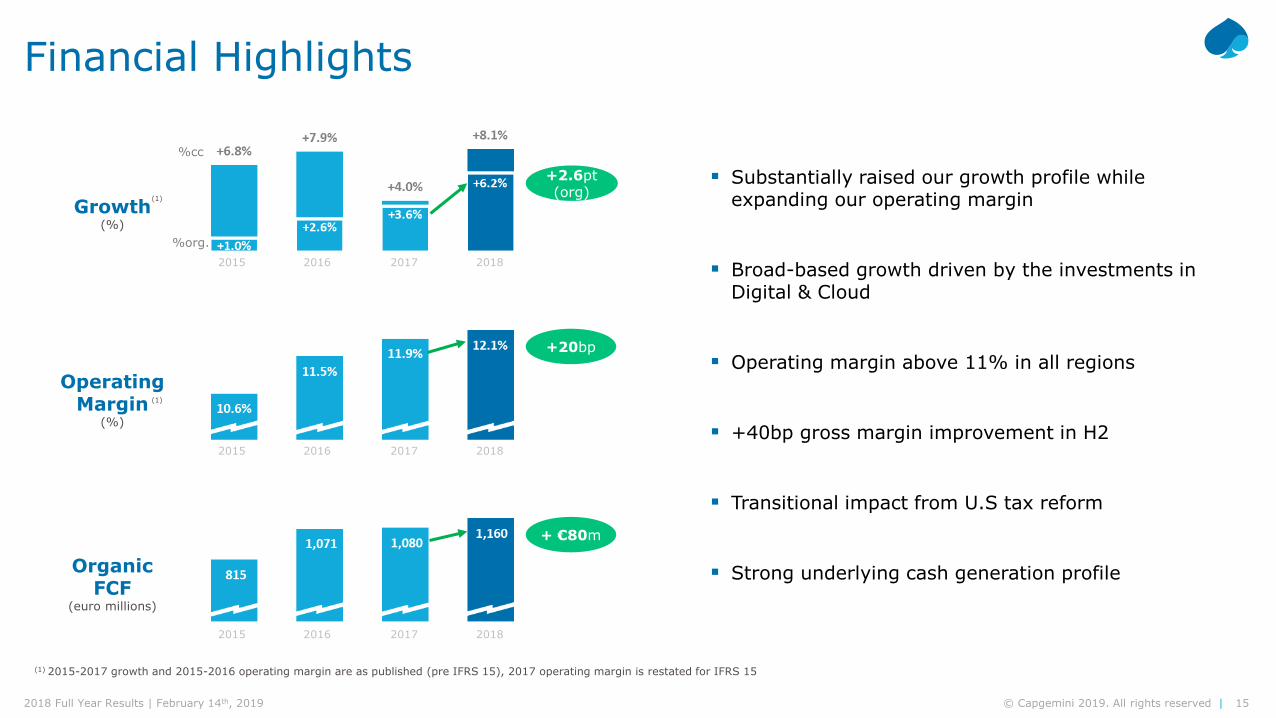
Growth(%)
2015 2016 2017 2018
+2.6pt(org)
OperatingMargin
(%)
2015 2016 2017 2018
+20bp
OrganicFCF
(euro millions)
2015 2016 2017 2018
+ €80m
Substantially raised our growth profile while expanding our operating margin
Broad-based growth driven by the investments in Digital & Cloud
Operating margin above 11% in all regions
+40bp gross margin improvement in H2
Transitional impact from U.S tax reform
Strong underlying cash generation profile
Financial Highlights
(1) 2015-2017 growth and 2015-2016 operating margin are as published (pre IFRS 15), 2017 operating margin is restated for IFRS 15
(1)
(1)
%cc
%org.

16© Capgemini 2019. All rights reserved |2018 Full Year Results | February 14th, 2019
FY 2017 FY 2018 VariationConstant CurrencyGrowth
Revenues 12,525 13,197 +5.4% +8.1%
Operating expenses -11,032 -11,600
Operating margin 1,493 1,597 +7%
(% Revenues) 11.9% 12.1% +0.2pt
Other operating income and expenses -310 -346
Operating profit 1,183 1,251 +6%
(% Revenues) 9.4% 9.5%
Net financial expense -72 -80
Income tax -303 -447
Non-controlling interests 12 6
Net Profit (Group Share) 820 730 -11%
(% Revenues) 6.6% 5.5% -1.1pt
Basic EPS in € 4.88 4.37 -10%
Normalized EPS in € 6.22 6.06 -3%
Organic Free cash flow 1,080 1,160 +80
Financial Overview
1) Normalized EPS is basic EPS using normalized net profit defined as net profit (Group share) corrected for theimpact of items recognized in 'other operating income and expense', net of tax.
2) Excluding a €53 million expense recognized in 2018 due to the transitional impact of the US tax reformNote: All alternate performance measures (organic growth, constant currency growth, operating margin, Free cashflow, normalized EPS and net debt) are defined in appendix
▐ in EUR millions In this presentation, unless otherwise stated,2017 is restated
for IFRS 15
(2)(1)
17© Capgemini 2019. All rights reserved |2018 Full Year Results | February 14th, 2019
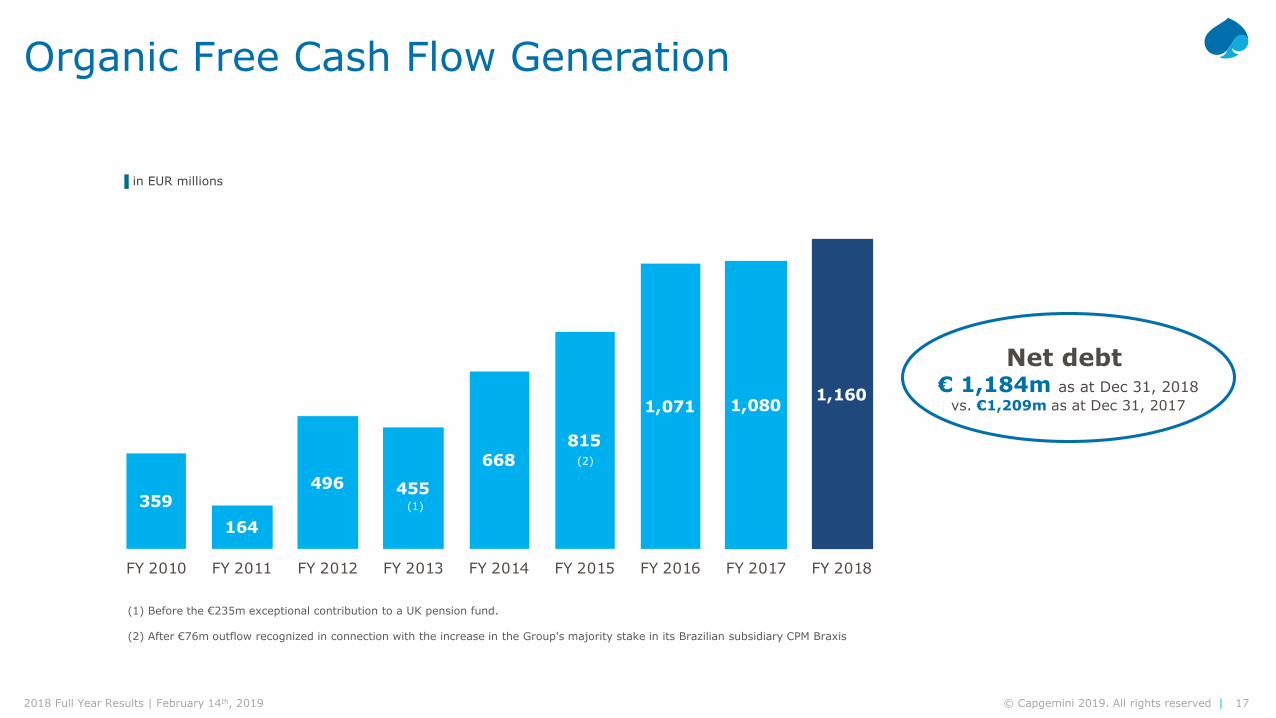
359164
496 455
668815
1,071 1,080 1,160
FY 2010 FY 2011 FY 2012 FY 2013 FY 2014 FY 2015 FY 2016 FY 2017 FY 2018
Organic Free Cash Flow Generation
Net debt € 1,184m as at Dec 31, 2018
vs. €1,209m as at Dec 31, 2017
▐ in EUR millions
(1) Before the €235m exceptional contribution to a UK pension fund.
(2) After €76m outflow recognized in connection with the increase in the Group's majority stake in its Brazilian subsidiary CPM Braxis
(1)
(1)
(2)
18© Capgemini 2019. All rights reserved |2018 Full Year Results | February 14th, 2019
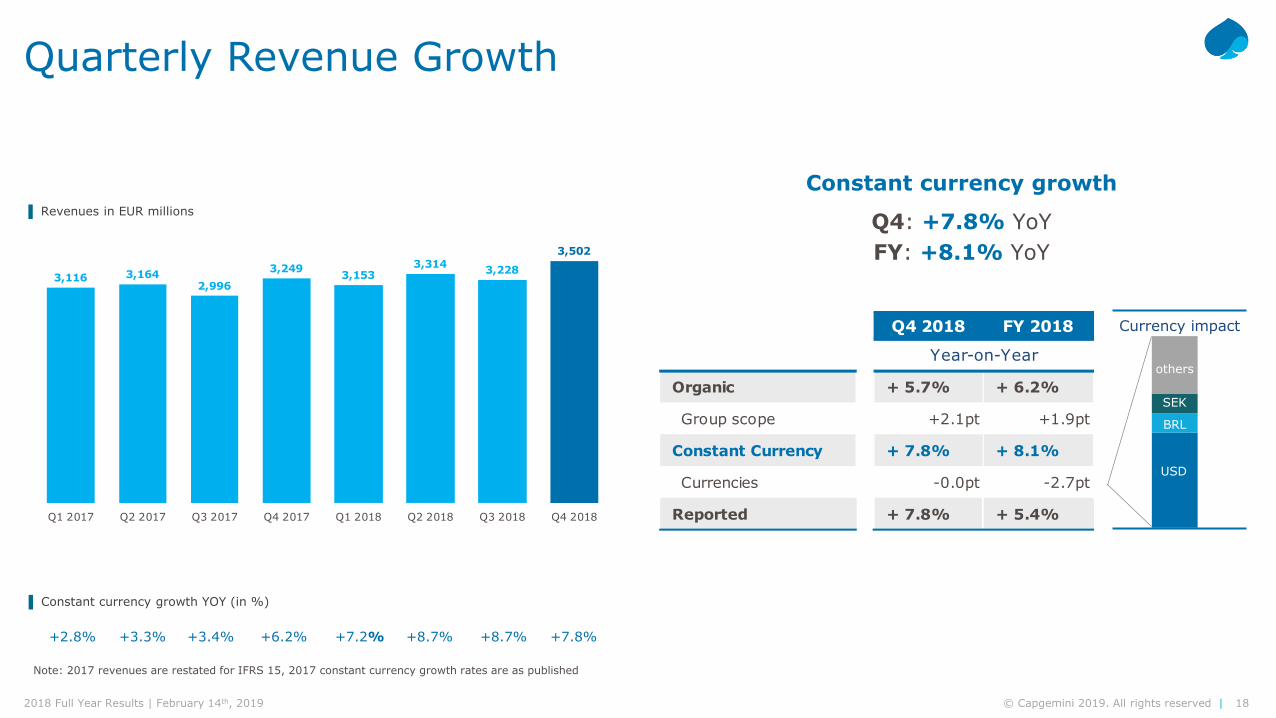
Q4 2018 FY 2018
Organic + 5.7% + 6.2%
Group scope +2.1pt +1.9pt
Constant Currency + 7.8% + 8.1%
Currencies -0.0pt -2.7pt
Reported + 7.8% + 5.4%
Year-on-Year
Quarterly Revenue Growth
▐ Revenues in EUR millions
▐ Constant currency growth YOY (in %)
Constant currency growth
Q4: +7.8% YoY FY: +8.1% YoY
USD
BRL
SEK
others
Currency impact
Note: 2017 revenues are restated for IFRS 15, 2017 constant currency growth rates are as published
+2.8% +3.3% +3.4% +6.2% +7.2% +8.7% +8.7% +7.8%
3,116 3,1642,996
3,249 3,1533,314 3,228
3,502
Q1 2017 Q2 2017 Q3 2017 Q4 2017 Q1 2018 Q2 2018 Q3 2018 Q4 2018
19© Capgemini 2019. All rights reserved |2018 Full Year Results | February 14th, 2019
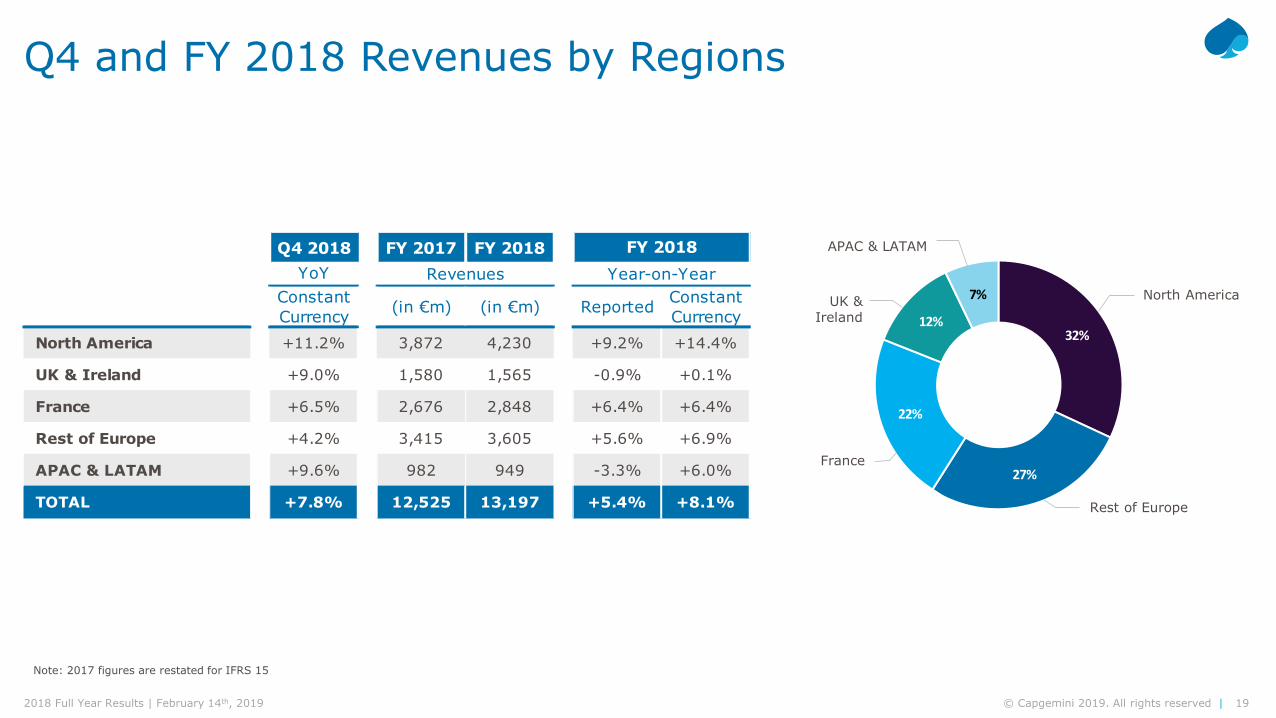
32%
27%
22%
12%
7%
Q4 2018 FY 2017 FY 2018YoY
ConstantCurrency (in €m) (in €m) Reported Constant
CurrencyNorth America +11.2% 3,872 4,230 +9.2% +14.4%
UK & Ireland +9.0% 1,580 1,565 -0.9% +0.1%
France +6.5% 2,676 2,848 +6.4% +6.4%
Rest of Europe +4.2% 3,415 3,605 +5.6% +6.9%
APAC & LATAM +9.6% 982 949 -3.3% +6.0%
TOTAL +7.8% 12,525 13,197 +5.4% +8.1%
FY 2018Revenues Year-on-Year
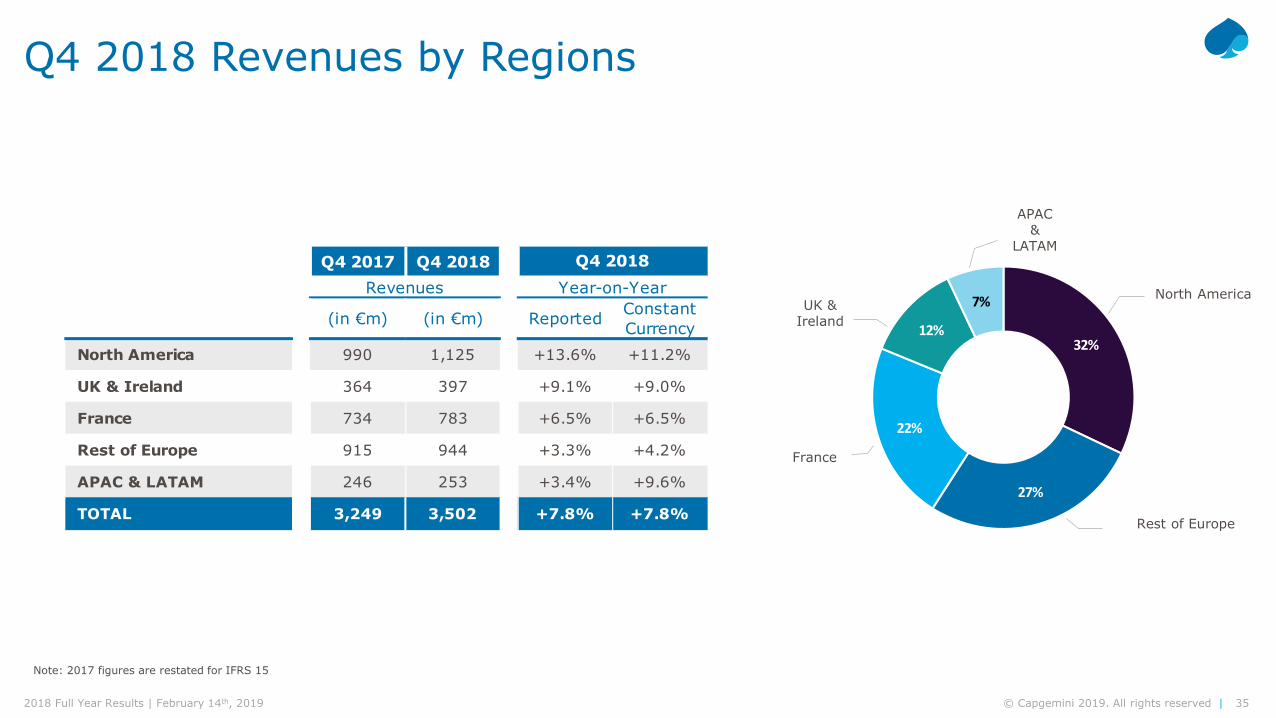
Q4 and FY 2018 Revenues by Regions
North America
Rest of Europe
France
UK & Ireland
APAC & LATAM
Note: 2017 figures are restated for IFRS 15
20© Capgemini 2019. All rights reserved |2018 Full Year Results | February 14th, 2019
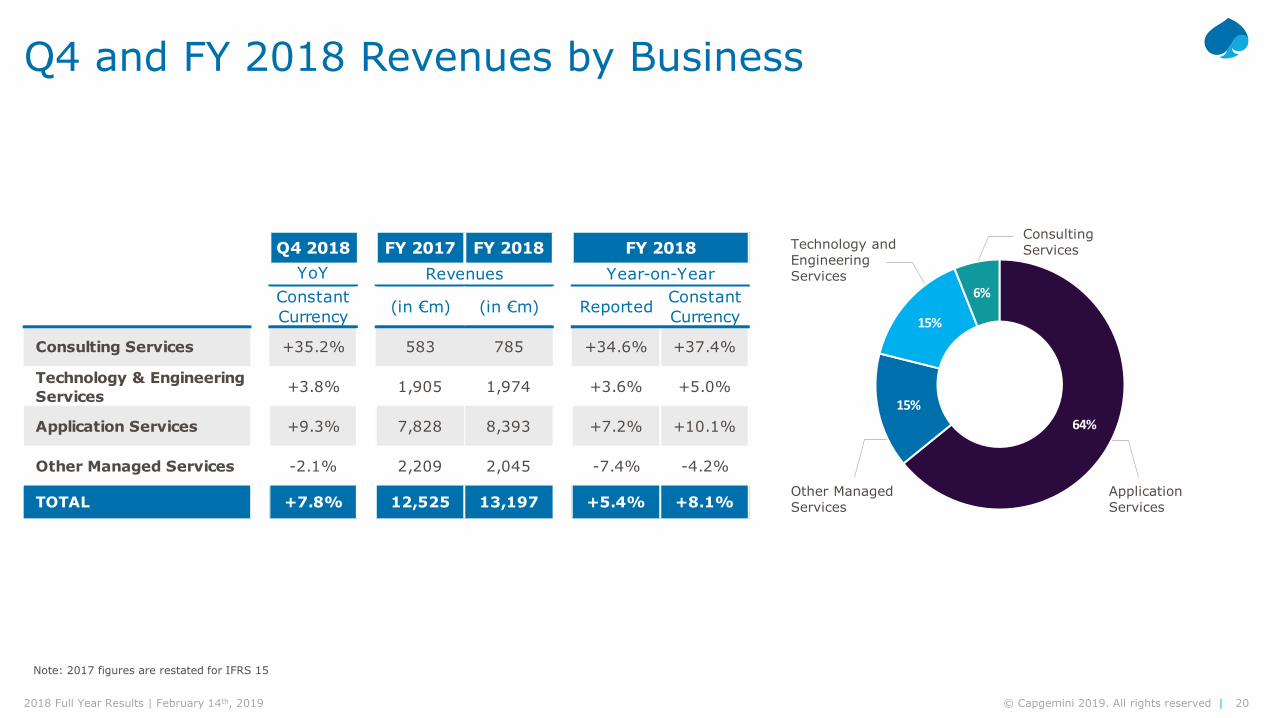
Q4 2018 FY 2017 FY 2018YoY
ConstantCurrency (in €m) (in €m) Reported Constant
Currency
Consulting Services +35.2% 583 785 +34.6% +37.4%
Technology & Engineering Services +3.8% 1,905 1,974 +3.6% +5.0%
Application Services +9.3% 7,828 8,393 +7.2% +10.1%
Other Managed Services -2.1% 2,209 2,045 -7.4% -4.2%
TOTAL +7.8% 12,525 13,197 +5.4% +8.1%
RevenuesFY 2018
Year-on-Year
Q4 and FY 2018 Revenues by Business
Technology and Engineering Services
Other Managed Services
Consulting Services
Application Services
Note: 2017 figures are restated for IFRS 15
64%15%
15%
6%

21© Capgemini 2019. All rights reserved |2018 Full Year Results | February 14th, 2019
Attrition FY 2017 FY 2018 Variation
Consulting Services 20.9% 20.7% -0.2pt
Technology and Engineering Services 20.2% 21.4% +1.2pt
Application Services 18.0% 21.8% +3.8pt
Other Managed Services 21.1% 24.0% +2.9pt
TOTAL 18.9% 22.0% +3.1pt
Dec. 2017 Net variationoffshore
Net variationonshore
Dec. 2018
Headcount Evolution
Workforce in global production centers:
+6.7%YoY 58%
of total
AttritionFY 2018 vs. FY 2017
Headcount EvolutionDecember 2017 to December 2018
+5.8%
+4,000+7,600
199,700 211,300
22© Capgemini 2019. All rights reserved |2018 Full Year Results | February 14th, 2019
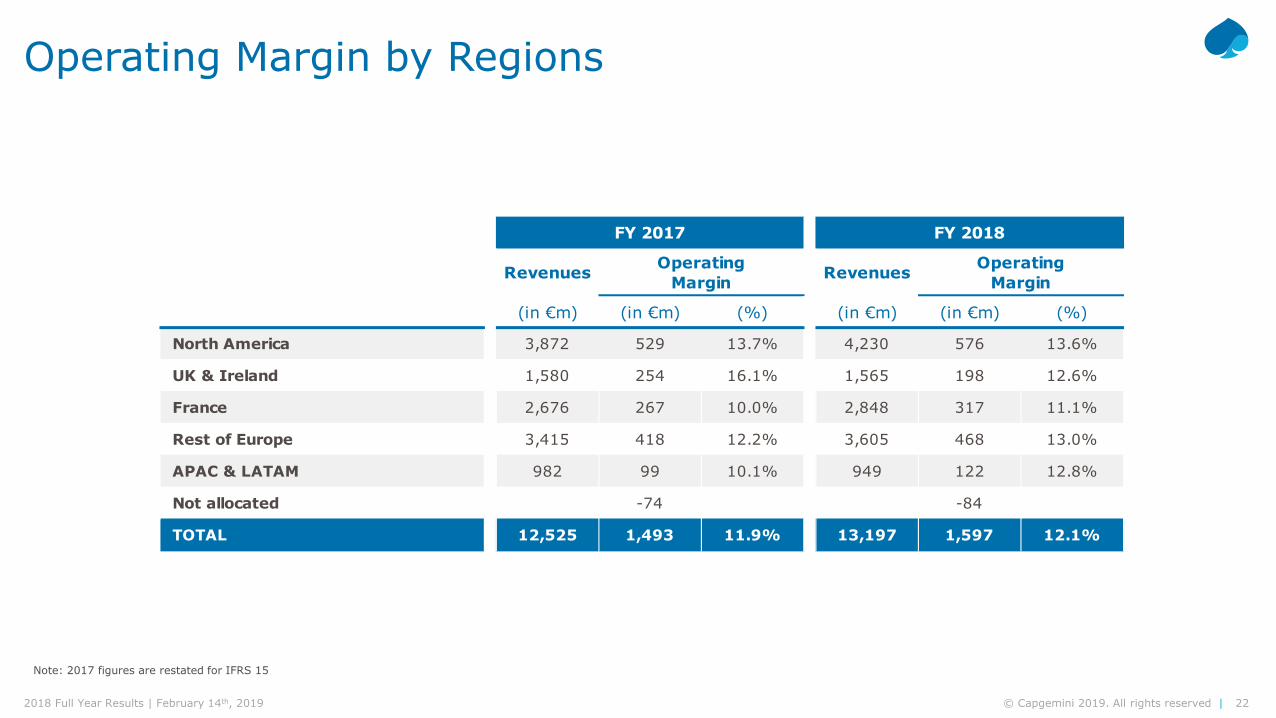
Revenues Revenues
(in €m) (in €m) (%) (in €m) (in €m) (%)
North America 3,872 529 13.7% 4,230 576 13.6%
UK & Ireland 1,580 254 16.1% 1,565 198 12.6%
France 2,676 267 10.0% 2,848 317 11.1%
Rest of Europe 3,415 418 12.2% 3,605 468 13.0%
APAC & LATAM 982 99 10.1% 949 122 12.8%
Not allocated -74 -84
TOTAL 12,525 1,493 11.9% 13,197 1,597 12.1%
FY 2017 FY 2018
Operating Margin
Operating Margin
Operating Margin by Regions
Note: 2017 figures are restated for IFRS 15

23© Capgemini 2019. All rights reserved |2018 Full Year Results | February 14th, 2019
Revenues Revenues
(in €m) (in €m) (%) (in €m) (in €m) (%)
Consulting Services 583 66 11.3% 785 101 12.9%
Technology and Engineering Services 1,905 262 13.8% 1,974 261 13.2%
Application Services 7,828 1,024 13.1% 8,393 1,140 13.6%
Other Managed Services 2,209 215 9.7% 2,045 179 8.7%
Not allocated -74 -84
TOTAL 12,525 1,493 11.9% 13,197 1,597 12.1%
FY 2017 FY 2018
Operating Margin
Operating Margin
Operating Margin by Business
Note: 2017 figures are restated for IFRS 15
24© Capgemini 2019. All rights reserved |2018 Full Year Results | February 14th, 2019
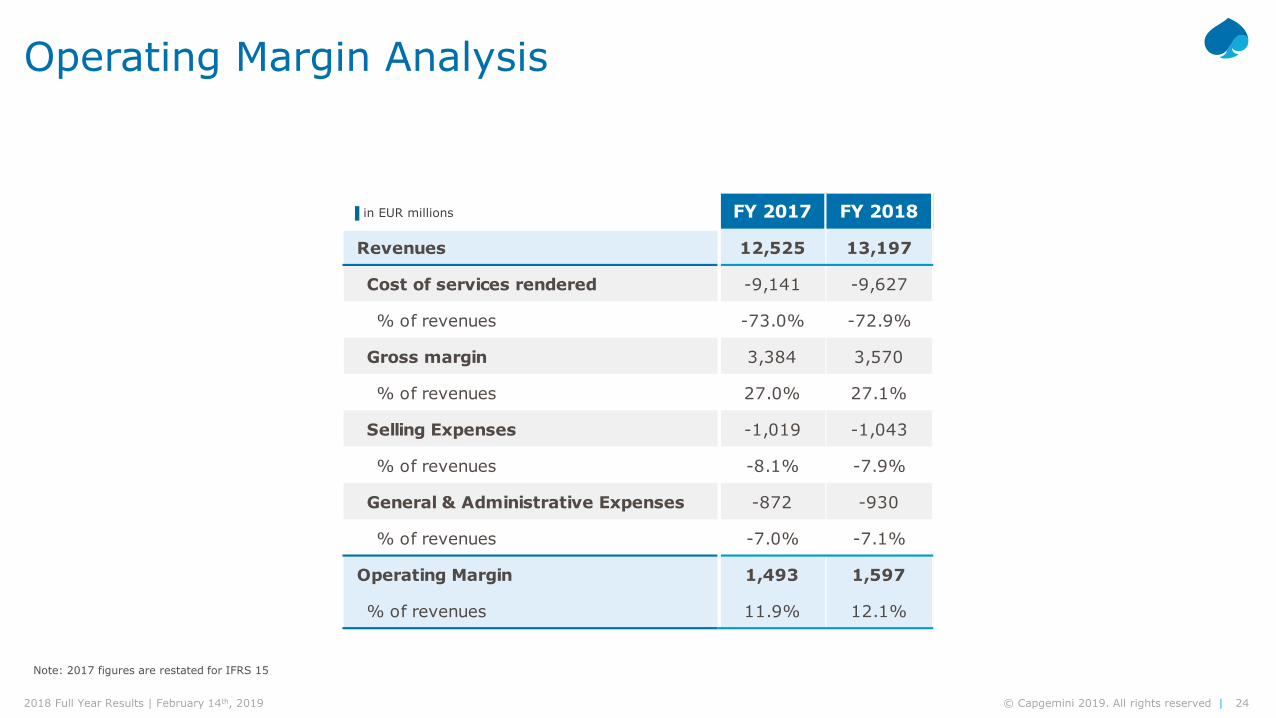
FY 2017 FY 2018
Revenues 12,525 13,197
Cost of services rendered -9,141 -9,627
% of revenues -73.0% -72.9%
Gross margin 3,384 3,570
% of revenues 27.0% 27.1%
Selling Expenses -1,019 -1,043
% of revenues -8.1% -7.9%
General & Administrative Expenses -872 -930
% of revenues -7.0% -7.1%
Operating Margin 1,493 1,597
% of revenues 11.9% 12.1%
Operating Margin Analysis
▐ in EUR millions
Note: 2017 figures are restated for IFRS 15

25© Capgemini 2019. All rights reserved |2018 Full Year Results | February 14th, 2019
FY 2017 FY 2018
Interest on bonds -55 -57
Other interest income and expense 37 45
Net interest expense -18 -12
Other financial income & expenses -54 -68
Net financial expense -72 -80
FY 2017 FY 2018
Income tax -303 -447
Effective tax rate 27.3% 38.2%
Effective tax rate, before transitional tax expense 27.3% 33.7%
Net Financial Expense and Income Tax
▐ in EUR millions
▐ in EUR millions
(1)
(1) Excluding a €53 million expense recognized in due to the transitional impact of the tax reform in the U.S.

26© Capgemini 2019. All rights reserved |2018 Full Year Results | February 14th, 2019
FY 2017 FY 2018
Operating margin 1,493 1,597
Other operating income and expenses -310 -346
of which
Restructuring costs -131 -122
Amortization of intangible assets acquired through business combinations -65 -75
Acquisition and integration costs -38 -38
Expenses relating to share grants -71 -91
Other costs -5 -20
Operating profit 1,183 1,251
Net financial expense -72 -80
Income tax expense -303 -447
Non-controlling interests 12 6
Net profit (Group share) 820 730
Average number of shares 168,057,561 167,088,363
Basic EPS - in € 4.88 4.37
Normalized EPS (non diluted) - in € 6.22 6.06
Net Profit Analysis ▐ in EUR millions
(1) Excluding a €53 million expense recognized in 2018 due to the transitional impact of the US tax reform
(1)
27© Capgemini 2019. All rights reserved |2018 Full Year Results | February 14th, 2019
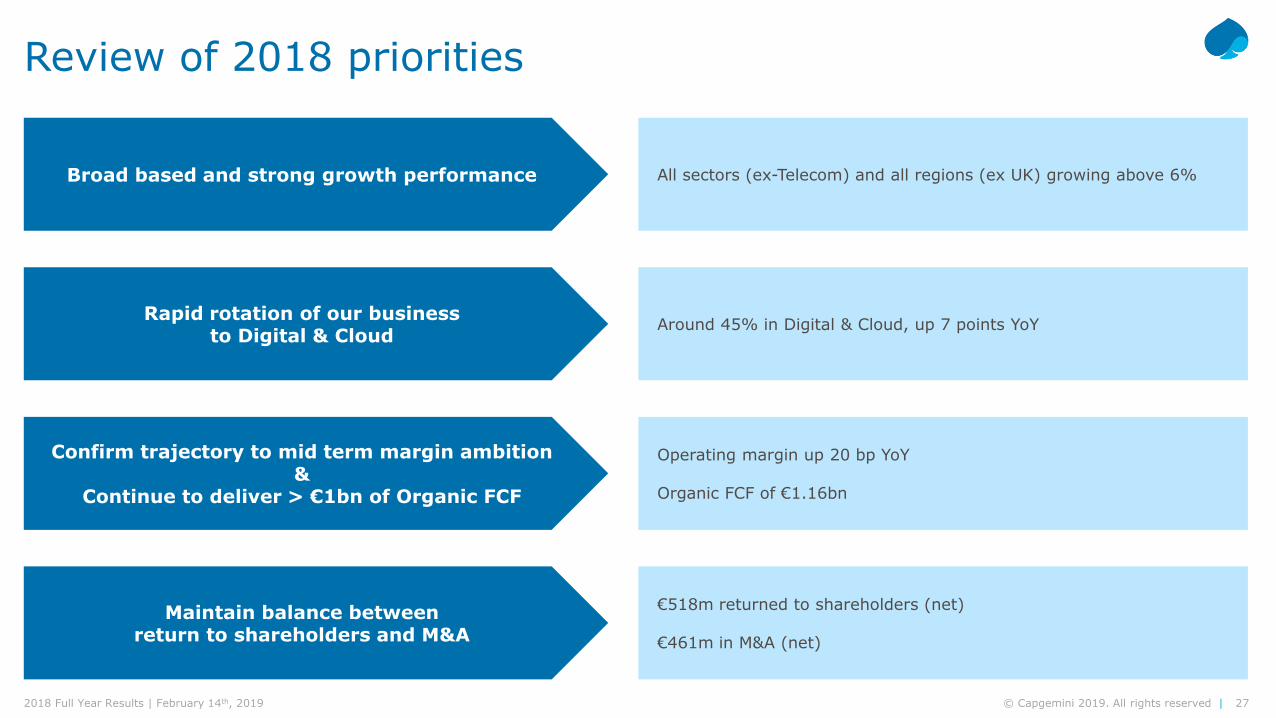
Review of 2018 priorities
Broad based and strong growth performance
Rapid rotation of our business to Digital & Cloud
Confirm trajectory to mid term margin ambition&
Continue to deliver > €1bn of Organic FCF
Maintain balance between return to shareholders and M&A
All sectors (ex-Telecom) and all regions (ex UK) growing above 6%
Around 45% in Digital & Cloud, up 7 points YoY
Operating margin up 20 bp YoY
Organic FCF of €1.16bn
€518m returned to shareholders (net)
€461m in M&A (net)
28© Capgemini 2019. All rights reserved |2018 Full Year Results | February 14th, 2019
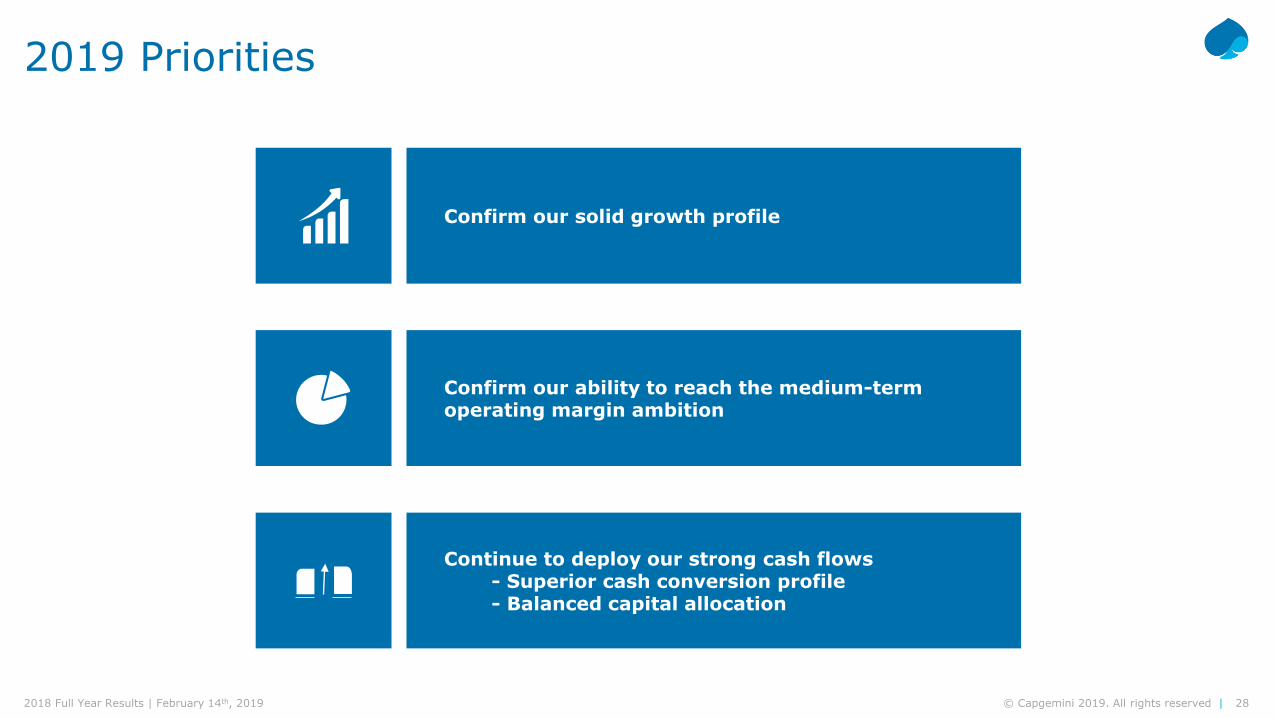
2019 Priorities
Confirm our solid growth profile
Confirm our ability to reach the medium-term operating margin ambition
Continue to deploy our strong cash flows- Superior cash conversion profile- Balanced capital allocation

29© Capgemini 2019. All rights reserved |2018 Full Year Results | February 14th, 2019
Q&A
Carole FERRANDChief Financial Officer
Rosemary STARKChief Sales Officer
Paul HERMELINChairman and CEO
Thierry DELAPORTEChief Operating Officer
Aiman EZZATChief Operating Officer
30© Capgemini 2019. All rights reserved |2018 Full Year Results | February 14th, 2019
Appendix

31© Capgemini 2019. All rights reserved |2018 Full Year Results | February 14th, 2019
Alternate performance measures▐ Organic growth, or like-for-like growth, in revenues is the growth rate calculated at constant Group scope and exchange rates. The
Group scope and exchange rates used are those for the published period. Exchange rates for the published period are also used tocalculate growth at constant exchange rates.
▐ Operating margin is one of the Group’s key performance indicators. It is equal to revenues less operating expenses. It is calculatedbefore “Other operating income and expenses” which include amortization of intangible assets recognized in business combinations, thecharge resulting from the deferred recognition of the fair value of shares granted to employees (including social security contributions andemployer contributions), and non-recurring revenues and expenses, notably impairment of goodwill, negative goodwill, capital gains orlosses on disposals of consolidated companies or businesses, restructuring costs incurred under a detailed formal plan approved by theGroup’s management, the cost of acquiring and integrating companies acquired by the Group, including earn-outs comprising conditionsof presence, and the effects of curtailments, settlements and transfers of defined benefit pension plans.
▐ Normalized earnings per share are calculated by dividing normalized profit or loss attributable to owners of the Company by theweighted average number of ordinary shares outstanding during the period, excluding treasury shares. Normalized net profit or loss isequal to profit for the period attributable to owners of the Company corrected for the impact of items recognized in other operatingincome and expense, net of tax calculated using the effective tax rate.
▐ Organic free cash flow is calculated based on items in the Statement of Cash Flows and is equal to cash flow from operations lessacquisitions of property, plant, equipment and intangible assets (net of disposals) and adjusted for flows relating to the net interest cost.
▐ Net debt comprises (i) cash and cash equivalents, as presented in the Consolidated Statement of Cash Flows (consisting of short-terminvestments and cash at bank) less bank overdrafts, and also including (ii) cash management assets (assets presented separately in theConsolidated Statement of Financial Position due to their characteristics), less (iii) short- and long-term borrowings. Account is also takenof (iv) the impact of hedging instruments when these relate to borrowings and own shares.
32© Capgemini 2019. All rights reserved |2018 Full Year Results | February 14th, 2019
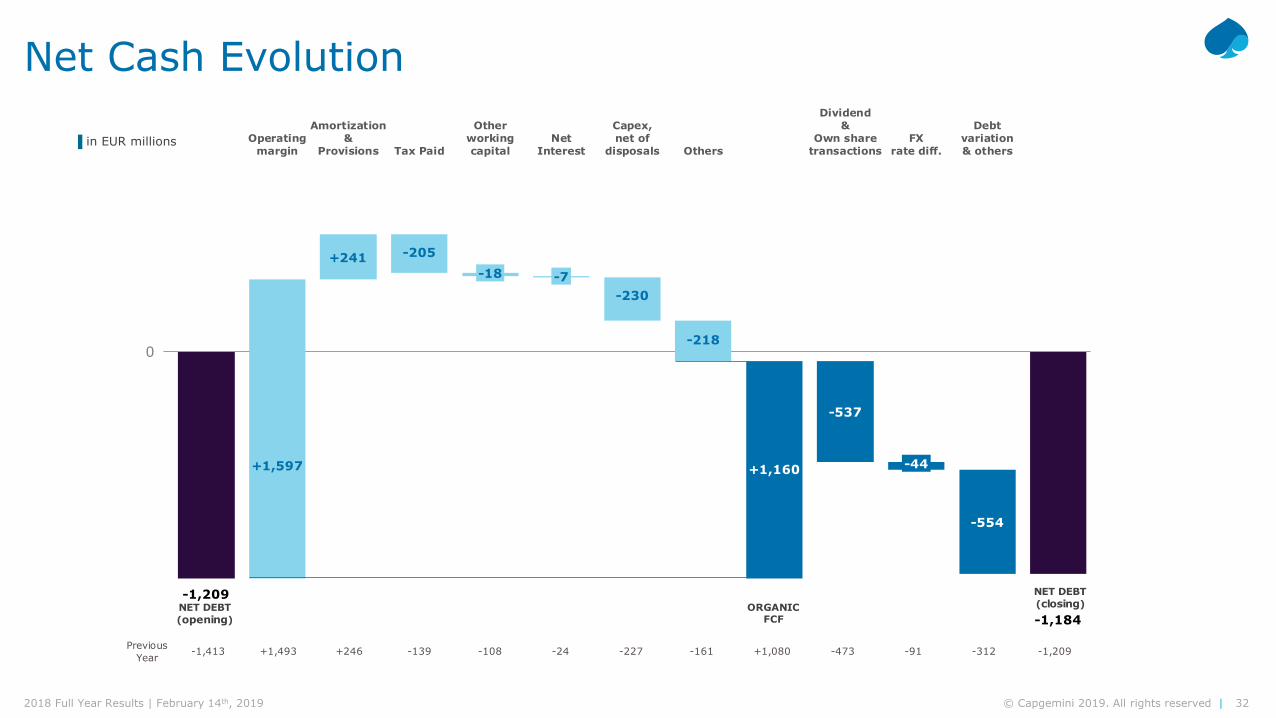
-1,209
-1,184
+1,160
-537
-44
-554
+1,597
+241 -205-18 -7
-230
-218
Operatingmargin
Amortization&
Provisions Tax Paid
Otherworkingcapital
NetInterest
Capex,net of
disposals Others
Dividend&
Own sharetransactions
FXrate diff.
Debtvariation& others
NET DEBT(opening)
ORGANICFCF
NET DEBT(closing)
Net Cash Evolution
▐ in EUR millions
PreviousYear -1,413 +1,493 +246 -139 -108 -24 -227 -161 +1,080 -473 -91 -312 -1,209
0

33© Capgemini 2019. All rights reserved |2018 Full Year Results | February 14th, 2019
2,946
3,312
2,651
3,716
3,1953,446
2,808
3,929
Q1 2017 Q2 2017 Q3 2017 Q4 2017 Q1 2018 Q2 2018 Q3 2018 Q4 2018
Bookings Evolution
FY 2018Published: +6%
Constant currency: +9%
▐ Bookings (in EUR billion)
▐ Constant currency growth YOY (in %)
-3.2% +4.8% -1.0% +1.4% +15.3% +8.0% +6.7% +5.2%
Note: 2017 bookings are restated for IFRS 15
34© Capgemini 2019. All rights reserved |2018 Full Year Results | February 14th, 2019
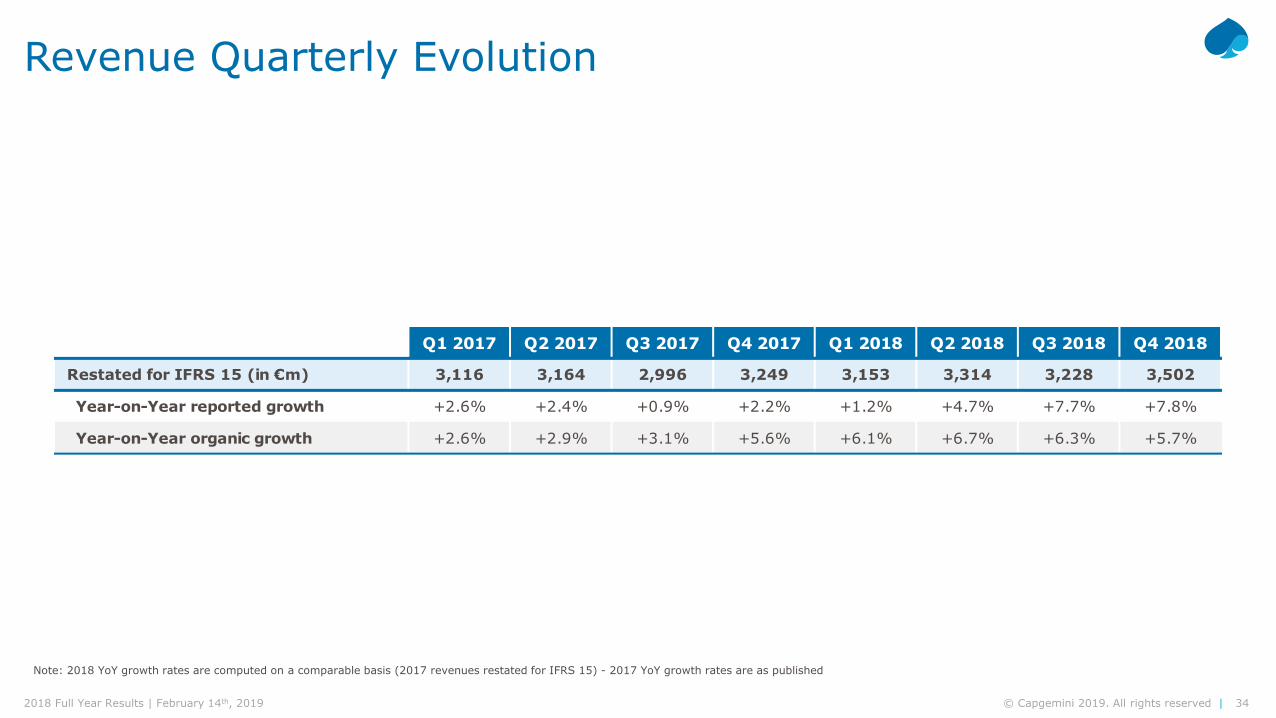
Revenue Quarterly Evolution
Note: 2018 YoY growth rates are computed on a comparable basis (2017 revenues restated for IFRS 15) - 2017 YoY growth rates are as published
Q1 2017 Q2 2017 Q3 2017 Q4 2017 Q1 2018 Q2 2018 Q3 2018 Q4 2018
Restated for IFRS 15 (in €m) 3,116 3,164 2,996 3,249 3,153 3,314 3,228 3,502
Year-on-Year reported growth +2.6% +2.4% +0.9% +2.2% +1.2% +4.7% +7.7% +7.8%
Year-on-Year organic growth +2.6% +2.9% +3.1% +5.6% +6.1% +6.7% +6.3% +5.7%
35© Capgemini 2019. All rights reserved |2018 Full Year Results | February 14th, 2019
32%
27%
22%
12%
7%
Q4 2017 Q4 2018
(in €m) (in €m) Reported ConstantCurrency
North America 990 1,125 +13.6% +11.2%
UK & Ireland 364 397 +9.1% +9.0%
France 734 783 +6.5% +6.5%
Rest of Europe 915 944 +3.3% +4.2%
APAC & LATAM 246 253 +3.4% +9.6%
TOTAL 3,249 3,502 +7.8% +7.8%
Year-on-YearQ4 2018
Revenues
Q4 2018 Revenues by Regions
North America
Rest of Europe
France
UK & Ireland
APAC &
LATAM
Note: 2017 figures are restated for IFRS 15
36© Capgemini 2019. All rights reserved |2018 Full Year Results | February 14th, 2019
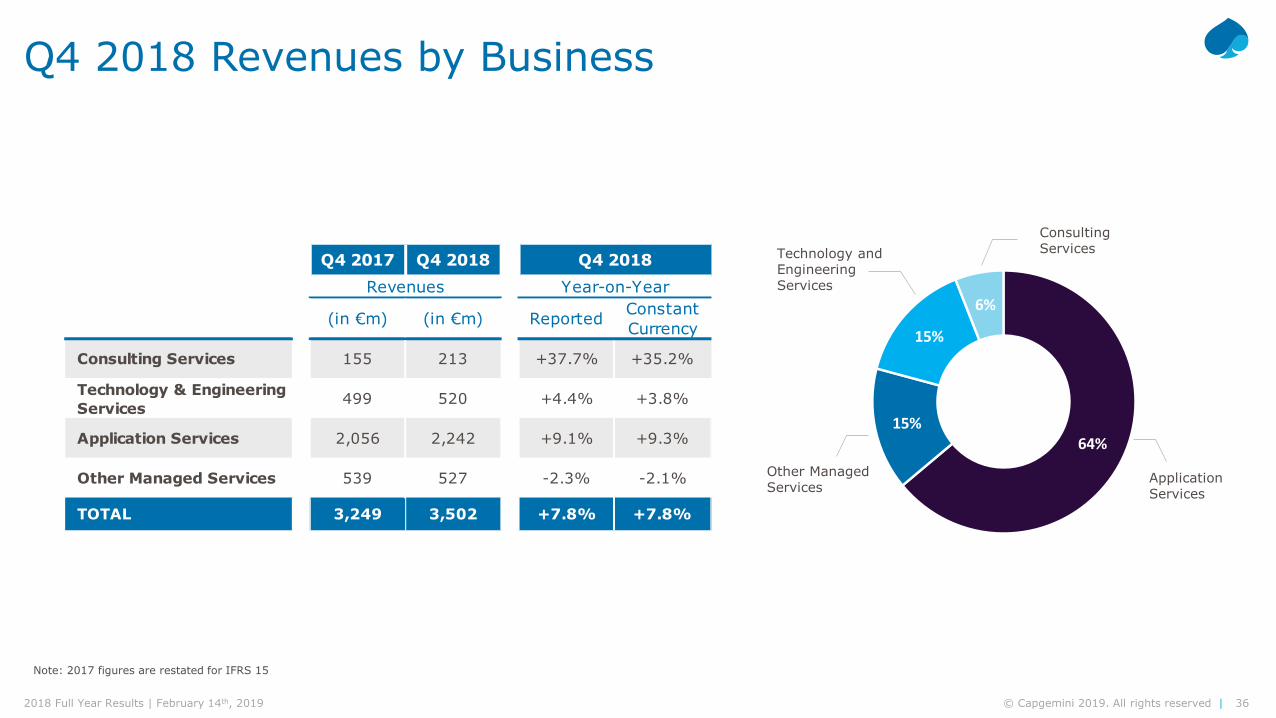
64%15%
15%
6%
Q4 2017 Q4 2018
(in €m) (in €m) Reported ConstantCurrency
Consulting Services 155 213 +37.7% +35.2%
Technology & Engineering Services 499 520 +4.4% +3.8%
Application Services 2,056 2,242 +9.1% +9.3%
Other Managed Services 539 527 -2.3% -2.1%
TOTAL 3,249 3,502 +7.8% +7.8%
Q4 2018Year-on-YearRevenues
Q4 2018 Revenues by Business
Technology and Engineering Services
Other Managed Services
Consulting Services
Application Services
Note: 2017 figures are restated for IFRS 15
37© Capgemini 2019. All rights reserved |2018 Full Year Results | February 14th, 2019
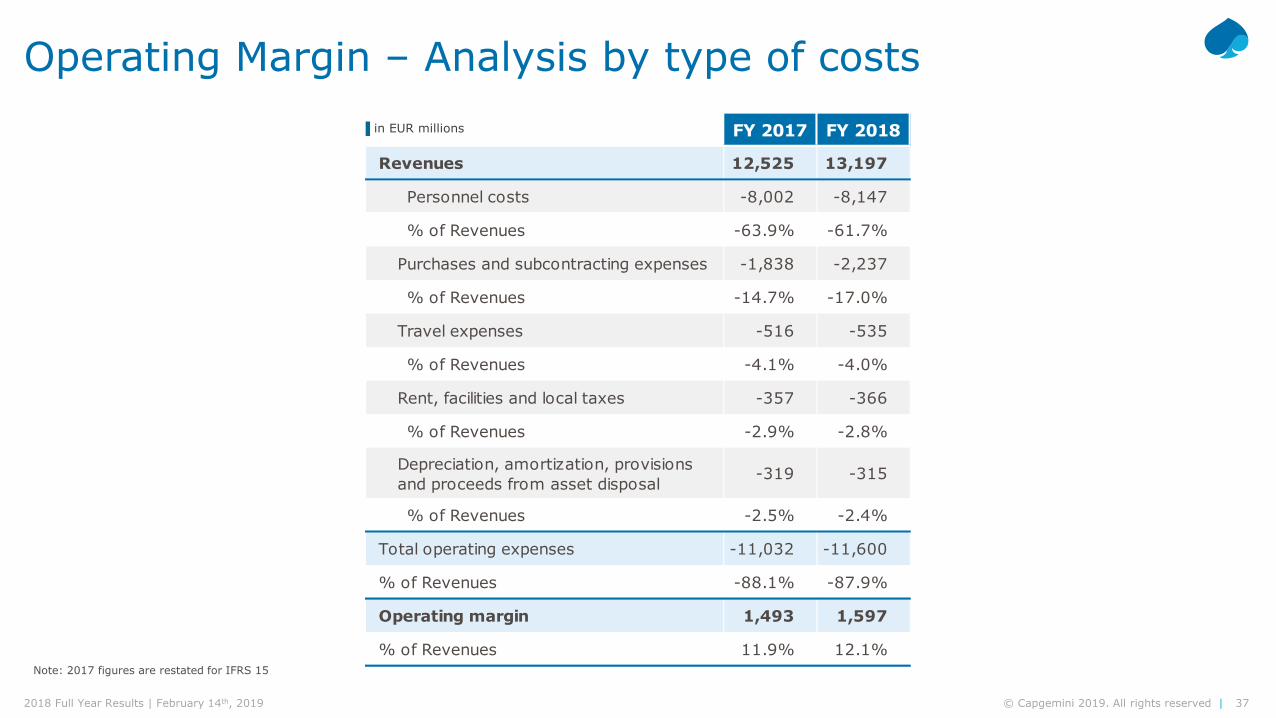
FY 2017 FY 2018
Revenues 12,525 13,197
Personnel costs -8,002 -8,147
% of Revenues -63.9% -61.7%
Purchases and subcontracting expenses -1,838 -2,237
% of Revenues -14.7% -17.0%
Travel expenses -516 -535
% of Revenues -4.1% -4.0%
Rent, facilities and local taxes -357 -366
% of Revenues -2.9% -2.8%
Depreciation, amortization, provisions and proceeds from asset disposal -319 -315
% of Revenues -2.5% -2.4%
Total operating expenses -11,032 -11,600
% of Revenues -88.1% -87.9%
Operating margin 1,493 1,597
% of Revenues 11.9% 12.1%
Operating Margin – Analysis by type of costs▐ in EUR millions
Note: 2017 figures are restated for IFRS 15
38© Capgemini 2019. All rights reserved |2018 Full Year Results | February 14th, 2019
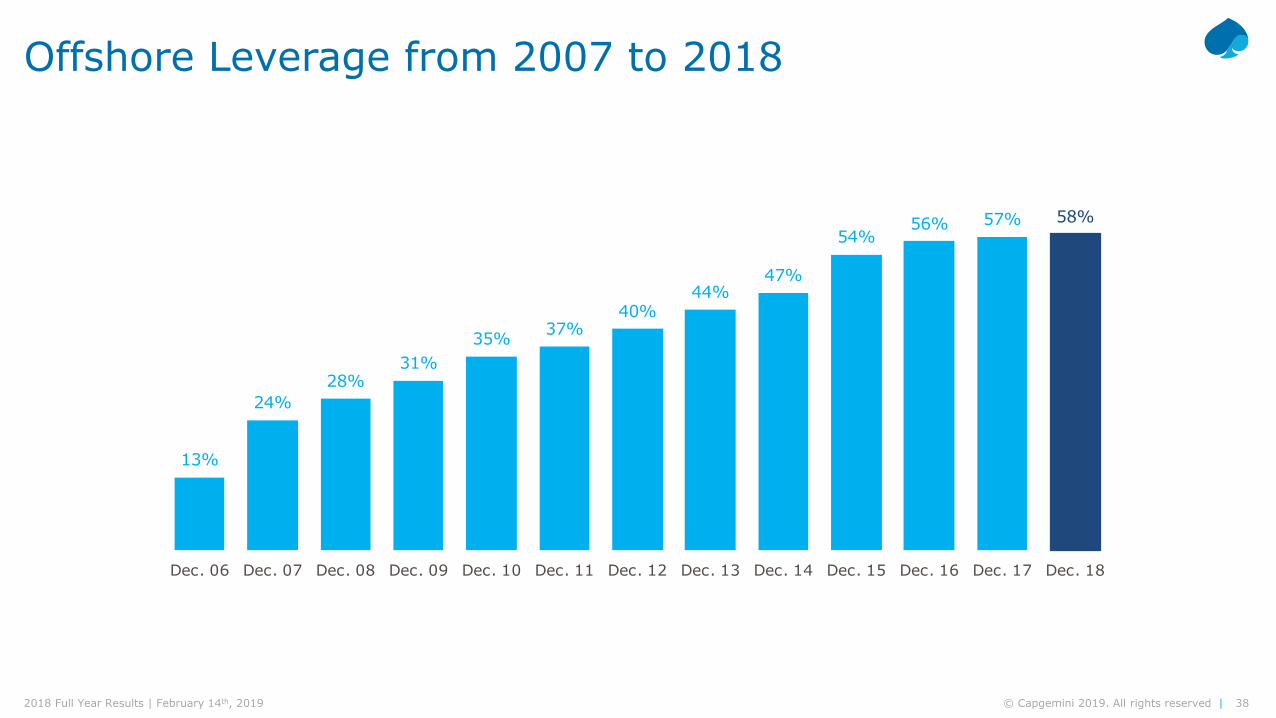
13%
24%28%
31%35% 37%
40%44%
47%
54%56% 57% 58%
Dec. 06 Dec. 07 Dec. 08 Dec. 09 Dec. 10 Dec. 11 Dec. 12 Dec. 13 Dec. 14 Dec. 15 Dec. 16 Dec. 17 Dec. 18
Offshore Leverage from 2007 to 2018

39© Capgemini 2019. All rights reserved |2018 Full Year Results | February 14th, 2019
Consulting Services
Utilization Rates
Application ServicesTechnology & Engineering
Services
71% 72% 69%72% 72% 73%
67%71%
Q1 2017 Q2 2017 Q3 2017 Q4 2017 Q1 2018 Q2 2018 Q3 2018 Q4 2018
81% 81% 82% 83% 81% 82% 83% 82%
Q1 2017 Q2 2017 Q3 2017 Q4 2017 Q1 2018 Q2 2018 Q3 2018 Q4 2018
82% 84% 85% 84% 83% 85% 84% 84%
Q1 2017 Q2 2017 Q3 2017 Q4 2017 Q1 2018 Q2 2018 Q3 2018 Q4 2018

40© Capgemini 2019. All rights reserved |2018 Full Year Results | February 14th, 2019
2017 2018
Profit for the period 808 724
Depreciation, amortization and impairment of fixed assets 301 303Change in provisions -9 -39Losses on disposals of assets 15 16Net finance costs 18 12Income tax expense / (income) 303 447Other non-cash items 96 73
Cash flows from operations before net finance costs and income tax 1,532 1,536
Income tax paid -139 -205Change in restructuring debt 10 17Changes in operating working capital -73 48
Operating cash flows (A) 1,330 1,396
Capital expenditure (net of proceeds) (B) -226 -229Cash outflows on business combinations net of cash & cash equivalents acquired -243 -461Increase in share capital 320 230Dividends paid -262 -284Net payments relating to treasury shares transactions -531 -483Change in debt -75 -93Interest paid & received (C) -24 -7Translation, perimeter changes & other -85 -44
Change in net cash and cash equivalents 204 25
Opening Net Cash / (Debt) -1,413 -1,209Closing Net Cash / (Debt) -1,209 -1,184
Organic Free Cash Flow (A) + (B) + (C) 1,080 1,160
Net Cash Evolution▐ in EUR millions
41© Capgemini 2019. All rights reserved |2018 Full Year Results | February 14th, 2019
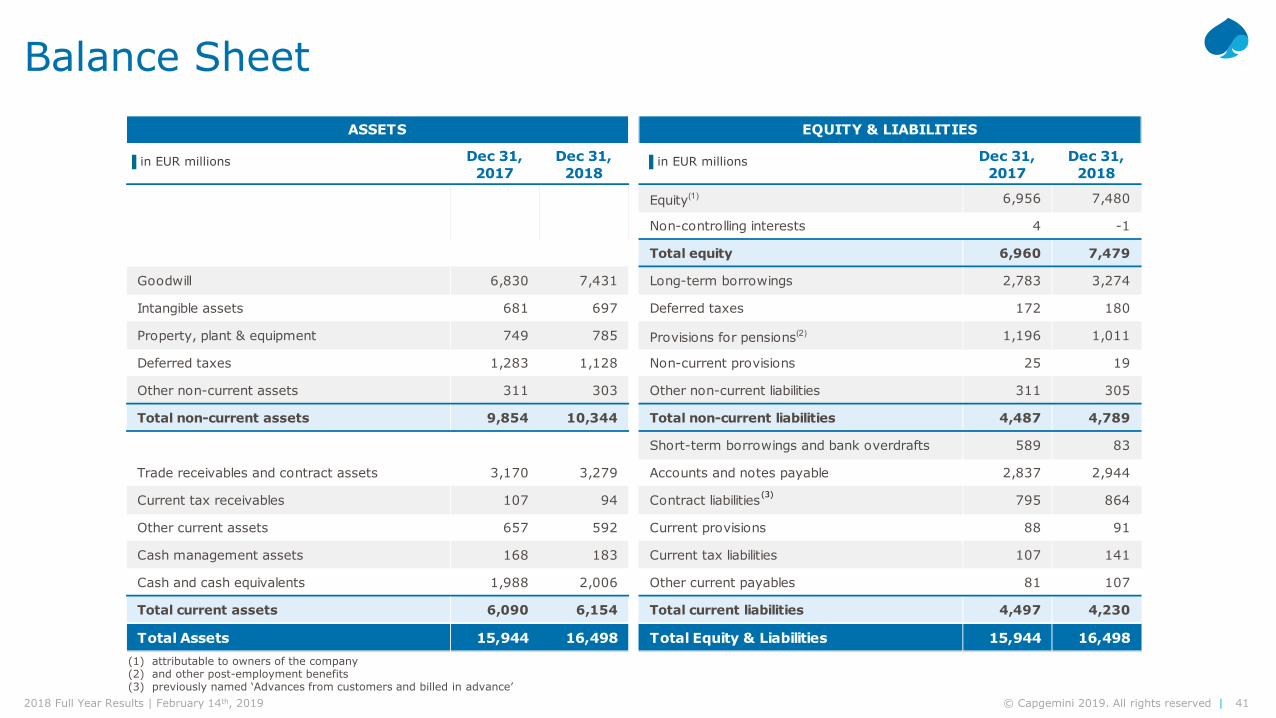
Dec 31, 2017
Dec 31, 2018
Dec 31, 2017
Dec 31, 2018
Equity(1) 6,956 7,480
Non-controlling interests 4 -1
Total equity 6,960 7,479
Goodwill 6,830 7,431 Long-term borrowings 2,783 3,274
Intangible assets 681 697 Deferred taxes 172 180
Property, plant & equipment 749 785 Provisions for pensions(2) 1,196 1,011
Deferred taxes 1,283 1,128 Non-current provisions 25 19
Other non-current assets 311 303 Other non-current liabilities 311 305
Total non-current assets 9,854 10,344 Total non-current liabilities 4,487 4,789
Short-term borrowings and bank overdrafts 589 83
Trade receivables and contract assets 3,170 3,279 Accounts and notes payable 2,837 2,944
Current tax receivables 107 94 Contract liabilities 795 864
Other current assets 657 592 Current provisions 88 91
Cash management assets 168 183 Current tax liabilities 107 141
Cash and cash equivalents 1,988 2,006 Other current payables 81 107
Total current assets 6,090 6,154 Total current liabilities 4,497 4,230
Total Assets 15,944 16,498 Total Equity & Liabilities 15,944 16,498
ASSETS EQUITY & LIABILITIES
Balance Sheet
(1) attributable to owners of the company(2) and other post-employment benefits(3) previously named ‘Advances from customers and billed in advance’
▐ in EUR millions ▐ in EUR millions
(3)
42© Capgemini 2019. All rights reserved |2018 Full Year Results | February 14th, 2019
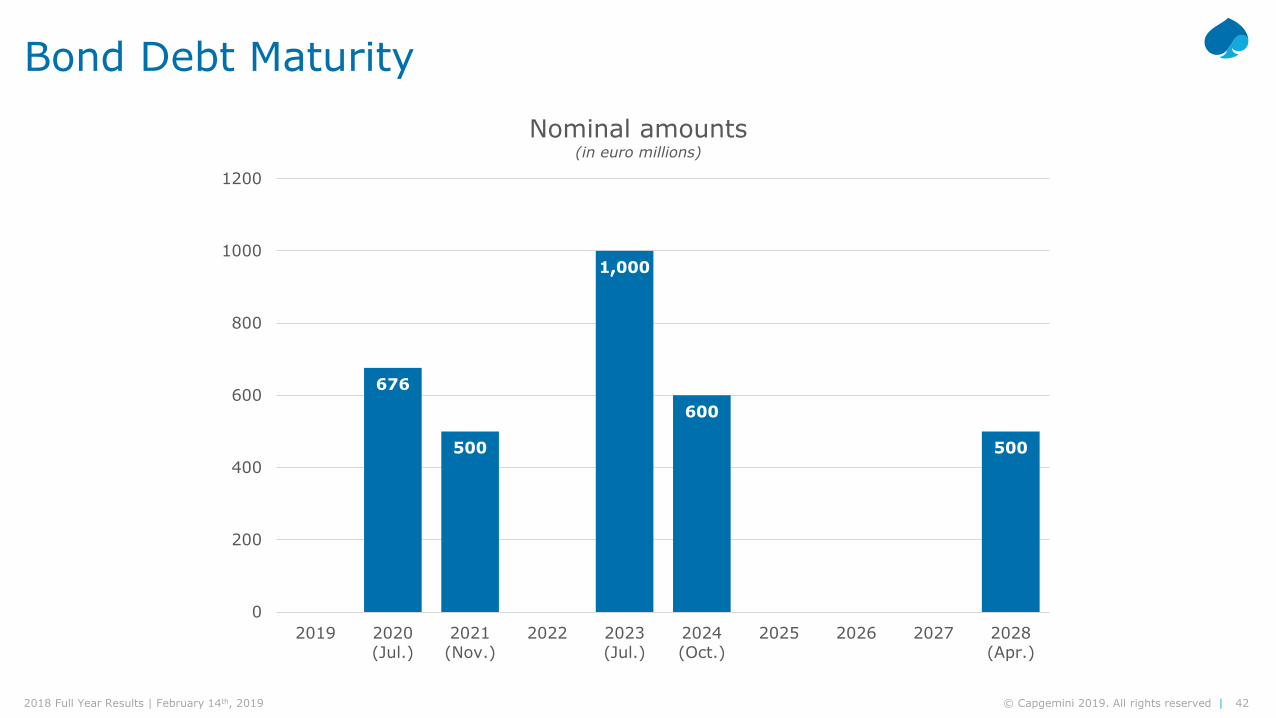
Bond Debt Maturity
676
500
1,000
600
500
0
200
400
600
800
1000
1200
2019 2020(Jul.)
2021(Nov.)
2022 2023(Jul.)
2024(Oct.)
2025 2026 2027 2028(Apr.)
Nominal amounts(in euro millions)
,
43© Capgemini 2019. All rights reserved |2018 Full Year Results | February 14th, 2019
Equity1
IFRS 16
Key impacts on P&LKey impacts on Balance Sheet
Pre IFRS 16
Revenues
Post IFRS 16
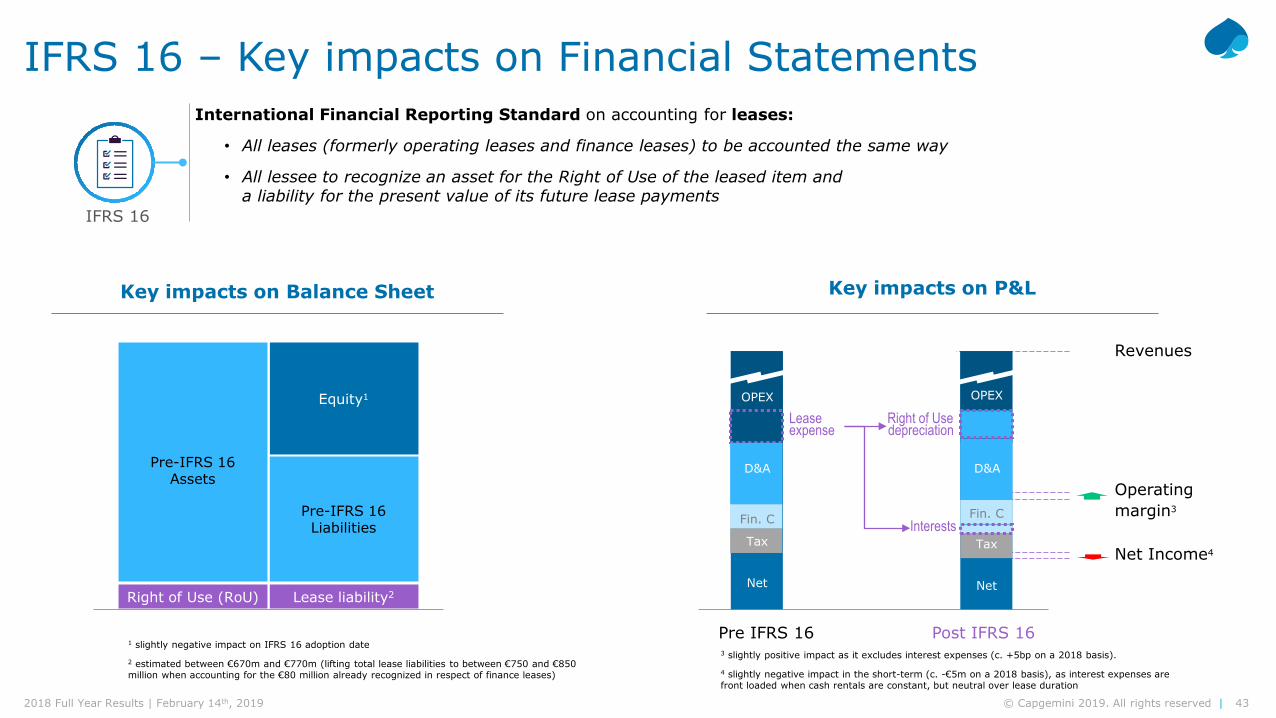
IFRS 16 – Key impacts on Financial Statements
Net Income4
OPEX
Fin. C
Tax
Operatingmargin3
OPEX
D&A
Leaseexpense
Fin. C
Tax
Right of Use depreciation
Interests
Net Net
Pre-IFRS 16Liabilities
Pre-IFRS 16Assets
Lease liability2Right of Use (RoU)
3 slightly positive impact as it excludes interest expenses (c. +5bp on a 2018 basis).
4 slightly negative impact in the short-term (c. -€5m on a 2018 basis), as interest expenses are front loaded when cash rentals are constant, but neutral over lease duration
International Financial Reporting Standard on accounting for leases:
• All leases (formerly operating leases and finance leases) to be accounted the same way
• All lessee to recognize an asset for the Right of Use of the leased item and a liability for the present value of its future lease payments
D&A D&A
1 slightly negative impact on IFRS 16 adoption date
2 estimated between €670m and €770m (lifting total lease liabilities to between €750 and €850 million when accounting for the €80 million already recognized in respect of finance leases)
44© Capgemini 2019. All rights reserved |2018 Full Year Results | February 14th, 2019
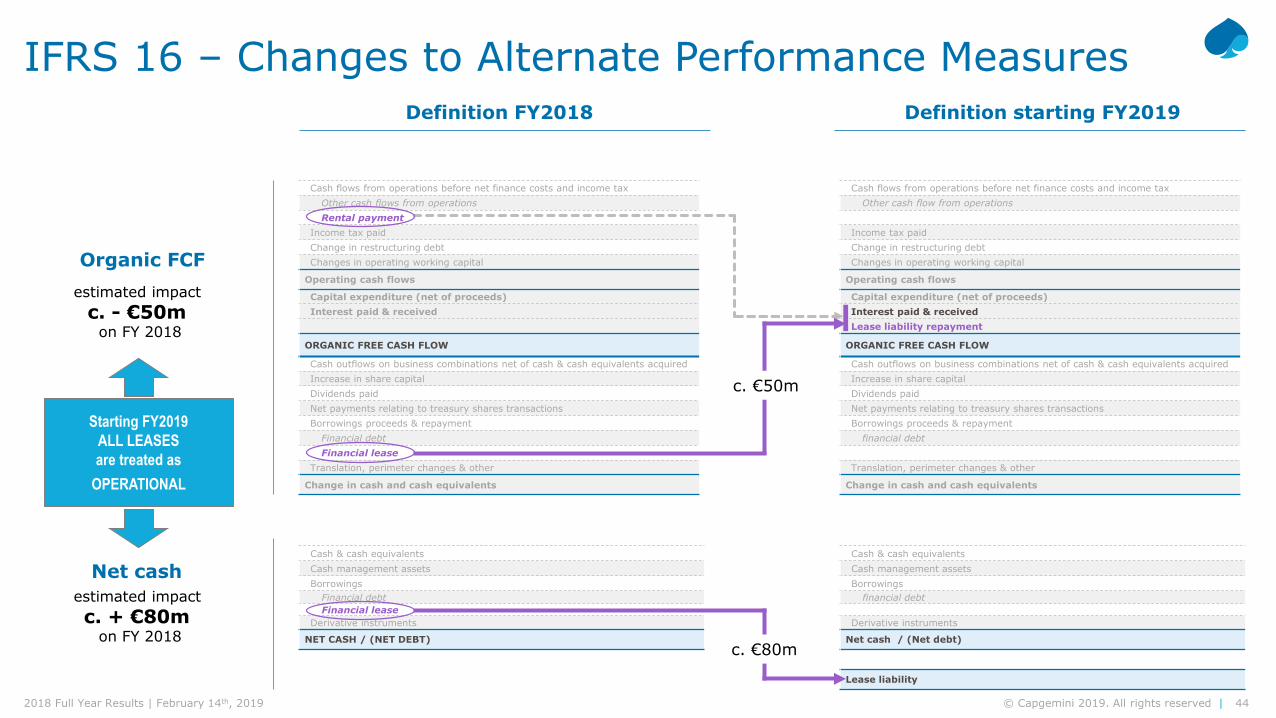
IFRS 16 – Changes to Alternate Performance Measures
Organic FCF
Cash flows from operations before net finance costs and income tax Other cash flows from operationsRental payment
Income tax paidChange in restructuring debtChanges in operating working capital
Operating cash flows
Capital expenditure (net of proceeds)Interest paid & received
ORGANIC FREE CASH FLOW
Cash outflows on business combinations net of cash & cash equivalents acquiredIncrease in share capitalDividends paidNet payments relating to treasury shares transactionsBorrowings proceeds & repayment
Financial debtFinancial lease
Translation, perimeter changes & other
Change in cash and cash equivalents
Cash flows from operations before net finance costs and income tax Other cash flow from operations
Income tax paidChange in restructuring debtChanges in operating working capital
Operating cash flows
Capital expenditure (net of proceeds)Interest paid & receivedLease liability repayment
ORGANIC FREE CASH FLOW
Cash outflows on business combinations net of cash & cash equivalents acquiredIncrease in share capitalDividends paidNet payments relating to treasury shares transactionsBorrowings proceeds & repayment
financial debt
Translation, perimeter changes & other
Change in cash and cash equivalents
estimated impact c. - €50m
on FY 2018
Net cashCash & cash equivalents Cash management assetsBorrowings
Financial debtFinancial lease
Derivative instruments
NET CASH / (NET DEBT)
Cash & cash equivalents Cash management assetsBorrowings
financial debt
Derivative instruments
Net cash / (Net debt)
Lease liability
estimated impact c. + €80m
on FY 2018
Definition starting FY2019 Definition FY2018
Starting FY2019ALL LEASES are treated as
OPERATIONAL
c. €80m
c. €50m
45© Capgemini 2019. All rights reserved |2018 Full Year Results | February 14th, 2019
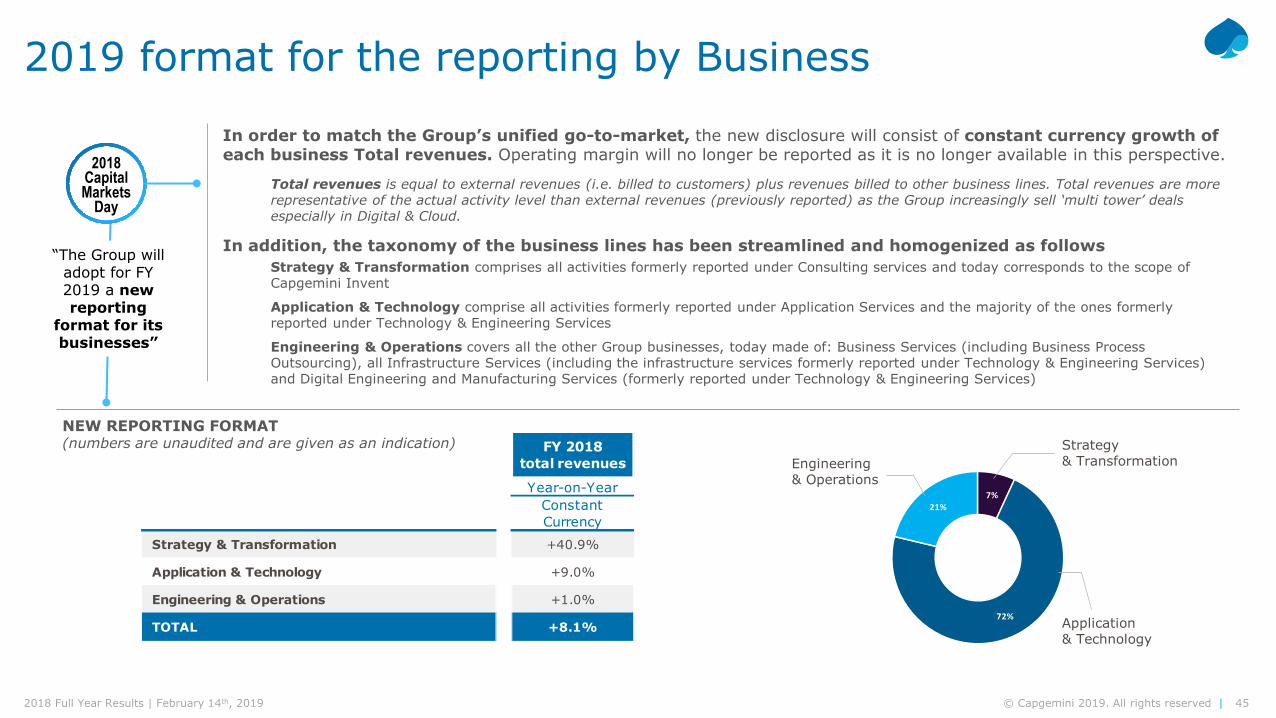
7%
72%
21%
2019 format for the reporting by Business
Engineering & Operations
Strategy & Transformation
Application & Technology
FY 2018total revenues
Year-on-YearConstant Currency
Strategy & Transformation +40.9%
Application & Technology +9.0%
Engineering & Operations +1.0%
TOTAL +8.1%
In order to match the Group’s unified go-to-market, the new disclosure will consist of constant currency growth of each business Total revenues. Operating margin will no longer be reported as it is no longer available in this perspective.
Total revenues is equal to external revenues (i.e. billed to customers) plus revenues billed to other business lines. Total revenues are more representative of the actual activity level than external revenues (previously reported) as the Group increasingly sell ‘multi tower’ deals especially in Digital & Cloud.
In addition, the taxonomy of the business lines has been streamlined and homogenized as followsStrategy & Transformation comprises all activities formerly reported under Consulting services and today corresponds to the scope of Capgemini Invent
Application & Technology comprise all activities formerly reported under Application Services and the majority of the ones formerly reported under Technology & Engineering Services
Engineering & Operations covers all the other Group businesses, today made of: Business Services (including Business Process Outsourcing), all Infrastructure Services (including the infrastructure services formerly reported under Technology & Engineering Services) and Digital Engineering and Manufacturing Services (formerly reported under Technology & Engineering Services)
2018CapitalMarkets
Day
“The Group will adopt for FY 2019 a new reporting
format for its businesses”
NEW REPORTING FORMAT (numbers are unaudited and are given as an indication)
A global leader in consulting, technology services and digital transformation,Capgemini is at the forefront of innovation to address the entire breadth of clients’opportunities in the evolving world of cloud, digital and platforms. Building on itsstrong 50-year heritage and deep industry-specific expertise, Capgemini enablesorganizations to realize their business ambitions through an array of services fromstrategy to operations. Capgemini is driven by the conviction that the business valueof technology comes from and through people. It is a multicultural company of over200,000 team members in over 40 countries. The Group reported 2018 globalrevenues of EUR 13.2 billion.
About Capgemini
Learn more about us at
www.capgemini.com
This message contains information that may be privileged or confidential and is the property of the Capgemini Group.Copyright © 2019 Capgemini. All rights reserved.
Biraud, VincentHead of Investor [email protected]+33 1 4754 5087
Schmitt, MarineSenior Investor Relations [email protected]+33 1 4754 5082
People matter, results count.
Massoni, PatrickInvestor [email protected]+33 1 4754 51 41