2018 u.s. and rochester area economic outlook 390,000 395,000 400,000 405,000 410,000 415,000...
TRANSCRIPT

2018 U.S. and Rochester Area
Economic Outlook
Gary Keith – Vice President, Regional Economist
Commercial Banking Division
January 26, 2018

Solid Economic Momentum Heading Into 2018
©2018 M&T Bank, Member FDIC
2013 2014 2015 2016 2017
U.S. Leading Indicators
Point to Further Expansion
“The Index…suggests that solid
economic growth will continue
into the first half of 2018”70
75
80
85
90
95
100
105
110
00 02 04 06 08 10 12 14 16 17
107R
E
C
E
S
S
I
O
N
The Conference Board
U.S. Leading Economic Index
Sources: U.S. Bureau of Labor Statistics, The Conference Board
3.5
4.0
4.5
5.0
5.5
6.0
6.5 Number of Non-farm Job Openings
Millions
5.9
Hiring Demand
Remains Robust
Strong hiring plans set the stage
for faster income and spending
growth in the coming year
R
E
C
E
S
S
I
O
N
Index:
2016=100
M&TBank 2

Upbeat Consumer Outlook Bodes Well For Spending
“After hitting a 17-year high in
November, expectations remain
at historically strong levels,
suggesting growth will continue
well into 2018”
Sentiment Has Moved Sharply Higher Over Past Year
©2018 M&T Bank, Member FDIC
National Federation of Independent Business
U.S. Small Business Optimism Index
90
92
94
96
98
100
102
104
106
108
110
112
114
116
J F M A M J J A S O N D J F M A M J J A S O N D J F M A M J J A S O N D
The Conference Board
U.S. Consumer Confidence Index
85
90
95
100
105
110
115
120
125
130
135
140
145
J F M A M J J A S O N D J F M A M J J A S O N D J F M A M J J A S O N D
97.6 average
since January 1990
122.1
104.9
2015 2016 2017
2015 2016 2017
Index:
1986=100
91.5 average
since January 1990
Index:
1985=100
Small Business Optimism Is At An All-Time High
“We haven’t seen this kind of
optimism in 34 years, and we’ve
seen it only once in the 44 years
that NFIB has been conducting
this research”
M&TBank 3

$52,000
$54,000
$56,000
$58,000
$60,000
$62,000
Constant 2016 Dollars
U.S. Real Median Household Income
00 01 02 03 04 05 06 07 08 09 10 11 12 13 14 15 16
Household Income Has (Finally) Crossed an Important Threshold
Adjusted for inflation, household income is up 10.7%
since 2012 and is now 0.6% above the 1999 peak
$57,214 average
from 2000-07
$59,039
©2018 M&T Bank, Member FDIC
R
E
C
E
S
S
I
O
N
R
E
C
E
S
S
I
O
N
$53,331
$58,149
M&TBank 4Source: U.S. Census Bureau, “Income & Poverty in the United States: 2016,” September 2017
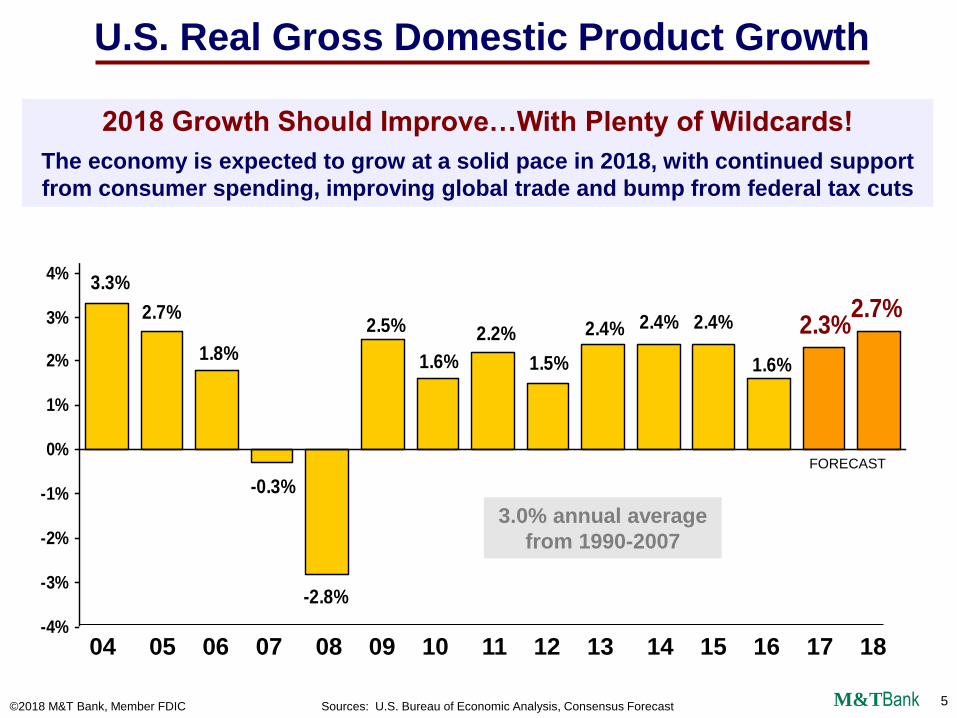
2.7%2.3%
1.6%
2.4%
3.3%
2.7%
1.8%
-0.3%
-2.8%
2.5%
1.6%
2.2% 2.4%
1.5%
2.4%
-4%
-3%
-2%
-1%
0%
1%
2%
3%
4%
5%
6%
7%
8%
9%
10%
04 05 06 07 08 09 10 11 12 13 14 15 16 17 18
Sources: U.S. Bureau of Economic Analysis, Consensus Forecast
FORECAST
5
3.0% annual average
from 1990-2007
©2018 M&T Bank, Member FDIC
2018 Growth Should Improve…With Plenty of Wildcards!
The economy is expected to grow at a solid pace in 2018, with continued support
from consumer spending, improving global trade and bump from federal tax cuts
M&TBank
U.S. Real Gross Domestic Product Growth
How’s the
Rochester Area
Performing?
$62
$63
$64
$65
$66
$67
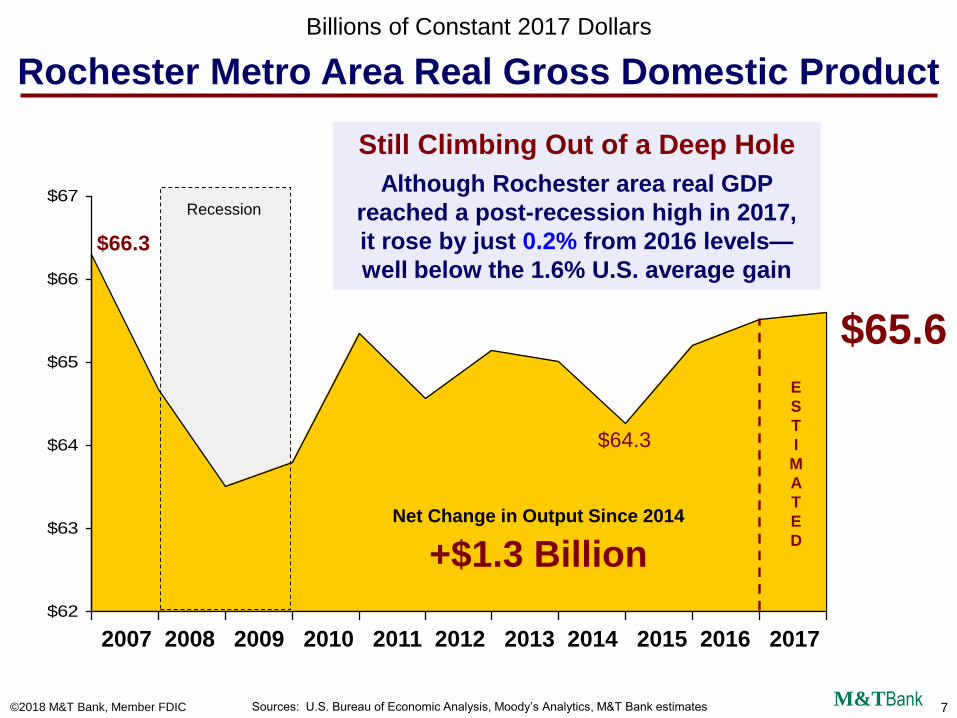
$65.6
Net Change in Output Since 2014
+$1.3 Billion
$64.3
Still Climbing Out of a Deep Hole
Although Rochester area real GDP
reached a post-recession high in 2017,
it rose by just 0.2% from 2016 levels—
well below the 1.6% U.S. average gain
Recession
Billions of Constant 2017 Dollars
Rochester Metro Area Real Gross Domestic Product
$66.3
E
S
T
I
M
A
T
E
D
M&TBank©2018 M&T Bank, Member FDIC 7Sources: U.S. Bureau of Economic Analysis, Moody’s Analytics, M&T Bank estimates
2007 2008 2009 2010 2011 2012 2013 2014 2015 2016 2017
8
390,000
395,000
400,000
405,000
410,000
415,000
420,000
425,000
430,000
435,000
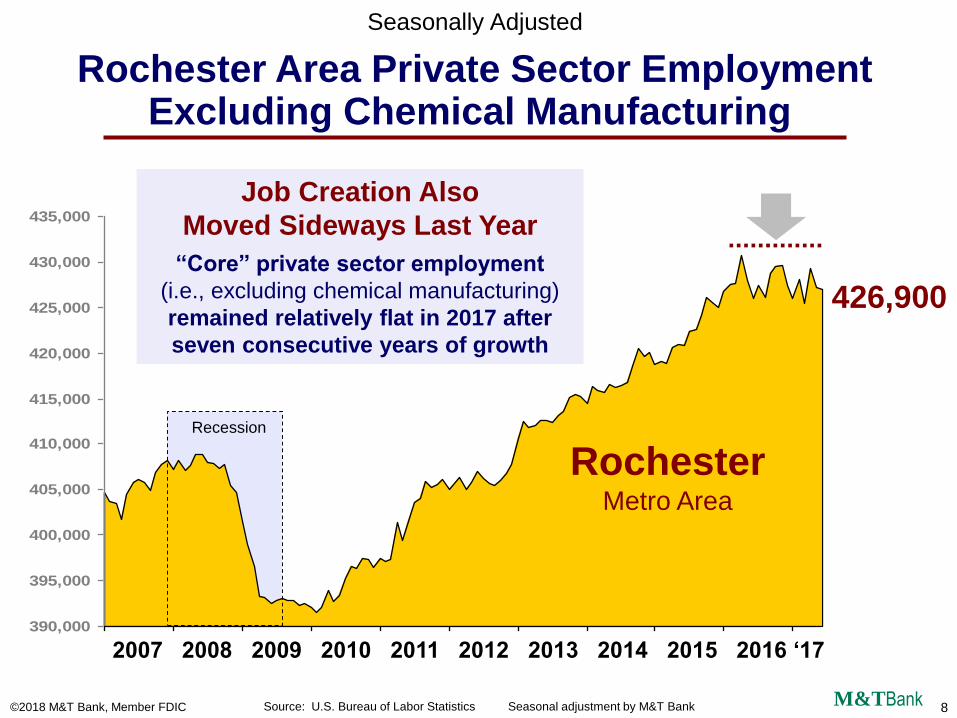
Seasonally Adjusted
Rochester Area Private Sector EmploymentExcluding Chemical Manufacturing
426,900
2007 2008 2009 2010 2011 2012 2013 2014 2015 2016 ‘17
M&TBank©2018 M&T Bank, Member FDIC Source: U.S. Bureau of Labor Statistics Seasonal adjustment by M&T Bank 8
Recession
Job Creation Also
Moved Sideways Last Year
“Core” private sector employment
(i.e., excluding chemical manufacturing)
remained relatively flat in 2017 after
seven consecutive years of growth
RochesterMetro Area

M&TBank
3%
4%
5%
6%
7%
8%
9%
10%
Seasonally Adjusted
Rochester Area and U.S. Unemployment Rate
2007 2008 2009 2010 2011 2012 2013 2014 2015 2016 2017
5.3%
4.1%Rochester data seasonally adjusted by M&T
9
July 2012
8.3%
UnitedStates
Nov. 2016
4.8%
“But Isn’t Labor Stress Continuing to Ease?”
While down three points since 2012, the Rochester area
jobless rate edged up slightly during the past year
RochesterMetro Area
©2018 M&T Bank, Member FDIC Sources: U.S. Bureau of Labor Statistics, New York State Department of Labor

So…Not Much
Good News to Get
Excited About?

-1%
0%
1%
2%
3%
4%
5%
6%
7%
J F M A M J J A S O N D J F M A M J J A S O N D J F M A M J J
+6.1%
+6.5%
2015 2016 2017
Source: U.S. Bureau of Labor Statistics Seasonal adjustment by M&T Bank
Seasonally Adjusted Relative Change Since January 2015
Rochester Area “Tech Knowledge” Job Growth*
Growth in Knowledge-Intensive
Employment Continues to Track the U.S.
Rochester area “tech knowledge” job creation has
been 93% of the U.S. average since the start of 2015
8,200 Net Increase in Jobs
United States
* Professional, scientific & technical,
computer & electronic manufacturing,
information, hospital and ambulatory
care services, private education services
11M&TBank©2018 M&T Bank, Member FDIC
RochesterMetro Area
12
-1%
0%
1%
2%
3%
4%
5%
6%
7%
Q1 Q2 Q3 Q4 Q1 Q2 Q3 Q4 Q1 Q2 Q3 Q4 Q1 Q2 Q3 Q4 Q1 Q2
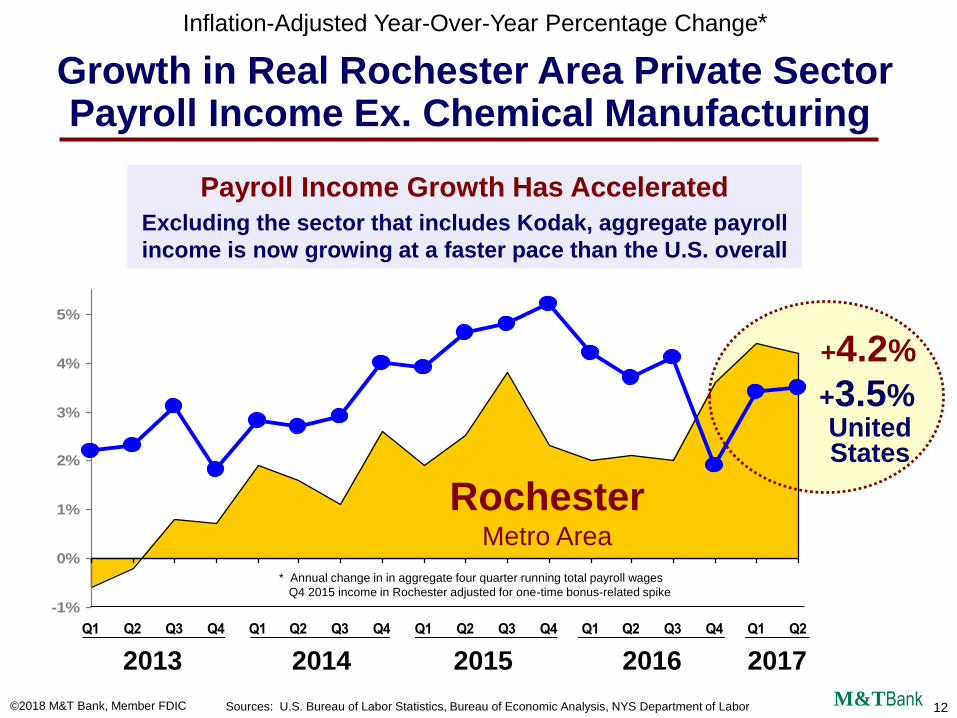
Inflation-Adjusted Year-Over-Year Percentage Change*
Growth in Real Rochester Area Private SectorPayroll Income Ex. Chemical Manufacturing
+4.2%
2013 2014 2015 2016 2017
+3.5%
* Annual change in in aggregate four quarter running total payroll wages
Q4 2015 income in Rochester adjusted for one-time bonus-related spike
M&TBank
UnitedStates
Payroll Income Growth Has Accelerated
Excluding the sector that includes Kodak, aggregate payroll
income is now growing at a faster pace than the U.S. overall
12
RochesterMetro Area
©2018 M&T Bank, Member FDIC Sources: U.S. Bureau of Labor Statistics, Bureau of Economic Analysis, NYS Department of Labor
13
$46,000
$48,000
$50,000
$52,000
$54,000
$56,000
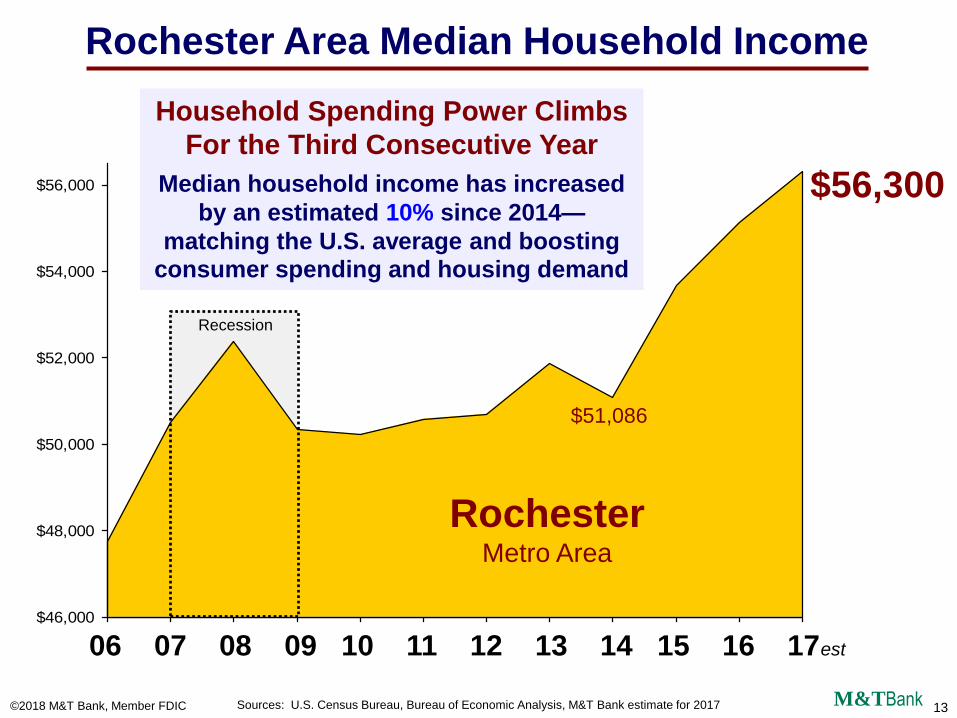
Rochester Area Median Household Income
$56,300
Household Spending Power Climbs
For the Third Consecutive Year
Median household income has increased
by an estimated 10% since 2014—
matching the U.S. average and boosting
consumer spending and housing demand
06 07 08 09 10 11 12 13 14 15 16 17est
RochesterMetro Area
M&TBank13
Recession
$51,086
©2018 M&T Bank, Member FDIC Sources: U.S. Census Bureau, Bureau of Economic Analysis, M&T Bank estimate for 2017
0%
1%
2%
3%
4%
5%
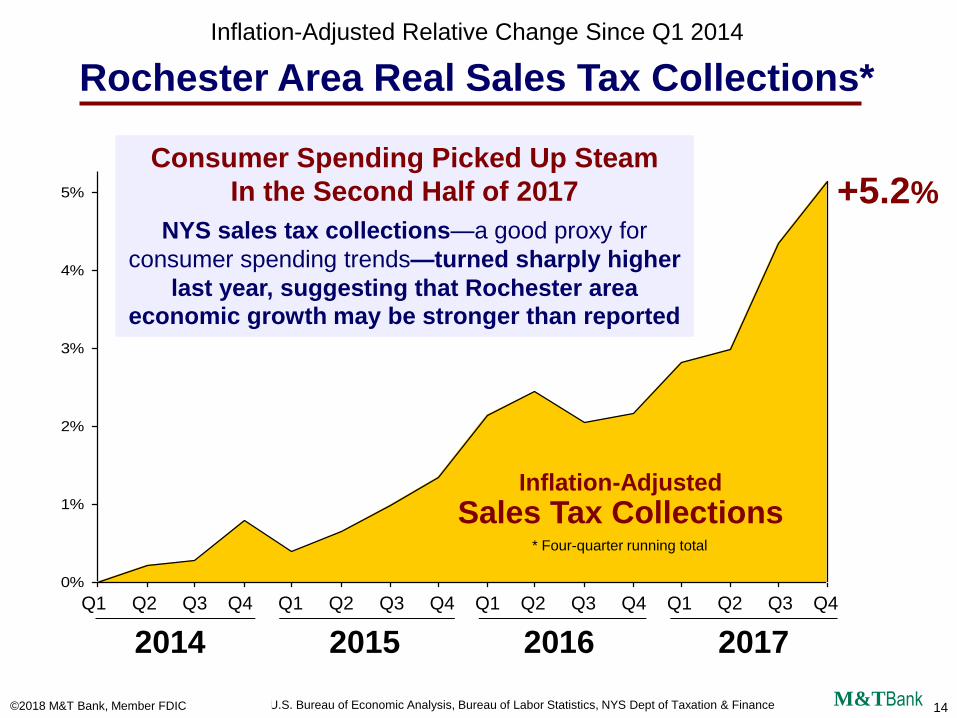
Inflation-Adjusted Relative Change Since Q1 2014
Rochester Area Real Sales Tax Collections*
+5.2%
Q1 Q2 Q3 Q4 Q1 Q2 Q3 Q4 Q1 Q2 Q3 Q4 Q1 Q2 Q3 Q4
2014 2015 2016 2017
Consumer Spending Picked Up Steam
In the Second Half of 2017
NYS sales tax collections—a good proxy for
consumer spending trends—turned sharply higher
last year, suggesting that Rochester area
economic growth may be stronger than reported
Inflation-Adjusted
Sales Tax Collections* Four-quarter running total
M&TBank14Sources: U.S. Bureau of Economic Analysis, Bureau of Labor Statistics, NYS Dept of Taxation & Finance©2018 M&T Bank, Member FDIC
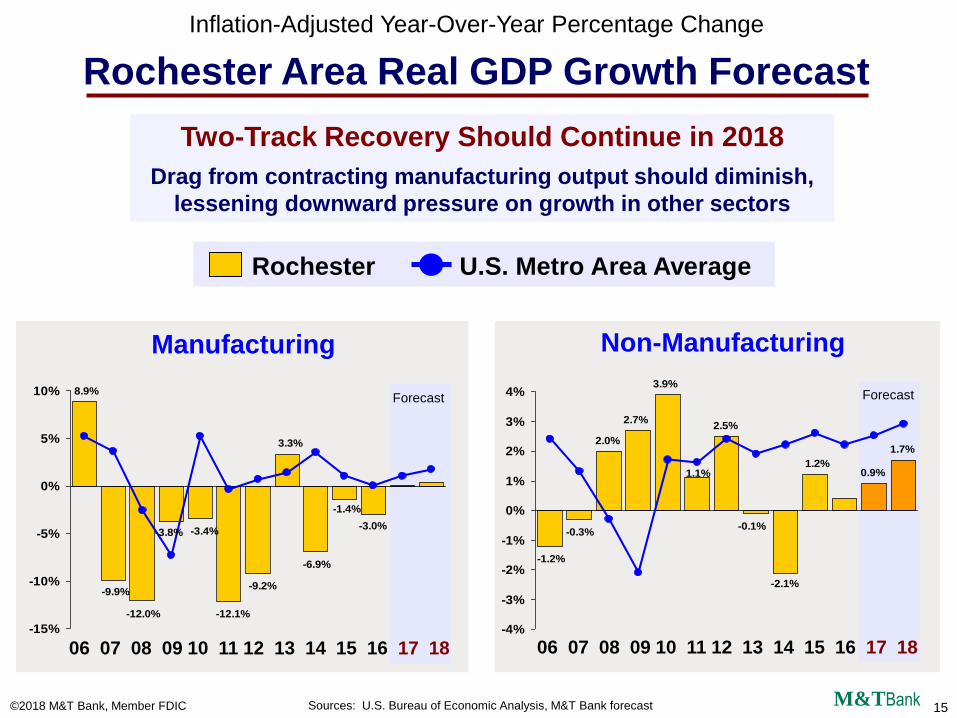
Inflation-Adjusted Year-Over-Year Percentage Change
Rochester Area Real GDP Growth Forecast
Sources: U.S. Bureau of Economic Analysis, M&T Bank forecast
Manufacturing Non-Manufacturing
Rochester U.S. Metro Area Average
-3.0%-3.4%
-12.1%
-9.9%
8.9%
-12.0%
-3.8%
-9.2%
3.3%
-6.9%
-1.4%
-15%
-10%
-5%
0%
5%
10%
06 07 08 09 10 11 12 13 14 15 16 17 18
Forecast Forecast
0.9%
1.7%
3.9%
1.1%
-0.3%
-1.2%
2.0%
2.7%2.5%
-0.1%
-2.1%
1.2%
-4%
-3%
-2%
-1%
0%
1%
2%
3%
4%
Two-Track Recovery Should Continue in 2018
Drag from contracting manufacturing output should diminish,
lessening downward pressure on growth in other sectors
M&TBank15
06 07 08 09 10 11 12 13 14 15 16 17 18
©2018 M&T Bank, Member FDIC
16
Impact on
Housing Demand
17
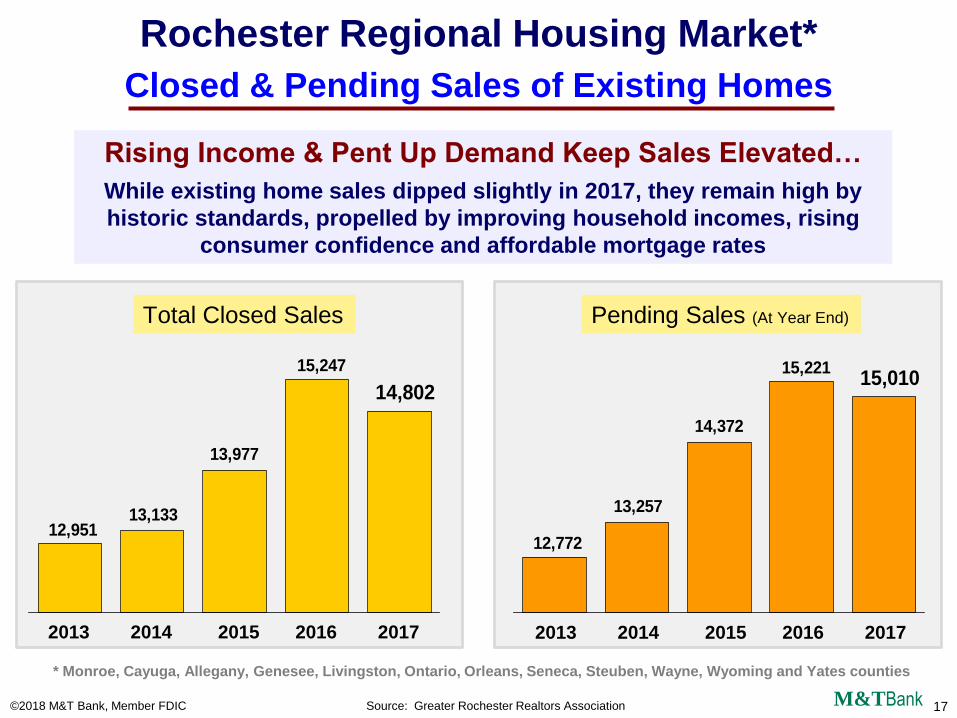
12,95113,133
13,977
15,247
14,802
2013 2014 2015 2016 2017
Rochester Regional Housing Market*
Closed & Pending Sales of Existing Homes
Total Closed Sales Pending Sales (At Year End)
Rising Income & Pent Up Demand Keep Sales Elevated…
While existing home sales dipped slightly in 2017, they remain high by
historic standards, propelled by improving household incomes, rising
consumer confidence and affordable mortgage rates
Source: Greater Rochester Realtors Association M&TBank©2018 M&T Bank, Member FDIC
* Monroe, Cayuga, Allegany, Genesee, Livingston, Ontario, Orleans, Seneca, Steuben, Wayne, Wyoming and Yates counties
17
12,772
13,257
14,372
15,22115,010
2013 2014 2015 2016 2017

18
5.1
4.5
4.0
2.82.5
Rochester Regional Housing Market*
Inventory of Existing Homes For Sale
Months Supply of Inventory
…Even as Available Supply Continues to Tighten
Inventory constraints are a major challenge, intensifying competition
for prime properties and putting upward pressure on pricing
M&TBank©2018 M&T Bank, Member FDIC 18Source: Greater Rochester Realtors Association
* Monroe, Cayuga, Allegany, Genesee, Livingston, Ontario, Orleans, Seneca, Steuben, Wayne, Wyoming and Yates counties
2013 2014 2015 2016 2017
5,446
5,0094,818
3,578
3,135
Inventory of Homes For Sale
2013 2014 2015 2016 2017

19
-0.8%
2.8%
-1.2%
4.0%
Rochester Regional Housing Market*
Median Price of Existing Homes Sold
Annual Change in Median Price
Net Result: Economics 101
Solid Demand + Less Supply = Positive Pricing Momentum
Limited inventory should continue to put upward pressure on pricing
M&TBank©2018 M&T Bank, Member FDIC 19Source: Greater Rochester Realtors Association
* Monroe, Cayuga, Allegany, Genesee, Livingston, Ontario, Orleans, Seneca, Steuben, Wayne, Wyoming and Yates counties
2014 2015 2016 2017
$124,000
$123,000
$126,500
$125,000
$130,000
Median Sales Price
2013 2014 2015 2016 2017
20
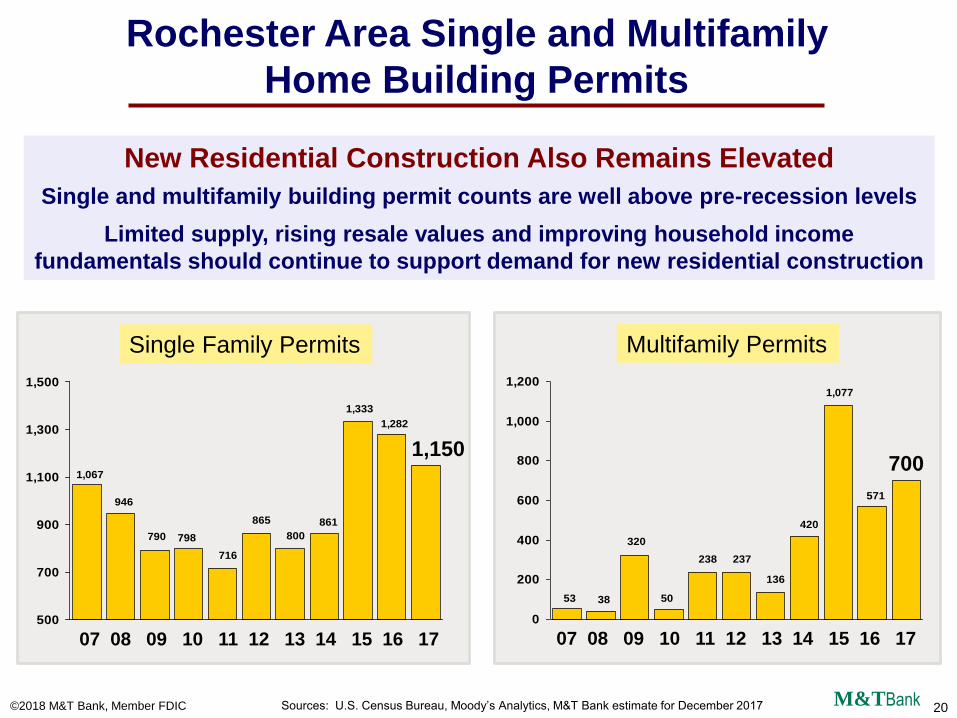
Rochester Area Single and Multifamily
Home Building Permits
Sources: U.S. Census Bureau, Moody’s Analytics, M&T Bank estimate for December 2017
716
865
946
1,067
790 798 800
861
1,333
1,282
500
700
900
1,100
1,300
1,500
07 08 09 10 11 12 13 14 15 16 17
M&TBank20
238 237
3853
320
50
136
420
1,077
571
0
200
400
600
800
1,000
1,200
07 08 09 10 11 12 13 14 15 16 17
7001,150
New Residential Construction Also Remains Elevated
Single and multifamily building permit counts are well above pre-recession levels
Limited supply, rising resale values and improving household income
fundamentals should continue to support demand for new residential construction
©2018 M&T Bank, Member FDIC
Multifamily PermitsSingle Family Permits
0.0%
0.5%
1.0%
1.5%
2.0%
2.5%
3.0%
3.5%
4.0%
4.5%
2010 2011 2012 2013 2014 2015 2016 2017 2018 2019
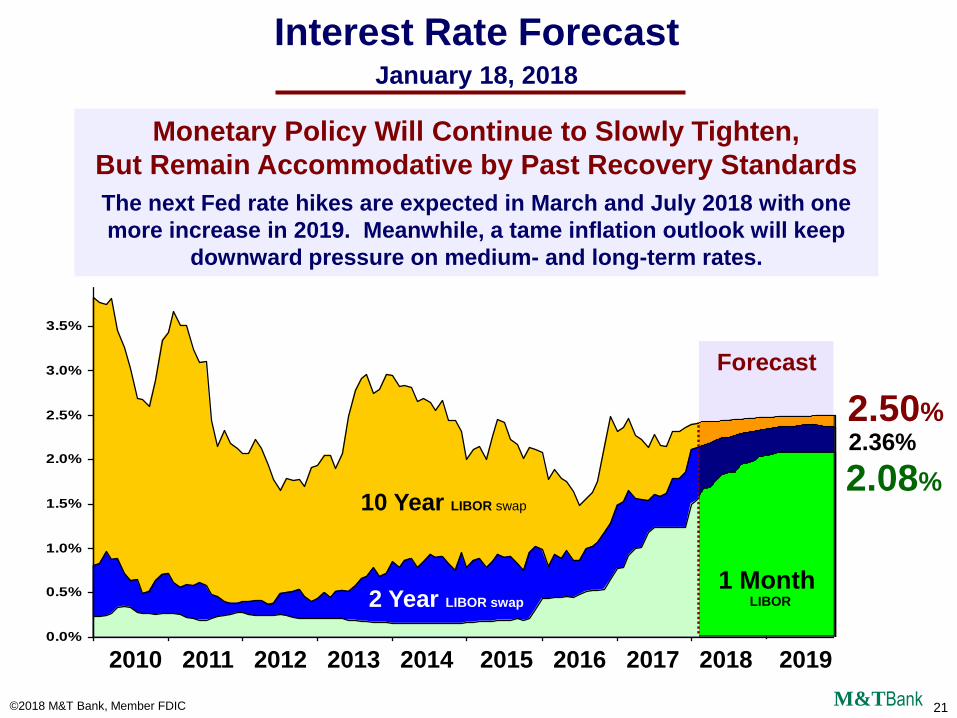
Interest Rate ForecastJanuary 18, 2018
Forecast
©2018 M&T Bank, Member FDIC
2.50%2.36%
2.08%
21M&TBank
10 Year LIBOR swap
2 Year LIBOR swap
Monetary Policy Will Continue to Slowly Tighten,
But Remain Accommodative by Past Recovery Standards
The next Fed rate hikes are expected in March and July 2018 with one
more increase in 2019. Meanwhile, a tame inflation outlook will keep
downward pressure on medium- and long-term rates.
1 MonthLIBOR

Total AverageReturns Deduction
State & LocalIncome Taxes 103,160 $8,303 49,860 $13,945
Real EstateTaxes 112,750 $6,836 50,390 $8,865
MortgageInterest Paid 92,500 $4,942 41,090 $5,895
TOTAL $20,081 $28,705
Source: Internal Revenue Service—Statistics of Income * AGI = Adjusted Gross Income
Tax Returns That Itemized Deductions:
Monroe County Federal Personal Income Tax Filers
Taking Selected Itemized Deductions—2015 Tax Year
Total AverageReturns Deduction
28% of returns 85% of returns
31% of returns 86% of returns
25% of returns 70% of returns
©2018 M&T Bank, Member FDIC 22M&TBank
Total Tax Filers AGI* of $100,000+

23
-2%
0%
2%
4%
6%
8%
10%
12%
14%
+10.6%
-0.9%
07 08 09 10 11 12 13 14 15 16
Relative Change Since 2007
Rochester Metro Area Population by Age Group
Total20 to 64
Years Old
+2.7%
35 to 64Years Old
20 to 34Years
20,848 increase
since 2007
23M&TBank
“Millennial” Demographic
Will Likely Boost Housing
Demand Over Next Few Years
The 10.6% increase in young adults
since 2007 exceeds the 9.2% U.S.
average gain
©2018 M&T Bank, Member FDIC Source: U.S. Census Bureau—American Community Survey 1-Year Estimate

24
Note: This presentation is for informational and educational purposes only. Nothing herein should be considered or relied upon as legal,
tax, accounting or financial advice. The author assumes no responsibility or liability for the specific applicability of the information
provided. Please consult your own legal counsel for any legal advice.