2019 1h interim results fubon financial holdings...credit by type total loans grew 5.1% yoy with...
TRANSCRIPT

2019.08.23
2019 1H Interim Results Fubon Financial Holdings
This meeting may contain forward-looking statements with respect to the
financial condition, results of operations and business of the company. These
forward-looking statements represent the company’s expectations or beliefs
concerning future events and involve known and unknown risks and uncertainty
that could cause actual results, performance or events to differ materially from
those expressed. Certain statements, such as those that include the words
“potential”, “estimated”, and similar expressions or variations on such
expressions may be considered “forward-looking statements”. Financial numbers
in this report may include preliminary unaudited numbers or management
accounts.
Disclaimer

Performance review by subsidiary
Taipei Fubon Bank
Fubon Life
Fubon Insurance
Fubon Securities
Overseas banking subsidiaries
Performance highlights of Fubon Financial Holdings
Agenda

Fubon Financial Holdings: Operation highlights
4
Top three position in brokerage and emerging stock trading business ETF products development in Fubon Asset Management
NIM and spread improvement from adjustment in asset and liabilities
structure
Growth in fee revenue driven by wealth management and syndication
loan
Virtual bank license of LINE Bank granted
Appointed as one of the domestic systematically important banks
Top position in terms of total premium for the 37th year with continuous
market share gains
Outstanding combined ratio performance with a focus on quality
Net profits reached NT$27.7 billion in 1H19, compared to NT$31.2bn in 1H18.
Profits came down yoy mainly from Fubon Life, while earnings growth in Taipei
Fubon Bank and Fubon Securities.
Taipei Fubon Bank
Fubon Life
Fubon Insurance
Fubon Securities
Net profits came down in 1H19 yoy due to increase in underwriting cost as
FYP growth 22% yoy, lower capital gains and one-time tax benefit in 1H18
Increase in recurring return and steady improvement in COL
Top two market position in FYPE leading to growth of VNB

2.90 2.70
1H18 1H19
Net profits came down yoy, while EPS maintained top position among peers
48.4 54.1
47.7
2016 2017 2018
4.73 5.19
4.52
2016 2017 2018
-11%
-7%
Fubon Financial Holdings: Profitability
Net profits
Earning per share (EPS)
NT$
NT$bn
5
31.2 27.7
1H18 1H19

31.2
19.1
10.2
2.6 1.2 2.0
0.4
27.7
10.9 10.9
2.1 1.4 1.7 0.7
FubonFHC
FubonLife
TaipeiFubonBank
FubonInsurance
FubonSecurities
FubonBank(HK)
FubonBank
(China)
6M18 6M19
Taipei Fubon Bank, 10.9,
39.2%
Fubon Life, 10.9 , 39.4%
Fubon Insurance, 2.1
, 7.7%
Fubon Securities, 1.4
, 5.1%
Fubon Bank (HK), 1.7 ,
6.1%
Fubon Bank (China), 0.7 ,
2.5%
Net profits from subsidiaries Profit contribution from subsidiaries
NT$bn NT$bn
Taipei Fubon Bank and Fubon Securities delivered earnings growth. Fubon Life’s earnings came
down
Close to half of the earnings contribution from the three banking subsidiaries
Note: (1) Profit contribution is based on the summation of the six
subsidiaries shown in the chart. There are four other subsidiaries with
combined net profits of NT$562mn. The inter-company account is net
-NT$466mn; (2) Net profits of Fubon Bank (China) is exclusive of the
net profits of Taipei Fubon Bank in the chart.
(2)
(2)
Fubon Financial Holdings: Net profits from major subsidiaries
6
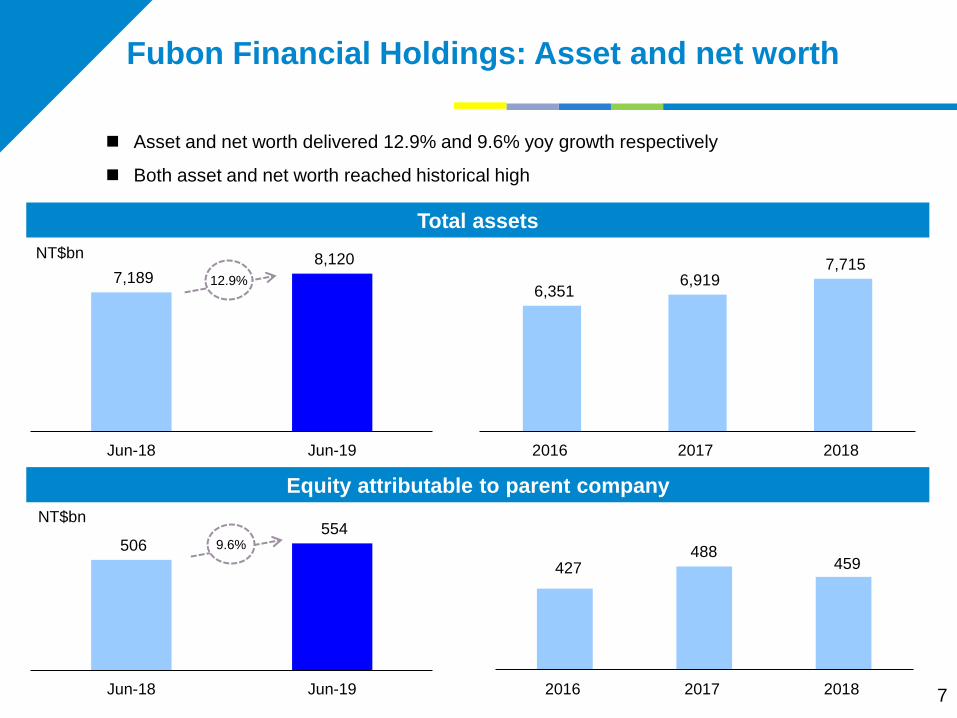
506 554
Jun-18 Jun-19
7,189 8,120
Jun-18 Jun-19
Total assets
Equity attributable to parent company
NT$bn
NT$bn
Asset and net worth delivered 12.9% and 9.6% yoy growth respectively
Both asset and net worth reached historical high
6,351 6,919
7,715
2016 2017 2018
427 488
459
2016 2017 2018
12.9%
9.6%
Fubon Financial Holdings: Asset and net worth
7

ROA
ROE
ROA and ROE came down yoy due to net profits decrease as well as asset and net worth growth
ROE maintains at benign level
0.79% 0.81%
0.65%
2016 2017 2018
12.19% 11.83%
9.98%
2016 2017 2018
Fubon Financial Holdings: ROA & ROE
8
0.88%
0.70%
1H18 1H19
12.43% 10.90%
1H18 1H19

Performance review by subsidiary Taipei Fubon Bank
Agenda

9.5% revenue growth yoy from all major line items
Revenue composition of Taipei Fubon Bank
NT$bn
Taipei Fubon Bank: Revenue
10
10.7 11.3
5.9 6.7
4.6 5.3 0.3
0.3 21.5
23.6
1H18 1H19
Others
Net treasury income
Net fee income
Net interest income
1.4%
28.5%
22.3% 1.4%
47.8%
27.3%
21.4%
49.9%
9.5%
18.0 19.4 21.7
11.5 10.9
10.9
5.0 7.5
8.5 1.3
1.0
0.3
35.8
38.8
41.4
2016 2017 2018
10
3.5%
14.1%
20.4% 19.2%
32.1%
50.3%
26.4% 28.0%
52.5% 50.1%
0.7% 2.6%

Credit by type
Total loans grew 5.1% yoy with steady growth in both corporate loans and retail loans
Contributions from mortgages and consumer loans continue to increase
Note: Ending balance
NT$bn
Taipei Fubon Bank: Credit composition
11
4.1% 3.8%
1.0% 1.1%
46.2% 46.0%
43.9% 44.1%
4.4% 4.6% 0.4% 0.4% 1,254.8
1,319.3
Jun-18 Jun-19
Credit card revolving
Other consumer loans
Mortgage loan
Corporate loan
Forfaiting & factoring
Government loan
YoY -0.9%
YoY +9.1%
YoY +5.7%
YoY +4.8%
YoY -2.9%
YoY +13.6%
5.1%

Corporate credit by currency SME credit and as % of corporate credit
NT$bn
Foreign currency credit grew 6.3% yoy mainly from overseas branches
Contribution from SME segment to total corporate credit increase, with the SME credit
outstanding increased by 6.8% yoy
NT$bn
Note: Ending balance
Taipei Fubon Bank: Corporate credit
12
348.4
0.0
231.2
12.7
348.4
243.9
361.6
1.1
245.9
13.4
362.7
259.3
NTD loan Non-NTD loan Forfaiting & factoring
6.3%
6.8%
Jun-18 Jun-19
245.6 261.9
5.4 6.2
42.4% 43.1%
Jun-18 Jun-19
Forfaiting & factoring
Loan
SME as % of corporate credit
251.0 268.2
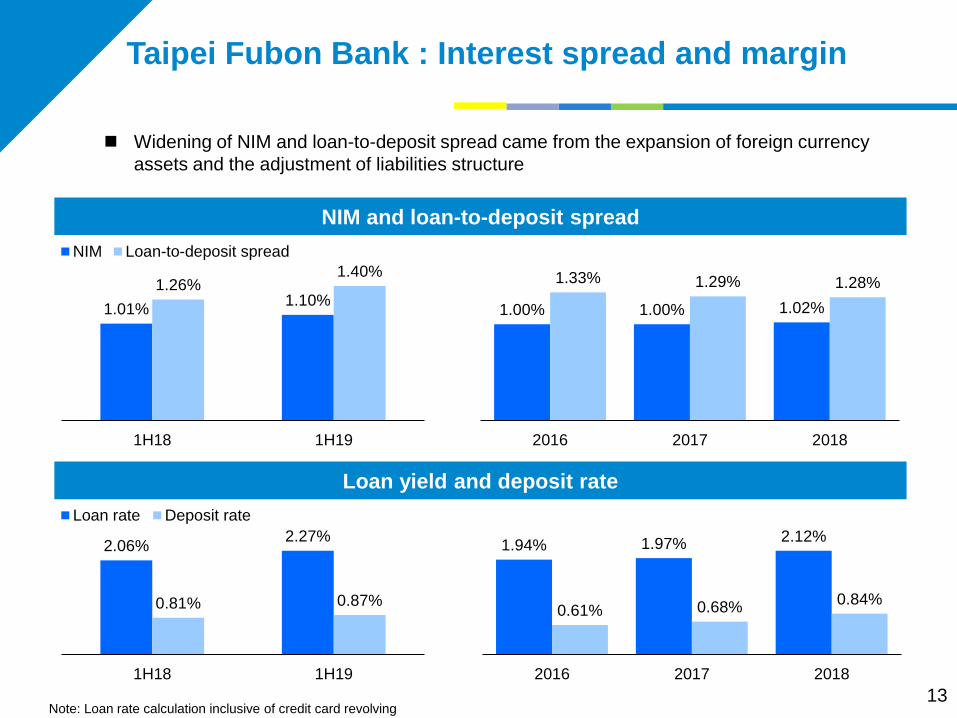
NIM and loan-to-deposit spread
Loan yield and deposit rate
Note: Loan rate calculation inclusive of credit card revolving
Widening of NIM and loan-to-deposit spread came from the expansion of foreign currency
assets and the adjustment of liabilities structure
13
1.01% 1.10%
1.26% 1.40%
1H18 1H19
NIM Loan-to-deposit spread
1.00% 1.00% 1.02%
1.33% 1.29% 1.28%
2016 2017 2018
1.94% 1.97% 2.12%
0.61% 0.68% 0.84%
2016 2017 2018
2.06% 2.27%
0.81% 0.87%
1H18 1H19
Loan rate Deposit rate
Taipei Fubon Bank : Interest spread and margin

40.9% 42.1%
59.1% 57.9%
641 616
Jun-18 Jun-19
Time
Demand
54.5% 59.8%
45.5% 40.2%
1,161 1,246
Jun-18 Jun-19
Time
Demand
NTD loan-to-deposit ratio (LDR) Deposit mix in NTD
Deposit mix in foreign currency Foreign currency LDR
Note: Ending balance
Focusing on deposit base expansion and mix adjustment. Demand deposit ratio improved in
both NTD and foreign currency deposits
Improvement in foreign deposit deployment. Foreign currency loans plus investment to foreign
deposit reached 72.8%, which is 9.8% increase yoy
Taipei Fubon Bank: Deposit mix and LDR
NT$bn
NT$bn
14
86.7% 83.6%
Jun-18 Jun-19
36.7% 40.4%
Jun-18 Jun-19
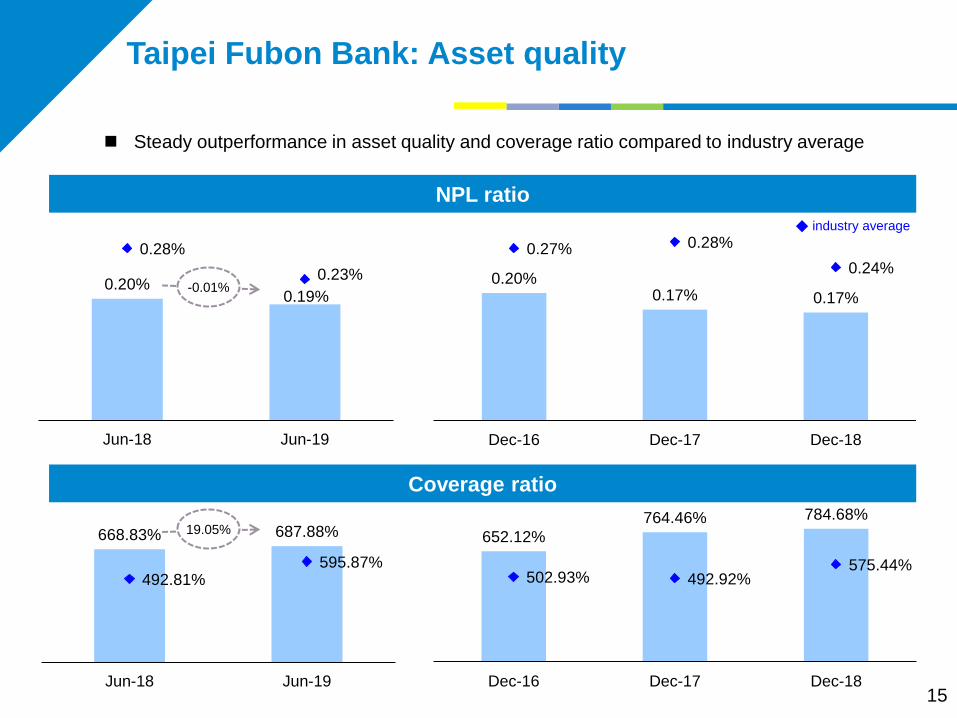
0.20% 0.17% 0.17%
0.27% 0.28%
0.24%
Dec-16 Dec-17 Dec-18
Taipei Fubon Bank: Asset quality
Steady outperformance in asset quality and coverage ratio compared to industry average
◆ industry average
NPL ratio
Coverage ratio
15
668.83% 687.88%
492.81% 595.87%
Jun-18 Jun-19
0.20% 0.19%
0.28%
0.23%
Jun-18 Jun-19
-0.01%
652.12%
764.46% 784.68%
502.93% 492.92% 575.44%
Dec-16 Dec-17 Dec-18
19.05%

Sources of fee revenue Wealth management fee
NT$mn NT$mn
Fees growth 14.3% yoy driven by double-digit growth in wealth management and syndication
loan
Wealth management fee growth 14.3% yoy mainly driven by insurance and fixed-income
products
Taipei Fubon Bank: Fee and Wealth management revenue
16
2,874 3,095
1,148 832
612 1,370 130
149
4,764
5,445
1H18 1H19
Custodianand trust
Structured,equity, andbondsproduct
Mutual funds
Insurancecommission
4,764 5,445
539
464 400
504
184
313
5,886
6,727
1H18 1H19
Others
Syndicationloan
Credit card
Wealthmanagement
14.3% 4.7%
6.9%
7.5%
80.9%
3.1%
9.2%
6.8%
80.9%
14.3%
2.7%
15.3%
25.2%
56.8%
2.7%
24.1%
12.9%
60.3%

Revenue from overseas branches up 22% yoy. Pretax profits contribution from overseas
branches reached 17.0% in Taipei Fubon Bank in 1H19 along with loan growth
Taipei Fubon Bank: Revenue and earnings from overseas branches
NT$bn
Net revenue from overseas branches
Pretax profits contribution from overseas branches in Taipei Fubon Bank
17
2.37 2.89
1H18 1H19
22%
2.92 3.27
4.64
2016 2017 2018
14.5%
17.0%
1H18 1H19
5.3%
8.1%
16.1%
2016 2017 2018

Taipei Fubon Bank: Investment in LINE Bank
25.1% stake investment in LINE Bank at NT$2.51bn
Aiming to start business in the first half of 2020. The ecosystem of LINE pave the foundation
for LINE Bank’s growth in Taiwan
18
21 million users 140 thousand merchants
Deposit
Consumer Banking
Insurance
Fund
Investment
A trusted bank

Taipei Fubon Bank: Appointed as one of the
domestic systemically important banks (D-SIB)
Capital adequacy ratio and D-SIBs capital requirements
19
Capital
adequacy
ratios
Taipei Fubon
Bank
2019Q2
(consolidated)
2019
capital
standards
D-SIBs capital requirements
2020 2021 2022 2023
CET1 10.4% 7.0% 8.0% 9.0% 10.0% 11.0%
Tier 1 11.0% 8.5% 9.5% 10.5% 11.5% 12.5%
CAR 13.1% 10.5% 11.5% 12.5% 13.5% 14.5%
Capital requirement for D-SIBs: 2ppt for D-SIB capital buffer and 2ppt for internal management
capital. 4-year implementation timeline from 2020 to 2023
Taipei Fubon Bank currently exceeds the minimum requirements for 2021. The bank aims to
accumulate capital and fully comply with the requirement within the four-year period as early as
possible
Target and planning:
• Preparation for AIRB application and adoption of new LTV methodology in
mortgage to calculate risk weighted assets
• Target to maintain steady ROE: improving asset allocation efficiency and focus on
capital light business
• Accumulating capital through earnings, and balance the needs for earnings
upstream

Performance review by subsidiary Fubon Life
Agenda

96.1 117.0
176.6 193.6
1H18 1H19
204.3 174.5 190.4
289.3 341.0 352.6
2016 2017 2018
Renewal premium
FYP
13.9% growth in total premium driven by 21.7% FYP growth
Top one market ranking in FYP. Top two in total premium and FYPE
NT$bn
493.6
543.0
35.1%
64.9% 58.6%
41.4% 33.8%
66.2%
515.4
272.7
310.6
37.7%
62.3%
35.2%
64.8%
21.7%
13.9%
Fubon Life: Total premium
21
Total premium composition

2.2% 6.3% 17.6% 12.2%
39.9% 27.0%
36.0% 50.9%
4.3%
3.6%
1H18 1H19
FYP composition
FYP growth 21.7% yoy driven by sales growth in regular-paid policies
7.2% 3.5% 2.6%
6.7% 14.8% 18.2%
36.6% 42.8% 38.4%
44.2% 34.0%
36.4%
5.3%
4.9%
4.4%
2016 2017 2018
Health, accidents and others
Traditional life: Regular paid
Traditional life: Single paid
Investment-linked
Interest-sensitive annuity
117.0
21.7% 96.1
204.3
174.5
190.4
NTD 56.5% 71.0%
43.5% 29.0% Non-NTD
76.2% 56.5% 60.3%
23.8% 43.5% 39.7%
Fubon Life: First year premium (FYP)
NT$bn
22

1H18 1H19
13.5
16.1% 13.5%
0.8% 2.4% 6.9% 5.0%
15.1% 10.1%
61.1%
69.0%
1H18 1H19
Traditional life:Regular-paid
Traditional life:Single-paid
Investment-linked
Interest-sensitiveannuity
Health, accidentsand others
NT$bn
22.6% growth in FYPE led to VNB growth of 25.3% due to meaningful growth in traditional
regular-paid policies
FYPE/
FYP 26.5% 26.7%
FYPE
Note: VNB is based on 2018 EV actuarial assumptions
NT$bn
VNB
25.5
31.3
22.6%
VNB/FYP 14.0% 14.5%
53.0% 54.1% VNB/FYPE
25.3%
Fubon Life: First year premium equivalent (FYPE) & Value of new business (VNB)
23
16.9

10.7 12.4
6.8 5.9
4.7
9.0 3.3
4.0
1H18 1H19
Other
Bancassurance:through externalbanks
Bancassurance:through TaipeiFubon bank
Tied agents
31.8 33.0
30.2 29.2
22.5
39.2
11.6
15.6
1H18 1H19
Other
Bancassurance: throughexternal banks
Bancassurance: through TaipeiFubon Bank
Tied agents
Contribution from external bank increased
Over 50% contribution coming from internal channels
FYP by channel FYPE by channel
NT$bn NT$bn
33.1%
31.4%
23.4%
12.1%
13.3%
33.6%
25.0%
28.1%
96.1
117.0
25.5
31.3
42.1%
26.6%
18.3%
13.0%
39.7%
18.7%
28.8%
12.8%
Fubon Life: Channel
24

Steady growth of investment assets with 8.0% yoy growth
Portfolio addition mainly into domestic investment assets in 1H19
Note: (1) Inclusive of NTD-denominated ETF
(2) Inclusive of OTC-listed international bond. The international bonds investment reached 16.7% of total investment assets as of 2019/06/30
NT$bn 2018/06/30 2019/03/31 2019/06/30
Deposit and cash equivalent 120.6 3.4% 216.4 5.7% 174.9 4.5%
Domestic fixed income(1) 429.6 12.0% 500.6 13.2% 557.5 14.5%
Overseas fixed income(2) 2,040.2 57.1% 2,093.8 55.3% 2,089.0 54.2%
Domestic equity 382.9 10.7% 345.1 9.1% 370.2 9.6%
Overseas equity 192.0 5.4% 188.4 5.0% 197.8 5.1%
Mortgage loans 133.9 3.8% 147.6 3.9% 151.5 3.9%
Policy loans 65.5 1.8% 68.6 1.8% 69.0 1.8%
Real estate 206.7 5.8% 228.4 6.0% 247.3 6.4%
Total Investments 3,571.4 100.0% 3,788.9 100.0% 3,857.2 100.0%
Domestic 1,268.9 35.5% 1,394.1 36.8% 1,448.9 37.6%
Overseas 2,302.5 64.5% 2,394.8 63.2% 2,408.3 62.4%
Fubon Life: Investment portfolio
25
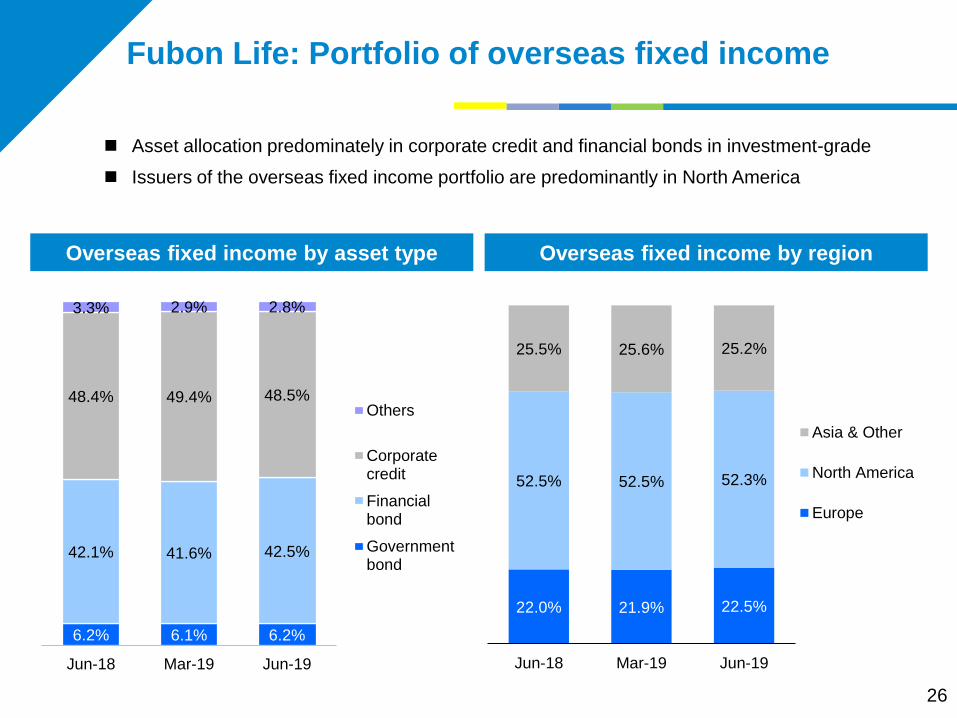
Overseas fixed income by region Overseas fixed income by asset type
Asset allocation predominately in corporate credit and financial bonds in investment-grade
Issuers of the overseas fixed income portfolio are predominantly in North America
26
6.2% 6.1% 6.2%
42.1% 41.6% 42.5%
48.4% 49.4% 48.5%
3.3% 2.9% 2.8%
Jun-18 Mar-19 Jun-19
Others
Corporatecredit
Financialbond
Governmentbond
22.0% 21.9% 22.5%
52.5% 52.5% 52.3%
25.5% 25.6% 25.2%
Jun-18 Mar-19 Jun-19
Asia & Other
North America
Europe
Fubon Life: Portfolio of overseas fixed income

NT$bn 1H18 1H19 YoY
growth 2016 2017 2018
Recurring investment income 55.5 61.9 11.4% 105.8 114.4 126.5
Interest income 47.7 50.6 6.0% 78.2 85.5 98.5
Cash dividend income from equity investment 3.7 3.7 -1.2% 14.9 18.8 18.9
Rental and others(1) 4.1 7.6 84.5% 12.7 10.1 9.1
Realized gains from fixed income investment 6.1 12.5 102.9% 24.1 14.1 8.9
Realized gains from equity investment 20.1 10.9 -45.9% 11.0 26.1 26.4
FX and others -14.1 -18.3 30.0% -17.0 -29.9 -34.8
Investment income 67.6 67.0 -0.9% 123.9 124.7 127.0
Total investment assets 3,571.4 3,857.2 8.0% 3,118.4 3,386.3 3,622.3
Investment return (before hedge) 4.73% 4.47% 4.84% 4.76% 4.63%
Investment return (after hedge) 3.89% 3.65% 4.30% 3.93% 3.62%
Investment income primarily came from recurring investment, with growth primarily came from interest income of bond investment and dividend income of mutual fund
Capital gain contribution from fixed income investments increased
Note: (1) ) Including interest income from fund investments 27
Fubon Life: Composition of investment income

-130 -114 -127 -101
-1 -14 -21
-7
1H18 1H19 1Q19 2Q19 CS+NDF cost
FX gain/loss &net provision ofFX reserve
Hedging cost & FX gain/loss FX position
Recurring return
Equity and fund
15.1%
Bond and cash
84.9%
Recurring hedging costs came down along with narrowing interest spread between Taiwan and US
With US dollar strengthening in 2Q19, un-hedged positions as percentage of total FX assets increased qoq. Dynamic management in hedging composition in response to market conditions
Increase in recurring return both in pre-hedged and after-hedged basis
-131bps -148bps -128bps
Fubon Life: Hedging composition
28
-108bps
3.22% 3.33%
2.39% 2.61%
1H18 1H19
Beforehedge
Afterhedge
Currency swap, NDF,
FX policy, 83.5%
Naked USD, 13.9%
Other
currencies
, 2.6%

29
Improvement in COL as the new business average down the total cost level
Increase in breakeven point due to higher FYP growth leading to first year strain
Breakeven point = (Profit before tax – Investment income) / Average investment assets
Cost of liability
Breakeven point
3.78% 3.72%
3.67%
Dec-16 Dec-17 Dec-18
3.19%
2.86% 2.81%
Dec-16 Dec-17 Dec-18
3.68% 3.65%
Jun-18 Jun-19
2.73% 2.89%
Jun-18 Jun-19
Fubon Life: Cost of liability & Breakeven point

255.5 292.5
Jun-18 Jun-19
-52.7
7.2 26.4
-10.6
70.6 -10.4
29.6
Dec-18 Mar-19 Jun-19
Unrealized balance in FVOCI&FVTPL overlay and the movement
Increase in unrealized balance coming from the mark-to-market value from fixed income
assets rebound and other financial assets, which led to increase in shareholder’s equity
NT$bn
Shareholders’ equity
NT$bn
Realized
gains
Dividend
income &
MTM
213.5
272.9
200.9
Dec-16 Dec-17 Dec-18
Note: Ending balance of AC as of Jun 19 was NT$58.2bn, compared to -NT$2.0bn as of Mar 19.
Fubon Life: Investment performance
30
Dividend
income &
MTM
Realized
gains

Performance review by subsidiary Fubon Insurance
Agenda

55.6% 57.3%
33.6% 33.6%
1H18 1H19
Net expense ratio
Net claim ratio
66.2% 65.1%
33.8% 34.9%
1H18 1H19
Commercialline
Personal line
Net combined ratio
NT$bn
Top 1 position with 24.5% market share, 0.4% increase yoy
8.6% premium growth yoy outperformed the industry average
Moderate increase in net combined ratio due to claims in commercial line
Note: Standalone basis
Direct written premium by product
20.4
22.1 90.9% 89.2% 8.6%
Fubon Insurance: Operating snapshot
32
Note: Inclusive of auto compulsory

71.2% 69.6%
28.8%
30.4%
1H18 1H19
Commercial line
Personal line
Net combined ratio Gross written premium
Focus on quality business, including health insurance and commercial lines. Top 9 position in
terms of premium among foreign P&C in China
Expense ratio has been well controlled, while loss ratio increase due to claims increase in auto
insurance and commercial line
RMB$mn
466.5
427.2
Fubon P&C (China): Business progress
33
47.2% 59.8%
26.0%
20.2%
31.2% 33.3%
1H18 1H19
Fixed Exp.Ratio
VariableExp.Ratio
Loss Ratio
104.4%
113.3%

Performance review by subsidiary Fubon Securities
Agenda

Top three positions in brokerage and
emerging stock trading business
Fubon Asset Management’s AUM of
ETF growth 60% yoy
Revenue up 1.6% yoy due to gains from
capital market; net profits increase
18.6% yoy with one-off expected credit
loss recognition in 1H18 from client
default in Fubon Futures
1H19 Ranking 1H18 Ranking
Brokerage 5.43% 3 6.16% 3
Emerging stock trading 20.19% 2 24.15% 2
IPO+SPO Amount 3.74% 8 27.25% 1
AUM of ETF (NT$mn) 169,500 4 106,200 2
Fubon Securities: Operating snapshot
NT$mn NT$mn
35
3,933 3,996
1H18 1H19
1,180
1,400
1H18 1H19
1.6% 18.6%
Market share & ranking
Net profits Operating revenue

Performance review by subsidiary Overseas banking subsidiaries
Agenda

103 106
Jun-18 Jun-19
13 15
Jun-18 Jun-19
48 50
Jun-18 Jun-19
66 69
Jun-18 Jun-19
Loans growth up 4.7% yoy mainly driven by corporate loans
Deposits growth up 4.0% yoy. Deposits growth in response to market liquidity
Fubon Bank (Hong Kong): Key balance sheet items
37
Assets Net worth
Deposits Loans
4.7%
4.0%
3.6%
9.8%
HK$bn

500
389
1H18 1H19
1.55% 1.50%
1H18 1H19
Net profits decreased 22% yoy mainly due to the difference in earning recognition of Xiamen
Bank. Core earning remained stable excluding one-off items
NIM came down mainly due to increase in HIBOR leading to higher deposit cost
Stable asset quality with NPL ratio down to 0.45%
Note: (1) Annualized basis (2) Coverage ratio = (Allowance for loan losses + Secured balance) / NPL
Fubon Bank (Hong Kong): Financial highlight
ROAA & ROAE (1)
NIM Net Profits
NPL ratio & Coverage ratio (2)
HK$m
38
1.00% 0.74%
7.18%
5.43%
1H18 1H19
ROAA ROAE
-22% -0.05%
0.53% 0.45%
81.8% 91.0%
Jun-18 Jun-19
NPL ratio Coverage ratio

5,586 5,876
Jun-18 Jun-19
64,289
83,030
Jun-18 Jun-19
Balance sheet growth as deposit and loan reached record high level with 44.3% and
23.1% yoy growth, respectively, leading to assets up 29.2% yoy
Fubon Bank (China): Key balance sheet items
39
Assets Net worth
Deposits Loans
37,883
54,656
Jun-18 Jun-19
25,025 31,940
4,051
3,850 29,076
35,790
Jun-18 Jun-19
Loans Rediscount
23.1% 44.3%
29.2% 5.2%
RMB$m

91
164
1H18 1H19
Fubon Bank (China): Financial highlight
Net profits increased by 81% yoy, mainly due to growth of net interest income and treasury
2bps increase in NIM due to the deposit expansion strategy offset the increase in lending
rate and loans balance
Stable asset quality with NPL ratio down to 1.29%
RMB$m
40
0.27% 0.43%
3.29%
5.63%
1H18 1H19
ROAA ROAE
1.70% 1.72%
1H18 1H19
0.02%
81%
NIM Net Profits
ROAA & ROAE (1) NPL ratio & Coverage ratio
Note: (1) Annualized basis
1.49% 1.29%
168.0% 147.4%
Jun-18 Jun-19
NPL ratio Coverage ratio

Thank you

Fubon Financial - Financial summary
NT$ millions, except for percentages 1H19 1H18 YoY 2Q19 1Q19 2018 2017 YoY
Income Statement DataNet interest income 68,871 62,586 10.0% 34,338 34,533 129,948 113,212 14.8%Insurance income 98,647 116,003 -15.0% 33,919 64,728 235,827 250,970 -6.0%Net gains (losses) on FX and financial assets 30,851 27,458 12.4% 18,667 12,183 44,373 40,612 9.3%Others (4,061) 1,784 N.M. (2,362) (1,699) 785 1,351 -41.9%Net revenue 194,307 207,831 -6.5% 84,562 109,745 410,933 406,145 1.2%Bad debt expense and reserve for guarantee (1,262) (775) 62.8% (1,134) (128) (1,463) (2,914) -49.8%Net change in insurance reserve (130,030) (141,700) -8.2% (50,586) (79,444) (293,423) (289,890) 1.2%Operating expense (30,408) (27,691) 9.8% (15,570) (14,838) (58,432) (55,290) 5.7%Income before tax 32,608 37,665 -13.4% 17,273 15,335 57,615 58,051 -0.7%Net income 27,772 31,157 -10.9% 15,203 12,569 47,721 54,016 -11.7%Net income to parent company 27,669 31,173 -11.2% 15,168 12,501 47,729 54,122 -11.8%
Balance Sheet DataTotal assets 8,119,735 7,188,839 12.9% 8,119,735 7,840,013 7,715,060 6,919,454 11.5%Equity attributable to parent company 554,073 505,587 9.6% 554,073 537,807 459,243 488,432 -6.0%Outstanding common shares (million shares) 10,234 10,234 0.0% 10,234 10,234 10,234 10,234 0.0%
Key MetricsROA 0.70% 0.88% 0.76% 0.65% 0.65% 0.81%ROE 10.90% 12.43% 11.11% 10.01% 9.98% 11.83%Equity / assets 6.96% 7.04% 6.96% 6.99% 6.08% 7.06%Double leverage 111.94% 108.19% 111.94% 110.28% 112.09% 115.00%Capital adequacy ratio 115.71% 127.76% 119.21% 129.50%Cash dividend per share 2.00 2.30

Fubon Life - Financial summary
NT$ millions, except for percentages 1H19 1H18 YoY 2Q19 1Q19 2018 2017 YoY
Income statement dataFirst year premium 116,981 96,096 21.7% 52,429 64,552 190,379 174,460 9.1%Retained earned premium 315,423 251,405 25.5% 159,265 156,159 504,821 479,885 5.2%Total investment income 72,034 68,142 5.7% 38,540 33,494 130,738 125,578 4.1% Recurring investment income 66,135 55,953 18.2% 35,220 30,916 129,313 114,891 12.6% Other investment income 5,899 12,189 -51.6% 3,320 2,578 1,425 10,688 -86.7% Realized gains (losses) from fixed income 12,617 6,040 108.9% 7,049 5,568 8,833 14,080 -37.3% Realized gains (losses) from equity 11,184 20,219 -44.7% 4,572 6,612 26,487 26,094 1.5% FX and others (16,272) (14,109) 15.3% (7,219) (9,052) (34,739) (29,088) 19.4% Investment property fair value movement (1,630) 39 N.M. (1,081) (550) 844 (398) N.M.Other income 1,803 1,319 36.7% 1,005 798 2,814 2,203 27.7%Total operating revenue 389,260 320,865 21.3% 198,810 190,451 638,374 607,666 5.1%Retained claim payment 223,669 142,111 57.4% 128,687 94,982 282,453 242,452 16.5%Net commission expense 15,088 11,524 30.9% 7,510 7,578 23,764 24,277 -2.1%Net change in insurance liability 126,908 140,037 -9.4% 48,334 78,574 287,912 291,922 -1.4%General and administrative expense 9,778 7,912 23.6% 5,068 4,710 17,174 15,867 8.2%Other operating costs 1,802 1,543 16.8% 880 922 3,308 2,980 11.0%Total operating costs and expenses 377,244 303,128 24.5% 190,478 186,766 614,610 577,498 6.4%Net non-operating income / (expenses) 228 251 -8.9% 98 131 333 288 15.5%Income before tax 12,244 17,989 -31.9% 8,430 3,815 24,097 30,456 -20.9%Net income 11,024 19,084 -42.2% 7,883 3,141 24,979 32,488 -23.1%Net income to parent company 10,896 19,084 -42.9% 7,828 3,069 24,930 32,488 -23.3%
Balance sheet dataTotal assets 4,615,915 3,857,458 19.7% 4,615,915 4,495,472 4,385,528 3,662,772 19.7%Total assets (general account) 4,237,221 3,698,034 14.6% 4,237,221 4,144,290 4,016,093 3,507,557 14.5%Insurance liabilities 3,754,975 3,290,850 14.1% 3,754,975 3,700,732 3,620,795 3,136,523 15.4%Total liabilities 4,312,339 3,601,921 19.7% 4,312,339 4,219,626 4,175,279 3,389,882 23.2%Total liabilities (general account) 3,937,216 3,442,498 14.4% 3,937,216 3,869,907 3,805,434 3,234,667 17.6%Equity attributable to parent company 292,479 255,537 14.5% 292,479 265,692 200,859 272,890 -26.4%
Key MetricsROA 0.49% 1.01% 0.69% 0.28% 0.62% 0.93%ROE 8.80% 14.19% 11.22% 5.24% 10.32% 13.36%Equity / Assets 6.58% 6.62% 6.58% 6.14% 4.79% 7.45%Expense ratio 3.10% 3.15% 3.18% 3.02% 3.40% 3.31%Persistency ratio - 13th month 96.47% 97.42% 96.47% 96.29% 96.95% 97.96%Persistency ratio - 25th month 95.36% 96.69% 95.36% 96.24% 96.44% 95.09%

Taipei Fubon Bank - Financial summary
NT$ millions, except for percentages 1H19 1H18 YoY 2Q19 1Q19 2018 2017 YoY
Income statement dataInterest income 30,192 27,206 11.0% 15,319 14,873 55,931 45,934 21.8%Interest expense (16,389) (14,109) 16.2% (8,349) (8,040) (29,606) (22,382) 32.3%Net interest income 13,803 13,098 5.4% 6,970 6,833 26,325 23,552 11.8%Net fee income 6,767 6,019 12.4% 3,535 3,232 11,135 11,232 -0.9%Other income 5,898 4,429 33.2% 2,612 3,285 8,386 7,848 6.8%Total net revenue 26,468 23,546 12.4% 13,117 13,351 45,846 42,633 7.5%Operating expenses (12,043) (10,939) 10.1% (6,109) (5,934) (22,912) (21,188) 8.1%Pre-provision profits 14,425 12,607 14.4% 7,008 7,416 22,935 21,445 6.9%Provision for credit losses (995) (369) 170.1% (947) (49) (797) (2,183) -63.5%Income before tax 13,429 12,239 9.7% 6,062 7,368 22,138 19,262 14.9%Net income 11,318 10,397 8.9% 5,169 6,149 18,826 16,931 11.2%Net income to parent company 11,065 10,292 7.5% 5,030 6,036 18,619 16,778 11.0%
Balance sheet dataLoans and discounts, net 1,487,086 1,387,768 7.2% 1,487,086 1,383,532 1,397,995 1,383,755 1.0%Deposits and remittances 2,145,530 2,007,192 6.9% 2,145,530 2,040,970 2,032,282 2,067,918 -1.7%Allowance for loan losses* 16,947 16,453 3.0% 16,947 16,582 16,632 16,142 3.0%Total assets 2,849,773 2,698,270 5.6% 2,849,773 2,712,520 2,711,118 2,671,307 1.5%Equity attributable to parent company 191,859 178,232 7.6% 191,859 192,608 185,886 178,604 4.1%
Key metricsROA 0.81% 0.77% 0.74% 0.91% 0.70% 0.67%ROE 11.72% 11.54% 10.47% 12.76% 10.22% 9.50%Equity / assets 7.39% 7.30% 7.39% 7.80% 7.54% 7.43%Cost / income ratio -45.50% -46.46% -46.57% -44.45% -49.97% -49.70%NPL ratio* 0.19% 0.20% 0.19% 0.18% 0.17% 0.17%Reserve / NPL* 687.88% 668.83% 687.88% 766.99% 784.68% 764.46%Tier 1 ratio* 12.19% 11.48% 12.39% 12.11%BIS ratio* 13.69% 13.02% 13.98% 13.93%
Note: 1. Data mark with * are stand-alone basis

Fubon Insurance - Financial summary
NT$ millions, except for percentages 1H19 1H18 YoY 2Q19 1Q19 2018 2017 YoY
Income statement dataDirect written premiums 23,907 22,381 6.8% 12,220 11,687 42,780 40,837 4.8%Retention of earned premiums 17,576 16,575 6.0% 8,891 8,685 33,661 32,453 3.7%Net income from investment 1,590 1,937 -17.9% 728 862 3,002 2,737 9.7%Other operating revenue 854 775 10.3% 481 374 1,431 1,285 11.3%Retained insurance payments 9,866 9,259 6.5% 5,152 4,714 18,521 17,370 6.6%Net change in liability reserve (7) (341) -98.1% (111) 104 8 648 -98.8%Commission and operating expenses 7,645 7,310 4.6% 3,946 3,699 14,830 14,434 2.7%Non-Operating Income (136) (103) 31.5% (84) (52) (440) (276) 59.2%Income before tax 2,381 2,955 -19.4% 1,028 1,352 4,294 3,747 14.6%Net income 2,040 2,570 -20.6% 860 1,180 3,710 3,338 11.1%Net income to parent company 2,119 2,603 -18.6% 926 1,193 3,858 3,631 6.3%
Balance sheet dataTotal assets 105,528 99,759 5.8% 105,528 103,321 97,721 97,667 0.1%Investment assets 71,811 67,450 6.5% 71,811 71,321 68,033 68,399 -0.5%Policy reserve 53,914 52,725 2.3% 53,914 52,595 51,769 51,353 0.8%Equity attributable to parent company 33,537 30,633 9.5% 33,537 33,737 30,216 31,241 -3.3%
Key MetricsROA 4.01% 5.21% 3.29% 4.69% 3.80% 3.40%ROE 13.29% 16.83% 11.01% 14.93% 12.56% 11.95%Total investment return 4.55% 5.70% 4.15% 4.95% 4.40% 4.11%Solvency margin (NWP/equity) 111.11% 116.28% 111.84% 109.72% 115.02% 105.49%Retention ratio 73.22% 74.62% 72.04% 74.45% 75.80% 75.85%

Fubon Securities - Financial summary
NT$ millions, except for percentages 1H19 1H18 YoY 2Q19 1Q19 2018 2017 YoY
Income statement dataBrokerage commissions 1,722 2,259 -23.8% 915 807 4,208 3,795 10.9%Net interest income 402 556 -27.6% 210 192 1,028 987 4.1%Fee income 498 434 14.6% 240 258 882 694 27.2%Net principal transactions and financial products gains 583 272 114.7% 174 409 (67) 1,124 N.M.Other income 791 411 92.3% 457 334 1,604 1,599 0.3%Total operating revenue 3,996 3,933 1.6% 1,996 2,000 7,649 8,194 -6.7%Total operating expense (2,987) (3,000) -0.5% (1,485) (1,502) (6,035) (5,962) 1.2%Net non-operating income / (expenses) 541 430 25.6% 231 310 876 785 11.6%Income before tax 1,549 1,359 14.0% 741 808 2,500 3,017 -17.1%Net income 1,400 1,174 19.3% 662 738 2,080 2,806 -25.9%Net income to parent company 1,400 1,180 18.6% 662 738 2,090 2,817 -25.8%
Balance sheet dataMargin loans 10,125 15,441 -34.4% 10,125 11,210 9,949 14,420 -31.0%Total assets 139,464 146,201 -4.6% 139,464 137,496 123,228 125,210 -1.6%Equity attributable to parent company 36,243 34,668 4.5% 36,243 36,602 35,427 33,755 5.0%
Key MetricsROA 2.13% 1.73% 1.91% 2.26% 1.67% 2.48%ROE 7.81% 6.90% 7.27% 8.20% 5.94% 8.49%Equity / assets 25.99% 23.71% 25.99% 26.62% 28.75% 26.96%Expenses / revenues -74.74% -76.29% -74.38% -75.10% -78.90% -72.76%Margin loans / total assets 7.26% 10.56% 7.26% 8.15% 8.07% 11.52%Margin loans / shareholders' equity 27.94% 44.54% 27.94% 30.63% 28.08% 42.72%

Fubon Bank (Hong Kong) - Financial Summary
HK$ millions, except for percentages 1H19 1H18 YoY 2018 2017 YoY
Income Statement DataInterest income 1,577 1,246 26.6% 2,708 2,181 24.2%Interest expense (882) (574) 53.7% (1,352) (965) 40.1%Net interest income 696 673 3.4% 1,356 1,216 11.5%Net fee income 162 165 -1.7% 289 318 -9.1%Other income 19 36 -48.0% 42 4 1067.8%Total revenue 877 874 0.3% 1,688 1,538 9.7%Operating expenses (405) (469) -13.7% (965) (950) 1.5%Provision for loan losses/ write-back 1 (25) N.M. (49) (68) -27.8%Net non-operating income 0 212 -100.0% 250 174 44.0%Income before tax 472 591 -20.1% 924 693 33.3%Net income 389 500 -22.2% 823 583 41.0%
Balance Sheet DataGross loans 50,246 47,971 4.7% 47,930 47,872 0.1%Customers Deposits 69,020 66,349 4.0% 68,248 62,068 10.0%Allowance for loan losses 221 218 1.5% 231 289 -20.2%Total assets 106,288 102,622 3.6% 102,787 98,484 4.4%Shareholders' equity 14,636 13,335 9.8% 14,024 12,861 9.0%
Key metricsReturn on average assets 0.74% 1.00% 0.82% 0.60%Return on average equity 5.43% 7.18% 5.61% 4.81%Equity / assets 13.77% 12.99% 13.64% 13.06%Net fee income / total revenue 18.53% 18.92% 17.14% 20.70%Cost / income ratio -46.21% -53.73% -57.16% -61.79%NPL ratio 0.45% 0.53% 0.49% 0.39%Reserve / NPL 98.27% 86.26% 98.88% 154.31%Gross Loans/Customers Deposits ratio 72.80% 72.30% 70.23% 77.13%Tier 1 ratio 16.73% 14.82% 16.75% 15.42%BIS ratio 20.04% 18.56% 20.60% 19.42%
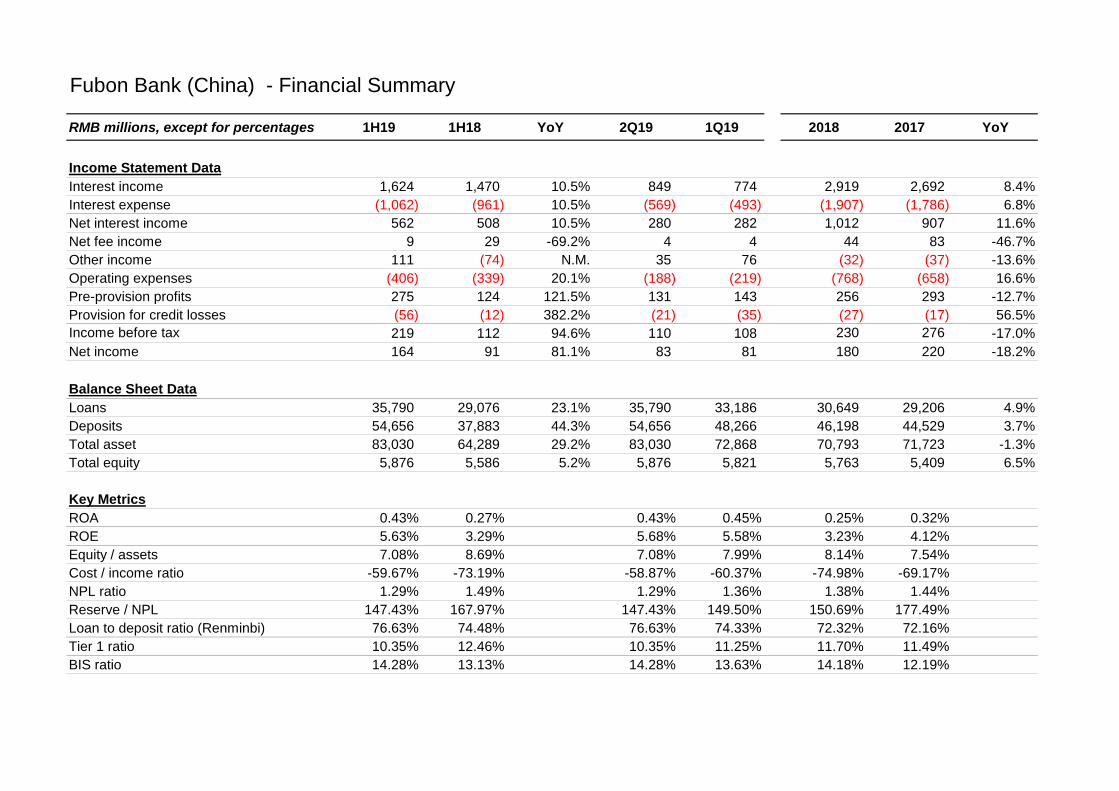
Fubon Bank (China) - Financial Summary
RMB millions, except for percentages 1H19 1H18 YoY 2Q19 1Q19 2018 2017 YoY
Income Statement DataInterest income 1,624 1,470 10.5% 849 774 2,919 2,692 8.4%Interest expense (1,062) (961) 10.5% (569) (493) (1,907) (1,786) 6.8%Net interest income 562 508 10.5% 280 282 1,012 907 11.6%Net fee income 9 29 -69.2% 4 4 44 83 -46.7%Other income 111 (74) N.M. 35 76 (32) (37) -13.6%Operating expenses (406) (339) 20.1% (188) (219) (768) (658) 16.6%Pre-provision profits 275 124 121.5% 131 143 256 293 -12.7%Provision for credit losses (56) (12) 382.2% (21) (35) (27) (17) 56.5%Income before tax 219 112 94.6% 110 108 230 276 -17.0%Net income 164 91 81.1% 83 81 180 220 -18.2%
Balance Sheet DataLoans 35,790 29,076 23.1% 35,790 33,186 30,649 29,206 4.9%Deposits 54,656 37,883 44.3% 54,656 48,266 46,198 44,529 3.7%Total asset 83,030 64,289 29.2% 83,030 72,868 70,793 71,723 -1.3%Total equity 5,876 5,586 5.2% 5,876 5,821 5,763 5,409 6.5%
Key MetricsROA 0.43% 0.27% 0.43% 0.45% 0.25% 0.32%ROE 5.63% 3.29% 5.68% 5.58% 3.23% 4.12%Equity / assets 7.08% 8.69% 7.08% 7.99% 8.14% 7.54%Cost / income ratio -59.67% -73.19% -58.87% -60.37% -74.98% -69.17%NPL ratio 1.29% 1.49% 1.29% 1.36% 1.38% 1.44%Reserve / NPL 147.43% 167.97% 147.43% 149.50% 150.69% 177.49%Loan to deposit ratio (Renminbi) 76.63% 74.48% 76.63% 74.33% 72.32% 72.16%Tier 1 ratio 10.35% 12.46% 10.35% 11.25% 11.70% 11.49%BIS ratio 14.28% 13.13% 14.28% 13.63% 14.18% 12.19%