2019 6 months investor presentation - oyak maden metalurji · 3 ereğli demir Çelik fabrikaları...
TRANSCRIPT

2019 6 Months
Investor Presentation
08.08.2019

3
Ereğli Demir Çelik Fabrikaları T.A.Ş. (Erdemir) may, when necessary, make written or verbal
announcements about forward-looking information, expectations, estimates, targets, assessments and
opinions. Erdemir has made the necessary arrangements about the amounts and results of such
information through its Disclosure Policy and has shared such policy with the public through the Erdemir
website, in accordance with the Capital Markets Board regulations. As stated in related policy, information
contained in forward-looking statements, whether verbal or written, should not include unrealistic
assumptions or forecasts. It should be noted that, actual results could materially differ from estimates
taking into account the fact that they are not based on historical facts but are driven from expectations,
beliefs, plans, targets and other factors which are beyond the control of our Company. As a result, forward-
looking statements should not be fully trusted or taken as granted. Forward-looking statements should be
considered valid only considering the conditions prevailing at the time of the announcement. In cases
where it is understood that forward-looking statements are no longer achievable, such matter will be
announced to the public and the statements will be revised. However, the decision to make a revision is a
result of a subjective evaluation. Therefore, it should be noted that, when a party is coming to a judgement
based on estimates and forward-looking statements, our Company may not have made a revision at that
particular time. Our Company makes no commitment to make regular revisions which would fully cover
changes in every parameter. New factors may arise in the future which may not be possible to foresee at
this moment in time.
Disclaimer

2019 Market Overview

5
Crude Steel ProductionChina Crude Steel Production (% yoy)EU28 Crude Steel Production (% yoy)
CIS Crude Steel Production (% yoy)
-10.0%
10.0%
0.0%
-5.0%
5.0%
Apr-
18
Jan-1
8
Dec-1
7
May-1
9
Jun-1
8
Jul-18
Jun-1
7
Nov-1
8
Mar-
16
Sep-1
7
Jul-17
Aug-1
7
Oct-
17
Nov-1
7
Feb
-18
May-1
8
Aug-1
8
Sep-1
8
Oct-
18
Dec-1
8
Jan-1
9
Feb
-19
Mar-
19
Apr-
19
Jun-1
9
5.0%
10.0%
-10.0%
-5.0%
15.0%
0.0%
May-1
9
Apr-
18
Nov-1
7
Aug-1
7
Jun-1
8
Jan-1
8
Apr-
18
Apr-
19
Dec-1
7
Feb
-18
Jun-1
7
Jul-17
Sep-1
7
Oct-
17
Mar-
18
Jul-18
Aug-1
8
Sep-1
8
Nov-1
8
Oct-
18
Dec-1
8
Jan-1
9
Feb
-19
Mar-
19
Jun-1
9
5.0%
-10.0%
-5.0%
0.0%
10.0%A
ug-1
7
Jun-1
7
Sep-1
7
Jul-17
Oct-
17
May-1
9
Nov-1
7
Dec-1
7
Jan-1
8
Feb-1
8
Mar-
16
Sep-1
8
Apr-
18
May-1
8
Jun-1
8
Apr-
19
Jul-18
Oct-
18
Aug-1
8
Dec-1
8
Nov-1
8
Jan-1
9
Feb-1
9
Mar-
19
Jun-1
9
Source: Worldsteel
6
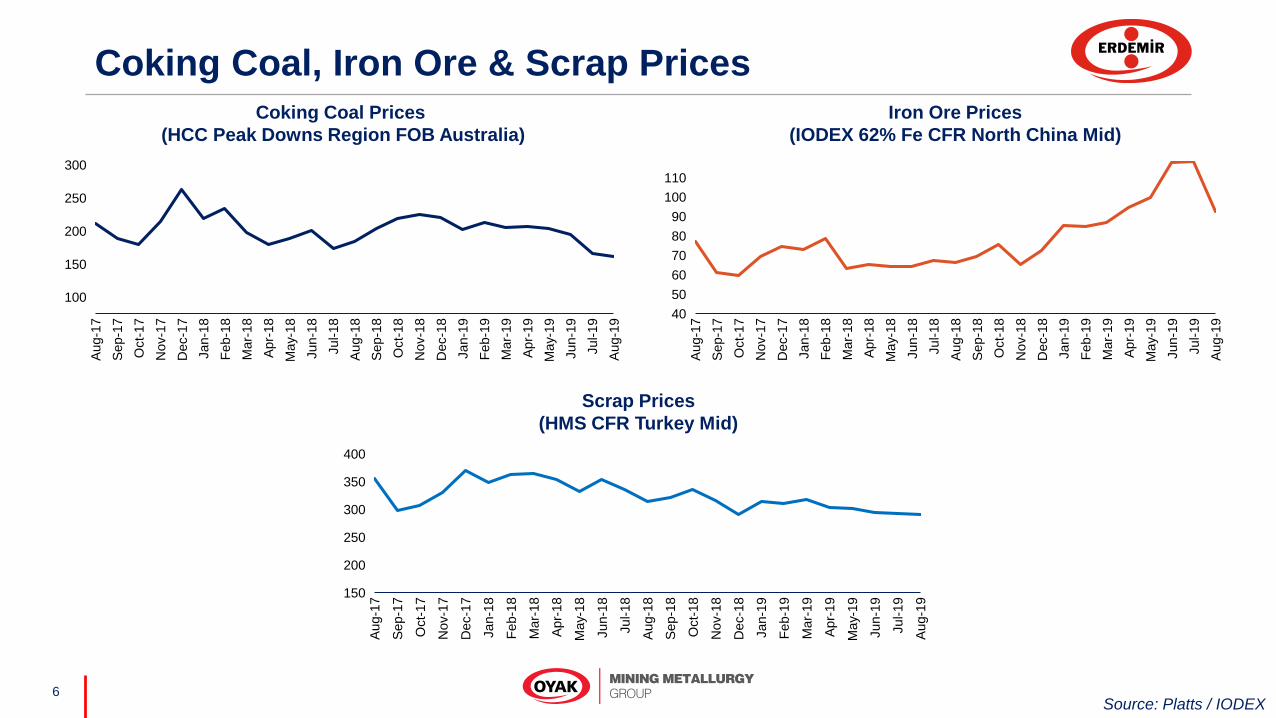
Coking Coal, Iron Ore & Scrap PricesIron Ore Prices
(IODEX 62% Fe CFR North China Mid)
Coking Coal Prices
(HCC Peak Downs Region FOB Australia)
Scrap Prices
(HMS CFR Turkey Mid)
150
100
300
200
250
Sep-1
7
Jul-19
Jun-1
9
Aug-1
7
Oct-
17
Nov-1
7
Dec-1
7
Jan-1
8
Feb-1
8
Mar-
18
May-1
8
Apr-
18
Jun-1
8
Jul-18
Aug-1
8
Jan-1
9
Sep-1
8
Oct-
18
Nov-1
8
Dec-1
8
Feb-1
9
Mar-
19
Apr-
19
May-1
9
Aug-1
9
110
80
40
100
60
50
90
70
Mar-
19
Sep-1
8
Oct-
17
Nov-1
7
Nov-1
8
Dec-1
7
Apr-
18
Jan-1
8
Sep-1
7
Mar-
18
Jul-18
May-1
8
Aug-1
9
Jun-1
8
Aug-1
8
Dec-1
8
Jan-1
9
Feb-1
9
Apr-
19
Jun-1
9
Jul-19
Oct-
18
May-1
9
Aug-1
7
Feb-1
8
200
300
400
150
350
250
May-1
9
Mar-
19
Feb-1
9
Dec-1
7
Feb-1
8
Aug-1
7
Sep-1
7
Oct-
17
Nov-1
7
Jan-1
8
Mar-
18
Apr-
18
May-1
8
Jun-1
8
Jul-18
Aug-1
8
Sep-1
8
Oct-
18
Nov-1
8
Dec-1
8
Jan-1
9
Apr-
19
Jun-1
9
Jul-19
Aug-1
9
Source: Platts / IODEX

7
Turkish Steel Production & Consumption
Source: TSPA
Production (mn tons)
Consumption (mn tons)
26.0
10.4
2017
10.4
2015
25.7 26.5
10.9
2014 2016
13.1
25.9
13.4
25.2
2018
36.1 36.9 36.9 39.0 38.6
Flat Long
14.6
16.2 17.6
16.5
30.8
14.8
2014
34.4
17.9
30.6
16.5
35.9
2015 2016
17.8
18.1
2017
15.8
2018
34.1
9.9
6M 2018
7.1
13.4
6.5
6M 2019
20.516.4
-20.0%
8.8
9.3
6M 2018
7.0
5.2
6M 2019
18.1
12.2
-32.6%

8
Turkish Steel Exports & Imports
Exports (mn tons)
Imports (mn tons)
11,0 10,2 10,0 9,3 10,7
2,5 2,6 3,1 4,3
6,1
2015
0,6
14,4
0,3
2014
0,3
2016
0,8
2017
1,0
2018
14,1 13,1 13,4
17,8
Semi-Product (Slab+Billet) Flat Steel Long Steel
6,78,6 8,7 9,0 7,5
4,8
7,9 6,2 4,84,8
2017
1,5
20162014
1,6 1,6
2015
1,5 1,3
2018
13,0
18,116,5
15,313,6
9.2
6M 2018
0.2
6M 2019
2.7
4.9
0.9
3.1
5.2
7.8
17.9%
6M 2019
0.8
3.1
4.3
0.6
6M 2018
3.5
1.4
8.2
5.5
-32.9%
Source: TSPA

2019 6M Results

10
Operational and Financial Highlights
Operational Highlights 2017 2018 6M 2018 6M 2019 Growth (YoY)
Liquid Steel Production (000 tons) 9,392 9,322 4,716 4,516 -4.2%
Flat Steel Production* (000 tons) 7,713 7,743 3,923 3,776 -3.7%
Long Steel Production (000 tons) 1,328 980 452 522 15.5%
Flat Steel Shipments (000 tons) 7,594 7,482 3,777 3,782 0.1%
Long Steel Shipments (000 tons) 1,364 919 422 540 28.0%
Financial Highlights 2017 2018 6M 2018 6M 2019 Growth (YoY)
Net Sales Revenue (USD mn) 5,140 5,598 2,845 2,601 -8.6%
EBITDA (USD mn) 1,496 1,720 919 622 -32.3%
Net Profit** (USD mn) 1,030 1,160 630 411 -34.8%
All figures are on IFRS consolidated basis unless stated otherwise.(*) Total flat steel production of Ereğli and İskenderun Plants.(**) It demonstrates Net Profit of Equity Holders of the Parent.

11
Liquid Steel Production (000 tons)
9,373
2016
9,3229,392
2017 2018
4,716
6M 2018
4,516
6M 2019
2,1472,316
Q2 2018 Q1 2019
2,369
Q2 2019

12
Crude Steel Capacity Utilization Ratio
2013
93%96%
78%76%
2014
100%
70%
2015
97%
69%
2016
97%
72%
2017
97%
2018
94%
6M 2019
Erdemir World*
Source: Worldsteel
As of August 2018, Worldsteel no longer publishes
global capacity utilization ratio for anti-trust reasons.

13
Production (000 tons)
Slab production for 3rd parties was included in
HRC production.
980
8,7239,041
5,891
1,701
2016
1,822
1,572
5,291
1,781
2017
1,328
6,042
2018
8,644
866 781
452 522
3,057
6M 2018
2,995
6M 2019
4,2984,375
435 403 378315
1,572
Q2 2018
201
1,528
2,157
1,423
207
Q1 2019 Q2 2019
2,164 2,141
Hot LongCold

14
Sales Volume (000 tons)
Slab sales for 3rd parties were included in HRC sales.
9191,587
1,908
1,364
1,860
2017
5,303
2016
5,686
8,401
1,750
5,732
2018
8,750 8,958
888 853
422 540
6M 2018 6M 2019
4,199
2,889 2,929
4,322
+2.9%
430 451 402
336
1,4351,410
Q2 2018 Q1 2019 Q2 2019
1,494
2042,013
2,222 2,100
173
+4.3%
Hot Cold Long
Total sales increased by 4.3% YoY in Q2 2019.
15
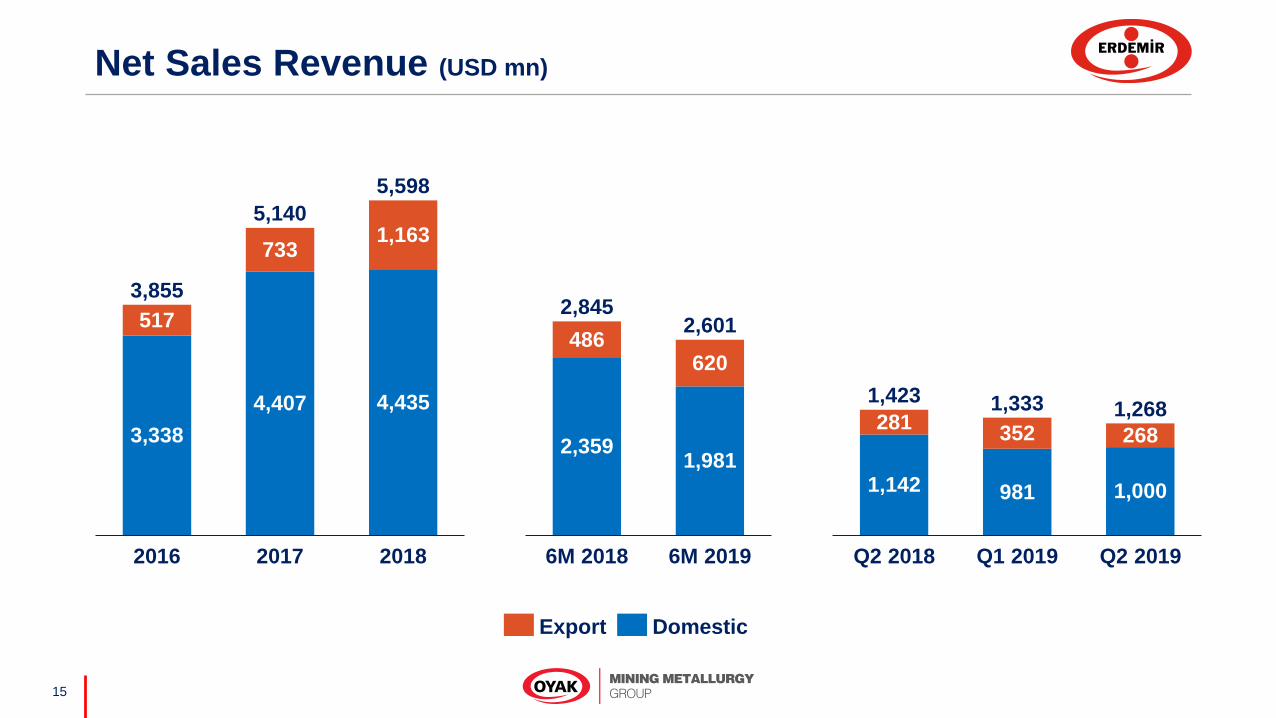
Net Sales Revenue (USD mn)
517
733
4,407
1,163
3,338
5,140
3,855
2016
4,435
2017 2018
5,598
486620
1,9812,359
6M 2018 6M 2019
2,8452,601
981
281352 268
Q2 2019Q2 2018
1,142
Q1 2019
1,000
1,423 1,333 1,268
Export Domestic
16
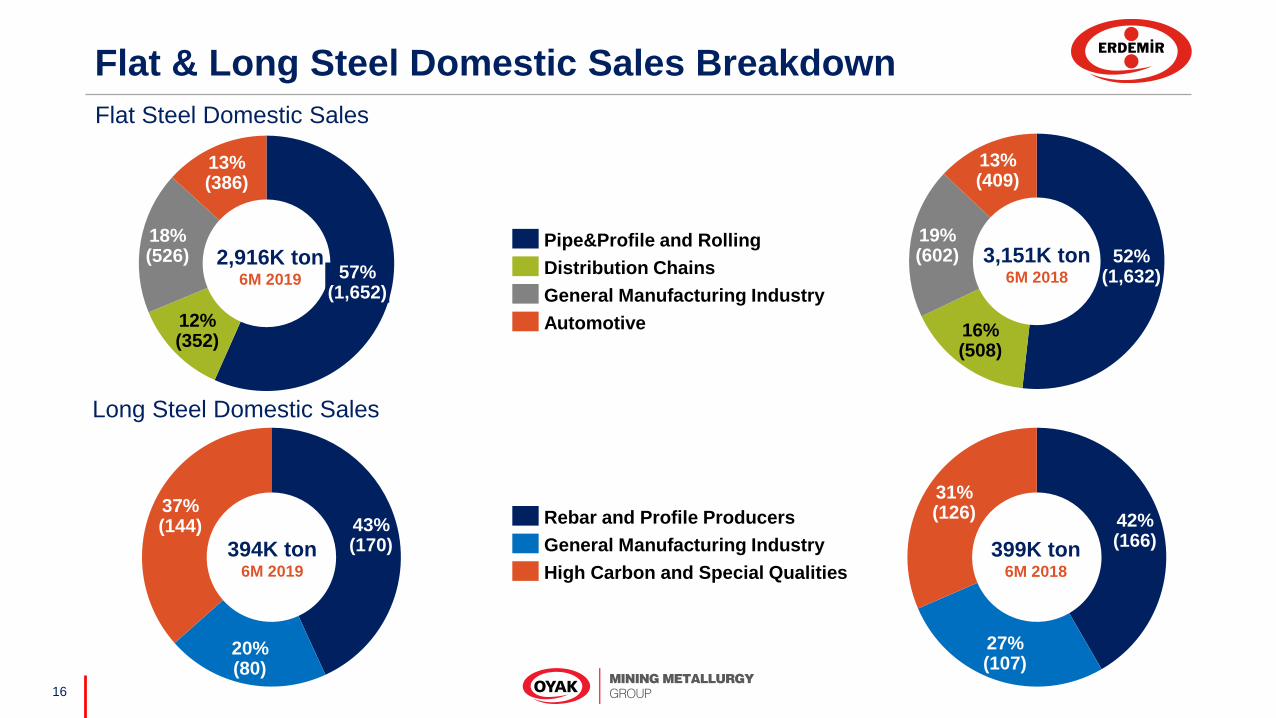
Flat & Long Steel Domestic Sales Breakdown
57%(1,652)
12%(352)
18%(526)
13%(386)
Pipe&Profile and Rolling
Distribution Chains
Automotive
General Manufacturing Industry
Flat Steel Domestic Sales
Long Steel Domestic Sales
2,916K ton6M 2019
43%(170)
20%(80)
37%(144) Rebar and Profile Producers
General Manufacturing Industry
High Carbon and Special Qualities
394K ton6M 2019
13%(409)
52%(1,632)
16%(508)
19%(602) 3,151K ton
6M 2018
42%(166)
27%(107)
31%(126)
399K ton6M 2018
17
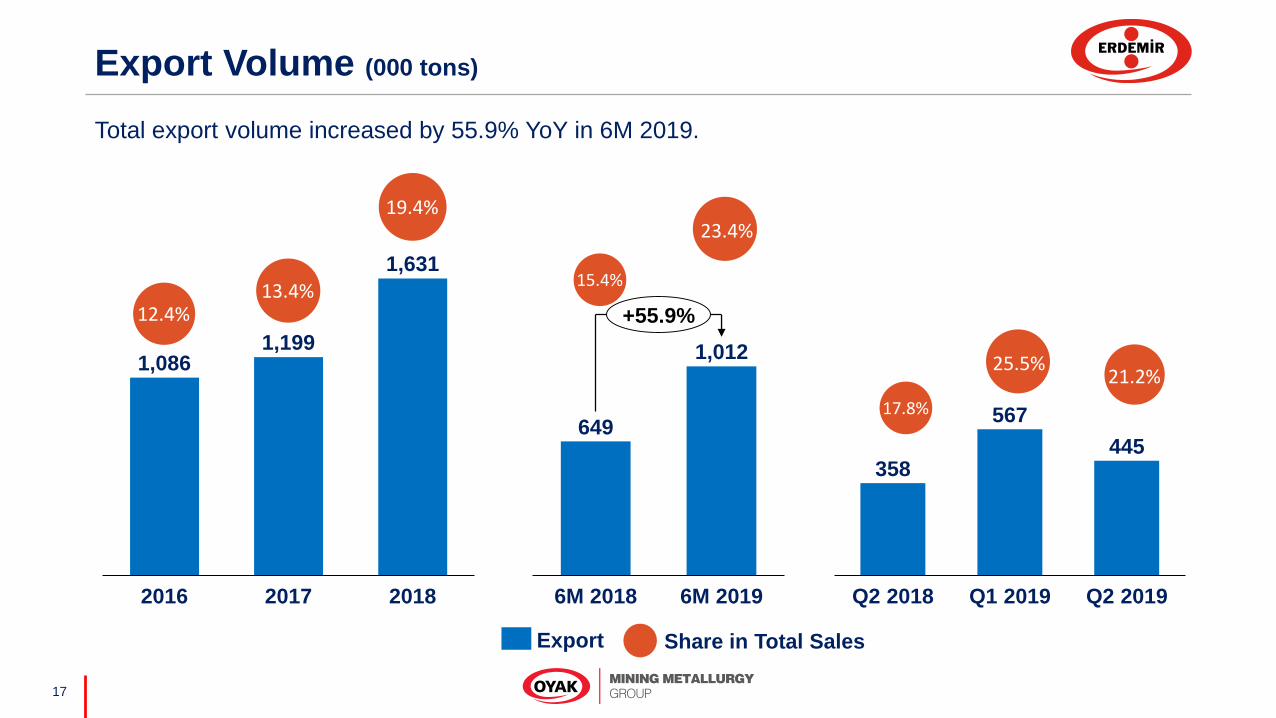
Export Volume (000 tons)
1,0861,199
2016 20182017
1,631
358
567
445
Q2 2018 Q1 2019 Q2 2019
Total export volume increased by 55.9% YoY in 6M 2019.
19.4%
13.4%12.4%
Export Share in Total Sales
649
6M 2018 6M 2019
1,012
+55.9%
17.8%
21.2%25.5%
23.4%
15.4%

18
EBITDA & Net Profit
895
2016
1,496
2017
1,720
2018
EBITDA (USD mn)
481323 299
Q2 2018 Q1 2019 Q2 2019
502
2016
1,030
2017
1,160
2018
Net Profit* (USD mn)
351186 225
Q2 2018 Q1 2019 Q2 2019
+20,8%
23.2%29.1% 30.7%
EBITDA Margin (%)
23.6%24.3%33.8%
20.7%20.0%13.0%
Net Profit Margin (%)
24.7%14.0% 17.7%
(*) It demonstrates Net Profit of Equity Holders of the Parent.
919622
6M 2018 6M 2019
630411
6M 20196M 2018
32.3%23.9%
22.2%15.8%

19
EBITDA Net Profit
622
519
411
107
EBITDA
6M 2019
(1)
(102)
Investing
Activities
Inc./(Exp.)
Depreciation Interest
Inc./(Exp.)
on Other
Operating
Inc./(Exp.)
Operating
Income
1
Finance
Inc./(Exp.)
(197)
Tax Inc./(Exp.)
(19)
Non-
Controlling
Interests
Net Profit
6M 2019
20
EBITDA Net Cash
622
519
(384)
201
(70)
Changes
in Working
Capital
Taxes PaidEBITDA
6M 2019
Interest
Inc./(Exp.)
Net
22
(189)
(89)
Net Cash
used in
Investing
Activities
(48)
Cash Flow
from
Financial
Investments
Free Cash
Flow
(794)
Dividend
Paid
Credit Usage/
(Payment)
Net
Other Change
in Cash
6M 2019
(39)

21
EBITDA per Ton* (USD/ton)
*One-off income/expense items are excluded.
10596
5143
85
138
119
174
141 143
179197
223 219
172
139 145
Q3
2016
Q4
2015
Q2
2015
Q3
2015
Q1
2016
Q2
2016
Q4
2016
Q1
2017
Q2
2018
Q2
2017
Q3
2017
Q4
2017
Q1
2018
Q3
2018
Q4
2018
Q1
2019
Q2
2019
Main Product

22
Financial Figures
Consolidated Net Assets (USD mn) 31.12.2018 30.06.2019 Growth (YoY)
Cash and Cash Equivalents 1,646 1,269 -23%
Working Capital 2,219 2,018 -9%
Tangible and Intangible Assets 3,533 3,512 -1%
Financial Liabilities (1,163) (1,147) -1%
Provisions and Other (674) (569) -16%
Net Assets 5,561 5,083 -9%
Working Capital (USD mn) 31.12.2018 30.06.2019 Growth (YoY)
Trade Receivables 837 675 -19%
Inventories 1,690 1,723 2%
Trade Payables (368) (465) 26%
Other 60 85 42%
Working Capital 2,219 2,018 -9%

23
Financial Borrowings (USD mn)
581 655460 362 266 353
891368 654 829 897 755
(190)
(675)(482)
(161)
2016 2018
529
6M 2019*
14
2014 2015 2017
Net Debt Short-Term Debt Long-Term Debt
*TFRS 16 Leases are excluded.

24
Net Debt (USD mn)
482
161
519
(46)
Net Cash
June 2019
Net Cash
Dec. 2018
Free Cash Flow
(794)
Dividend Paid Other

25
Borrowings Maturity Profile (USD mn)
127 174 145 89
342170
184
1 1
43
2020June 2019
Cash
22
Jul.-Dec.
2019
2021
25
1,269
2022
93
24
2023
8
2024
491
387
163
9
Principal Revolving Trade Financing Loans Interest

26
Cost of Sales Breakdown* (%)
64 73 76 75
1411 9
2017
757
2016
785
6 555 5
2018
76
6M 2019
Personnel Expenses
Raw Materials
Purchased Energy Expenses
Other
Depreciation and Amortization Exp.
36 33 31 34
27 35 35 36
13 12 12 1124 20 22 19
20182016 2017 6M 2019
Other
Scrap
Iron Ore&Pellet
Coal
Raw Materials Breakdown (%)
* Excluding inventory writedowns and provision released.

27
Capital Expenditures (USD mn)
17
5793 83
5580 88
52 43
84
140
143
171159
10782
113
110165
132
71
216
20112009 2010 2012 2013 2014 20172015 2016 2018 6M 2019
158
200
264
242
162 162
201
162
208
83
12
Capital Expenditures Fixed Assets Acquisition
28
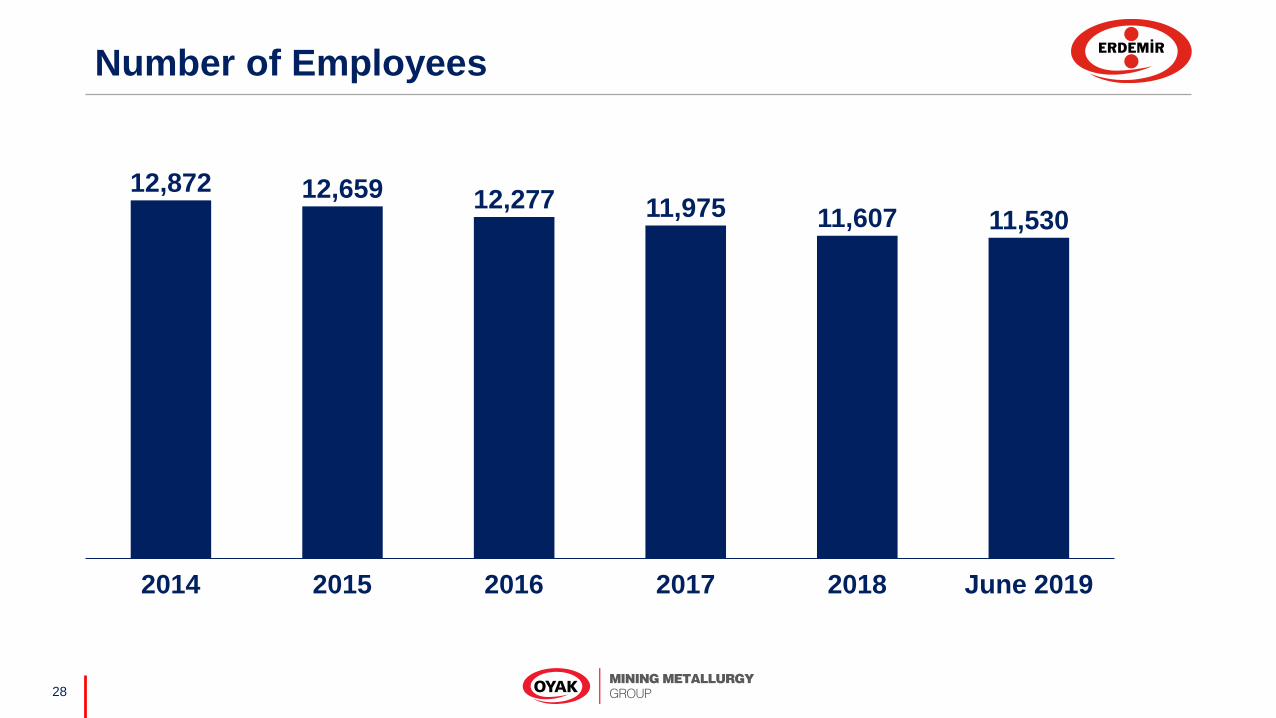
Number of Employees
2016 201820152014
12,872
2017
11,975
June 2019
12,659 12,27711,607 11,530
29
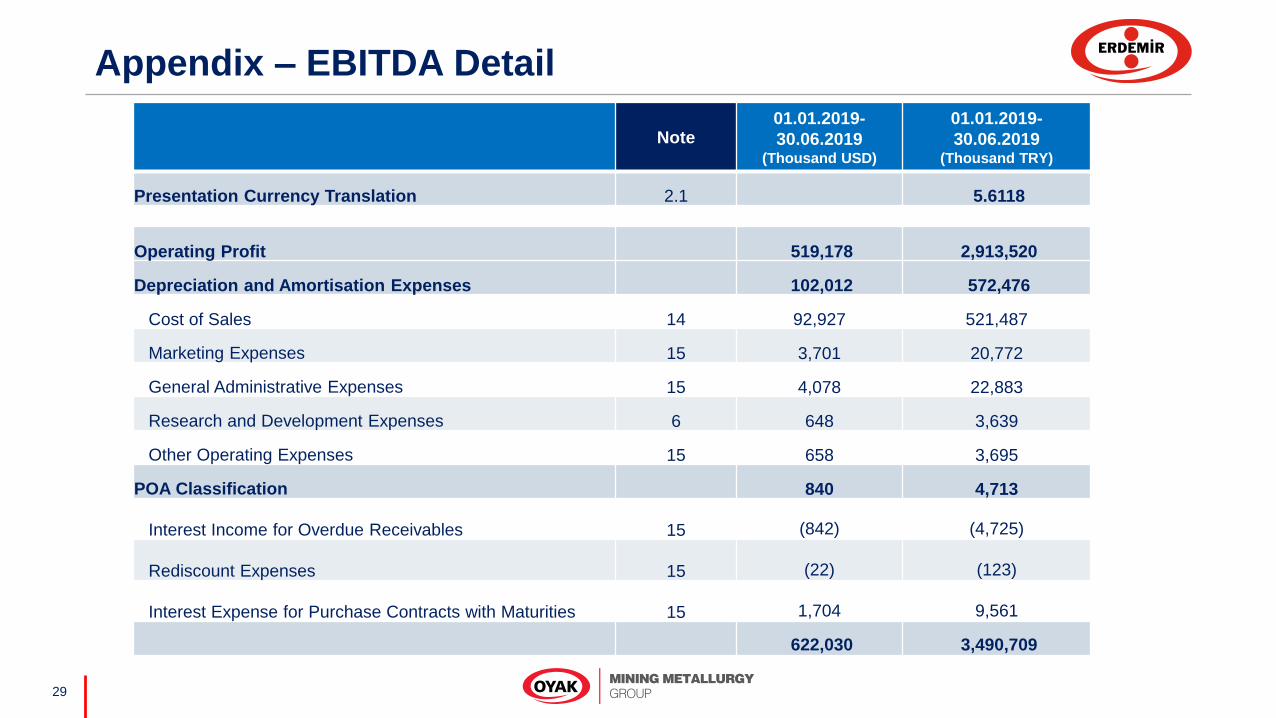
Appendix – EBITDA Detail
Note01.01.2019-
30.06.2019(Thousand USD)
01.01.2019-
30.06.2019(Thousand TRY)
Presentation Currency Translation 2.1 5.6118
Operating Profit 519,178 2,913,520
Depreciation and Amortisation Expenses 102,012 572,476
Cost of Sales 14 92,927 521,487
Marketing Expenses 15 3,701 20,772
General Administrative Expenses 15 4,078 22,883
Research and Development Expenses 6 648 3,639
Other Operating Expenses 15 658 3,695
POA Classification 840 4,713
Interest Income for Overdue Receivables 15 (842) (4,725)
Rediscount Expenses 15 (22) (123)
Interest Expense for Purchase Contracts with Maturities 15 1,704 9,561
622,030 3,490,709
30
Erdemir Investor [email protected] https://www.erdemir.com.tr/investor-relations/ +90 216 578 80 61