2019 growth of communications in africa
TRANSCRIPT

DRIVING THE GROWTH OF COMMUNICATIONS IN AFRICA
Helios Towers plcAnnual Report and Financial Statements
Helios Tow
ers plc A
nnual Rep
ort and Financial Statem
ents 2019

Helios Towers plcAnnual Report and Financial Statements 2019
Who we are Contents
Overview01 2019 Highlights02 At a glance04 Our journey05 Chair’s introduction06 Investment proposition
Strategic Report08 Chief Executive Officer’s statement12 Q&A with our CEO and CFO14 Market overview20 Business model22 Our strategy 28 Sustainability38 Chief Financial Officer’s statement41 Detailed financial review46 Risk management47 Principal risks and uncertainties49 Viability statement50 Section 172 statement52 Operating review
PG.5CHAIR’S INTRODUCTION
PGS.12-13Q&A WITH OUR CEO AND CFO
OUR VISION IS TO BE THE LEADING TELECOMS INFRASTRUCTURE COMPANY IN AFRICAHelios Towers plc (“HT”) is a leading independent tower company, providing mobile network operators (“MNOs”) with tower site space, power and related services.
We operate in some of the fastest-growing mobile markets in the world, driven by young and urbanising populations, high GDP growth and through continued expansion of communications infrastructure. In a continent with minimal fixed line connectivity, mobile is the driving force in communications, and a key enabler for social and economic development.
OUR PURPOSEOur purpose is to drive the growth of communications in Africa. We play a pivotal role in advancing African mobile telecoms services, and the resulting development of economies and communities.
OUR VALUESThroughout Helios Towers, we hold true to our three core values of integrity, partnership and excellence.
INTEGRITYDoing the right thing.
PARTNERSHIPWith our stakeholders, where each party respects and benefits from the other.
EXCELLENCEOur constant goal is to be the best we can be, in everything we do.
From the clear imperatives of our legal responsibilities, to how we act towards people, inside and outside the business, these values guide and govern how we behave each day. And we don’t just apply these values throughout our organisation, but by extension through our partnerships with both key suppliers and our customers.
For more information go towww.heliostowers.com

01
Revenue (US$m) 387.82019
356.0+3%
2018
345.02017
+9%
Sites
6,9742019
6,7452018
6,5192017
+3%+3%
Adjusted EBITDA∆ (US$m)
205.22019
177.62018
146.02017
+16%+22%
Colocations
7,6172019
6,8042018
6,4682017
+12%+5%
Adjusted EBITDA∆ margin (%) 52.92019
49.92018
42.32017
+3.0ppt+7.6ppt
Tenancy ratio
2.09x2019
2.01x2018
1.99x2017
+0.08x+0.02x
Operating profit/(loss) (US$m)
(4.5)2019
3.32018
(24.0)2017
($8m)+$27m
Helios Towers plcAnnual Report and Financial Statements 2019
Overview StrategicReport
GovernanceReport
Financial Statements
2019 Highlights
FINANCIAL KPIs
OPERATIONAL KPIsGovernance Report56 Chair’s introduction58 Board of Directors60 Corporate governance report66 Nomination Committee report67 Audit Committee report76 Directors’ remuneration report97 Directors’ report100 Statement of Directors’ responsibilities
Financial Statements101 Independent auditor’s report111 Consolidated Income Statement112 Consolidated Statement of other
comprehensive income113 Consolidated Statement of financial position114 Consolidated Statement of changes in equity115 Consolidated Statement of cash flows116 Notes to the Financial Statements152 Company Statement of financial position153 Company Statement of changes in equity154 Notes to the Company Financial Statements157 List of subsidiaries158 Officers and professional advisors159 SDG reporting161 Glossary
PGS.22-23CASE STUDY | GROWTH
PGS.26-27CASE STUDY | SUSTAINABILITY
PGS.24-25CASE STUDY | BUSINESS EXCELLENCE
Δ Alternative Performance Measures as defined in the Alternative Performance Measures section of the annual report on pages 54–55.
02
Helios Towers plcAnnual Report and Financial Statements 2019
Overview
At a glance
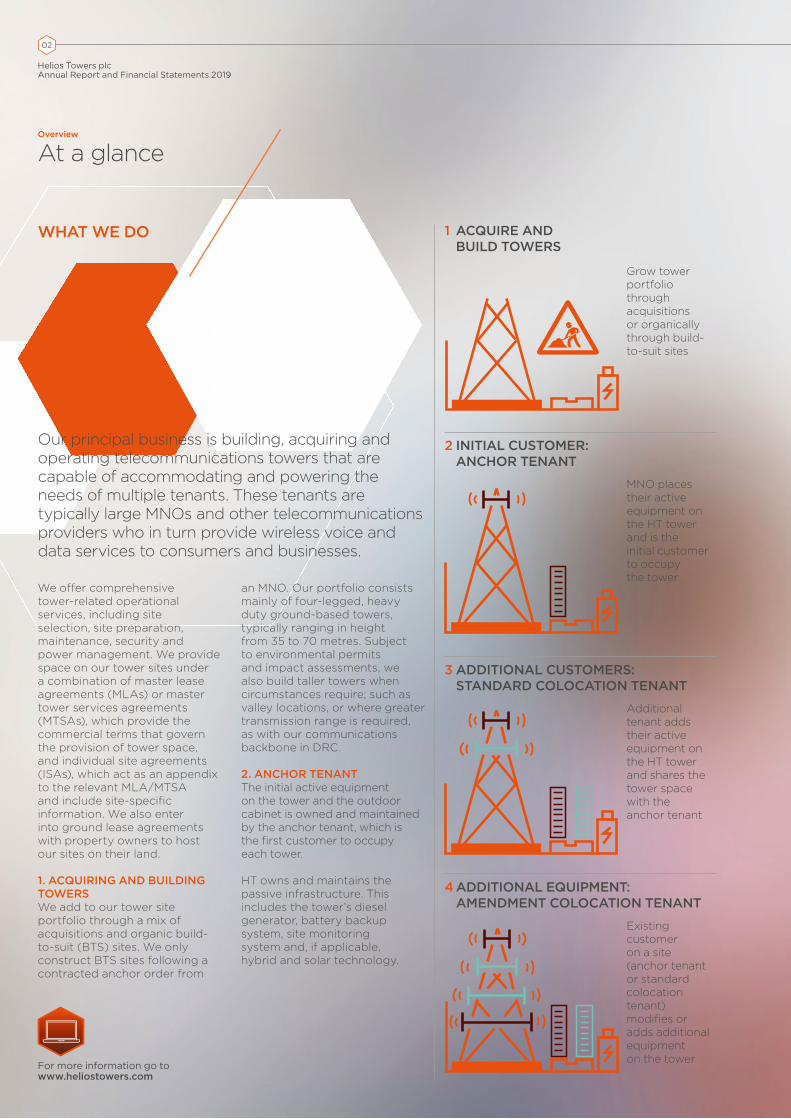
WHAT WE DO 1 ACQUIRE AND BUILD TOWERS
2 INITIAL CUSTOMER: ANCHOR TENANT
Grow tower portfolio through acquisitions or organically through build-to-suit sites
MNO places their active equipment on the HT tower and is the initial customer to occupy the tower
Additional tenant adds their active equipment on the HT tower and shares the tower space with the anchor tenant
Existing customer on a site (anchor tenant or standard colocation tenant) modifies or adds additional equipment on the tower
3 ADDITIONAL CUSTOMERS: STANDARD COLOCATION TENANT
4 ADDITIONAL EQUIPMENT: AMENDMENT COLOCATION TENANT
Our principal business is building, acquiring and operating telecommunications towers that are capable of accommodating and powering the needs of multiple tenants. These tenants are typically large MNOs and other telecommunications providers who in turn provide wireless voice and data services to consumers and businesses.
We offer comprehensive tower-related operational services, including site selection, site preparation, maintenance, security and power management. We provide space on our tower sites under a combination of master lease agreements (MLAs) or master tower services agreements (MTSAs), which provide the commercial terms that govern the provision of tower space, and individual site agreements (ISAs), which act as an appendix to the relevant MLA/MTSA and include site-specific information. We also enter into ground lease agreements with property owners to host our sites on their land.
1. ACQUIRING AND BUILDING TOWERS We add to our tower site portfolio through a mix of acquisitions and organic build-to-suit (BTS) sites. We only construct BTS sites following a contracted anchor order from
an MNO. Our portfolio consists mainly of four-legged, heavy duty ground-based towers, typically ranging in height from 35 to 70 metres. Subject to environmental permits and impact assessments, we also build taller towers when circumstances require; such as valley locations, or where greater transmission range is required, as with our communications backbone in DRC.
2. ANCHOR TENANT The initial active equipment on the tower and the outdoor cabinet is owned and maintained by the anchor tenant, which is the first customer to occupy each tower.
HT owns and maintains the passive infrastructure. This includes the tower’s diesel generator, battery backup system, site monitoring system and, if applicable, hybrid and solar technology.
For more information go towww.heliostowers.com
03
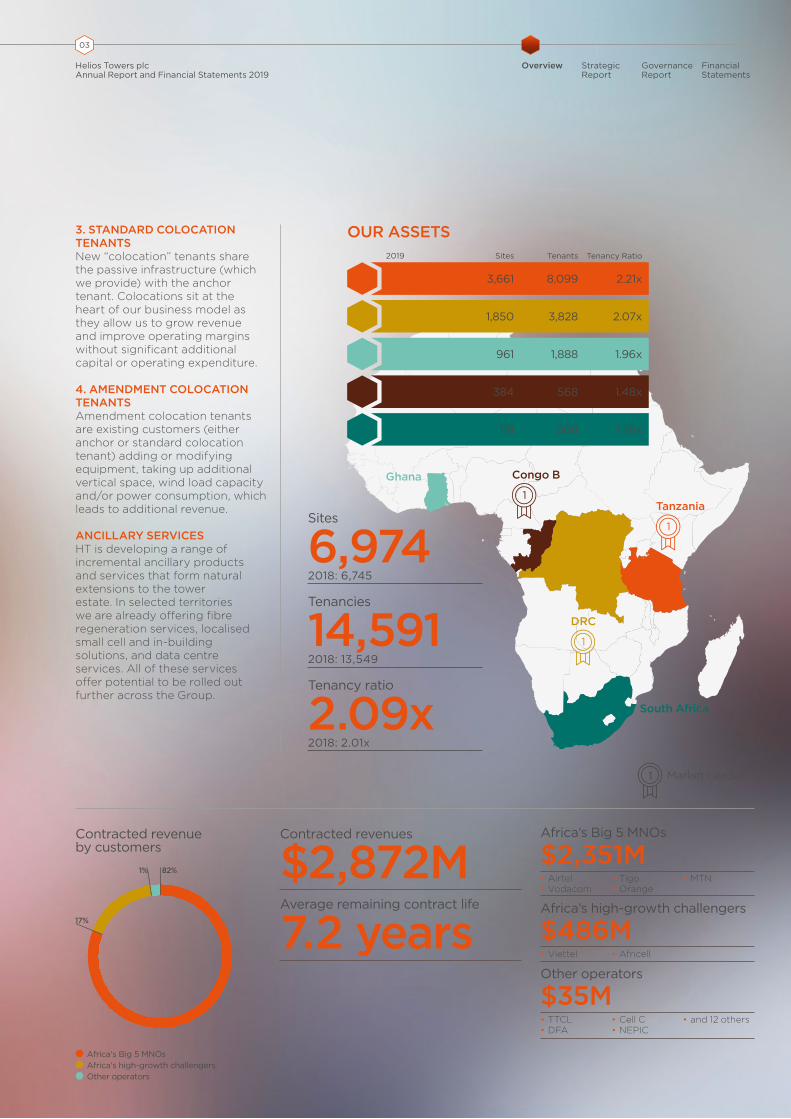
Congo B
Tanzania
South Africa
Ghana
DRC
82%
17%
1%
Africa's Big 5 MNOs Africa's high-growth challengers Other operators
Helios Towers plcAnnual Report and Financial Statements 2019
Overview StrategicReport
GovernanceReport
Financial Statements
3. STANDARD COLOCATION TENANTS New “colocation” tenants share the passive infrastructure (which we provide) with the anchor tenant. Colocations sit at the heart of our business model as they allow us to grow revenue and improve operating margins without significant additional capital or operating expenditure.
4. AMENDMENT COLOCATION TENANTS Amendment colocation tenants are existing customers (either anchor or standard colocation tenant) adding or modifying equipment, taking up additional vertical space, wind load capacity and/or power consumption, which leads to additional revenue.
ANCILLARY SERVICESHT is developing a range of incremental ancillary products and services that form natural extensions to the tower estate. In selected territories we are already offering fibre regeneration services, localised small cell and in-building solutions, and data centre services. All of these services offer potential to be rolled out further across the Group.
2019 Sites Tenants Tenancy Ratio
Tanzania 3,661 8,099 2.21x
DRC 1,850 3,828 2.07x
Ghana 961 1,888 1.96x
Congo B 384 568 1.48x
South Africa 118 208 1.76x
OUR ASSETS
Contracted revenues
$2,872MAverage remaining contract life
7.2 years
Africa’s Big 5 MNOs
$2,351M• Airtel• Vodacom
• Tigo• Orange
• MTN
Africa’s high-growth challengers
$486M• Viettel • Africell
Other operators
$35M• TTCL• DFA
• Cell C• NEPIC
• and 12 others
Contracted revenue by customers
Sites
6,9742018: 6,745
Tenancies
14,5912018: 13,549
Tenancy ratio
2.09x2018: 2.01x
Market Leader
04
Helios Towers plcAnnual Report and Financial Statements 2019
Overview
Our journey
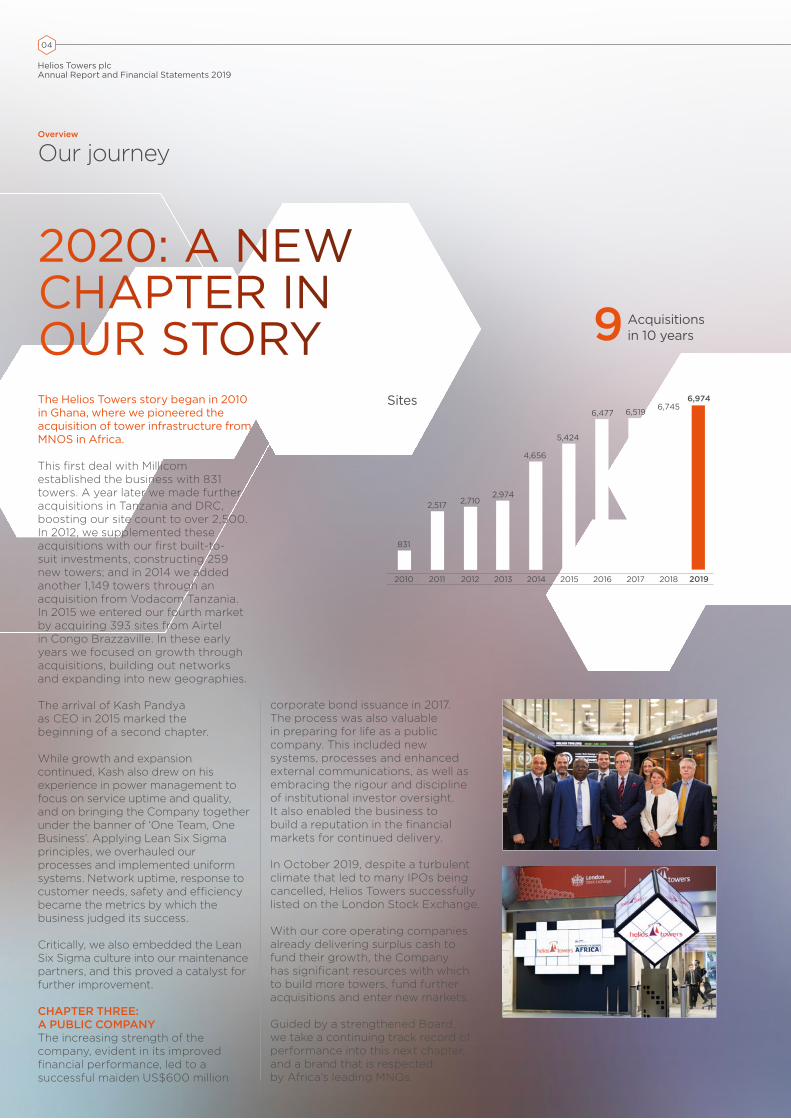
2020: A NEW CHAPTER IN OUR STORY
2010 2011 2012 2013 2014 2015 2016 2017 2018
831
2,517 2,7102,974
4,656
5,424
6,477 6,5196,745
2019
6,974SitesThe Helios Towers story began in 2010 in Ghana, where we pioneered the acquisition of tower infrastructure from MNOS in Africa.
This first deal with Millicom established the business with 831 towers. A year later we made further acquisitions in Tanzania and DRC, boosting our site count to over 2,500. In 2012, we supplemented these acquisitions with our first built-to-suit investments, constructing 259 new towers; and in 2014 we added another 1,149 towers through an acquisition from Vodacom Tanzania. In 2015 we entered our fourth market by acquiring 393 sites from Airtel in Congo Brazzaville. In these early years we focused on growth through acquisitions, building out networks and expanding into new geographies. The arrival of Kash Pandya as CEO in 2015 marked the beginning of a second chapter.
While growth and expansion continued, Kash also drew on his experience in power management to focus on service uptime and quality, and on bringing the Company together under the banner of ‘One Team, One Business’. Applying Lean Six Sigma principles, we overhauled our processes and implemented uniform systems. Network uptime, response to customer needs, safety and efficiency became the metrics by which the business judged its success.
Critically, we also embedded the Lean Six Sigma culture into our maintenance partners, and this proved a catalyst for further improvement.
CHAPTER THREE: A PUBLIC COMPANYThe increasing strength of the company, evident in its improved financial performance, led to a successful maiden US$600 million
corporate bond issuance in 2017. The process was also valuable in preparing for life as a public company. This included new systems, processes and enhanced external communications, as well as embracing the rigour and discipline of institutional investor oversight. It also enabled the business to build a reputation in the financial markets for continued delivery.
In October 2019, despite a turbulent climate that led to many IPOs being cancelled, Helios Towers successfully listed on the London Stock Exchange.
With our core operating companies already delivering surplus cash to fund their growth, the Company has significant resources with which to build more towers, fund further acquisitions and enter new markets.
Guided by a strengthened Board, we take a continuing track record of performance into this next chapter, and a brand that is respected by Africa’s leading MNOs.
9 Acquisitions in 10 years

05
Helios Towers plcAnnual Report and Financial Statements 2019
Overview StrategicReport
GovernanceReport
Financial Statements
Chair’s introduction
I am proud to be able to welcome you to the Helios Towers Annual Report for the first time.
I came on board as Chair in September 2019 and for me this has been a double pleasure. Firstly, mobile telephony holds an enduring fascination for me, having previously served on the Board of Vodafone Group Plc for a decade. But secondly, I am a proud Ghanaian and African, and have witnessed the transformative effects that mobile communications invariably bring to communities, cities, nations and continents.
It is worth remembering that there is minimal fixed line telephony across Africa. So as the mobile sector expands, it is not bringing an additional choice – it is usually providing telephony for the first time. It is always remarkable to see how, overnight, a rural college or hospital can become connected not just to its community, but to the internet and the world’s knowledge, insights and experiences.
Africans are also leading the world in some areas of online service use. Millions are gaining online access for the first time with a 3G or 4G smartphone in their hands. They’re using WhatsApp and Facebook from day one. There is already a generation that has never stepped into a physical bank – to them, it has always been an online service. And from farming and tourist services to online medical consultations, mobile is changing lives. GROWING TRUE TO OUR VALUESIn many respects, we are pushing at an open door: governments, local authorities, consumers and businesses alike can all see the benefits of mobile and are widely supportive.
Equally, the Company is determined to grow responsibly; to build towers considerately and to maintain them efficiently. We act with integrity and with locally sourced talent, complying with, and typically exceeding, all legal requirements. We also believe in partnership, working with some 7,000 contractors with a one-company ethos. And we strive for excellence, whether in safety, training, technology or service uptime and reliability.
A STRENGTHENED PUBLIC COMPANYI was delighted to see the Company’s business model and strategy validated by the public financial markets through a successful IPO in October. This is also a positive statement for African business generally, proving the LSE is open to the continent’s myriad opportunities.
In parallel, the Company’s governance has been refined and upgraded to align with the uncompromised values we believe in. This has included strengthening our Board with relevant and complementary skills that will serve us well for the opportunities and challenges to come.
SECTION 172We believe that our strategy and actions reflect the requirements and spirit of Section 172 with the information we offer you in this report on pages 50 and 51. These include our commitment to our workforce, customers, suppliers, shareholders, communities and the environment and to operate both sustainably and with integrity.
OUTLOOKThe rapid growth in mobile is also being propelled by the African economy – one of the fastest-growing in the world. A rising middle class and increasing consumer expectations are igniting demand. The continent has significant room for structural growth which will take many years to fulfill. Helios Towers is instrumental in helping MNOs to both densify and expand, without the distraction and capex needed to improve and operate tower networks.
Just as importantly, the Company has continued to demonstrate its ability to grow inorganically. This year the Company entered South Africa –a different market for us in that mobile there is generally much more mature. South Africa is the powerhouse of sub-Saharan Africa, and its mobile market is pioneering many of the regional developments of both mobile and ancillary technologies. Its towers market is still full of growth and potential, so we are excited about our prospects.
The combination of organic growth potential and well-judged acquisitions in both new and existing markets bodes well for the continued expansion of our business, and for the social and economic prospects for the areas in which we operate.
Samuel Jonah, KBE, OSG | Chair
9
06
4.9%
3.8%
1.4%
HT Markets(revenue weighted)
sub-SaharanAfrica
G7
29%31%
6%
HT Markets(averagegrowth)
sub-SaharanAfrica
G7
48% 45%
85%
HT Markets sub-SaharanAfrica
G7
16% 17%
2%
+37m+172m
+14m
HT Markets sub-SaharanAfrica
G7
Helios Towers plcAnnual Report and Financial Statements 2019
Overview
Investment proposition
• HT customers are mainly the large MNOs and other telecoms providers, who in turn provide wireless voice and data services to end-consumers and businesses.
• Africa has clear and compelling population and GDP drivers that are propelling its mobile markets forward and, in turn, demand for HT services.
• In our markets the UN forecasts population growth of 37 million between 2018 to 2024.
• The combination of Africa’s physical vastness, its lack of fixed line infrastructure, and fast developing economies means that mobile infrastructure is already critical to its societies and economies, with demand expected to continue to grow.
1 LEVERAGING A FAVOURABLE AFRICAN MACRO ENVIRONMENT
2 WITH UNIQUE STRENGTHS AND POSITIONING TO DELIVER ON LONG TERM GROWTH OPPORTUNITIES
• HT is uniquely positioned as the market leader and sole independent player in Tanzania, DRC and Congo B, with a growing portfolio in Ghana (predominantly high traffic urban areas) and newly established operations in South Africa.
• Combined with the youthful and increasingly urban nature of the populations, and the mobile-dominated internet access and digital economies of these markets, independent forecasts(4) estimate 54 million more mobile subscriptions between 2018 and 2024.
(1) Source: United Nations, World Population Prospects 2019, June 2019
(2) Source: IMF World Economics Outlook database, October 2019
(3) Source: GSMA Intelligence database, January 2020. Unique mobile subscribers 2019
(4) Source: Hardiman report, August 2019
Population growth(1)
(2018 - 2024E)
Mobile penetration(3) (%)(2019)
Strong GDP growth(2) (%)(2018 - 2024E CAGR)
Mobile subscription growth(4) (%)(2018–2024E CAGR)
• MNOs in these markets are expected to require around 19,000 additional standard Points of Service (PoS) between 2018 to 2024, each of which represents a potential new tenancy for Helios Towers.
• At the end of 2019, HT’s unique asset base consisted of 6,974 sites and 14,591 tenancies – equating to a Group tenancy ratio of 2.09x.

07
2016
Org
anic
Acq
uire
d
2017
Org
anic
2018
Org
anic
Acq
uire
d
2019
105
31 10 146
32 178
26
2
205
Helios Towers plcAnnual Report and Financial Statements 2019
Overview StrategicReport
GovernanceReport
Financial Statements
3 THROUGH MULTIPLE ACTIVITIES, BUILDING A PLATFORM FOR PROFITABLE AND SUSTAINABLE GROWTH
5 USING A ROBUST BUSINESS MODEL, DELIVERING FINANCIAL STRENGTH AND SUSTAINABLE DIFFERENTIATION
6 TO DELIVER VALUE FOR SHAREHOLDERS, SUSTAINABLY ALONGSIDE OTHER KEY STAKEHOLDERS
Adj. EBITDAΔ growth (US$m)• Acquire tower portfolios, yielding large long-term contracted revenues.
• Custom build new tower assets for MNOs (build-to-suit).
• Promote tower sharing through multiple MNOs on tower sites (colocation), and multiple technologies on tower sites (amendment tenancies); delivering cost benefits to customers and reducing environmental impact.
• Operate the tower and associated passive infrastructure, providing a full suite of tower-related space, power and operational services. These include:
– Site preparation and construction;
– Site management and maintenance;
– Power management; and– Security and other services.
• Additionally, HT is developing ancillary products and services in fibre backhaul, localised small cell and in-building solutions and data centre services; for potential rollout across the Group.
• Continually improving operational leverage and performance.
• High customer service levels.
4 EMBEDDING BUSINESS EXCELLENCE IN THE PLATFORM
• Supply chain optimisation driving efficiencies across the business (“One team, one business”).
• Realised capex savings through reduction in strategic suppliers.
% Tower Uptime Achieved
99.98%uptime of our towers across all of 2019
Localised workforce
96%in operating companies are local employees
Contracted revenues
$2.9B% Adj. EBITDAΔ in USD/EUR pegged
65%
Lean Six Sigma training
45%of employees trained by the end of 2019
• Contracts are protected against power prices and general inflation.
• Contracts are long term, with c.$2.9 billion contracted future revenue with 7.2 years of average remaining life.
• High quality contracts in hard currencies with “Big-5” African MNOs, delivering committed revenues for many years ahead.
• Through the execution of our strategy we aim to maximise value for our shareholders.
• Medium-term, HT is looking forward to the potential development of a sustainable dividend distribution policy.
• Sustainable lease rates and stable and visible cash flows with diversified customer base.
• Balance sheet strength to continue to support investments.
• Funding and financing options provide flexibility to support long-term growth initiatives.
• In accordance with its values and goals, HT continues to also strive to benefit its employees and partner with suppliers and customers; in a socially and environmentally responsible manner, helping to improve the communities and societies in which it operates.
08
Helios Towers plcAnnual Report and Financial Statements 2019
Strategic Report
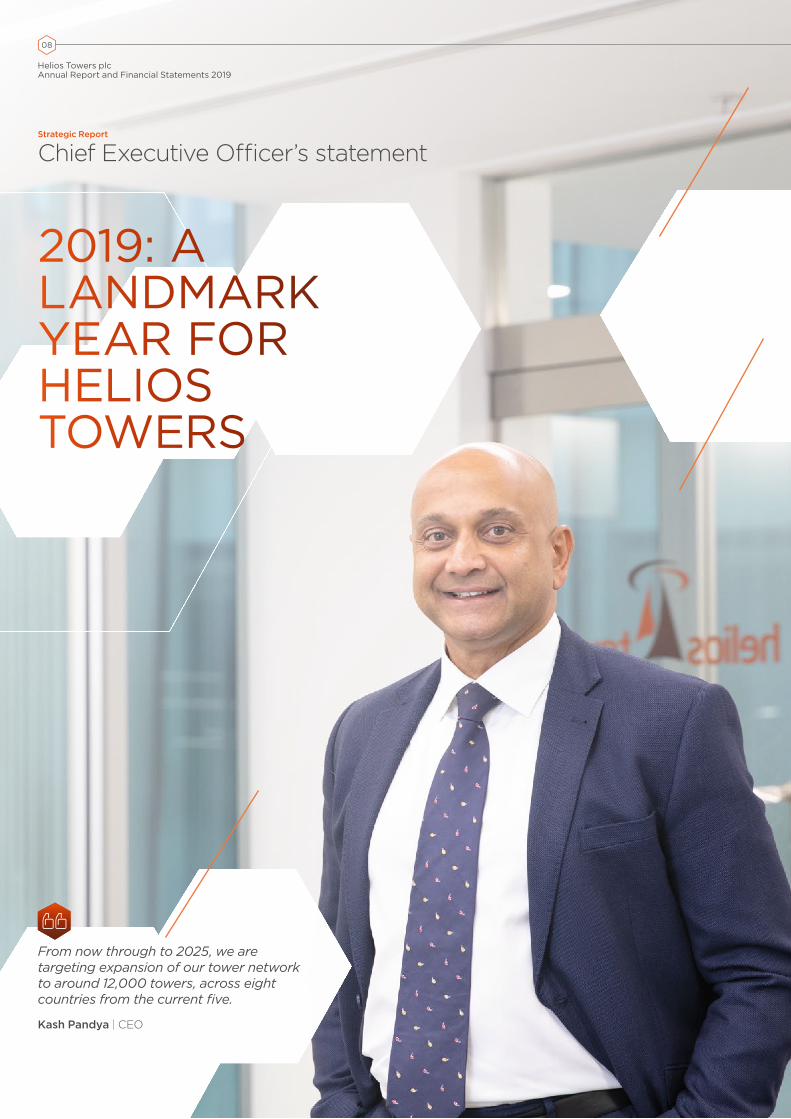
Chief Executive Officer’s statement
2019: A LANDMARK YEAR FOR HELIOS TOWERS
From now through to 2025, we are targeting expansion of our tower network to around 12,000 towers, across eight countries from the current five.
Kash Pandya | CEO
09
Helios Towers plcAnnual Report and Financial Statements 2019
Overview StrategicReport
GovernanceReport
Financial Statements
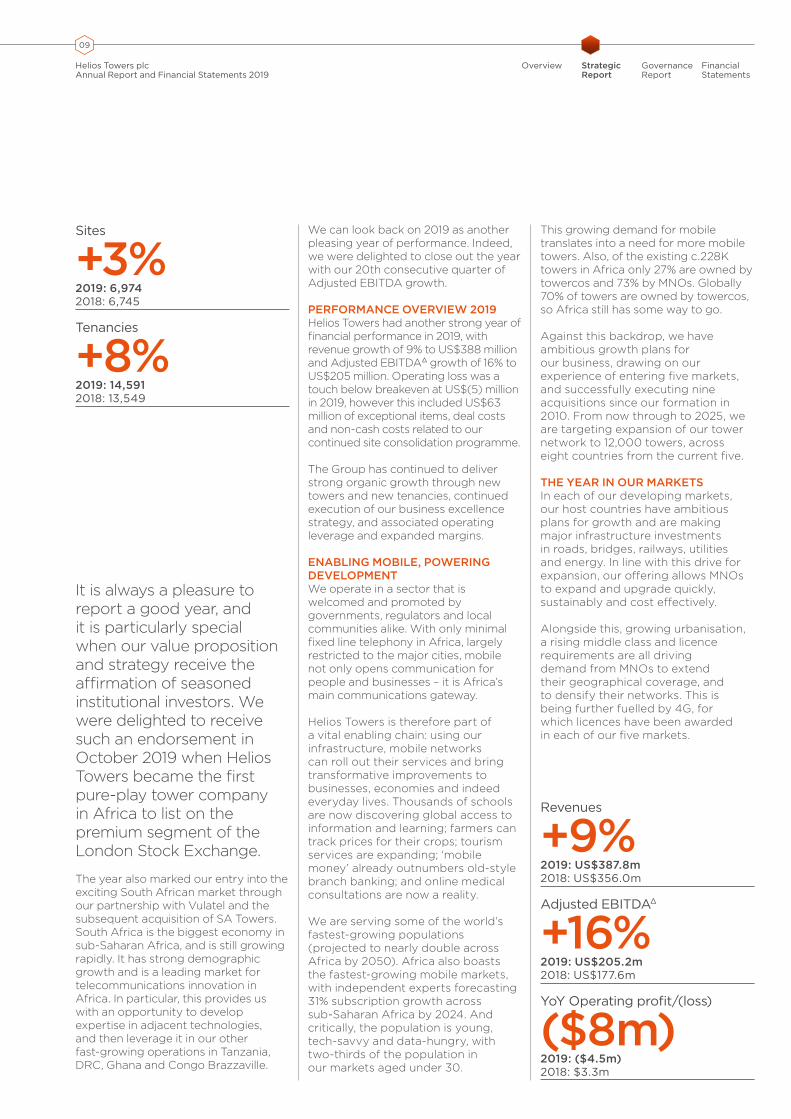
It is always a pleasure to report a good year, and it is particularly special when our value proposition and strategy receive the affirmation of seasoned institutional investors. We were delighted to receive such an endorsement in October 2019 when Helios Towers became the first pure-play tower company in Africa to list on the premium segment of the London Stock Exchange.
The year also marked our entry into the exciting South African market through our partnership with Vulatel and the subsequent acquisition of SA Towers. South Africa is the biggest economy in sub-Saharan Africa, and is still growing rapidly. It has strong demographic growth and is a leading market for telecommunications innovation in Africa. In particular, this provides us with an opportunity to develop expertise in adjacent technologies, and then leverage it in our other fast-growing operations in Tanzania, DRC, Ghana and Congo Brazzaville.
We can look back on 2019 as another pleasing year of performance. Indeed, we were delighted to close out the year with our 20th consecutive quarter of Adjusted EBITDA growth.
PERFORMANCE OVERVIEW 2019Helios Towers had another strong year of financial performance in 2019, with revenue growth of 9% to US$388 million and Adjusted EBITDAΔ growth of 16% to US$205 million. Operating loss was a touch below breakeven at US$(5) million in 2019, however this included US$63 million of exceptional items, deal costs and non-cash costs related to our continued site consolidation programme.
The Group has continued to deliver strong organic growth through new towers and new tenancies, continued execution of our business excellence strategy, and associated operating leverage and expanded margins.
ENABLING MOBILE, POWERING DEVELOPMENTWe operate in a sector that is welcomed and promoted by governments, regulators and local communities alike. With only minimal fixed line telephony in Africa, largely restricted to the major cities, mobile not only opens communication for people and businesses – it is Africa’s main communications gateway.
Helios Towers is therefore part of a vital enabling chain: using our infrastructure, mobile networks can roll out their services and bring transformative improvements to businesses, economies and indeed everyday lives. Thousands of schools are now discovering global access to information and learning; farmers can track prices for their crops; tourism services are expanding; ‘mobile money’ already outnumbers old-style branch banking; and online medical consultations are now a reality.
We are serving some of the world’s fastest-growing populations (projected to nearly double across Africa by 2050). Africa also boasts the fastest-growing mobile markets, with independent experts forecasting 31% subscription growth across sub-Saharan Africa by 2024. And critically, the population is young, tech-savvy and data-hungry, with two-thirds of the population in our markets aged under 30.
This growing demand for mobile translates into a need for more mobile towers. Also, of the existing c.228K towers in Africa only 27% are owned by towercos and 73% by MNOs. Globally 70% of towers are owned by towercos, so Africa still has some way to go.
Against this backdrop, we have ambitious growth plans for our business, drawing on our experience of entering five markets, and successfully executing nine acquisitions since our formation in 2010. From now through to 2025, we are targeting expansion of our tower network to 12,000 towers, across eight countries from the current five.
THE YEAR IN OUR MARKETSIn each of our developing markets, our host countries have ambitious plans for growth and are making major infrastructure investments in roads, bridges, railways, utilities and energy. In line with this drive for expansion, our offering allows MNOs to expand and upgrade quickly, sustainably and cost effectively.
Alongside this, growing urbanisation, a rising middle class and licence requirements are all driving demand from MNOs to extend their geographical coverage, and to densify their networks. This is being further fuelled by 4G, for which licences have been awarded in each of our five markets.
Revenues
+9%2019: US$387.8m 2018: US$356.0m
Adjusted EBITDAΔ
+16%2019: US$205.2m 2018: US$177.6m
YoY Operating profit/(loss)
($8m)2019: ($4.5m) 2018: $3.3m
Sites
+3%2019: 6,974 2018: 6,745
Tenancies
+8%2019: 14,591 2018: 13,549

10
Helios Towers plcAnnual Report and Financial Statements 2019
• Ghana. During the year we saw an interesting evolution of the towerco market with American Tower’s acquisition of Eaton Towers, endorsing the attractiveness of tower assets in Africa. Helios Towers is the only other towerco in Ghana, and our nimble and entrepreneurial approach has won us significant business from all leading MNOs in the market. With economic growth of 7.5%(2) estimated for 2019, Ghana is one of the world’s fastest-growing economies and we continue to expand our tower count there.
• Congo Brazzaville. Our business continues to gain traction with the MNOs in a mobile market projected to add one million subscribers by 2024. We remain the only independent player in the country and provide high-quality infrastructure services to both leading MNOs in the market.
• South Africa. We entered this market in spring 2019 and our goal here is to have 1,000 towers operational within three years. We have already made good progress, closing the year with 118 sites and 208 tenancies, and an attractive pipeline of over 500 sites. 4G is well established here, and the Government is now pushing the MNOs to densify in rural areas. Our operational ethos has been embedded with remarkable smoothness and we see exciting times ahead.
GOVERNANCEOn 18 October 2019, Helios Towers marked the beginning of a new chapter with a successful initial public offering of its shares, and a premium listing on the London Stock Exchange.
Accordingly, to strengthen our governance the business made several new appointments to the plc Board. We welcomed Sir Samuel Jonah who joined as Chair; Magnus Mandersson who is now the Senior Independent Director; and Alison Baker who joined as an Independent Non-Executive Director and Audit Committee Chair
Each brings significant and complementary skills and experience to the Board for our new life as a public company.
ADDRESSING RISK We have always adopted the highest standards of financial probity, and in 2019 we further strengthened this area by gaining ISO 37001 accreditation for our anti-bribery measures. We believe this makes us one of the first, if not the only, enterprise in Africa to hold a ‘full-house’ of anti-bribery, quality, safety and environmental ISO standards.
We also continued to focus on other high-risk areas including conflicts of interest management, and technology risks ranging from cybercrime and network access to security. Of course, there is no end-point to managing risks; its nature constantly evolves, and therefore so do our practices to defend against them.
2020We enter the year as a public company with an enviable platform of both talent and assets.
Our script for 2020 is broadly similar to last year’s: to keep doing what we’re doing, do it better every time, and look for opportunities to grow in both existing and new locations.
Meanwhile, my thanks go again to our fantastic and tenacious teams and our partner suppliers. Once again they have delivered continued improvement and record KPIs, making us ever-more efficient and effective. I also thank our loyal MNO customers, many of whom have been with us from our earliest days in each territory. We look forward to continuing to grow with you in the great continent of Africa.
Kash Pandya | Chief Executive Officer
(1) Source: Hardiman Report, August 2019(2) IMF, World Economic Outlook, October 2019
Strategic Report
Chief Executive Officer’s statement continued
• Tanzania. The MNOs are focused on continuing to roll out 4G and this is driving significant amendment revenue for us. The Government has also extended the power grid by more than 1,000km, enabling us to connect 147 more towers to the grid and save opex by reducing fuel consumption and fuelling visits. Tanzania is investing heavily in its growth, and the World Bank is also contributing; it recently released $450m of $1.7bn overall funding to drive the country’s development.
• DRC. Early in the year, we were pleased to see a smooth election process and transition to the new president, Félix Tshisekedi. Like Tanzania, DRC is attracting and making significant investment, as are the MNOs. Inaugural 4G licences, awarded in 2018, were acquired by the leading players (Vodacom, Airtel, Orange and Africell), and independent forecasts(1) point to rapid subscription growth from 38m (2018) to 63m (2024).

11
Helios Towers plcAnnual Report and Financial Statements 2019
Overview StrategicReport
GovernanceReport
Financial Statements

12
Helios Towers plcAnnual Report and Financial Statements 2019
Strategic Report
Q&A with Kash Pandya, CEO and Tom Greenwood, CFO.
A YEAR OF MILESTONES,ACHIEVEMENTS AND CONTINUED PROGRESS
Africa is a continent like no other. It claims all the superlatives: the fastest growing population and the fastest growing mobile market. Even when you look at the world’s Top 10 fastest growing cities - every one of them is in Africa.
Tom Greenwood | CFO
13
Helios Towers plcAnnual Report and Financial Statements 2019
Overview StrategicReport
GovernanceReport
Financial Statements
QEvery year tends to have a standout moment. What was it for Helios Towers in 2019?
AKash: Well, I believe there were at least three: our successful IPO in October, our entry into South Africa and our continued strong Adjusted EBITDA growth.
Taking the IPO first, it is a compliment to everyone at Helios Towers and to our partners who drive the miles and climb the towers. Together, we have all created something that has made seasoned investors want to participate.
I also think that an African-operating business listed on the LSE is good for African investment generally.
Tom: And we are primed for future expansion. We raised $125 million primary capital in the IPO, which combined with our potential debt capacity gives us significant firepower for further geographic expansion. As we now have listed stock we have the ability to raise further financing faster and more easily than before, should the right opportunity present itself.
QAnd South Africa?
AKash: South Africa is a vast and mature market with 103 million subscriptions. It is also leading the charge to the faster mobile technologies of 4G and 5G. When coupled with improvements in coverage, the associated demand for infrastructure is expected to require around 7,000 new PoS between 2018 to 2024.
The towerco model in South Africa is still immature with just 15% of towers in independent hands. This, coupled with the organic PoS growth potential, makes South Africa an exciting market for us.
Tom: And we’ve got off to a good start. Our culture has been understood and embedded. We acquired SA Towers in April, with its pipeline of over 500 permitted locations. And we closed the year with 118 towers and a tenancy ratio of 1.76x which tells us that our sites are in the right locations.
Kash: South Africa is also an incubator for new technologies – for example, the 5G spectrum auctions are due to take place shortly and independent forecasts suggest four million 5G users within the next five years. That’s great for us as 5G will require additional antenna on towers, and a greater density of tower infrastructure. The country is also a proving ground for adjacent technologies such as fibre and small cells. So it’s a good environment in which to develop upon the 13 fibre regeneration sites we acquired from Vulatel.
QAnd your third highlight was Adjusted EBITDA growth, closing the year with a 20th consecutive quarter of growth. What lies behind this uninterrupted run?
AKash: I see it as the natural consequence of us getting better at what we do each year. By the end of 2019, almost half of our employees had been trained in Lean Six Sigma and our desire to innovate and improve has never been sharper. For example, in 2019 we found ways to reduce diesel generator run-time by nearly 40% on optimised sites. We also improved the depth of discharge of our batteries by nearly one-third, and improved solar performance in Tanzania and DRC, boosting output on optimised sites by 16%. These are all significant increments that help us drive down fuel consumption, emissions and cost.
Tom: Continued organic growth in our markets and consistent delivery of business excellence to our customers ensures that we are the trusted partner for the MNOs to grow with; which in turn delivers our growth.
QAre you happy with the growth in the original four core markets?
ATom: Very much so. In 2019, we achieved Adjusted EBITDA growth in all of our markets, with DRC, Tanzania and Congo B growing double-digits. Looking forward, we do not see growth slowing, with approximately 12,000 additional PoS forecast in our four markets between 2018 to 2024.
This substantial growth is in-line with the rest of Africa. The continent claims all the superlatives: the fastest growing population and the fastest growing mobile market. Even when you look at the world’s Top 10 fastest growing cities – every one of them is in Africa.
The continent today is home to 1.3 billion people and the World Bank forecasts this will double by 2050 and triple by 2100. It has by far the fastest growing population of any continent on earth today. And less than half of the population are currently connected, so the growth potential stretches for decades to come.
QAnd what are the challenges?
AKash: The main challenge is also our single greatest priority, and that’s the safety of our staff and our contractor partners. This is principally due to the fact that (1) we operate in territories with some of the least developed road infrastructure in the world, and (2) the
extensive driving requirements we have to deliver our business services.
We naturally comply with all local requirements, but we take this much further and insist on embedding world-class standards. During the year we strengthened our resources in Health and Safety by appointing a dedicated Group Head of Safety, Health, Environment and Quality, to work on standardising and improving training, systems and processes across all of our operations.
Tom: Every business in Africa faces a significant risk from road traffic accidents. And in 2019 our partners drove more than 15 million kilometres to maintain our sites. But through rolling out training such as defensive driving we’ve seen accidents decrease significantly. We also continued to focus on skills for working at height. This included increasing our involvement in the “Taking Safety to New Heights” series of industry live events.
QAnd what about the wider context of working sustainably?
AKash: As a relatively young company this comes naturally to us. Sustainability, or environmental, social and governance (ESG), is ultimately about doing well by doing the right thing.
Rightly, this has risen up the business agenda, with investors, customers, employees and citizens expecting more. Our new life as a public company brings even greater expectations, and we welcome that.
So at the close of 2019 we started a process to take sustainability to the next level and to formalise how we continuously improve, identify gaps and drive meaningful actions. We will be developing our Sustainability reporting over the coming months and years so please watch this space for more.
QAnd what about next year – what are you excited about?
AKash: I am excited that the IPO has given us extra firepower and funding flexibility and we are assessing numerous potential acquisitions across Africa. But we remain as rigorous and selective as ever, only considering those that meet strict criteria and do not overstretch our management or financial resources.
And in our existing markets – we focus on delivering more of the same. We’ll continue to roll out wherever our customers need us, while driving down opex and environmental impacts through the awesome capabilities we have across the Group.

14
Po
pul
atio
n (b
illio
ns)
1950 1960 1970 1980 1990 2000 2010 2020 2030 2040 2050 2060 2070 2080 2090 2100
AsiaAfrica
Forecast
EuropeLatin America and the Caribbean North America
Africa
0
1
2
3
4
5
6
Helios Towers plcAnnual Report and Financial Statements 2019
Strategic Report
Market overview
WHY AFRICA?
Fast-growing populations, young, tech savvy users, under-penetrated mobile markets and minimal fixed line availability are all driving the need for telecom tower infrastructure across Africa.
AFRICAN MARKETS: DYNAMICS AND CHARACTERISTICS
The UN forecasts population growth across the continent of Africa will triple this century, to 4.3 billion.
Africa is also one of the world’s most rapidly urbanising populations. UN forecasts to 2035 highlight that all of the world’s top ten fastest growing cities are in Africa. Four of them are in our markets of DRC (Kinshasa, Lubumbashi and Mbuji-Mayi) and Tanzania (Dar es Salaam).
This population growth is mirrored by rising GDP. Africa accounts for five of the World Bank’s top ten fastest-growing economies in 2019 (and this includes our market of Ghana).
Together, these dynamics create a compelling macro environment for growth in mobile usage and, by extension, investment in mobile infrastructure.
Top ten fastest-growing economies(1) (2019)
5 in Africa(Including Ghana)
Top ten fastest-growing cities(2) (2020-2035E)
All in Africa(including Kinshasa, Dar es Salaam, Lubumbashi and Mbuji-Mayi)
MULTIPLE METRICS SUPPORT THE CASE FOR INVESTMENT IN AFRICAN MOBILE INFRASTRUCTURE:
• A fast-growing population. Africa’s total population is forecast to triple in the next 80 years, significantly faster than any other continent in the world.
• A young, tech savvy population. Africa has the largest proportion of population under 30 years of age. This demographic embraces technology and consumes vast amounts of mobile data through social media and app platforms. This drives MNOs to invest in both improving and expanding their networks in our markets.
• An urbanising population. UN forecasts show that the world’s top 10 fastest-growing cities are all in Africa. Denser and more populous cities create demand for increased mobile network capacity and associated investment by MNOs, both in new technologies (3G, 4G, 5G) and associated points of service, and network density (more sites).
• Scarce fixed line availability. African territories rely on mobile for nearly all their communications needs. Fixed line availability across the continent remains poor or indeed non-existent, with the vast African territories more practically and effectively served through mobile.
Helios Towers is well positioned to benefit from the resulting growth in under-penetrated markets in Africa.
(1) World Bank, 2019.(2) United Nations, World Urbanization Prospects, 2018 revision
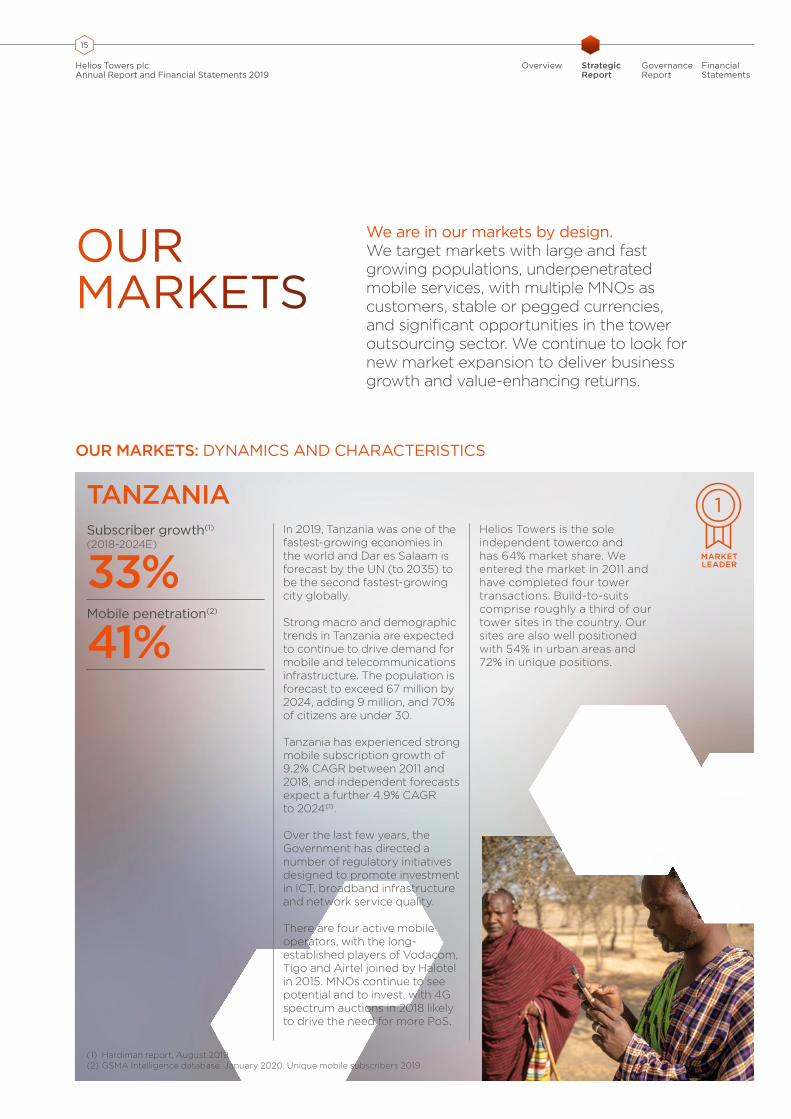
IMAGE TBC1451PPI
15
Helios Towers plcAnnual Report and Financial Statements 2019
Overview StrategicReport
GovernanceReport
Financial Statements
OUR MARKETS
We are in our markets by design. We target markets with large and fast growing populations, underpenetrated mobile services, with multiple MNOs as customers, stable or pegged currencies, and significant opportunities in the tower outsourcing sector. We continue to look for new market expansion to deliver business growth and value-enhancing returns.
OUR MARKETS: DYNAMICS AND CHARACTERISTICS
TANZANIA
(1) Hardiman report, August 2019(2) GSMA Intelligence database. January 2020. Unique mobile subscribers 2019
Subscriber growth(1)
(2018-2024E)
33%Mobile penetration(2)
41%
In 2019, Tanzania was one of the fastest-growing economies in the world and Dar es Salaam is forecast by the UN (to 2035) to be the second fastest-growing city globally.
Strong macro and demographic trends in Tanzania are expected to continue to drive demand for mobile and telecommunications infrastructure. The population is forecast to exceed 67 million by 2024, adding 9 million, and 70% of citizens are under 30.
Tanzania has experienced strong mobile subscription growth of 9.2% CAGR between 2011 and 2018, and independent forecasts expect a further 4.9% CAGR to 2024(1).
Over the last few years, the Government has directed a number of regulatory initiatives designed to promote investment in ICT, broadband infrastructure and network service quality.
There are four active mobile operators, with the long-established players of Vodacom, Tigo and Airtel joined by Halotel in 2015. MNOs continue to see potential and to invest, with 4G spectrum auctions in 2018 likely to drive the need for more PoS.
Helios Towers is the sole independent towerco and has 64% market share. We entered the market in 2011 and have completed four tower transactions. Build-to-suits comprise roughly a third of our tower sites in the country. Our sites are also well positioned with 54% in urban areas and 72% in unique positions.
MARKET LEADER

IMAGE TBC1451PPI
16
Helios Towers plcAnnual Report and Financial Statements 2019
DRC
(1) Hardiman report, August 2019(2) GSMA Intelligence database. January 2020. Unique mobile subscribers 2019
Subscriber growth(1)
(2018-2024E)
66%Mobile penetration(2)
38%DRC is the second largest country in Africa and covers an area the size of Western Europe. Logistics are therefore a challenge, but also an opportunity.
Its population exceeded 84 million in 2018 and is forecasted to reach over 100 million in the next five years. By 2035, the UN predicts that the population will nearly double in Kinshasa, DRC’s capital city, making it the seventh largest city in the world at c.27 million inhabitants. With over 70% of the population under the age of 30, the demographics all point to continued growth in mobile.
Mobile penetration is currently low, at just over 38%, and only around 50% of the country has mobile coverage.
In 2017, the telecommunications minister announced plans to establish a universal service fund designed to extend network coverage to rural and underserved regions.
In 2018, Helios Towers rolled out a new 1,800km microwave backbone tower network to bring mobile network coverage to a further six million people in new territories.
The scope for growth remains vast. Between 2011 and 2018, DRC saw mobile subscription growth of 14% annually, which includes government-imposed disconnections of unregistered SIM cards in 2015, an encouraging step forward in further professionalising the market. Independent forecasts project a further 9% CAGR to 2024(1).
There are four mobile operators in a balanced competitive market structure, with Vodacom, Orange (which acquired Tigo in 2016) and Airtel being increasingly challenged by the slightly later entrant Africell, who launched in 2012.
MNOs continue to invest in expanding their infrastructure. All were awarded 4G licences in 2018 to add to their existing 3G expansion plans, driving expectations of continued strong PoS growth.
Helios Towers is the sole independent towerco with a 63% market share. We entered the market in 2011 and have completed two acquisitions as well as adding considerable build-to-suit sites and the new backbone network. Our sites are well positioned with 67% in urban areas and 68% in unique locations.
OUR MARKETS: DYNAMICS AND CHARACTERISTICS (CONTINUED)
Strategic Report
Market overview continued
OUR MARKETS
MARKET LEADER

IMAGE TBC1451PPI
17
Helios Towers plcAnnual Report and Financial Statements 2019
Overview StrategicReport
GovernanceReport
Financial Statements
GHANASubscriber growth(1)
(2018-2024E)
14%Mobile penetration(2)
55%
One of our most mature markets, Ghana already boasts 55% mobile penetration of its 30 million population, as well as regionally high smartphone ownership driving increased demand for mobile data.
Between 2012 and 2018 Ghana saw mobile subscription CAGR of 7.0%, with independent forecasts suggesting this will ease to 2.3% CAGR to 2024.
Network expansion is supported by government-led initiatives such as the rural telephony project, designed to accelerate mobile penetration in the country and should, in turn, drive organic growth for our business.
The merger of Airtel and Tigo in 2017 has resulted in some network consolidation. Longer-term, the merger is expected to catalyse network investment by all operators as competition intensifies, creating further growth opportunities for our business.
The market now supports three main mobile players, with the other two being MTN and Vodafone, both of whom have received 4G licences to drive network investment in new PoS.
Helios Towers is one of two independent players in the competitive towerco market, following this year’s merger of American Tower and Eaton Towers, with 21% market share. We entered the market in 2010 with the acquisition of Millicom’s sites and have been adding meaningful volumes of build-to-suit sites in the last few years. Helios Towers’ sites are well positioned with 79% in urban areas and 59% uniquely positioned.
(1) Hardiman report, August 2019(2) GSMA Intelligence database. January 2020. Unique mobile subscribers 2019
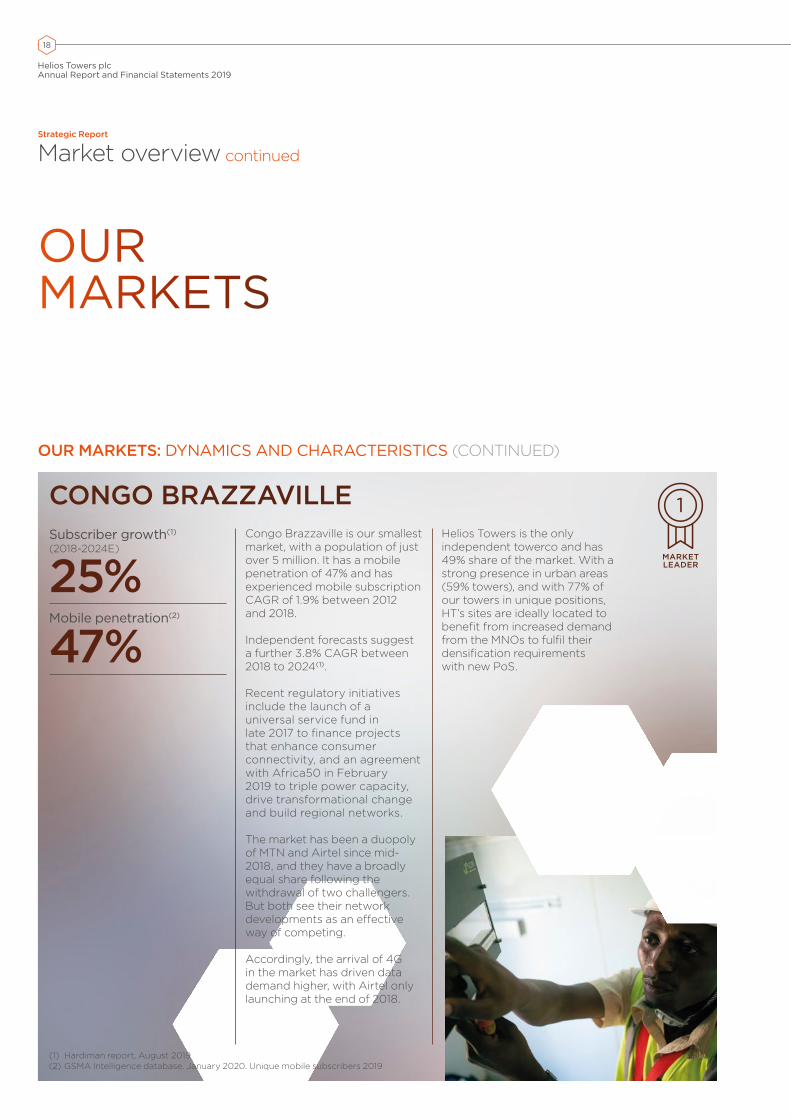
IMAGE TBC1451PPI
18
Helios Towers plcAnnual Report and Financial Statements 2019
Strategic Report
Market overview continued
OUR MARKETS
OUR MARKETS: DYNAMICS AND CHARACTERISTICS (CONTINUED)
CONGO BRAZZAVILLE
(1) Hardiman report, August 2019(2) GSMA Intelligence database. January 2020. Unique mobile subscribers 2019
Subscriber growth(1)
(2018-2024E)
25% Mobile penetration(2)
47%
Congo Brazzaville is our smallest market, with a population of just over 5 million. It has a mobile penetration of 47% and has experienced mobile subscription CAGR of 1.9% between 2012 and 2018.
Independent forecasts suggest a further 3.8% CAGR between 2018 to 2024(1).
Recent regulatory initiatives include the launch of a universal service fund in late 2017 to finance projects that enhance consumer connectivity, and an agreement with Africa50 in February 2019 to triple power capacity, drive transformational change and build regional networks.
The market has been a duopoly of MTN and Airtel since mid-2018, and they have a broadly equal share following the withdrawal of two challengers. But both see their network developments as an effective way of competing.
Accordingly, the arrival of 4G in the market has driven data demand higher, with Airtel only launching at the end of 2018.
Helios Towers is the only independent towerco and has 49% share of the market. With a strong presence in urban areas (59% towers), and with 77% of our towers in unique positions, HT’s sites are ideally located to benefit from increased demand from the MNOs to fulfil their densification requirements with new PoS.
MARKET LEADER

19
Helios Towers plcAnnual Report and Financial Statements 2019
Overview StrategicReport
GovernanceReport
Financial Statements
SOUTH AFRICA
(1) Hardiman report, August 2019(2) GSMA Intelligence database. January 2020. Unique mobile subscribers 2019
Subscriber growth(1)
(2018 - 2024E)
8%Mobile penetration(2)
67%
Our most recent entry, and also the most mature of our markets, South Africa is the economic powerhouse of sub-Saharan Africa.
South Africa boasts a relatively high mobile penetration of 67% of its 58 million population, but this is still well below the G7 average of 85%. The country also shows very high smartphone ownership, resulting in increasing demand for mobile data.
Independent forecasts suggest mobile subscriptions will grow 1.3% annually to 2024, driving 7,000 additional PoS between 2018 to 2024.
Pertinent regulatory initiatives include the ECA Amendment Bill which requires service providers with at least 25% of South Africa’s network infrastructure to share their networks with competitors. There have been delays to spectrum allocation over recent years, with the 2019 auction likely to release some pent-up demand in the coming years for new infrastructure rollouts that make use of the new capacity. 5G trials have begun and should drive demand further.
The market supports four main mobile operators, with the players Vodacom, MTN and Cell C joined most recently by Telkom in 2010, which remains the smaller challenger. All of the MNOs have received 4G licences to add to their 2G and 3G spectrum, driving network investment in new PoS.
Helios Towers is one of several players in the competitive towerco market. We entered South Africa in 2019 through a partnership with Vulatel. Shortly afterwards we announced the acquisition of SA Towers, and with it a pipeline of 500 site locations.
South Africa is a vast and mature market with 103 million subscriptions. It is also leading the charge to the faster mobile technologies of 4G and 5G. When coupled with improvements in coverage, the associated demand for infrastructure is expected to require approximately 7,000 new PoS between 2018 and 2024.
Kash Pandya | CEO
20
Helios Towers plcAnnual Report and Financial Statements 2019
Strategic Report
Business model
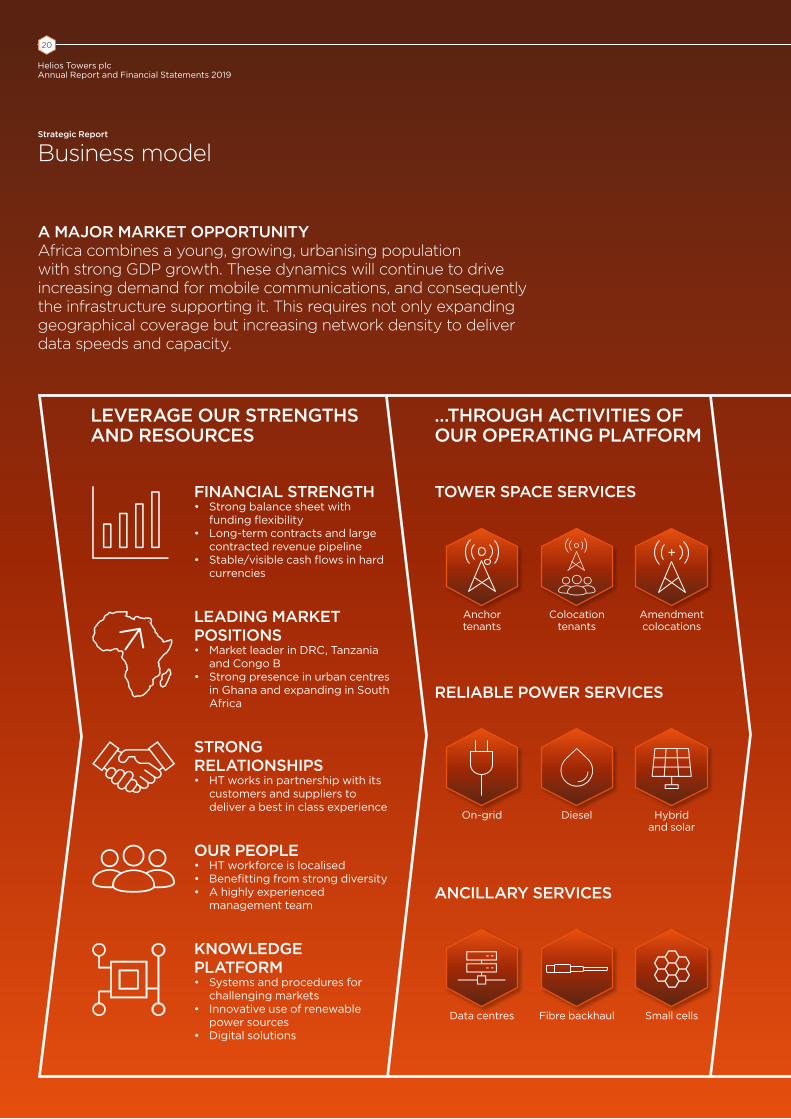
A MAJOR MARKET OPPORTUNITY Africa combines a young, growing, urbanising population with strong GDP growth. These dynamics will continue to drive increasing demand for mobile communications, and consequently the infrastructure supporting it. This requires not only expanding geographical coverage but increasing network density to deliver data speeds and capacity.
LEVERAGE OUR STRENGTHS AND RESOURCES
FINANCIAL STRENGTH• Strong balance sheet with
funding flexibility• Long-term contracts and large
contracted revenue pipeline• Stable/visible cash flows in hard
currencies
LEADING MARKET POSITIONS• Market leader in DRC, Tanzania
and Congo B• Strong presence in urban centres
in Ghana and expanding in South Africa
STRONG RELATIONSHIPS• HT works in partnership with its
customers and suppliers to deliver a best in class experience
OUR PEOPLE• HT workforce is localised• Benefitting from strong diversity• A highly experienced
management team
KNOWLEDGE PLATFORM• Systems and procedures for
challenging markets• Innovative use of renewable
power sources• Digital solutions
TOWER SPACE SERVICES
Anchortenants
Colocationtenants
Amendment colocations
RELIABLE POWER SERVICES
On-grid Diesel Hybrid and solar
ANCILLARY SERVICES
Data centres Fibre backhaul Small cells
…THROUGH ACTIVITIES OF OUR OPERATING PLATFORM
21
Helios Towers plcAnnual Report and Financial Statements 2019
Overview StrategicReport
GovernanceReport
Financial Statements
OUR PURPOSE: To drive the growth of communications in Africa.
OUR VISION: Our vision is to be the leading telecoms infrastructure company in Africa.
CUSTOMERS• More efficient tower usage (30%
discount to total cost of ownership)
• Reduced capital investment by MNOs frees resources to invest in differentiated propositions
COMMUNITY AND ENVIRONMENT• Contributions to building
local economies that enable businesses and individuals to grow
• Reduced environmental impact through our sustainable operating platform
SUPPLIER PARTNERS• Integrated partnerships
with benefits including training and shared offices
EMPLOYEES• Employment, training and
promotion opportunities for local people, both with us and with our partners
SHAREHOLDERS• Aim to maximise value
generation through full execution of the strategy
• Dividend distribution policy to be considered in medium-term
…DRIVEN BY STRATEGY OF SUSTAINABLE PROFITABLE GROWTH
THREE STRATEGIC PRIORITIES
1. GROWTH• Existing markets• New markets• New offerings
For more information go toOur strategy on pg.22
2. BUSINESS EXCELLENCE• Supply chain optimisation• Business digitalisation• Lean Six Sigma
For more information go toOur strategy on pg.24
3. SUSTAINABILITY• Building partnerships• Training local people• Environmental responsibility• Embedding our values
For more information go toOur strategy on pg.26
… TO DELIVER VALUE TO OUR STAKEHOLDERS

22
Helios Towers plcAnnual Report and Financial Statements 2019
ENTERINGSOUTH AFRICA
Strategic Report
Our strategy
GROWTH
In 2019 we entered our fifth territory, and our most developed mobile market: South Africa.
The country offers a compelling opportunity for the Group. The population of 58 million is projected to rise to some 62 million by 2024. Furthermore, with a unique mobile subscriber base of 67% and some geographical areas with limited mobile coverage there remains considerable room for growth.
At the same time, the country’s rapid adoption of smartphones and an ever-increasing reliance on mobile data communications is driving the MNOs to invest in 4G network rollout, and to prepare for 5G. A potential source of funding for these investments may well lie in operators’ divesting their tower assets; and there is ample scope to do so. Of the 29,000 tower sites in South Africa, only around 15% are currently owned and operated by independent tower companies. Coupled with the logistical and economic benefits of colocation, we see excellent opportunities for our business to support MNOs focus their investments more effectively.
We also see South Africa as more than simply a tower opportunity. The MNOs are looking to improve their infrastructure and this plays directly to our strengths in providing efficient and high-quality power, bringing expertise and experience that we have gained in our other markets.
A PRODUCTIVE PARTNERSHIPWe entered South Africa early in 2019, creating Helios Towers South Africa (“HTSA”) as a majority-owned subsidiary, together with Vulatel. This partner gave us a strong foothold in the market through their deep local mobile industry experience and 13 edge data centres. Vulatel is a 69% black-owned and 45% black women-owned business with a Level 2 B-BEE (Broad Based Black Economic Empowerment) rating.
In April, HTSA acquired SA Towers, and with it a pipeline of more than 500 potential tower sites that we have identified as being of potential interest to MNOs.
By the end of the year we had 118 sites with a tenancy ratio of 1.76x, with a target of 1,000 sites by the third anniversary of the deal in 2022.
PROGRESS IN 2019:• Adjusted EBITDA growth in
all of our markets.
• New market entry into South Africa.
• Growth in tenancies in all markets.
• Growth in tenancy ratio across all markets.
• New edge data centre services.
OUTLOOK FOR 2020• Our markets should continue
to support organic growth for the Group for many years to come.
• Additionally we are actively reviewing a number of potential inorganic opportunities to supplement this growth both in our current markets and new markets.
• We will continue to develop new ancillary services and rollout those we have already successfully established in individual markets across the wider Group, as appropriate.
STRATEGY IN ACTION
58mPopulation(1)
29,000Towers(2)
7,000Additional PoS required (2018–2024)(3)
(1) Source: United Nations, World Population Prospects, June 2019(2) TowerXchange Issue 25(3) Hardiman Report, August 2019
23
Helios Towers plcAnnual Report and Financial Statements 2019
Overview StrategicReport
GovernanceReport
Financial Statements
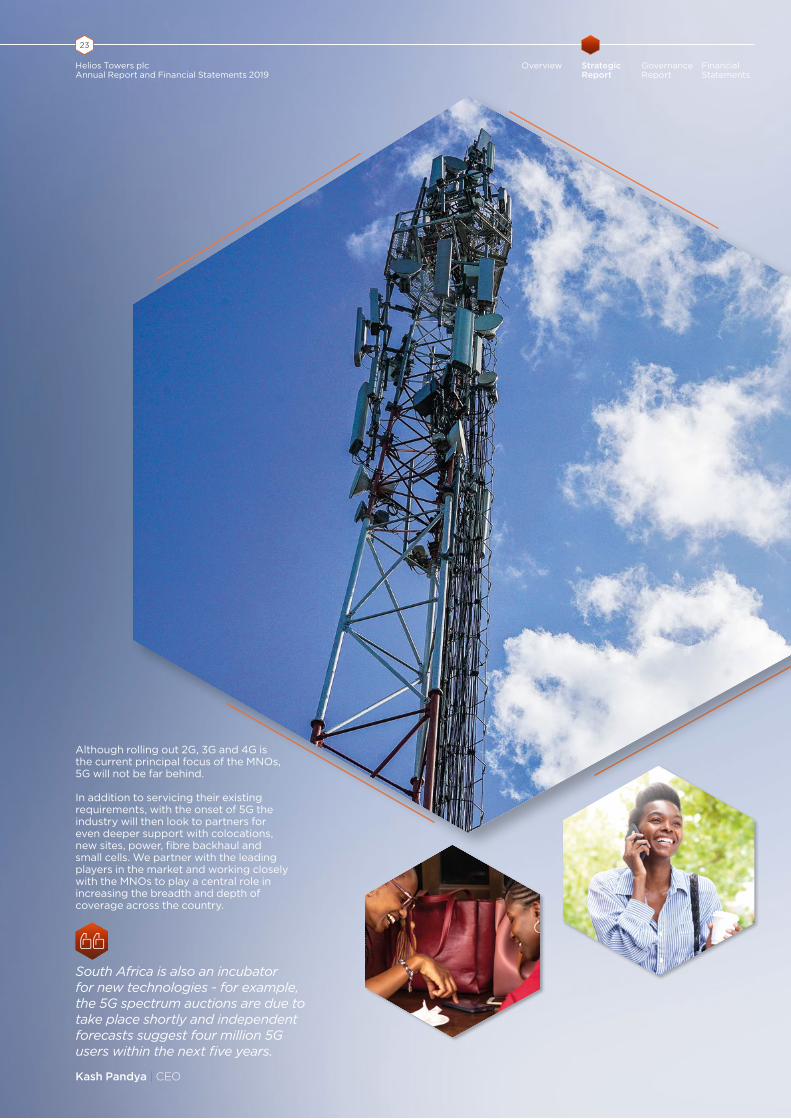
Although rolling out 2G, 3G and 4G is the current principal focus of the MNOs, 5G will not be far behind.
In addition to servicing their existing requirements, with the onset of 5G the industry will then look to partners for even deeper support with colocations, new sites, power, fibre backhaul and small cells. We partner with the leading players in the market and working closely with the MNOs to play a central role in increasing the breadth and depth of coverage across the country.
South Africa is also an incubator for new technologies - for example, the 5G spectrum auctions are due to take place shortly and independent forecasts suggest four million 5G users within the next five years.
Kash Pandya | CEO
24
Helios Towers plcAnnual Report and Financial Statements 2019
Strategic Report
Our strategy continued
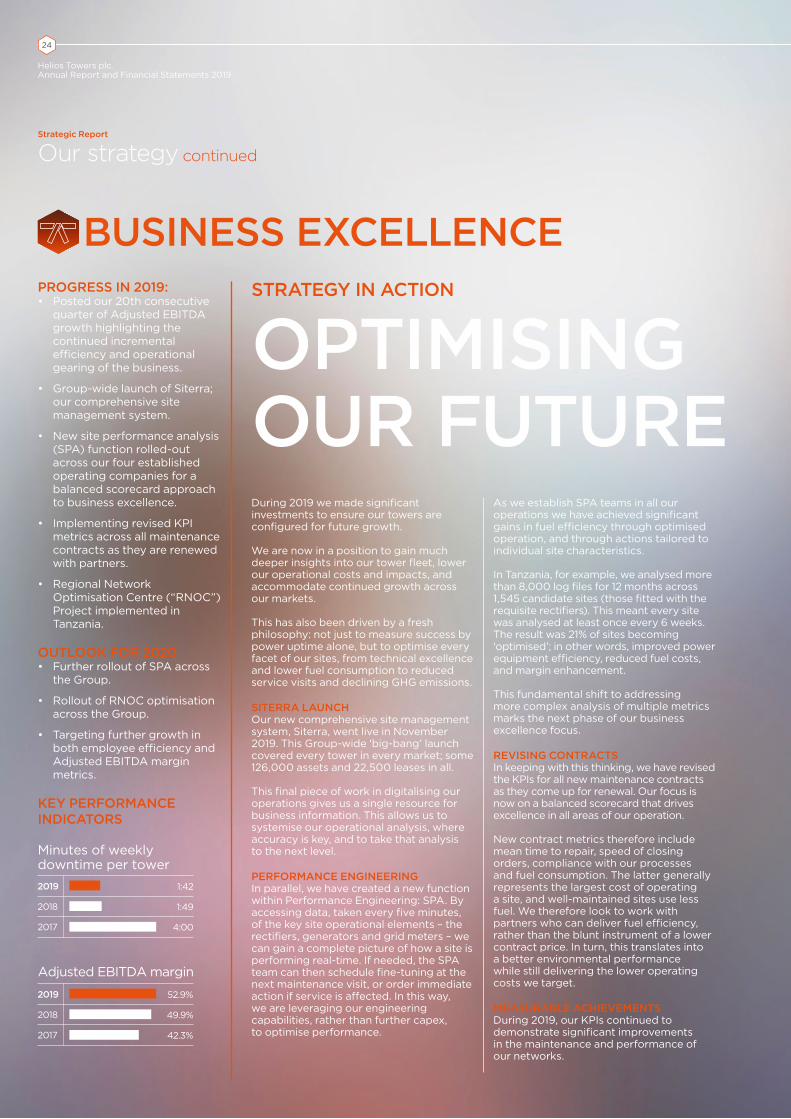
BUSINESS EXCELLENCE
During 2019 we made significant investments to ensure our towers are configured for future growth.
We are now in a position to gain much deeper insights into our tower fleet, lower our operational costs and impacts, and accommodate continued growth across our markets.
This has also been driven by a fresh philosophy: not just to measure success by power uptime alone, but to optimise every facet of our sites, from technical excellence and lower fuel consumption to reduced service visits and declining GHG emissions.
SITERRA LAUNCHOur new comprehensive site management system, Siterra, went live in November 2019. This Group-wide ‘big-bang’ launch covered every tower in every market; some 126,000 assets and 22,500 leases in all.
This final piece of work in digitalising our operations gives us a single resource for business information. This allows us to systemise our operational analysis, where accuracy is key, and to take that analysis to the next level.
PERFORMANCE ENGINEERINGIn parallel, we have created a new function within Performance Engineering: SPA. By accessing data, taken every five minutes, of the key site operational elements – the rectifiers, generators and grid meters – we can gain a complete picture of how a site is performing real-time. If needed, the SPA team can then schedule fine-tuning at the next maintenance visit, or order immediate action if service is affected. In this way, we are leveraging our engineering capabilities, rather than further capex, to optimise performance.
As we establish SPA teams in all our operations we have achieved significant gains in fuel efficiency through optimised operation, and through actions tailored to individual site characteristics.
In Tanzania, for example, we analysed more than 8,000 log files for 12 months across 1,545 candidate sites (those fitted with the requisite rectifiers). This meant every site was analysed at least once every 6 weeks. The result was 21% of sites becoming ‘optimised’; in other words, improved power equipment efficiency, reduced fuel costs, and margin enhancement.
This fundamental shift to addressing more complex analysis of multiple metrics marks the next phase of our business excellence focus. REVISING CONTRACTSIn keeping with this thinking, we have revised the KPIs for all new maintenance contracts as they come up for renewal. Our focus is now on a balanced scorecard that drives excellence in all areas of our operation.
New contract metrics therefore include mean time to repair, speed of closing orders, compliance with our processes and fuel consumption. The latter generally represents the largest cost of operating a site, and well-maintained sites use less fuel. We therefore look to work with partners who can deliver fuel efficiency, rather than the blunt instrument of a lower contract price. In turn, this translates into a better environmental performance while still delivering the lower operating costs we target.
MEASURABLE ACHIEVEMENTSDuring 2019, our KPIs continued to demonstrate significant improvements in the maintenance and performance of our networks.
PROGRESS IN 2019:• Posted our 20th consecutive
quarter of Adjusted EBITDA growth highlighting the continued incremental efficiency and operational gearing of the business.
• Group-wide launch of Siterra; our comprehensive site management system.
• New site performance analysis (SPA) function rolled-out across our four established operating companies for a balanced scorecard approach to business excellence.
• Implementing revised KPI metrics across all maintenance contracts as they are renewed with partners.
• Regional Network Optimisation Centre (“RNOC”) Project implemented in Tanzania.
OUTLOOK FOR 2020• Further rollout of SPA across
the Group.
• Rollout of RNOC optimisation across the Group.
• Targeting further growth in both employee efficiency and Adjusted EBITDA margin metrics.
KEY PERFORMANCE INDICATORS
Minutes of weekly downtime per tower
1:422019
1:492018
4:002017
Adjusted EBITDA margin
52.9%2019
49.9%2018
42.3%2017
STRATEGY IN ACTION
OPTIMISINGOUR FUTURE

25
Helios Towers plcAnnual Report and Financial Statements 2019
Overview StrategicReport
GovernanceReport
Financial Statements
Examples included:
• A 39% reduction in diesel generator run-time on 519 sites that were optimised by our SPA team.
• A 16% increase in the solar output on our 400 sites in DRC and Tanzania.
• Improved generator efficiency and tower uptime performance through reduced battery cycles.
In 2020, with Siterra and our SPA teams newly in place, we look forward to performing even more strongly, delivering optimised tower networks for our customers that are robust, cost less to operate and have a decreasing impact on their environments.
We are now in a position to gain much deeper insights into our tower fleet, lower our operational costs and impacts, and accommodate continued growth across our markets.
Kash Pandya | CEO

26
Helios Towers plcAnnual Report and Financial Statements 2019
Strategic Report
Our strategy continued
SUSTAINABILITYPROGRESS IN 2019:• Attained the Anti-Bribery
management system certification (ISO 37001). This added to our comprehensive suite of management systems that are aligned to international best practices and includes: Quality (9001), environment (14001), and safety management (18001).
• Enhanced Board with appointment of new independent Chair and two additional independent Non-Executive Directors.
• Contributing to industry-wide initiatives through the organisation of live events focused on lifting safety standards, and active focus on improving driving standards in our operations.
• Continued roll out of leadership development programs across the Group.
• Commenced active strategy development of our sustainability agenda, including benchmarking, stakeholder engagement and materiality assessment; to be aligned with recognised standards and measured against UN Sustainable Development Goals.
OUTLOOK FOR 2020• Completion of strategy
development of our sustainability agenda.
• Further Board enhancement through additional non-executive appointment.
• Continued implementation of SHEQ programme.
STRATEGY IN ACTION
GOING HOME SAFESafety, Health, the Environment and Quality (‘SHEQ’) have always been important to the Group. And we are further building on our achievements by embedding a uniform SHEQ culture across the operating companies through our newly appointed Group Head of Health, Safety, Environment and Quality, Will Richardson-White.
The care and consideration we give to the whole workforce remains clear. The Group has strong systems and standards, including in collecting and acting on data. And our efforts go beyond a concern for our own employees. Our business uses a large number of contractors, with whom we have been working in ever closer alignment with our rigorous systems and standards.
We have also taken the opportunity to tighten processes and data so that our five operating companies have now adopted a uniform Group-level approach.
EMBRACING CHANGE The business has continued to demonstrate a remarkable ability to adopt behavioural change rapidly. This is due to the Lean Six Sigma culture that has been embedded in the business for many years, helping the Group to achieve change in months that might have taken many times longer elsewhere.
The biggest safety risk for our people concerns road traffic accidents, which remain notoriously frequent across our territories of operation. With our employees and contractors driving around 15 million kilometres a year, mostly for maintenance and refuelling visits to tower sites, we need to be proactive to help ensure the safety of our drivers. We have therefore undertaken an extensive programme of defensive driving tuition.
Working at height is another main area of risk at Helios Towers. We are currently auditing the equipment and processes used by our maintenance engineers, and sharing our knowledge by supporting live events for the benefit of the industry as a whole. The SHEQ philosophy that now runs across the Group is more forward-looking and preventative. While lagging (i.e. past) indicators can and do provide valuable insights, it is on leading (future) indicators that our energies are now more focused.
27
Helios Towers plcAnnual Report and Financial Statements 2019
Overview StrategicReport
GovernanceReport
Financial Statements
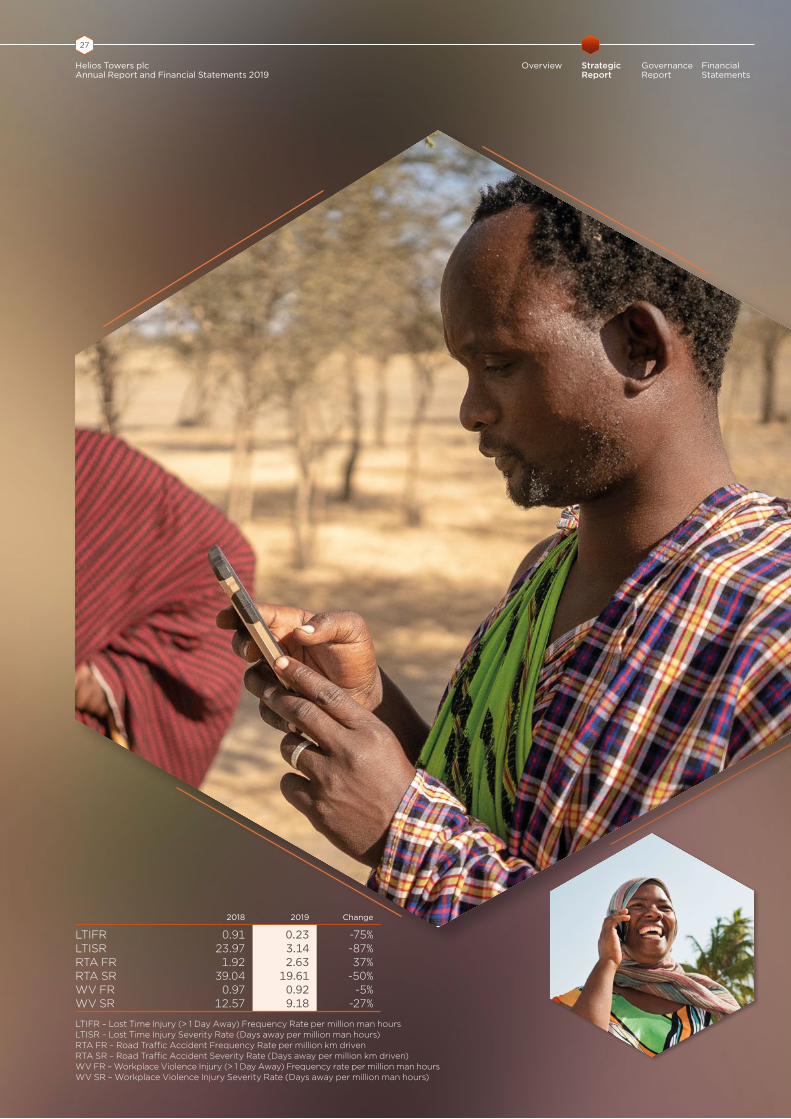
2018 2019 Change
LTIFR 0.91 0.23 -75%LTISR 23.97 3.14 -87%RTA FR 1.92 2.63 37%RTA SR 39.04 19.61 -50%WV FR 0.97 0.92 -5%WV SR 12.57 9.18 -27% LTIFR – Lost Time Injury (> 1 Day Away) Frequency Rate per million man hoursLTISR – Lost Time Injury Severity Rate (Days away per million man hours)RTA FR – Road Traffic Accident Frequency Rate per million km drivenRTA SR – Road Traffic Accident Severity Rate (Days away per million km driven)WV FR – Workplace Violence Injury (> 1 Day Away) Frequency rate per million man hoursWV SR – Workplace Violence Injury Severity Rate (Days away per million man hours)
28
Helios Towers plcAnnual Report and Financial Statements 2019
Strategic Report
Sustainability
DEVELOPING A SUSTAINABILITY FRAMEWORK
THE PROCESS TOWARDS A SUSTAINABILITY FRAMEWORKWe provide employment, directly or indirectly, for more than 7,000 people.
Our business also operates around 7,000 towers that require regular maintenance and, in most cases, significant amounts of fossil fuel energy.
To align our practices even more closely to our goals, and to adopt best-practice in environmental, social and governance (ESG) considerations, Helios Towers is creating a formal sustainability framework. This work is well under way. In Q1 2019 we started a structured process, carrying out an initial materiality assessment to see what we could learn from other businesses generally, and our peers in particular.
Additionally, each of our employees was invited to respond to a sustainability survey. The response rate of 74% was exceptionally high, which not only gave us a large base of opinion but was a pleasing indicator of the importance of sustainability to our people.
We also interviewed representatives from our shareholders, key partners and the Executive Management Team for their perspectives.
For more information on our sustainability framework go towww.heliostowers.com
For more information go to page 32
For more information go to page 35
For more information go to page 31
For more information go to page 34
For more information go to page 33
CONNECTIVITY AND SUSTAINABILITY
LIFTING SAFETY TO NEW HEIGHTS
DEVELOPING OUR PEOPLE
ANTI-BRIBERY: ISO 37001 CERTIFICATION
SAME POWER LESS FUEL

29
Helios Towers plcAnnual Report and Financial Statements 2019
Overview StrategicReport
GovernanceReport
Financial Statements
Below, we share our initial findings on where our focus should be, as identified through the materiality assessment undertaken which includes: governance, employees, pre-IPO shareholders, society and the environment. From page 32, we expand on each of these pillars.
Meanwhile, this piece of work continues and we intend to publish our definitive sustainability framework during 2020.
MATERIALITY ISSUES: THE FRAMEWORK PILLARS
GOVERNANCE
We believe in the importance of good governance and are committed to acting ethically and with integrity, ensuring we comply with regulation and have a positive impact on people’s fundamental rights.
EMPLOYEES
We believe that fostering a welcoming and inclusive culture, in which every employee can be themselves and fulfil their potential, is an important moral consideration, as well as essential to our success as a company.
SOCIETY
Everyone has a role to play in addressing the challenges facingsociety. We are working hard to assess the impact of our business on the communities in which we operate and how we can contribute positively and create long-lasting value.
ENVIRONMENT
With climate change a threat facing the whole world, it is important we are part of the solution rather than the problem; looking at how we can use resources more responsibly, right across our value chain.
• Being an ethical business
• Legal / regulatory compliance
• Data privacy and security
• Human rights
• Diversity and inclusion• Employee attraction
and development• Employee engagement• Health, safety and
wellbeing
• Local community engagement
• Economic development• Community health and
wellbeing
• GHG and energy use• Safe and responsible
supply chain
UNDERPINNED BY GOVERNANCETo attain and maintain the highest standards across our operations, Helios Towers has now gained accreditations
in four management systems: ISO 9001 (Quality); ISO 14001 (Environmental Management); OSHAS 18001 (Health & Safety Management); and ISO 37001 (Anti-Bribery). We believe we are
one of very few enterprises in Africa to hold all four of these standards.
30
Helios Towers plcAnnual Report and Financial Statements 2019
Strategic Report
Sustainability continued
ENGAGING WITH OUR STAKEHOLDERS
STAKEHOLDER GROUP WHY IS IT IMPORTANT TO ENGAGE? HOW WE ENGAGE
EMPLOYEES
Our employees are a key asset of the business. We nurture and invest in our people to give them the tools to be effective and the opportunities to grow within the business. By doing this we ensure we retain an engaged, happy, productive and efficient workforce.
• Training and education programmes• Town hall and other employee meetings• Employee satisfaction surveys• Performance reviews and career conversations• Group intranet of newsletters• Volunteering programmes• Code of ethics• Social events
COMMUNITY AND ENVIRONMENT
Our business is part of the communications supply chain that breathes economic and social life into the local communities it serves. We want to ensure that the communities we help to serve maximise all the benefits of the vital services made available to them, in the most sustainable way, and with minimal environmental impact.
• Partnership in community programmes• Group initiatives such as “Power to the
people”. (A project where we delivered solar powered street lighting and USB ports to communities in Tanzania and DRC)
CUSTOMERS
Our customers are at the centre of everything we do. Our customers choose us to accelerate their growth ambitions and to lower their costs of delivering crucial services. Regular engagement is vital for speed and efficiency of service and therefore critical to our customers; and in turn, our performance drives theirs.
• Regular meetings and communication• Customer surveys• Conferences• Involvement in industry partnership
programmes and industry groups
SUPPLIER PARTNERS
To ensure our supplier relationships are true partnerships takes time and effort by both parties to bring about successful collaborations. We streamline our supplier base so that we can focus on, and invest in, a select few, developing true partnerships that create value. The development of sustainable long-term relationships is necessary to build and maintain assets that need to last for decades.
• Regular meetings and communication• Conferences• Industry training activities• Supplier surveys• Third party code of conduct• Co-habiting work environments
INVESTORS
Investors have provided the business with the capital to invest. Regular engagement with investors is vital to ensure they understand the business model, strategy, opportunities and risks. This will ensure they continue to provide the funding flexibility required for full execution of the strategy, and in turn we will be able to continue to deliver value to their investments.
• Detailed quarterly reporting and annual report• RNS announcements, as appropriate• AGM and other shareholder meetings• Investor roadshows• Investor and industry conferences• Capital markets days • Calls and meetings• Sell side equity research analysts engagement • Investor relations website
‘Partnership’ is one of our core values, and this characterises our relationships and interactions with all our varied stakeholders.
We work with our communities in the careful siting and operation of our towers, and their cooperation enables us to bring the myriad of benefits of mobile into their daily lives.
Many of these local people will also work with us, and together we benefit from the significant investment we make in training and personal development. In 2020 we will be introducing employee engagement surveys and providing feedback from our employees to the Board.
As a significant consumer of fuel, we make available a report into our greenhouse gas emissions and are focusing on reducing them wherever we can.
We have formed close ties with our customers and engage with them through dedicated account managers at local level, supported by customer-specific project managers and senior management. In the case of our maintenance partners, we even embed our own staff in their offices, to optimise communication and foster a ‘one team’ ethos.
We also have multiple channels of communication for our investors and shareholders, ranging from our regular reporting and investor roadshows to conferences, capital markets days and ad hoc meetings and calls.
Our Section 172 disclosure provides information on how the Directors have engaged with the Company’s key stakeholders to help inform the Board’s decision-making. This is available on pages 50 and 51.

31
Helios Towers plcAnnual Report and Financial Statements 2019
Overview StrategicReport
GovernanceReport
Financial Statements
STAKEHOLDER GROUP WHY IS IT IMPORTANT TO ENGAGE? HOW WE ENGAGE
EMPLOYEES
Our employees are a key asset of the business. We nurture and invest in our people to give them the tools to be effective and the opportunities to grow within the business. By doing this we ensure we retain an engaged, happy, productive and efficient workforce.
• Training and education programmes• Town hall and other employee meetings• Employee satisfaction surveys• Performance reviews and career conversations• Group intranet of newsletters• Volunteering programmes• Code of ethics• Social events
COMMUNITY AND ENVIRONMENT
Our business is part of the communications supply chain that breathes economic and social life into the local communities it serves. We want to ensure that the communities we help to serve maximise all the benefits of the vital services made available to them, in the most sustainable way, and with minimal environmental impact.
• Partnership in community programmes• Group initiatives such as “Power to the
people”. (A project where we delivered solar powered street lighting and USB ports to communities in Tanzania and DRC)
CUSTOMERS
Our customers are at the centre of everything we do. Our customers choose us to accelerate their growth ambitions and to lower their costs of delivering crucial services. Regular engagement is vital for speed and efficiency of service and therefore critical to our customers; and in turn, our performance drives theirs.
• Regular meetings and communication• Customer surveys• Conferences• Involvement in industry partnership
programmes and industry groups
SUPPLIER PARTNERS
To ensure our supplier relationships are true partnerships takes time and effort by both parties to bring about successful collaborations. We streamline our supplier base so that we can focus on, and invest in, a select few, developing true partnerships that create value. The development of sustainable long-term relationships is necessary to build and maintain assets that need to last for decades.
• Regular meetings and communication• Conferences• Industry training activities• Supplier surveys• Third party code of conduct• Co-habiting work environments
INVESTORS
Investors have provided the business with the capital to invest. Regular engagement with investors is vital to ensure they understand the business model, strategy, opportunities and risks. This will ensure they continue to provide the funding flexibility required for full execution of the strategy, and in turn we will be able to continue to deliver value to their investments.
• Detailed quarterly reporting and annual report• RNS announcements, as appropriate• AGM and other shareholder meetings• Investor roadshows• Investor and industry conferences• Capital markets days • Calls and meetings• Sell side equity research analysts engagement • Investor relations website
DEVELOPING OUR PEOPLE
We appreciate the needs of all our people to receive appropriate help, advice and support throughout their careers with the Group.
By the end of 2019, 45% of our staff had been trained in Lean Six Sigma, which provides essential skills and techniques to eliminate waste and drive efficiencies. Once trained, we encourage our people to manage a new project across HT, reinforcing the Lean mindset while also improving business performance.
We also understand the need to equip our leaders, both new and experienced, with the skills and capabilities to be the best they can be. And this year, with our partners MindGym, we delivered 5 days’ training for our leadership group of around 60.
We held courses in London, and at our operating companies in Ghana, Tanzania, and DRC (who were joined by colleagues from Congo Brazzaville).
The courses addressed topics such as how to manage colleagues who were formerly of equal seniority; and how experienced leaders can continue to energise and inspire their teams.
Meanwhile, for the benefit of all our employees we also invested in developing Success Factors; software that enables us to monitor regular performance reviews in real-time and gives us centralised oversight. This means that we can pick up on issues straight away and offer constructive help and input as soon as it is needed.
Percentage of staff trained in Lean Six Sigma
+10%2019: 45% trained 2018: 35% trained
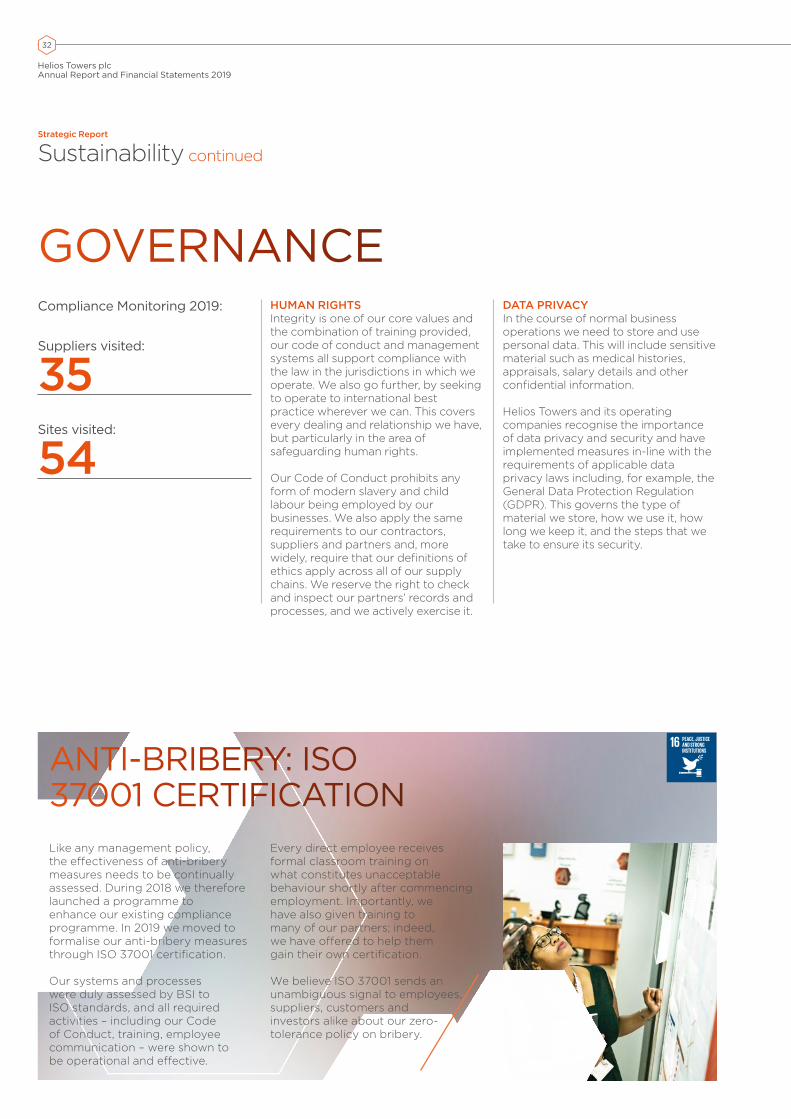
32
Helios Towers plcAnnual Report and Financial Statements 2019
Strategic Report
Sustainability continued
GOVERNANCECompliance Monitoring 2019:
Suppliers visited:
35Sites visited:
54
HUMAN RIGHTSIntegrity is one of our core values and the combination of training provided, our code of conduct and management systems all support compliance with the law in the jurisdictions in which we operate. We also go further, by seeking to operate to international best practice wherever we can. This covers every dealing and relationship we have, but particularly in the area of safeguarding human rights.
Our Code of Conduct prohibits any form of modern slavery and child labour being employed by our businesses. We also apply the same requirements to our contractors, suppliers and partners and, more widely, require that our definitions of ethics apply across all of our supply chains. We reserve the right to check and inspect our partners’ records and processes, and we actively exercise it.
DATA PRIVACY In the course of normal business operations we need to store and use personal data. This will include sensitive material such as medical histories, appraisals, salary details and other confidential information.
Helios Towers and its operating companies recognise the importance of data privacy and security and have implemented measures in-line with the requirements of applicable data privacy laws including, for example, the General Data Protection Regulation (GDPR). This governs the type of material we store, how we use it, how long we keep it, and the steps that we take to ensure its security.
ANTI-BRIBERY: ISO 37001 CERTIFICATIONLike any management policy, the effectiveness of anti-bribery measures needs to be continually assessed. During 2018 we therefore launched a programme to enhance our existing compliance programme. In 2019 we moved to formalise our anti-bribery measures through ISO 37001 certification.
Our systems and processes were duly assessed by BSI to ISO standards, and all required activities – including our Code of Conduct, training, employee communication – were shown to be operational and effective.
Every direct employee receives formal classroom training on what constitutes unacceptable behaviour shortly after commencing employment. Importantly, we have also given training to many of our partners; indeed, we have offered to help them gain their own certification.
We believe ISO 37001 sends an unambiguous signal to employees, suppliers, customers and investors alike about our zero-tolerance policy on bribery.

33
77% (262)
23%(80)
Male Female
88% (7)
13% (1)
Male Female
92% (11)8% (1)
Male Female
Helios Towers plcAnnual Report and Financial Statements 2019
Overview StrategicReport
GovernanceReport
Financial Statements
EMPLOYEESDIVERSITY AND INCLUSION We believe that our company thrives by having a workforce that mirrors the society we serve. We define workforce as permanent staff and fixed-term contractors.
We promote diversity and inclusion, offering everyone equal opportunities to apply for jobs with us, and to advance their careers on an equal footing.
We also believe that everyone deserves respect, and we do not tolerate discrimination of any kind, be it based on gender, marital status, race, ethnicity, colour, nationality, disability, religion, sexual orientation or age.
EMPLOYEE ENGAGEMENTEvery employee receives regular reviews against their objectives, together with mid-year and end-of-year appraisals.
We have been running regular ‘town-hall’ meetings across our business for many years, covering key business topics. In Q3 2019 we built on this by holding an all-employee ‘town-hall’ conference call to announce the financial and operational
performance of the quarter. This has since become a regular fixture. We bring together specific disciplines (e.g. Operational, Commercial, Finance, Legal) from across our operating companies to exchange ideas and promote Group standards. Each business also has its own newsletters and social events.
The Board has established plans to visit multiple operating companies in 2020, providing the opportunity to engage with employees and attend local stand-up meetings.
HEALTH, SAFETY AND WELLBEINGWe place the safety of our people and our contractors above any other priority. To this end, in July 2019, the Company appointed a dedicated Group Head of Health, Safety, Environment and Quality.
Our principal safety risk, as for many businesses operating in Africa, is road traffic accidents. By the nature of our business, we also work at height. Our focus is to learn from experiences, collect and use data intelligently and to drive uniform Group standards and best practices.
Gender split – workforce
Gender split – Board of Directors
LIFTING SAFETY TO NEW HEIGHTSThe very nature of our business requires us to work at height, and this brings specific safety demands. Every engineer working on our towers therefore receives comprehensive training in specialist processes, equipment and mitigating risk.
We also believe that our sector as a whole should benefit from shared knowledge and experiences. In 2018, with partners Delmec and Nokia, we therefore created the inaugural “Lifting Safety to New Heights” conference in Tanzania.
We welcomed attendees from all corners of the industry. Its success inspired us to roll out further events in 2019 in Nairobi, Accra and Johannesburg.
A fourth partner, Gravity has joined this initiative, meaning that each event offered rounded perspectives of a specialist equipment manufacturer and trainer, structural engineers, a telecoms equipment vendor and our own experiences as tower owner/operators.
Further events are planned in 2020.
Gender split – Senior Management

34
Helios Towers plcAnnual Report and Financial Statements 2019
Strategic Report
Sustainability continued
SOCIETYThe very nature of our business is rooted in society.
We bring infrastructure that enables communities to connect, trade, learn, heal, discover, innovate, improve and thrive. In each of our markets, we find that communities place a high value on how mobile communications can enhance their lives and work, and they welcome our arrival. Even so, we consult our host regions carefully about the siting and the appearance of our proposed towers and seek community as well as authority approval.
MAKING POSITIVE IMPACTSOur presence also creates local employment, both in the construction of new towers, their ongoing maintenance and security, and the opening up of the wider local economy that mobile access brings.
In a wider context, our towers have opened up online banking, new trading opportunities in agriculture and even authentic holiday experiences and online sales of tribal merchandise (please see a video on our website which illustrates this for a Masai tribe in Tanzania at www.heliostowers.com/videos). All the services that every society needs – health, education, police and emergency response – have taken a leap forward with mobile voice and internet access.
We also continue to roll out facilities at sites where anyone can plug in their mobile for a full battery charge at no cost. This small gesture is highly popular, but we are now looking to take this a stage further: for example, through developing plans that could make a valuable contribution to our communities’ health and well-being.
As a leading independent tower company, we provide mobile network operators with the infrastructure required to support and sustain communities across Africa.
Nick Summers | Director of Sustainability and Organisational Development
CONNECTIVITY AND SUSTAINABILITYAs our infrastructure is used to improve and extend mobile networks, the ripple effects of social and economic benefits are tangible.
Tumba Malumba Charlotte is a rice farmer in Kingabwa, DRC. Her property is too large to be able to monitor her labourers personally, but linking everyone by mobile means that when they complete one task, they phone in for another. She can now operate much more productively.
Her smartphone also allows her to drum up rice sales by calling potential customers. And when they buy from her, they simply transfer funds by M-PESA (Swahili for ‘mobile money’) to her online account.
If a single word can reflect the effect of mobile in Africa, it is ‘opportunity’, as connectivity creates better businesses and better lives.

35
Helios Towers plcAnnual Report and Financial Statements 2019
Overview StrategicReport
GovernanceReport
Financial Statements
ENVIRONMENTBy bringing efficiency benefits to the mobile network operators, we are also doing the same for the environment.
Our colocation model, concentrating up to six operators’ equipment onto one of our towers, is an elegantly sustainable solution, which instantly delivers green and aesthetic synergies, compared with the traditional operator-owned model, which typically has minimal sharing infrastructure. It means surplus towers can be decommissioned and removed
from the horizon. It requires only one generator or power supply, not multiple duplications and emissions.
And it means only one maintenance visit, saving thousands of road kilometres a month – while also reducing associated safety risks.
Couple this with our success in driving down our own fuel consumption and greenhouse gas emissions, and we are connecting Africa’s communities sustainably.
SAME POWER, LESS FUELAt the heart of our service is the ability to deliver dependable power both cost-efficiently and with due regard to the environment. For both of these reasons, we see reducing fuel consumption as one of the most critical of all measures.
In Tanzania, for example, we have therefore maximised the opportunities to connect directly to the country’s expanding grid availability which has had 1,000km of lines added recently. We have also upgraded the number of sites benefiting from hybrid solar applications by 11, and have
optimised both the way our assets are configured on-site and the fuel management and control process. Between March and October 2019, these enhancements reduced fuel consumption on these sites by 26%. More tangibly, that means 364,000 fewer litres of fuel being transported and consumed every month.
The performance of our maintenance partners is fundamental to this improvement, and fuel efficiency targets will be a central feature of contracts as they come up for renewal.
GHG EMISSIONSTonnes of CO2e (thousands)Emissions from: 2019 KT
Scope 1 – Combustion of fuel and operation of facilities 117
Scope 2 – Electricity, heat, steam and cooling purchased for own use 51
Total 168
Intensity measurement (Scopes 1 and 2) – Tonnes CO2e/$m revenue 0.433

36
Helios Towers plcAnnual Report and Financial Statements 2019
Strategic Report
Sustainability continued
NON-FINANCIAL INFORMATIONMany of the positive factors that contribute to the sustainable investment case of a company are impossible to gauge by financial performance. Integrity, care, culture and purpose are intangibles, yet they are central to the success of our operations and the value we create for ourselves and society.
Rightly, shareholders, analysts and regulators look for more detail on these areas and we welcome the opportunity to tell them more. This table highlights key non-financial impacts and where to find more information on them.
We undertake due-diligence through our compliance function as set out in risk management & compliance section on pages 46–48.
REPORTING REQUIREMENT
OUR BUSINESS, IMPACTS AND OUTCOMES
RELEVANT POLICIES
ENVIRONMENTAL MATTERS
Tower Construction p.2
ISO 14001 Environmental Management System p.26/32
Sustainability Framework p.28/29
Engaging with our Stakeholders p.30
GHG Emissions p.35
• Environmental Policy Statement The Environmental Policy Statement is a commitment from Helios Towers to continually improve, to protect the environment, prevent pollution and to meet other relevant commitments.
In this regard in each of our markets there is guidance related to the siting of masts and the requirement to undertake environmental assessments in accordance with the permitting laws. In addition, there are environmental benefits obtained through the efficiencies made by Helios Towers in embedding and following the standard day-to-day processes for the management of sites.
EMPLOYEES Appointment of Group Head of HSE and Quality p.13/26
Going Home Safe p.26
OSHAS 18001 p.26
Sustainability Framework p.28/29
Engaging with our Stakeholders p.30
Developing Our People p.31
Promoting Local Talent p.37
Employee Engagement p.33
Health, Safety, Wellbeing p.33
Diversity and Inclusion p.33
Principle Risk p.48/49
Directors Remuneration Policy p.76–96
• Bonus Calculation Policy• Directors Remuneration Policy• Health and Safety Policy• Diversity and Inclusion Policy There are a number of further employment policies in place for our workforce, each tailored to relevant local market but covering such areas as (but not limited to): annual leave entitlements, recruitment, discipline and grievance and maternity leave.
SOCIETY AND COMMUNITIES
Enabling mobile, powering development p.9
Extend network coverage to rural and underserved regions in DRC p.15
Sustainability Framework p.28/29
Engaging with our Stakeholders p.30
Connectivity and sustainability p.34
Society p.34
As we continue to develop our Sustainability Framework and further enhance our engagements with stakeholders new policies will be derived which will have a direct impact on Society and the Communities in which we operate.
RESPECT FOR HUMAN RIGHTS
Sustainability Framework p.28/29
Governance, Human Rights p.32
• Code of Conduct • Third Party Code of Conduct • Integrity Policy (covering Modern
Slavery and raising concerns) • Harassment Policy (also covers
discrimination and bullying)
ANTI-BRIBERYAND CORRUPTION
ISO 37001 Anti Bribery Management System p.32
Sustainability Framework p.28/29
Principle Risk p.48/49
• Code of Conduct • Third Party Code of Conduct • Integrity Policy (covering Bribery and Corruption,
facilitation payments, Gifts and Hospitality conflicts of interest and related areas)
KEY SUSTAINABILITY ACHIEVEMENTS FOR 2019:• Began active strategy development
of our sustainability agenda, including benchmarking, stakeholder engagement and materiality assessment, to be aligned with recognised standards and measured against UN Sustainable Development Goals. Formal sustainability KPIs will form one of the key outputs of this process.
• Awarded the Anti-Bribery management system certification (ISO 37001), adding to our comprehensive suite of ISO/OSHAS standards: Quality (9001), environment (14001), and occupational health and safety management (18001).
• Enhanced our Board with the appointment of new independent. Chair and Non-Executive Directors.
• Contributing to safety for the whole industry through organisation of live events and active focus on improving driving standards.
• Continued rollout of leadership development programmes across the entire Group.

37
Helios Towers plcAnnual Report and Financial Statements 2019
Overview StrategicReport
GovernanceReport
Financial Statements
REPORTING REQUIREMENT
OUR BUSINESS, IMPACTS AND OUTCOMES
RELEVANT POLICIES
ENVIRONMENTAL MATTERS
Tower Construction p.2
ISO 14001 Environmental Management System p.26/32
Sustainability Framework p.28/29
Engaging with our Stakeholders p.30
GHG Emissions p.35
• Environmental Policy Statement The Environmental Policy Statement is a commitment from Helios Towers to continually improve, to protect the environment, prevent pollution and to meet other relevant commitments.
In this regard in each of our markets there is guidance related to the siting of masts and the requirement to undertake environmental assessments in accordance with the permitting laws. In addition, there are environmental benefits obtained through the efficiencies made by Helios Towers in embedding and following the standard day-to-day processes for the management of sites.
EMPLOYEES Appointment of Group Head of HSE and Quality p.13/26
Going Home Safe p.26
OSHAS 18001 p.26
Sustainability Framework p.28/29
Engaging with our Stakeholders p.30
Developing Our People p.31
Promoting Local Talent p.37
Employee Engagement p.33
Health, Safety, Wellbeing p.33
Diversity and Inclusion p.33
Principle Risk p.48/49
Directors Remuneration Policy p.76–96
• Bonus Calculation Policy• Directors Remuneration Policy• Health and Safety Policy• Diversity and Inclusion Policy There are a number of further employment policies in place for our workforce, each tailored to relevant local market but covering such areas as (but not limited to): annual leave entitlements, recruitment, discipline and grievance and maternity leave.
SOCIETY AND COMMUNITIES
Enabling mobile, powering development p.9
Extend network coverage to rural and underserved regions in DRC p.15
Sustainability Framework p.28/29
Engaging with our Stakeholders p.30
Connectivity and sustainability p.34
Society p.34
As we continue to develop our Sustainability Framework and further enhance our engagements with stakeholders new policies will be derived which will have a direct impact on Society and the Communities in which we operate.
RESPECT FOR HUMAN RIGHTS
Sustainability Framework p.28/29
Governance, Human Rights p.32
• Code of Conduct • Third Party Code of Conduct • Integrity Policy (covering Modern
Slavery and raising concerns) • Harassment Policy (also covers
discrimination and bullying)
ANTI-BRIBERYAND CORRUPTION
ISO 37001 Anti Bribery Management System p.32
Sustainability Framework p.28/29
Principle Risk p.48/49
• Code of Conduct • Third Party Code of Conduct • Integrity Policy (covering Bribery and Corruption,
facilitation payments, Gifts and Hospitality conflicts of interest and related areas)
PROMOTING LOCAL TALENT
Among the workforce in our five operating companies, expats are now exceedingly rare.
This was always our plan: we believe our national businesses should be run and populated by local people.
Two examples are Fritz Dzeklo (Ghana) and Ramsey Koola (Tanzania). Both have risen to become Managing Directors of their respective businesses.
Fritz joined us from Vodafone, where he knew us as a customer. He recalls: “Having seen the business pioneer the acquisition of tower infrastructure in Ghana I became convinced that Helios Towers was the future.”
He joined us as a project manager and later became Head of Projects. He then gained valuable experience in our Tanzanian business before returning to Ghana as Managing Director.
Ramsey joined us in Tanzania as the Network Operations Centre (NOC) manager. He then transferred to Group to standardise all our NOCs, before returning to Tanzania as Managing Director.
“One of the unique features of Helios Towers is the focus on personal development. If you have the ambition, they will support you,” explains Ramsey.
Percentage of local employees in HT operating companies
96%

38
Helios Towers plcAnnual Report and Financial Statements 2019
Strategic Report
Chief Financial Officer’s statement
A SIGNIFICANT YEAR FOR GROWTH, DELIVERY AND PROGRESS
Our business continues to maintain a robust earning stream, which is driven by high quality customers, strength of contracts, and operational execution.
Tom Greenwood | CFO
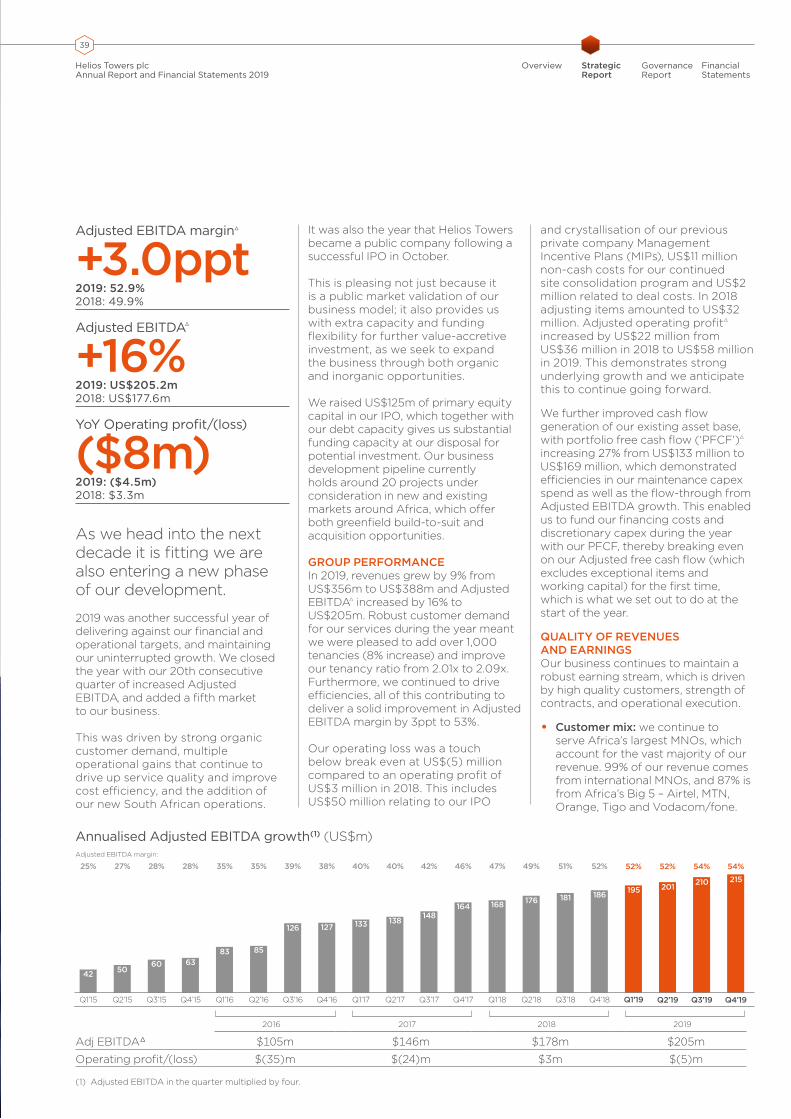
39
Q1’17 Q2’17 Q3’17 Q4’17Q1’16 Q2’16 Q3’16 Q4’16Q1’15 Q2’15 Q3’15 Q4’15 Q1’18 Q2’18 Q3’18 Q4’18
40% 40% 42% 46%35% 35% 39% 38%25%Margin 27% 28% 28% 47% 49% 51%
133 138148
164
83 85
126 127
42 5060 63
168 176 181
52%
186
Q2’19 Q3’19 Q4’19
52% 52% 54%
195 201 210
54%
215
Q1’19
Helios Towers plcAnnual Report and Financial Statements 2019
Overview StrategicReport
GovernanceReport
Financial Statements
As we head into the next decade it is fitting we are also entering a new phase of our development.
2019 was another successful year of delivering against our financial and operational targets, and maintaining our uninterrupted growth. We closed the year with our 20th consecutive quarter of increased Adjusted EBITDA, and added a fifth market to our business.
This was driven by strong organic customer demand, multiple operational gains that continue to drive up service quality and improve cost efficiency, and the addition of our new South African operations.
It was also the year that Helios Towers became a public company following a successful IPO in October.
This is pleasing not just because it is a public market validation of our business model; it also provides us with extra capacity and funding flexibility for further value-accretive investment, as we seek to expand the business through both organic and inorganic opportunities.
We raised US$125m of primary equity capital in our IPO, which together with our debt capacity gives us substantial funding capacity at our disposal for potential investment. Our business development pipeline currently holds around 20 projects under consideration in new and existing markets around Africa, which offer both greenfield build-to-suit and acquisition opportunities.
GROUP PERFORMANCEIn 2019, revenues grew by 9% from US$356m to US$388m and Adjusted EBITDAΔ increased by 16% to US$205m. Robust customer demand for our services during the year meant we were pleased to add over 1,000 tenancies (8% increase) and improve our tenancy ratio from 2.01x to 2.09x. Furthermore, we continued to drive efficiencies, all of this contributing to deliver a solid improvement in Adjusted EBITDA margin by 3ppt to 53%.
Our operating loss was a touch below break even at US$(5) million compared to an operating profit of US$3 million in 2018. This includes US$50 million relating to our IPO
and crystallisation of our previous private company Management Incentive Plans (MIPs), US$11 million non-cash costs for our continued site consolidation program and US$2 million related to deal costs. In 2018 adjusting items amounted to US$32 million. Adjusted operating profitΔ increased by US$22 million from US$36 million in 2018 to US$58 million in 2019. This demonstrates strong underlying growth and we anticipate this to continue going forward.
We further improved cash flow generation of our existing asset base, with portfolio free cash flow (‘PFCF’)Δ
increasing 27% from US$133 million to US$169 million, which demonstrated efficiencies in our maintenance capex spend as well as the flow-through from Adjusted EBITDA growth. This enabled us to fund our financing costs and discretionary capex during the year with our PFCF, thereby breaking even on our Adjusted free cash flow (which excludes exceptional items and working capital) for the first time, which is what we set out to do at the start of the year.
QUALITY OF REVENUES AND EARNINGSOur business continues to maintain a robust earning stream, which is driven by high quality customers, strength of contracts, and operational execution.
• Customer mix: we continue to serve Africa’s largest MNOs, which account for the vast majority of our revenue. 99% of our revenue comes from international MNOs, and 87% is from Africa’s Big 5 – Airtel, MTN, Orange, Tigo and Vodacom/fone.
Adjusted EBITDA marginΔ
+3.0ppt2019: 52.9% 2018: 49.9%
Adjusted EBITDAΔ
+16%2019: US$205.2m 2018: US$177.6m
YoY Operating profit/(loss)
($8m)2019: ($4.5m) 2018: $3.3m
Annualised Adjusted EBITDA growth(1) (US$m)Adjusted EBITDA margin:
2016 2017 2018 2019
Adj EBITDAΔ $105m $146m $178m $205m
Operating profit/(loss) $(35)m $(24)m $3m $(5)m
(1) Adjusted EBITDA in the quarter multiplied by four.
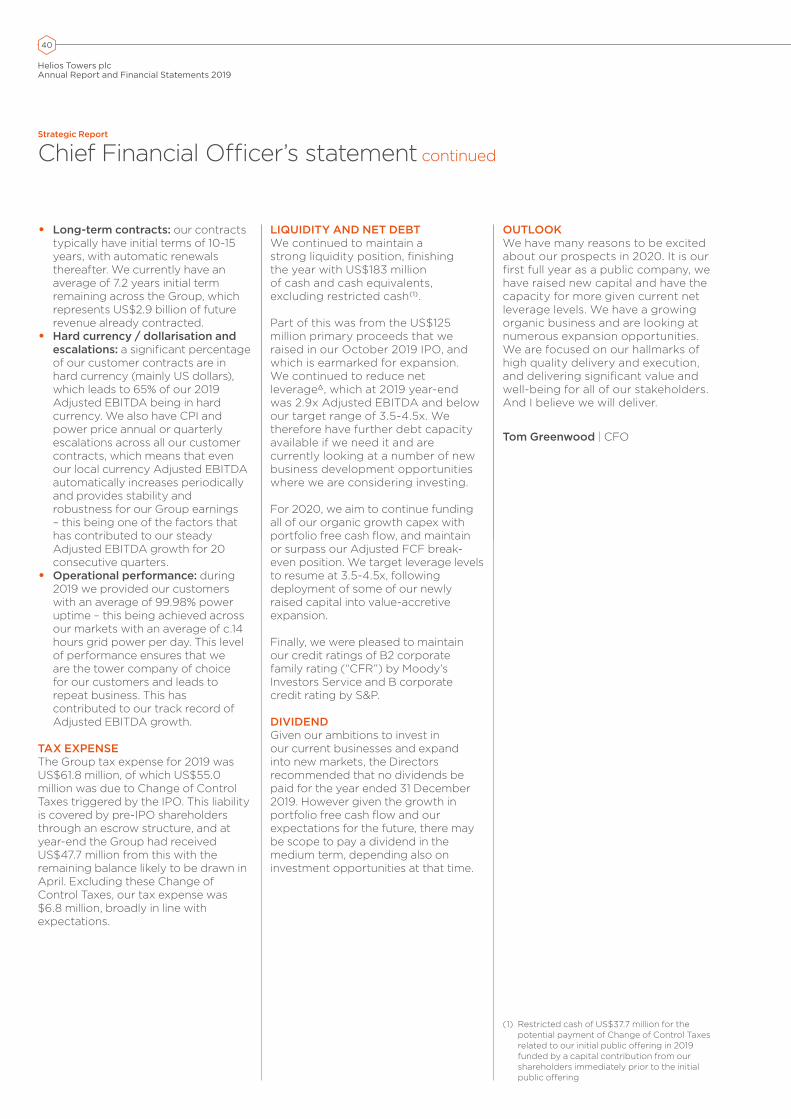
40
Helios Towers plcAnnual Report and Financial Statements 2019
Strategic Report
Chief Financial Officer’s statement continued
• Long-term contracts: our contracts typically have initial terms of 10-15 years, with automatic renewals thereafter. We currently have an average of 7.2 years initial term remaining across the Group, which represents US$2.9 billion of future revenue already contracted.
• Hard currency / dollarisation and escalations: a significant percentage of our customer contracts are in hard currency (mainly US dollars), which leads to 65% of our 2019 Adjusted EBITDA being in hard currency. We also have CPI and power price annual or quarterly escalations across all our customer contracts, which means that even our local currency Adjusted EBITDA automatically increases periodically and provides stability and robustness for our Group earnings – this being one of the factors that has contributed to our steady Adjusted EBITDA growth for 20 consecutive quarters.
• Operational performance: during 2019 we provided our customers with an average of 99.98% power uptime – this being achieved across our markets with an average of c.14 hours grid power per day. This level of performance ensures that we are the tower company of choice for our customers and leads to repeat business. This has contributed to our track record of Adjusted EBITDA growth.
TAX EXPENSEThe Group tax expense for 2019 was US$61.8 million, of which US$55.0 million was due to Change of Control Taxes triggered by the IPO. This liability is covered by pre-IPO shareholders through an escrow structure, and at year-end the Group had received US$47.7 million from this with the remaining balance likely to be drawn in April. Excluding these Change of Control Taxes, our tax expense was $6.8 million, broadly in line with expectations.
LIQUIDITY AND NET DEBT We continued to maintain a strong liquidity position, finishing the year with US$183 million of cash and cash equivalents, excluding restricted cash(1).
Part of this was from the US$125 million primary proceeds that we raised in our October 2019 IPO, and which is earmarked for expansion. We continued to reduce net leverage∆, which at 2019 year-end was 2.9x Adjusted EBITDA and below our target range of 3.5-4.5x. We therefore have further debt capacity available if we need it and are currently looking at a number of new business development opportunities where we are considering investing.
For 2020, we aim to continue funding all of our organic growth capex with portfolio free cash flow, and maintain or surpass our Adjusted FCF break-even position. We target leverage levels to resume at 3.5-4.5x, following deployment of some of our newly raised capital into value-accretive expansion.
Finally, we were pleased to maintain our credit ratings of B2 corporate family rating (“CFR”) by Moody’s Investors Service and B corporate credit rating by S&P.
DIVIDENDGiven our ambitions to invest in our current businesses and expand into new markets, the Directors recommended that no dividends be paid for the year ended 31 December 2019. However given the growth in portfolio free cash flow and our expectations for the future, there may be scope to pay a dividend in the medium term, depending also on investment opportunities at that time.
OUTLOOKWe have many reasons to be excited about our prospects in 2020. It is our first full year as a public company, we have raised new capital and have the capacity for more given current net leverage levels. We have a growing organic business and are looking at numerous expansion opportunities. We are focused on our hallmarks of high quality delivery and execution, and delivering significant value and well-being for all of our stakeholders. And I believe we will deliver.
Tom Greenwood | CFO
(1) Restricted cash of US$37.7 million for the potential payment of Change of Control Taxes related to our initial public offering in 2019 funded by a capital contribution from our shareholders immediately prior to the initial public offering

41
Helios Towers plcAnnual Report and Financial Statements 2019
Overview StrategicReport
GovernanceReport
Financial Statements
Strategic Report
Detailed financial review
CONSOLIDATED INCOME STATEMENTFor the year ended 31 December
(US$m)
Year ended 31 December
2019 2018
Revenue 387.8 356.0Cost of sales (261.9) (255.8)
Gross profit 125.9 100.2
Administrative expenses (119.4) (91.1)Loss on disposal of property, plant and equipment (11.0) (5.8)
Operating (loss)/profit (4.5) 3.3
Interest receivable 0.7 1.0Gain/(loss) on derivative financial instruments 33.9 (16.8)Finance costs (104.9) (107.0)
Loss before tax (74.8) (119.5)
Tax expenses (61.8) (4.4)
Loss after tax (136.6) (123.9)
KEY PERFORMANCE INDICATORSFor the year ended 31 December
$ values are presented as US$m
Group Tanzania DRC Congo Brazzaville Ghana South Africa
2019 2018 2019 2018 2019 2018 2019 2018 2019 2018 2019 2018
Revenue for the year $387.8 $356.0 $162.2 $149.8 $158.0 $140.9 $25.9 $24.3 $40.1 $41.0 $1.6 –Adjusted gross margin(1) 66% 63% 66% 65% 64% 60% 70% 67% 69% 66% 78% –Sites at beginning of the
year 6,745 6,519 3,701 3,491 1,773 1,819 380 384 891 825 – –Sites at year end 6,974 6,745 3,661 3,701 1,850 1,773 384 380 961 891 118 –Tenancies at beginning
of the year 13,549 12,987 7,848 7,392 3,492 3,347 529 525 1,680 1,723 – –Tenancies at year end 14,591 13,549 8,099 7,848 3,828 3,492 568 529 1,888 1,680 208 –Tenancy ratio at year
end 2.09x 2.01x 2.21x 2.12x 2.07x 1.97x 1.48x 1.39x 1.96x 1.89x 1.76x –Adjusted EBITDA for the
year(2) $205.2 $177.6 $96.4 $86.2 $88.3 $72.5 $13.6 $12.1 $23.6 $22.8 $0.2 –
Adjusted EBITDA margin for the year 53% 50% 59% 57% 56% 51% 53% 50% 59% 56% 13% –
(1) Adjusted gross margin means gross profit, adding back site and warehouse depreciation, divided by revenue.(2) Group Adjusted EBITDA for the year is stated including corporate costs of US$16.9 million (2018: US$16.0 million).
TOTAL TENANCIES AS AT 31 DECEMBER
Group Tanzania DRC Congo Brazzaville Ghana South Africa
2019 2018 2019 2018 2019 2018 2019 2018 2019 2018 2019 2018
Standard colocations 6,856 6,269 3,978 3,762 1,905 1,689 170 144 715 674 88 –Amendment colocations 761 535 460 385 73 30 14 5 212 115 2 –
Total colocations 7,617 6,804 4,438 4,147 1,978 1,719 184 149 927 789 90 –Total sites 6,974 6,745 3,661 3,701 1,850 1,773 384 380 961 891 118 –
Total tenancies 14,591 13,549 8,099 7,848 3,828 3,492 568 529 1,888 1,680 208 –
TENANCIESThe number of tenancies increased by 8% to 14,591 on 31 December 2019 from 13,549 on 31 December 2018. This increase was driven by tenancy growth across all markets.
The number of sites increased by 3% to 6,974 on 31 December 2019 from 6,745 on 31 December 2018. This increase was driven by entry into the South African market in 2019 and predominantly by site growth in DRC and Ghana. The number of sites in Tanzania decreased slightly from 3,701 on 31 December 2018 to 3,661 on 31 December 2019, due largely to our ongoing site consolidation program which reduces site count but improves network efficiency and margin enhancement.

42
Helios Towers plcAnnual Report and Financial Statements 2019
REVENUERevenue increased by 9% to US$387.8 million in the year ended 31 December 2019 from US$356.0 million in the year ended 31 December 2018. The increase in revenue was largely driven by the 8% increase in tenancies from 13,549 as of 31 December 2018 to 14,591 as of 31 December 2019.
COST OF SALES
(US$m)
Year ended 31 December
% of Revenue % of Revenue
2019 2019 2018 2018
Power 82.6 21.3% 81.9 23.0%Non-power 50.6 13.0% 49.8 14.0%Site and warehouse depreciation 128.7 33.2% 124.1 34.9%
Total cost of sales 261.9 67.5% 255.8 71.9%
The table below shows an analysis of the cost of sales on a country-by-country basis for the year ended 31 December 2019 and 2018.
(US$m)
Tanzania DRC Congo Brazzaville Ghana South Africa
Year ended 31 December
Year ended 31 December
Year ended 31 December
Year ended 31 December
Year ended 31 December
2019 2018 2019 2018 2019 2018 2019 2018 2019 2018
Power 29.4 29.2 41.6 39.3 2.9 3.0 8.5 10.4 0.2 –Non-power 26.1 23.5 15.7 17.7 4.9 5.1 3.8 3.6 0.1 –Site and warehouse depreciation 54.1 54.7 55.1 50.2 10.9 11.3 8.1 7.8 0.5 –
Total cost of sales 109.6 107.4 112.4 107.2 18.7 19.4 20.4 21.8 0.8 –
Year-on-year, cost of sales increased to US$261.9 million in the year ended 31 December 2019 from US$255.8 million in the year ended 31 December 2018, due primarily to an increase in site and warehouse depreciation in line with the increased number of sites. Group power costs increased marginally, largely due to DRC, where we added significant tenancies. This was partially offset by lower power costs in Ghana and Congo Brazzaville.
ADMINISTRATIVE EXPENSESAdministrative expenses increased by 31% to US$119.4 million in the year ended 31 December 2019 from US$91.1 million in the year ended 31 December 2018. The increase in administrative expenses is primarily due to exceptional and adjusting items of US$49.7 million in the year ended 31 December 2019, with the majority of this relating to the listing on the London Stock Exchange (“LSE”) and associated share-based payments costs, largely attributed to the unwinding of the Group’s legacy private company Management Incentive Plans. See Note 4 to the Financial Statements.
(US$m)
Year ended 31 December
% of Revenue % of Revenue
2019 2019 2018 2018
Other administrative costs 51.1 13.2% 49.0 13.8%Depreciation and amortisation 18.5 4.8% 17.2 4.8%Exceptional items 49.8 12.8% 24.9 7.0%
Total administrative expense 119.4 30.8% 91.1 25.6%
ADJUSTED EBITDAAdjusted EBITDAΔ was US$205.2 million in the year ended 31 December 2019 compared to US$177.6 million in the year ended 31 December 2018. The increase in Adjusted EBITDA between periods is primarily attributable to the changes in revenue, cost of sales and administrative expenses, as discussed above.
LOSS ON DISPOSAL OF PROPERTY, PLANT AND EQUIPMENTLoss on disposal of property, plant and equipment was US$11.0 million in the year ended 31 December 2019, compared to a loss of US$5.8 million during the year ended 31 December 2018. This increase in loss on disposal was primarily a result of the site consolidation programs in DRC and Tanzania which will deliver increased network efficiency and margin enhancement.
Strategic Report
Detailed financial review continued

43
Helios Towers plcAnnual Report and Financial Statements 2019
Overview StrategicReport
GovernanceReport
Financial Statements
GAIN/(LOSS) ON DERIVATIVE FINANCIAL INSTRUMENTSGain/(loss) on derivative financial instruments recognised in the year ended 31 December 2019 was a gain of US$33.9 million, compared to a loss of US$16.8 million in the year ended 31 December 2018. This is in relation to the fair value movement of the embedded derivative valuation of the US$600 million 9.125% bond.
FINANCE COSTSFinance costs of US$104.9 million for the year ended 31 December 2019, mainly comprise interest for the US$600 million 9.125% bond and the $100 million term loan facility activated in October 2018, of which US$75 million was drawn at 31 December 2019 (31 December 2018: US$25 million). The year-on-year decrease in foreign exchange differences for the year ended 31 December 2019 is driven primarily by the change in subsidiary financing structure.
(US$m)
Year ended 31 December
2019 2018
Foreign exchange differences 12.0 18.0Interest cost 77.0 73.9Interest cost on lease liabilities 15.9 15.1
Total finance costs 104.9 107.0
TAX EXPENSEOur tax expense was US$61.8 million in the year ended 31 December 2019 as compared to US$4.4 million in the year ended 31 December 2018. The current year includes US$55.0 million related to Change of Control Taxes which is fully funded by a capital contribution from the pre-IPO shareholders. Though entities in Congo B, Tanzania and DRC have continued to be loss making, minimum income taxes have been levied based on revenue, as stipulated by law in these jurisdictions. Ghana is profit making and subject to income tax. Minimal taxes were levied in South Africa.
CONTRACTED REVENUE The following table provides our total undiscounted contracted revenue by country as of 31 December 2019 for each year from 2020 to 2024, with local currency amounts converted at the applicable average rate for US dollars for the year ended 31 December 2019 held constant. Our contracted revenue calculation for each year presented assumes: • no escalation in fee rates; • no increases in sites or tenancies other than our committed tenancies;• our customers do not utilise any cancellation allowances set forth in their MLAs;• our customers do not terminate MLAs early for any reason; and• no automatic renewal.
(US$m)
Year ended 31 December
2020 2021 2022 2023 2024
Tanzania 163.7 163.4 160.5 153.5 133.9DRC 162.7 166.3 164.5 163.5 161.7Congo Brazzaville 22.1 18.3 17.6 16.5 16.5Ghana 32.8 32.8 31.2 30.3 29.7South Africa 2.2 2.5 2.8 3.1 3.1
Total 383.5 383.3 376.6 366.9 344.9
The following table provides our total undiscounted contracted revenue by key customers as of 31 December 2019 over the life of the contracts with local currency amounts converted at the applicable average rate for US dollars for the year ended 31 December 2019 held constant. Our contracted revenue calculation for each year presented assumes the same basis as above.
(US$m)
Total Committed
Revenues
Percentage of Total
Committed Revenues
Africa’s Big-Five MNOs(1) 2,350.8 82%Other 520.9 18%
Total 2,871.7 100%
(1) Includes Vodacom/fone, Airtel, Tigo, Orange and MTN.
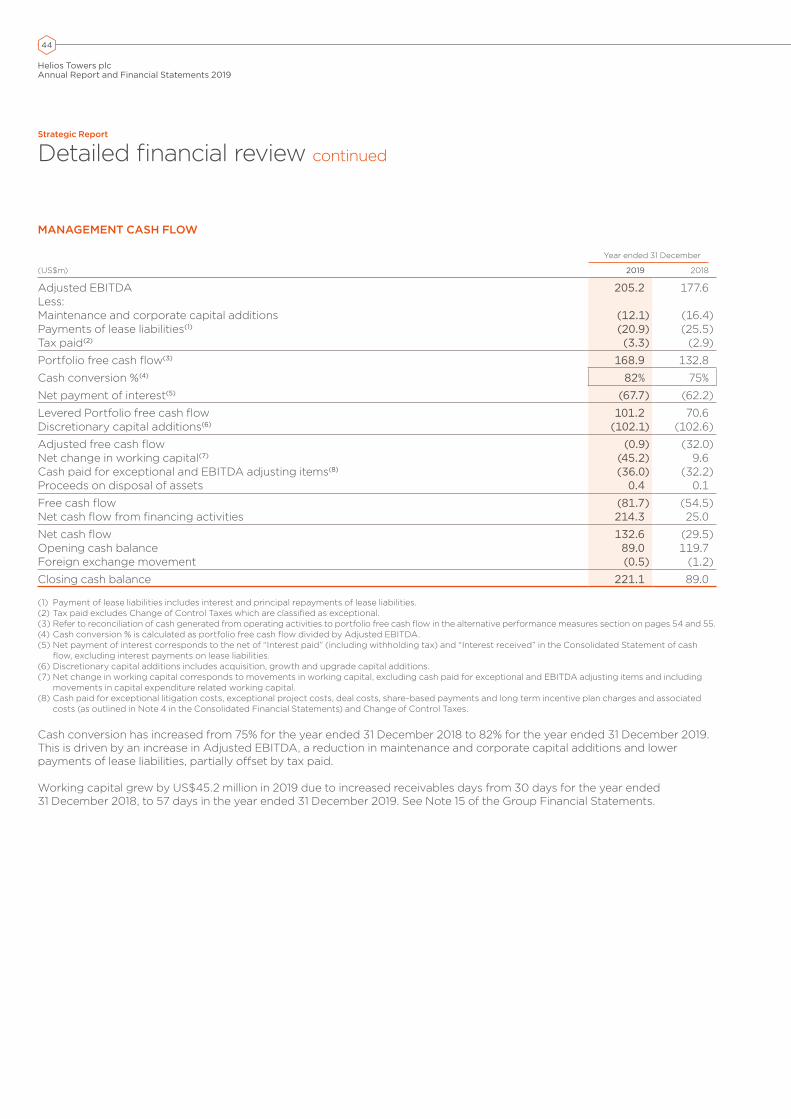
44
Helios Towers plcAnnual Report and Financial Statements 2019
MANAGEMENT CASH FLOW
(US$m)
Year ended 31 December
2019 2018
Adjusted EBITDA 205.2 177.6Less:Maintenance and corporate capital additions (12.1) (16.4) Payments of lease liabilities(1) (20.9) (25.5)Tax paid(2) (3.3) (2.9)
Portfolio free cash flow(3) 168.9 132.8
Cash conversion %(4) 82% 75%
Net payment of interest(5) (67.7) (62.2)
Levered Portfolio free cash flow 101.2 70.6Discretionary capital additions(6) (102.1) (102.6)
Adjusted free cash flow (0.9) (32.0)Net change in working capital(7) (45.2) 9.6Cash paid for exceptional and EBITDA adjusting items(8) (36.0) (32.2)Proceeds on disposal of assets 0.4 0.1
Free cash flow (81.7) (54.5)Net cash flow from financing activities 214.3 25.0
Net cash flow 132.6 (29.5)Opening cash balance 89.0 119.7Foreign exchange movement (0.5) (1.2)
Closing cash balance 221.1 89.0
(1) Payment of lease liabilities includes interest and principal repayments of lease liabilities.(2) Tax paid excludes Change of Control Taxes which are classified as exceptional.(3) Refer to reconciliation of cash generated from operating activities to portfolio free cash flow in the alternative performance measures section on pages 54 and 55. (4) Cash conversion % is calculated as portfolio free cash flow divided by Adjusted EBITDA.(5) Net payment of interest corresponds to the net of “Interest paid” (including withholding tax) and “Interest received” in the Consolidated Statement of cash
flow, excluding interest payments on lease liabilities.(6) Discretionary capital additions includes acquisition, growth and upgrade capital additions.(7) Net change in working capital corresponds to movements in working capital, excluding cash paid for exceptional and EBITDA adjusting items and including
movements in capital expenditure related working capital.(8) Cash paid for exceptional litigation costs, exceptional project costs, deal costs, share-based payments and long term incentive plan charges and associated
costs (as outlined in Note 4 in the Consolidated Financial Statements) and Change of Control Taxes.
Cash conversion has increased from 75% for the year ended 31 December 2018 to 82% for the year ended 31 December 2019.This is driven by an increase in Adjusted EBITDA, a reduction in maintenance and corporate capital additions and lower payments of lease liabilities, partially offset by tax paid.
Working capital grew by US$45.2 million in 2019 due to increased receivables days from 30 days for the year ended 31 December 2018, to 57 days in the year ended 31 December 2019. See Note 15 of the Group Financial Statements.
Strategic Report
Detailed financial review continued
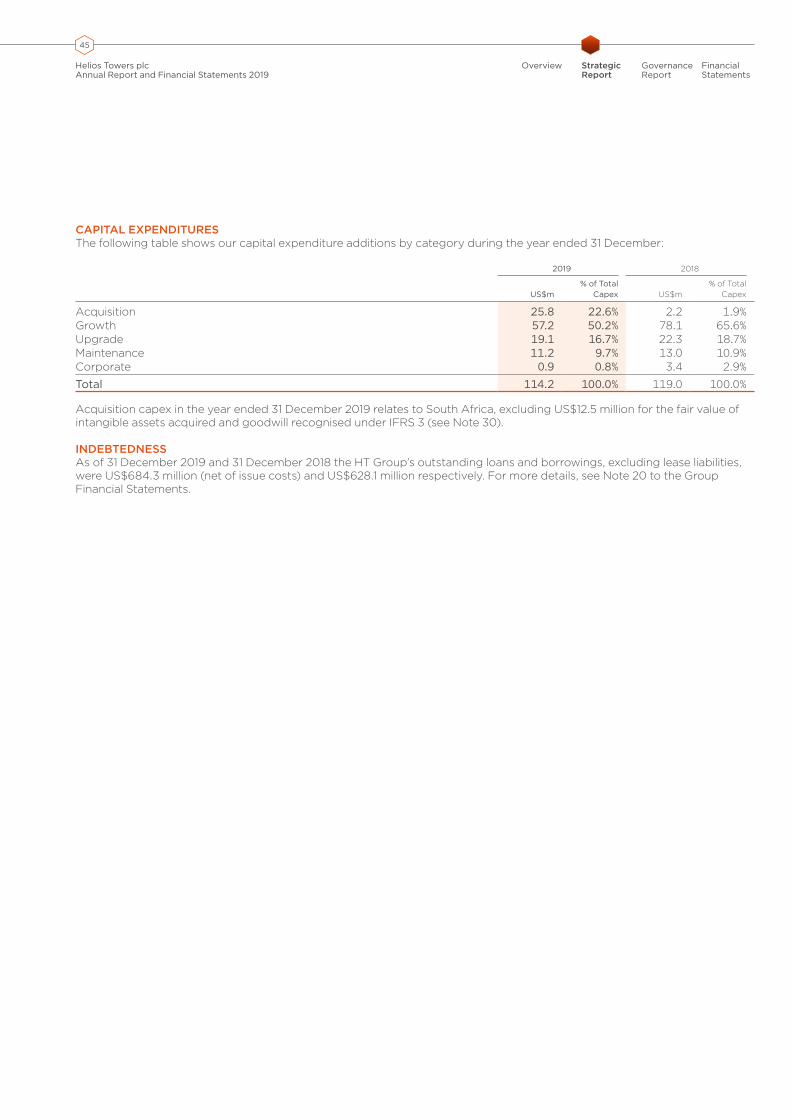
45
Helios Towers plcAnnual Report and Financial Statements 2019
Overview StrategicReport
GovernanceReport
Financial Statements
CAPITAL EXPENDITURESThe following table shows our capital expenditure additions by category during the year ended 31 December:
2019 2018
US$m% of Total
Capex US$m% of Total
Capex
Acquisition 25.8 22.6% 2.2 1.9%Growth 57.2 50.2% 78.1 65.6%Upgrade 19.1 16.7% 22.3 18.7%Maintenance 11.2 9.7% 13.0 10.9%Corporate 0.9 0.8% 3.4 2.9%
Total 114.2 100.0% 119.0 100.0%
Acquisition capex in the year ended 31 December 2019 relates to South Africa, excluding US$12.5 million for the fair value of intangible assets acquired and goodwill recognised under IFRS 3 (see Note 30).
INDEBTEDNESS As of 31 December 2019 and 31 December 2018 the HT Group’s outstanding loans and borrowings, excluding lease liabilities, were US$684.3 million (net of issue costs) and US$628.1 million respectively. For more details, see Note 20 to the Group Financial Statements.

46
BOARD/AUDIT COMMITTEE
EXECUTIVE TEAM
1ST LINE OF DEFENCEOwns and manages risks andimplements/operates business controls
WHO IS RESPONSIBLE• Operational sta�/management
ACTIVITY/CONTROLS• Policies and procedures• Internal controls• Planning, budgeting/forecasting processes• Delegation of authority matrix• Business workflows/IT systems controls• Personal objectives and incentives
2ND LINE OF DEFENCEOversight of risk and control compliance
WHO IS RESPONSIBLE• Compliance/functional teams
ACTIVITY/CONTROLS• Safety, Health, Environment
and Quality (”SHEQ”)• Regulatory compliance• Management/Board reporting and review
of KPIs and financial performance• Corporate policies and Group
functions oversight
3RD LINE OF DEFENCEIndependent assurance
WHO IS RESPONSIBLE• Internal Audit
ACTIVITY/CONTROLS• Internal Audit risk assessment• Approved Internal Audit plan• Internal Audit reporting line to
Audit Committee
Helios Towers plcAnnual Report and Financial Statements 2019
Strategic Report
Risk management
RISK APPETITEThe Group defines risk appetite as the amount of risk that the business is prepared to take in order to deliver safe, effective working practices as well as maintaining and growing its business. The Group dedicates resources and focus to understanding and ensuring risk is identified, assessed, managed and monitored. Controls and mitigating actions are designed as appropriate to reflect the risk appetite in each instance.
Determination of risk appetite for the Group is the responsibility of the Board. The current risk appetite has been defined as high, given the countries the Group operates in and its experience in these countries. This represents no change on the 2018 Annual Report.
RISK GOVERNANCERisk management is integral to the Group’s strategy and to the achievement of its long-term goals. The Group’s continued success as an organisation depends on its ability to identify and pursue the opportunities generated by its business and the markets in which it operates.
The Board has overall responsibility for risk management, compliance and internal controls, and is supported by the Audit Committee.
The Audit Committee, under delegation from the Board, monitors the nature and extent of risk exposure against the Group’s risk appetite. The Committee is responsible for identifying, mitigating and managing risk, as well as setting the risk appetite for the business with advice from the executive team.
The creation and maintenance of the Group risk register involves the whole business – with operating company and functional head input being consolidated by Group Compliance into a register for discussion and agreement at Executive level prior to submission to the Audit Committee and the Board. The risk register is updated twice a year after these discussions and a review of the external environment for any emerging risks.
All risks are classified into six broad risk types: Strategic, Reputational, Compliance (including legal), Finance, Operational and People. All risks are assessed according to the probability and consequence of being realised and a determination made to accept, avoid, or control and mitigate, in which case mitigating controls are clearly defined. A risk owner for all risks is identified. Two additional principal risks have been added for 2019 relating to tax disputes and operational resilience – these are
GOVERNANCE STRUCTURE
described in more detail on pages 47 and 48. There has been no change in the nature, probability or potential impact of previously identified risks.
During bi-annual discussions with Executive Management and functional heads of department, potential emerging risks are also discussed. These may result from internal developments: changes in organisational structure/personnel, potential new products or markets being considered or changes in the external environment such as regulatory changes, socio-economic, political or health and safety matters.
Emerging risks related to sustainability, climate change, the covid-19 outbreak and evolving legal requirements concerning human rights abuses have been identified as part of the risk management process and will continue to be monitored. In respect of covid-19 we have undertaken a risk assessment relating to our workforce and operations, site and tenancy roll-out and associated revenue and financial implications and have determined that in overall terms our business model remains resilient and minimal disruption is currently expected. Due to the nature of the operations, Brexit is not considered to be a principal risk.
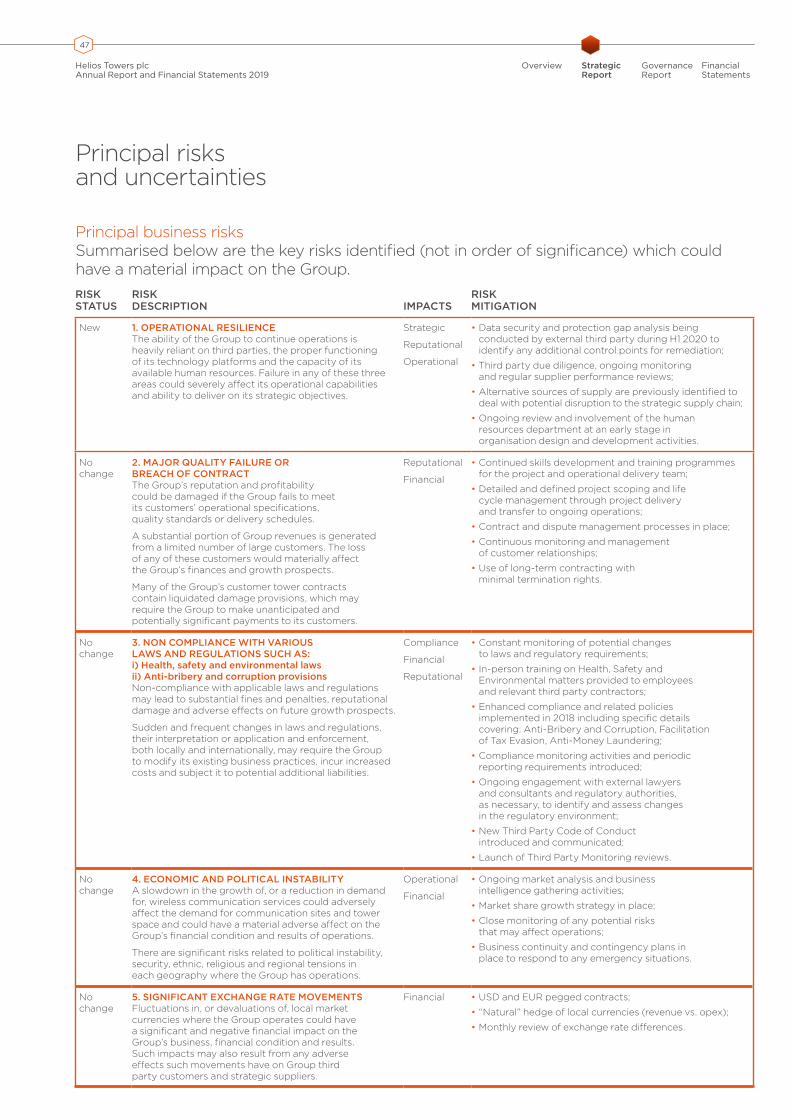
47
Helios Towers plcAnnual Report and Financial Statements 2019
Overview StrategicReport
GovernanceReport
Financial Statements
Principal risks and uncertainties
Principal business risksSummarised below are the key risks identified (not in order of significance) which could have a material impact on the Group. RISK STATUS
RISK DESCRIPTION IMPACTS
RISK MITIGATION
New 1. OPERATIONAL RESILIENCEThe ability of the Group to continue operations is heavily reliant on third parties, the proper functioning of its technology platforms and the capacity of its available human resources. Failure in any of these three areas could severely affect its operational capabilities and ability to deliver on its strategic objectives.
Strategic
Reputational
Operational
• Data security and protection gap analysis being conducted by external third party during H1 2020 to identify any additional control points for remediation;
• Third party due diligence, ongoing monitoring and regular supplier performance reviews;
• Alternative sources of supply are previously identified to deal with potential disruption to the strategic supply chain;
• Ongoing review and involvement of the human resources department at an early stage in organisation design and development activities.
No change
2. MAJOR QUALITY FAILURE OR BREACH OF CONTRACTThe Group’s reputation and profitability could be damaged if the Group fails to meet its customers’ operational specifications, quality standards or delivery schedules.
A substantial portion of Group revenues is generated from a limited number of large customers. The loss of any of these customers would materially affect the Group’s finances and growth prospects.
Many of the Group’s customer tower contracts contain liquidated damage provisions, which may require the Group to make unanticipated and potentially significant payments to its customers.
Reputational
Financial
• Continued skills development and training programmes for the project and operational delivery team;
• Detailed and defined project scoping and life cycle management through project delivery and transfer to ongoing operations;
• Contract and dispute management processes in place;
• Continuous monitoring and management of customer relationships;
• Use of long-term contracting with minimal termination rights.
No change
3. NON COMPLIANCE WITH VARIOUS LAWS AND REGULATIONS SUCH AS:i) Health, safety and environmental lawsii) Anti-bribery and corruption provisionsNon-compliance with applicable laws and regulations may lead to substantial fines and penalties, reputational damage and adverse effects on future growth prospects.
Sudden and frequent changes in laws and regulations, their interpretation or application and enforcement, both locally and internationally, may require the Group to modify its existing business practices, incur increased costs and subject it to potential additional liabilities.
Compliance
Financial
Reputational
• Constant monitoring of potential changes to laws and regulatory requirements;
• In-person training on Health, Safety and Environmental matters provided to employees and relevant third party contractors;
• Enhanced compliance and related policies implemented in 2018 including specific details covering: Anti-Bribery and Corruption, Facilitation of Tax Evasion, Anti-Money Laundering;
• Compliance monitoring activities and periodic reporting requirements introduced;
• Ongoing engagement with external lawyers and consultants and regulatory authorities, as necessary, to identify and assess changes in the regulatory environment;
• New Third Party Code of Conduct introduced and communicated;
• Launch of Third Party Monitoring reviews.
No change
4. ECONOMIC AND POLITICAL INSTABILITYA slowdown in the growth of, or a reduction in demand for, wireless communication services could adversely affect the demand for communication sites and tower space and could have a material adverse affect on the Group’s financial condition and results of operations.
There are significant risks related to political instability, security, ethnic, religious and regional tensions in each geography where the Group has operations.
Operational
Financial
• Ongoing market analysis and business intelligence gathering activities;
• Market share growth strategy in place;
• Close monitoring of any potential risks that may affect operations;
• Business continuity and contingency plans in place to respond to any emergency situations.
No change
5. SIGNIFICANT EXCHANGE RATE MOVEMENTSFluctuations in, or devaluations of, local market currencies where the Group operates could have a significant and negative financial impact on the Group’s business, financial condition and results. Such impacts may also result from any adverse effects such movements have on Group third party customers and strategic suppliers.
Financial • USD and EUR pegged contracts;
• “Natural” hedge of local currencies (revenue vs. opex);
• Monthly review of exchange rate differences.
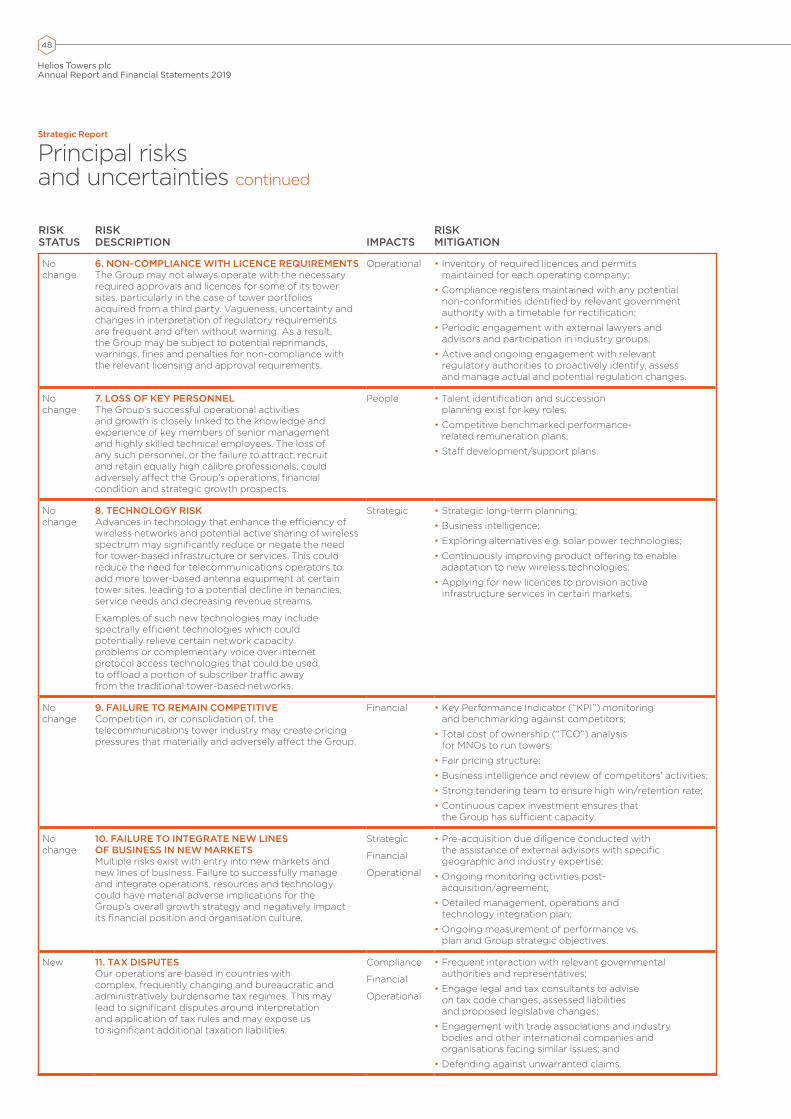
48
Helios Towers plcAnnual Report and Financial Statements 2019
RISK STATUS
RISK DESCRIPTION IMPACTS
RISK MITIGATION
No change
6. NON-COMPLIANCE WITH LICENCE REQUIREMENTSThe Group may not always operate with the necessary required approvals and licences for some of its tower sites, particularly in the case of tower portfolios acquired from a third party. Vagueness, uncertainty and changes in interpretation of regulatory requirements are frequent and often without warning. As a result, the Group may be subject to potential reprimands, warnings, fines and penalties for non-compliance with the relevant licensing and approval requirements.
Operational • Inventory of required licences and permits maintained for each operating company;
• Compliance registers maintained with any potential non-conformities identified by relevant government authority with a timetable for rectification;
• Periodic engagement with external lawyers and advisors and participation in industry groups;
• Active and ongoing engagement with relevant regulatory authorities to proactively identify, assess and manage actual and potential regulation changes.
No change
7. LOSS OF KEY PERSONNELThe Group’s successful operational activities and growth is closely linked to the knowledge and experience of key members of senior management and highly skilled technical employees. The loss of any such personnel, or the failure to attract, recruit and retain equally high calibre professionals, could adversely affect the Group’s operations, financial condition and strategic growth prospects.
People • Talent identification and succession planning exist for key roles;
• Competitive benchmarked performance-related remuneration plans;
• Staff development/support plans.
No change
8. TECHNOLOGY RISKAdvances in technology that enhance the efficiency of wireless networks and potential active sharing of wireless spectrum may significantly reduce or negate the need for tower-based infrastructure or services. This could reduce the need for telecommunications operators to add more tower-based antenna equipment at certain tower sites, leading to a potential decline in tenancies, service needs and decreasing revenue streams.
Examples of such new technologies may include spectrally efficient technologies which could potentially relieve certain network capacity problems or complementary voice over internet protocol access technologies that could be used to offload a portion of subscriber traffic away from the traditional tower-based networks.
Strategic • Strategic long-term planning;
• Business intelligence;
• Exploring alternatives e.g. solar power technologies;
• Continuously improving product offering to enable adaptation to new wireless technologies;
• Applying for new licences to provision active infrastructure services in certain markets.
No change
9. FAILURE TO REMAIN COMPETITIVECompetition in, or consolidation of, the telecommunications tower industry may create pricing pressures that materially and adversely affect the Group.
Financial • Key Performance Indicator (“KPI”) monitoring and benchmarking against competitors;
• Total cost of ownership (“TCO”) analysis for MNOs to run towers;
• Fair pricing structure;
• Business intelligence and review of competitors’ activities;
• Strong tendering team to ensure high win/retention rate;
• Continuous capex investment ensures that the Group has sufficient capacity.
No change
10. FAILURE TO INTEGRATE NEW LINES OF BUSINESS IN NEW MARKETSMultiple risks exist with entry into new markets and new lines of business. Failure to successfully manage and integrate operations, resources and technology could have material adverse implications for the Group’s overall growth strategy and negatively impact its financial position and organisation culture.
Strategic
Financial
Operational
• Pre-acquisition due diligence conducted with the assistance of external advisors with specific geographic and industry expertise;
• Ongoing monitoring activities post-acquisition/agreement;
• Detailed management, operations and technology integration plan;
• Ongoing measurement of performance vs. plan and Group strategic objectives.
New 11. TAX DISPUTESOur operations are based in countries with complex, frequently changing and bureaucratic and administratively burdensome tax regimes. This may lead to significant disputes around interpretation and application of tax rules and may expose us to significant additional taxation liabilities.
Compliance
Financial
Operational
• Frequent interaction with relevant governmental authorities and representatives;
• Engage legal and tax consultants to advise on tax code changes, assessed liabilities and proposed legislative changes;
• Engagement with trade associations and industry bodies and other international companies and organisations facing similar issues; and
• Defending against unwarranted claims.
Strategic Report
Principal risks and uncertainties continued
49
Helios Towers plcAnnual Report and Financial Statements 2019
Overview StrategicReport
GovernanceReport
Financial Statements
Viability statement
1) ASSESSMENT OF PROSPECTSCONTEXT FOR THE ASSESSMENTThe Group’s strategy and business model are central to understanding its prospects. Details can be found on pages 20 to 21. The current overall strategy has been in place for several years and continues to develop and evolve subject to ongoing review and monitoring. The Group’s activities are long-term in nature, as is its business model.
The core business of the group has a market-leading share in three of the five markets in which it operates. The Group has demonstrated consistent and continued Adjusted EBITDA growth for the last five years. From 2016 to 2019, operating loss has improved from US$(35) million to US$(5) million.
The Board continues to take a balanced approach to the Group’s strategy and the focus is primarily on exercising opportunities for growth in new markets, strengthening revenue generating streams from existing assets and cost control management.
Decisions relating to entry into new markets are made consistent with the Group’s current risk appetite and subject to robust commercial analysis, diligence and Board oversight and approval. Similar controls operate in relation to significant new customers and tower colocation opportunities.
The Group’s focus is on identifying further opportunities for expansion into new markets, growing its existing tower and tenant portfolio in existing markets and identifying potential for new product development in these markets. This is consistent with the Group’s existing strategy and risk profile, which is overseen and considered by the Board.
KEY ASSUMPTIONS AND THE ASSESSMENT PROCESSGroup prospects are assessed through its strategic planning process, which is led by the CEO and the executive management team and involves all relevant functions such as Finance, Commercial, Operations, Legal and Compliance. The Board, through its regularly scheduled meetings oversees this process. The Board’s role is to assess and consider whether the plan outputs take account of external dynamics including political, social, technological and macro-economic factors.
The output of this process is a set of objectives, financial forecasts and an assessment of any key risks that may impact its delivery. The latest updates to this strategic plan were finalised in 2019. This considered the Group’s current positions and business prospects for the next five years, focusing on potential market expansion, growth opportunities in existing markets and the scope for new product development.
Based on this analysis, detailed financial forecasts were prepared for a five-year period. The forecasts for the first year represent its operating budget, which is subject to ongoing review and formal monitoring during the year. A similar level of detail is included in the second year of the forecast and this is flexed, based on the actual results obtained in year one. Forecasts for the remaining years are extrapolated from these first two years, based on the overall content of the strategic plan.
We assume that debt refinancing will be available in all plausible market conditions and that there will be no material change to the Group’s capital structure over the period.
The key assumptions reflect the principal risks of the Group, which are explained on pages 47 and 48. The purpose of this summary is to set out those key risks that could prevent the Group from achieving its strategy. Depending on the nature or impact of aspects of these principal risks, the Group’s ability to continue in business in its current form could be affected, if these were realised. This was considered as part of the Group’s viability assessment, outlined below.
2) ASSESSMENT OF VIABILITYWhile the Group’s strategic plan reflects the Directors’ best estimates of the future prospects of the business, the Group has also considered a number of downside scenarios by quantifying their potential financial impact and assessing the potential impact on planned delivery. These scenarios, which are based on aspects of the principal risks and represent “severe but plausible” circumstances that could affect the Group, its operations and business activities.
The results of this stress-testing, and assessment of significant quantitative and qualitative factors, demonstrated that the Group would be able to withstand these impacts over the period of its financial forecasts. This is due to the stability of its core business and by making necessary adjustments to its business-as-usual operational and activity plans.
3) VIABILITY STATEMENTThe Directors confirm that they have a reasonable expectation that the Group will be able to continue in operation and meet its liabilities as they fall due over this five-year period, based on the assessment of prospects and viability detailed above.
4) GOING CONCERNThe Directors also considered it appropriate to prepare the Financial Statements on a going concern basis, as explained in Note 2 to the Group Financial Statements included in this Annual Report.

50
Helios Towers plcAnnual Report and Financial Statements 2019
In accordance with section 172 of the UK Companies Act 2006, the Board has a duty to promote the success of the Company for the benefit of its members as a whole.
In doing so, it must have regard to specified issues (among other matters) including the interests of the Company’s employees, its business relationships with suppliers and customers, and the impact of its operations on communities and the environment.
The Directors have always, both collectively and individually, taken decisions for the long term and consistently aim to uphold the highest standards of business conduct. This statement serves as an overview of how the Directors have performed this duty in 2019 and engaged with the Company’s key stakeholders to help to inform the Board’s decision-making.
Helios Towers plc became the ultimate holding company of the Group on 17 October 2019. Therefore, this section 172 statement has been prepared on the basis that references to “the Board” are to the board of the previous holding company of the Group, Helios Towers, Ltd for all actions that occurred between 1 January 2019 and 17 October 2019 and are to the “Board of the Company” for all actions that occurred after 17 October 2019.
Further information on the Company’s engagement activities can be found on pages 30 and 31.
INTERESTS OF THE COMPANY’S WORKFORCE During 2019, the Board considered the reward and training needs of the Company’s workforce and made the following decisions.(a) In order to retain, reward and
incentivise employees, the Board reviewed and approved the payment of the 2018 annual bonuses for all Group employees, and the structure of annual bonus awards for 2019.
(b) In order to retain, reward and incentivise its senior leadership team, the Board approved the implementation of a new Management Incentive Plan which crystallised on completion of the Company’s IPO and rewarded certain senior managers with the grant of options under a new employment incentive plan. Further information is set out in Note 25 to the Financial Statements on page 141 and pages 89 to 90 of the Remuneration Report.
(c) As part of the approval of the 2019 budget, the Board approved continued investment in various training initiatives, with a strong focus on Lean Six Sigma training. This resulted in an increased proportion of staff trained in Lean Six Sigma, from 35% as at 31 December 2018 to 45% as at 31 December 2019. The Leadership Development Training programme also continued successfully, as well as department-specific training (for example, for Finance, Legal and HR) and various team-building exercises and off-site activities. Please see further information on our training initiatives and workforce engagement in the strategic report under “Developing our people” on page 31.
Engagement activities in 2019 included the majority of our Directors visiting at least one of our markets, and members of the senior management team regularly visiting our workforce across all our markets, to ensure better collaboration and a greater sense of belonging to the Helios Towers family. This included ‘town hall’ meetings, hosted by Executive Directors and with Group-wide participation, to keep employees up to date with the latest quarterly results and milestones of the business. These concluded with a Q&A session where staff could put questions to our Executive Directors, to ensure that the motives and plans of the Board were understood.
In 2020, the Board expects to appoint a designated Non-Executive Director to represent the workforce and to consider and approve an employee engagement survey.
RELATIONSHIPS WITH CUSTOMERS AND SUPPLIERS During 2019, the Board considered the situation and requirements of the Company’s customers and suppliers, leading to the following decisions.(a) To better support its customers and
suppliers, the Company became a member of the International Digital Infrastructure Association (IDIA). The association’s primary aim is to ensure that the industry can work within constructive regulatory frameworks.
(b) To better service the needs of its customers, the Board agreed that its subsidiary, Helios Towers Tanzania, should enter into a collocation marketing agreement with Viettel, whereby it acquired the rights to collocate on approximately 1,000 sites. These additional sites meant that new collocation opportunities were made available to other Group customers.
Strategic Report
Section 172 statement
51
Helios Towers plcAnnual Report and Financial Statements 2019
Overview StrategicReport
GovernanceReport
Financial Statements
(c) To help drive customer excellence, the Board agreed that part of the annual bonuses awarded to employees was to be determined by the Company’s network performance across its markets.
(d) To provide more sites to its South African customers, it entered into a c.$36 million facilities agreement, providing the necessary funds for site expansion across the country.
In addition, in January, June and September 2019, the Group co-hosted three training programmes in Nairobi, Accra and Johannesburg respectively. These events, entitled “Lifting Safety to New Heights” were held with Nokia, Delmec (one of our key suppliers) and Gravity Training (in Johannesburg only). Please see further information in the strategic report on page 33.
INTERESTS OF SHAREHOLDERS AND DEBT INVESTORSIn 2019, the primary focus of the Board was to secure the successful IPO of the Company. In addition, the Board was keen to ensure that its shareholders and debt investors were kept regularly updated with the Group’s performance. Further information is set out in the corporate governance report under “Stakeholders and the Board” on page 60.
The Board’s decision to enter into a c.$36 million facilities agreement for South Africa was also driven by the shareholders’ desire for the Company to implement its growth strategy in that market.
SUSTAINABILITY IN OUR COMMUNITIES AND ENVIRONMENTSThe Board is committed to operating sustainably, in the widest sense of the term. This means providing safe and equitable employment; offering equal opportunities for all; trading honestly and ethically; and working with full regard for the well-being of our communities, environments and the planet.
During 2019, the Board therefore took a number of actions and decisions, including: (a) reviewing, approving and adopting
a new Modern Slavery Act policy;(b) reviewing, approving and adopting
the policies set out in the strategic report relating to sustainability. Please see details under “Relevant policies” on pages 36 and 37; and
(c) approving the decommissioning of 154 and 33 sites in Tanzania and DRC respectively. The Company’s model prioritises site-sharing to reduce wasteful duplication. In turn, this can reduce the impact on the community and the environment, both physically and visually, and indeed through more efficient energy use and reduced carbon emissions.
During 2019, the Company attained ISO: 37001 anti-bribery certification (see page 32). We also give more detail on the Board’s decisions relating to sustainability and environment on pages pages 32 and 35. Guiding everything we do is the non-negotiable priority of operating safely and considerately in our host communities. Indeed, at every meeting of the Board, the first item of the CEO’s report is an update on safety, health and the environment.

52
Helios Towers plcAnnual Report and Financial Statements 2019
Strategic Report
Operating review
PARTNERING WITH OUR CUSTOMERSWe partner with our customers to provide critical infrastructure and services to the mobile network operators (MNOs) and other communications service providers, supporting their coverage and densification plans.
During the year, MNOs continued to invest to improve and expand their networks, rolling out 3G and 4G across each of our markets. We worked with them to build sites in new coverage areas, and by adding both colocation and amendment tenancies to existing sites, largely for technology upgrades and network densification.
We also helped recently-merged networks to maximise the benefits of their integration. This included some limited decommissioning of their now-redundant sites in favour of more efficient colocation on alternative sites.
During the year we also entered the South African market. One of the many benefits of this venture has been the new experience of delivering edge data centre capability. Together with fibre regeneration and small cell solutions, this brings increasing breadth and depth to the support Helios Towers can bring to our partnerships with mobile operators.
TANZANIAKey highlights (US$ millions) FY19 FY18
Revenue 162.1 149.8Adjusted EBITDAΔ 96.4 86.2Total sites 3,661 3,701Total tenancies 8,099 7,848Tenancy ratio 2.21x 2.12x
• Tanzania performed well in 2019 with revenues of US$162.1 million and Adjusted EBITDAΔ of US$96.4 million
• We saw strong demand from larger customers, largely driven by major investments in 4G from both Tigo and Vodafone
• The Government is also pushing to increase rural coverage. This is driving BTS rollout, and we expect this to continue into 2020
• Tightly controlled costs have been delivered through efficiency improvements, resulting in HT offering some of the lowest prices for tower access in Tanzania. This has helped to sustain demand.
Key highlights (US$ millions) FY19 FY18
Revenue 158.0 140.9Adjusted EBITDAΔ 88.3 72.5Total sites 1,850 1,773Total tenancies 3,828 3,492Tenancy ratio 2.07x 1.97x
• DRC performed strongly in 2019 with revenues of US$158.0 million and Adjusted EBITDAΔ of US$88.3 million
• 2019 saw more demand for both colocations and new-builds
• This performance has been driven by a combination of network densification and expansion by all our operator customers. Our DRC backbone has also enabled greater customer capacity and is driving demand
• The market remains full of potential with large swathes of the territory and population still out of reach of both mobile coverage and ISPs
• To push network expansion further into the rural territories, many operators are looking for sustainable solutions that need no subsidies. This requires lower cost, lighter tower solutions.
DRC
Adjusted EBITDAΔ growth
+12%2019: US$96.4m 2018: US$86.2m
Adjusted EBITDAΔ growth
+22%2019: US$88.3m 2018: US$72.5m

53
Helios Towers plcAnnual Report and Financial Statements 2019
Overview StrategicReport
GovernanceReport
Financial Statements
Key highlights (US$ millions) FY19 FY18
Revenue 40.1 41.0Adjusted EBITDAΔ 23.6 22.8Total sites 961 891Total tenancies 1,888 1,680Tenancy ratio 1.96x 1.89x
• We experienced stable performance in the competitive Ghanaian market with revenue and Adjusted EBITDAΔ of US$40.1 million and US$23.6 million, respectively
• Market growth continued to be marginally hampered by the 2017 integration of Airtel and Tigo, but the combined group continues to roll out on many of our sites
• Other operators continue to add colocations and new site rollouts in a competitive response to the new No.2 player
• Ghana continues to be an efficiently performing competitive market.
Key highlights (US$ millions) FY19 FY18
Revenue 25.9 24.3Adjusted EBITDAΔ 13.6 12.1Total sites 384 380Total tenancies 568 529Tenancy ratio 1.48x 1.39x
• A strong and stable market with continued growth in revenue and Adjusted EBITDAΔ of US$25.9 million and US$13.6 million, respectively
• Customers have been adding equipment using the lease capacity they already have, and our relationships remain strong
• Operationally our performance has improved significantly through excellent cost management
• Operators have recently begun investing in 4G, and this may trigger new demand for more sites and colocation needs.
Key highlights (US$ millions) FY19 FY18
Revenue 1.6 –Adjusted EBITDAΔ 0.2 –Total sites 118 –Total tenancies 208 –Tenancy ratio 1.76x –
• Our entry this year has delivered its first revenue and Adjusted EBITDAΔ of US$1.6 million and US$0.2 million, respectively
• Although a relatively mature mobile market with urban centres similar to Western cities, there are many unserved and under-served areas. New or additional tower infrastructure, and more fibre backhaul, is needed to deliver faster 4G services
• We see opportunities both to expand the tower market and to bring our expertise from other markets, such as in resilient power solutions, to a country increasingly prone to unreliable power supplies
• 5G is looming large with the catalyst of spectrum auctions expected soon. This should encourage MNOs to enter tower sale and leaseback transactions to free up investment for 5G network rollouts, as well as associated edge data centres and small cell solutions.
GHANA CONGO B S. AFRICA
Adjusted EBITDAΔ growth
+4%2019: US$23.6m 2018: US$22.8m
Adjusted EBITDAΔ growth
+12%2019: US$13.6m 2018: US$12.1m
Targeted sites by April 2022
+1,0002019: 118 2018: N/A

54
Helios Towers plcAnnual Report and Financial Statements 2019
Strategic Report
Operating review continued
ALTERNATIVE PERFORMANCE MEASURES The Group has presented a number of alternative performance measures (“APMs”), which are used in addition to IFRS statutory performance measures.
The Group believes that these APMs, which are not considered to be a substitute for or superior to IFRS measures, provide stakeholders with additional helpful information on the performance of the business. These APMs are consistent with how the business performance is planned and reported within the internal management reporting to the Board. Some of these measures are also used for the purposes of setting remuneration targets.
Reconciliation between APM and IFRS2019
US$m2018
US$m
Adjusted EBITDA 205.2 177.6Adjustments applied to give Adjusted EBITDAExceptional items:
Litigation costs(1) – (10.2)Exceptional project costs(2) (18.6) (14.7)
Deal costs(3) (1.7) (1.5)Share-based payments and long term incentive plans(4) (31.2) –Loss on disposal of property, plant and equipment (11.0) (5.8)Other gains and losses 33.9 (16.8)Recharged depreciation(5) – (0.9)Depreciation of property, plant and equipment (129.5) (124.0)Amortisation of intangibles (9.2) (8.4)Depreciation of right-of-use assets (8.5) (8.8)Interest receivable 0.7 1.0Finance costs (104.9) (107.0)
Loss before tax (74.8) (119.5)
(1) Litigation costs relate to legal costs incurred in connection with a previously terminated equity transaction.(2) Exceptional project costs are in relation to the listing of equity on the London Stock Exchange.(3) Deal costs comprise deal costs for aborted acquisitions, which mainly comprise professional fees and
travel costs incurred while investigating potential site acquisitions that are expensed when the potential site acquisition does not proceed, and deal costs not capitalized, which relate to the exploration of investment opportunities across Africa that are mainly related to the acquisition of an 89.5% interest in HTSA Towers (Pty) Ltd. See Note 30.
(4) Share-based payments, long term incentive plan charges, retention award (US$10 million) and associated costs. See Note 25.
(5) The Group incurred costs charged to it through a service contract from Helios Towers Africa LLP until 5 March 2019. From 6 March 2019, Helios Towers Africa LLP was consolidated in to the Group. Prior to this, management considered that the depreciation element of the charge should be removed from Adjusted EBITDA as it is depreciation in nature.
ADJUSTED EBITDADEFINITIONManagement defines Adjusted EBITDA as loss for the year, adjusted for tax expenses, finance costs, other gains and losses, interest receivable, loss on disposal of property, plant and equipment, amortisation of intangible assets, depreciation and impairment of property, plant and equipment, depreciation of right-of-use assets, recharged depreciation, deal costs, share-based payments and long-term incentive plan charges, and exceptional items. Exceptional items are material items that are considered exceptional in nature by management by virtue of their size and/or incidence.
PURPOSEThe Group believes that Adjusted EBITDA facilitates comparisons of operating performance from period to period and company to company by eliminating potential differences caused by variations in capital structures (affecting interest and finance charges), tax positions (such as the impact on periods or companies of changes in effective tax rates or net operating losses) and the age and booked depreciation on assets. The Group excludes certain items from Adjusted EBITDA, such as loss on disposal of property, plant and equipment, and exceptional and adjusting items because it believes they are not indicative of its underlying trading performance.

55
Helios Towers plcAnnual Report and Financial Statements 2019
Overview StrategicReport
GovernanceReport
Financial Statements
ADJUSTED GROSS MARGINDEFINITIONAdjusted gross margin means gross profit, adding back site and warehouse depreciation, divided by revenue.
PURPOSEThis measure is used to evaluate the underlying level of gross profitability of the operations of the business, excluding depreciation, which is the major non-cash measure otherwise reflected in cost of sales. The Group believes that adjusted
Reconciliation between IFRS and APM2019
US$m2018
US$m
Gross profit 125.9 100.2Add back: Site and warehouse depreciation 128.7 124.1Adjusted gross profit 254.6 224.3Revenue 387.8 356.0Adjusted gross margin 66% 63%
Reconciliation between IFRS and APM2019
US$m2018
US$m
Operating (loss)/profit (4.5) 3.3Exceptional items:
Litigation costs(1) – 10.2Exceptional project costs(2) 18.6 14.7
Deal costs(3) 1.7 1.5Share-based payments and long term incentive plans(4) 31.2 –Loss on disposal of property, plant and equipment 11.0 5.8
Adjusted operating profit 58.0 35.5
gross profit facilitates comparisons of operating performance from period to period and company to company by eliminating potential differences caused
ADJUSTED OPERATING PROFIT/(LOSS)DEFINITIONAdjusted operating profit/(loss) means reported operating profit/(loss) adjusted for loss on disposal of property, plant and equipment, deal costs, share-based payments and long-term incentive plan charges, and exceptional items. Exceptional items are material items that are considered exceptional in nature by management by virtue of their size and/or incidence.
PURPOSEThis measure is used to evaluate the underlying level of operating profitability of
the Group. By including adjustments mentioned in the definition the Group believes that adjusted operating profit/
by the age and booked depreciation on assets. It is also a proxy for the gross cash generation of its operations.
(loss) facilitates a more meaningful comparison of Group operating performance trends from period to period.
Reconciliation between IFRS and APM2019
US$m2018
US$m
Cash generated from operating activities 125.3 133.8Adjustments applied:Movement in working capital 28.4 16.5Exceptional items:
Litigation costs(1) – 10.2Exceptional project costs(2) 18.6 14.7
Share-based payments and long term incentive plans(4) 31.2 –Deal costs(3) 1.7 1.5Recharged depreciation – 0.9Adjusted EBITDA 205.2 177.6Less: Maintenance and corporate capital additions (12.1) (16.4)Less: Payments of lease liabilities(5) (20.9) (25.5)Less: Tax paid(6) (3.3) (2.9)Portfolio free cash flow 168.9 132.8
PORTFOLIO FREE CASH FLOW AND ADJUSTED FREE CASH FLOWDEFINITIONPortfolio free cash flow is defined as Adjusted EBITDA less maintenance and corporate capital expenditure, payments of lease liabilities (including interest and principal repayments of lease liabilities) and tax paid. Adjusted free cash flow is defined as portfolio free cash flow less net payment of interest and discretionary capital additions. For a reconciliation please see page 44.
PURPOSEThis measure is used to evaluate the cash flow generated by the business operations after expenditure incurred on maintaining capital assets, including lease liabilities, and taxes. It is a measure of the cash generation of the tower estate.
Reconciliation between IFRS and APM2019
US$m2018
US$m
External debt 684.3 628.1Lease liabilities 125.6 118.4Gross debt 809.9 746.5Cash and cash equivalents 221.1 89.0Less: restricted cash (37.7) –Adjusted cash and cash equivalents 183.4 89.0
Net debt 626.5 657.5
GROSS DEBT, NET DEBT, NET LEVERAGE AND ADJUSTED CASH & CASH EQUIVALENTSDEFINITIONGross debt is calculated as non-current loans and current loans and long-term and short-term lease liabilities. Net debt is calculated as gross debt less adjusted cash and cash equivalents. Adjusted cash and cash equivalents comprises cash and cash equivalents excluding US $37.7 million of restricted cash for the potential payment of change of control taxes related to our initial public offering in 2019 funded by a capital contribution from our shareholders immediately prior to the initial public offering. Net leverage is calculated as net debt divided by last quarter annualised Adjusted EBITDA.
PURPOSENet debt is a measure of the group’s net indebtedness that provides an indicator of overall balance sheet strength. It is also a single measure that can be used to assess both the group’s cash position and
its indebtedness. The use of the term ‘net debt’ does not necessarily mean that the cash included in the net debt calculation is available to settle the liabilities included in this measure.
(1) Litigation costs relate to legal costs incurred in connection with a previously terminated equity transaction.
(2) Exceptional project costs are in relation to the listing of equity on the London Stock Exchange.
(3) Deal costs comprise deal costs for aborted acquisitions, which mainly comprise professional fees
and travel costs incurred while investigating potential site acquisitions that are expensed when the potential site acquisition does not proceed, and deal costs not capitalized, which relate to the exploration of investment opportunities across Africa that are mainly related to the acquisition of an 89.5% interest in HTSA Towers (Pty) Ltd. See Note 30.
(4) Share-based payments, long term incentive plan charges, retention award (US$10 million) and associated costs. See Note 25.
(5) Payment of lease liabilities includes interest and principal repayments of lease liabilities.
(6) Tax paid excludes Change of Control Taxes which are classified as exceptional.

56
Helios Towers plcAnnual Report and Financial Statements 2019
Governance Report
Chair’s introduction
Dear Shareholder
On behalf of the Board, I am delighted to introduce our first Governance Report as a listed company. It is also my first as Chair.
As you can imagine, our IPO in October 2019 required many months of preparation across the business. This included establishing a solid system of corporate governance and embedding the policies and procedures we need to meet the Company’s new regulatory and governance requirements.
This report outlines the main steps we are taking en route to ensuring that the Board and its committees comply with the 2018 UK Corporate Governance Code (“the Code”). This is a continuing process: we have only been a listed company since “Admission” on 18 October 2019 and there is more work to do. However, we are committed to be fully compliant with the Code by 1 January 2021.
As part of preparing for Admission, the Company appointed Alison Baker and Magnus Mandersson as Independent Non-Executive Directors. We have been delighted to welcome them and the valuable insights and experience they bring in emerging markets and the telecoms sector. We also expect to make two additional Independent Non-Executive Director appointments, (one of which will be our workforce designated Non-Executive Director), in 2020 which will further enhance the diversity and balance of the Board.
Our Directors above join Richard Byrne (also an independent), Temitope Lawani and David Wassong (who, respectively, represent two of our largest shareholders – Lath Holdings Ltd and Quantum Strategic Partners, Ltd). All three were Directors of the Group’s previous holding company, and I believe the Company has a qualified and capable Board with a broad range of relevant skills.
We have also reshaped our Audit, Remuneration and Nomination committees, with the membership of each complying with the Code.
Over the coming year, the Board’s corporate governance priorities will be to enhance its engagement and communications with stakeholders; to recruit two additional independent Non-Executive Directors; and to ensure Code-compliant engagement with the Group’s workforce.
These and other steps are designed to build on the firm commitment that the Board has already made to uphold the highest standards of corporate governance; a commitment we will work hard to fulfil over the coming year. I am also looking forward to welcoming shareholders to our inaugural Annual General Meeting in April 2020, and the opportunity to discuss personally any questions you may have about our governance arrangements.
I do hope you can join us.
Samuel Jonah, KBE, OSG | Chair

57
Helios Towers plcAnnual Report and Financial Statements 2019
Overview StrategicReport
GovernanceReport
Financial Statements
DIRECTOR BOARD AUDIT NOMINATION REMUNERATION
Sir Samuel Jonah (Chair) (Chair, Nomination Committee)
1/1 N/A 0/0 1/1
Magnus Mandersson (SID)
1/1 1/1 0/0 1/1
Alison Baker (Chair, Audit Committee)
1/1 1/1 N/A 1/1
Richard Byrne (Chair, Remuneration Committee)
1/1 1/1 N/A 1/1
Temitope Lawani 0/1 N/A 0/0 N/A
David Wassong 1/1 N/A N/A N/A
Kash Pandya (Group CEO)
1/1 N/A N/A N/A
Tom Greenwood (Group CFO)
1/1 N/A N/A N/A
DIRECTORS’ ATTENDANCEThe table below sets out the Directors’ attendance at Board and committee meetings during the period from Admission to 31 December 2019. Where a Director was absent, they ensured that their views were communicated to the Chair or another Director prior to the meeting.
Some Directors also attended committee meetings as invitees during the year, but this is not reflected in the table. Where ‘N/A’ is shown, this signifies that the Director listed has not been a member of that particular committee.
The Board intends to visit a Group business location each year to enable the Directors to gain a deeper understanding of the Group’s operations. This will also provide senior managers from across the Group with the opportunity to present to the Board as well as to meet the Directors on a more informal basis.
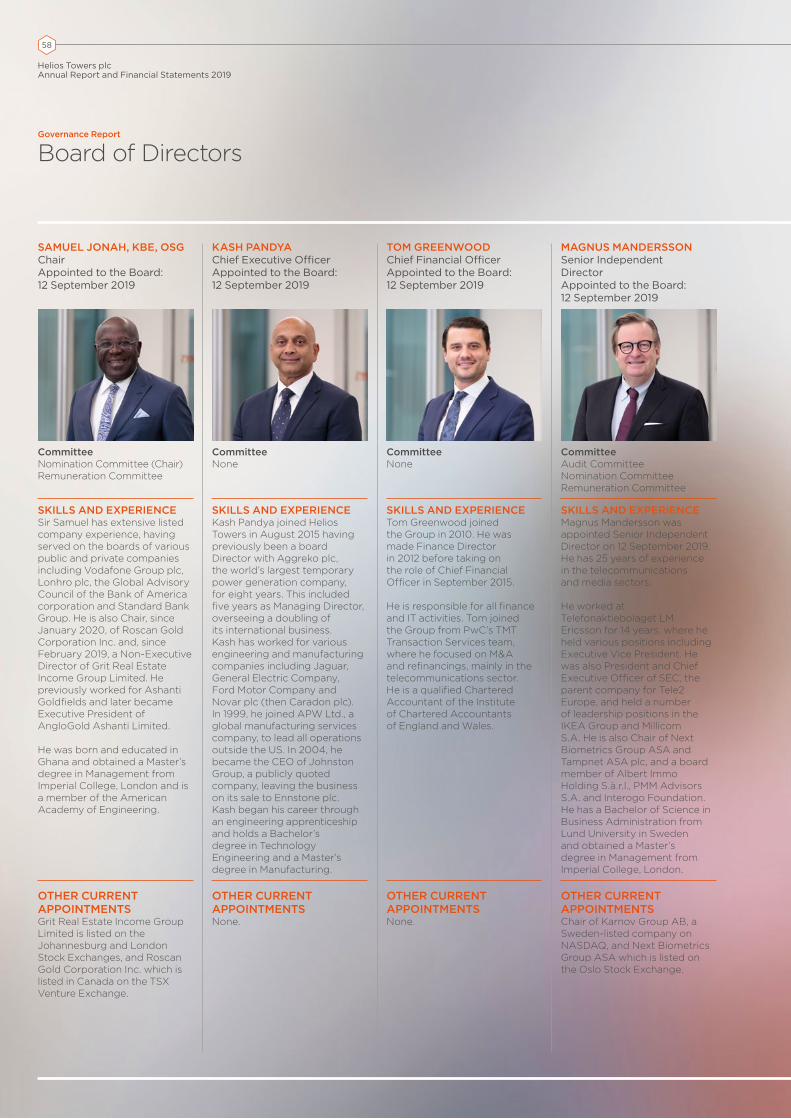
58
Helios Towers plcAnnual Report and Financial Statements 2019
Governance Report
Board of Directors
SAMUEL JONAH, KBE, OSGChairAppointed to the Board: 12 September 2019
KASH PANDYAChief Executive OfficerAppointed to the Board: 12 September 2019
TOM GREENWOODChief Financial OfficerAppointed to the Board: 12 September 2019
MAGNUS MANDERSSONSenior Independent DirectorAppointed to the Board: 12 September 2019
CommitteeNomination Committee (Chair)Remuneration Committee
CommitteeNone
CommitteeNone
CommitteeAudit Committee Nomination Committee Remuneration Committee
SKILLS AND EXPERIENCESir Samuel has extensive listed company experience, having served on the boards of various public and private companies including Vodafone Group plc, Lonhro plc, the Global Advisory Council of the Bank of America corporation and Standard Bank Group. He is also Chair, since January 2020, of Roscan Gold Corporation Inc. and, since February 2019, a Non-Executive Director of Grit Real Estate Income Group Limited. He previously worked for Ashanti Goldfields and later became Executive President of AngloGold Ashanti Limited.
He was born and educated in Ghana and obtained a Master’s degree in Management from Imperial College, London and is a member of the American Academy of Engineering.
SKILLS AND EXPERIENCEKash Pandya joined Helios Towers in August 2015 having previously been a board Director with Aggreko plc, the world’s largest temporary power generation company, for eight years. This included five years as Managing Director, overseeing a doubling of its international business. Kash has worked for various engineering and manufacturing companies including Jaguar, General Electric Company, Ford Motor Company and Novar plc (then Caradon plc). In 1999, he joined APW Ltd., a global manufacturing services company, to lead all operations outside the US. In 2004, he became the CEO of Johnston Group, a publicly quoted company, leaving the business on its sale to Ennstone plc. Kash began his career through an engineering apprenticeship and holds a Bachelor’s degree in Technology Engineering and a Master’s degree in Manufacturing.
SKILLS AND EXPERIENCETom Greenwood joined the Group in 2010. He was made Finance Director in 2012 before taking on the role of Chief Financial Officer in September 2015.
He is responsible for all finance and IT activities. Tom joined the Group from PwC’s TMT Transaction Services team, where he focused on M&A and refinancings, mainly in the telecommunications sector. He is a qualified Chartered Accountant of the Institute of Chartered Accountants of England and Wales.
SKILLS AND EXPERIENCEMagnus Mandersson was appointed Senior Independent Director on 12 September 2019. He has 25 years of experience in the telecommunications and media sectors.
He worked at Telefonaktiebolaget LM Ericsson for 14 years, where he held various positions including Executive Vice President. He was also President and Chief Executive Officer of SEC, the parent company for Tele2 Europe, and held a number of leadership positions in the IKEA Group and Millicom S.A. He is also Chair of Next Biometrics Group ASA and Tampnet ASA plc, and a board member of Albert Immo Holding S.à.r.l., PMM Advisors S.A. and Interogo Foundation. He has a Bachelor of Science in Business Administration from Lund University in Sweden and obtained a Master’s degree in Management from Imperial College, London.
OTHER CURRENT APPOINTMENTSGrit Real Estate Income Group Limited is listed on the Johannesburg and London Stock Exchanges, and Roscan Gold Corporation Inc. which is listed in Canada on the TSX Venture Exchange.
OTHER CURRENT APPOINTMENTSNone.
OTHER CURRENT APPOINTMENTSNone.
OTHER CURRENT APPOINTMENTSChair of Karnov Group AB, a Sweden-listed company on NASDAQ, and Next Biometrics Group ASA which is listed on the Oslo Stock Exchange.

59
Overview StrategicReport
GovernanceReport
Financial Statements
Helios Towers plcAnnual Report and Financial Statements 2019
ALISON BAKERIndependent Non-Executive DirectorAppointed to the Board: 12 September 2019
RICHARD BYRNEIndependent Non-Executive DirectorAppointed to the Board: 12 September 2019
DAVID WASSONGNon-Executive DirectorAppointed to the Board: 12 September 2019
TEMITOPE LAWANINon-Executive DirectorAppointed to the Board: 12 September 2019
CommitteeAudit Committee (Chair) Remuneration Committee
CommitteeAudit CommitteeRemuneration Committee (Chair)
CommitteeNone
CommitteeNomination Committee
SKILLS AND EXPERIENCEAlison has more than 25 years of experience in auditing, capital markets and assurance services. She has worked extensively in emerging markets, including those in Africa.
Until January 2017, Alison was a partner at PwC LLP and, previously, a partner at EY LLP. She is a qualified Chartered Accountant of the Institute of Chartered Accountants of England and Wales, and gained a Bachelor of Science in Mathematical Sciences from Bath University.
SKILLS AND EXPERIENCERichard Byrne was appointed to the Board on 12 September 2019, having previously been a Director of Helios Towers, Ltd. since December 2010.
Richard co-founded TowerCo in 2004, serving as the company’s President and Chief Executive Officer. He was a member of the board of Directors from its inception until his retirement in December 2018. Before TowerCo, he was President of the tower division of SpectraSite Communications, Inc.
Richard has also served as National Director of Business Development at Nextel Communications Inc. From 2008 to 2018, he served on the board of Directors of the Wireless Infrastructure Trade Association (“WIA”) in the US.
SKILLS AND EXPERIENCEDavid Wassong was previously a Director of Helios Towers, Ltd., serving from January 2010. He is Managing Partner of Newlight Partners LP, an independent investment manager formed in October 2018 when part of the Strategic Investments Group of Soros Fund Management LLC (“SFM”), spun out of SFM. Previously, David was co-head of the Strategic Investments Group and jointly responsible for overseeing its investment portfolios. Before SFM, David was Vice President at Lauder Gaspar Ventures, LLC. He started his career in finance as an analyst and then as an associate in the investment banking group of Schroder Wertheim & Co., Inc. David received an MBA from the Wharton School at the University of Pennsylvania and gained his Bachelor’s degree in Economics from the University of Pennsylvania.
SKILLS AND EXPERIENCETemitope Lawani was previously a Director of Helios Towers, Ltd., serving since February 2010. A Nigerian national, he is a co-founder and Managing Partner of Helios Investment Partners (“Helios”) and has more than 25 years of principal investment experience.
Prior to forming Helios,Temitope was a principal in the San Francisco and London offices of TPG Capital, a global private equity firm. Temitope began his career as a corporate development analyst at the Walt Disney Company. He received a Bachelor of Science in Chemical Engineering from the Massachusetts Institute of Technology, a Juris Doctorate (cum laude) from Harvard Law School and an MBA from Harvard Business School.
OTHER CURRENT APPOINTMENTSKAZ Minerals Plc is listed on the Main Market of the London Stock Exchange, Rockhopper Exploration Plc is listed on AIM and Endeavour Mining Corp is listed on the Toronto Stock Exchange.
OTHER CURRENT APPOINTMENTSNone.
OTHER CURRENT APPOINTMENTSNone.
OTHER CURRENT APPOINTMENTSVivo Energy Holding plc is listed on the London Stock Exchange.
SENIOR MANAGEMENTThe Senior Management Team comprises: Alex Leigh (Chief Commercial Officer); Helen (Ebert) Shaw (Chief Legal Officer and Company Secretary); Colin Gaston (Director of Special Projects); Nicholas Summers (Director of Sustainability and Organisational Development); Roy Cursley (Director of Delivery and Technology); Philippe Loridon (CEO of Helios Towers Tanzania, Helios Towers DRC and Helios Towers Congo Brazzaville); Jeffrey Schumacher (CEO of
Helios Towers Ghana and Helios Towers South Africa); Leon-Paul Manya Okitanyenda (CEO of Helios Towers DRC); Patrick “Rico” Marx (Head of Towers at Helios Towers South Africa); Colard Nkole (Managing Director of Helios Towers Congo Brazzaville); Fritz Dzeklo (Managing Director of Helios Towers Ghana); and Ramsey Koola (Managing Director of Helios Towers Tanzania). Their management experience and expertise can be found at www.heliostowers.com.

60
Helios Towers plcAnnual Report and Financial Statements 2019
Governance Report
Corporate governance report
The Board has established a number of committees and has delegated to them responsibility for certain matters. The Board committee structure is shown opposite. Each committee is directed by written terms of reference setting out its roles and responsibilities, and the extent of its authority, as delegated by the Board. The Chair of each committee reports regularly to the Board on matters discussed at committee meetings.
COMPLIANCE STATEMENTAs a company with a premium listing on the London Stock Exchange, Helios Towers plc is required under the FCA Listing Rules to comply with the UK Corporate Governance Code (“the Code”, available from the Financial Reporting Council at frc.org.uk), or otherwise to explain its reasons for non-compliance.
The following statement is made in respect of the period from Admission to 31 December 2019 (the “Listed Period”).
During the Listed Period, the Company has complied with the provisions of the Code, with two exceptions:• Code Provision 11 recommends that
at least half the Board, excluding the Chair, should be Non-Executive Directors whom the Board considers to be independent. The Company does not currently comply with this provision because only three (excluding, for these purposes, the Chair) of its Non-Executive Directors are regarded by the Board to be independent for the purposes of the Code. The current composition of the Board reflects the rights of two of the Company’s largest shareholders (Lath Holdings, Ltd and Quantum Strategic Partners Limited) to appoint a Director to the Board under the Shareholders’ Agreement. Currently, Millicom Holding BV has a similar right, but has elected not to take this up.
THE BOARD
REMUNERATION COMMITTEE
AUDIT COMMITTEE
NOMINATION COMMITTEE
The Board regards the Chair, Sir Samuel Jonah, and Magnus Mandersson, Alison Baker and Richard Byrne to be independent for the purposes of the Code. Temitope Lawani and David Wassong, as representative Directors nominated by each of Lath Holdings, Ltd and Quantum Strategic Partners Limited respectively, are not regarded as independent. (Further information on Board appointment rights contained in the Shareholders’ Agreement is set out on page 64.) In order to comply with and exceed the Code, the Company will be appointing two additional Independent Non-Executive Directors during 2020. The Company is currently progressing this task and will update the market when the appointments have taken place.
• Code Provision 5 recommends that the Board engages with the workforce and suggests either one or a combination of methods be used, being either a Director appointed from the workforce, a formal workforce advisory panel or a designated Non-Executive Director. Having only recently listed, the Company does not currently comply with this provision. However, one of the additional Independent Non-Executive Directors to be hired during 2020 will be designated as the Company’s workforce Non-Executive Director.
The following sections of this report explain how the principles of the Code have been applied, and provide cross-references to other sections and/or the Company’s website (heliostowers.com), where more detailed descriptions are available.
BOARD LEADERSHIP AND COMPANY PURPOSEThe Board comprises eight members: the Chair, Chief Executive Officer, Chief Financial Officer and five Non-Executive Directors, of whom three are considered to be independent for the purposes of the Code. The names of the Directors and their biographies are set out on pages 58 and 59.
The Board is collectively responsible for the oversight, and long-term success, of the Company and the effective leadership of the Group. To that end, the Group has a skilled and dedicated executive leadership team that develops and promotes the Group’s strategy and oversees its implementation. Day-to-day management is delegated to the Executive Directors. However, certain matters are the specific preserve of the Board, including:

Overview StrategicReport
GovernanceReport
Financial Statements
61
Helios Towers plcAnnual Report and Financial Statements 2019
STRATEGY AND MANAGEMENT
• the Group’s strategy;• approval of the annual operating expenditure and capital expenditure budgets, and any material changes to them;• oversight of the Group’s operations; and• review of the Group’s performance in the light of its strategic aims, objectives, business plans and budgets.
CULTURE, PURPOSE AND VALUES
• establishing the Company’s purpose, values and strategy;• assessing and monitoring of culture; and• ensuring workforce policies and practices support the Company’s long-term sustainable success and are consistent
with the Company’s values.
STRUCTURE AND CAPITAL
• changes to the Company’s capital structure;• major changes to the Group’s corporate structure; and• changes to the Group’s management and control structure.
FINANCIAL REPORTING AND CONTROLS
• approval of Financial Statements;• approval of the dividend policy; and• approval of any significant changes in accounting policies or practices.
INTERNAL CONTROLS
• establishment and maintenance of a framework of prudent and effective controls, to enable risk to be assessed and managed.
CONTRACTS
• approval of major capital projects, material contracts (including debt facilities), major investments and disposals; and• approval of non-ordinary course contracts.
ENGAGEMENT AND COMMUNICATION
• engagement with, and participation from, shareholders and stakeholders on an ongoing basis; and• approval of mechanisms by which the Board will engage with the workforce.
BOARD MEMBERSHIP AND OTHER APPOINTMENTS
• ensuring adequate succession-planning for the Board and senior management;• changes to the structure, size and composition of the Board;• appointments to the Board; and• approving the continuation in office of Directors.
REMUNERATION
• determining the remuneration of the Directors, senior management and the company secretary;• determining the remuneration of the Non-Executive Directors; and• introducing new share incentive plans or major changes to existing plans, to be put to shareholders for approval.
DELEGATION OF AUTHORITY
• agreeing the division of responsibilities of the Chair, Chief Executive Officer and Senior Independent Director, Board and committees; and
• approving the delegated levels of authority.
62
Helios Towers plcAnnual Report and Financial Statements 2019
CORPORATE GOVERNANCE MATTERS
• undertaking a formal and rigorous annual review of its own performance, and that of its committees and individual Directors, and the division of responsibilities;
• determining the independence of each Non-Executive Director;• considering the balance of interests between shareholders, employees, customers and the community; and• reviewing the overall corporate governance structure of the Group.
POLICIES
• approval of policies including those relating to the Code of Conduct, share dealings, whistleblowing, anti-bribery, health and safety, environment and sustainability.
OTHERS
• political donations;• approving the appointment of the Group’s principal advisers;• approving the overall level of insurance; and• any decision likely to have a material impact on the Company or Group from any perspective.
Governance Report
Corporate governance report continued
The Board is responsible for ensuring leadership through effective oversight and review. It sets the strategic direction for the Group, shapes the organisational culture and values, promotes corporate governance and plays a key role in ensuring the business creates and sustains value growth over the long-term. The Board also oversees the implementation of appropriate risk assessment systems and processes to identify, manage and mitigate the Group’s principal risks, as outlined on pages 47 to 48.
Each Board meeting considers strategic, performance and risk agenda items to address future opportunities and threats, and to ensure the continued sustainability of the Group’s business model.
The Board believes that effective corporate governance is critical to delivering our strategy and creating long-term value and sustainability within our business for the benefit of our investors. We are always mindful of our responsibilities and duties to these stakeholders under section 172 of the Companies Act 2006. We have provided details of our key stakeholders, their importance to our business, and the value we generate for them in our business model on pages 20 to 21.
RISK MANAGEMENT AND INTERNAL CONTROL The Board has overall responsibility for risk management and sets
the Group’s risk strategy, risk appetite and monitors risk exposure consistent with strategic priorities.
In preparation for its IPO, the Company established a Group-wide system of risk management and internal control which identifies and enables management and the Board to evaluate and manage the Group’s emerging and principal risks. Due to the limitations inherent in any system of internal control, this system provides robust, but not absolute, assurance against material misstatement or loss and is designed to manage rather than eliminate risk.
The effectiveness of the Group’s system of internal control is regularly reviewed by the Board as is the Group’s risk management framework, with specific consideration given to material financial, operations and sustainability risks and controls, with appropriate steps taken to address any issues identified.
During 2019, although no significant internal control failings were identified, in November, the Group was the subject of a cyberattack. Whilst the attack did not have a material impact on the Group’s operations and the majority of its systems were restored by the end of the next day following the attack, the Group implemented additional procedures and controls to reduce any future risk of attack.
The Board has established the Audit Committee which is comprised of three independent non-executive Directors, chaired by Alison Baker who has extensive recent and relevant financial experience. The Audit Committee meets at least quarterly to oversee, amongst other things, the risk management framework and the effectiveness of the Group’s financial reporting, internal control and assurance systems and it provides regular updates to the Board on any risks it considers within its remit.
The Board confirms that throughout 2019 and up to the date of approval of this Annual Report and Financial Statements, there have been rigorous processes in place to identify, evaluate and manage the emerging and principal risks faced by the Group, including those that would threaten its business model, future performance, solvency or liquidity, in accordance with Principle of the Code and the Guidance on Risk Management, Internal Control and Related Financial and Business Reporting published by the Financial Reporting Council. The Group’s approach to risk management, the risk identified and how it profiles these risks, is set out in the Risk management overview and Principal Risks section on pages 47 to 48.

63
Helios Towers plcAnnual Report and Financial Statements 2019
Overview StrategicReport
GovernanceReport
Financial Statements
THE BOARD AND CULTUREThe Board assesses and monitors the culture of the Group. If it is not satisfied that the policy, practices or behaviour throughout the business are aligned with the Group’s purpose, values and strategy, it will ensure that management addresses the issue.
BOARD ACTIVITIES SINCE ADMISSIONDuring the Listed Period, the activities undertaken by the Board included: • the approval of the capital reduction
of the Company; • a review of Group health and safety; • a review of sustainability and
environmental, social and corporate governance (ESG);
• compliance, financial and operational reviews;
• a review of technology and delivery; and
• receiving reports and recommendations from the Audit Committee and the Remuneration Committee.
STAKEHOLDERS AND THE BOARDThe Board actively engages with the Group’s debt and equity investors. The Executive Directors hold regular meetings and calls with investors, for example through formal roadshows following the Company’s quarterly results, at industry and investor conferences and through ad hoc meetings and presentations. Via monthly and quarterly updates, the Board is appraised of all investor relations activities undertaken by management and the Executive Directors. IR activity and a review of the shareholder register are also regular items in the Board information pack.
During 2019, the Executive Directors held over 300 investor meetings with a combination of existing and potential debt and equity investors. Executive Board members also attended two City conferences and four sales force briefings and hosted four roadshow and investor events in the UK, USA, South Africa, Middle East and mainland Europe. These engagements covered both current and prospective shareholders, the majority of which are institutional, with the remainder comprising large private client investment managers.
Any investors interested in engaging with the Company, including with the Executive Directors, should reach out in the first instance to [email protected].
WORKFORCE ENGAGEMENTThe Group’s operating companies each produce quarterly newsletters which are circulated Groupwide, and the Group itself engages with employees through multiple channels and activities. These include stand-up meetings and round-table discussions, briefings provided to the whole Group conducted by the Executive Directors, functional forums and team building activities. An all-employee town hall conference call has also been established to announce the financial and operational performance of each quarter, and the Company expects to undertake an Employee Engagement and Culture Survey during 2020 across the whole Group.
All Group employees and third parties have access to a confidential whistleblowing hotline, EthicsPoint, which is hosted by Navex Global Inc. They can either make a personal call to report any concerns or log them via a website. The Company’s whistleblowing policy provides that, subject to an allegation not being malicious or vexatious, there is no recrimination against any whistleblower – even if the concern is subsequently found to be unsubstantiated.
The Board has delegated the oversight of whistleblowing claims to the Audit Committee. At each of its meetings, members receive a report on any concern that has been received and provide the appropriate challenges to management to ensure that all allegations are properly investigated.
BOARD PROCESSThe Company’s Articles of Association set out the policy for dealing with any conflicts of interests of a Director, and comply with the Companies Act 2006. If any Director has a concern about the operation of the Board or the management of the Company that cannot be resolved, the Director’s concerns will be recorded in the Board minutes.
DIVISION OF RESPONSIBILITIESThe Board determines the appropriate division of responsibilities between the Chair, Senior Independent Director and Chief Executive Officer.
On 12 September 2019, Sir Samuel Jonah was appointed Chair and Magnus Mandersson was appointed as the Senior Independent Director of the Company. Both were deemed to be independent on their appointments, when assessed against the circumstances set out in Provision 10 of the Code. Kash Pandya is the Chief Executive Officer.
COMPOSITION OF THE BOARDThe Board has identified Magnus Mandersson, Richard Byrne and Alison Baker as Independent Non-Executive Directors. Two Non-Executive Directors – David Wassong and Temitope Lawani – are appointed to the Board under the Shareholders’ Agreement, which is described further on page 64.
Currently, at least half the Board (excluding the Chair) are not Non-Executive Directors whom the Board considers to be independent. However, the Company intends to appoint two additional Independent Non-Executive Directors in 2020.
The respective responsibilities of the Chair, Chief Executive Officer and Senior Independent Director are set out on the Company’s website at www.heliostowers.com/investors/governance.
Board committee membership is shown in the biographies of the Directors on pages 58 to 59.

64
Helios Towers plcAnnual Report and Financial Statements 2019
BOARD SUCCESSION AND DIVERSITYThe Board focuses its succession on ensuring the right mix of skills and experience, which it believes is imperative for delivering on its strategy. All new appointments are based on merit, and a diverse and inclusive Board is key to ensuring the Group’s high performance. Consequently, the Board believes in the importance of diverse membership, including in relation to gender, tenure and relevant experience.
Whilst only one out of our 8 Board members is a woman (which represents 12.5% of the Board), the Company recognises and is striving to achieve the Hampton-Alexander Review target for women to represent 33% of Boards by 2020, as soon as possible. However, it will always appoint Directors based on merit.
The Board is ethnically diverse in composition and already meets, and exceeds the recommendation of the Parker Review report, to have at least one Director from a non-white ethnic group. The Company is currently recruiting two additional independent Non-Executive Directors which will further enhance the Board’s diversity and balance. The Company has recently adopted a new policy on diversity which puts at the forefront of everyone’s mind that everyone should be treated equally regardless of gender, race, ethnicity, age, sexual orientation or other characteristics.
The Nomination Committee Report on page 66 provides more information on the Company’s Board appointment process.
SHAREHOLDERS’ AGREEMENTShortly prior to Admission, certain founders and early investors of the Group (the “Principal Shareholders”), entered into a Shareholders’ Agreement with the Company which included specific governance rights. Each of Quantum Strategic Partners, Ltd., Lath Holdings Ltd and Millicom Holding B.V. has the right to appoint a Director to the Board for such time as it and its associates are entitled to exercise or control 10% or more of the voting rights in the Company. Quantum Strategic Partners, Ltd and Lath Holdings Ltd have taken up this right whilst Millicom Holding B.V. has not.
The Shareholders’ Agreement will terminate either if: (i) the shares of the Company cease to be listed on the premium listing segment of the Official List and traded on the London Stock Exchange; (ii) if no Principal Shareholder holds 3% or more of the shares of the Company; or (iii) there is only one Principal Shareholder who holds 3% or more of the shares in the Company and none of Quantum Strategic Partners, Ltd, Lath Holdings Ltd or Millicom Holding B.V. holds 10% or more of the share of the Company.
TIME COMMITMENTSWhen making new appointments, the Board takes into account other demands on the Directors’ time. Prior to any appointment, significant commitments are disclosed to the Chair with an indication of the time involved. The Board is content with the current level of external directorships held by the Chair and the Independent Non-Executive Directors and, indeed, believes that other directorships enhance the capability and skills of the Board.
COMPANY SECRETARY AND LEGAL ADVICEAll Directors have access to the advice of the Company Secretary, who is responsible for advising the Board on all governance matters. Both the appointment and removal of the Company Secretary is a matter for the whole Board.
Any Director may take independent professional advice at the expense of the Company to carry out their duties, if they believe it is necessary. On appointment, all Directors are advised of their duties, responsibilities and liabilities as a Director of a public listed company, and are given an induction to the Company. This includes meeting with the senior management team and visiting an operating company.
TAX STRATEGYThe Group is committed to complying with its statutory obligations in relation to the payment of tax, including full disclosure of all relevant facts to the appropriate tax authorities. Whilst the Board has ultimate responsibility for the Group’s tax strategy, the day-to-day management rests with the senior leadership team, headed up by the Chief Financial Officer. Further information on the Group’s tax strategy is available on the Company’s website at https://www.heliostowers.com/investors/governance/.
Governance Report
Corporate governance report continued

65
Helios Towers plcAnnual report and accounts 2019
Overview StrategicReport
GovernanceReport
Financial Statements

66
Helios Towers plcAnnual Report and Financial Statements 2019
Governance Report
Nomination Committee report
CHAIR’S INTRODUCTION
Dear Shareholder
On behalf of the Board, I am pleased to present our first Nomination Committee report for the year ended 31 December 2019.
The Committee was formally established by the Board prior to the IPO in October 2019 and will meet, at a minimum, twice a year. Magnus Mandersson and Temitope Lawani join me as the other members of the Committee. Our key priorities are to:
• establish and ensure that there are formal, rigorous and transparent procedures for making recommendations to the Board on appointments to the Board, and its structure, size and composition;
• ensure that there is succession-planning for the Board and senior management positions;
• evaluate the balance of skills, diversity, knowledge and experience of the Board;
• review the time commitment of the Non-Executive Directors and evaluate the membership and performance of the Board and its Committees; and
• recommend, where appropriate, the re-election of Directors.
As we stated in the Company’s IPO Prospectus, the Board is not currently Code-compliant as only three of its Non-Executive Directors – Magnus Mandersson, Alison Baker and Richard Byrne – are considered to be independent. Richard has been a Director of the Group’s holding company since 2010, albeit for less than a year in the new era of the Company being listed. The Board considers his continued membership of the Board is in the best interests of the Company and, after careful consideration, is satisfied that Richard continues to demonstrate the qualities of independence in carrying out his role as a Non-Executive Director and Chair of the Remuneration Committee. The Board considers that he continues to be independent in his character and perspective, and that there are no relationships or circumstances which are likely to affect, or could appear to affect, his judgement.
The Company is actively seeking two additional Independent Non-Executive Directors, and recruitment consultant Korn Ferry has been appointed to assist us. This firm was previously engaged by the Group prior to Admission to assist in the recruitment of the Chair and the Senior Independent Director.
The Company and each of the Directors confirm that they have no connection to Korn Ferry. Alison Baker was appointed as a result of a previous search conducted in 2017/2018 by a different firm, Spencer Stuart and the Company and the Directors confirm that they have no connection to Spencer Stuart.
The Company is committed to an inclusive culture and the Board recognises the benefits of diversity of all kinds, including gender diversity. We are aware of the need to achieve an appropriate balance of women both on our Board and in senior positions within our Group. However, we will continue to make appointments based on merit, and against objective criteria, to ensure that we always appoint the best individual for each role.
Although the Committee did not meet in the Listed Period, it did meet on 28 February 2020, where it identified the key priorities of the Committee. We are satisfied that we have a good balance of skills and experience on the Board to support the Company’s future success and growth and, accordingly, recommend to the Board that each Director stands for election at the forthcoming AGM.
Given that Admission only occurred on 18 October 2019, the Company has yet to conduct any review of either the Board or any of the committees’ effectiveness. However, during 2020, an internal performance review will be launched and the results reported in next year’s annual report.
Yours faithfully,
Samuel Jonah, KBE, OSG | Chair

67
Helios Towers plcAnnual Report and Financial Statements 2019
Overview StrategicReport
GovernanceReport
Financial Statements
Audit Committee report
A significant focus for the Committee’s members during 2019 was to prepare for the Company’s IPO, and we have detailed the due diligence process and enhancements to the internal control environment which have been implemented before and after the listing in 2019. I also oversaw the preparatory work for the listing put on hold in March 2018 and can report first-hand a continued improvement to our systems, processes and finance function over the last two years.
We experienced healthy challenge and full support from our external Auditor, Deloitte LLP, as we undertook an extended period of preparation for listing. Prior to the IPO, the shareholders established an Audit Committee which reviewed the quarterly Financial Statements, key accounting judgements and estimates as well as receiving reports both from our Head of Internal Audit and Deloitte. Policies were independently and rigorously reviewed by the separate independent Deloitte reporting accountant team, and the Committee, prior to the listing in October 2019.
Since then, the Committee has continued performing its core role of reviewing the Group’s financial results, including narrative reporting, significant financial reporting estimates and judgements, and the financial disclosures in the quarterly Financial Statements. We have continued to monitor the Group’s systems of internal control and risk management and to oversee the relationship with the external Auditor and the internal audit function.
In this report, we summarise the significant issues that the Committee considered over the course of the year and the activities that it undertook in performing its duties. Given certain inherent risks of our countries of operation, we have focused our attention on higher-risk areas such as procurement, third party management, site acquisition, fraud and whistleblowing, as well as assessing the appropriateness of our finance function for life as a listed company.
In addition to the scheduled Committee meetings, I have met regularly with the Chief Financial Officer, Head of Internal Audit and the external audit partner to discuss their reports and any relevant issues. I regularly meet the Deloitte audit team as part of my ongoing review of their effectiveness and quality.
CHAIR’S INTRODUCTION
Dear Shareholder
I am pleased to present to you our inaugural Audit Committee report for the year ended 31 December 2019.
The Audit Committee reports to the Board with its assessment of effective governance in financial reporting, internal control and assurance processes, and on the procedures in place to identify and manage risk.

68
Helios Towers plcAnnual Report and Financial Statements 2019
Governance Report
Audit Committee report continued
RESPONSIBILITIES OF THE COMMITTEE Detailed responsibilities are set out in the Committee’s terms of reference, which can be found at www.heliostowers.com/investors/governance. The principal duties of the Committee are:
ACCOUNTING AND FINANCIAL REPORTING MATTERS
• monitoring the integrity of the quarterly financial information and annual report and accounts, and any formal announcements relating to the Group’s financial performance;
• reviewing significant financial reporting judgements and accounting policies; • advising the Board on whether, as a whole, the Annual report and Financial Statements, along with other price-sensitive
public records and reports, are fair, balanced and understandable; • considering the going concern statement; and • considering and reviewing the statement of the Group’s viability over a specified period.
RISK MANAGEMENT AND INTERNAL CONTROL
• reviewing the Group’s financial controls and internal control effectiveness and maturity; • reviewing the Group’s risk management systems and risk appetite; • considering whistleblowing arrangements by which employees may raise concerns about possible improprieties in
financial reporting or other matters; and• reviewing the systems which have been in place for the year under review and up to the date of approval of the annual
report and Financial Statements.
INTERNAL AUDIT
• monitoring and reviewing the effectiveness of the Group’s internal audit function; • considering the results and conclusions of work performed by internal audit; and• considering the major findings of internal investigations.
EXTERNAL AUDIT
• considering recommendation of the external Auditor appointment to the shareholders at the Annual General Meeting and approving their remuneration;
• reviewing the results and conclusions of work performed by the external Auditor; and• reviewing and monitoring the relationship with the external Auditor, including their independence, objectivity,
effectiveness and terms of engagement.
GENERAL MATTERS
• any specific topics as defined by the Board; • referring matters to the Board which, in its opinion, should be addressed at a meeting of the Board; and • providing advice to the Remuneration Committee on financial reporting matters and related judgements as they affect
executive remuneration performance objectives.
COMMITTEE MEMBERSHIP AND ATTENDANCEIn compliance with the 2018 Corporate Governance Code, the Committee is composed exclusively of Non-Executive Directors, and each member is considered to be independent by the Company. The Chair of the Company, Sir Samuel Jonah, is not a member of the Audit Committee.
The Board is satisfied I have recent and relevant financial experience to Chair the Committee. I am a Chartered Accountant and chair audit committees of other listed companies, and am viewed by the Board as being well qualified to undertake this role effectively.
Details of the members and attendance at each of the scheduled meetings is shown in the table below and the biographies and qualifications of the members are shown on pages 58 and 59.
Meetings attended
Alison Baker (Chair) 1/1
Magnus Mandersson 1/1
Richard Byrne 1/1
In addition, two meetings have been held subsequent to the year end, with full attendance at both.
During the year I undertook a deep dive of operations in DRC prior to the listing and attended the annual finance function forum in Dubai in November 2019 which was a great opportunity to meet the entire senior finance team.
I would like to thank my fellow Committee members Richard Byrne and Magnus Mandersson, whose insightful contributions have enabled the Committee to perform its duties effectively.
Various officers and senior leaders of the Company attend meetings of the Committee by invitation. These include the Chair, the Group Chief Executive Officer, the Chief Financial Officer, the Group Financial Controller, the Director of Sustainability and Organisational Development who leads the risk, compliance and health & safety functions, and representatives from the external and internal audit teams.
After each meeting I, as the Chair of the Committee, report to the Board on the business undertaken.
69
Helios Towers plcAnnual Report and Financial Statements 2019
Overview StrategicReport
GovernanceReport
Financial Statements
COMMITTEE ACTIVITY IN 2019In planning its own agenda, and reviewing the audit plans of the internal and external auditor, the Committee takes account of significant issues and risks, both operational and financial, that may have an impact on the Group’s Financial Statements and/or the execution and delivery of its strategy.
During 2019, after robust challenge and debate, there were no areas of significant disagreement between management, the external auditor and the Committee, or unresolved issues that needed to be referred to the Board.
The new Committee has met once since the IPO during 2019. In addition we have met twice in 2020 prior to finalisation of this Annual Report.
MATTERS DISCUSSED WITH MANAGEMENT OR WHERE FURTHER INFORMATION WAS REQUIREDAt our inaugural meeting we received deep-dive presentations on the following matters:
• Purchase to pay process including key control activities;
• Finance function structure including enhancements following the IPO; and
• Compliance function vision, policies and activities including Anti-bribery & Corruption (“ABC”), whistleblowing and third party management.
SIGNIFICANT FINANCIAL REPORTING JUDGEMENTS AND ESTIMATESWe show below the key matters considered by the Audit Committee, with the support and challenge from the external Auditor.
ACTION TAKEN BY MANAGEMENT ACTION TAKEN BY THE AUDIT COMMITTEE
Accounting for SA Towers and Goodwill review
The Group announced the completion of the SA Towers acquisition on 1 May 2019. Management prepared the original provisional fair value accounting which was presented in the half year statements. This was subsequently updated the information to reflect current roll out plans and estimated payment of contingent consideration amongst other adjustments.
The Committee received reports from both management and Deloitte on the key judgements in revisiting the fair values ascribed to the assets and liabilities acquired. This included key valuation assumptions associated with recognition of intangible assets such as customer contracts and judgements in relation to roll out plans in calculating the estimated contingent consideration. The Committee was satisfied with the accounting adjustments and the disclosure associated with the acquisition, which can be found in Note 30 to the Financial Statements and concurred with management’s assessment that there was no impairment required to the small amount of goodwill recognised of US$4.2 million.
Taxation Due to the evolving nature of tax legislation and its application in our operating countries, management is required to make judgements and estimates in relation to tax risks, the outcomes of which can be less predictable than in other jurisdictions. Management has determined its best estimates for taxes payable, in conjunction with local advisers, and accounted for them accordingly.
The Committee considered papers from both management and Deloitte. After receiving input from the Group CFO on the latest position with regards to on-going matters concluded that the Group’s tax position had been appropriately accounted for and that there was adequate disclosure in relation to the key known uncertain matters as set out in Note 27 to the Financial Statements.
Subsequent to the year end and before approval of this Annual Report and Financial Statements we received deep dive presentations on the following matters:
• Site acquisition process• Non financial metrics assurance
process; and• Tax strategy risks and processes

70
Helios Towers plcAnnual Report and Financial Statements 2019
Governance Report
Audit Committee report continued
ACTION TAKEN BY MANAGEMENT ACTION TAKEN BY THE AUDIT COMMITTEE
Impact of IPO accounting and reporting
The Group completed its IPO in October 2019. Management preparation included understanding the potential tax consequences, which included the potential for Change of Control Taxes in certain jurisdictions. Expert reports and advice was received and the pre-IPO shareholders agreed to set aside funds into Escrow to make any such Change of Control Taxes payments.
Other considerations included the timing and fair value of crystallization of Management Incentive Plans that had been put in place prior to the IPO. Management also considered accounting matters in relation to exceptional costs associated with the IPO and the accounting for the reorganisation prior to admission.
The Audit Committee has received reports from management and its advisors on the likelihood of charges arising and considered the disclosure provided in Note 10 to the Financial Statements to be appropriate.
The Audit Committee received reports from management and Deloitte on the calculation of share based payment awards and adjustment from statutory performance for exceptional costs associated with the IPO which were deemed to be appropriate.
Recoverability of receivables and accrued revenue
The Group’s customer base is primarily large MNOs who account for 73% of the receivables balance. Accordingly management’s review for impairment of receivables focuses on the smaller operators, or where there is evidence of a customer dispute.
In accordance with customer contracts agreements, variations are often billed for additional equipment placed on our towers. Management has ongoing controls to identify amendments to customer tower equipment. Accrued revenue only reflects amounts that management has inventoried and believes are due under the contract.
The Committee received detailed analysis of the receivables and accrued revenue balances for consideration. We noted Deloitte proposed judgemental differences in relation to a debtor, which is paying slowly and concluded that adjustment was not required given it was immaterial and cash was still being received.
The Committee challenged the practice of recognising revenue ahead of agreement with the customer but noted that there was a history of settlement at amounts at least equal to that due under the contract. Accordingly the Committee concluded that management’s judgement in relation to the receivables balances and associated disclosure was appropriate.

71
Helios Towers plcAnnual Report and Financial Statements 2019
Overview StrategicReport
GovernanceReport
Financial Statements
In addition to the significant judgements and estimates noted above, the Audit Committee reviewed the Alternative Performance Measures used within the Annual Report and Financial Statements and concluded that the disclosures were appropriate. More detail on the challenge provided by our Auditor in this regard is set out on page 72.
EFFECTIVENESS OF INTERNAL CONTROL AND RISK MANAGEMENT PROCESS With the assistance of the internal audit team, the Committee has, on behalf of the Board, monitored and regularly reviewed the effectiveness of internal controls and risk management systems, including ESG risks.
As part of our considerations on behalf of the Board, the Audit Committee received a report from Internal Audit setting out the key findings during the year of control breakdowns and remediation matters. During the year, although no significant internal control findings were identified in November 2019, the Group was subject to a cyberattack. Whilst the attack did not have a material impact on the Group’s operations and the majority of its systems were restored by the end of the next day following the attack, the Group implemented additional procedures and controls to reduce any future risk of attack. The Audit Committee will continue to focus on any potential risks associated with our IT systems architecture and will receive regular updates from the Head of IT and Internal Audit during 2020.
Principal risks We reviewed and recommended to the Board the principal risk disclosures for approval, including emerging risk considerations, for inclusion in the 2019 Annual Report.
Two new risks were added to the principal risk register following our reviews during the year: the risks associated with tax matters and operational resilience.
Details on how the Group implements its risk management framework and monitors its controls on a Groupwide basis are set out on pages 46 to 48.
GOING CONCERN AND LONG-TERM VIABILITY The Committee reviewed and challenged the assumptions from management in assessing the going concern basis of preparation and the scenarios and disclosure of longer-term viability.
With respect to going concern, the Audit Committee:• reviewed the detailed cashflow
forecasts prepared by management and challenged the underlying assumptions including downside scenarios;
• assessed the Group’s available facilities and headroom including compliance with bond and banking covenants;
• received comment from Deloitte on the assumptions and judgements made; and
• satisfied with the robustness of the review, recommended to the Board the appropriateness of the going concern assumption and the related disclosures.
Further details on the Group’s going concern assessment can be found on page 49.
With regard to the viability statement, the Audit Committee:• reviewed and challenged
management on its recommended viability period as well as on its robust modelling, stress-testing scenarios and conclusions; and
• satisfied itself that a five-year outlook is appropriate. This choice of period is driven principally by the fact that it is covered by the Group’s strategic plan; reflects the nature of the Group’s principal risks (some of which are external and have the potential to impact in the short-term).
The viability statement, and a full explanation can be found on page 49.
FAIR, BALANCED AND UNDERSTANDABLE The Board as a whole is responsible for ensuring that risk management and internal control systems are effective and that annual reports are fair, balanced and understandable.
The Audit Committee assessed and recommended to the Board (which it subsequently endorsed) that, taken as a whole, the 2019 Annual Report and Financial Statements is fair, balanced and understandable and provides the necessary information for shareholders to assess the Company’s position and performance, business model and strategy.
The Committee’s assessment included:• understanding the detailed process
undertaken in drafting the Annual Report, including the Audit Committee Chair attending the annual report planning process;
• feedback from investors through engagement specialists from the IPO;
• a deep-dive at our March 2020 meeting on assurance surrounding non-financial KPIs and management information; and
• results from work undertaken by Deloitte on their review of the Annual Report which provided a number of key findings that were presented to the Audit Committee.

72
Helios Towers plcAnnual Report and Financial Statements 2019
Governance Report
Audit Committee report continued
ALTERNATIVE PERFORMANCE MEASURESHistorically, the tower industry has used a wide range of APMs to compare and assess business performance. This is a function of differing lease and debt structures, as well as asset-life.
As noted above, the Audit Committee reviewed in detail the use of APMs within the Annual Report. We requested that the Auditor specifically comment on the APMs against disclosure of the ESMA guidance. The Auditor challenged the balance of APMs and importance of equal prominence and additional disclosures in relation to adjusting items. In order to ensure appropriate balance and not give undue prominence, we requested that management present all of the APM reconciliations and explanations in a separate section of the Annual Report and Financial Statements. This can be found on pages 54 and 55.
INTERNAL AUDIT I meet with the Head of Internal Audit outside of the formal meetings, typically monthly, to discuss the output from the internal audit function and aspects of risk management. The Head of Internal Audit attends each of the Committee meetings and also has a private session with the Audit Committee without management present.
At each meeting, the Committee considers the results of the internal audits undertaken and the appropriateness of management’s response to matters raised. The Committee also tracks long-outstanding items. I am satisfied that the Head of Internal Audit is receiving adequate support from the business to undertake his reviews and senior sponsorship is strong in ensuring that there is timely follow-through of recommendations.
At present, the rolling internal audit plan is addressing, in turn, each of the key business cycles across the operating companies and central functions where appropriate. As the Group continues to grow, we will reassess the adequacy of the internal audit function to ensure that it is fit for growth and emerging risk requirements.
COMPLIANCE AND WHISTLEBLOWING The Head of Compliance and the Director of Sustainability and Organisational Development attend the Committee meetings and present any whistleblowing incidents and an update on ongoing investigations.
The Committee assessed the adequacy of the Group’s whistleblowing arrangements and the procedures for detecting fraud. We did not experience any material frauds during the year. EXTERNAL AUDITOR During the year, the Chief Financial Officer and I have had regular discussions on accounting matters, internal control and fees with our external audit partner, in addition to the detailed discussions undertaken by the Committee.
Professional scepticism and challengeThe quality of the audit is of paramount importance to the Committee and the agenda and accounting matters presented to the Committee are often the outcome of many weeks or months of work undertaken by Deloitte and our finance function. The regular discussions held outside of the Committee meeting allow me to assess the level of professional scepticism and challenge that our external Auditor apply to management.
After each Committee meeting we also hold a private session with the external Auditor, without management being present where we challenge the Auditor on whether they have maintained their independence and objectivity from management in considering key matters and whether there are areas of concern that they wish to bring to the Committee’s attention.
In addition to the key matters set out on pages 69 to 70, areas where the Auditor has challenged management included:• valuation assumptions in share
based payment calculations;• key sources of estimation and
inclusion of sensitivities to help users understand the impact of estimates including derivative valuation; and
• APM disclosures as set out above.
The Committee received a detailed report from Deloitte in advance of our March 2020 meeting and I can report that all key matters and areas of challenge were satisfactorily resolved with no disagreements between the auditor and management. Some immaterial Audit differences were noted and reported to the Audit Committee.
Areas where the Audit Committee has requested a specific focus from external audit As part of our review of the audit plan we requested that Deloitte undertake additional reporting to Audit Committee on the Alternative Performance Measures disclosed within the Annual Report. This is discussed above.
Audit Committee assessment of quality and effectiveness In its assessment of audit quality, the Committee took into account: • the detailed audit scope and
strategy for the year, including the coverage of emerging risks in all geographies and recent acquisitions;
• Group materiality and component materiality;
• how the Auditor communicated any key accounting judgements and conclusions; and
• feedback from management of the performance of the Auditor.
73
Helios Towers plcAnnual Report and Financial Statements 2019
Overview StrategicReport
GovernanceReport
Financial Statements
2019 FRC Audit Quality Inspection We reviewed the FRC’s 2018/19 Audit Quality Inspection Report on Deloitte LLP. The results highlighted the need to: • exercise greater professional
scepticism in the audit of potential prior year adjustments and related disclosures in the Annual Report and Financial Statements;
• strengthen the extent of challenge of estimates and assumptions in key areas of judgement, including asset valuations and impairment testing;
• improve the consistency of the quality of the firm’s audit of revenue; and
• achieve greater consistency in the audit of provisions and liabilities.
As part of my year-end review, I also met Deloitte LLP’s Head of Audit Quality and Risk for Africa to discuss their approach to audit quality and assurance in connection with their audit of Helios Towers across our operating geographies.
The Audit Committee considered that the audit process as a whole had been conducted robustly and the team had been effective and professional. The Committee duly recommended to the Board that Deloitte be offered for re-election at the forthcoming AGM.
External audit tendering Following the IPO, and after Helios Towers became a constituent of the FTSE 250 at the end of December 2019, Helios Towers became a Public Interest Entity (“PIE”) as defined under the Companies Act 2006. As a PIE, and in accordance with the Governance Code and EU legislation, Helios Towers is required to comply with all requirements regarding auditor tendering every 10 years and rotation after 20 years.
Helios Towers has not run a competitive audit tender process in the last 10 years and is therefore required to carry one out for its first audit after it became a PIE.
In compliance with the Competition and Markets Authority’s final Order on mandatory tendering and audit committee responsibilities for FTSE 350 companies, the Audit Committee plans to carry out a full and competitive audit tender during 2020 with the External Auditor’s appointment being effective for the audit of the 2020 financial year.
On listing, we have implemented rotation to ensure that we have an audit partner with extensive experience of working in both the listed segment and sub-Saharan Africa. As Audit Chair I was involved in the selection process and welcome the insight and challenge that Ryan has brought to the audit process. I would also like to thank our outgoing partner Simon Olsen who has provided great insight and support to me as I came on board and has provided significant challenge and support to management as they prepared for listing.
External Auditor independence & objectivityThe Committee seeks to ensure the objectivity and independence of our Auditor through: • focus on the assignment and
rotation of key personnel; • the adequacy of audit resource and
level of senior hours; and• policies in relation to non-audit
work.
As indicated through our IPO case study above, the historical work of Deloitte was subject to independent review in advance of our listing, and this did not highlight any adjustments to the historical financial information or audit scope.
Non-audit services policy The predecessor Audit Committee had established a policy that non-audit fees in excess of $100,000 were subject to the Committee’s approval. This was in line with the 2016 FRC ethical standards for a non PIE. The Committee reviewed and updated the policy for the listing and, in January 2020, made a further amendment to reflect the new ethical standards issued by the FRC in December 2019 further restricting non-audit services and setting out the prescribed services which our Auditor may provide.
Non-audit services Given the extended nature of the listing process, Deloitte has provided significant non-audit services to the Group over the last two years. As a result, the 2019 non-audit fees were US$3.8 million of which US$2.4 million related to the IPO, US$1.3 million related to Audit related assurance services and US$0.1 million related to tax work which ceased on listing. Further details on non-audit fees can be found in Note 5B on page 128.
Going forward, the Committee and management expect that the level of non-audit fees will be considerably lower, and will reflect the smaller number of permitted services which are non audit-related.
A copy of our Auditor Independence policy is available on our website at www.heliostowers.com
External Auditor reappointmentAs noted above, the Committee recommended to the Board that Deloitte be offered for re-election at the forthcoming AGM.
Committee effectiveness Because the new Audit Committee has only recently been formed we have not yet conducted a formal review of our effectiveness, but will do so during 2020.

74
Helios Towers plcAnnual Report and Financial Statements 2019
Governance Report
Audit Committee report continued
CASE STUDY:
GETTINGREADY FORTHE IPO
A major part of the due diligence process for the IPO was the preparation by management of the Financial Position and Prospects procedures (“FPP”) Memorandum. This assures that the Directors have established procedures that provide a reasonable basis on which to make proper judgements on an ongoing basis as to the financial position and prospects of the Group. The work undertaken can be summarised as:
LOOKING AHEADIn planning our agenda for 2020 we will comply with the requirements of the 2018 UK Corporate Governance Code and follow best practice guidance for audit committees, recently updated by the FRC.
The Committee will continue to receive in-depth presentations from management on the challenges faced by the business and the operation of internal controls across the business cycles. The Committee agenda will also continue to respond to the issues raised by our ‘three lines of defence’ internally – management, risk and compliance, and internal audit – as well as to the evolving external risk landscape and regulatory environment.
Specific areas of focus are to:• understand detailed site acquisition
processes and the regulatory risks of operating in our geographies;
• understand tax risks and strategies in each of our operating jurisdictions;
• continued focus on systems, including defending against cyber risks;
• operating company site visits to assess the quality of finance functions, succession planning and development;
• review of our combined assurance plan, including developing the internal audit function in line with the growth ambitions of the Group, to ensure that we have robust assurance plans across our three lines of defence;
• consideration of our climate related financial disclosures and associated risk and governance processes; and
• oversight of the audit tender process which will be conducted in Q2 2020.
Over the next 12 months, and in addition to its usual duties, the Committee will assess the policy package of audit reforms that are expected to be presented by the UK Government and the new audit regulator. A strong, high-quality regulator will be good for audit quality and it remains our key priority to ensure that we maintain the integrity of our Financial Statements through a rigorous audit process.
We also seek to respond to shareholders’ expectations in our reporting and, as always, welcome any feedback from them. I will be available at the AGM in April and welcome any questions relating to the work of the Audit Committee and our forward agenda. I hope to see you there.
Alison Baker | Chair Audit Committee

75
Helios Towers plcAnnual Report and Financial Statements 2019
Overview StrategicReport
GovernanceReport
Financial Statements
DETAILED RISK ASSESSMENTA detailed risk assessment was performed as to the timely and accurate reporting of FPP information. This entailed discussions with the executive team, head of departments, operating company management and various key personnel. Risks were identified at both the Group and operating company level and were scored based on impact (low to high) and probability (low to high) assessments.
IDENTIFICATION AND DOCUMENTATION OF MITIGATING CONTROLS This work included:• assessment of high-level entity
controls, such as delegation of authority, budgeting and forecasting processes, and establishing multiple governance processes, to ensure compliance with the 2018 Corporate Governance Code;
• documentation of key business cycles (e.g. revenue & receivables, procurement & payables, fixed assets & capex) and the relevant key controls; and
• documentation and assessment of key IT processes and controls such as business continuity and access controls.
KEY ACTIONS TAKEN DURING THE PERIOD PRIOR TO LISTING: People: We invested in building up our team to ensure that the Group was ready for life as a listed company. This included appointing a new Head of Investor Relations, a Tax and Treasury Manager, Head of IT, Head of Financial Reporting, as well as additional company secretariat resource.
Processes: A small number of control deficiencies were identified and remediated prior to listing in the following areas: revenue (2), business combinations (4), fixed assets (3) and IT (3). Significant improvements have been noted in the capital work in progress (CWIP) and IFRS16 lease disclosure processes.
Systems: The Group has continued to invest in single-platform cloud-based ERP solutions to enable full transparency and delegated access to reporting and procurement workflows across Group Finance and the centralised back-office (“CBO”) based in London and the operating company finance teams in each market, with all significant approvals made at Group level.
Independent review of accounting judgements and historical audits The independent Deloitte reporting accounting team carried out a review of the historical financial information (“HFI”) included in the listing prospectus. This included a review of accounting policies, judgements and estimates, and the scope of the audit work. Their findings were presented to an Audit Committee meeting in September 2019, which included both its predecessor members and the prospective members of the new plc Audit Committee. This gave the incoming members an opportunity to challenge the HFI audit team on the key historical judgements and accounting policies. The Committee noted that no substantial additional audit procedures or amendments to financial information were required as a result of this review.
Ongoing monitoring by the management team and the Audit CommitteeThe management team has established a controls and audit tracker which is presented at each Audit Committee meeting and acts as a discussion tool to ensure that further improvements in the control environment are identified and actioned. Inputs include feedback from our Auditor and control matters raised in the business.
1. Identify risks to the timely and accurate
reporting of FPP information
2. Identify mitigating controls for each risk
identified
3. Document mitigating controls
4. Directors provide their FPP assertion

76
Helios Towers plcAnnual Report and Financial Statements 2019
Governance Report
Directors’ remuneration report
CHAIR’S INTRODUCTION
Dear Shareholder
I am pleased to present the first Directors’ remuneration report since listing, for the year ending 31 December 2019.
This has been a landmark year for Helios Towers, following our Admission to Trading on the London Stock Exchange on 18 October 2019 and inclusion in the FTSE 250 index on 23 December 2019.
The Company also began operations in South Africa in the first half of the year, adding a fifth market to our established operations in Tanzania, DRC, Congo Brazzaville and Ghana.
The Group’s site count grew 3.4% to 6,974, and the number of tenancies by 7.7% to 14,591. The Company delivered strong financial performance with revenue of $388m, up 8.9% year-on-year, and Adjusted EBITDAΔ of $205m, up 15.5% year-on-year. Adjusted EBITDA marginΔ increased to 53% in 2019 from 50% in 2018.
In this Directors’ remuneration report, we set out the Board’s approach to remuneration policy and practice, which is based on the principles that rewards must be competitive, linked to performance and encourage outperformance. It recognises that the remuneration framework should be aligned to shareholders’ interests and support sustainable success.
The Remuneration Policy (the “Policy”) has been developed in line with UK regulations and best practice in the UK market. The Remuneration Committee (the “Committee”) took into account a number of reference points including practices at UK-listed companies, particularly those in the FTSE 250 index due to their similar size.
The Committee is attuned to the expectations of our shareholders and the evolving governance and regulatory landscape. These were all key sources of reference for our review.
We have set overall remuneration packages for our Executive Directors at levels we deem appropriate and over 75% of the potential pay for the CEO, and over 70% for the CFO, is incentive-based and therefore dependent on delivering performance targets.
The salaries, incentive opportunities and Non-Executive Director fee levels are unchanged from the information published in our Prospectus in October 2019.
PAY IN RESPECT OF THE 2019 FINANCIAL YEARPay for 2019 was mainly set by the previous Committee that was in place before the appointment of the plc board, of which I was a member, but not the Chair.
Following the appointment of the Non-Executive Directors and Chair of the Board in September 2019, the Committee set the salaries for the CEO and CFO in alignment with current practices of other UK listed companies, particularly those in the FTSE 250 index. In future years, we anticipate that where changes are made to Executive Directors’ salaries, these will be in line with increases applied across the wider workforce unless there is a business rationale to act otherwise, such as a change in role.
The 2019 annual bonus scheme was set before the listing and pays out based on achievement against four of our strategic KPIs; Adjusted EBITDA, portfolio free cash flow, operating free cash flow and network performance.
SUMMARY OF REVIEW: PROPOSED REMUNERATION POLICYThe proposed Policy has been developed in line with UK regulations and best practice in the UK market, and will be submitted for your approval at our first AGM in April 2020. I wrote to our shareholders in February 2020, summarising the proposal and sharing information on the proposed approach to performance measurement for the annual bonus and the LTIP for our Executive Directors.
We have adopted practices that comply with the UK Corporate Governance Code, including:
• pension entitlements aligned with the majority of the wider workforce, equal to 9% of base salary;
• bonus deferral equal to 50% of amounts awarded in excess of target performance levels in the form of restricted share awards (RSAs), with a three-year vesting period;
• a two-year holding period on shares vested in relation to LTIP awards (following the three-year performance assessment period);
• malus and clawback provisions on incentives;
• a minimum shareholding requirement, set at 200% of base salary for the CEO and 150% for the CFO; and
• a shareholding policy post-cessation of employment, equal to 100% of their minimum shareholding requirement for a period of two years.

77
Helios Towers plcAnnual Report and Financial Statements 2019
Overview StrategicReport
GovernanceReport
Financial Statements
PROPOSED APPROACH FOR THE 2020 FINANCIAL YEARThere will be no increase to the salaries of the CEO and the CFO in 2020. The Committee will review salaries annually with the aim of keeping them appropriately aligned within the market benchmark and in-line with salary increases awarded to the wider workforce.
Under the proposed Remuneration Policy, share-based schemes will be used for bonus deferrals and long-term incentive plan (LTIP) awards.
2020 ANNUAL BONUSThe 2020 annual bonus is assessed primarily against core financial metrics, which the Committee believes is the most effective way of assessing annual performance:
• Adjusted EBITDA(1): 50% weighting;• portfolio free cash flow(1): 30%
weighting;• network performance: 15%
weighting; and• environmental, social and
governance (ESG): 5% weighting.
Maintaining strong cash flow, in addition to delivering our Adjusted EBITDA targets, is crucial in ensuring that we are well positioned to capitalize on opportunities out in the market.
The specific targets are set by the Committee at the start of 2020 and, as they are currently commercially sensitive, will be disclosed in full in the 2020 Directors Remuneration Report, published in 2021.
2020 LTIPAs described in the IPO prospectus, the 2020 LTIP awards were granted around the time of the Company’s results announcement for the three months ending 30 September 2019. The aim is to ensure that the Executive Directors and other selected senior executives and key personnel are retained and incentivised in the immediate years post-IPO to deliver the longer-term business plan and sustainable long-term value creation.
The 2020 LTIP awards will be assessed against the following measures evaluated over the three-year period of the financial years 2020-2022:
• relative total shareholder return (TSR): 33% weighting;
• Adjusted EBITDA per share: 33% weighting; and
• return on invested capital (ROIC)(2): 33% weighting.
After the initial three-year vesting period, the 2020 LTIP awards are subject to a further two-year holding period resulting in a total vesting and holding period of five years.
The Committee does not plan to grant further LTIP awards until 2021.
I believe that the proposed Directors’ Remuneration Policy is in line with the relevant UK regulations and best practice and represents the best long-term interests of the Company and all of our stakeholders.
I hope we can rely on your support at our forthcoming AGM.
Richard Byrne | Chair Remuneration Committee
(1) Defined in the alternative performance measures section on pages 54 and 55.(2) ROIC is calculated as portfolio free cash flow (PFCF) divided by gross assets. Gross assets is defined
as gross plant, property and equipment (“PPE”) and gross intangibles, less maintenance and corporate capital expenditure.

78
Helios Towers plcAnnual Report and Financial Statements 2019
AT A GLANCE
2019 HIGHLIGHTS
MARKET EXPANSION
NUMBER OF SITES
NUMBER OF TENANCIES REVENUE
ADJUSTED EBITDA
ADJUSTED EBITDA MARGIN
South Africa added as a 5th market
6,974
+3.4% YoY increase
14,591
+7.7% YoY increase
$388m
+8.9% YoY increase
$205m
+15.5% YoY increase
53%
(2018: 50%)
EXECUTIVE DIRECTORS’ REMUNERATION IN RESPECT OF 2019The table below sets out the policy that applies, from Admission, for base salary, benefits and pension. Actual bonus payments made in respect of 2019 have also been shown.
BASE SALARY BENEFITS PENSION ANNUAL BONUS TOTAL
CEO £579k £41k £52k £748k £1,420k
CFO £355k £25k £32k £371k £782k
KEY OBJECTIVES OF APPROACH TO REMUNERATION
Market competitive / attract and retain talent
Performance-linked incentives
Encourage outperformance
Align with shareholder interests
Align with UK corporate governance practices
Support sustainable success
PROPOSED IMPLEMENTATION OF REMUNERATION POLICY IN 2020OVERVIEW OF QUANTUM
BASE SALARYPENSION (% SALARY)
ANNUAL BONUS (MAXIMUM % SALARY)
LTIP (MAXIMUM % SALARY)
CEO £579k 9% 175% 200%
CFO £355k 9% 150% 150%
Incumbent Executive Directors will not receive a salary increase during 2020.
Governance Report
Directors’ remuneration report continued
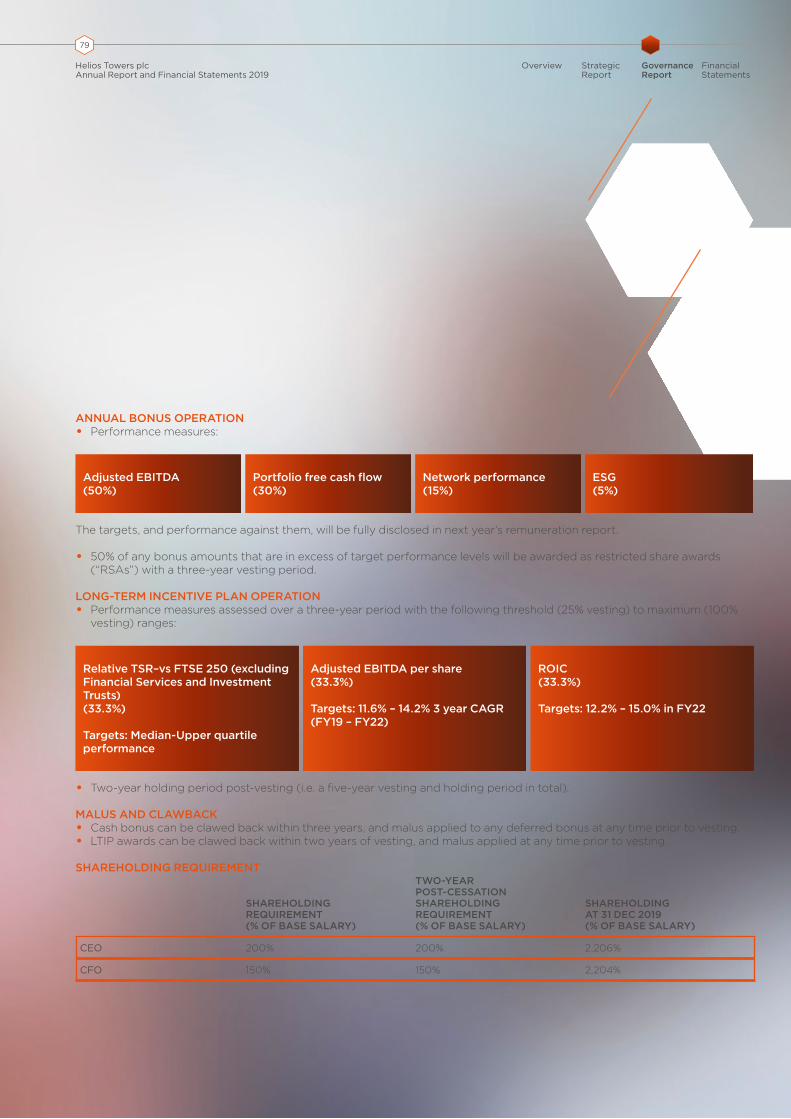
79
Overview StrategicReport
GovernanceReport
Financial Statements
Helios Towers plcAnnual Report and Financial Statements 2019
ANNUAL BONUS OPERATION• Performance measures:
Adjusted EBITDA (50%)
Portfolio free cash flow (30%)
Network performance (15%)
ESG (5%)
The targets, and performance against them, will be fully disclosed in next year’s remuneration report.
• 50% of any bonus amounts that are in excess of target performance levels will be awarded as restricted share awards (“RSAs”) with a three-year vesting period.
LONG-TERM INCENTIVE PLAN OPERATION• Performance measures assessed over a three-year period with the following threshold (25% vesting) to maximum (100%
vesting) ranges:
Relative TSR–vs FTSE 250 (excluding Financial Services and Investment Trusts) (33.3%)
Targets: Median-Upper quartile performance
Adjusted EBITDA per share (33.3%)
Targets: 11.6% – 14.2% 3 year CAGR (FY19 – FY22)
ROIC (33.3%)
Targets: 12.2% – 15.0% in FY22
• Two-year holding period post-vesting (i.e. a five-year vesting and holding period in total).
MALUS AND CLAWBACK• Cash bonus can be clawed back within three years, and malus applied to any deferred bonus at any time prior to vesting. • LTIP awards can be clawed back within two years of vesting, and malus applied at any time prior to vesting.
SHAREHOLDING REQUIREMENT
SHAREHOLDING REQUIREMENT (% OF BASE SALARY)
TWO-YEAR POST-CESSATION SHAREHOLDING REQUIREMENT (% OF BASE SALARY)
SHAREHOLDING AT 31 DEC 2019 (% OF BASE SALARY)
CEO 200% 200% 2,206%
CFO 150% 150% 2,204%

80
Helios Towers plcAnnual Report and Financial Statements 2019
DIRECTORS’ REMUNERATION POLICY
This section sets out the Company’s first Directors’ Remuneration Policy (the “policy”), which has been prepared in accordance with the Large and Medium-sized Companies and Groups (Accounts and Reports) Regulations 2008 (as amended) (the “regulations”). The policy will be subject to a binding shareholder vote at the AGM on 9 April 2020 and, subject to shareholder approval, will become effective from that date. Although the policy is intended to apply for three years, the Company can choose to bring a new policy to a vote before the end of this period. The policy as set out below is consistent with the information disclosed in the prospectus published ahead of the Company’s Admission to the London Stock Exchange (“Admission”).
The policy was developed based on the following principles:
• remuneration should be competitive with the market, but above-market pay should only be earned for outperformance against the market;
• remuneration should be sufficient to attract and retain talent in the event of the departure of any executive; and• the design of remuneration should follow similar principles and governance to other FTSE-listed companies.
Because the Company is committed to achieving high standards of corporate governance, the principles of the revised UK Corporate Governance Code (effective from 1 January 2019) were taken into consideration when developing this inaugural policy. In particular the Committee believe the proposed policy is:
• simple, being in-line with standard market practice for a UK-listed company;• clear to both participants and shareholders;• risk aligned through features such as malus and clawback provisions and the ability of the Committee to overrule formulaic
incentive outcomes;• providing a significant proportion of Executive Directors pay based on overall corporate performance, and particularly
long-term performance; and• aligned to the culture and business strategy of Helios Towers, through the use of appropriate performance measures.
The views of shareholders and their advisory bodies are also central in informing our thinking. The Committee takes its duty to shareholders and other stakeholders seriously and will maintain an open and constructive dialogue on the approach to remuneration.
If any material changes to the policy, or its implementation, are proposed, the Committee will consult with shareholders and seek their approval when appropriate.
ELEMENT & PURPOSE POLICY & OPERATION MAXIMUMPERFORMANCE MEASURES
EXECUTIVE DIRECTORS
Base salary The core element of pay, reflecting the individual’s role and responsibilities within the Company, and experience.
To attract and retain executives of the right calibre and with the required skills to successfully develop and execute the business strategy.
Aim for salary to be broadly aligned to the median of the market benchmark.
Salaries will be reviewed annually, typically prior to 1 January. In reviewing base salaries, the Remuneration Committee will consider:
• the performance of the Company and individual;• any changes in responsibilities or scope of the role;
and• pay practices in relevant comparator companies of
a broadly similar size.
There is no prescribed maximum. However, it is anticipated that any salary increases will generally be in line with those awarded to the wider workforce.
Higher increases may be made in certain circumstances including, but not limited to:
• changes in role and responsibilities;
• market levels; and• individual and
Company performance.
No performance conditions apply.
Governance Report
Directors’ remuneration report continued

81
Overview StrategicReport
GovernanceReport
Financial Statements
Helios Towers plcAnnual Report and Financial Statements 2019
ELEMENT & PURPOSE POLICY & OPERATION MAXIMUMPERFORMANCE MEASURES
Benefits To provide market-competitive benefits valued by recipients.
The Executive Directors are entitled to receive benefits-in-kind, including life insurance, medical insurance and gym membership. Other appropriate and market-competitive benefits may be provided in the future, but will not be significant.
Where an Executive Director is required to relocate to perform their role, they may be offered appropriate relocation allowances and international transfer-related benefits where required.
Benefits will be reviewed annually by the Remuneration Committee.
The value of benefits delivered will depend on the cost of providing these particular items, and there is no prescribed maximum.
No performance conditions apply.
Pension To provide retirement benefits in line with the wider workforce.
Pension contribution rates (or allowances in lieu) for Executive Directors will be aligned with those available to the workforce.
9% of base salary, subject to change if the contributions available to the wider workforce increase or decrease.
No performance conditions apply.
Annual bonus To focus the Executive Directors on the successful delivery of business performance and strategy over a one-year operating cycle.
The annual bonus is to reward performance over a financial year.
Once set, performance measures and targets will generally remain unchanged for the year, except to reflect events (e.g. corporate acquisitions and other major transactions), where in the Committee’s opinion it is necessary to make appropriate adjustments.
The target bonus is 100% of base salary for the CEO and 75% of base salary for the CFO. 50% of any bonus awarded for above-target performance will be deferred for three years in shares, subject to continued employment. Dividends and dividend equivalents will be payable on deferred shares during the vesting period.
The Remuneration Committee has discretion to withhold all or part of the bonus if performance is not a true reflection of the business.
Malus and clawback provisions apply as explained in more detail in the notes to this policy table.
CEO: 175% of base salary.
CFO: 150% of base salary.
Performance will be assessed against financial and non-financial measures to provide a balanced approach.
Specific measures may be amended each year to reflect the business strategy but at least 80% of the bonus will be assessed against financial measures.
0% will pay out for threshold performance, with straight line vesting between threshold and target, and target and maximum respectively.
Long-term incentive plan (LTIP) Represents the long-term incentive aspect of the Executive Directors’ overall remuneration package with the aim of motivating and rewarding them for the long-term delivery of sustained performance and value creation for shareholders.
LTIP awards will be granted on an annual basis and may be granted as nil-cost options or restricted shares which vest subject to a three-year performance period whereby specified performance conditions are satisfied.
After vesting, awards will be subject to a further holding period of at least two years.
The Remuneration Committee retains discretion to adjust the vesting levels to ensure they reflect underlying business performance and any other relevant factors. The Committee will consult with shareholders where appropriate before using discretion to increase the outcome.
Dividends and dividend equivalents will be payable on vested awards during the holding period.
Malus and clawback provisions apply as explained in more detail in the notes to this policy table.
CEO: 200% of base salary.
CFO: 150% of base salary.
A combination of future financial, shareholder-return and strategic performance targets will be set for each annual award.
Prior to award, the Remuneration Committee will determine the measures, targets and weightings. The current measures are TSR, ROIC and Adjusted EBITDA per share.
For threshold performance, 25% of the maximum award will vest, with straight line vesting between threshold and maximum performance.

82
Helios Towers plcAnnual Report and Financial Statements 2019
ELEMENT & PURPOSE POLICY & OPERATION MAXIMUMPERFORMANCE MEASURES
Shareholding requirement Minimum shareholding requirement for the Executive Directors to further promote the alignment of interests of the CEO and CFO with shareholders by tying up a proportion of their wealth in the business.
The Executive Directors are subject to the following shareholding requirements:
• CEO: 200% of base salary.• CFO: 150% of base salary.A new incoming CEO and/or CFO would have five years to obtain the necessary shareholding. Deferred bonus and LTIP awards that have vested count towards the shareholding requirement (including unexercised options). Unvested deferred bonuses not subject to performance conditions count towards the shareholding requirement on a notional net of tax basis.
Unvested LTIP awards do not count towards the shareholding requirement.
Executives are able to make up for any shortfall in shareholding through self-purchase of shares in the open market. They would be expected to retain a portion of vested share awards to achieve their shareholding requirement.
Post-cessation shareholding requirement The Executive Directors will be required to hold shares of a value equal to 100% of the shareholding requirement for a period of two years post-employment. The Remuneration Committee will have the discretion to waive this requirement in certain exceptional personal circumstances.
Not applicable. Not applicable.
NON-EXECUTIVE DIRECTORS
Directors’ fees Fixed-fee remuneration to attract and retain high calibre and experienced individuals to serve on the Board by offering market-competitive fee arrangements.
The Chair receives an annual fee.
Independent Non-Executive Directors receive an annual base fee. They may receive further fees for additional responsibilities including Senior Independent Director, Audit Committee Chair, Remuneration Committee Chair and being a member of a committee. They will be entitled to an additional fee if they are required to perform any specific and additional services. Chair and membership fees may be introduced for any new committees. Fees are subject to review, taking into account time commitment, responsibilities and market practice.
All Non-Executive Directors are entitled to be reimbursed for reasonable expenses incurred in connection with their duties, including any tax due on these benefits.
Non-Executive Directors do not participate in incentive or share schemes or receive a pension provision
The aggregate fees and any benefits of the Chair and Non-Executive Directors will not exceed the limit prescribed within the Company’s Articles of Association for such fees (currently £5 million p.a. in aggregate).
Any increases in fee levels made will be appropriately disclosed.
No performance conditions apply.
NOTES TO THE POLICY TABLEOPERATION OF INCENTIVE PLANSThe incentive plans will be operated within the policy at all times and in accordance with the relevant plan rules and the listing rules. There are a number of areas over which the Remuneration Committee retains flexibility:
• The selection of participants in each plan;• The timing of an award and/or payment;• The size of an award/bonus opportunity subject to the maximum limits set out in the Remuneration Policy table;• Performance measures, weightings and targets that will apply each year and any adjustments thereof;• Treatment of awards in the event of a change of control, restructuring or other corporate event;• Treatment of leavers; and• Amendments of plan rules in accordance with their terms.
In the case of Executive Directors, any use of discretion by the Remuneration Committee will be disclosed in the relevant annual report on remuneration and may be subject to consultation with the Company’s shareholders.
Governance Report
Directors’ remuneration report continued

83
Overview StrategicReport
GovernanceReport
Financial Statements
Helios Towers plcAnnual Report and Financial Statements 2019
PERFORMANCE MEASURES AND TARGETSThe annual bonus measures, which are fundamental to the Company’s future growth, are selected to provide a balance between rewarding financial performance, operational excellence and successful execution of the strategy. For the LTIP, the performance measures will align participants with generating long-term sustainable value for shareholders.
Targets for the incentive plans are set by taking into account a number of reference points. These include the strategic plan, long-term business goals and external consensus forecasts for the Company and the market, to ensure the level of performance required is appropriately stretching.
Conditions applying to the LTIP may be altered if the Remuneration Committee considers this appropriate. If they are varied, they must, in the opinion of the Committee, be fair, reasonable and materially no less or more challenging than the original conditions.
MALUS AND CLAWBACK PROVISIONSMalus and clawback provisions will apply to both the annual bonus and LTIP and will be operated at the discretion of the Remuneration Committee. The cash bonus can be clawed back within three years of payment, and malus applied to the deferred bonus at any time prior to vesting. LTIP awards can be clawed back within two years of vesting, and malus applied at any time prior to vesting.
Malus and clawback can be triggered in exceptional circumstances including material misstatement of accounts or errors in calculating the award, gross misconduct and, in respect of LTIP and deferred bonus awards, material loss which should have been prevented by adequate risk management or a participants material error.
POLICY ON PAYMENTS FOR LOSS OF OFFICEThe Company may require Executive Directors to work their notice period or may choose to place the individual on ‘gardening leave’ if this is the most commercially sensible approach. In the event of termination, certain restrictions may apply for a period of up to twelve months to protect the business interests of the Company.
Payment in lieu of notice may be made for the unexpired portion of the notice period; this is limited to the Executive Director’s base salary and is subject to mitigation. The Company may make such payments in monthly instalments. The employment of each Executive Director is terminable with immediate effect and without payment in lieu of notice in certain circumstances including gross misconduct.
The treatment of any outstanding incentive awards will be determined based on the circumstances of the Executive Director’s departure, as summarised in the following table. The Remuneration Committee may classify individuals as a “good leaver” if they left due to serious illness, injury or disability; retirement; the sale or transfer of the employing company or business (other than on a change of control); or for other reasons specifically approved by the Committee.
Treatment for good leavers • Salary and pension contribution will be paid as a lump sum for the notice period or progressively over the notice period, subject to mitigation.
• Bonus in the year of deperature will be paid on a pro-rata basis at the Remuneration Committee’s discretion.
• Unvested bonus will vest as per the original vesting schedule, at the Remuneration Committee’s discretion.• No new award of LTIP will be made. Unvested LTIP awards will vest on a pro-rata basis.• Vested but unexercised awards, if awards are made as options, will remain exercisable.• The Remuneration Committee will have discretion to remove good leaver classification in certain
circumstances (for example, if an individual joins a competitor after leaving).• In all cases, the level of award vesting will be based on performance and will by default continue to vest at
the same time as awards for non-leavers. The Remuneration Committee has discretion to accelerate vesting in exceptional circumstances. In the event of death, payments will typically be paid as soon as possible after receiving notification.
Treatment for all other leavers
• No payment will be made for salary and pension, except during the notice period.• No annual bonus entitlement unless employed for the full bonus year (but pro-rata bonus may be awarded
in certain circumstances).• Unvested bonus awards at the date of departure will lapse in full.• Unvested LTIP awards at the date of departure will lapse in full. Vested but unexercised awards, if awards
are made as options, will remain exercisable for up to six months post-departure.• All awards are subject to malus and clawback, meaning that even once fully vested the awards can be
clawed back for egregious behaviour.
Change of control • All awards will vest based on the achieved performance up to the date of change of control.• The default position will also be to allow full vesting for all awards on a time basis. This would be subject to
the Remuneration Committee’s discretion, which might include choosing not to apply full vesting if it regards it as inappropriate in the particular circumstance.
84
Helios Towers plcAnnual Report and Financial Statements 2019
EXTERNAL APPOINTMENTSThe Company’s policy is to permit an Executive Director to accept non-executive appointments outside the Company when this does not conflict with the individual’s duties to the Company. When an Executive Director takes on such a role, they may be entitled to retain any fees which they earn from that appointment.
REMUNERATION POLICY ON RECRUITMENTThe Company’s recruitment remuneration policy aims to give the Committee sufficient flexibility to secure the appointment and promotion of high-calibre executives to strengthen the management team and secure the skill-sets to deliver our strategic aims.
In terms of the principles for setting a package for a new Executive Director, the starting point for the Committee will be to apply the general policy for Executive Directors as set out above and structure a package in accordance with that policy.
The annual bonus plan and LTIP awards, including the maximum award levels (for the annual bonus, 175% of salary (CEO) and 150% of salary (CFO); for the LTIP awards, 200% of salary (CEO) and 150% of salary (CFO)), will operate as detailed in the general policy in relation to any newly appointed Executive Director. For an internal appointment, any variable pay element awarded in respect of the prior role may either continue on its original terms or be adjusted to reflect the new appointment, as appropriate.
For both external and internal appointments, the Committee may agree that the Company will meet certain relocation expenses as it considers appropriate, as per the Remuneration Policy table.
For external candidates, it may be necessary to make additional awards in connection with the recruitment to buy out awards forfeited by the individual on leaving a previous employer. For the avoidance of doubt, buyout awards are not subject to a formal cap. Any recruitment-related awards which are not buyouts will be subject to the limits for the annual bonus plan and LTIP awards, as stated in the general policy. Details of any recruitment-related awards will be appropriately disclosed.
For any buyouts, the Company will not pay more than necessary and payment will be limited to the Committee’s estimate of the fair value of the awards foregone. This will take into account all relevant factors including any performance conditions attached to these awards, the form in which they were granted and the timeframe over which they would have vested. In all cases, the Committee will seek, in the first instance, to deliver any such awards under the terms of the existing annual bonus plan and LTIP awards. It may, however, be necessary in some cases to make buyout awards on terms that are more bespoke than the existing annual bonus plan and LTIP.
CONSIDERATION OF EMPLOYMENT CONDITIONS ELSEWHERE IN THE COMPANYThe Company’s pay, and employment conditions generally, will be taken into account when setting Executive Directors’ remuneration. The Committee will receive regular updates including (but not limited to) changes in base pay and any staff bonuses in operation.
In line with the new UK Corporate Governance Code, the Committee is fully informed on, and considers, wider employee remuneration and related policies. This includes the following as they apply to the wider workforce:
• salary increases;• opportunities and payments under annual bonus plans;• operation of incentive plans; and• total remuneration levels.
The Committee will oversee share plans in which Executive Directors and all eligible employees participate and assure that all involved participate on the same terms and conditions. Reflecting standard practice, the Company does not currently consult with staff in drawing up the Company’s remuneration report or when determining the underlying policy, although it will continue to monitor developments in this area.
Governance Report
Directors’ remuneration report continued

85
Overview StrategicReport
GovernanceReport
Financial Statements
Helios Towers plcAnnual Report and Financial Statements 2019
CONSIDERING SHAREHOLDER VIEWSThe Remuneration Committee is fully aware of its responsibility to shareholders and will maintain an open dialogue on executive remuneration.
The views of shareholders and their representative bodies are important to us when determining the appropriate approach to remuneration. The 2020 AGM is the first occasion at which the Company will seek the formal support of its shareholders on matters relating to the remuneration of Executive Directors. The Committee will ensure that it considers all feedback received from shareholders during this process.
APPLYING THE REMUNERATION POLICY: SCENARIO EXAMPLESThe following charts illustrate estimates of the Executive Directors’ potential remuneration opportunity in 2020 under the policy. The bars are split between the three different elements of remuneration, under three different performance scenarios: ‘Minimum’, ‘Target’ and ‘Maximum’. In line with reporting regulations, we also include a further illustration, assuming 50% share price growth over the three-year LTIP performance period, for the maximum performance scenario. The assumptions used for these charts are set out below:
CEO: Total Remuneration (£’000)
£672Minimum
£1,975Target
£2,843
£3,422
100%
34%
24%
20%
29%
36%
30%
37%
41%
51%
Maximum
Maximum+50% share price
appreciation
CFO: Total Remuneration (£’000)
£411Minimum
£1,011Target
£1,476
£1,743
100%
41%
28%
24%
26%
36%
31%
33%
36%
46%
Maximum
Maximum+50% share price
appreciation
Annual BonusFixed benefits LTIP Policy
Minimum performance • Fixed remuneration (salary, benefits and pension) only
Salary Benefits(1) Pension
CEO £579k £41k £52k
CFO £355k £25k £32k
• No payout under the annual bonus or LTIP
Target performance • Fixed remuneration (salary, benefits and pension)• 100% and 75% of salary under the annual bonus for the CEO and CFO respectively• 125% and 94% of salary vesting under the LTIP for the CEO and CFO respectively (62.5% of maximum)
Maximum performance • Fixed remuneration (salary, benefits and pension)• 175% and 150% of salary under the annual bonus for the CEO and CFO respectively• 200% and 150% of salary vesting under the LTIP for the CEO and CFO respectively
Maximum performance + 50% share price growth
• Fixed remuneration (salary, benefits and pension)• 175% and 150% of salary under the annual bonus for the CEO and CFO respectively• 200% and 150% of salary vesting under the LTIP for the CEO and CFO respectively • 50% assumed share price growth over three-year LTIP performance period
(1) Estimate based on value of 2019 benefits provided.
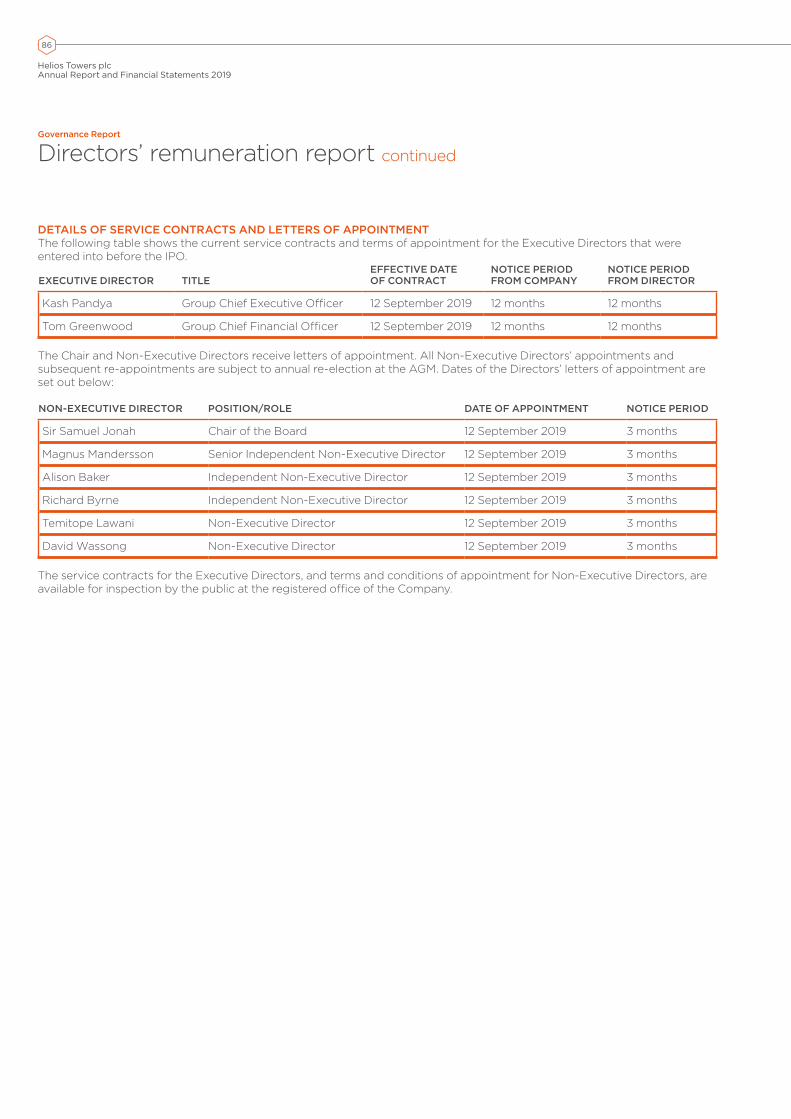
86
Helios Towers plcAnnual Report and Financial Statements 2019
DETAILS OF SERVICE CONTRACTS AND LETTERS OF APPOINTMENTThe following table shows the current service contracts and terms of appointment for the Executive Directors that were entered into before the IPO.
EXECUTIVE DIRECTOR TITLEEFFECTIVE DATE OF CONTRACT
NOTICE PERIOD FROM COMPANY
NOTICE PERIOD FROM DIRECTOR
Kash Pandya Group Chief Executive Officer 12 September 2019 12 months 12 months
Tom Greenwood Group Chief Financial Officer 12 September 2019 12 months 12 months
The Chair and Non-Executive Directors receive letters of appointment. All Non-Executive Directors’ appointments and subsequent re-appointments are subject to annual re-election at the AGM. Dates of the Directors’ letters of appointment are set out below:
NON-EXECUTIVE DIRECTOR POSITION/ROLE DATE OF APPOINTMENT NOTICE PERIOD
Sir Samuel Jonah Chair of the Board 12 September 2019 3 months
Magnus Mandersson Senior Independent Non-Executive Director 12 September 2019 3 months
Alison Baker Independent Non-Executive Director 12 September 2019 3 months
Richard Byrne Independent Non-Executive Director 12 September 2019 3 months
Temitope Lawani Non-Executive Director 12 September 2019 3 months
David Wassong Non-Executive Director 12 September 2019 3 months
The service contracts for the Executive Directors, and terms and conditions of appointment for Non-Executive Directors, are available for inspection by the public at the registered office of the Company.
Governance Report
Directors’ remuneration report continued

87
Overview StrategicReport
GovernanceReport
Financial Statements
Helios Towers plcAnnual Report and Financial Statements 2019
ANNUAL REPORT ON REMUNERATION
This section of the Directors’ remuneration report provides details of:• how Directors were paid for the year ending 31 December 2019; and • how we propose to implement our policy for 2020, which is our first full financial year as a listed Company.
Because the Company was incorporated on 1 August and listed on the London Stock Exchange on 18 October 2019, our formal reporting requirements relate only to part of 2019. However, we have chosen to provide additional disclosure to assist transparency.
We are committed to an open dialogue with our shareholders and hope that the level of disclosure we provide will ensure that the Committee’s decisions on remuneration are fully explained and contribute to building a positive relationship with our shareholders.
This full Director’s remuneration report (excluding the Director’s Remuneration Policy) will be subject to an Advisory vote at the 2020 AGM.
REMUNERATION COMMITTEEROLES AND RESPONSIBILITIESThe role of the Remuneration Committee is to assist the Board in determining its responsibilities in relation to remuneration, including:
• establishing a formal and transparent procedure for developing the policy on executive remuneration;• making recommendations to the Board on the Company’s policy on executive remuneration, including setting the over-
arching principles, parameters and governance framework of the Group’s Remuneration Policy; • aligning the approach to remuneration throughout the Company with long-term sustainable success;• determining the individual remuneration and benefits package of each of the Company’s Executive Directors and certain
senior executives, including the Company Secretary; • reviewing the wider workforce remuneration policies and practices and taking these into account when determining the
approach for executives; • reviewing and approving the design of performance-related pay schemes; and• ensuring compliance with the UK Corporate Governance Code in relation to remuneration.
The Committee meets at least three times a year and has formal terms of reference which can be viewed on the Company’s website at www.heliostowers.com.
Committee attendance is set out on page 57.
MEMBERSHIPThe Board considers the Group in compliance with the UK Corporate Governance Code requirements relating to committee composition and roles; namely, a Remuneration Committee should comprise at least three members who are all independent Non-Executive Directors, and the Chair of the Board should not also chair the Remuneration Committee.
INDEPENDENT NON-EXECUTIVE DIRECTOR DATE OF APPOINTMENT TO COMMITTEE
Richard Byrne (Remuneration Committee Chair) 12 September 2019
Sir Samuel Jonah 12 September 2019
Alison Baker 12 September 2019
Magnus Mandersson 12 September 2019
MAIN ACTIVITIESThe Remuneration Committee held a meeting on 12 November 2019, prior to the Company’s results announcement for the three months ending 30 September 2019, where it reviewed and resolved to adopt the Remuneration policy. At this meeting, the Remuneration Committee also reviewed and granted the 2020 LTIP awards to Executive Directors and other selected senior executives and key employees.
The Remuneration Committee also met on two further occasions after the year-end, in January and March 2020 to approve annual incentive targets for 2020, annual incentive outcomes for 2019, salary increases for 2020 for the Group’s employees and timing of salary increases for the Executive Directors. In addition, the Committee reviewed and approved the Directors’ remuneration report.

88
Helios Towers plcAnnual Report and Financial Statements 2019
ADVICE TO THE COMMITTEEMembers of the management team are invited to attend Committee meetings where appropriate, except when their own remuneration is being discussed. During the year Kash Pandya (Group Chief Executive Officer), Tom Greenwood (Group Chief Financial Officer), Helen Shaw (the Company Secretary and Chief Legal Officer), and Nick Summers (Director of Sustainability and Organisational Development) attended meetings at the Committee’s invitation.
Since Admission, the Committee has appointed PwC to provide independent advice on remuneration matters. PwC is a member of the Remuneration Consultants’ Group and, as such, operates voluntarily under the Remuneration Consultants’ Group Code of Conduct in relation to executive remuneration consulting in the UK.
The Committee is satisfied that the advice provided by PwC is independent and objective. During 2019, the firm also acted as Tax Adviser to the Company, and Helios Towers, Ltd. in preparation for the IPO. Total fees received by PwC amounted to £26,280, in relation to remuneration advice that materially assisted the Committee from Admission to 31 December 2019.
The Committee will continue to seek remuneration advice from PwC in 2020.
REMUNERATION PAID IN RESPECT OF 2019Pay for 2019 was chiefly set by the Remuneration Committee that was in place prior to listing. As required by the regulations, statutory figures for Helios Towers plc are reported from the date the Company was incorporated (1 August 2019 or “Incorporation”) to 31 December 2019. Since the Helios Towers Group reorganisation for the IPO was effected prior to Admission, it should be noted that such figures are equivalent to the period from 18 October 2019 to 31 December 2019.
SINGLE FIGURE TABLE FOR EXECUTIVE DIRECTORSThe regulations require the single figure table to include disclosure of amounts paid to individuals for “qualifying services”. For the reasons above, these are part-year figures.
ANNUALISED (NON-STATUTORY) SINGLE FIGURE TABLE FOR THE EXECUTIVE DIRECTORS The table below shows the annualised payments for each of the Executive Directors holding office as at 31 December 2019. This is reported as if the Remuneration Policy (which operated only since the IPO) had been in place for the entirety of 2019 for salary, benefits and pension.
Actual bonus payments to the Executive Directors in respect of the 2019 financial year are also shown.
EXECUTIVE DIRECTOR
BASE SALARY BENEFITS(1)
ANNUAL BONUS(2) LTIP PENSION(3)
TOTAL REMUNERATION
TOTAL FIXED REMUNERATION
TOTAL VARIABLE REMUNERATION
Kash Pandya £579k £41k £748k – £52k £1,420k £672k £748k
Tom Greenwood £355k £25k £371k – £32k £782k £411k £371k
STATUTORY SINGLE FIGURE TABLE FOR THE EXECUTIVE DIRECTORS (AUDITED)The following tables show the information required by the Remuneration Reporting Requirements from Admission to 31 December 2019.
EXECUTIVE DIRECTOR
BASE SALARY BENEFITS(1)
ANNUAL BONUS(2) LTIP PENSION(3)
TOTAL REMUNERATION
TOTAL FIXED REMUNERATION
TOTAL VARIABLE REMUNERATION
Kash Pandya £119k £8k £154k – £11k £292k £138k £154k
Tom Greenwood £73k £5k £76k – £7k £161k £85k £76k
(1) Benefits received in 2019 included 25 days’ annual leave, life insurance cover equal to 4 x base salary and worldwide medical insurance (excluding the US). The most significant benefit received was health insurance, representing 77% of total benefits received by each of the Executive Directors.
(2) The 2019 annual bonus was paid in cash. No portion of the annual bonus was deferred.(3) The CEO and CFO were based in Dubai during the period from Admission to 31 December 2019. No employer pension contributions were provided to either
the CEO or CFO but an equivalent End of Service Gratuity (EOSG) arrangement equal to 9% of base salary operated, in line with local Dubai market practice. No Director has a prospective entitlement to a defined benefit pension plan.
Governance Report
Directors’ remuneration report continued

89
Overview StrategicReport
GovernanceReport
Financial Statements
Helios Towers plcAnnual Report and Financial Statements 2019
ANNUAL BONUSThe Remuneration Policy was applied to the threshold, target and maximum awards for the Executive Directors for the 2019 annual bonus scheme. The maximum bonus opportunity awards for the CEO and CFO were 175% and 150% of salary respectively.
ROLE NAME
THRESHOLD PERFORMANCE (% OF SALARY)
TARGET PERFORMANCE (% OF SALARY)
MAXIMUM PERFORMANCE (% OF SALARY)
CEO Kash Pandya 0% 100% 175%
CFO Tom Greenwood 0% 75% 150%
The performance conditions for the 2019 annual bonus scheme were set pre-listing and based on achievement against run-rate Adjusted EBITDA, portfolio free cash flow, operating free cash flow and network performance targets. We have provided details of the bonus targets and achievement against them in the table below:
MEASURE WEIGHTING THRESHOLD TARGET MAXIMUM ACTUAL
CEO BONUS (% OF BASE SALARY)
CFO BONUS (% OF BASE SALARY)
Run-rate Adjusted EBITDA(1)
40% $174.9m $218.7m $262.4m $217.8m 39.2% 29.4%
Portfolio free cash flow
20% $126.9m $158.7m $190.4m $168.9m 24.8% 19.8%
Operating free cash flow(2)
20% ($119.4m) ($99.5m) ($79.6m) ($60.5m) 35.0% 30.0%
Network performance (uptime)(3)
20% n/a n/a 12 months(4) 11 months 30.2% 25.2%
Total 129.2% 104.4%
(1) Represents the annualised Adjusted EBITDA for December 2019, pro forma for any items that increased or decreased EBITDA during that month.(2) Cash flow pre-financing (adjusted. EBITDA less working capital, interest, tax, capital expenditure).(3) Based on compliance with service level agreements with anchor tenants for all operating subsidiaries, measured as the cumulative performance relative to
customer SLAs measured in each operating subsidiary at the end of each month.(4) The 2019 annual bonus criteria for network performance based on cumulative SLA compliance across all operating subsidiaries measured at the end of each
month were as follows:• less than 7 consecutive months of meeting or exceeding customer SLAs across all operating subsidiaries: no award;• at least 7 consecutive months: 25.1% and 20.1% of salary for the CEO and CFO respectively;• at least 9 consecutive months: 30.2% and 25.2% of salary for the CEO and CFO respectively;• 12 consecutive months: 35.0% and 30.0% of salary for the CEO and CFO respectively.
Despite being a pre-listing legacy arrangement, the Remuneration Committee considered the 2019 annual bonus scheme in the round including performance measures, relative weightings, targets, value of award, performance against targets and resulting levels of award. The Committee deemed the scheme to be appropriate and that it required no discretion to be exercised. The bonus was paid in cash. No portion of the bonus was deferred.
SHAREHOLDINGS IN RESPECT OF LEGACY INCENTIVE PLANS AND SHARE SALES AT IPOPrior to Admission, the Executive Directors, certain Non-Executive Directors, senior executives, other key personnel and former employees participated in incentive plans (“Legacy Incentive Plans”), the key details of which were set out in the IPO prospectus.
These plans were the sole incentive plans in place prior to IPO and were amended in the first half of 2019, prior to Admission, to align its participants more effectively with legacy shareholders, and to retain critical talent. The value of shares and nil-cost options delivered under the legacy plans was determined based on the value of the legacy shareholders’ holdings in the Company at the IPO price, less amounts that shareholders contributed to an escrow account to fund potential future tax liabilities. The awards vested on listing and the number of shares delivered to participants was determined at this point. There are no awards outstanding under the Legacy Incentive Plans.
The legacy shareholders allocated a total of 28,118,141 shares and 6,557,668 nil-cost options to the Executive Directors, senior management and key personnel. This represented 3.47% of the issued share capital post-Admission.

90
Helios Towers plcAnnual Report and Financial Statements 2019
Kash Pandya received 8,258,766 shares and 1,797,450 nil-cost options immediately prior to Admission, representing 1.01% of the issued share capital post-Admission. Mr Pandya exercised all of his nil-cost options and sold 1,973,056 shares in total immediately on Admission at £1.15 per share for £2,269,014 aggregate sale proceeds. Mr Pandya retained a balance of 8,083,160 shares post-Admission.
Tom Greenwood received 5,059,065 shares and 1,101,062 nil-cost options prior to Admission, representing 0.62% of the issued share capital post-Admission. Mr Greenwood exercised all of his nil-cost options and sold 1,208,633 shares in total immediately on Admission at £1.15 per share for £1,389,928 aggregate sale proceeds. Mr Greenwood retained a balance of 4,951,494 shares post-Admission.
Richard Byrne received 285,178 shares and 62,067 nil-cost options prior to Admission, representing 0.04% of the issued share capital post-Admission. Mr Byrne did not sell any shares in the IPO and did not exercise any nil-cost options.
Following the share sale at IPO, the Executive Directors entered into a lock-up arrangement (the “lock-up arrangement”) in relation to the balance of shares retained post-Admission, with such shares being subject to forfeiture in the event that they become a “bad leaver” as noted in the prospectus. During the period that such shares are subject to forfeiture, the Executive Directors will not be able to sell or otherwise dispose of them.
On and after the first anniversary of Admission, each Executive Director’s remaining shares will cease to be subject to forfeiture in accordance with the following schedule:
DATEPROPORTION OF THE SHARES HELD BY EACH INCUMBENT EXECUTIVE DIRECTOR POST-ADMISSION WHICH WILL CEASE TO BE SUBJECT TO FORFEITURE
CUMULATIVE PRO-PORTION RELEASED
On the first anniversary of Admission
The greater of 50% and the proportion of the shares held by the Legacy Shareholders immediately following the IPO which have (in aggregate) been sold since that date.
50%
On the date falling 18 months after Admission
The greater of 40% and the proportion of the shares held by the Legacy Shareholders on the first anniversary of Admission which have (in aggregate) been sold since that date.
70%
On the second anniversary of Admission
The greater of 50% and the proportion of the shares held by the Legacy Shareholders on the date falling 18 months after Admission which have (in aggregate) been sold since that date.
85%
On the third anniversary of Admission
The remainder shall be released. 100%
Both Executive Directors now have substantial shareholdings in the Company. For the duration of their employment and for a period of two years post-employment, Mr Pandya and Mr Greenwood are, respectively, required to retain a minimum of 200% and 150% of salary in shares. The leaver provisions also support the retention of both Mr Pandya and Mr Greenwood.
SINGLE FIGURE TABLE FOR NON-EXECUTIVE DIRECTORS (AUDITED)The following table sets out the total remuneration for Non-Executive Directors and the Chair of the Board for the year ended 31 December 2019. Remuneration is shown from the date of appointment to the Board.
POSITION/ROLEBOARD COMMITTEE CHAIR POSITION TOTAL FEES(1)
Sir Samuel Jonah Chair of the Board Nomination Committee Chair £72k
Magnus Mandersson Senior Independent Non-Executive Director
£23k
Alison Baker Independent Non-Executive Director
Audit Committee Chair £23k
Richard Byrne(2) Independent Non-Executive Director
Remuneration Committee Chair £23k
Temitope Lawani Non-Executive Director –
David Wassong Non-Executive Director –
(1) No taxable benefits were paid to the Non-Executive Directors during the year; therefore, the figures above are total payments.(2) Excludes the value at Admission of 285,178 shares and 62,067 nil-cost options in the Company to which Richard Byrne became entitled prior to listing, in
recognition of past services provided to the Company prior to Admission.
Governance Report
Directors’ remuneration report continued
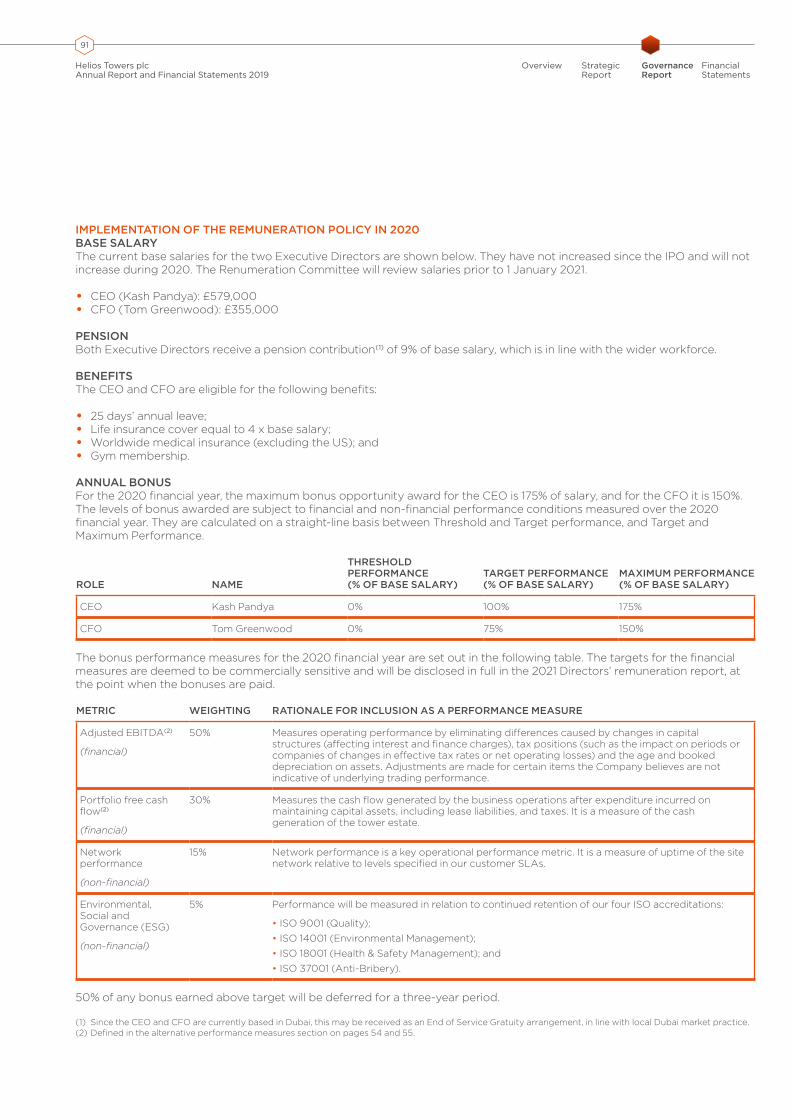
91
Overview StrategicReport
GovernanceReport
Financial Statements
Helios Towers plcAnnual Report and Financial Statements 2019
IMPLEMENTATION OF THE REMUNERATION POLICY IN 2020BASE SALARYThe current base salaries for the two Executive Directors are shown below. They have not increased since the IPO and will not increase during 2020. The Renumeration Committee will review salaries prior to 1 January 2021.
• CEO (Kash Pandya): £579,000• CFO (Tom Greenwood): £355,000
PENSIONBoth Executive Directors receive a pension contribution(1) of 9% of base salary, which is in line with the wider workforce.
BENEFITSThe CEO and CFO are eligible for the following benefits:
• 25 days’ annual leave;• Life insurance cover equal to 4 x base salary;• Worldwide medical insurance (excluding the US); and• Gym membership.
ANNUAL BONUSFor the 2020 financial year, the maximum bonus opportunity award for the CEO is 175% of salary, and for the CFO it is 150%. The levels of bonus awarded are subject to financial and non-financial performance conditions measured over the 2020 financial year. They are calculated on a straight-line basis between Threshold and Target performance, and Target and Maximum Performance.
ROLE NAME
THRESHOLD PERFORMANCE (% OF BASE SALARY)
TARGET PERFORMANCE (% OF BASE SALARY)
MAXIMUM PERFORMANCE (% OF BASE SALARY)
CEO Kash Pandya 0% 100% 175%
CFO Tom Greenwood 0% 75% 150%
The bonus performance measures for the 2020 financial year are set out in the following table. The targets for the financial measures are deemed to be commercially sensitive and will be disclosed in full in the 2021 Directors’ remuneration report, at the point when the bonuses are paid.
METRIC WEIGHTING RATIONALE FOR INCLUSION AS A PERFORMANCE MEASURE
Adjusted EBITDA(2)
(financial)
50% Measures operating performance by eliminating differences caused by changes in capital structures (affecting interest and finance charges), tax positions (such as the impact on periods or companies of changes in effective tax rates or net operating losses) and the age and booked depreciation on assets. Adjustments are made for certain items the Company believes are not indicative of underlying trading performance.
Portfolio free cash flow(2)
(financial)
30% Measures the cash flow generated by the business operations after expenditure incurred on maintaining capital assets, including lease liabilities, and taxes. It is a measure of the cash generation of the tower estate.
Network performance
(non-financial)
15% Network performance is a key operational performance metric. It is a measure of uptime of the site network relative to levels specified in our customer SLAs.
Environmental, Social and Governance (ESG)
(non-financial)
5% Performance will be measured in relation to continued retention of our four ISO accreditations:
• ISO 9001 (Quality);• ISO 14001 (Environmental Management);• ISO 18001 (Health & Safety Management); and • ISO 37001 (Anti-Bribery).
50% of any bonus earned above target will be deferred for a three-year period.
(1) Since the CEO and CFO are currently based in Dubai, this may be received as an End of Service Gratuity arrangement, in line with local Dubai market practice.(2) Defined in the alternative performance measures section on pages 54 and 55.
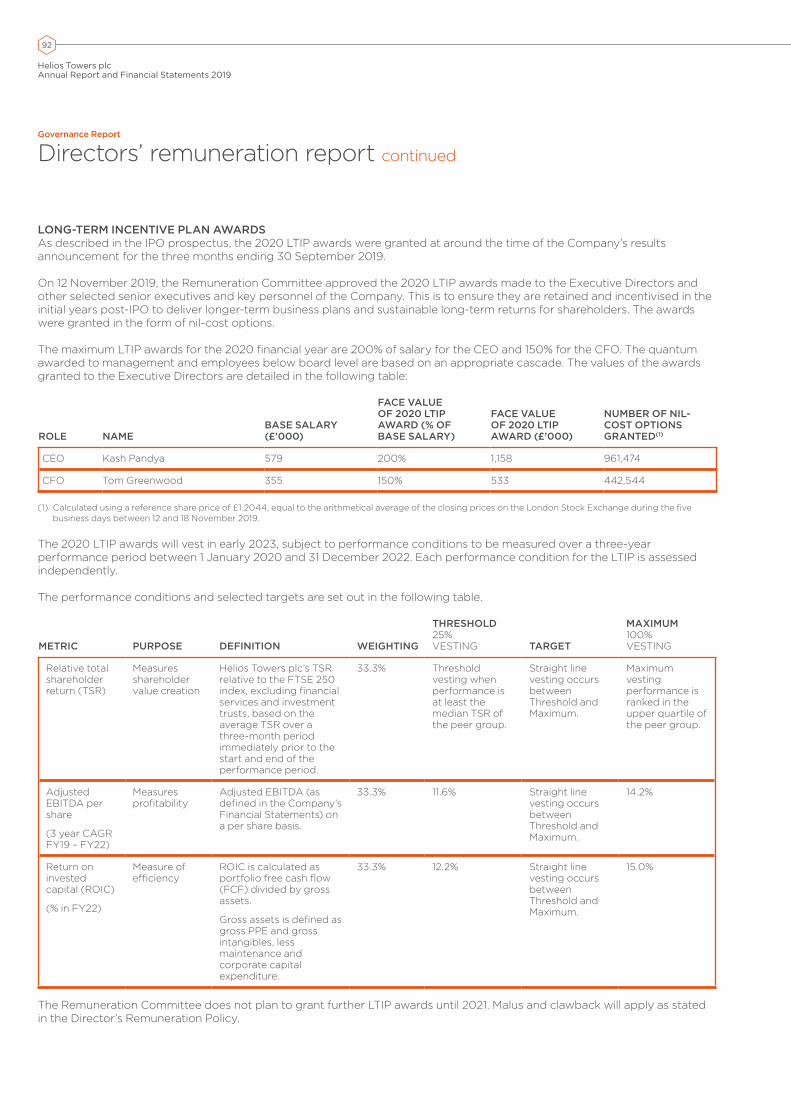
92
Helios Towers plcAnnual Report and Financial Statements 2019
LONG-TERM INCENTIVE PLAN AWARDSAs described in the IPO prospectus, the 2020 LTIP awards were granted at around the time of the Company’s results announcement for the three months ending 30 September 2019.
On 12 November 2019, the Remuneration Committee approved the 2020 LTIP awards made to the Executive Directors and other selected senior executives and key personnel of the Company. This is to ensure they are retained and incentivised in the initial years post-IPO to deliver longer-term business plans and sustainable long-term returns for shareholders. The awards were granted in the form of nil-cost options.
The maximum LTIP awards for the 2020 financial year are 200% of salary for the CEO and 150% for the CFO. The quantum awarded to management and employees below board level are based on an appropriate cascade. The values of the awards granted to the Executive Directors are detailed in the following table:
ROLE NAMEBASE SALARY (£’000)
FACE VALUE OF 2020 LTIP AWARD (% OF BASE SALARY)
FACE VALUE OF 2020 LTIP AWARD (£’000)
NUMBER OF NIL-COST OPTIONS GRANTED(1)
CEO Kash Pandya 579 200% 1,158 961,474
CFO Tom Greenwood 355 150% 533 442,544
(1) Calculated using a reference share price of £1.2044, equal to the arithmetical average of the closing prices on the London Stock Exchange during the five business days between 12 and 18 November 2019.
The 2020 LTIP awards will vest in early 2023, subject to performance conditions to be measured over a three-year performance period between 1 January 2020 and 31 December 2022. Each performance condition for the LTIP is assessed independently.
The performance conditions and selected targets are set out in the following table.
METRIC PURPOSE DEFINITION WEIGHTING
THRESHOLD 25% VESTING TARGET
MAXIMUM 100% VESTING
Relative total shareholder return (TSR)
Measures shareholder value creation
Helios Towers plc’s TSR relative to the FTSE 250 index, excluding financial services and investment trusts, based on the average TSR over a three-month period immediately prior to the start and end of the performance period.
33.3% Threshold vesting when performance is at least the median TSR of the peer group.
Straight line vesting occurs between Threshold and Maximum.
Maximum vesting performance is ranked in the upper quartile of the peer group.
Adjusted EBITDA per share
(3 year CAGR FY19 – FY22)
Measures profitability
Adjusted EBITDA (as defined in the Company’s Financial Statements) on a per share basis.
33.3% 11.6% Straight line vesting occurs between Threshold and Maximum.
14.2%
Return on invested capital (ROIC)
(% in FY22)
Measure of efficiency
ROIC is calculated as portfolio free cash flow (FCF) divided by gross assets.
Gross assets is defined as gross PPE and gross intangibles, less maintenance and corporate capital expenditure.
33.3% 12.2% Straight line vesting occurs between Threshold and Maximum.
15.0%
The Remuneration Committee does not plan to grant further LTIP awards until 2021. Malus and clawback will apply as stated in the Director’s Remuneration Policy.
Governance Report
Directors’ remuneration report continued
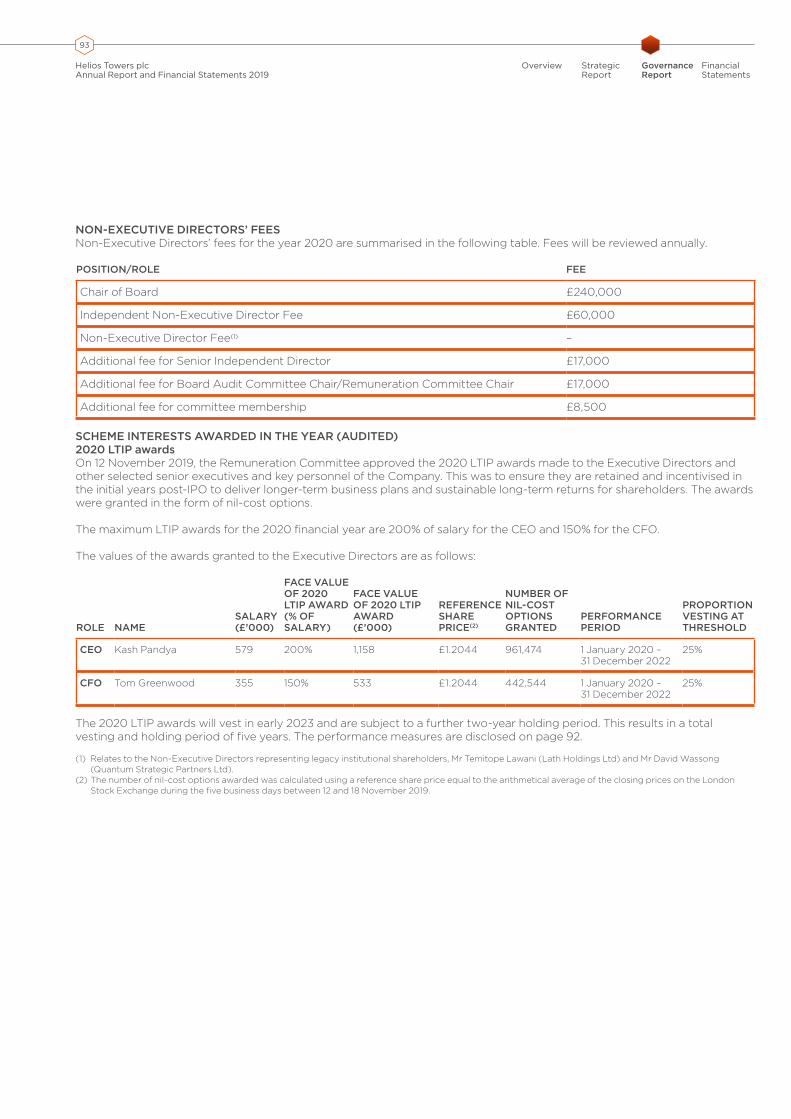
93
Overview StrategicReport
GovernanceReport
Financial Statements
Helios Towers plcAnnual Report and Financial Statements 2019
NON-EXECUTIVE DIRECTORS’ FEESNon-Executive Directors’ fees for the year 2020 are summarised in the following table. Fees will be reviewed annually.
POSITION/ROLE FEE
Chair of Board £240,000
Independent Non-Executive Director Fee £60,000
Non-Executive Director Fee(1) –
Additional fee for Senior Independent Director £17,000
Additional fee for Board Audit Committee Chair/Remuneration Committee Chair £17,000
Additional fee for committee membership £8,500
SCHEME INTERESTS AWARDED IN THE YEAR (AUDITED)2020 LTIP awardsOn 12 November 2019, the Remuneration Committee approved the 2020 LTIP awards made to the Executive Directors and other selected senior executives and key personnel of the Company. This was to ensure they are retained and incentivised in the initial years post-IPO to deliver longer-term business plans and sustainable long-term returns for shareholders. The awards were granted in the form of nil-cost options.
The maximum LTIP awards for the 2020 financial year are 200% of salary for the CEO and 150% for the CFO.
The values of the awards granted to the Executive Directors are as follows:
ROLE NAMESALARY (£’000)
FACE VALUE OF 2020 LTIP AWARD (% OF SALARY)
FACE VALUE OF 2020 LTIP AWARD (£’000)
REFERENCE SHARE PRICE(2)
NUMBER OF NIL-COST OPTIONS GRANTED
PERFORMANCE PERIOD
PROPORTION VESTING AT THRESHOLD
CEO Kash Pandya 579 200% 1,158 £1.2044 961,474 1 January 2020 – 31 December 2022
25%
CFO Tom Greenwood 355 150% 533 £1.2044 442,544 1 January 2020 – 31 December 2022
25%
The 2020 LTIP awards will vest in early 2023 and are subject to a further two-year holding period. This results in a total vesting and holding period of five years. The performance measures are disclosed on page 92.
(1) Relates to the Non-Executive Directors representing legacy institutional shareholders, Mr Temitope Lawani (Lath Holdings Ltd) and Mr David Wassong (Quantum Strategic Partners Ltd).
(2) The number of nil-cost options awarded was calculated using a reference share price equal to the arithmetical average of the closing prices on the London Stock Exchange during the five business days between 12 and 18 November 2019.
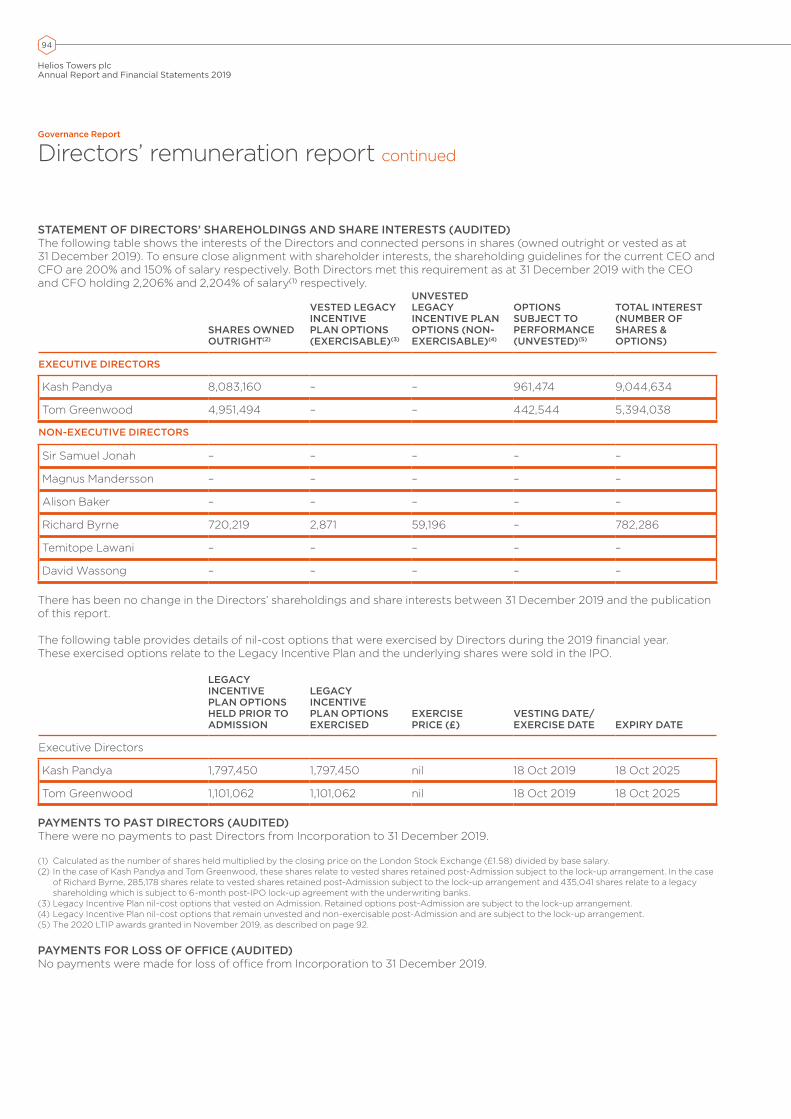
94
Helios Towers plcAnnual Report and Financial Statements 2019
STATEMENT OF DIRECTORS’ SHAREHOLDINGS AND SHARE INTERESTS (AUDITED)The following table shows the interests of the Directors and connected persons in shares (owned outright or vested as at 31 December 2019). To ensure close alignment with shareholder interests, the shareholding guidelines for the current CEO and CFO are 200% and 150% of salary respectively. Both Directors met this requirement as at 31 December 2019 with the CEO and CFO holding 2,206% and 2,204% of salary(1) respectively.
SHARES OWNED OUTRIGHT(2)
VESTED LEGACY INCENTIVE PLAN OPTIONS (EXERCISABLE)(3)
UNVESTED LEGACY INCENTIVE PLAN OPTIONS (NON-EXERCISABLE)(4)
OPTIONS SUBJECT TO PERFORMANCE (UNVESTED)(5)
TOTAL INTEREST (NUMBER OF SHARES & OPTIONS)
EXECUTIVE DIRECTORS
Kash Pandya 8,083,160 – – 961,474 9,044,634
Tom Greenwood 4,951,494 – – 442,544 5,394,038
NON-EXECUTIVE DIRECTORS
Sir Samuel Jonah – – – – –
Magnus Mandersson – – – – –
Alison Baker – – – – –
Richard Byrne 720,219 2,871 59,196 – 782,286
Temitope Lawani – – – – –
David Wassong – – – – –
There has been no change in the Directors’ shareholdings and share interests between 31 December 2019 and the publication of this report.
The following table provides details of nil-cost options that were exercised by Directors during the 2019 financial year. These exercised options relate to the Legacy Incentive Plan and the underlying shares were sold in the IPO.
LEGACY INCENTIVE PLAN OPTIONS HELD PRIOR TO ADMISSION
LEGACY INCENTIVE PLAN OPTIONS EXERCISED
EXERCISE PRICE (£)
VESTING DATE/EXERCISE DATE EXPIRY DATE
Executive Directors
Kash Pandya 1,797,450 1,797,450 nil 18 Oct 2019 18 Oct 2025
Tom Greenwood 1,101,062 1,101,062 nil 18 Oct 2019 18 Oct 2025
PAYMENTS TO PAST DIRECTORS (AUDITED)There were no payments to past Directors from Incorporation to 31 December 2019.
(1) Calculated as the number of shares held multiplied by the closing price on the London Stock Exchange (£1.58) divided by base salary. (2) In the case of Kash Pandya and Tom Greenwood, these shares relate to vested shares retained post-Admission subject to the lock-up arrangement. In the case
of Richard Byrne, 285,178 shares relate to vested shares retained post-Admission subject to the lock-up arrangement and 435,041 shares relate to a legacy shareholding which is subject to 6-month post-IPO lock-up agreement with the underwriting banks.
(3) Legacy Incentive Plan nil-cost options that vested on Admission. Retained options post-Admission are subject to the lock-up arrangement.(4) Legacy Incentive Plan nil-cost options that remain unvested and non-exercisable post-Admission and are subject to the lock-up arrangement.(5) The 2020 LTIP awards granted in November 2019, as described on page 92.
PAYMENTS FOR LOSS OF OFFICE (AUDITED)No payments were made for loss of office from Incorporation to 31 December 2019.
Governance Report
Directors’ remuneration report continued
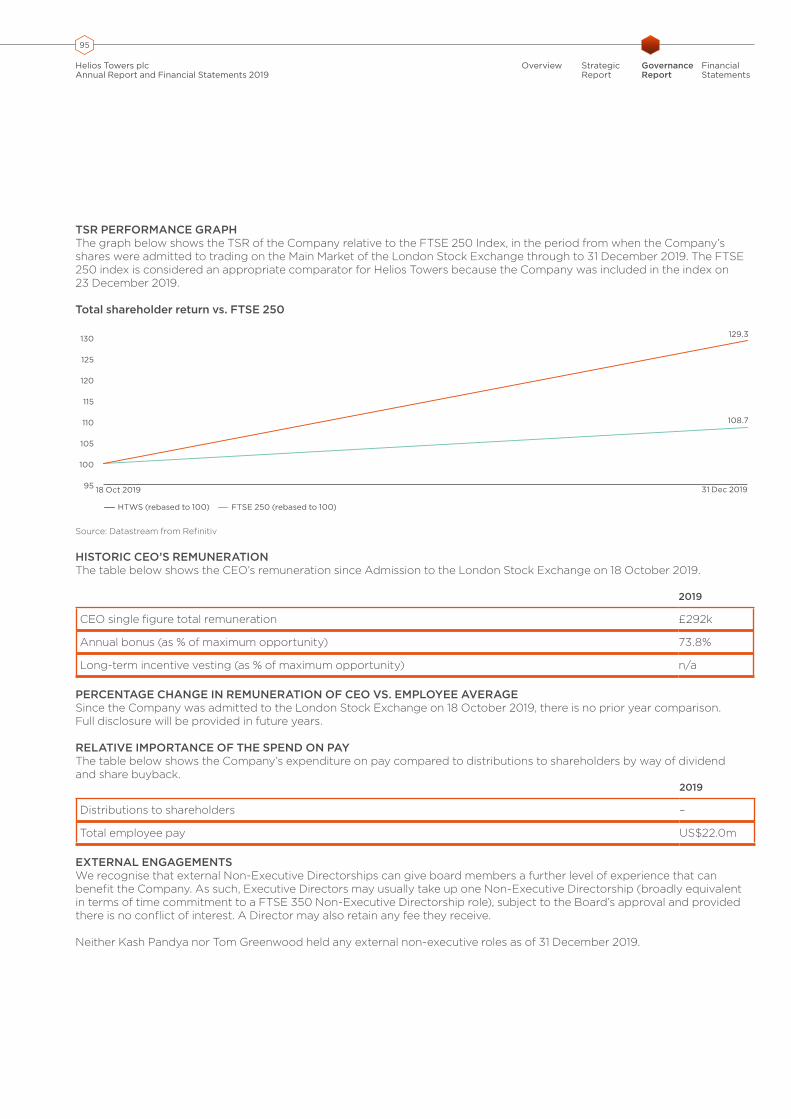
95
Overview StrategicReport
GovernanceReport
Financial Statements
Helios Towers plcAnnual Report and Financial Statements 2019
TSR PERFORMANCE GRAPHThe graph below shows the TSR of the Company relative to the FTSE 250 Index, in the period from when the Company’s shares were admitted to trading on the Main Market of the London Stock Exchange through to 31 December 2019. The FTSE 250 index is considered an appropriate comparator for Helios Towers because the Company was included in the index on 23 December 2019.
Total shareholder return vs. FTSE 250
18 Oct 2019
129.3
108.7
HTWS (rebased to 100)
95
100
105
110
115
120
125
130
FTSE 250 (rebased to 100)
31 Dec 2019
Source: Datastream from Refinitiv
HISTORIC CEO’S REMUNERATIONThe table below shows the CEO’s remuneration since Admission to the London Stock Exchange on 18 October 2019.
2019
CEO single figure total remuneration £292k
Annual bonus (as % of maximum opportunity) 73.8%
Long-term incentive vesting (as % of maximum opportunity) n/a
PERCENTAGE CHANGE IN REMUNERATION OF CEO VS. EMPLOYEE AVERAGESince the Company was admitted to the London Stock Exchange on 18 October 2019, there is no prior year comparison. Full disclosure will be provided in future years.
RELATIVE IMPORTANCE OF THE SPEND ON PAYThe table below shows the Company’s expenditure on pay compared to distributions to shareholders by way of dividend and share buyback.
2019
Distributions to shareholders –
Total employee pay US$22.0m
EXTERNAL ENGAGEMENTSWe recognise that external Non-Executive Directorships can give board members a further level of experience that can benefit the Company. As such, Executive Directors may usually take up one Non-Executive Directorship (broadly equivalent in terms of time commitment to a FTSE 350 Non-Executive Directorship role), subject to the Board’s approval and provided there is no conflict of interest. A Director may also retain any fee they receive.
Neither Kash Pandya nor Tom Greenwood held any external non-executive roles as of 31 December 2019.

96
Helios Towers plcAnnual Report and Financial Statements 2019
CEO PAY RATIO AND GENDER PAY GAPHelios Towers has fewer than 250 UK employees and therefore is not required at this stage to report or disclose our CEO: median employee pay ratio or gender pay gap information. The Company regularly reviews the pay rates throughout the Company and will keep its approach to disclosing a UK and/or group wide pay ratio and/or gender pay gap information under review over the coming years.
STATEMENT ON SHAREHOLDER VOTINGSince Incorporation, there is no historic information to disclose. We are committed to maintaining an open and transparent dialogue on pay at all times. There will be two resolutions on the Directors’ remuneration report and one resolution on the Remuneration Policy tabled at the 2020 AGM, and full details of voting outcomes will be disclosed in next year’s Annual Report.
Richard Byrne | Chair Remuneration Committee
Governance Report
Directors’ remuneration report continued

97
Helios Towers plcAnnual Report and Financial Statements 2019
Overview StrategicReport
GovernanceReport
Financial Statements
Directors’ report
In accordance with Section 415 of the Companies Act 2006, the Directors of Helios Towers plc present their Annual Report and audited Financial Statements for the year ended 31 December 2019.
The Directors believe that the requisite components of this report are set out within this Annual Report and Financial Statements and/or on the Company’s website at www.heliostowers.com.
BUSINESS PERFORMANCERESULTSResults for the year ended 31 December 2019 are set out in the Detailed financial review on pages 41 to 45 and the Consolidated Income Statement on page 111.
DIVIDENDSThe Directors do not intend to pay a final dividend for the year ending 31 December 2019.
STRATEGIC REPORTThe strategic report can be found on pages 8 to 55.
CORPORATE GOVERNANCE STATEMENTThe Company’s statement on corporate governance can be found on pages 60–64.
DIRECTORS’ REMUNERATION REPORTThe Directors’ remuneration report can be found on pages 76 to 96.
ACTIVITIES IN RESEARCH AND DEVELOPMENTThe Company undertook no activities in research and development.
BRANCHES OUTSIDE THE UKThe Company has no branches outside the UK.
FUTURE DEVELOPMENTSThere are currently no material likely future developments for the Group.
POST-BALANCE SHEET EVENTSSee Note 31 of the Notes to the Financial Statements.
DIRECTORSDirectors who have served during the year, and summaries of the current Directors’ key skills and experience, are set out in the corporate governance report on pages 58 to 59.
DIRECTORS’ INTERESTS Details of the Directors’ beneficial interests are set out in the Directors’ Remuneration Report on page 94.
DIRECTORS’ AND OFFICERS’ LIABILITY INSURANCE AND INDEMNITIESThe Company maintains Directors’ and officers’ liability insurance, which provides cover for legal actions brought against its Directors and officers. Each Director also has the benefit of prospectus liability insurance which gives cover for liabilities incurred by Directors in the performance of their duties or powers in connection with the issue of the Company’s prospectus dated 15 October 2019 in relation to the Company’s listing on the premium listing segment of the Financial Conduct Authority’s Official List and admission to trading on the Main Market for listed securities of the London Stock Exchange. The Company has also entered into qualifying third-party indemnity arrangements for the benefit of all its Directors, in a form and scope that complies with the Companies Act 2006. These indemnities came into force on 15 October 2019 and remain in force as at the date of this Annual Report.
ARTICLES OF ASSOCIATIONThe Articles of Association set out the internal regulation of the Company and cover such matters as the rights of shareholders, the appointment and removal of Directors and the conduct of the Board and general meetings. Copies are available from the Company Secretary. The Articles of Association may be amended in accordance with the provisions of the Companies Act 2006 by way of a special resolution of the Company’s shareholders.
STAKEHOLDERS AND POLICIESSECTION 172 STATEMENT The Company’s section 172 statement can be found in the strategic report on pages 50 to 51.
EMPLOYEE ENGAGEMENT Details of how the Company engages with its workforce can be found in the strategic report on pages 30 to 31.
MODERN SLAVERY STATEMENT The Company has approved and published on its website its modern slavery statement in accordance with the Modern Slavery Act 2015. www.heliostowers.com/modern-slavery-statement/
ANTI-DISCRIMINATION POLICY The Company’s Anti-Discrimination policy applies to all Group staff (including non-permanent workers) as well as contractors, consultants and any other workers and provides a zero tolerance for any unlawful discrimination when a person is harassed or treated arbitrarily or differently due to a relevant protected characteristic. The Company encourages all its workforce to report any instance of discrimination which they witness or which comes to their attention and makes it clear that selection for employment, promotion, training or any other benefit will be on the basis of aptitude and ability only. The policy is reviewed periodically to take account of legislative changes.
GREENHOUSE GAS EMISSIONS Details of the Company’s greenhouse gas emissions can be found in the sustainability section on page 35 of the strategic report.

98
Helios Towers plcAnnual Report and Financial Statements 2019
CONTRACTS OF SIGNIFICANCEThe Company is required to disclose any significant agreements that take effect, alter or terminate on a change of control of the Company following a successful take-over bid.
The Company has committed debt facilities and a $600m listed bond, all of which are directly or indirectly subject to change of control provisions, albeit the facilities do not necessarily require mandatory prepayment on a change of control.
The Shareholders’ Agreement, details of which are set out on page 64, will terminate either if: (i) the shares of the Company cease to be listed on the premium listing segment of the Official List and traded on the London Stock Exchange; (ii) no Founding Shareholder holds 3% or more of the shares of the Company; or (iii) there is only one Founding Shareholder who holds 3% or more of the shares in the Company and none of Quantum Strategic Partners, Ltd, Lath Holdings Ltd or Millicom Holding B.V. holds 10% or more of the shares of the Company.
If there is a takeover or other change of control (usually excluding an internal reorganisation), outstanding awards under the Group’s incentive plans vest or become exercisable, to the extent that any performance conditions (if applicable) have been met, and subject to time pro-rating (if applicable) unless determined otherwise by the Board in its discretion and in accordance with the rules of the plans. In certain circumstances, the Board may decide (with the consent of the acquiring company) that outstanding awards under the Employee Incentive Plan 2019 will instead be cancelled in exchange for equivalent awards over shares in the acquiring company.
POLITICAL CONTRIBUTIONSThe Company did not make any donations to political organisations during the year.
FINANCIAL RISKDetails of the Company’s policies on financial risk management and the Company’s exposure to price risk, credit risk, liquidity risk and cash flow risk are outlined in Note 26 to the Financial Statements.
SHAREHOLDERS AND SHARE CAPITALSHARE CAPITALDetails of the Company’s share capital are set out in Note 18 to the Financial Statements. The Company has one class of ordinary share which carries no right to fixed income. Each share carries the right to one vote at general meetings of the Company. The rights attaching to the shares are set out in the Articles of Association.
The Company has established a trust (the “EBT”) in connection with the Company’s share plans, which holds treasury shares (as described in Note 18 to the Financial Statements,) on trust for the benefit of employees and former employees of the Group. The trustee(s) of the EBT (the “Trustee”) may vote or abstain from voting in respect of the Company’s shares held unallocated in the EBT. In respect of any allocated shares, unless the Company requests otherwise, the Trustee must seek voting directions from beneficial holders of the shares and vote in accordance with any directions received (or otherwise abstain from voting).
In accordance with good practice, unless the Company directs otherwise, the–Trustee will waive its entitlement to receive any dividends above a maximum of one pence in aggregate in respect of shares which are the beneficial property of the EBT.
AUTHORITY TO PURCHASE OWN SHARES Provided it has the authority to do so, the Company can make market purchases of its own shares or agree to do so in the future.
On 14 October 2019, the Company was authorised to purchase up to 100,000,000 ordinary shares in the capital of the Company, subject to the minimum price being paid for a share being not less than the nominal value of the share and the maximum price being not more than an amount equal to the higher of (a) 105% of the average of the closing price of the Company’s ordinary shares as derived from the London Stock Exchange Daily Official List for the five business days immediately preceding the day on which such share is contracted to be purchased and (b) the higher of the price of the last independent trade and the highest current bid as stipulated by the European Commission-adopted Regulatory Technical Standards pursuant to article 5(6) of the Market Abuse Regulation.
MAJOR INTERESTS IN SHARESAs at 31 December 2019, the Company had been advised of the following notifiable interests (whether directly or indirectly held) in its voting rights:
Shareholder Number of
voting rights %
Millicom Holding B.V. 161,514,872 16.15Quantum Strategic Partners, Ltd 157,417,444 15.74Lath Holdings Ltd. 118,665,646 11.87ACM Africa Holdings, L.P. 83,857,891 8.39T Rowe Price 52,907,327 5.29RIT Capital Partners plc 51,866,841 5.19
As at 9 March 2020, the Company had not been advised of any changes.
Governance Report
Directors’ report

99
Helios Towers plcAnnual Report and Financial Statements 2019
Overview StrategicReport
GovernanceReport
Financial Statements
ANNUAL GENERAL MEETINGThe Company’s Annual General Meeting (the “AGM”) will be held on Thursday 9 April 2020 at 10.00am at Linklaters LLP, One Silk Street, London EC2Y 8HQ. The Chair, and the Chairs of the Audit and Remuneration Committees, will be present to answer shareholders’ questions. Shareholders will have the ability to appoint a proxy electronically either through our registrar’s website or the CREST service.
Voting at the AGM will be conducted by way of a poll and the results will be announced through the Regulatory News Service and posted on the Company’s website. In planning the business of the AGM, the Board will take account of institutional shareholder guidelines on pre-emption rights, share buy-backs and shareholder rights in relation to general meetings when drafting the usual resolutions dealing with those matters. In each case, resolutions will be presented to the AGM to give the Board flexibility to respond to market developments.
AUDITOR AND AUDITAUDITOR RE-APPOINTMENT A resolution to re-appoint Deloitte LLP as Auditor will be proposed at the Annual General Meeting.
In accordance with the Competition and Markets Authority’s Statutory Audit Services for Large Companies Market Investigation (Mandatory Use of Competitive Tender Processes and Audit Committee Responsibilities) Order 2014, the Company will conduct an audit tender in 2020 and will inform shareholders of the result of the tender, which is expected to be conducted in the second quarter of 2020.
AUDIT INFORMATIONEach of the Directors at the date of the approval of this report confirms that: • so far as they are aware, there is no
relevant audit information of which the Company’s Auditor is unaware; and
• they have taken all reasonable steps as Directors to make themselves aware of any relevant audit information, and to establish that the Company’s Auditor is aware of that information.
This confirmation is given, and should be interpreted, in accordance with the provisions of section 418 of the Companies Act 2006.
LISTING RULE DISCLOSURESThe following disclosures are made under Listing Rule 9.8.4 C along with cross-references indicating where (as applicable) the relevant information is set out in the Annual Report and Financial Statements:• The contracts of significance can be
found in this Directors’ Report on page 98.
The remaining disclosures required by Listing Rule 9.8.4 C are not applicable to the Company.
The Directors’ report has been approved by the Board of Directors of Helios Towers plc.
Signed on behalf of the Board
H.S. Shaw | Company Secretary12 March 2020
Helios Towers plcCompany number: 12134855Registered office: 10th Floor, 5 Merchant Square West, London W2 1AS
100
Helios Towers plcAnnual Report and Financial Statements 2019
Governance Report
Statement of Directors’ responsibilities
STATEMENT OF DIRECTORS’ RESPONSIBILITIES The Directors are responsible for preparing the Annual Report and Financial Statements, and the Group’s Financial Statements, in accordance with applicable United Kingdom law and those International Financial Reporting Standards (IFRS) adopted by the European Union.
The Directors have elected to prepare the Company financial statements in accordance with United Kingdom Generally Accepted Accounting Practice (United Kingdom Accounting Standards and applicable law) including FRS102 “The Financial Reporting Standard Applicable in the UK and Republic of Ireland.”
The Directors are required to prepare Financial Statements for each financial year which present a true and fair view of the financial position of the Company and of the Group, and of the financial performance and cash flows of the Company and of the Group. In preparing those Financial Statements, the Directors are required to:• select suitable accounting policies in
accordance with IAS 8 (‘Accounting policies, changes in accounting estimates and errors’) and then apply them consistently;
• present information, including accounting policies, in a manner that provides relevant, reliable, comparable and understandable information;
• provide additional disclosures when compliance with the specific requirements in IFRS for Group and FRS 102 for Company is insufficient to enable users to understand the impact of particular transactions, other events and conditions on the Company and of the Group’s financial position and financial performance;
• state that the Company has complied with FRS 102 and the Group has complied with IFRS, subject to any material departures disclosed and explained in the Financial Statements; and
• prepare the accounts on a going concern basis unless, having assessed the ability of the Company and the Group to continue as a going concern, management either intends to liquidate the entity or to cease trading, or have no realistic alternative but to do so.
The Directors are responsible for keeping proper accounting records which disclose with reasonable accuracy at any time the financial position of the Company and of the Group, and which enable them to ensure that the Financial Statements comply with the Companies Act 2006 and Article 4 of the IAS Regulation. They are also responsible for safeguarding the assets of the Company and the Group, and hence for taking reasonable steps for the prevention and detection of fraud and other irregularities.
Under applicable UK law and regulations, the Directors are responsible for the preparation of a Directors’ report, Directors’ remuneration report and corporate governance report that comply with that law and regulations. In addition, the Directors are responsible for the maintenance and integrity of the corporate and financial information included on the Company’s website. Legislation in the UK governing the preparation and dissemination of Financial Statements may differ from legislation in other jurisdictions.
Neither the Company nor the Directors accept any liability to any person in relation to the Annual Report and Financial Statements except to the extent that such liability could arise under English law. Accordingly, any liability to a person who has demonstrated reliance on any untrue or misleading statement or omission shall be determined in accordance with section 90A and schedule 10A of the Financial Services and Markets Act 2000.
DIRECTORS’ RESPONSIBILITY STATEMENT UNDER THE UK CORPORATE GOVERNANCE CODEIn accordance with Provision 27 of the 2018 UK Corporate Governance Code, the Directors consider that the Annual Report and Financial Statements, taken as a whole, is fair, balanced and understandable and provides information to enable shareholders to assess the Company’s performance, business model and strategy.
RESPONSIBILITY STATEMENT OF THE DIRECTORS IN RESPECT OF THE ANNUAL REPORT AND FINANCIAL STATEMENTS Each of the Directors whose names are listed on pages 58 to 59 confirm that to the best of their knowledge:a) the Financial Statements, prepared
in accordance with International Financial Reporting Standards as adopted by the European Union, give a true and fair view of the assets, liabilities, financial position and profit and loss of the Company and the undertakings included in the consolidation taken as a whole; and
b) the management report (encompassed within the ‘overview’, ‘strategic report’, ‘performance’ and ‘governance’ sections) includes a fair review of the development and performance of the business, and the position of the Company and the undertakings included in the consolidation taken as a whole, together with a description of the principal risks and uncertainties that they face.
For and on behalf of the Board
Kash Pandya | Chief Executive Officer12 March 2020

101
Helios Towers plcAnnual Report and Financial Statements 2019
Overview StrategicReport
GovernanceReport
Financial Statements
REPORT ON THE AUDIT OF THE FINANCIAL STATEMENTS
1. OPINION
In our opinion:• the financial statements of Helios Towers plc (the ‘Company’) and its subsidiaries (the ‘Group’) give a true and fair view
of the state of the Group’s and of the Company’s affairs as at 31 December 2019 and of the Group’s loss for the year then ended;
• the Group financial statements have been properly prepared in accordance with International Financial Reporting Standards (IFRSs) as adopted by the European Union;
• the Company financial statements have been properly prepared in accordance with United Kingdom Generally Accepted Accounting Practice, including Financial Reporting Standard 102 “The Financial Reporting Standard applicable in the UK and Republic of Ireland”; and
• the financial statements have been prepared in accordance with the requirements of the Companies Act 2006 and, as regards the Group financial statements, Article 4 of the IAS Regulation.
We have audited the financial statements, which comprise:• the consolidated income statement;• the consolidated statement of other comprehensive income;• the consolidated and Company statement of financial position;• the consolidated and Company statements of changes in equity;• the consolidated statement of cash flows;• the related notes to the consolidated Financial Statements 1 to 31 and notes to the Company Financial Statements 1 to 7.
The financial reporting framework that has been applied in the preparation of the Group financial statements is applicable law and IFRSs as adopted by the European Union. The financial reporting framework that has been applied in the preparation of the Company financial statements is applicable law and United Kingdom Accounting Standards, including FRS 102 “The Financial Reporting Standard applicable in the UK and Republic of Ireland” (United Kingdom Generally Accepted Accounting Practice).
2. BASIS FOR OPINIONWe conducted our audit in accordance with International Standards on Auditing (UK) (ISAs (UK)) and applicable law. Our responsibilities under those standards are further described in the auditor’s responsibilities for the audit of the financial statements section of our report.
We are independent of the Group and the Company in accordance with the ethical requirements that are relevant to our audit of the financial statements in the UK, including the Financial Reporting Council’s (the ‘FRC’s’) Ethical Standard as applied to listed public interest entities, and we have fulfilled our other ethical responsibilities in accordance with these requirements. The non-audit services provided to the Group and Company for the year are disclosed in Note 4 to the financial statements. We confirm that the non-audit services prohibited by the FRC’s Ethical Standard were not provided to the Group or the Company.
We believe that the audit evidence we have obtained is sufficient and appropriate to provide a basis for our opinion.
3. SUMMARY OF OUR AUDIT APPROACH
Key audit matters The key audit matters that we identified in the current year were:• Recoverability of receivables• Completeness of tax provisions• Accounting for the SA Towers acquisition• Change of Control Taxes and escrow accounting
Materiality The materiality that we used in the current year was US$6.2m, which was determined on the basis of 3% of Adjusted EBITDA as defined in Note 4 to the Group financial statements.
Scoping We have performed a full scope audit on the Group’s key trading entities in Tanzania, Democratic Republic of the Congo, Ghana and the Republic of the Congo. We have performed specified procedures over the South African trading entity. Based on this assessment, our audit coverage was 99% of Group Adjusted EBITDA and Revenue, and 88% of Net Assets.
Independent auditor’s report to the members of Helios Towers plc

102
Helios Towers plcAnnual Report and Financial Statements 2019
Financial Statements
Independent auditor’s report to the members of Helios Towers plc(continued)
4. CONCLUSIONS RELATING TO GOING CONCERN, PRINCIPAL RISKS AND VIABILITY STATEMENT
We have reviewed the Directors’ statement in Note 2 to the financial statements about whether they considered it appropriate to adopt the going concern basis of accounting in preparing the financial statements and their identification of any material uncertainties to the Group’s and company’s ability to continue to do so over a period of at least twelve months from the date of approval of the financial statements.
We considered as part of our risk assessment the nature of the Group, its business model and related risks including where relevant the impact of Brexit, the requirements of the applicable financial reporting framework and the system of internal control. We evaluated the Directors’ assessment of the Group’s ability to continue as a going concern, including challenging the underlying data and key assumptions used to make the assessment, and evaluated the Directors’ plans for future actions in relation to their going concern assessment.
We are required to state whether we have anything material to add or draw attention to in relation to that statement required by Listing Rule 9.8.6R(3) and report if the statement is materially inconsistent with our knowledge obtained in the audit.
Going concern is the basis of preparation of the financial statements that assumes an entity will remain in operation for a period of at least 12 months from the date of approval of the financial statements.
We confirm that we have nothing material to report, add or draw attention to in respect of these matters.
4.2. PRINCIPAL RISKS AND VIABILITY STATEMENTBased solely on reading the Directors’ statements and considering whether they were consistent with the knowledge we obtained in the course of the audit, including the knowledge obtained in the evaluation of the Directors’ assessment of the Group’s and the company’s ability to continue as a going concern, we are required to state whether we have anything material to add or draw attention to in relation to:• the disclosures on pages 47–48 that describe the principal risks, procedures to
identify emerging risks, and an explanation of how these are being managed or mitigated;
• the Directors’ confirmation on page 47 that they have carried out a robust assessment of the principal and emerging risks facing the Group, including those that would threaten its business model, future performance, solvency or liquidity; or
• the Directors’ explanation on page 49 as to how they have assessed the prospects of the Group, over what period they have done so and why they consider that period to be appropriate, and their statement as to whether they have a reasonable expectation that the Group will be able to continue in operation and meet its liabilities as they fall due over the period of their assessment, including any related disclosures drawing attention to any necessary qualifications or assumptions.
We are also required to report whether the Directors’ statement relating to the prospects of the Group required by Listing Rule 9.8.6R(3) is materially inconsistent with our knowledge obtained in the audit.
Viability means the ability of the group to continue over the time horizon considered appropriate by the Directors.
We confirm that we have nothing material to report, add or draw attention to in respect of the Directors’ disclosure of principal risks and viability.

103
Helios Towers plcAnnual Report and Financial Statements 2019
Overview StrategicReport
GovernanceReport
Financial Statements
5. KEY AUDIT MATTERSKey audit matters are those matters that, in our professional judgement, were of most significance in our audit of the financial statements of the current period and include the most significant assessed risks of material misstatement (whether or not due to fraud) that we identified. These matters included those, which had the greatest effect on: the overall audit strategy, the allocation of resources in the audit; and directing the efforts of the engagement team.
These matters were addressed in the context of our audit of the financial statements as a whole, and in forming our opinion thereon, and we do not provide a separate opinion on these matters
5.1. RECOVERABILITY OF RECEIVABLES
Key audit matter description
The Group’s customer base is comprised of Mobile Network Operators (MNOs) and other fixed wireless operators. We have identified a risk of recoverability of balances receivable from both smaller operators, who may have a higher liquidity risk and where historically management have experienced recoverability issues, and specific receivable balances from larger operators where there is evidence of dispute with the customer.
IFRS 9 Financial Instruments, requires management to record an impairment against receivable balances (expected credit losses) based on unbiased forward-looking information; there is judgment involved in determining these impairment charges and hence, we considered this to be a key audit matter for the audit. As at 31 December 2019, the Group had trade receivables totalling US$129.3m. The Group has recognised an impairment charge of US$6.4m against these receivables. Further information is set out on pages 135 to 136 of the financial statements and this represents a significant matter considered by the Audit Committee on page 70.
How the scope of our audit responded to the key audit matter
In responding to this key audit matter, we obtained an understanding of management’s controls relevant to the identification of receivables at risk of default, assessing their recoverability, and determining appropriate levels of impairment.
We challenged management on their impairment policy to assess whether their judgements regarding the recoverability of receivables were reasonable and completed the following audit procedures:• identified receivables which may be under dispute or may not be recoverable due to customer
cash flow issues, based on a review of aged items and discussions with Group and local management;
• sent balance confirmation letters to customers to confirm validity of receivables at year end, and obtained relevant contracts and customer approved invoices where confirmation letters from customers were not received;
• obtained evidence of cash received post year end to confirm the recoverability of amounts receivable at the year end;
• obtained other supporting evidence available to assess recoverability; and• assessed management’s impairment calculation for compliance with the requirements of IFRS 9
Financial Instruments.
Key observations We are satisfied that the inputs and assumptions applied in management’s impairment calculation were reasonable and that the overall estimate is appropriate. However, as discussed in the audit committee report on page 70, we identified an immaterial uncorrected misstatement relating to the provision for a specific doubtful debt.
5.2. COMPLETENESS OF TAX PROVISIONS
Key audit matter description
The Group operates in a variety of tax jurisdictions within Africa. Historically, there have been a number of tax investigations and inspections by local tax authorities within these jurisdictions, the findings of which could result in the imposition of fines and penalties. We note there is often judgement required when applying the tax laws within these jurisdictions and therefore we consider the completeness of tax provisions to be a key audit matter. Similarly, the Audit Committee has also raised taxation as a significant matter for consideration on page 69 of the annual report and Note 27 describes several tax related contingent liabilities.

104
Helios Towers plcAnnual Report and Financial Statements 2019
Financial Statements
Independent auditor’s report to the members of Helios Towers plc(continued)
5.2. COMPLETENESS OF TAX PROVISIONS CONTINUED
How the scope of our audit responded to the key audit matter
In responding to this key audit matter, we obtained an understanding of management’s controls relevant to the assessment of required provisions in respect of existing tax investigations and inspections.
We also tested the completeness of the Group’s tax provision by completing the following procedures:• held discussions with local management, including finance managers, financial controllers and
tax advisors, to further understand current tax matters and the extent of communications with local tax authorities during the year;
• reviewed related correspondence between the Group and the local tax authorities to corroborate management’s stated positions;
• reviewed supporting calculations for the tax provision/accrual and assessed the adequacy thereof based on the information obtained above;
• involved tax specialists in Africa to audit key judgements within the tax provisions/accruals, and worked with a tax specialist at the Group level to review the Group’s overall tax position; and
• assessed the completeness and accuracy of disclosures made in the annual report in respect of tax investigations and inspections in accordance with IAS 37, Provisions Contingent Liabilities and Contingent Assets.
Key observations We determined that the provisions held by management were reasonable, did not identify any additional cases requiring further consideration and provision, and are satisfied that the tax related contingent liabilities are appropriately disclosed in Note 27.
5.3. ACCOUNTING FOR THE SA TOWERS ACQUISITION
Key audit matter description
The Group completed the acquisition of a South African subsidiary SA Towers on 30 April 2019. Management have identified and recognised acquired intangible assets comprised of customer contracts (US$3.4m), customer relationships (US$7.0m) and non-compete intangibles of (US$1.1m). The valuation of acquired tangible and intangible assets requires the determination of estimates and the exercise of judgement, as does the related accounting under IFRS3, Business Combinations. The Audit Committee also identified this transaction as a significant area of estimation and judgement as disclosed on page 69 of the annual report. The associated accounting and disclosures are made within the annual report in Note 30.
How the scope of our audit responded to the key audit matter
In responding to this key audit matter, we obtained an understanding of management’s controls relevant to the acquisition accounting, in particular the identification and measurement of acquired intangibles.
Furthermore, we completed the following procedures over the related accounting and disclosures within the financial statements:• performed substantive tests of detail to establish the existence, completeness and accuracy of
opening balance sheet items; • involved internal specialists to challenge and test appropriateness of the valuation model used
by management, and the key judgements and assumptions made in relation to the fair value of the acquired assets and liabilities, including attributed economic useful lives, through comparison with external economic benchmarking data;
• challenged management’s review of post period-end trading of the acquired business and their assessment of potential impairment indicators;
• evaluated the appropriateness and completeness of information included in the acquisition accounting models based on our cumulative knowledge of the business driven by our review of trading plans, strategic initiatives, board minutes, together with our wider industry knowledge; and
• audited the fair value adjustments and disclosures made by management in line with IFRS 3, Business Combinations.

105
Helios Towers plcAnnual Report and Financial Statements 2019
Overview StrategicReport
GovernanceReport
Financial Statements
Key observations We are satisfied that the acquired intangible assets identified by management and that the basis of measurement used is appropriate, the estimates and judgements made appear to be within a reasonable range and that the associated accounting and disclosures made within the annual report in Note 30 comply with IFRS 3, Business Combinations.
5.4. CHANGE OF CONTROL TAXES AND ESCROW ACCOUNTING
Key audit matter description
On 15 October 2019, Helios Towers plc completed an initial public offering (‘IPO’) and listed on the London stock exchange, thus impacting the ultimate beneficial ownership of the Group.
In certain countries in which the Group operates a change of more than 50 per cent of the ultimate beneficial ownership of the relevant local Group company over a three-year period may give rise to the imposition of Change of Control Taxes on the local subsidiary.
To provide for the estimated tax liability, a proportion of the net proceeds raised through the IPO was retained in an escrow account to be held until such time as the Directors are satisfied all material amounts have been settled or the applicable statute of limitations has expired.
The timing of recognition, valuation and disclosure of the Change of Control Taxes liabilities is highly judgemental, for which the Group has appointed third-party tax and valuation specialists. As such, we have identified this as a key audit matter. The Audit Committee report on page 70 makes similar reference to this being a significant reporting judgement and estimate.
How the scope of our audit responded to the key audit matter
In responding to this key audit matter, we tested obtained an understanding of management’s controls relevant to the IPO accounting, in particular the identification and measurement of expected Change of Control Taxes liabilities, and associated disclosures in the annual report.
We tested the recognition and disclosure of Change of Control Taxes and escrow balances by completing the following procedures:• reviewed management’s overall assessment of any potential Change of Control Taxes liability,
challenging management to obtain an external tax opinion from their advisers to confirm the position taken by the company, and worked with internal Group and local tax specialists to assess the reasonableness of this opinion;
• reviewed related correspondence between management and the relevant tax authorities and used this information to further assess the quantification and likelihood of related liabilities arising;
• assessed the accounting of the escrow account both prior to and in the event of any liability materialising; and
• assessed the completeness and accuracy of disclosures made in the annual report in respect of the Change of Control Taxes.
Key observations We concur with the position taken by management and determined that the provisions and disclosures were appropriate.

106
Helios Towers plcAnnual Report and Financial Statements 2019
6. OUR APPLICATION OF MATERIALITY6.1. MATERIALITYWe define materiality as the magnitude of misstatement in the financial statements that makes it probable that the economic decisions of a reasonably knowledgeable person would be changed or influenced. We use materiality both in planning the scope of our audit work and in evaluating the results of our work.
Based on our professional judgement, we determined materiality for the financial statements as a whole as follows:
Group Financial Statements Company Financial Statements
Materiality $6,200,000 $2,480,000
Basis for determining materiality
Materiality has been determined by considering different measures including adjusted EBITDA, as defined by management in Note 4 to the financial statements, and revenue.
Company materiality has been determined as 1% of net assets, which is capped at 40% of Group materiality.
Rationale for the benchmark applied
We believe that using a materiality based on these benchmarks reflects the underlying performance of the Group and are key performance measures used by investors, and have used professional judgement in determining a blended measure. In calculating an adjusted EBITDA measure figure, exceptional items have been removed as these are not reflective of the underlying performance of the Group.
Materiality represents approximately 3.0% of adjusted EBITDA, 1.6% of revenue, and less than 1% of Net Assets.
The Company acts principally as a holding company and therefore net assets is a key measure for this business.
6.2. PERFORMANCE MATERIALITYWe set performance materiality at a level lower than materiality to reduce the probability that, in aggregate, uncorrected and undetected misstatements exceed the materiality for the financial statements as a whole. Group performance materiality was set at 70% of Group materiality for the 2019 audit. In determining performance materiality, we primarily considered our risk assessment of the Group’s overall control environment, the history of aggregated prior period adjustments and a recognition of the fact that there has not been any turnover of key management or accounting personnel in the year. We have also taken into consideration the Group’s centralisation of the finance function in the UK to ensure a uniform approach to reconciliations and the year end close process.
6.3. ERROR REPORTING THRESHOLDWe agreed with the Audit Committee that we would report to the Committee all audit differences in excess of US$310,000, as well as differences below that threshold that, in our view, warranted reporting on qualitative grounds. We also report to the Audit Committee on disclosure matters that we identified when assessing the overall presentation of the financial statements.
Financial Statements
Independent auditor’s report to the members of Helios Towers plc(continued)
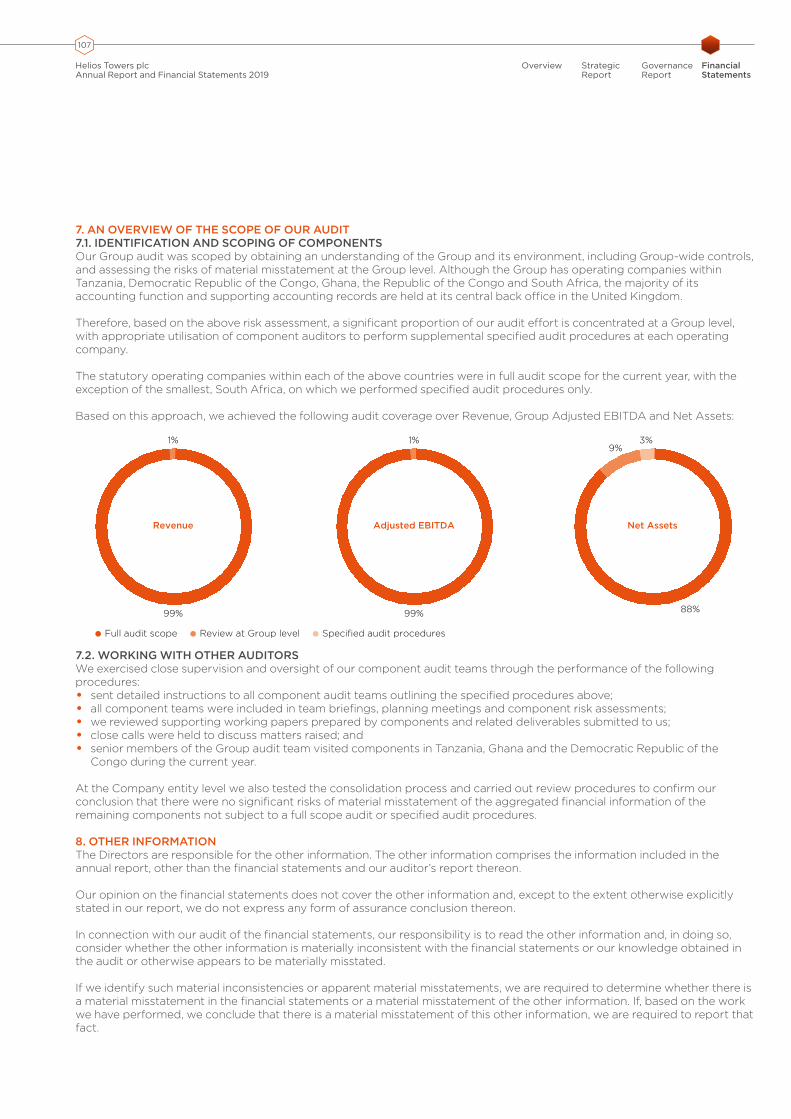
107
Helios Towers plcAnnual Report and Financial Statements 2019
Overview StrategicReport
GovernanceReport
Financial Statements
7. AN OVERVIEW OF THE SCOPE OF OUR AUDIT7.1. IDENTIFICATION AND SCOPING OF COMPONENTSOur Group audit was scoped by obtaining an understanding of the Group and its environment, including Group-wide controls, and assessing the risks of material misstatement at the Group level. Although the Group has operating companies within Tanzania, Democratic Republic of the Congo, Ghana, the Republic of the Congo and South Africa, the majority of its accounting function and supporting accounting records are held at its central back office in the United Kingdom.
Therefore, based on the above risk assessment, a significant proportion of our audit effort is concentrated at a Group level, with appropriate utilisation of component auditors to perform supplemental specified audit procedures at each operating company.
The statutory operating companies within each of the above countries were in full audit scope for the current year, with the exception of the smallest, South Africa, on which we performed specified audit procedures only.
Based on this approach, we achieved the following audit coverage over Revenue, Group Adjusted EBITDA and Net Assets:
Revenue
99%
1%
Adjusted EBITDA
99%
1%
Net Assets
88%
3% 9%
Full audit scope
Review at Group level
Specified audit procedures
7.2. WORKING WITH OTHER AUDITORSWe exercised close supervision and oversight of our component audit teams through the performance of the following procedures: • sent detailed instructions to all component audit teams outlining the specified procedures above;• all component teams were included in team briefings, planning meetings and component risk assessments;• we reviewed supporting working papers prepared by components and related deliverables submitted to us;• close calls were held to discuss matters raised; and • senior members of the Group audit team visited components in Tanzania, Ghana and the Democratic Republic of the
Congo during the current year.
At the Company entity level we also tested the consolidation process and carried out review procedures to confirm our conclusion that there were no significant risks of material misstatement of the aggregated financial information of the remaining components not subject to a full scope audit or specified audit procedures.
8. OTHER INFORMATIONThe Directors are responsible for the other information. The other information comprises the information included in the annual report, other than the financial statements and our auditor’s report thereon.
Our opinion on the financial statements does not cover the other information and, except to the extent otherwise explicitly stated in our report, we do not express any form of assurance conclusion thereon.
In connection with our audit of the financial statements, our responsibility is to read the other information and, in doing so, consider whether the other information is materially inconsistent with the financial statements or our knowledge obtained in the audit or otherwise appears to be materially misstated.
If we identify such material inconsistencies or apparent material misstatements, we are required to determine whether there is a material misstatement in the financial statements or a material misstatement of the other information. If, based on the work we have performed, we conclude that there is a material misstatement of this other information, we are required to report that fact.

108
Helios Towers plcAnnual Report and Financial Statements 2019
In this context, matters that we are specifically required to report to you as uncorrected material misstatements of the other information include where we conclude that:• Fair, balanced and understandable – the statement given by the Directors that they consider the annual report and
financial statements taken as a whole is fair, balanced and understandable and provides the information necessary for shareholders to assess the Group’s position and performance, business model and strategy, is materially inconsistent with our knowledge obtained in the audit; or
• Audit committee reporting – the section describing the work of the audit committee does not appropriately address matters communicated by us to the audit committee; or
• Directors’ statement of compliance with the UK Corporate Governance Code – the parts of the Directors’ statement required under the Listing Rules relating to the company’s compliance with the UK Corporate Governance Code containing provisions specified for review by the auditor in accordance with Listing Rule 9.8.10R(2) do not properly disclose a departure from a relevant provision of the UK Corporate Governance Code.
We have nothing to report in respect of these matters.
9. RESPONSIBILITIES OF DIRECTORSAs explained more fully in the Directors’ responsibilities statement, the Directors are responsible for the preparation of the financial statements and for being satisfied that they give a true and fair view, and for such internal control as the Directors determine is necessary to enable the preparation of financial statements that are free from material misstatement, whether due to fraud or error.
In preparing the financial statements, the Directors are responsible for assessing the Group’s and the Company’s ability to continue as a going concern, disclosing as applicable, matters related to going concern and using the going concern basis of accounting unless the Directors either intend to liquidate the Group or the Company or to cease operations, or have no realistic alternative but to do so.
10. AUDITOR’S RESPONSIBILITIES FOR THE AUDIT OF THE FINANCIAL STATEMENTSOur objectives are to obtain reasonable assurance about whether the financial statements as a whole are free from material misstatement, whether due to fraud or error, and to issue an auditor’s report that includes our opinion. Reasonable assurance is a high level of assurance, but is not a guarantee that an audit conducted in accordance with ISAs (UK) will always detect a material misstatement when it exists. Misstatements can arise from fraud or error and are considered material if, individually or in the aggregate, they could reasonably be expected to influence the economic decisions of users taken on the basis of these financial statements.
Details of the extent to which the audit was considered capable of detecting irregularities, including fraud and non-compliance with laws and regulations are set out below.
A further description of our responsibilities for the audit of the financial statements is located on the FRC’s website at: www.frc.org.uk/auditorsresponsibilities. This description forms part of our auditor’s report.
11. EXTENT TO WHICH THE AUDIT WAS CONSIDERED CAPABLE OF DETECTING IRREGULARITIES, INCLUDING FRAUDWe identify and assess the risks of material misstatement of the financial statements, whether due to fraud or error, and then design and perform audit procedures responsive to those risks, including obtaining audit evidence that is sufficient and appropriate to provide a basis for our opinion.
11.1. IDENTIFYING AND ASSESSING POTENTIAL RISKS RELATED TO IRREGULARITIESIn identifying and assessing risks of material misstatement in respect of irregularities, including fraud and non-compliance with laws and regulations, we considered the following:• the nature of the industry and sector, control environment and business performance including the design of the Group’s
remuneration policies, key drivers for Directors’ remuneration, bonus levels and performance targets;• results of our enquiries of management, internal compliance, and the audit committee about their own identification and
assessment of the risks of irregularities; • any matters we identified having obtained and reviewed the Group’s documentation of their policies and procedures
relating to:– identifying, evaluating and complying with laws and regulations and whether they were aware of any instances of
non-compliance;– detecting and responding to the risks of fraud and whether they have knowledge of any actual, suspected or alleged
fraud;– the internal controls established to mitigate risks of fraud or non-compliance with laws and regulations;
• the matters discussed among the audit engagement team including significant component audit teams and involving relevant internal specialists, including tax, valuations, forensic and IT specialists regarding how and where fraud might occur in the financial statements and any potential indicators of fraud.
Financial Statements
Independent auditor’s report to the members of Helios Towers plc(continued)

109
Helios Towers plcAnnual Report and Financial Statements 2019
Overview StrategicReport
GovernanceReport
Financial Statements
As a result of these procedures, we considered the opportunities and incentives that may exist within the organisation for fraud and identified the greatest potential for fraud in completeness of tax provisions, revenue recognition, petty cash or small asset misappropriation and bribery and kickbacks. In common with all audits under ISAs (UK), we are also required to perform specific procedures to respond to the risk of management override.
We also obtained an understanding of the legal and regulatory frameworks that the Group operates in, focusing on provisions of those laws and regulations that had a direct effect on the determination of material amounts and disclosures in the financial statements. The key laws and regulations we considered in this context included the UK Companies Act, Listing Rules and tax legislation.
In addition, we considered provisions of other laws and regulations that do not have a direct effect on the financial statements but compliance with which may be fundamental to the Group’s ability to operate or to avoid a material penalty. These included the Group’s adherence to telecommunication and environmental regulations applicable to the Group (including its components) and the sector in which it operates.
11.2. AUDIT RESPONSE TO RISKS IDENTIFIEDAs a result of performing the above, we identified the completeness of tax provisions as a key audit matter related to the potential risk of fraud or non-compliance with laws and regulations. The key audit matters section of our report explains the matter in more detail and also describes the specific procedures we performed in response to this key audit matter.
In addition to the above, our procedures to respond to risks identified included the following:• reviewing the financial statement disclosures and testing to supporting documentation to assess compliance with
provisions of relevant laws and regulations described as having a direct effect on the financial statements;• enquiring of management, the audit committee and in-house legal counsel concerning actual and potential litigation and
claims;• performing analytical procedures to identify any unusual or unexpected relationships that may indicate risks of material
misstatement due to fraud;• reading minutes of meetings of those charged with governance, reviewing internal audit reports and reviewing
correspondence with relevant tax authorities;• in addressing the risk of fraud through management override of controls, testing the appropriateness of journal entries and
other adjustments; assessing whether the judgements made in making accounting estimates are indicative of a potential bias; and evaluating the business rationale of any significant transactions that are unusual or outside the normal course of business;
• in addressing the risks of fraud in petty cash or small asset misappropriation and bribery and kickbacks, performing additional audit procedures including further tests of detail on unusual transactions, reviewing the Group’s whistleblowing hotline and increasing our challenge to management on how the Group addresses the risk of fraud or non-compliance with laws and regulations;
• in addressing the risk of fraud in revenue recognition, for all material customers obtaining underlying contracts and recalculating expected revenue balances based on the contractual terms.
We also communicated relevant identified laws and regulations and potential fraud risks to all engagement team members including internal specialists and significant component audit teams, and remained alert to any indications of fraud or non-compliance with laws and regulations throughout the audit.
REPORT ON OTHER LEGAL AND REGULATORY REQUIREMENTS
12. OPINIONS ON OTHER MATTERS PRESCRIBED BY THE COMPANIES ACT 2006
In our opinion the part of the Directors’ remuneration report to be audited has been properly prepared in accordance with the Companies Act 2006.
In our opinion, based on the work undertaken in the course of the audit:• the information given in the strategic report and the Directors’ report for the financial year for which the financial
statements are prepared is consistent with the financial statements; and• the strategic report and the Directors’ report have been prepared in accordance with applicable legal requirements.
In the light of the knowledge and understanding of the Group and the Company and their environment obtained in the course of the audit, we have not identified any material misstatements in the strategic report or the Directors’ report.
110
Helios Towers plcAnnual Report and Financial Statements 2019
13. MATTERS ON WHICH WE ARE REQUIRED TO REPORT BY EXCEPTION13.1. ADEQUACY OF EXPLANATIONS RECEIVED AND ACCOUNTING RECORDSUnder the Companies Act 2006 we are required to report to you if, in our opinion:• we have not received all the information and explanations we require for our audit; or• adequate accounting records have not been kept by the Company, or returns adequate for our audit have not been
received from branches not visited by us; or• the Company financial statements are not in agreement with the accounting records and returns.
We have nothing to report in respect of these matters.
13.2. DIRECTORS’ REMUNERATIONUnder the Companies Act 2006 we are also required to report if in our opinion certain disclosures of Directors’ remuneration have not been made or the part of the Directors’ remuneration report to be audited is not in agreement with the accounting records and returns.
We have nothing to report in respect of these matters.
14. OTHER MATTERS14.1. AUDITOR TENUREThe Company was incorporated on 1 August 2019. We were appointed on 1 October 2019 to audit the financial statements for the period ending 31 December 2019 and subsequent financial periods; this was just prior to the listing of the Company on the London Stock Exchange.
The period of total uninterrupted engagement including previous renewals and reappointments of the firm is 1 year, covering the period ending 31 December 2019. However, we were appointed on 18 November 2010 for other Group entities (including the former Company Helios Towers, Ltd) to audit the financial statements for the year ending 31 December 2010. The period of total uninterrupted engagement including previous renewals and reappointments of the firm is 10 years, covering the years ending 31 December 2010 to 31 December 2019.
14.2. CONSISTENCY OF THE AUDIT REPORT WITH THE ADDITIONAL REPORT TO THE AUDIT COMMITTEEOur audit opinion is consistent with the additional report to the audit committee we are required to provide in accordance with ISAs (UK).
15. USE OF OUR REPORTThis report is made solely to the company’s members, as a body, in accordance with Chapter 3 of Part 16 of the Companies Act 2006. Our audit work has been undertaken so that we might state to the company’s members those matters we are required to state to them in an auditor’s report and for no other purpose. To the fullest extent permitted by law, we do not accept or assume responsibility to anyone other than the company and the company’s members as a body, for our audit work, for this report, or for the opinions we have formed.
Ryan Duffy For and on behalf of Deloitte LLPStatutory AuditorBirmingham12 March 2020
Financial Statements
Independent auditor’s report to the members of Helios Towers plc(continued)

111
Helios Towers plcAnnual Report and Financial Statements 2019
Overview StrategicReport
GovernanceReport
Financial Statements
Note2019
US$m2018
US$m
Revenue 3 387.8 356.0Cost of sales (261.9) (255.8)
Gross profit 125.9 100.2
Administrative expenses (119.4) (91.1)Loss on disposal of property, plant and equipment (11.0) (5.8)
Operating (loss)/profit 5 (4.5) 3.3
Interest receivable 8 0.7 1.0Gain/(loss) on derivative financial instruments 24 33.9 (16.8)Finance costs 9 (104.9) (107.0)
Loss before tax (74.8) (119.5)
Tax expense 10 (61.8) (4.4)
Loss after tax for the year (136.6) (123.9)
Loss attributable to:Owners of the Company (135.9) (123.9)Non-controlling interest (0.7) –
Loss for the year (136.6) (123.9)
Loss per share:Basic and diluted loss per share (cents) 29 (15) (14)
All activities relate to continuing operations.
The accompanying notes form an integral part of these Financial Statements.
Consolidated Income Statement For the year ended 31 December

112
Helios Towers plcAnnual Report and Financial Statements 2019
2019US$m
2018US$m
Loss after tax for the year (136.6) (123.9)Other comprehensive loss:Items that may be reclassified subsequently to profit and loss (net of tax):Exchange differences on translation of foreign operations (1.0) (2.3)
Total comprehensive loss for the year (137.6) (126.2)
Total comprehensive loss attributable to:Owners of the Company (137.0) (126.2)Non-controlling interest (0.6) –
Total comprehensive loss for the year (137.6) (126.2)
The accompanying notes form an integral part of these Financial Statements.
Financial Statements
Consolidated Statement of other comprehensive incomeFor the year ended 31 December

113
Helios Towers plcAnnual Report and Financial Statements 2019
Overview StrategicReport
GovernanceReport
Financial Statements
Assets Note2019
US$m2018
US$m
Non-current assetsIntangible assets 11 28.4 12.4Property, plant and equipment 12a 631.9 676.6Right-of-use assets 12b 108.2 103.8Investments 13 – 0.1Derivative financial assets 26 41.0 7.1
809.5 800.0
Current assetsInventories 14 9.3 10.3Trade and other receivables 15 166.5 102.3Prepayments 16 14.1 16.4Cash and cash equivalents 17 221.1 89.0
411.0 218.0
Total assets 1,220.5 1,018.0
Equity and liabilitiesEquityIssued capital and reservesShare capital 18 12.8 909.2Share premium 18 – 187.0
Stated capital 12.8 1,096.2Other reserves (87.0) (12.8)Share-based payments reserves 19.6 –Treasury shares (4.4) –Translation reserve (82.7) (81.7)Retained earnings 317.6 (880.0)
Equity attributable to owners 175.9 121.7Non-controlling interest (0.6) –
Total equity 175.3 121.7
Current liabilitiesTrade and other payables 19 222.7 149.8Short-term lease liabilities 21 21.4 19.6Contingent consideration 30 3.6 –Loans 20 19.2 17.3
266.9 186.7
Non-current liabilitiesDeferred tax liabilities 10 3.1 –Contingent consideration 30 5.9 –Long-term lease liabilities 21 104.2 98.8Loans 20 665.1 610.8
778.3 709.6
Total liabilities 1,045.2 896.3
Total equity and liabilities 1,220.5 1,018.0
These Financial Statements were approved and authorised for issue by the Board on 12 March 2020 and signed on its behalf by:
Kash Pandya Tom Greenwood
The accompanying notes form an integral part of these Financial Statements.
Consolidated Statement of financial positionAs at 31 December
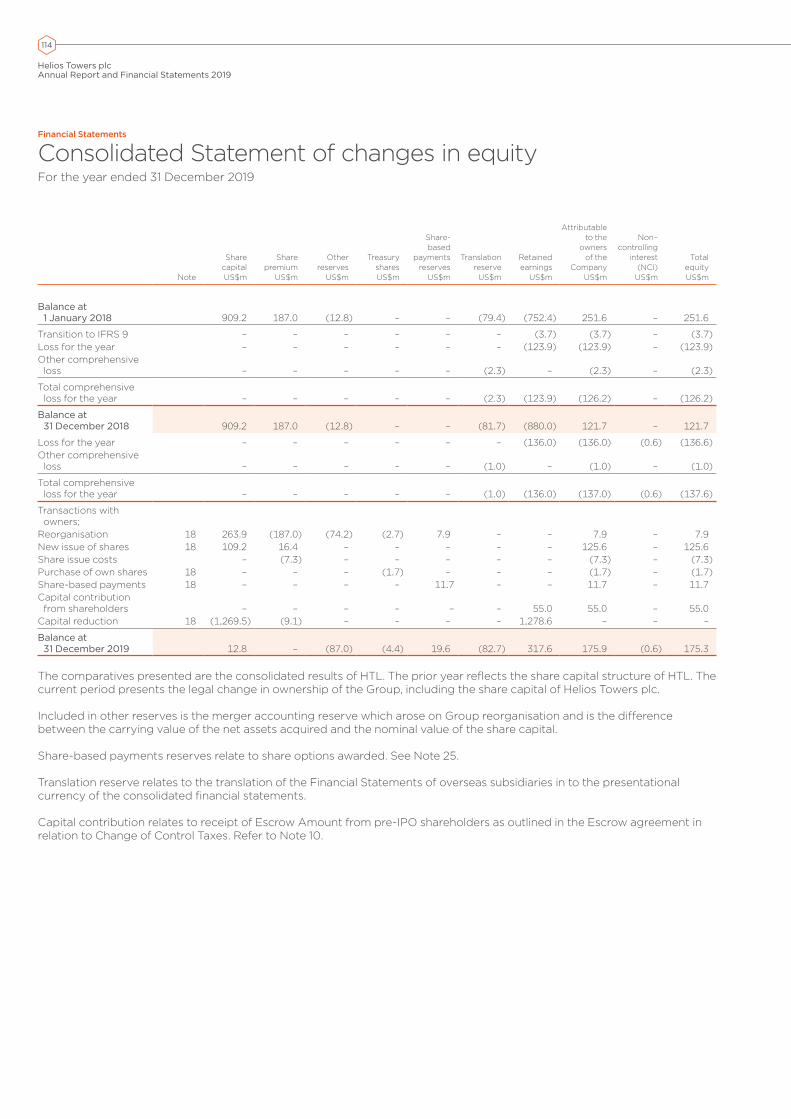
114
Helios Towers plcAnnual Report and Financial Statements 2019
Note
SharecapitalUS$m
Share premium
US$m
Other reserves
US$m
Treasury shares US$m
Share-based
payments reserves
US$m
Translation reserve
US$m
Retained earnings
US$m
Attributable to the
owners of the
CompanyUS$m
Non–controlling
interest (NCI)
US$m
Total equityUS$m
Balance at 1 January 2018 909.2 187.0 (12.8) – – (79.4) (752.4) 251.6 – 251.6
Transition to IFRS 9 – – – – – – (3.7) (3.7) – (3.7)Loss for the year – – – – – – (123.9) (123.9) – (123.9)Other comprehensive loss – – – – – (2.3) – (2.3) – (2.3)
Total comprehensive loss for the year – – – – – (2.3) (123.9) (126.2) – (126.2)
Balance at 31 December 2018 909.2 187.0 (12.8) – – (81.7) (880.0) 121.7 – 121.7
Loss for the year – – – – – – (136.0) (136.0) (0.6) (136.6)Other comprehensive loss – – – – – (1.0) – (1.0) – (1.0)
Total comprehensive loss for the year – – – – – (1.0) (136.0) (137.0) (0.6) (137.6)
Transactions with owners;
Reorganisation 18 263.9 (187.0) (74.2) (2.7) 7.9 – – 7.9 – 7.9New issue of shares 18 109.2 16.4 – – – – – 125.6 – 125.6Share issue costs – (7.3) – – – – – (7.3) – (7.3)Purchase of own shares 18 – – – (1.7) – – – (1.7) – (1.7)Share-based payments 18 – – – – 11.7 – – 11.7 – 11.7Capital contribution from shareholders – – – – – – 55.0 55.0 – 55.0
Capital reduction 18 (1,269.5) (9.1) – – – – 1,278.6 – – –
Balance at 31 December 2019 12.8 – (87.0) (4.4) 19.6 (82.7) 317.6 175.9 (0.6) 175.3
The comparatives presented are the consolidated results of HTL. The prior year reflects the share capital structure of HTL. The current period presents the legal change in ownership of the Group, including the share capital of Helios Towers plc.
Included in other reserves is the merger accounting reserve which arose on Group reorganisation and is the difference between the carrying value of the net assets acquired and the nominal value of the share capital.
Share-based payments reserves relate to share options awarded. See Note 25.
Translation reserve relates to the translation of the Financial Statements of overseas subsidiaries in to the presentational currency of the consolidated financial statements. Capital contribution relates to receipt of Escrow Amount from pre-IPO shareholders as outlined in the Escrow agreement in relation to Change of Control Taxes. Refer to Note 10.
Financial Statements
Consolidated Statement of changes in equityFor the year ended 31 December 2019

115
Helios Towers plcAnnual Report and Financial Statements 2019
Overview StrategicReport
GovernanceReport
Financial Statements
Note2019
US$m2018
US$m
Cash flows from operating activitiesLoss before tax (74.8) (119.5)Adjustments for:Gain/(loss) on derivative financial instruments 24 (33.9) 16.8Finance costs 9 104.9 107.0Interest receivable 8 (0.7) (1.0)Depreciation and amortisation 11, 12 147.2 141.2Loss on disposal of property, plant and equipment 4 11.0 5.8Movement in working capital:Decrease/(increase) in inventories 1.0 (1.0)(Increase)/decrease in trade and other receivables (56.0) 9.3Decrease in prepayments (1.0) (3.8)Increase/(decrease) in trade and other payables 27.6 (21.0)Cash generated from operations 125.3 133.8Interest paid (74.4) (69.9)Tax paid (13.3) (2.9)Net cash generated from operating activities 37.6 61.0Cash flows from investing activitiesPayments to acquire property, plant and equipment (95.2) (103.0)Payments to acquire intangible assets (9.2) (3.2)Acquisitions net of cash received 30 (10.6) –Proceeds on disposal on assets 0.4 0.1Interest received 0.7 1.0Net cash used in investing activities (113.9) (105.1)Cash flows from financing activitiesGross proceeds from issue of equity share capital 125.6 –Share issue costs (7.3) –Re-purchase of fully vested options (1.7) –Borrowing drawdowns 50.0 25.0Capital contributions – escrow funds 47.7 –Repayment of lease liabilities (5.4) (10.4)Net cash generated from financing activities 208.9 14.6Net increase/(decrease) in cash and cash equivalents 132.6 (29.5)Foreign exchange on translation movement (0.5) (1.2)Cash and cash equivalents at 1 January 89.0 119.7Cash and cash equivalents at 31 December 221.1 89.0
Consolidated Statement of cash flowsFor the year ended 31 December 2019

116
Helios Towers plcAnnual Report and Financial Statements 2019
1. STATEMENT OF COMPLIANCE AND PRESENTATION OF FINANCIAL STATEMENTSHelios Towers plc, together with its subsidiaries (collectively, “Helios”, “the Group” or “the Company”), is a sub-Saharan independent tower company, with operations across five countries. Helios Towers plc is a public limited company incorporated and domiciled in the UK, and registered under the laws of England & Wales under company number 12134855 with its registered address at 10th Floor, 5 Merchant Square West, London, W2 1AS, United Kingdom on 18 October 2019, the ordinary shares of Helios Towers plc were admitted to the premium listing segment of the Official List of the UK Financial Conduct Authority and trade on the London Stock Exchange Plc’s main market for listed securities.
Prior to the Initial Public Offering (“IPO“), Helios Towers, Ltd (“HTL“) was the Company of the Group for which consolidated Financial Statements were produced. On 15 October 2019 (the date of completion of the IPO, with 18 October 2019 representing admission to trading on the London Stock Exchange), the shareholders of HTL transferred all of their shares in HTL to Helios Towers plc in exchange for ordinary shares of equal value in Helios Towers plc (“Reorganisation“). This resulted in Helios Towers plc becoming the new Company of the Group.
The financial information for the year ended 31 December 2019 (and comparative information for the year ended 31 December 2018) is presented as a continuation of HTL. The Company and entities controlled by the Company are disclosed in Note 13. The principal accounting policies adopted by the Group are set out in Note 2.
2. ACCOUNTING POLICIESBASIS OF PREPARATIONThe Group’s Financial Statements are prepared in accordance with International Financial Reporting Standards as adopted by the European Union (“IFRSs”), taking into account IFRS Interpretations Committee (IFRS IC) interpretations and those parts of the Companies Act 2006 applicable to companies reporting under IFRS. As there were no changes in rights or proportion of control exercised as a result of the Reorganisation involving Helios Towers plc becoming the new holding company of the Group in a share for share exchange, the Financial Statements have been prepared applying the principles of predecessor accounting ownership, this was a common control transaction and therefore outside the scope of IFRS 3.
As a result, the comparatives presented in these Financial Statements are the consolidated results of HTL. The prior year consolidated statement of financial position reflects the share capital structure of HTL. The current period consolidated statement of financial position presents the legal change in ownership of the Group, including the share capital of Helios Towers plc.
The transaction does not meet the definition of a business combination under IFRS 3 Business Combinations and as such, falls outside the scope of that standard. As a consequence, following guidance from IAS 8 Accounting Policies, Changes in Accounting Estimates and Errors, the integration of the Company has been prepared under merger accounting principles. This policy, which does not conflict with IFRS, reflects the economic substance of the transaction. Under these principles, the Group has presented its Financial Statements of the Group as though the current Group structure had always been in place. Accordingly, the results of the combined entities for both the current and prior period are presented as if the Group had been in existence throughout the periods presented, rather than from the restructuring date. The consolidated statement of changes in equity and the additional disclosures in Note 25 explain the impact of the share-for-share exchange and capital reduction in more detail.
In December 2019, the Company completed a court-approved reduction of capital. The purpose of the reduction of capital was to provide distributable reserves which will allow the Company to make future dividend payments. Following the reduction of capital, the number of issued shares and the rights attached to those shares remained unchanged. The nominal value of the ordinary shares in the capital of the Company was reduced by £0.99 from £1.00 to £0.01.
The Financial Statements have been prepared on the historical cost basis, except for the revaluation of certain financial instruments that are measured at fair value at the end of each reporting period, share-based payments which are measured in accordance with IFRS 2. The Financial Statements are presented in United States dollars (US$) and rounded to the nearest hundred thousand (US$0.1 million) except when otherwise indicated. Historical cost is generally based on the fair value of the consideration given in exchange for goods and services.
The principal accounting policies adopted are set out below.
BASIS OF CONSOLIDATIONThe consolidated Financial Statements incorporate the Financial Statements of the Company and entities controlled by the Company (its subsidiaries) made up to 31 December each year. Control is achieved when the Company:• has the power over the investee;• is exposed, or has rights, to variable return from its involvement with the investee; and• has the ability to use its power to affect its returns.
The Company reassesses whether or not it controls an investee if facts and circumstances indicate that there are changes to one or more of the three elements of control listed above.
Financial Statements
Notes to the Financial StatementsFor the year ended 31 December 2019

117
Helios Towers plcAnnual Report and Financial Statements 2019
Overview StrategicReport
GovernanceReport
Financial Statements
2. ACCOUNTING POLICIES (CONTINUED)BASIS OF CONSOLIDATION (CONTINUED)Consolidation of a subsidiary begins when the Company obtains control over the subsidiary and ceases when the Company loses control of the subsidiary. Specifically, the results of subsidiaries acquired or disposed of during the year are included in the consolidated statement of profit or loss and other comprehensive income from the date the Company gains control until the date when the Company ceases to control the subsidiary.
Profit or loss and each component of other comprehensive income are attributed to the owners of the Company and to the non-controlling interests. Total comprehensive income of the subsidiaries is attributed to the owners of the Company and to the non-controlling interests even if this results in the non-controlling interests having a deficit balance.
Where necessary, adjustments are made to the Financial Statements of subsidiaries to bring the accounting policies used into line with the Group’s accounting policies.
All intra-group assets and liabilities, equity, income, expenses and cash flows relating to transactions between the members of the Group are eliminated on consolidation.
Non-controlling interests in subsidiaries are identified separately from the Group’s equity therein. Those interests of non-controlling shareholders that are present ownership interests entitling their holders to a proportionate share of net assets upon liquidation may initially be measured at fair value or at the non-controlling interests’ proportionate share of the fair value of the acquiree’s identifiable net assets. The choice of measurement is made on an acquisition-by-acquisition basis. Other non-controlling interests are initially measured at fair value. Subsequent to acquisition, the carrying amount of non-controlling interests is the amount of those interests at initial recognition plus the non-controlling interests’ share of subsequent changes in equity.
Changes in the Group’s interests in subsidiaries that do not result in a loss of control are accounted for as equity transactions. The carrying amount of the Group’s interests and the non-controlling interests are adjusted to reflect the changes in their relative interests in the subsidiaries. Any difference between the amount by which the non-controlling interests are adjusted and the fair value of the consideration paid or received is recognised directly in equity and attributed to the owners of the Company.
GOING CONCERNThe Directors believe that the Group is well placed to manage its business risks successfully, despite the current uncertain economic outlook in the wider economy. The Group’s forecasts and projections, taking account of reasonably possible changes in trading performance, show that the Group should be able to operate within the level of its current committed facilities. The Directors consider it appropriate to adopt the going concern basis of preparation for the consolidated Financial Statements.
As part of their regular assessment of the Group’s working capital and financing position, the Directors have prepared a detailed trading and cash flow forecast for a period which covers at least 12 months after the date of approval of the consolidated Financial Statements. In assessing the forecast, the Directors have considered:• trading risks presented by the current economic conditions in the operating markets;• the impact of macroeconomic factors, particularly interest rates and foreign exchange rates;• the status of the Group’s financial arrangements;• progress made in developing and implementing cost reduction programmes and operational improvements; and• mitigating actions available should business activities fall behind current expectations, including the deferral of
discretionary overheads and restricting cash outflows.
The Directors have acknowledged the latest guidance on going concern. Management has considered the latest forecasts available and additional sensitivity analysis has been prepared to consider any reduction in anticipated levels of Adjusted EBITDA and operating profit.
NEW ACCOUNTING POLICIES IN 2019During the year ended 31 December 2019, a new accounting policy for business combinations was applied.
BUSINESS COMBINATIONS AND GOODWILLBusiness combinations are accounted for using the acquisition method. The consideration transferred in a business combination is measured at fair value, which is calculated as the sum of the acquisition-date fair values of assets transferred by the Group, liabilities incurred by the Group to the former owners of the acquiree and the equity interest issued by the Group in exchange for control of the acquiree. The identifiable assets, liabilities and contingent liabilities (“identifiable net assets”) are recognised at their fair value at the date of acquisition. Acquisition-related costs are expensed as incurred and included in administrative expenses.
118
Helios Towers plcAnnual Report and Financial Statements 2019
2. ACCOUNTING POLICIES (CONTINUED)At the acquisition date, the identifiable assets acquired and the liabilities assumed are recognised at their fair value at the acquisition date, except that:• deferred tax assets or liabilities and assets or liabilities related to employee benefit arrangements are recognised and
measured in accordance with IAS 12 Income Taxes and IAS 19 Employee Benefits respectively;• liabilities or equity instruments related to share-based payment arrangements of the acquiree or share-based payment
arrangements of the Group entered into to replace share-based payment arrangements of the acquiree are measured in accordance with IFRS 2 Share-Based Payments at the acquisition date (see below); and
• assets (or disposal groups) that are classified as held for sale in accordance with IFRS 5 Non-current Assets Held for Sale and Discontinued Operations are measured in accordance with that Standard.
When the Group acquires a business, it assesses the financial assets and liabilities assumed for appropriate classification and designation in accordance with the contractual terms, economic circumstances and pertinent conditions as at the acquisition date. Goodwill is initially measured at cost, being the excess of the aggregate of the consideration transferred, the amount of any non-controlling interest in the acquire, and the fair value of the acquirer’s previously held equity interest in the acquire (if any) over the net of the fair values of acquired assets and liabilities assumed. If the fair value of the net assets acquired is in excess of the aggregate consideration transferred, the gain is recognised in profit or loss. Goodwill is capitalised as an intangible asset with any impairment in carrying value being charged to the consolidated statement of profit or loss.
If the initial accounting for a business combination is incomplete by the end of the reporting period in which the combination occurs, the Group reports provisional amounts for the items for which the accounting is incomplete. Those provisional amounts are adjusted during the measurement period (a period of no more than 12 months), or additional assets or liabilities are recognised, to reflect new information obtained about facts and circumstances that existed as of the acquisition date that, if known, would have affected the amounts recognised as of that date.
When the consideration transferred by the Group in a business combination includes a contingent consideration arrangement, the contingent consideration is measured at its acquisition date fair value and included as part of the consideration transferred in a business combination. Changes in fair value of the contingent consideration that qualify as measurement period adjustments are adjusted retrospectively, with corresponding adjustments against goodwill. The carrying value of contingent consideration is the present value of those cash flows (when the effect of the time value of money is material).
Measurement period adjustments are adjustments that arise from additional information obtained during the “measurement period” (which cannot exceed one year from the acquisition date) about facts and circumstances that existed at the acquisition date. Subsequently, changes in the fair value of the contingent consideration that do not qualify as measurement period adjustments are recognised in profit or loss, when contingent consideration amounts are remeasured to fair value at subsequent reporting dates. After initial recognition, goodwill is measured at cost less any accumulated impairment losses. For the purpose of impairment testing, goodwill acquired in a business combination is, from the acquisition date, allocated to the cash-generating units (“CGU”) that are expected to benefit from the combination, irrespective of whether other assets or liabilities of the acquiree are assigned to those units.
CGUs to which goodwill has been allocated are tested for impairment annually, or more frequently when there is an indication that the unit may be impaired. If the recoverable amount of the CGU is less than its carrying amount, the impairment loss is allocated first to reduce the carrying amount of any goodwill allocated to the unit and then to the other assets of the unit pro-rata based on the carrying amount of each asset in the unit. Any impairment loss is recognised directly in profit or loss. An impairment loss recognised for goodwill is not able to be reversed in subsequent periods.
On disposal of the relevant CGU, the attributable amount of goodwill is included in the determination of the profit or loss on disposal.
REVENUE RECOGNITIONThe Group applies the five-step approach in IFRS 15 Revenue from Contracts with Customers. Prescriptive guidance in IFRS 15 is followed to deal with specific scenarios. Details of IFRS 15 on Group’s consolidated Financial Statements are described below.
The Group’s accounting policies for its revenue stream are disclosed in detail on the next page.
Financial Statements
Notes to the Financial StatementsFor the year ended 31 December 2019 (continued)
119
Helios Towers plcAnnual Report and Financial Statements 2019
Overview StrategicReport
GovernanceReport
Financial Statements
2. ACCOUNTING POLICIES (CONTINUED)REVENUE RECOGNITION (CONTINUED) The Group recognises revenue from the rendering of tower services provided by utilisation of the Group’s tower infrastructure pursuant to written contracts with its customers. Revenue is measured at the fair value of the consideration received or receivable and represents amounts receivable for services provided in the normal course of business, less VAT and other sales-related taxes. Revenue is reduced for estimated and agreed liquidated damages resulting from failure to meet the agreed service performance levels set out in the contract. The Group provides tower and related services for the utilisation of its tower infrastructure to mobile and other telecommunication operators. Revenue includes fees for the provision of tower infrastructure, power escalations and tower service contracts. Revenue from these services is recognised as the performance obligation is satisfied over time.
Customers are usually billed in advance creating a contract liability which is then recognised as the performance obligation is met over a straight-line basis.
In line with IFRS 15, though multiple performance obligations arise as a result of the provision of these services, the Group considers it reasonable to combine the provision of these tower services into a single performance obligation as this does not impact the ultimate pattern of revenue recognition as they are all recognised over time.
LESSEE ACCOUNTINGThe Group applies IFRS 16 Leases. The Group holds leases primarily on land, buildings and motor vehicles used in the ordinary course of business. Based on the accounting policy applied the Group recognises a right-of-use asset and a lease liability at the commencement date of the contract for all leases conveying the right to control the use of an identified asset for a period of time. The commencement date is the date on which a lessor makes an underlying asset available for use by a lessee. The right-of-use assets are initially measured at cost, which comprises:• the amount of the initial measurement of the lease liability;• any lease payments made at or before the commencement date, less any lease incentives received; and,• any initial direct costs incurred by the lessee.
After the commencement date the right-of-use assets are measured at cost less any accumulated depreciation and any accumulated impairment losses and adjusted for any remeasurement of the lease liability. The Group depreciates the right-of-use asset from the commencement date to the end of the lease term. The lease liability is initially measured at the present value of the lease payments that are not paid at that date. These include:• fixed payments, less any lease incentives receivable; and• variable lease payments that depend on a fixed rate, as at the commencement date. Variable lease payments not included in the initial measurement of the lease liability are recognised in the consolidated statement of profit or loss as they arise. The lease payments are discounted using the incremental borrowing rate at the commencement of the lease contract or modification. Generally it is not possible to determine the interest rate implicit in the land and building leases. The incremental borrowing rate is estimated taking account of the economic environment of the lease, the currency of the lease and the lease term. The lease term determined by the Group comprises:• non-cancellable period of lease contracts;• periods covered by an option to extend the lease if the Group is reasonably certain to exercise that option; and• periods covered by an option to terminate the lease if the Group is reasonably certain not to exercise that option. After the commencement date the Group measures the lease liability by:• increasing the carrying amount to reflect interest on the lease liability;• reducing the carrying amount to reflect lease payments made; and• remeasuring the carrying amount to reflect any reassessment or lease modifications.
120
Helios Towers plcAnnual Report and Financial Statements 2019
2. ACCOUNTING POLICIES (CONTINUED)INTEREST EXPENSE Interest expense is recognised as interest accrues, using the effective interest method, to the net carrying amount of the financial liability.
The effective interest method is a method of calculating the amortised cost of a financial asset/financial liability and of allocating interest income/interest expense over the relevant period. The effective interest rate is the rate that exactly discounts estimated future cash receipts/payments through the expected life of the financial assets/financial liabilities, or, where appropriate, a shorter period.
RETIREMENT BENEFIT COSTS Payments to defined contribution retirement benefit schemes are recognised as an expense when employees have rendered service entitling them to the contributions. Payments made to state-managed retirement benefit schemes are dealt with as payments to defined contribution schemes where the Group’s obligations under the schemes are equivalent to those arising in a defined contribution retirement benefit scheme.
SHARE-BASED PAYMENTSThe Group’s management awards employee share options, from time to time, on a discretionary basis which are subject to vesting conditions. The economic cost of awarding the share options to its employees is recognised as an employee benefit expense in the income statement equivalent to the fair value of the benefit awarded over the vesting period. For further details refer to Note 25.
TAXATIONThe tax expense represents the sum of the tax currently payable and deferred tax.
CURRENT TAXThe tax currently payable is based on taxable profit for the year. Taxable profit differs from net profit as reported in the statement of profit or loss and other comprehensive income because it excludes items of income or expense that are taxable or deductible in other years and it further excludes items that are never taxable or deductible. The Group’s liability for current tax is calculated using tax rates that have been enacted or substantively enacted by the reporting date.
DEFERRED TAXDeferred tax is the tax expected to be payable or recoverable on differences between the carrying amounts of assets and liabilities in the Financial Statements and the corresponding tax bases used in the computation of taxable profit, and is accounted for using the statement of financial position liability method. Deferred tax liabilities are generally recognised for all taxable temporary differences and deferred tax assets are recognised to the extent that it is probable that taxable profits will be available against which deductible temporary differences can be utilised. Such assets and liabilities are not recognised if the temporary difference arises from the initial recognition of goodwill or from the initial recognition (other than in a business combination) of other assets and liabilities in a transaction that affects neither the taxable profit nor the accounting profit.
Deferred tax liabilities are recognised for taxable temporary differences arising on investments in subsidiaries, except where the Group is able to control the reversal of the temporary difference and it is probable that the temporary difference will not reverse in the foreseeable future. Deferred tax assets arising from deductible temporary differences associated with such investments and interests are only recognised to the extent that it is probable that there will be sufficient taxable profits against which to utilise the benefits of the temporary differences and they are expected to reverse in the foreseeable future.
The carrying amount of deferred tax assets is reviewed at each reporting date and reduced to the extent that it is no longer probable that sufficient taxable profits will be available to allow all or part of the asset to be recovered.
Deferred tax is calculated at the tax rates that are expected to apply in the period when the liability is settled or the asset is realised based on tax laws and rates that have been enacted or substantively enacted at the reporting date. Deferred tax is charged or credited in the profit or loss, except when it relates to items charged or credited in other comprehensive income, in which case the deferred tax is also dealt with in other comprehensive income.
The measurement of deferred tax liabilities and assets reflects the tax consequences that would follow from the manner in which the Group expects, at the end of the reporting period, to recover or settle the carrying amount of its assets and liabilities.
Deferred tax assets and liabilities are offset when there is a legally enforceable right to set off current tax assets against current tax liabilities and when they relate to income taxes levied by the same taxation authority and the Group intends to settle its current tax assets and liabilities on a net basis.
CURRENT AND DEFERRED TAX FOR THE YEARCurrent and deferred tax are recognised in the statement of profit or loss, except when they relate to items that are recognised in other comprehensive income or directly in equity, in which case the current and deferred tax are also recognised in other comprehensive income or directly in equity respectively.
Financial Statements
Notes to the Financial StatementsFor the year ended 31 December 2019 (continued)

121
Helios Towers plcAnnual Report and Financial Statements 2019
Overview StrategicReport
GovernanceReport
Financial Statements
2. ACCOUNTING POLICIES (CONTINUED)FOREIGN CURRENCYThe individual Financial Statements of each Group company are presented in the currency of the primary economic environment in which it operates (its functional currency). For the purpose of the consolidated Financial Statements, the results and financial position of each Group company are expressed in United States Dollars (“US$”), which is the functional currency of the Company, and the presentation currency for the consolidated Financial Statements.
In preparing the Financial Statements of the individual companies, transactions in currencies other than the entity’s functional currency (foreign currencies) are recognised at the rates of exchange prevailing on the dates of the transactions. At each reporting date, monetary assets and liabilities that are denominated in foreign currencies are re-translated at the rates prevailing at that date. Non-monetary items carried at fair value that are denominated in foreign currencies are translated at the rates prevailing at the date when the fair value was determined. Non-monetary items that are measured in terms of historical cost in a foreign currency are not re-translated.
For the purpose of presenting consolidated Financial Statements, the assets and liabilities of the Group’s foreign operations are translated at exchange rates prevailing on the reporting date. Income and expense items are translated at the average exchange rates for the period, unless exchange rates fluctuate significantly during that period, in which case the exchange rates at the date of transactions are used. Exchange differences arising, if any, are recognised in other comprehensive income and accumulated in a separate component of equity (attributed to non-controlling interests as appropriate).
On the disposal of a foreign operation (i.e. a disposal of the Group’s entire interest in a foreign operation, or a disposal involving loss of control over a subsidiary that includes a foreign operation, or a partial disposal of an interest in a joint arrangement or an associate that includes a foreign operation of which the retained interest become a financial asset), all of the exchange differences accumulated in a separate component of equity in respect of that operation attributable to the owners of the Company are reclassified to profit or loss.
In addition, in relation to a partial disposal of a subsidiary that includes a foreign operation that does not result in the Group losing control over the subsidiary, the proportionate share of accumulated exchange differences are re-attributed to non-controlling interests and are not recognised in profit or loss. For all other partial disposals (i.e. partial disposals of associates or joint arrangements that do not result in the Group losing significant influence or joint control), the proportionate share of the accumulated exchange differences is reclassified to profit or loss.
PROPERTY, PLANT AND EQUIPMENTItems of property, plant and equipment are stated at cost of acquisition or production cost less accumulated depreciation and impairment losses, if any.
Assets in the course of construction for production, supply or administrative purposes, are carried at cost, less any recognised impairment loss. Cost includes material and labour and professional fees in accordance with the Group’s accounting policy. Depreciation of these assets, on the same basis as other assets, commences when the assets are ready for their intended use.
Freehold land is not depreciated.
Depreciation is charged so as to write off the cost of assets over their estimated useful lives, using the straight-line method, on the following bases:
Site assets – towers Up to 15 yearsSite assets – generators 8 yearsSite assets – plant & machinery 3–5 yearsFixtures and fittings 3 yearsIT equipment 3 yearsMotor vehicles 5 yearsLeasehold improvements 5–10 years
Directly attributable costs of acquiring tower assets are capitalised together with the towers acquired and depreciated over a period of up to 15 years in line with the assets.
An item of property, plant and equipment is derecognised upon disposal or when no future economic benefits are expected to arise from continued use of the asset. Any gain or loss arising on disposal or retirement of an item of property, plant and equipment is determined as the difference between the sale proceeds and the carrying amount of the asset and is recognised in profit and loss.
122
Helios Towers plcAnnual Report and Financial Statements 2019
2. ACCOUNTING POLICIES (CONTINUED)INTANGIBLE ASSETSContract acquired related intangible assets with finite useful lives are carried at cost less accumulated amortisation and accumulated impairment losses. They are amortised on a straight-line basis over the life of the contract. Other intangible assets are subsequently amortised on a straight-line basis over their estimated lives of three to ten years.
Intangible assets acquired in a business combination and recognised separately from goodwill are recognised initially at their fair value at the acquisition date (which is regarded as their cost). Subsequent to initial recognition, intangible assets acquired in a business combination are reported at cost less accumulated amortisation and accumulated impairment losses, on the same basis as intangible assets that are acquired separately.
Amortisation is charged so as to write off the cost of assets over their estimated useful lives, using the straight-line method, on the following bases:
Customer contracts 15 yearsCustomer relationships 15 years Colocation rights 15 years Right of first refusal 7 yearsNon-compete agreement 5 years
An intangible asset is derecognised on disposal, or when no future economic benefits are expected from use or disposal. Gains or losses arising from derecognition of an intangible asset, measured as the difference between the net disposal proceeds and the carrying amount of the asset, are recognised in profit or loss when the asset is derecognised.
IMPAIRMENT OF TANGIBLE AND INTANGIBLE ASSETS At each reporting date, the Directors review the carrying amounts of its tangible and intangible assets to determine whether there is any indication that those assets have suffered an impairment loss. If any such indication exists, the recoverable amount of the asset is estimated to determine the extent of the impairment loss (if any). Where the asset does not generate cash flows that are independent from other assets, the Directors estimate the recoverable amount of the cash-generating unit to which the asset belongs. The recoverable amount is the higher of fair value less costs to sell and value in use. In assessing value in use, the estimated future cash flows are discounted to their present value using a pre-tax discount rate that reflects current market assessments of the time value of money and the risks specific to the asset for which the estimates of future cash flows have not been adjusted.
If the recoverable amount of an asset (or cash-generating unit) is estimated to be less than its carrying amount, the carrying amount of the asset (or cash-generating unit) is reduced to its recoverable amount. An impairment loss is recognised immediately in profit or loss.
INVENTORYInventories are stated at the lower of cost and net realisable value. Cost comprises direct materials and those overheads that have been incurred in bringing the inventories to their present location and condition. Cost is calculated using the weighted average method.
TRADE AND OTHER RECEIVABLESTrade receivables are recognised by the Group and carried at original invoice amount less an allowance for any non-collectable or impaired amounts. The Group uses the IFRS 9 Expected Credit Loss (“ECL”) model to measure loss allowances at an amount equal to their lifetime expected credit loss.
Other receivables are recognised at fair value. Subsequent measurement is at amortised cost using the effective interest method, less any impairment.
Financial Statements
Notes to the Financial StatementsFor the year ended 31 December 2019 (continued)

123
Helios Towers plcAnnual Report and Financial Statements 2019
Overview StrategicReport
GovernanceReport
Financial Statements
2. ACCOUNTING POLICIES (CONTINUED)CASH AND CASH EQUIVALENTSCash and cash equivalents comprise cash at bank and in hand and short-term deposits. Short-term deposits are defined as deposits with an initial maturity of three months or less.
Bank overdrafts that are repayable on demand and form an integral part of the Group’s cash management are included as a component of cash and cash equivalents for the purposes of the statement of cash flows.
DERIVATIVE FINANCIAL INSTRUMENTSShort-term debtors and creditors are treated as financial assets or liabilities. The Group does not trade in financial instruments. The Group enters into derivative financial instruments to manage its exposure to interest rate risk.
Derivatives are initially recognised at fair value at the date a derivative contract is entered into and are subsequently remeasured to their fair value at each reporting date. The resulting gain or loss is recognised in profit or loss immediately.
A derivative with a positive fair value is recognised as a financial asset whereas a derivative with a negative fair value is recognised as a financial liability. A derivative is presented as a non-current asset or a non-current liability if the remaining maturity of the instrument is more than 12 months and it is not expected to be realised or settled within 12 months. Other derivatives are presented as current assets or current liabilities.
Derivatives embedded in other financial instruments or other host contracts are treated as separate derivatives when their risks and characteristics are not closely related to those of the host contracts and the host contracts are not measured at fair value through profit or loss. Embedded derivatives are disclosed separately in the statement of financial position.
OTHER FINANCIAL LIABILITIES Other financial liabilities, including borrowings, are initially measured at fair value, net of transaction costs.
Other financial liabilities are subsequently measured at amortised cost using the effective interest method, with interest expense recognised on an effective yield basis.
DERECOGNITION OF FINANCIAL LIABILITIESThe Group derecognises financial liabilities when, and only when, the Group’s and the Company’s obligations are discharged, cancelled or have expired. The difference between the carrying amount of the financial liability derecognised and the consideration paid and payable is recognised in profit or loss.
RELATED PARTIESFor the purpose of these Financial Statements, parties are considered to be related to the Group if they have the ability, directly or indirectly to control the Group or exercise significant influence over the Group in making financial or operating decisions, or vice versa, or where the Group is subject to common control or common significant influence. Related parties may be individuals or other entities.
DEFERRED INCOMEDeferred income is recognised when payments are received from customers in advance of services being provided. The Group policy is to bill customers in advance, thus creating deferred income. The deferred income is included as a current liability within trade and other payables. Deferred income is recognised as it is a contract liability as defined by IFRS 15.
124
Helios Towers plcAnnual Report and Financial Statements 2019
2. ACCOUNTING POLICIES (CONTINUED)TREASURY SHARESTreasury shares represents the shares of Helios Towers plc that are held in treasury or by the Employee Benefit Trust. Treasury shares are recorded at cost and deducted from equity.
NEW ACCOUNTING PRONOUNCEMENTThe Group has adopted all of the new and revised Standards and Interpretations issued by the IASB and International Financial Reporting Interpretations Committee (“IFRIC”) of the IASB that are relevant to its operations and effective for accounting periods covered by the consolidated Financial Statements.
At the date of authorisation of these Financial Statements, the following new and revised IFRS Standards, which are applicable to the Group, were issued but are not yet effective:
IFRS 10 and IAS 28 (amendments) Sale or Contribution of Assets between an Investor and its Associate or Joint Venture
Amendments to IFRS 3 Definition of a business
Amendments to IAS 1 and IAS 8 Definition of material
Conceptual Framework Amendments to References to the Conceptual Framework in IFRS Standards
The Directors do not expect that the adoption of the Standards listed above will have a material impact on the Financial Statements of the Group in future periods.
CRITICAL ACCOUNTING JUDGEMENTS AND KEY SOURCES OF ESTIMATION UNCERTAINTYIn the application of the Group’s accounting policies, which are described above, the Directors are required to make judgements (other than those involving estimations) that have a significant impact on the amounts recognised and to make estimates and assumptions about the carrying amounts of assets and liabilities that are not readily apparent from other sources. The estimates and associated assumptions are based on historical experience and other factors that are considered to be relevant. Actual results may differ from these estimates.
The estimates and underlying assumptions are reviewed on an ongoing basis. Revisions to accounting estimates are recognised in the period in which the estimate is revised if the revision affects only that period, or in the period of the revision and future periods if the revision affects both current and future periods.
Financial Statements
Notes to the Financial StatementsFor the year ended 31 December 2019 (continued)
125
Helios Towers plcAnnual Report and Financial Statements 2019
Overview StrategicReport
GovernanceReport
Financial Statements
2. ACCOUNTING POLICIES (CONTINUED)CRITICAL JUDGEMENTS IN APPLYING THE GROUP’S ACCOUNTING POLICIESThe following are the critical judgements, apart from those involving estimations (which are dealt with separately below), that the Directors, have made in the process of applying the Group’s accounting policies and that have the most significant effect on the amounts recognised in the Financial Statements.
Revenue recognitionRevenue is recognised as service revenue in accordance with IFRS 15: Revenue from contracts with customers. In arriving at this assessment the Directors concluded that there is not an embedded lease because its contracts permit it, subject to certain conditions, to relocate customer’s equipment on its towers in order to accommodate other tenants and therefore the contract does not provide the customer with the right to a specific location on the tower.
Uncertain tax positionsThe tax impact of a transaction or item can be uncertain until a conclusion is reached with the relevant tax authority or through a legal process. The Group assesses for each uncertain tax treatment whether it should be considered independently or whether some tax treatments should be considered together based on what the Group believes provides a better prediction of the resolution of the uncertainty. The Group uses tax experts when assessing uncertain tax positions and seeks the advice of external professional advisors where appropriate. The most significant judgement in this area relates to the Group’s tax disputes in Democratic Republic of Congo, Congo Brazzaville and Ghana. Further details of these are included in Note 27. Business combinationsFrom time to time, the Group acquires a portfolio of towers, comprising the tower infrastructure and other associated assets. The Directors assess each acquisition on the basis of its purchase agreement and the substance of the transaction to determine if it is considered to be a business combination in accordance with IFRS 3. Following the amendment to the definition of a business in IFRS 3, effective from 1 January 2020, a business is an integrated set of activities and assets that is capable of being conducted and managed for the purpose of providing goods or services to customers, generating investment income (such as dividends or interest) or generating other income from ordinary activities. A business consists of inputs and processes applied to those inputs that have the ability to contribute to the creation of outputs.
Acquisitions that meet the definition of a business are accounted for in accordance with IFRS 3, refer to Business combinations and goodwill accounting policy. Portfolio acquisitions that do not meet the definition of a business under IFRS 3 since they do not represent an integrated set of activities and assets that are capable of being conducted and managed independently, and consequently have been accounted for as an asset acquisition under IAS 16. Accordingly, no goodwill is recognised and the costs incurred are capitalised as part of the costs of acquisition of the tower. The impact of the new business definition is expected to be immaterial.
Contingent liabilitiesThe Group exercises judgement to determine whether to recognise provisions and the exposures to contingent liabilities related to pending litigations or other outstanding claims subject to negotiated settlement, mediation, arbitration or government regulation, as well as other contingent liabilities (see Note 27). Judgement is necessary to assess the likelihood that a pending claim will succeed, or a liability will arise.
KEY SOURCES OF ESTIMATION UNCERTAINTYThe key assumptions concerning the future, and other key sources of estimation uncertainty at the reporting date, that have a significant risk of causing a material adjustment to the carrying amounts of assets and liabilities within the next financial year, are discussed below.
Impairment of goodwillDetermining whether goodwill is impaired requires an estimation of the recoverable amount being the value in use or fair value less costs of disposal of the cash-generating units to which goodwill has been allocated. The value in use calculation requires the entity to estimate the future cash flows expected to arise from the cash-generating unit and a suitable discount rate in order to calculate present value.
The recoverable amount of each cash generating unit is determined based on a value in use calculation using cash flow projections for the next ten years from financial budgets approved by senior management as this period matches the typical customer contract period for tower management. Refer to Note 11.
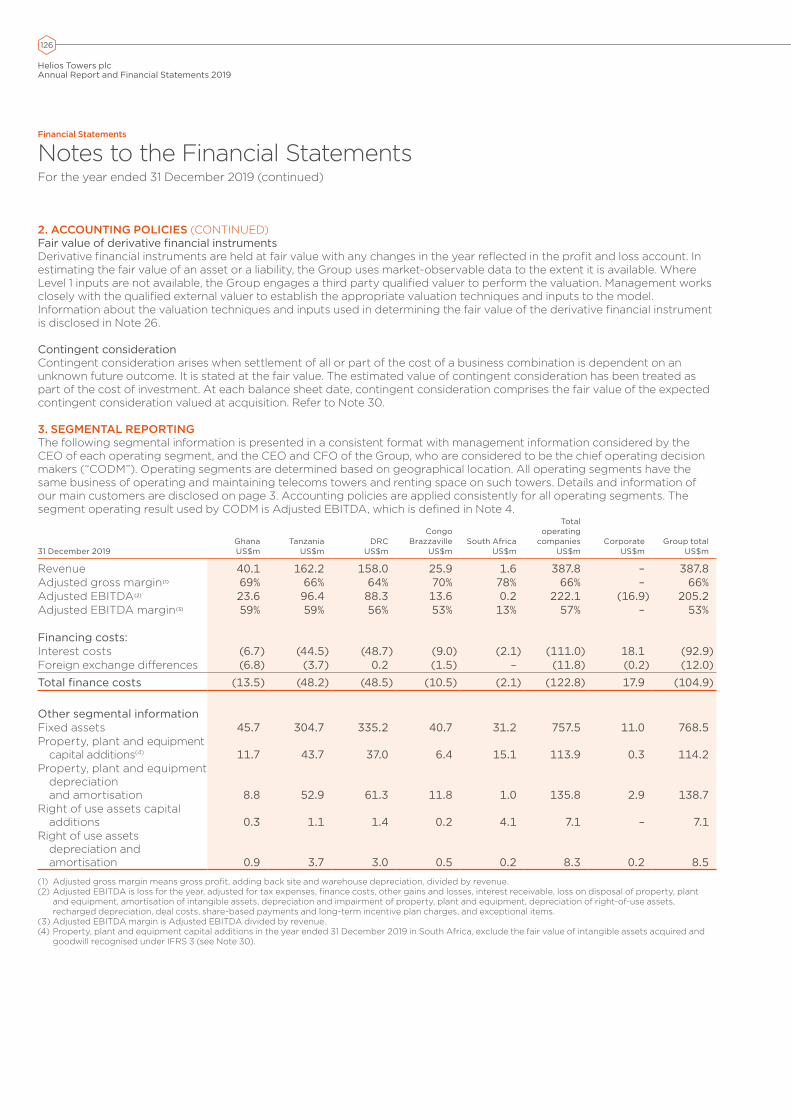
126
Helios Towers plcAnnual Report and Financial Statements 2019
2. ACCOUNTING POLICIES (CONTINUED) Fair value of derivative financial instrumentsDerivative financial instruments are held at fair value with any changes in the year reflected in the profit and loss account. In estimating the fair value of an asset or a liability, the Group uses market-observable data to the extent it is available. Where Level 1 inputs are not available, the Group engages a third party qualified valuer to perform the valuation. Management works closely with the qualified external valuer to establish the appropriate valuation techniques and inputs to the model. Information about the valuation techniques and inputs used in determining the fair value of the derivative financial instrument is disclosed in Note 26.
Contingent considerationContingent consideration arises when settlement of all or part of the cost of a business combination is dependent on an unknown future outcome. It is stated at the fair value. The estimated value of contingent consideration has been treated as part of the cost of investment. At each balance sheet date, contingent consideration comprises the fair value of the expected contingent consideration valued at acquisition. Refer to Note 30.
3. SEGMENTAL REPORTING The following segmental information is presented in a consistent format with management information considered by the CEO of each operating segment, and the CEO and CFO of the Group, who are considered to be the chief operating decision makers (“CODM”). Operating segments are determined based on geographical location. All operating segments have the same business of operating and maintaining telecoms towers and renting space on such towers. Details and information of our main customers are disclosed on page 3. Accounting policies are applied consistently for all operating segments. The segment operating result used by CODM is Adjusted EBITDA, which is defined in Note 4.
31 December 2019Ghana US$m
Tanzania US$m
DRC US$m
Congo Brazzaville
US$mSouth Africa
US$m
Total operating
companies US$m
Corporate US$m
Group total US$m
Revenue 40.1 162.2 158.0 25.9 1.6 387.8 – 387.8Adjusted gross margin(1) 69% 66% 64% 70% 78% 66% – 66%Adjusted EBITDA(2) 23.6 96.4 88.3 13.6 0.2 222.1 (16.9) 205.2Adjusted EBITDA margin(3) 59% 59% 56% 53% 13% 57% – 53%
Financing costs:Interest costs (6.7) (44.5) (48.7) (9.0) (2.1) (111.0) 18.1 (92.9)Foreign exchange differences (6.8) (3.7) 0.2 (1.5) – (11.8) (0.2) (12.0)
Total finance costs (13.5) (48.2) (48.5) (10.5) (2.1) (122.8) 17.9 (104.9)
Other segmental informationFixed assets 45.7 304.7 335.2 40.7 31.2 757.5 11.0 768.5Property, plant and equipment
capital additions(4) 11.7 43.7 37.0 6.4 15.1 113.9 0.3 114.2Property, plant and equipment
depreciation and amortisation 8.8 52.9 61.3 11.8 1.0 135.8 2.9 138.7
Right of use assets capital additions 0.3 1.1 1.4 0.2 4.1 7.1 – 7.1
Right of use assets depreciation and amortisation 0.9 3.7 3.0 0.5 0.2 8.3 0.2 8.5
(1) Adjusted gross margin means gross profit, adding back site and warehouse depreciation, divided by revenue.(2) Adjusted EBITDA is loss for the year, adjusted for tax expenses, finance costs, other gains and losses, interest receivable, loss on disposal of property, plant
and equipment, amortisation of intangible assets, depreciation and impairment of property, plant and equipment, depreciation of right-of-use assets, recharged depreciation, deal costs, share-based payments and long-term incentive plan charges, and exceptional items.
(3) Adjusted EBITDA margin is Adjusted EBITDA divided by revenue.(4) Property, plant and equipment capital additions in the year ended 31 December 2019 in South Africa, exclude the fair value of intangible assets acquired and
goodwill recognised under IFRS 3 (see Note 30).
Financial Statements
Notes to the Financial StatementsFor the year ended 31 December 2019 (continued)

127
Helios Towers plcAnnual Report and Financial Statements 2019
Overview StrategicReport
GovernanceReport
Financial Statements
3. SEGMENTAL REPORTING (CONTINUED)
31 December 2018GhanaUS$m
Tanzania US$m
DRC US$m
Congo Brazzaville
US$mSouth Africa
US$m
Total operating
companies US$m
Corporate US$m
Group total US$m
Revenue 41.0 149.8 140.9 24.3 – 356.0 – 356.0Adjusted gross margin(1) 66% 65% 60% 67% – 63% – 63%Adjusted EBITDA(2) 22.8 86.2 72.5 12.1 – 193.6 (16.0) 177.6Adjusted EBITDA margin(3) 56% 57% 51% 50% – 54% – 50%
Financing costs: –Interest costs (5.1) (54.3) (47.3) (8.4) – (115.1) 26.1 (89.0)Foreign exchange differences (3.5) (11.3) – (3.3) – (18.1) 0.1 (18.0)
Total finance costs (8.6) (65.6) (47.3) (11.7) – (133.2) 26.2 (107.0)
Other segmental informationFixed assets 50.1 325.6 364.7 48.4 – 788.8 4.0 792.8Property, plant and equipment
capital additions(4) 19.7 37.9 57.1 4.0 – 118.7 0.3 119.0Property, plant and
equipment depreciation and amortisation 8.0 52.9 59.4 11.8 – 132.1 0.3 132.4
Right of use assets capital additions 0.6 1.9 3.7 0.2 – 6.4 – 6.4
Right of use assets depreciation and amortisation 0.6 4.5 3.2 0.5 – 8.8 – 8.8
(1) Adjusted gross margin means gross profit, adding back site and warehouse depreciation, divided by revenue.(2) Adjusted EBITDA is loss for the year, adjusted for tax expenses, finance costs, other gains and losses, interest receivable, loss on disposal of property, plant
and equipment, amortisation of intangible assets, depreciation and impairment of property, plant and equipment, depreciation of right-of-use assets, recharged depreciation, deal costs, share-based payments and long-term incentive plan charges, and exceptional items.
(3) Adjusted EBITDA margin is Adjusted EBITDA divided by revenue.(4) Property, plant and equipment capital additions in the year ended 31 December 2019 in South Africa, exclude the fair value of intangible assets acquired and
goodwill recognised under IFRS 3 (see Note 30).
4. RECONCILIATION OF AGGREGATE SEGMENT ADJUSTED EBITDA TO LOSS BEFORE TAXThe segment operating result used by the chief operating decision makers is Adjusted EBITDA.
Management defines Adjusted EBITDA as loss for the year, adjusted for tax expenses, finance costs, gain/(loss) on derivative financial instruments, interest receivable, loss on disposal of property, plant and equipment, amortisation of intangible assets, depreciation and impairment of property, plant and equipment, depreciation of right-of-use assets, recharged depreciation, deal costs for aborted acquisitions, deal costs not capitalised, share-based payments and long-term incentive plan charges, and exceptional items. Exceptional items are material items that are considered exceptional in nature by management by virtue of their size and/or incidence.
The Group believes that Adjusted EBITDA facilitates comparisons of operating performance from period to period and company to company by eliminating potential differences caused by variations in capital structures (affecting interest and finance charges), tax positions (such as the impact on periods or companies of changes in effective tax rates or net operating losses) and the age and booked depreciation on assets. The Group excludes certain items from Adjusted EBITDA, such as loss on disposal of property, plant and equipment, and exceptional and adjusting items because it believes they are not indicative of its underlying trading performance.

128
Helios Towers plcAnnual Report and Financial Statements 2019
4. RECONCILIATION OF AGGREGATE SEGMENT ADJUSTED EBITDA TO LOSS BEFORE TAX (CONTINUED)Adjusted EBITDA is reconciled to loss before tax as follows:
2019 US$m
2018 US$m
Adjusted EBITDA 205.2 177.6Adjustments applied to give Adjusted EBITDAExceptional items:
Litigation costs(1) – (10.2)Exceptional project costs(2) (18.6) (14.7)
Deal costs(3) (1.7) (1.5)Share-based payments and long term incentive plans(4) (31.2) –Loss on disposal of property, plant and equipment (11.0) (5.8)Gain/(loss) on derivative financial instruments (Note 24) 33.9 (16.8)Recharged depreciation(5) – (0.9)Depreciation of property, plant and equipment (129.5) (124.0)Amortisation of intangibles (9.2) (8.4)Depreciation of right-of-use assets (8.5) (8.8)Interest receivable 0.7 1.0Finance costs (104.9) (107.0)
Loss before tax (74.8) (119.5)
(1) Litigation costs relate to legal costs incurred in connection with a previously terminated equity transaction.(2) Exceptional project costs are in relation to the listing of equity on the London Stock Exchange.(3) Deal costs comprise deal costs for aborted acquisitions, which mainly comprise professional fees and travel costs incurred while investigating potential site
acquisitions that are expensed when the potential site acquisition does not proceed, and deal costs not capitalized, which relate to the exploration of investment opportunities across Africa that are mainly related to the acquisition of an 89.5% interest in HTSA Towers (Pty) Ltd. See Note 30.
(4) Share-based payments, long term incentive plan charges, retention award (US$10 million) and associated costs. See Note 25.(5) The Group incurred costs charged to it through a service contract from Helios Towers Africa LLP until 5 March 2019. From 6 March 2019, Helios Towers Africa
LLP was consolidated in to the Group. Prior to this, management considered that the depreciation element of the charge should be removed from Adjusted EBITDA as it is depreciation in nature.
5A. OPERATING (LOSS)/PROFITOperating (loss)/profit is stated after charging the following:
2019 US$m
2018 US$m
Cost of inventory expensed 56.8 57.2Auditor remuneration (see Note 5B) 5.8 4.6Loss on disposal of property, plant and equipment 11.0 5.8Depreciation and amortisation 147.2 141.2Staff costs (Note 6) 22.6 21.7
Amortisation of intangible assets is presented in administrative expenses in the Consolidated Income Statement.
5B. AUDIT REMUNERATION2019
US$m2018
US$m
Statutory audit of the Company’s annual accounts 0.3 0.1 Statutory audit of the Group’s subsidiaries 1.7 0.8
Audit fees: 2.0 0.9
Quarterly review engagements 0.3 0.4Other assurance services 1.0 –Controls related services 0.0 0.1
Audit related assurance services 1.3 0.5
Project costs 2.4 3.2Other services 0.1 –
Total other non-audit services: 2.5 3.2
Total non-audit fees 3.8 3.7
Total fees 5.8 4.6
Project costs relate to the IPO which was completed in October 2019 – refer to Note 4. From 18 October 2019, Helios Towers plc became an EU Public Interest Entity (PIE), the US$3.8m non-audit fees in current year was all incurred pre-IPO, post–IPO there were no non-audit services provided to the Group by Deloitte and its associates for the period to 31 December 2019.
Financial Statements
Notes to the Financial StatementsFor the year ended 31 December 2019 (continued)

129
Helios Towers plcAnnual Report and Financial Statements 2019
Overview StrategicReport
GovernanceReport
Financial Statements
6. STAFF COSTSStaff costs consist of the following components:
2019 US$m
2018 US$m
Wages and salaries 21.7 21.4Social security costs - employer contributions 0.6 0.3Pension costs 0.3 –
22.6 21.7
The average monthly number of employees during the year was made up as follows:
2019 2018
Operations 133 115Legal and regulatory 29 24Administration 32 30Finance 84 74Sales and marketing 64 63
342 306
7. KEY MANAGEMENT PERSONNEL COMPENSATION
2019US$m
2018US$m
Salaries 1.5 1.0Bonus 1.4 1.3Benefits 0.2 0.3
3.1 2.6
The above remuneration information relates to Directors in Helios Towers plc. Further details can be found in the Remuneration Report of the Annual Report.
8. INTEREST RECEIVABLE
2019 US$m
2018 US$m
Bank interest receivable 0.7 1.0
9. FINANCE COSTS
2019 US$m
2018 US$m
Foreign exchange differences 12.0 18.0Interest costs 77.0 73.9Interest costs on lease liabilities 15.9 15.1
104.9 107.0
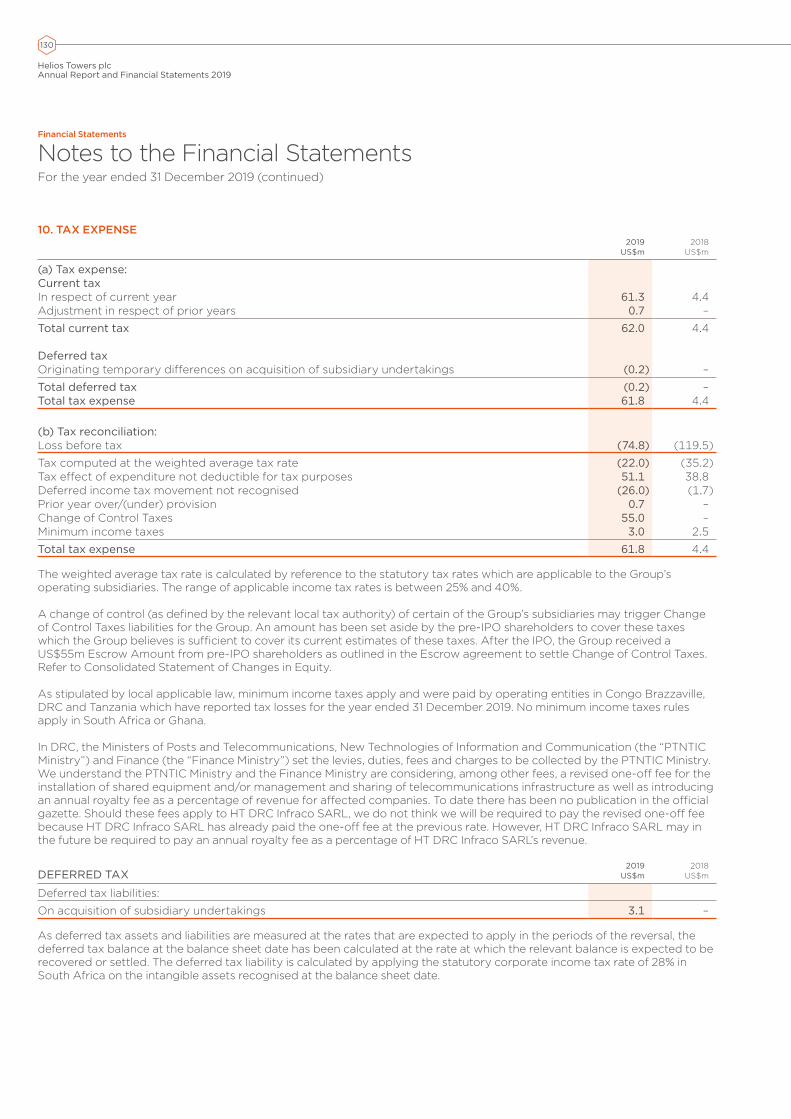
130
Helios Towers plcAnnual Report and Financial Statements 2019
10. TAX EXPENSE 2019
US$m2018
US$m
(a) Tax expense:Current taxIn respect of current year 61.3 4.4Adjustment in respect of prior years 0.7 –
Total current tax 62.0 4.4
Deferred taxOriginating temporary differences on acquisition of subsidiary undertakings (0.2) –
Total deferred tax (0.2) – Total tax expense 61.8 4.4
(b) Tax reconciliation:Loss before tax (74.8) (119.5)
Tax computed at the weighted average tax rate (22.0) (35.2)Tax effect of expenditure not deductible for tax purposes 51.1 38.8Deferred income tax movement not recognised (26.0) (1.7)Prior year over/(under) provision 0.7 –Change of Control Taxes 55.0 –Minimum income taxes 3.0 2.5
Total tax expense 61.8 4.4
The weighted average tax rate is calculated by reference to the statutory tax rates which are applicable to the Group’s operating subsidiaries. The range of applicable income tax rates is between 25% and 40%.
A change of control (as defined by the relevant local tax authority) of certain of the Group’s subsidiaries may trigger Change of Control Taxes liabilities for the Group. An amount has been set aside by the pre-IPO shareholders to cover these taxes which the Group believes is sufficient to cover its current estimates of these taxes. After the IPO, the Group received a US$55m Escrow Amount from pre-IPO shareholders as outlined in the Escrow agreement to settle Change of Control Taxes. Refer to Consolidated Statement of Changes in Equity.
As stipulated by local applicable law, minimum income taxes apply and were paid by operating entities in Congo Brazzaville, DRC and Tanzania which have reported tax losses for the year ended 31 December 2019. No minimum income taxes rules apply in South Africa or Ghana.
In DRC, the Ministers of Posts and Telecommunications, New Technologies of Information and Communication (the “PTNTIC Ministry”) and Finance (the “Finance Ministry”) set the levies, duties, fees and charges to be collected by the PTNTIC Ministry. We understand the PTNTIC Ministry and the Finance Ministry are considering, among other fees, a revised one-off fee for the installation of shared equipment and/or management and sharing of telecommunications infrastructure as well as introducing an annual royalty fee as a percentage of revenue for affected companies. To date there has been no publication in the official gazette. Should these fees apply to HT DRC Infraco SARL, we do not think we will be required to pay the revised one-off fee because HT DRC Infraco SARL has already paid the one-off fee at the previous rate. However, HT DRC Infraco SARL may in the future be required to pay an annual royalty fee as a percentage of HT DRC Infraco SARL’s revenue.
DEFERRED TAX2019
US$m2018
US$m
Deferred tax liabilities:
On acquisition of subsidiary undertakings 3.1 –
As deferred tax assets and liabilities are measured at the rates that are expected to apply in the periods of the reversal, the deferred tax balance at the balance sheet date has been calculated at the rate at which the relevant balance is expected to be recovered or settled. The deferred tax liability is calculated by applying the statutory corporate income tax rate of 28% in South Africa on the intangible assets recognised at the balance sheet date.
Financial Statements
Notes to the Financial StatementsFor the year ended 31 December 2019 (continued)

131
Helios Towers plcAnnual Report and Financial Statements 2019
Overview StrategicReport
GovernanceReport
Financial Statements
11. INTANGIBLE ASSETS
Customer contracts
US$m
Customer relationships
US$mGoodwill
US$m
ColocationrightsUS$m
Right of first refusalUS$m
Non-compete agreement
US$m
Computer software and
licenceUS$m
Total US$m
CostAt 1 January 2018 – – – – 35.0 30.0 15.2 80.2Additions during the year – – – – – – 3.0 3.0Disposals during the year – – – – – – – –Effects of foreign currency exchange differences
– – – – – – (0.4) (0.4)
At 31 December 2018 – – – – 35.0 30.0 17.7 82.7
Additions during the year – – – 8.8 – – 0.4 9.2On acquisition of subsidiary undertakings (Note 30) 3.4 6.9 4.1 – – 1.1 – 15.5Effects of foreign currency exchange differences
0.1 0.2 0.1 – – – 1.3 1.7
At 31 December 2019 3.5 7.1 4.2 8.8 35.0 31.1 19.4 109.1
AmortisationAt 1 January 2018 – – – – (22.5) (30.0) (9.7) (62.6)Charge for year – – – – (5.0) – (3.4) (8.4)Effects of foreign currency exchange differences
– – – – – – 0.3 0.3
At 31 December 2018 – – – – (27.5) (30.0) (12.8) (70.3)
Charge for year (0.2) (0.3) – (0.3) (5.2) – (3.2) (9.2)Effects of foreign currency exchange differences
– – – – – – (1.2) (1.2)
At 31 December 2019 (0.2) (0.3) – (0.3) (32.7) (30.0) (17.2) (80.7)
Net book valueAt 31 December 2019 3.3 6.8 4.2 8.5 2.3 1.1 2.2 28.4
At 31 December 2018 – – – – 7.5 – 4.9 12.4
At 1 January 2018 – – – – 12.5 – 5.5 18.0

132
Helios Towers plcAnnual Report and Financial Statements 2019
11. INTANGIBLE ASSETS (CONTINUED)In 2016, alongside the purchase of 967 towers from Airtel Group, a right of first refusal (“ROFR”) agreement was signed with Airtel Group in the DRC giving the Group the right of first refusal over build-to-suit towers that Airtel Group wish to commission. A payment of US$20 million was made for this right and is amortised on a straight line basis over its exercisable period ending on 1 May 2020. In July 2019, HTT Infraco Limited entered into a marketing agreement with Viettel, whereby it acquired the rights to colocate on approximately 1,000 sites. These additional sites meant that new colocation opportunities were made available to other Group customers.
The remaining amortisation period is; • customer contracts and customer relationships 14 years;• colocation rights 14 years;• right of first refusal one year;• non-compete agreement four years; and • computer software and licence two to three years.
As part of the same transaction, the Group entered into a non-compete agreement with Airtel Group under which the Group and the Company was granted the right that Airtel will not compete with the Group in DRC and/or Congo Brazzaville. The remaining amortisation period for the non-compete agreement is four years. The Group issued shares with a fair value of US$30 million to Airtel Group for this right commencing on the date of the agreement (5 May 2016) and terminating 12 consecutive months after first date closing (7 July 2016). The issuance of these shares was a non-cash transaction.
IMPAIRMENTGoodwill acquired in a business combination is allocated, at acquisition, to the cash generating units (CGUs) that are expected to benefit from that business combination. The Group tests goodwill annually for impairment or more frequently if there are indications that goodwill might be impaired. Net book value has been compared with recoverable amount to assess impairment. Intangibles, including goodwill on acquisition of subsidiary undertakings includes US$3 million of assets for which consideration was paid in cash for the acquisition of SA Towers Proprietary Limited and Sky Coverage Proprietary Limited, the remaining US$12.6 million relates to the fair value of intangible assets acquired and goodwill recognised under IFRS 3. The Group’s CGUs are aligned to its operating segments.
The recoverable amount of each cash generating unit has been determined based on a value in use calculation using cash flow projections for the next five years from financial budgets approved by senior management as this period matches the typical customer contract period for tower management.
KEY ASSUMPTIONS USED IN VALUE-IN-USE CALCULATIONSThe calculation of value-in-use is most sensitive to the following assumptions:• Number of towers under management at the end of each year together with the lease upgrade or number of tenants per
tower. These are based on estimates of the number of tower opportunities in the relevant markets and the expected growth in these markets;
• discount rate; and• operating cost and capital expenditure requirements.
A long-term growth rate of 5% has been applied to extrapolate the cash flow projections into perpetuity, based on management’s estimate of the long-term annual growth rates in Adjusted EBITDA. From the financial model a net present value was derived, using discount rates ranging from 15% to 20%, and compared to the goodwill carrying value. The discount rates were based on an industry average weighted average cost of capital assuming debt leveraging of 40% and market interest rates ranging from 9% to 10%. A reasonable change in any of the key assumptions does not result in an impairment of goodwill.
Financial Statements
Notes to the Financial StatementsFor the year ended 31 December 2019 (continued)
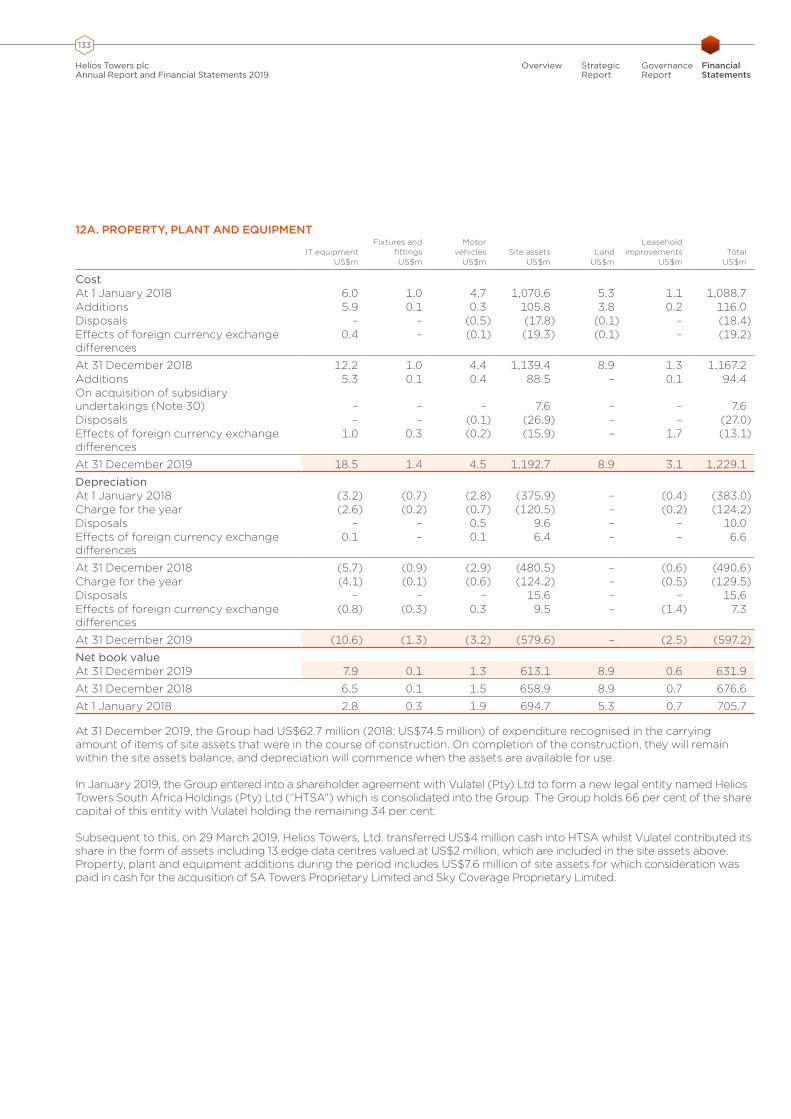
133
Helios Towers plcAnnual Report and Financial Statements 2019
Overview StrategicReport
GovernanceReport
Financial Statements
12A. PROPERTY, PLANT AND EQUIPMENT
IT equipment US$m
Fixtures and fittingsUS$m
Motor vehicles
US$mSite assets
US$mLand
US$m
Leasehold improvements
US$mTotal
US$m
CostAt 1 January 2018 6.0 1.0 4.7 1,070.6 5.3 1.1 1,088.7Additions 5.9 0.1 0.3 105.8 3.8 0.2 116.0Disposals – – (0.5) (17.8) (0.1) – (18.4)Effects of foreign currency exchange differences
0.4 – (0.1) (19.3) (0.1) – (19.2)
At 31 December 2018 12.2 1.0 4.4 1,139.4 8.9 1.3 1,167.2Additions 5.3 0.1 0.4 88.5 – 0.1 94.4On acquisition of subsidiary undertakings (Note 30) – – – 7.6 – – 7.6Disposals – – (0.1) (26.9) – – (27.0)Effects of foreign currency exchange differences
1.0 0.3 (0.2) (15.9) – 1.7 (13.1)
At 31 December 2019 18.5 1.4 4.5 1,192.7 8.9 3.1 1,229.1
DepreciationAt 1 January 2018 (3.2) (0.7) (2.8) (375.9) – (0.4) (383.0)Charge for the year (2.6) (0.2) (0.7) (120.5) – (0.2) (124.2)Disposals – – 0.5 9.6 – – 10.0Effects of foreign currency exchange differences
0.1 – 0.1 6.4 – – 6.6
At 31 December 2018 (5.7) (0.9) (2.9) (480.5) – (0.6) (490.6)Charge for the year (4.1) (0.1) (0.6) (124.2) – (0.5) (129.5)Disposals – – – 15.6 – – 15,6Effects of foreign currency exchange differences
(0.8) (0.3) 0.3 9.5 – (1.4) 7.3
At 31 December 2019 (10.6) (1.3) (3.2) (579.6) – (2.5) (597.2)
Net book valueAt 31 December 2019 7.9 0.1 1.3 613.1 8.9 0.6 631.9
At 31 December 2018 6.5 0.1 1.5 658.9 8.9 0.7 676.6
At 1 January 2018 2.8 0.3 1.9 694.7 5.3 0.7 705.7
At 31 December 2019, the Group had US$62.7 million (2018: US$74.5 million) of expenditure recognised in the carrying amount of items of site assets that were in the course of construction. On completion of the construction, they will remain within the site assets balance, and depreciation will commence when the assets are available for use.
In January 2019, the Group entered into a shareholder agreement with Vulatel (Pty) Ltd to form a new legal entity named Helios Towers South Africa Holdings (Pty) Ltd (“HTSA”) which is consolidated into the Group. The Group holds 66 per cent of the share capital of this entity with Vulatel holding the remaining 34 per cent.
Subsequent to this, on 29 March 2019, Helios Towers, Ltd. transferred US$4 million cash into HTSA whilst Vulatel contributed its share in the form of assets including 13 edge data centres valued at US$2 million, which are included in the site assets above. Property, plant and equipment additions during the period includes US$7.6 million of site assets for which consideration was paid in cash for the acquisition of SA Towers Proprietary Limited and Sky Coverage Proprietary Limited.
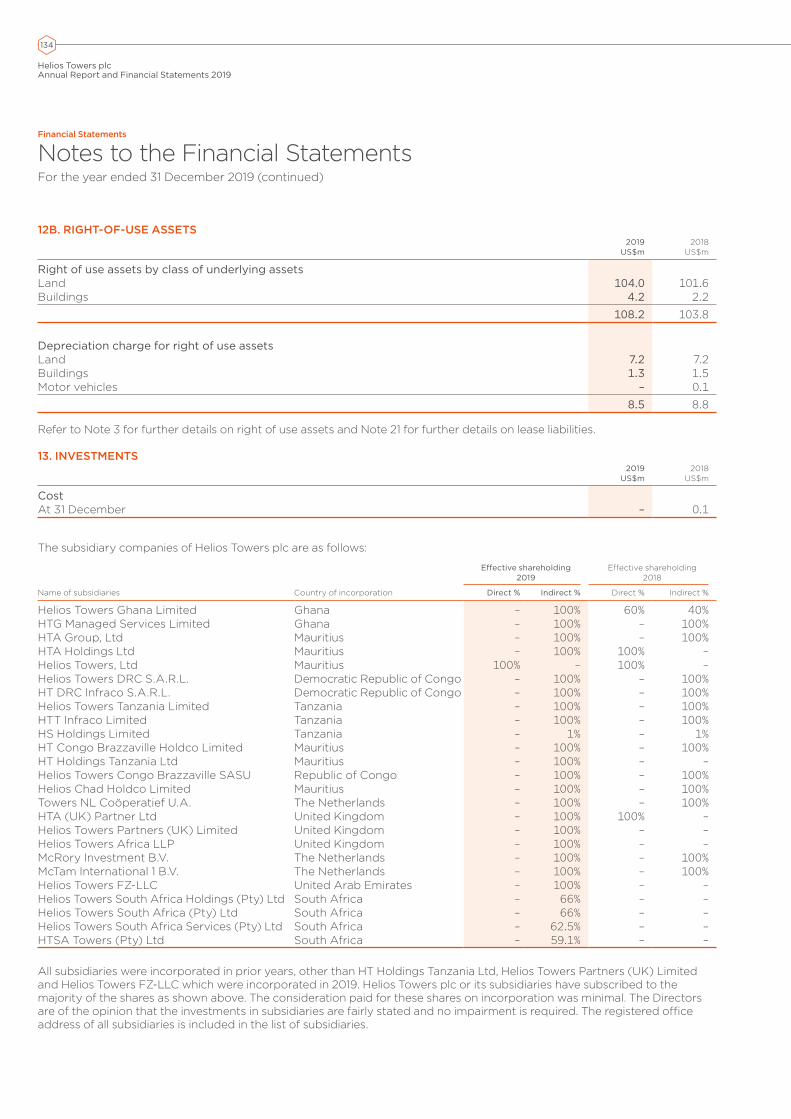
134
Helios Towers plcAnnual Report and Financial Statements 2019
12B. RIGHT-OF-USE ASSETS2019
US$m2018
US$m
Right of use assets by class of underlying assetsLand 104.0 101.6Buildings 4.2 2.2
108.2 103.8
Depreciation charge for right of use assetsLand 7.2 7.2Buildings 1.3 1.5Motor vehicles – 0.1
8.5 8.8
Refer to Note 3 for further details on right of use assets and Note 21 for further details on lease liabilities.
13. INVESTMENTS2019
US$m2018
US$m
CostAt 31 December – 0.1
The subsidiary companies of Helios Towers plc are as follows:
Effective shareholding 2019
Effective shareholding 2018
Name of subsidiaries Country of incorporation Direct % Indirect % Direct % Indirect %
Helios Towers Ghana Limited Ghana – 100% 60% 40%HTG Managed Services Limited Ghana – 100% – 100%HTA Group, Ltd Mauritius – 100% – 100%HTA Holdings Ltd Mauritius – 100% 100% –Helios Towers, Ltd Mauritius 100% – 100% –Helios Towers DRC S.A.R.L. Democratic Republic of Congo – 100% – 100%HT DRC Infraco S.A.R.L. Democratic Republic of Congo – 100% – 100%Helios Towers Tanzania Limited Tanzania – 100% – 100%HTT Infraco Limited Tanzania – 100% – 100%HS Holdings Limited Tanzania – 1% – 1%HT Congo Brazzaville Holdco Limited Mauritius – 100% – 100%HT Holdings Tanzania Ltd Mauritius – 100% – –Helios Towers Congo Brazzaville SASU Republic of Congo – 100% – 100%Helios Chad Holdco Limited Mauritius – 100% – 100%Towers NL Coöperatief U.A. The Netherlands – 100% – 100%HTA (UK) Partner Ltd United Kingdom – 100% 100% –Helios Towers Partners (UK) Limited United Kingdom – 100% – –Helios Towers Africa LLP United Kingdom – 100% – –McRory Investment B.V. The Netherlands – 100% – 100%McTam International 1 B.V. The Netherlands – 100% – 100%Helios Towers FZ-LLC United Arab Emirates – 100% – –Helios Towers South Africa Holdings (Pty) Ltd South Africa – 66% – –Helios Towers South Africa (Pty) Ltd South Africa – 66% – –Helios Towers South Africa Services (Pty) Ltd South Africa – 62.5% – –HTSA Towers (Pty) Ltd South Africa – 59.1% – –
All subsidiaries were incorporated in prior years, other than HT Holdings Tanzania Ltd, Helios Towers Partners (UK) Limited and Helios Towers FZ-LLC which were incorporated in 2019. Helios Towers plc or its subsidiaries have subscribed to the majority of the shares as shown above. The consideration paid for these shares on incorporation was minimal. The Directors are of the opinion that the investments in subsidiaries are fairly stated and no impairment is required. The registered office address of all subsidiaries is included in the list of subsidiaries.
Financial Statements
Notes to the Financial StatementsFor the year ended 31 December 2019 (continued)

135
Helios Towers plcAnnual Report and Financial Statements 2019
Overview StrategicReport
GovernanceReport
Financial Statements
13. INVESTMENTS (CONTINUED)Helios Towers Ghana Limited, Helios Towers South Africa Holdings (Pty) Ltd , HTA Holdings Ltd, Helios Towers DRC S.A.R.L., Helios Towers Tanzania Limited, HT Congo Brazzaville Holdco Limited, Helios Chad Holdco Limited, Towers NL Coöperatief U.A., McRory Investment B.V., McTam International 1 B.V. and HTA (UK) Partner Ltd are intermediate holding companies.
The principal activities of HTG Managed Services Limited, HT DRC Infraco S.A.R.L., HTT Infraco Limited, and Helios Towers Congo Brazzaville SASU and the remaining South African entities are the building and maintenance of telecommunications towers to provide space on those towers to wireless telecommunication service providers in Africa. South Africa entities were acquired in 2019. See Note 30.
All investments relate to ordinary shares.
14. INVENTORIES2019
US$m2018
US$m
Inventories 9.3 10.3
Inventories are primarily made up of fuel stocks of US$6.6 million (2018: US$7.7 million) and raw materials of US$2.7 million (2018: US$2.6 million). The impact of inventories recognised as an expense during the year in respect of continuing operations was US$56.8 million (2018: US$57.2 million).
There is no material difference between the carrying value of inventories and their net realisable value.
15. TRADE AND OTHER RECEIVABLES2019
US$m2018
US$m
Trade receivables 105.7 72.0Loss allowance (6.4) (6.5)
99.3 65.5Trade receivable from related parties 23.4 10.0
122.7 75.5Other receivables 37.1 21.5VAT & withholding tax receivable 6.7 5.3
166.5 102.3
RECONCILIATION OF ALLOWANCE FOR IMPAIRMENT OF TRADE AND OTHER RECEIVABLES2019
US$m2018
US$m
Balance brought forward 6.5 4.7Provision for impairment - 1.8Unused amounts reversed (0.1) -
6.4 6.5
The Group measures the loss allowance for trade receivables and trade receivables from related parties at an amount equal to lifetime expected credit losses (“ECL”). The expected credit losses on trade receivables are estimated using a provision matrix by reference to past default experience of the debtor and an analysis of the debtor’s current financial position, adjusted for factors that are specific to the debtors, general economic conditions of the industry in which the debtors operate and an assessment of both the current as well as the forecast direction of conditions at the reporting date.
There has been no change in the estimation techniques or significant assumptions made during the current reporting period.Interest can be charged on past due debtors. The normal credit period of services is 30 days.
Other receivables mainly comprise of accrued income, sundry receivables and Escrow receivables.

136
Helios Towers plcAnnual Report and Financial Statements 2019
15. TRADE AND OTHER RECEIVABLES (CONTINUED)Of the trade receivables balance at 31 December 2019, 73% (31 December 2018: 61%) is due from five of the Group’s largest customers. The Group does not hold any collateral or other credit enhancements over these balances nor does it have a legal right of offset against any amounts owed by the Group to the counterparty.
DEBTOR DAYSThe Group calculates debtor days as set out in the table below. It considers its most relevant customer receivables exposure on a given reporting date to be the amount of receivables due in relation to the revenue that has been reported up to that date. It therefore defines its net receivables as the total trade receivables and accrued revenue, less deferred income.
2019 US$m
2018 US$m
Trade receivables(1) 129.1 82.0Accrued revenue(2) 2.2 2.1Less: Loss allowance (6.4) (6.5)Less: Deferred income (64.4) (48.1)
Net receivables 60.5 29.5
Revenue 387.8 356.0
Debtor days 57 30
(1) Trade receivables, including related parties(2) Reported within other receivables
In determining the recoverability of a trade receivable, the Group considers any change in the credit quality of the trade receivable from the date credit was initially granted up to the reporting date. The Directors consider that the carrying amount of trade and other receivables is approximately equal to their fair value.
Terms and conditions attached to receivable balances due by related parties and by the non-controlling interest are disclosed in Note 23.
16. PREPAYMENTS2019
US$m2018
US$m
Prepayments 14.1 16.4
Prepayments primarily comprise advance payments to suppliers.
17. CASH AND CASH EQUIVALENTS2019
US$m2018
US$m
Bank balances 216.8 57.8Short-term deposits 4.3 31.2
221.1 89.0
The bank balances as at 31 December 2019 include restricted cash of US$37.7 million (31 December 2018: US$Nil) relating to Change of Control Taxes. See Note 10 for further details.
Financial Statements
Notes to the Financial StatementsFor the year ended 31 December 2019 (continued)

137
Helios Towers plcAnnual Report and Financial Statements 2019
Overview StrategicReport
GovernanceReport
Financial Statements
18. SHARE CAPITAL2019 2018
Number of shares US$m
Number of shares US$m
Authorised, issued and fully paidOrdinary shares of £0.01 each 1,000,000,000 12.8 – –Ordinary share capital class A of US$1 – – 390,410,138 390.4Ordinary share capital class C of US$100 – – 100 –Ordinary share capital class D of US$1 – – 100 –Ordinary share capital class G of US$1 – – 518,714,176 518.8Ordinary share capital class H of US$100 – – 100 –Ordinary share capital class Z of US$100 – – 100 –
1,000,000,000 12.8 909,124,714 909.2
The share capital of the Group is represented by the share capital of the Company, Helios Towers plc. This Company was incorporated on 1 August 2019 to act as the holding company for the Group. Prior to this the share capital of the Group was represented by the share capital of the previous Company, Helios Towers, Ltd.
Helios Towers plc was incorporated on 1 August 2019 and issued one ordinary share of £1 at par. On 3 September 2019 the Company issued 49,999 non-voting redeemable preference shares with a nominal value of £1.00 each.
2019 SHARES RECONCILIATIONMovement of share capital during the year Number of shares US$m
Authorised, issued and fully paidHelios Towers share exchange (refer below) 907,418,137 11.6Shares issued on IPO (refer below) 86,386,373 1.1EBT Shares (refer below) 6,195,490 0.1
Total number of issued shares 1,000,000,000 12.8
On 15 October 2019 the date of completion of the IPO, the Pre-IPO Reorganisation was effected, comprising the following steps;• the Company issued 907,418,137 ordinary shares of £1.00 in a share for share exchange ratio of 99.8% for the entire share
capital of Helios Towers, Ltd; As part of the share exchange the management incentive plans were unwound. Included in the shares issued are 356,299 shares of £1.00 nominal value issued to the Helios Towers plc employee benefit trust (“EBT”) in respect of MIP V Option Awards;
• The Company issued a further 6,195,490 ordinary shares to the trustee of the EBT in order to satisfy settlement of nil-cost options awarded under the legacy LTIP scheme;
• The Company repurchased and cancelled the 49,999 redeemable preference shares of £1.00 at nominal value;• In connection with the IPO the Company issued 86,386,373 new ordinary shares in exchange for cash at a price of £1.15
per share. Issuance costs of US$7.3 million were recognised against the share premium account in accordance with the Companies Act 2006, section 610.
On 3 December 2019, the Company completed a court-approved reduction of capital. The purpose of the reduction of capital was to provide distributable reserves which will allow the Company the flexibility to make future dividend payments. Following the reduction of capital, the number of issued shares and the rights attached to those shares remained unchanged. The nominal value of the ordinary shares in the capital of the Company was reduced by £0.99 from £1.00 to £0.01. On 12 December 2019 the Company issued a further 910,436 shares to the trustee of the EBT in order to satisfy options awarded under the LTIP scheme.
The Treasury shares represent the cost of shares in Helios Towers plc purchased in the market and held by the Helios Towers plc Employee Benefit Trust to satisfy options under the Group Share options plan. Treasury shares held by the Group as at 31 December 2019 are 3,046,273 (31 December 2018: nil).
Other reserves are disclosed in the consolidated statement of changes in equity.
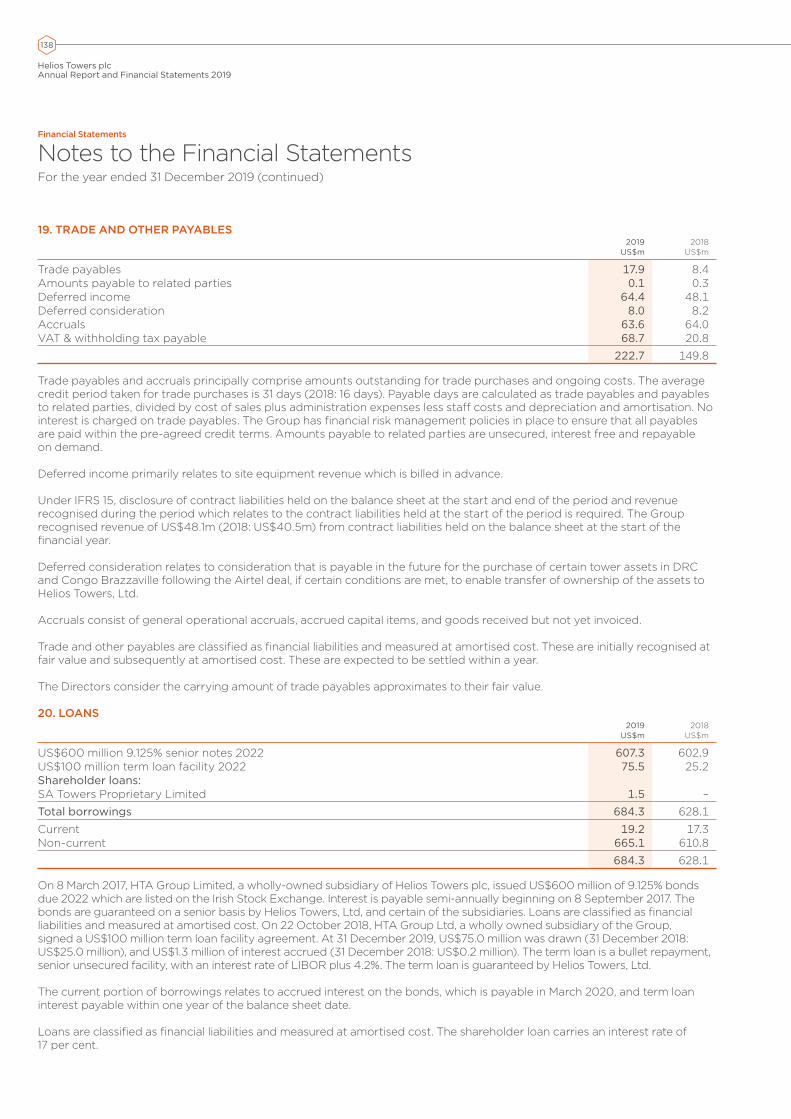
138
Helios Towers plcAnnual Report and Financial Statements 2019
19. TRADE AND OTHER PAYABLES2019
US$m2018
US$m
Trade payables 17.9 8.4Amounts payable to related parties 0.1 0.3Deferred income 64.4 48.1Deferred consideration 8.0 8.2Accruals 63.6 64.0VAT & withholding tax payable 68.7 20.8
222.7 149.8
Trade payables and accruals principally comprise amounts outstanding for trade purchases and ongoing costs. The average credit period taken for trade purchases is 31 days (2018: 16 days). Payable days are calculated as trade payables and payables to related parties, divided by cost of sales plus administration expenses less staff costs and depreciation and amortisation. No interest is charged on trade payables. The Group has financial risk management policies in place to ensure that all payables are paid within the pre-agreed credit terms. Amounts payable to related parties are unsecured, interest free and repayable on demand.
Deferred income primarily relates to site equipment revenue which is billed in advance.
Under IFRS 15, disclosure of contract liabilities held on the balance sheet at the start and end of the period and revenue recognised during the period which relates to the contract liabilities held at the start of the period is required. The Group recognised revenue of US$48.1m (2018: US$40.5m) from contract liabilities held on the balance sheet at the start of the financial year.
Deferred consideration relates to consideration that is payable in the future for the purchase of certain tower assets in DRC and Congo Brazzaville following the Airtel deal, if certain conditions are met, to enable transfer of ownership of the assets to Helios Towers, Ltd.
Accruals consist of general operational accruals, accrued capital items, and goods received but not yet invoiced.
Trade and other payables are classified as financial liabilities and measured at amortised cost. These are initially recognised at fair value and subsequently at amortised cost. These are expected to be settled within a year.
The Directors consider the carrying amount of trade payables approximates to their fair value.
20. LOANS2019
US$m2018
US$m
US$600 million 9.125% senior notes 2022 607.3 602.9US$100 million term loan facility 2022 75.5 25.2Shareholder loans:SA Towers Proprietary Limited 1.5 –
Total borrowings 684.3 628.1
Current 19.2 17.3Non-current 665.1 610.8
684.3 628.1
On 8 March 2017, HTA Group Limited, a wholly-owned subsidiary of Helios Towers plc, issued US$600 million of 9.125% bonds due 2022 which are listed on the Irish Stock Exchange. Interest is payable semi-annually beginning on 8 September 2017. The bonds are guaranteed on a senior basis by Helios Towers, Ltd, and certain of the subsidiaries. Loans are classified as financial liabilities and measured at amortised cost. On 22 October 2018, HTA Group Ltd, a wholly owned subsidiary of the Group, signed a US$100 million term loan facility agreement. At 31 December 2019, US$75.0 million was drawn (31 December 2018: US$25.0 million), and US$1.3 million of interest accrued (31 December 2018: US$0.2 million). The term loan is a bullet repayment, senior unsecured facility, with an interest rate of LIBOR plus 4.2%. The term loan is guaranteed by Helios Towers, Ltd.
The current portion of borrowings relates to accrued interest on the bonds, which is payable in March 2020, and term loan interest payable within one year of the balance sheet date.
Loans are classified as financial liabilities and measured at amortised cost. The shareholder loan carries an interest rate of 17 per cent.
Financial Statements
Notes to the Financial StatementsFor the year ended 31 December 2019 (continued)
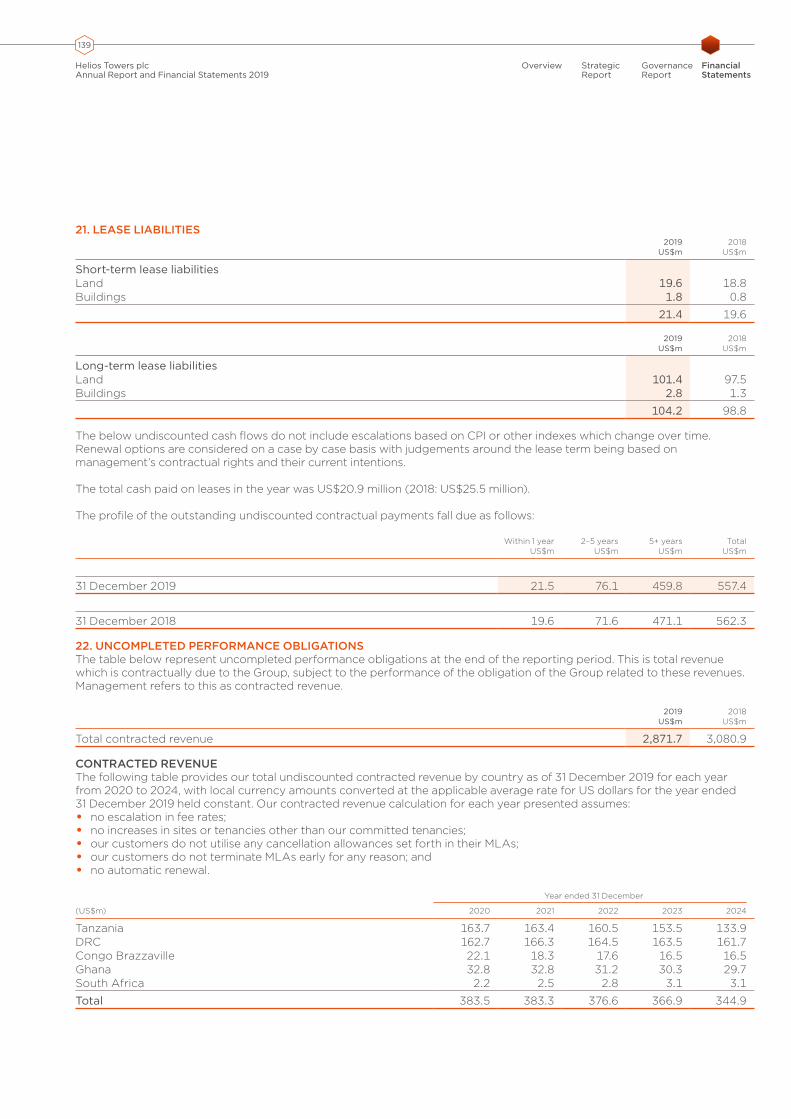
139
Helios Towers plcAnnual Report and Financial Statements 2019
Overview StrategicReport
GovernanceReport
Financial Statements
21. LEASE LIABILITIES2019
US$m2018
US$m
Short-term lease liabilitiesLand 19.6 18.8Buildings 1.8 0.8
21.4 19.6
2019 US$m
2018 US$m
Long-term lease liabilitiesLand 101.4 97.5Buildings 2.8 1.3
104.2 98.8
The below undiscounted cash flows do not include escalations based on CPI or other indexes which change over time. Renewal options are considered on a case by case basis with judgements around the lease term being based on management’s contractual rights and their current intentions.
The total cash paid on leases in the year was US$20.9 million (2018: US$25.5 million).
The profile of the outstanding undiscounted contractual payments fall due as follows:
Within 1 year US$m
2–5 years US$m
5+ years US$m
Total US$m
31 December 2019 21.5 76.1 459.8 557.4
31 December 2018 19.6 71.6 471.1 562.3
22. UNCOMPLETED PERFORMANCE OBLIGATIONSThe table below represent uncompleted performance obligations at the end of the reporting period. This is total revenue which is contractually due to the Group, subject to the performance of the obligation of the Group related to these revenues. Management refers to this as contracted revenue.
2019 US$m
2018 US$m
Total contracted revenue 2,871.7 3,080.9
CONTRACTED REVENUE The following table provides our total undiscounted contracted revenue by country as of 31 December 2019 for each year from 2020 to 2024, with local currency amounts converted at the applicable average rate for US dollars for the year ended 31 December 2019 held constant. Our contracted revenue calculation for each year presented assumes:• no escalation in fee rates;• no increases in sites or tenancies other than our committed tenancies;• our customers do not utilise any cancellation allowances set forth in their MLAs;• our customers do not terminate MLAs early for any reason; and• no automatic renewal.
Year ended 31 December
(US$m) 2020 2021 2022 2023 2024
Tanzania 163.7 163.4 160.5 153.5 133.9DRC 162.7 166.3 164.5 163.5 161.7Congo Brazzaville 22.1 18.3 17.6 16.5 16.5Ghana 32.8 32.8 31.2 30.3 29.7South Africa 2.2 2.5 2.8 3.1 3.1
Total 383.5 383.3 376.6 366.9 344.9
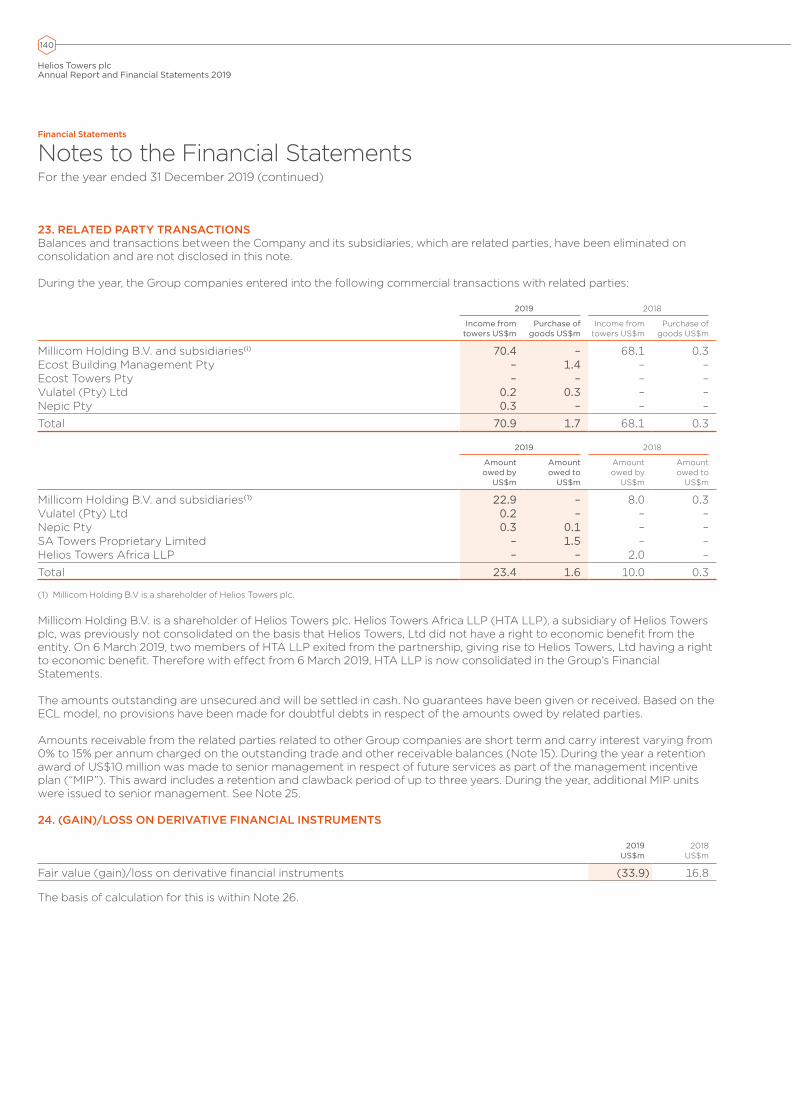
140
Helios Towers plcAnnual Report and Financial Statements 2019
23. RELATED PARTY TRANSACTIONSBalances and transactions between the Company and its subsidiaries, which are related parties, have been eliminated on consolidation and are not disclosed in this note.
During the year, the Group companies entered into the following commercial transactions with related parties:
2019 2018
Income from towers US$m
Purchase of goods US$m
Income from towers US$m
Purchase of goods US$m
Millicom Holding B.V. and subsidiaries(i) 70.4 – 68.1 0.3Ecost Building Management Pty – 1.4 – –Ecost Towers Pty – – – –Vulatel (Pty) Ltd 0.2 0.3 – –Nepic Pty 0.3 – – –
Total 70.9 1.7 68.1 0.3
2019 2018
Amount owed by
US$m
Amount owed to
US$m
Amount owed by
US$m
Amount owed to
US$m
Millicom Holding B.V. and subsidiaries(1) 22.9 – 8.0 0.3Vulatel (Pty) Ltd 0.2 – – –Nepic Pty 0.3 0.1 – –SA Towers Proprietary Limited – 1.5 – –Helios Towers Africa LLP – – 2.0 –
Total 23.4 1.6 10.0 0.3
(1) Millicom Holding B.V is a shareholder of Helios Towers plc.
Millicom Holding B.V. is a shareholder of Helios Towers plc. Helios Towers Africa LLP (HTA LLP), a subsidiary of Helios Towers plc, was previously not consolidated on the basis that Helios Towers, Ltd did not have a right to economic benefit from the entity. On 6 March 2019, two members of HTA LLP exited from the partnership, giving rise to Helios Towers, Ltd having a right to economic benefit. Therefore with effect from 6 March 2019, HTA LLP is now consolidated in the Group’s Financial Statements.
The amounts outstanding are unsecured and will be settled in cash. No guarantees have been given or received. Based on the ECL model, no provisions have been made for doubtful debts in respect of the amounts owed by related parties.
Amounts receivable from the related parties related to other Group companies are short term and carry interest varying from 0% to 15% per annum charged on the outstanding trade and other receivable balances (Note 15). During the year a retention award of US$10 million was made to senior management in respect of future services as part of the management incentive plan (“MIP”). This award includes a retention and clawback period of up to three years. During the year, additional MIP units were issued to senior management. See Note 25.
24. (GAIN)/LOSS ON DERIVATIVE FINANCIAL INSTRUMENTS
2019 US$m
2018 US$m
Fair value (gain)/loss on derivative financial instruments (33.9) 16.8
The basis of calculation for this is within Note 26.
Financial Statements
Notes to the Financial StatementsFor the year ended 31 December 2019 (continued)

141
Helios Towers plcAnnual Report and Financial Statements 2019
Overview StrategicReport
GovernanceReport
Financial Statements
25. SHARE-BASED PAYMENTSThe HT Group had six share share-based payment plans in effect in the 2019 financial year. Five of these plans (“Legacy agreements”) were in place prior to admission on the London Stock Exchange, these plans were generally referred to as “MIP I”, “MIP II” and “MIP III”, “MIP V” (each, a “MIP”), and “HT LTIP”. In October 2019, the HTL group was admitted for listing on the London Stock Exchange. All of the MIP plans and HT LTIP in place were unwound prior to admission.
After admission onto the London Stock Exchange, the Company adopted a discretionary share plan called the Helios Towers plc Employee Incentive Plan 2019 (the “EIP”), details of which are set out in this note.
LEGACY AGREEMENTSThe MIPs were designed to provide long-term incentives for senior managers and above (including Executive Directors) to deliver long-term shareholder returns. Participants in the MIPs benefited from the return on certain classes of shares in HT Ltd created for the purposes of the MIPs in the event of an IPO or other form of change of control or shareholder distributions.
Each of the MIPs was structured by way of a Cayman Islands exempted limited partnership which held the relevant class of shares in HT Ltd. The MIP participants were all limited partners in one or more of the MIP limited partnerships which held units, and each unit represents an interest in an underlying MIP share held in the partnership. Participant entitlements relating to the units were subject to various leaver and claw back provisions.
In the year ended 31 December 2018, the HT Group recognised no share-based payment expense. The IPO or change of control is a non-market vesting condition and therefore on the basis that an IPO or change of control was not expected at 31 December 2018, no expense was recognised.
In October 2019, the Group made an announcement to pursue an IPO on the London Stock Exchange. As a result shares were issued to entitled employees and a share-based payment expense was recognised in the income statement, being the fair value of the awards at their respective grant dates. The Group was successfully admitted to trading on the London Stock Exchange in October 2019.
SHARE OPTIONS PRE-IPOIn addition, ahead of the IPO certain Directors, former Directors, Senior Managers and employees of the Group were granted nil-cost options in respect of shares up to an aggregate value of US$10 million based on an offer price of 115 pence and a U.S. dollar to pounds sterling conversion rate of US$1:£0.7948 (the “HT LTIP”).
These options are due to become exercisable over a three-year period post-IPO. The award participants were entitled to exercise some of the share options on IPO.
Number of options
As at 1 January 2019 273Granted during the year 20,000Exercised during the year (19,041)Forfeited during the year –
Vested and exercisable at 31 December 2019 1,232
The charge recognised in the consolidated income statement for the year ended 31 December 2019 in respect to these share options was US$19.6 million.
In the event an option holder becomes a “bad leaver”, any of their options which have not yet become exercisable will lapse.
On and after the first anniversary of admission to the London Stock Exchange, each participant’s remaining entitlements (whether shares and/or options over shares) will cease to be subject to forfeiture in accordance with a defined schedule.
The Company issued 6,557,668 shares to the trustee of the Trust (or as it directs) immediately prior to IPO in order to satisfy future settlement of awards under the HT LTIP and nil-cost options under the HT MIPs. The Trust is consolidated into the Group.

142
Helios Towers plcAnnual Report and Financial Statements 2019
25. SHARE-BASED PAYMENTS (CONTINUED)FAIR VALUE OF OPTIONS/SHARE AWARDS GRANTED PRE-IPOThe fair value at grant date is independently determined using a probability-weighted expected returns methodology, which is an appropriate future-orientated approach when considering the fair value of options/shares that have no intrinsic value at the time of issue. In this case the expected future returns were estimated by reference to the expected proceeds attributable to the underlying shares at IPO, as provided by management, including adjustments for expected net debt, transaction costs and priority returns to other shareholders. This is then discounted into present value terms adopting an appropriate discount rate. The capital asset pricing methodology was used when considering an appropriate discount rate to apply to the payout expected to accrue to the share awards on realisation.
Key assumptions:• Expected exit dates 0 to 4 years;• Probability weightings up to 25%;• Expected range of exit multiples up to 10.0x; • Expected forecast Adjusted EBITDA across two scenarios (management case and downside case) and respective
probability weightings;• Estimated proceeds per share; and• Hurdle per share up to US$1.25.
EMPLOYEE INCENTIVE PLANFollowing successful admission to the London Stock Exchange the Company has adopted a discretionary share plan called the Helios Towers plc Employee Incentive Plan 2019 (the “EIP”). The Employee Incentive Plan is designed to provide long-term incentives for senior managers and above (including Executive Directors) to deliver long-term shareholder returns. Participation in the plan is at the Remuneration Committee’s discretion, and no individual has a contractual right to participate in the plan or to receive any guaranteed benefits. Shares received under the scheme by Executive Directors will be subject to a two-year post-vesting holding period, In all other respects the shares rank equally with other fully paid ordinary shares on issue.
In November 2019, the Group offered 4,271,821 nil cost share awards to selected Executive Directors and other senior executives. The equity settled awards comprise three equal and separate tranches which vest depending upon the achievement of the following performance targets over a three year period: • Relative TSR tranche;• Adjusted EBITDA tranche; and• ROIC tranche.
Set out below are summaries of options granted under the EIP.
2019Number of
options
As at 1 January 2019 –Granted during the year 4,271,821Exercised during the year –Forfeited during the year –
As at 31 December 2019 4,271,821Vested and exercisable at 31 December 2019 –
The charge recognised in the Consolidated Income Statement for the 2019 Financial Year in respect to the EIP was US$0.08 million.
Financial Statements
Notes to the Financial StatementsFor the year ended 31 December 2019 (continued)
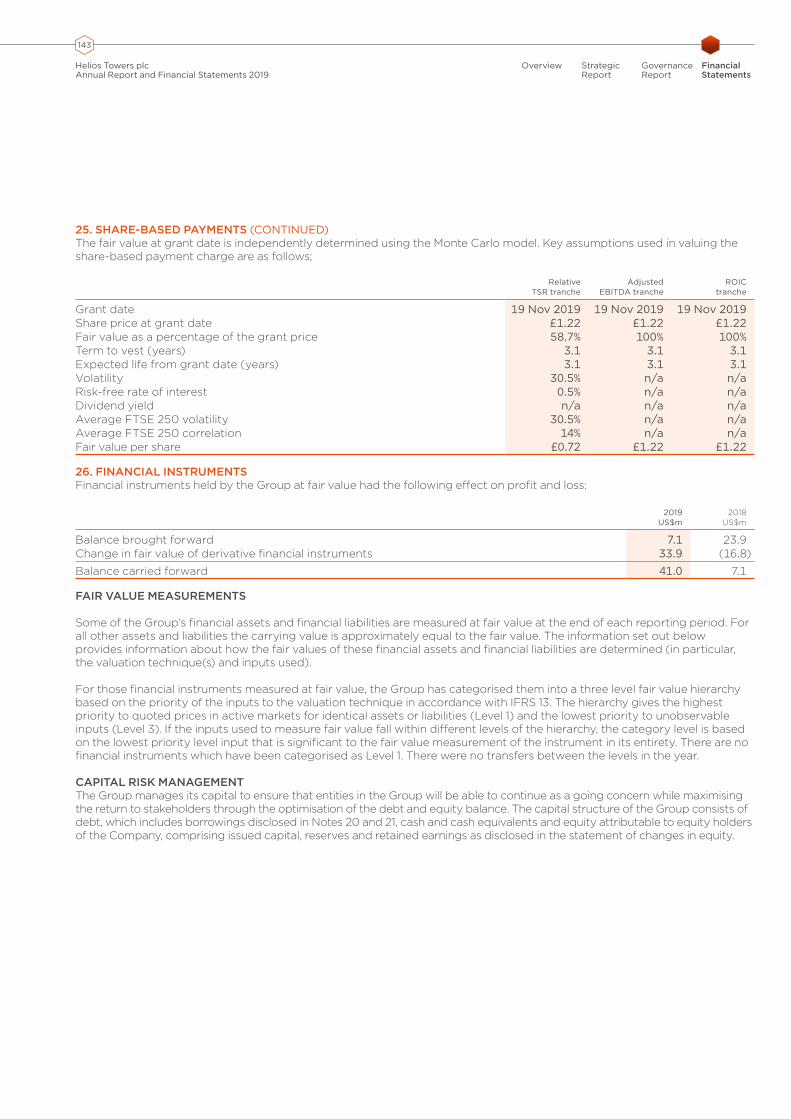
143
Helios Towers plcAnnual Report and Financial Statements 2019
Overview StrategicReport
GovernanceReport
Financial Statements
25. SHARE-BASED PAYMENTS (CONTINUED)The fair value at grant date is independently determined using the Monte Carlo model. Key assumptions used in valuing the share-based payment charge are as follows;
Relative TSR tranche
Adjusted EBITDA tranche
ROIC tranche
Grant date 19 Nov 2019 19 Nov 2019 19 Nov 2019Share price at grant date £1.22 £1.22 £1.22Fair value as a percentage of the grant price 58.7% 100% 100%Term to vest (years) 3.1 3.1 3.1Expected life from grant date (years) 3.1 3.1 3.1Volatility 30.5% n/a n/aRisk-free rate of interest 0.5% n/a n/aDividend yield n/a n/a n/aAverage FTSE 250 volatility 30.5% n/a n/aAverage FTSE 250 correlation 14% n/a n/aFair value per share £0.72 £1.22 £1.22
26. FINANCIAL INSTRUMENTSFinancial instruments held by the Group at fair value had the following effect on profit and loss:
2019US$m
2018US$m
Balance brought forward 7.1 23.9Change in fair value of derivative financial instruments 33.9 (16.8)
Balance carried forward 41.0 7.1
FAIR VALUE MEASUREMENTS
Some of the Group’s financial assets and financial liabilities are measured at fair value at the end of each reporting period. For all other assets and liabilities the carrying value is approximately equal to the fair value. The information set out below provides information about how the fair values of these financial assets and financial liabilities are determined (in particular, the valuation technique(s) and inputs used).
For those financial instruments measured at fair value, the Group has categorised them into a three level fair value hierarchy based on the priority of the inputs to the valuation technique in accordance with IFRS 13. The hierarchy gives the highest priority to quoted prices in active markets for identical assets or liabilities (Level 1) and the lowest priority to unobservable inputs (Level 3). If the inputs used to measure fair value fall within different levels of the hierarchy, the category level is based on the lowest priority level input that is significant to the fair value measurement of the instrument in its entirety. There are no financial instruments which have been categorised as Level 1. There were no transfers between the levels in the year.
CAPITAL RISK MANAGEMENTThe Group manages its capital to ensure that entities in the Group will be able to continue as a going concern while maximising the return to stakeholders through the optimisation of the debt and equity balance. The capital structure of the Group consists of debt, which includes borrowings disclosed in Notes 20 and 21, cash and cash equivalents and equity attributable to equity holders of the Company, comprising issued capital, reserves and retained earnings as disclosed in the statement of changes in equity.

144
Helios Towers plcAnnual Report and Financial Statements 2019
26. FINANCIAL INSTRUMENTS (CONTINUED)GEARING RATIOThe Group keeps its capital structure under review. The gearing ratio at the year end is as follows:
2019 US$m
2018 US$m
Debt (net of issue costs) 809.9 746.5Cash and cash equivalents (excluding restricted cash – see Note 17) (183.4) (89.0)
Net debt 626.5 657.5Equity attributable to the owners 175.9 121.7
356% 540%
Debt is defined as long-term and short-term loans and lease liabilities, as detailed in Notes 20 and 21.
Equity includes all capital and reserves of the Group attributable to equity holders of the Company.
EXTERNALLY IMPOSED CAPITAL REQUIREMENTSThe Group is not subject to externally imposed capital requirements.
CATEGORIES OF FINANCIAL INSTRUMENTS2019
US$m2018
US$m
Financial assetsFinancial assets at amortised cost:Cash and cash equivalents 221.1 89.0Trade and other receivables 159.8 97.0Fair value through profit or loss:Derivative financial assets 41.0 7.1
421.9 193.1
Financial liabilities Amortised cost:Trade and other payables 89.6 80.9Contingent consideration 9.5 –Lease liabilities 125.6 118.4Loans 684.3 628.1
909.0 827.4
As at 31 December 2019 and 31 December 2018, the Group had no cash pledged as collateral for financial liabilities. The Directors estimate the amortised cost of borrowings and cash and cash equivalents is approximate to fair value.
FINANCIAL RISK MANAGEMENT OBJECTIVES AND POLICIESThe Group’s finance function provides services to the business, coordinates access to domestic and international financial markets, and monitors and manages the financial risks relating to the operations of the Group through internal risk reports which analyse exposures by degree and magnitude of risks. These risks include market risk (including currency risk, fair value interest rate risk and price risk), credit risk, liquidity risk and cash flow interest rate risk. The Group seeks to minimise the effects of these risks by using derivative financial instruments to hedge these risk exposures. The use of financial derivatives is governed by the Group’s policies approved by the Board of Directors, which provide written principles on foreign exchange risk, interest rate risk, credit risk, the use of financial derivatives and non-derivative financial instruments. Compliance with policies and exposure limits is reviewed by the Board of Directors regularly. The Group does not enter into or trade financial instruments, including derivative financial instruments, for speculative purposes.
Key financial risks and exposures are monitored through a monthly report to the Board of Directors, together with an annual Board review of corporate treasury matters. The Group has exposure to sterling (“GBP”) fluctuations, however this is not considered material.
Financial Statements
Notes to the Financial StatementsFor the year ended 31 December 2019 (continued)
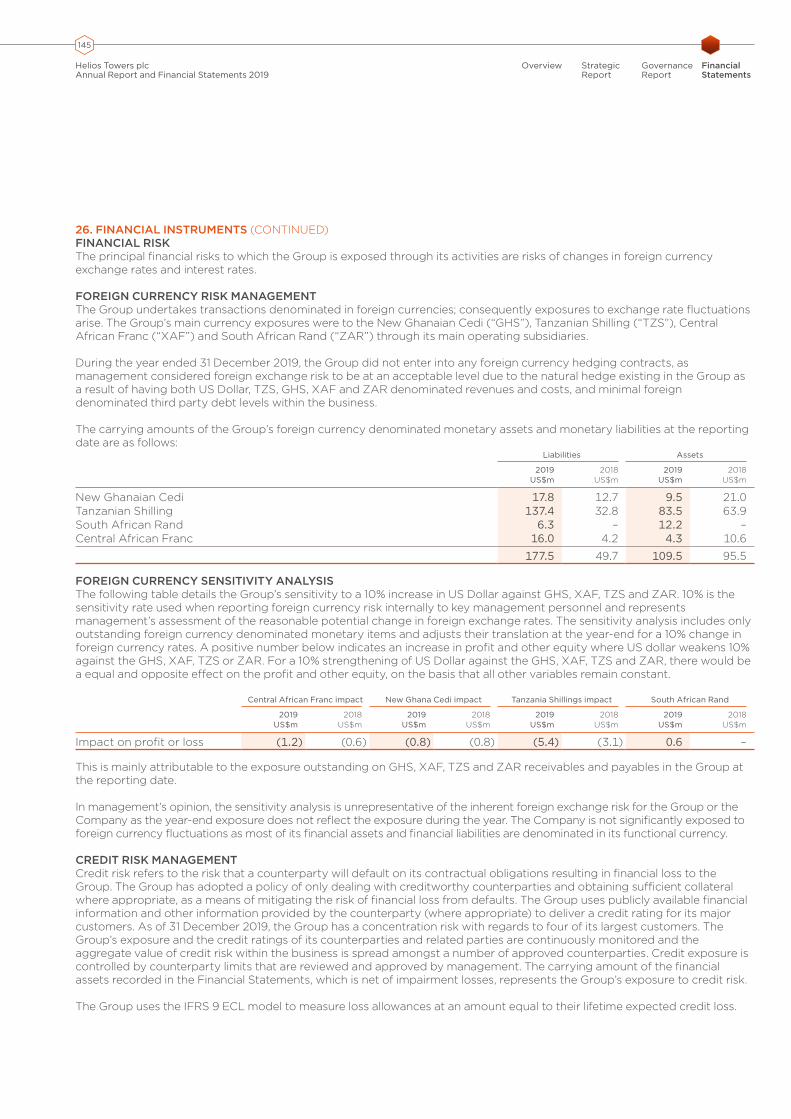
145
Helios Towers plcAnnual Report and Financial Statements 2019
Overview StrategicReport
GovernanceReport
Financial Statements
26. FINANCIAL INSTRUMENTS (CONTINUED)FINANCIAL RISKThe principal financial risks to which the Group is exposed through its activities are risks of changes in foreign currency exchange rates and interest rates.
FOREIGN CURRENCY RISK MANAGEMENTThe Group undertakes transactions denominated in foreign currencies; consequently exposures to exchange rate fluctuations arise. The Group’s main currency exposures were to the New Ghanaian Cedi (“GHS”), Tanzanian Shilling (“TZS”), Central African Franc (“XAF”) and South African Rand (“ZAR”) through its main operating subsidiaries.
During the year ended 31 December 2019, the Group did not enter into any foreign currency hedging contracts, as management considered foreign exchange risk to be at an acceptable level due to the natural hedge existing in the Group as a result of having both US Dollar, TZS, GHS, XAF and ZAR denominated revenues and costs, and minimal foreign denominated third party debt levels within the business.
The carrying amounts of the Group’s foreign currency denominated monetary assets and monetary liabilities at the reporting date are as follows:
Liabilities Assets
2019 US$m
2018 US$m
2019 US$m
2018 US$m
New Ghanaian Cedi 17.8 12.7 9.5 21.0Tanzanian Shilling 137.4 32.8 83.5 63.9South African Rand 6.3 – 12.2 –Central African Franc 16.0 4.2 4.3 10.6
177.5 49.7 109.5 95.5
FOREIGN CURRENCY SENSITIVITY ANALYSISThe following table details the Group’s sensitivity to a 10% increase in US Dollar against GHS, XAF, TZS and ZAR. 10% is the sensitivity rate used when reporting foreign currency risk internally to key management personnel and represents management’s assessment of the reasonable potential change in foreign exchange rates. The sensitivity analysis includes only outstanding foreign currency denominated monetary items and adjusts their translation at the year-end for a 10% change in foreign currency rates. A positive number below indicates an increase in profit and other equity where US dollar weakens 10% against the GHS, XAF, TZS or ZAR. For a 10% strengthening of US Dollar against the GHS, XAF, TZS and ZAR, there would be a equal and opposite effect on the profit and other equity, on the basis that all other variables remain constant.
Central African Franc impact New Ghana Cedi impact Tanzania Shillings impact South African Rand
2019 US$m
2018 US$m
2019 US$m
2018 US$m
2019 US$m
2018 US$m
2019 US$m
2018 US$m
Impact on profit or loss (1.2) (0.6) (0.8) (0.8) (5.4) (3.1) 0.6 –
This is mainly attributable to the exposure outstanding on GHS, XAF, TZS and ZAR receivables and payables in the Group at the reporting date.
In management’s opinion, the sensitivity analysis is unrepresentative of the inherent foreign exchange risk for the Group or the Company as the year-end exposure does not reflect the exposure during the year. The Company is not significantly exposed to foreign currency fluctuations as most of its financial assets and financial liabilities are denominated in its functional currency.
CREDIT RISK MANAGEMENTCredit risk refers to the risk that a counterparty will default on its contractual obligations resulting in financial loss to the Group. The Group has adopted a policy of only dealing with creditworthy counterparties and obtaining sufficient collateral where appropriate, as a means of mitigating the risk of financial loss from defaults. The Group uses publicly available financial information and other information provided by the counterparty (where appropriate) to deliver a credit rating for its major customers. As of 31 December 2019, the Group has a concentration risk with regards to four of its largest customers. The Group’s exposure and the credit ratings of its counterparties and related parties are continuously monitored and the aggregate value of credit risk within the business is spread amongst a number of approved counterparties. Credit exposure is controlled by counterparty limits that are reviewed and approved by management. The carrying amount of the financial assets recorded in the Financial Statements, which is net of impairment losses, represents the Group’s exposure to credit risk.
The Group uses the IFRS 9 ECL model to measure loss allowances at an amount equal to their lifetime expected credit loss.
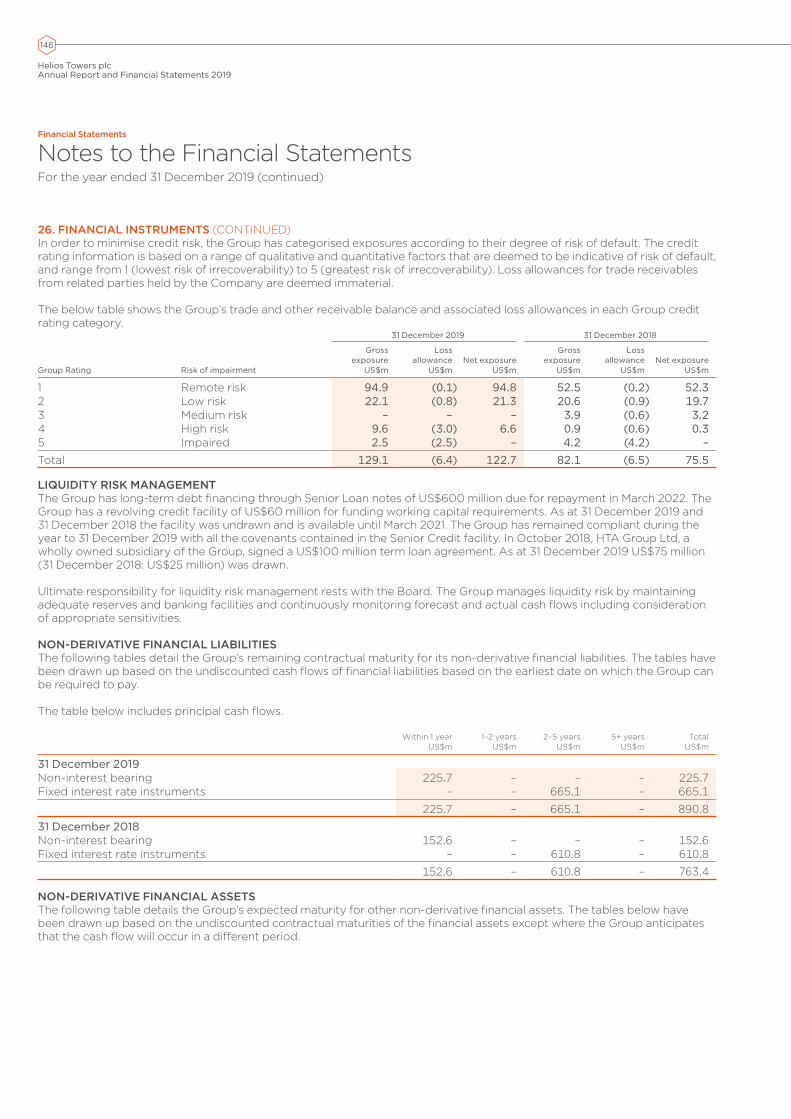
146
Helios Towers plcAnnual Report and Financial Statements 2019
26. FINANCIAL INSTRUMENTS (CONTINUED)In order to minimise credit risk, the Group has categorised exposures according to their degree of risk of default. The credit rating information is based on a range of qualitative and quantitative factors that are deemed to be indicative of risk of default, and range from 1 (lowest risk of irrecoverability) to 5 (greatest risk of irrecoverability). Loss allowances for trade receivables from related parties held by the Company are deemed immaterial.
The below table shows the Group’s trade and other receivable balance and associated loss allowances in each Group credit rating category.
31 December 2019 31 December 2018
Group Rating Risk of impairment
Gross exposure
US$m
Loss allowance
US$mNet exposure
US$m
Gross exposure
US$m
Loss allowance
US$mNet exposure
US$m
1 Remote risk 94.9 (0.1) 94.8 52.5 (0.2) 52.32 Low risk 22.1 (0.8) 21.3 20.6 (0.9) 19.73 Medium risk – – – 3.9 (0.6) 3.24 High risk 9.6 (3.0) 6.6 0.9 (0.6) 0.35 Impaired 2.5 (2.5) – 4.2 (4.2) –
Total 129.1 (6.4) 122.7 82.1 (6.5) 75.5 LIQUIDITY RISK MANAGEMENTThe Group has long-term debt financing through Senior Loan notes of US$600 million due for repayment in March 2022. The Group has a revolving credit facility of US$60 million for funding working capital requirements. As at 31 December 2019 and 31 December 2018 the facility was undrawn and is available until March 2021. The Group has remained compliant during the year to 31 December 2019 with all the covenants contained in the Senior Credit facility. In October 2018, HTA Group Ltd, a wholly owned subsidiary of the Group, signed a US$100 million term loan agreement. As at 31 December 2019 US$75 million (31 December 2018: US$25 million) was drawn.
Ultimate responsibility for liquidity risk management rests with the Board. The Group manages liquidity risk by maintaining adequate reserves and banking facilities and continuously monitoring forecast and actual cash flows including consideration of appropriate sensitivities.
NON-DERIVATIVE FINANCIAL LIABILITIESThe following tables detail the Group’s remaining contractual maturity for its non-derivative financial liabilities. The tables have been drawn up based on the undiscounted cash flows of financial liabilities based on the earliest date on which the Group can be required to pay.
The table below includes principal cash flows.
Within 1 year US$m
1–2 years US$m
2–5 years US$m
5+ years US$m
TotalUS$m
31 December 2019Non-interest bearing 225.7 – – – 225.7Fixed interest rate instruments – – 665.1 – 665.1
225.7 – 665.1 – 890.8
31 December 2018Non-interest bearing 152.6 – – – 152.6Fixed interest rate instruments – – 610.8 – 610.8
152.6 – 610.8 – 763.4
NON-DERIVATIVE FINANCIAL ASSETSThe following table details the Group’s expected maturity for other non-derivative financial assets. The tables below have been drawn up based on the undiscounted contractual maturities of the financial assets except where the Group anticipates that the cash flow will occur in a different period.
Financial Statements
Notes to the Financial StatementsFor the year ended 31 December 2019 (continued)
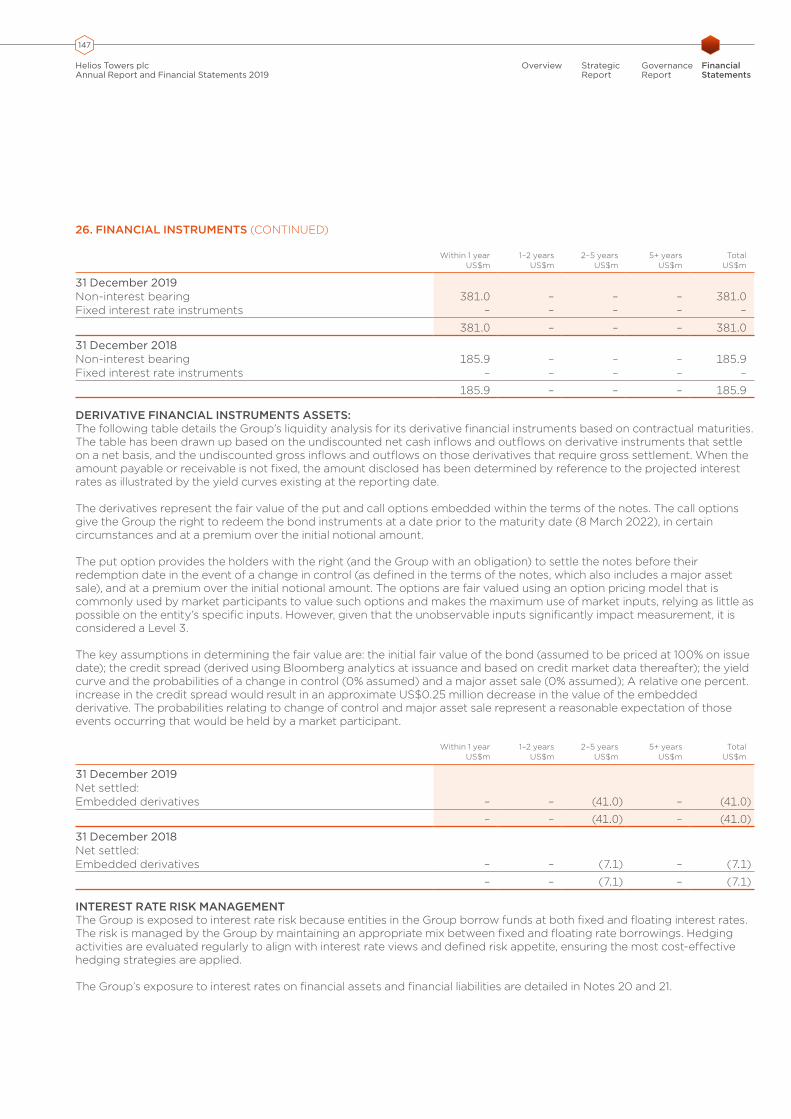
147
Helios Towers plcAnnual Report and Financial Statements 2019
Overview StrategicReport
GovernanceReport
Financial Statements
26. FINANCIAL INSTRUMENTS (CONTINUED)
Within 1 year US$m
1–2 years US$m
2–5 years US$m
5+ years US$m
TotalUS$m
31 December 2019Non-interest bearing 381.0 – – – 381.0Fixed interest rate instruments – – – – –
381.0 – – – 381.0
31 December 2018Non-interest bearing 185.9 – – – 185.9Fixed interest rate instruments – – – – –
185.9 – – – 185.9
DERIVATIVE FINANCIAL INSTRUMENTS ASSETS:The following table details the Group’s liquidity analysis for its derivative financial instruments based on contractual maturities. The table has been drawn up based on the undiscounted net cash inflows and outflows on derivative instruments that settle on a net basis, and the undiscounted gross inflows and outflows on those derivatives that require gross settlement. When the amount payable or receivable is not fixed, the amount disclosed has been determined by reference to the projected interest rates as illustrated by the yield curves existing at the reporting date.
The derivatives represent the fair value of the put and call options embedded within the terms of the notes. The call options give the Group the right to redeem the bond instruments at a date prior to the maturity date (8 March 2022), in certain circumstances and at a premium over the initial notional amount.
The put option provides the holders with the right (and the Group with an obligation) to settle the notes before their redemption date in the event of a change in control (as defined in the terms of the notes, which also includes a major asset sale), and at a premium over the initial notional amount. The options are fair valued using an option pricing model that is commonly used by market participants to value such options and makes the maximum use of market inputs, relying as little as possible on the entity’s specific inputs. However, given that the unobservable inputs significantly impact measurement, it is considered a Level 3.
The key assumptions in determining the fair value are: the initial fair value of the bond (assumed to be priced at 100% on issue date); the credit spread (derived using Bloomberg analytics at issuance and based on credit market data thereafter); the yield curve and the probabilities of a change in control (0% assumed) and a major asset sale (0% assumed); A relative one percent. increase in the credit spread would result in an approximate US$0.25 million decrease in the value of the embedded derivative. The probabilities relating to change of control and major asset sale represent a reasonable expectation of those events occurring that would be held by a market participant.
Within 1 year US$m
1–2 years US$m
2–5 years US$m
5+ years US$m
Total US$m
31 December 2019Net settled:Embedded derivatives – – (41.0) – (41.0)
– – (41.0) – (41.0)
31 December 2018Net settled:Embedded derivatives – – (7.1) – (7.1)
– – (7.1) – (7.1)
INTEREST RATE RISK MANAGEMENTThe Group is exposed to interest rate risk because entities in the Group borrow funds at both fixed and floating interest rates. The risk is managed by the Group by maintaining an appropriate mix between fixed and floating rate borrowings. Hedging activities are evaluated regularly to align with interest rate views and defined risk appetite, ensuring the most cost-effective hedging strategies are applied.
The Group’s exposure to interest rates on financial assets and financial liabilities are detailed in Notes 20 and 21.

148
Helios Towers plcAnnual Report and Financial Statements 2019
27. CONTINGENCIESContingent liabilities are potential future cash outflows, where the likelihood of payment is considered more than remote, but is not considered probable or cannot be measured reliably.
In the year ended 31 December 2015, the Democratic Republic of Congo’s National Tax Services issued an initial assessment for the financial years ended 31 December 2014 and 31 December 2015, of US$2.6 million. In the year ended 31 December 2018, Congo Brazzaville Public Treasury Authority commenced an investigation for the financial years ended 31 December 2014 to 31 December 2015 in relation to direct and indirect taxes. In the year ended 31 December 2019, the Ghana Revenue Authority issued an initial assessment on Transfer Pricing for years 2012 to 2017 of approximately US$10.0 million. The initial assessments are in early stages of review with local tax experts and as such the impact, if any, is unknown at this time.
The Directors have appealed against these assessments and together with their advisers are in discussion with the tax authorities to bring the matters to conclusion based on the facts.
LEGAL CLAIMSOther legal and regulatory proceedings, claims and unresolved disputes are pending against Helios Towers in respect of which the timing of resolution and potential outcome (including any future financial obligations) are uncertain and no provisions have been recognised in relation to these matters.
28. NET DEBT2019
US$m2018
US$m
External debt (684.3) (628.1)Lease liabilities (125.6) (118.4)Cash and cash equivalents (excluding restricted cash) 183.4 89.0
Net debt (626.5) (657.5)
The movement in net debt is as follows:
2019
At 1 January
2019 US$m
Cash flows US$m
Other(1)
US$m
At 31 December
2019 US$m
Cash and cash equivalents (excluding restricted cash) 89.0 94.9 (0.5) 183.4
External debt (628.1) (50.0) (6.2) (684.3)Lease liabilities (118.4) 5.4 (12.6) (125.6)
Total financing liabilities (746.5) (44.6) (18.8) (809.9)
Net debt (657.5) 50.3 (19.3) (626.5)
2018
At 1 January
2018 US$m
Cash flows US$m
Other(1)
US$m
At 31 December
2018 US$m
Cash and cash equivalents (excluding restricted cash) 119.7 (29.5) (1.2) 89.0
External debt (596.4) (25.0) (6.7) (628.1)Lease liabilities (116.6) 10.4 (12.2) (118.4)Derivative financial instruments (1.9) – 1.9 –
Total financing liabilities (714.9) (14.6) (17.0) (746.5)
Net debt (595.2) (44.1) (18.2) (657.5)
(1) Other includes foreign exchange and interest movements.
External debt is the total loans owed to commercial banks and institutional investors.
Financial Statements
Notes to the Financial StatementsFor the year ended 31 December 2019 (continued)

149
Helios Towers plcAnnual Report and Financial Statements 2019
Overview StrategicReport
GovernanceReport
Financial Statements
29. EARNINGS PER SHAREBasic earnings per share has been calculated by dividing the total loss for the year by the weighted average number of shares in issue during the year after adjusting for shares held in employee benefit trusts.
To calculate diluted earnings per share, the weighted average number of ordinary shares in issue is adjusted to assume conversion of all dilutive potential shares. Share options granted to employees where the exercise price is less than the average market price of the Company’s ordinary shares during the year are considered to be dilutive potential shares. Where share options are exercisable based on performance criteria and those performance criteria have been met during the year, these options are included in the calculation of dilutive potential shares.
The Directors believe that Adjusted EBITDA per share is representative of the operations of the business, refer to Note 4.
Earnings per share is based on:2019
US$m2018
US$m
Loss after tax for the year attributable to owners of the Company 135.9 (123.9)Adjusted EBITDA (Note 4) 205.2 177.6
2019Number
2018Number
Weighted average number of ordinary shares used to calculate basic earnings per share 926,493,633 909,124,714Weighted average number of dilutive potential shares 998,232 –Weighted average number of ordinary shares used to calculate diluted earnings per share 927,491,865 909,124,714
Loss per share2019
cents2018
cents
Basic (15) (14)Diluted (15) (14)
Adjusted EBITDA per share2019
cents2018
cents
Basic 22 20Diluted 22 20
The calculation of basic and diluted earnings per share is based on the net loss attributable to equity holders of the Company entity for the year US$135.9 million (2018: US$123.9 million). Basic and diluted earnings per share amounts are calculated by dividing the net loss attributable to equity shareholders of the Company entity by the weighted average number of shares outstanding during the year.
The calculation of Adjusted EBITDA per share and diluted EBITDA per share are based on the Adjusted EBITDA earnings for the year of US$205.2 million (2018: US$177.6 million). Refer to Note 4 for a reconciliation of Adjusted EBITDA to net loss before tax.
30. ACQUISITION OF SUBSIDIARY UNDERTAKINGSOn 30 April 2019, the Group acquired 89.5% of the voting equity shares of Helios Towers South Africa Holdings (Pty) Ltd and simultaneously entered into agreements with SA Towers Proprietary Limited and Sky Coverage Proprietary Limited, to purchase certain employee contracts and business assets comprising towers, tower sites and related assets as well as to transfer certain tenant leases. The Group has treated this as a single business combination transaction and accounted for it in accordance with IFRS 3 – Business Combinations (“IFRS 3”) using the acquisition method. The total consideration in respect of this transaction was US$20.0 million. Goodwill arising on this business combination has been allocated to the South Africa CGU. This acquisition is in line with the Group’s strategy.

150
Helios Towers plcAnnual Report and Financial Statements 2019
30. ACQUISITION OF SUBSIDIARY UNDERTAKINGS (CONTINUED)This business combination had the following effect on the Group’s assets and liabilities:
30 April 2019 US$m
Identifiable assets acquired:AssetsFair value of property, plant and equipment 7.6Fair value of intangible assets 11.5Other assets 0.2Total assets 19.3LiabilitiesAssumed liabilities (0.1)Deferred income (0.1)Deferred taxation (3.2)
Total net identifiable assets 15.9Goodwill on acquisition 4.1
Total consideration 20.0Consideration paid in cash 10.6Consideration paid in shares 0.1Contingent consideration 9.3
Total consideration 20.0
The goodwill is mainly attributable to the workforce and the future uprate potential of the sites acquired and is expected to be deductible for tax purposes.
The contingent consideration balance of US$9.5 million as of 31 December 2019 is made up of US$5.9 million long-term, and US$3.6 million included in the short-term balance. The contingent consideration is for a two year period ending April 2021.
ACQUISITION-RELATED CONTINGENT CONSIDERATIONThe contingent consideration balance is dependent on the timing of sites under construction being fully completed in accordance with technical specifications. The potential undiscounted amount of all future payments that the Group could be required to make under the contingent consideration arrangement is between US$nil and US$12 million undiscounted. The fair value of the contingent consideration arrangement of US$9.3 million was estimated at 30 April 2019 based on management knowledge of market outlook and future pipeline. There was no change in the fair value of the contingent consideration for the year ended 31 December 2019. The contingent consideration liability is categorised as Level 3 in the fair value hierarchy of IFRS 13. The calculation of the fair value of the contingent consideration balance is most sensitive to changes in the following assumptions: • number of sites coming on-air between 310 and 500; • timing of sites coming on-air for a period of two years; and • discount rate ranging from 15% to 20%.
As at 31 December, the Group finalised the acquisition accounting for the transaction, which resulted in an adjustment of: contingent consideration of US$13 million (from US$22.4 to US$9.3), intangible assets of US$11 million (from US$22.7 to US$11.5), goodwill of US$5 million (from US$9.2 to US$4.1) and deferred tax of US$3 million (from US$6.2 to US$3.2).
The Group incurred acquisition-related costs of US$0.7 million related to the above business combination in 2019. These costs have been included in deal costs in the Group’s consolidated income statement. For the period from 30 April 2019 to 31 December 2019 this acquisition contributed revenue of US$1.7 million and a loss of USD$1.9 million. If the above business combination had occurred on 1 January 2019, management estimates that Group consolidated revenue would have been US$388.7 million and Group consolidated loss before tax would have been US$65.6 million for the year ended 31 December 2019.
Financial Statements
Notes to the Financial StatementsFor the year ended 31 December 2019 (continued)

151
Helios Towers plcAnnual Report and Financial Statements 2019
Overview StrategicReport
GovernanceReport
Financial Statements
30. ACQUISITION OF SUBSIDIARY UNDERTAKINGS (CONTINUED)The Group has assessed the fair value of the assets acquired at US$19.3 million, in terms of IFRS 3, based on appropriate valuation methodology. The valuation techniques used for measuring the fair value of material assets acquired were as follows:
Assets acquired Valuation technique
Property, plant and equipment Depreciated replacement cost adjusted for physical deterioration as well as functional and economic obsolescence
Intangible assets (customer contracts) Multi-period excess earnings method which considers thepresent value of net cash flows expected to be generated by the customer relationships
31. SUBSEQUENT EVENTSThere are no reportable events after the balance sheet date.

152
Helios Towers plcAnnual Report and Financial Statements 2019
Note2019
US$m
Fixed assetsInvestments 3 1,165.1
1,165.1
Current assetsTrade and other receivables 4 5.7Prepayments 0.3Cash and cash equivalents 5 119.0
125.0
Total assets 1,290.1
EquityIssued capital and reservesShare capital 6 12.8
Stated capital 12.8Share-based payments reserves 10.0Other reserves 7.2Retained earnings 1,258.3
Total equity 1,288.3
Current liabilitiesTrade and other payables 7 1.8
Total liabilities 1.8
Total equity and liabilities 1,290.1
The loss for the period attributable to the shareholders of the Company and recorded through the accounts of the Company was US$20.2 million.
These Financial Statements were approved and authorised for issue by the Board on 12 March 2020 and signed on its behalf by:
Kash Pandya Tom Greenwood
The accompanying notes form an integral part of these Financial Statements.
Financial Statements
Company Statement of financial positionAs at 31 December
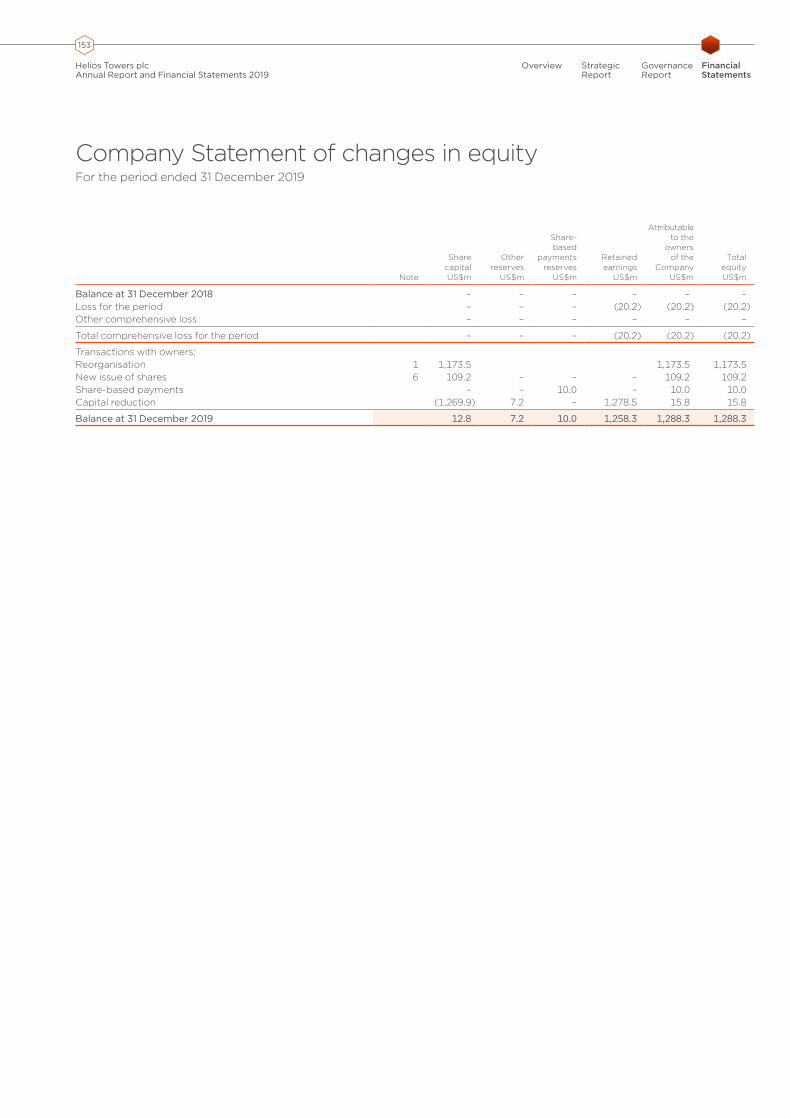
153
Helios Towers plcAnnual Report and Financial Statements 2019
Overview StrategicReport
GovernanceReport
Financial Statements
Note
SharecapitalUS$m
Other reserves
US$m
Share-based
payments reserves
US$m
Retained earnings
US$m
Attributable to the
owners of the
CompanyUS$m
Total equityUS$m
Balance at 31 December 2018 – – – – – –Loss for the period – – – (20.2) (20.2) (20.2)Other comprehensive loss – – – – – –
Total comprehensive loss for the period – – – (20.2) (20.2) (20.2)
Transactions with owners;Reorganisation 1 1,173.5 1,173.5 1,173.5New issue of shares 6 109.2 – – – 109.2 109.2Share-based payments – – 10.0 – 10.0 10.0Capital reduction (1,269.9) 7.2 – 1,278.5 15.8 15.8
Balance at 31 December 2019 12.8 7.2 10.0 1,258.3 1,288.3 1,288.3
Company Statement of changes in equityFor the period ended 31 December 2019

154
Helios Towers plcAnnual Report and Financial Statements 2019
Financial Statements
Notes to the Company Financial StatementsFor the period ended 31 December 2019
1. STATEMENT OF COMPLIANCE AND PRESENTATION OF FINANCIAL STATEMENTSHelios Towers plc, together with its subsidiaries (collectively, “Helios”, “the Group” or “the Company”), is a sub-Saharan independent tower company, with operations across five countries. Helios Towers plc is a public limited company incorporated and domiciled in the UK, and registered under the laws of England & Wales under company number 12134855 with its registered address at 10th Floor, 5 Merchant Square West, London W2 1AS, United Kingdom. The ordinary shares of Helios Towers plc were admitted to the premium listing segment of the Official List of the UK Financial Conduct Authority and trade on the London Stock Exchange plc’s main market for listed securities.
Prior to the Initial Public Offering (“IPO“), Helios Towers, Ltd (“HTL“) was the Company of the Group for which consolidated Financial Statements were produced. On 15 October 2019 (the date of completion of the IPO, with 18 October 2019 representing admission to trading on the London Stock Exchange), the shareholders of HTL transferred all of their shares in HTL to Helios Towers plc in exchange for ordinary shares of equal value in Helios Towers plc (“Reorganisation“). This resulted in Helios Towers plc becoming the new Company of the Group.
The principal accounting policies adopted by the Company are set out in Note 2.
2. ACCOUNTING POLICIESBASIS OF PREPARATIONThe Company Financial Statements have been prepared in accordance with applicable United Kingdom accounting standards, including Financial Reporting Standard 102 – ‘The Financial Reporting Standard applicable in the United Kingdom and Republic of Ireland’ (‘FRS 102’), and with the Companies Act 2006. This is the first set of Financial Statements for the Company.
The Financial Statements have been prepared on the historical cost basis. The Financial Statements are presented in United States dollars (US$), and rounded to the nearest hundred thousand (US$0.1 million) except where otherwise stated, which is the functional currency of the Company. Historical cost is generally based on the fair value of the consideration given in exchange for goods and services.
Helios Towers plc meets the definition of a qualifying entity under FRS 102 and has therefore taken advantage of the disclosure exemptions available to it in respect of its Financial Statements. Exemptions have been taken in relation to share-based payments, financial instruments, presentation of a cash flow statement, intra-Group transactions and remuneration of key management personnel.
The Company has taken advantage of section 408 of the Companies Act 2006 and has not included its own profit and loss account in these Financial Statements.
The principal accounting policies adopted are set out below.
VALUATION OF INVESTMENTSInvestments held as fixed assets are stated at cost, less any provision for impairment in value.
SHARE-BASED EMPLOYEE REMUNERATION The Company’s employees may benefit from a Group operated share-based payment arrangement. The fair value of equity settled awards for share based payments is determined at grant and expensed straight line over the period from grant to the date of earliest unconditional exercise. Refer to Note 25 of the Group Financial Statements for disclosure of share-based payments.
FINANCIAL INSTRUMENTSDisclosures on financial instruments have not been included in the Company’s Financial Statements as the Group consolidated Financial Statements include appropriate disclosures.
FINANCIAL ASSETS Trade debtors and other receivables are financial assets are carried at amortised cost.
FINANCIAL LIABILITIES Trade creditors and other payables are carried at amortised cost.
FOREIGN CURRENCYIn preparing the Financial Statements of the individual companies, transactions in currencies other than the entity’s functional currency (foreign currencies) are recognised at the rates of exchange prevailing on the dates of the transactions. At each reporting date, monetary assets and liabilities that are denominated in foreign currencies are re-translated at the rates prevailing at that date. Non-monetary items carried at fair value that are denominated in foreign currencies are translated at the rates prevailing at the date when the fair value was determined.
MERGERAs part of the reorganisation outlined in Note 1 the Group applied merger relief as set out in section 612 of the Companies Act 2006, no share premium has been recognised.
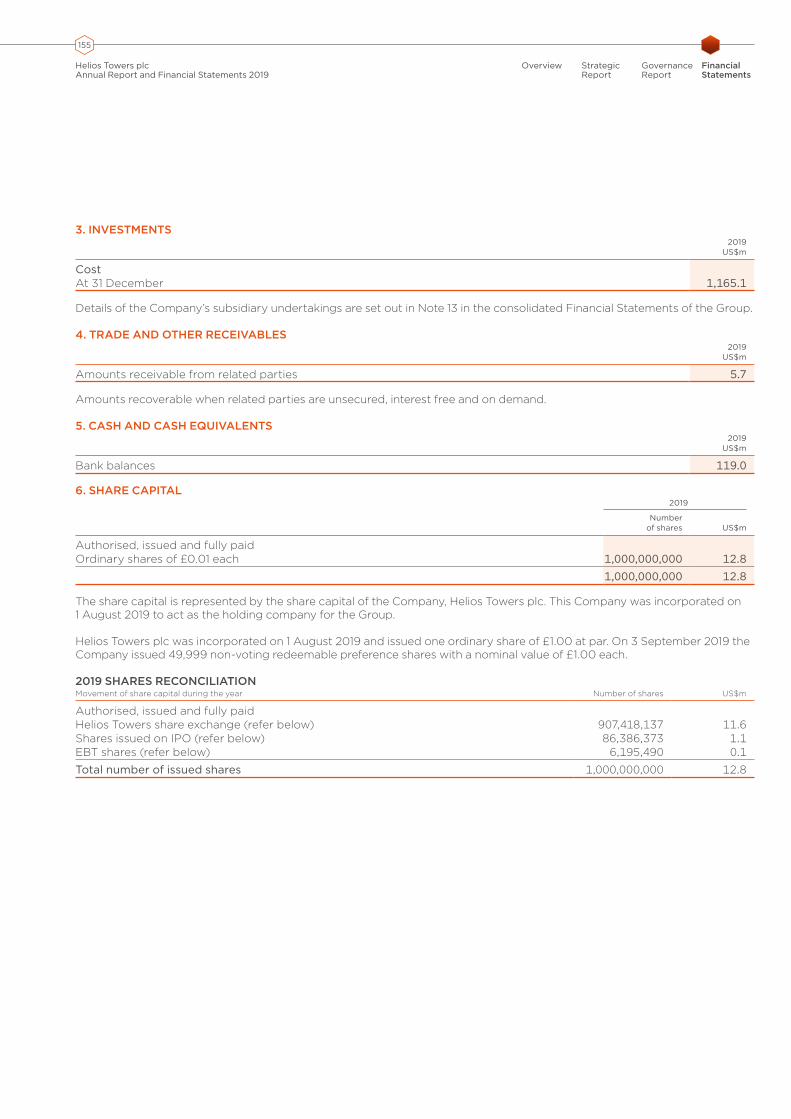
155
Helios Towers plcAnnual Report and Financial Statements 2019
Overview StrategicReport
GovernanceReport
Financial Statements
3. INVESTMENTS2019
US$m
CostAt 31 December 1,165.1
Details of the Company’s subsidiary undertakings are set out in Note 13 in the consolidated Financial Statements of the Group.
4. TRADE AND OTHER RECEIVABLES2019
US$m
Amounts receivable from related parties 5.7
Amounts recoverable when related parties are unsecured, interest free and on demand.
5. CASH AND CASH EQUIVALENTS2019
US$m
Bank balances 119.0
6. SHARE CAPITAL2019
Number of shares US$m
Authorised, issued and fully paidOrdinary shares of £0.01 each 1,000,000,000 12.8
1,000,000,000 12.8
The share capital is represented by the share capital of the Company, Helios Towers plc. This Company was incorporated on 1 August 2019 to act as the holding company for the Group.
Helios Towers plc was incorporated on 1 August 2019 and issued one ordinary share of £1.00 at par. On 3 September 2019 the Company issued 49,999 non-voting redeemable preference shares with a nominal value of £1.00 each.
2019 SHARES RECONCILIATIONMovement of share capital during the year Number of shares US$m
Authorised, issued and fully paidHelios Towers share exchange (refer below) 907,418,137 11.6Shares issued on IPO (refer below) 86,386,373 1.1EBT shares (refer below) 6,195,490 0.1
Total number of issued shares 1,000,000,000 12.8

156
Helios Towers plcAnnual Report and Financial Statements 2019
6. SHARE CAPITAL (CONTINUED)• the Company issued 907,418,137 ordinary shares of £1.00 in a share for share exchange ratio of 99.8% for the entire share
capital of Helios Towers, Ltd; As part of the share exchange the management incentive plans were unwound. Included in the shares issued are 356,299 shares of £1.00 nominal value issued to the Helios Towers plc employee benefit trust (“EBT”) in respect of MIP V Option Awards;
• the Company issued a further 6,195,490 ordinary shares to the trustee of the EBT in order to satisfy settlement of nil-cost options awarded under the legacy LTIP scheme;
• the Company repurchased and cancelled the 49,999 redeemable preference shares of £1.00 at nominal value; and• in connection with the IPO the Company issued 86,386,373 new ordinary shares in exchange for cash at a price of £1.15
per share.
In December 2019, the Company completed a court-approved reduction of capital. The purpose of the reduction of capital was to provide distributable reserves which will allow the Company the flexibility to make future dividend payments. Following the reduction of capital, the number of issued shares and the rights attached to those shares remained unchanged. The nominal value of the ordinary shares in the capital of the Company was reduced by £0.99 from £1.00 to £0.01.
On 12 December the Company issued a further 910,436 shares to the trustee of the EBT in order to satisfy options awarded under the LTIP scheme.
Other reserves are disclosed in the consolidated statements of changes in equity.
7. TRADE AND OTHER PAYABLES2019
US$m
Amounts payable to related parties 1.8
Amounts payable to related parties are unsecured, interest free and repayable on demand.
Financial Statements
Notes to the Company Financial StatementsFor the period ended 31 December 2019 (continued)

157
Helios Towers plcAnnual Report and Financial Statements 2019
Overview StrategicReport
GovernanceReport
Financial Statements
Financial Statements
List of subsidiaries
Name of subsidiaries Registered office address
HTA Holdings, Ltd Level 3, Alexander House, 35 Cybercity, Ebene, Mauritius
HTA Group, Ltd Level 3, Alexander House, 35 Cybercity, Ebene, Mauritius
HTA (UK) Partner Ltd 5 Merchant Square West, 10th Floor, London, W2 1AS
Helios Towers, Ltd Level 3, Alexander House, 35 Cybercity, Ebene, Mauritius
Helios Towers Africa LLP 5 Merchant Square West, 10th Floor, London, W2 1AS
Helios Towers Partners (UK) Limited 5 Merchant Square West, 10th Floor, London, W2 1AS
HT Congo Brazzaville Holdco Limited Level 3, Alexander House, 35 Cybercity, Ebene, Mauritius
Helios Towers Congo Brazzaville SASU 1st Floor TPI Building, Boulevard Denis Sassou-Nguesso, opposite the SCLOG, Mpila, Brazzaville, Congo
Helios Towers DRC S.A.R.L. 1st Floor, Tower LE 130, 130B, Avenue Kwango, Kinshasa, Gombe, DRC
HT DRC Infraco S.A.R.L. 1st Floor, Tower LE 130, 130B, Avenue Kwango, Kinshasa, Gombe, DRC
Helios Towers Tanzania Limited Ground Floor, Peninsula House, Plot No. 251 Toure Drive, P.O. Box 105297, Oysterbay, Dar Es Salaam, Tanzania
HTT Infraco Limited Ground Floor, Peninsula House, Plot No. 251 Toure Drive, P.O. Box 105297, Oysterbay, Dar Es Salaam, Tanzania
HS Holdings Limited Ground Floor, Peninsula House, Plot No. 251 Toure Drive, P.O. Box 105297, Oysterbay, Dar Es Salaam, Tanzania
HT Holdings Tanzania Ltd Level 3, Alexander House, 35 Cybercity, Ebene, Mauritius
Helios Chad Holdco Limited Level 3, Alexander House, 35 Cybercity, Ebene, Mauritius
Helios Towers Ghana Limited No.31, Akosombo Road, Airport Residential Area, Private Mail Bag CT 409, Cantonments, Accra, Ghana
HTG Managed Services Limited No.31, Akosombo Road, Airport Residential Area, Private Mail Bag CT 409, Cantonments, Accra, Ghana
Towers NL Coöperatief U.A. Prins Bernhardplein 200, 1097JB Amsterdam, The Netherlands
McTam International 1 B.V. Oslo 1, 2993 LD Barendrecht, The Netherlands
McRory Investment B.V. Oslo 1, 2993 LD Barendrecht, The Netherlands
Helios Towers FZ-LLC DIC, Unit 102, Floor 1, Building5, Dubai Internet City, United Arab Emirates
Helios Towers South Africa Holdings (Pty) Ltd
Unit D8, E1 Ridge Office Park, 100 Elizabeth Road, Bartlett, Boksburg, Gauteng, 1459, South Africa
Helios Towers South Africa (Pty) Ltd Unit D8, E1 Ridge Office Park, 100 Elizabeth Road, Bartlett, Boksburg, Gauteng, 1459, South Africa
Helios Towers South Africa Services(Pty) Ltd
Unit D8, E1 Ridge Office Park, 100 Elizabeth Road, Bartlett, Boksburg, Gauteng, 1459, South Africa
HTSA Towers (Pty) Ltd Unit D8, E1 Ridge Office Park, 100 Elizabeth Road, Bartlett, Boksburg, Gauteng, 1459, South Africa

158
Helios Towers plcAnnual Report and Financial Statements 2019
Financial Statements
Officers and professional advisors
DIRECTORSSir Samuel JonahKash PandyaTom GreenwoodMagnus ManderssonAlison BakerRichard Byrne David WassongTemitope Lawani COMPANY SECRETARYHelen (Ebert) Shaw
REGISTERED OFFICE10th Floor5 Merchant Square WestLondonW2 1AS
REGISTERED NUMBER12134855
BANKERNatWest Bank Plc63 Piccadilly & New Bond StreetLondon W1J 0AJ
AUDITORDeloitte LLPFour BrindleyplaceBirminghamB1 2HZ
SOLICITORLinklaters LLPOne Silk StreetLondonEC2Y 8HQ
REGISTRARComputerShareThe PavillionsBridgwater RoadBristolBS13 8AE
FINANCIAL PRFTI Consulting200 Aldersgate StreetBarbicanLondonEC1A 4HD
This Annual Report and Financial Statements does not constitute an invitation to underwrite, subscribe for, or otherwise acquire or dispose of any company shares or other securities. This Annual Report and Accounts contains certain forward-looking statements with respect to the financial condition, results, operations and businesses of the company. These statements and forecasts involve risk and uncertainty because they relate to events and depend on circumstances that will occur in the future. There are a number of factors that could cause actual results or developments to differ materially from those expressed or implied by these forward-looking statements and forecasts. Past performance is no guide to future performance and persons needing advice should consult an independent financial adviser.

159
Helios Towers plcAnnual Report and Financial Statements 2019
Overview StrategicReport
GovernanceReport
Financial Statements
SDG reporting
Helios Towers is supportive of the ethos of the UN agenda for sustainable development and the Company recognises that it has a direct impact on the environment and the areas covered by the sustainable development goals (SDGs). The table below details the key SDGs the Company has an impact on. As mentioned on page 29 of the strategic report, the Company intends to publish a definitive sustainability framework this year, and it is envisaged that this framework will show greater alignment to the SDGs.
SDG SDG SUB TARGET OUR IMPACT/ACTIONS
BUILD RESILIENT INFRASTRUCTURE, PROMOTE INCLUSIVE AND SUSTAINABLE INDUSTRIALIZATION AND FOSTER INNOVATION
9.1 Develop quality, reliable, sustainable and resilient infrastructure, including regional and trans-border infrastructure, to support economic development and human well-being, with a focus on affordable and equitable access for all
HT's core business is the buildout and maintenance of quality infrastructure that supports digital technology. HT's significant investment in upgrading the quality and resiliency of its tower portfolio has established its best in class reputation with its customers while simultaneously supporting economic development and human well-being in its markets.
9.4 By 2030, upgrade infrastructure and retrofit industries to make them sustainable, with increased resource-use efficiency and greater adoption of clean and environmentally sound technologies and industrial processes, with all countries taking action in accordance with their respective capabilities
Through its business excellence program, HT’s infrastructure efficiency initiatives translate to lower carbon footprint and higher earnings.
9.A Facilitate sustainable and resilient infrastructure development in developing countries through enhanced financial, technological and technical support to African countries, least developed countries, landlocked developing countries and small island developing States
HT’s vision is to become the leading telecoms infrastructure company in Africa. To achieve this would mean increasing the number of African countries that have access to technological advancements, therefore improving the connectivity of developing nations in Africa.
9.C Significantly increase access to information and communications technology and strive to provide universal and affordable access to the Internet in least developed countries by 2020
HT has been integral in all of their markets in building and maintaining infrastructure that in turn enables MNO’s to offer affordable mobile coverage and internet access. The construction of new towers enables MNOs to provide these services to new users, or to improve capacity and quality of service in areas where coverage already exists.

160
Helios Towers plcAnnual Report and Financial Statements 2019
SDG SDG SUB TARGET OUR IMPACT/ACTIONS
PROMOTE SUSTAINED, INCLUSIVE AND SUSTAINABLE ECONOMIC GROWTH, FULL AND PRODUCTIVE EMPLOYMENT AND DECENT WORK FOR ALL
8.2 Achieve higher levels of economic productivity through diversification, technological upgrading and innovation, including through a focus on high value added and labour-intensive sectors
HT’s infrastructure facilitates innovation in areas where access to the internet was previously lacking. HT's employees and subcontractors (construction, maintenance) represent high value added paying jobs.
8.3 Promote development-oriented policies that support productive activities, decent job creation, entrepreneurship, creativity and innovation, and encourage the formalization and growth of micro-, small- and medium-sized enterprises, including through access to financial services
HT’s service fundamentally supports the migration of employment to formal more productive, creative, and innovative job growth via micro, SME, MME especially in regards to financial services.
8.5 By 2030, achieve full and productive employment and decent work for all women and men, including for young people and persons with disabilities, and equal pay for work of equal value
HT promotes a culture of equal opportunities across its operations with recruitment, training and remuneration polices stipulating as much and being in place.
ENSURE HEALTHY LIVES AND PROMOTE WELL-BEING FOR ALL AT ALL AGES
3.6 By 2020, halve the number of global deaths and injuries from road traffic accidents
HT has extensive polices and standards, education and awareness programmes, contractual obligations and governance in place to support an environment whereby all is done to reduce and mitigate the risk of road traffic accidents.
CLIMATE ACTION
13.2 Integrate climate change measures into national policies, strategies and planning
HT’s colocation model is a highly sustainable solution, allowing multiple operators to use one tower, reducing the need for additional towers and the energy used to build and operate them. HT are always looking for ways to reduce reliance on diesel, by either connecting to the grid or using renewable energy.
13.B Promote mechanisms for raising capacity for effective climate change-related planning and management in least developed countries and small island developing States, including focusing on women, youth and local and marginalized communities
As HT develops a commitment to solar and renewable energy sources, a programme was set up in 2019 to deliver solar powered street lighting with integrated USB ports to communities surrounding operations in DRC and Tanzania. Whilst only a small number of sites have been deployed, this improvement in infrastructure for communities has allowed key development and connectivity.
Financial Statements
SDG reporting(continued)

161
Helios Towers plcAnnual Report and Financial Statements 2019
Overview StrategicReport
GovernanceReport
Financial Statements
Glossary
We have prepared the interim report using a number of conventions, which you should consider when reading information contained herein as follows:
All references to “we”, “us”, “our”, “HT Group”, our “Group” and the “Group” are references to Helios Towers plc and its subsidiaries taken as a whole.
‘‘2G’’ means the second-generation cellular telecommunications network commercially launched on the GSM and CDMA standards.
‘‘3G’’ means the third-generation cellular telecommunications networks that allow simultaneous use of voice and data services, and provide high-speed data access using a range of technologies.
‘‘4G’’ or ‘‘4G LTE’’ means the fourth-generation cellular telecommunications networks that allow simultaneous use of voice and data services, and provide high-speed data access using a range of technologies (these speeds exceed those available for 3G).
‘‘5G’’ means the fifth generation cellular telecommunications networks. 5G does not currently have a publicly agreed upon standard; however, it provides high-speed data access using a range of technologies that exceed those available for 4G.
“Adjusted cash and cash equivalents” means cash and cash equivalents excluding U.S.$37.7 million of restricted cash for the potential payment of change of control taxes related to our initial public offering in 2019 funded by a capital contribution from our shareholders immediately prior to the initial public offering.
“Adjusted EBITDA” management defines as loss for the period, adjusted for tax expenses, finance costs, other gains and loss, interest receivable, loss on disposal of property, plant and equipment, amortisation of intangible assets, depreciation and impairment of property, plant and equipment, depreciation of right-of-use assets, recharged depreciation, deal costs for aborted acquisitions, deal costs not capitalised, share-based payments and long-term incentive plan charges, and exceptional items. Exceptional items are material items that are considered exceptional in nature by management by virtue of their size and/or incidence.
“Adjusted EBITDA margin” means Adjusted EBITDA divided by revenue.
“Africa’s Big-Five MNO’s” means Airtel, MTN, Orange, Tigo and Vodacom/Vodafone.
“Airtel” means Airtel Africa.
“amendment colocation tenant” means an existing customer on a site (anchor tenant or standard colocation tenant) adding or modifying equipment, taking up additional vertical space, wind load capacity and/or power consumption, which leads to additional revenue billing under the menu pricing of an existing MLA agreement. The Group calculates amendment colocations using the additional revenue generated by the amendment on a weighted basis as
compared to the market average rate for a standard tenancy in the month the amendment is added.
“anchor tenant” means the primary customer occupying each site.
“APMs” Alternative Performance Measures are measures of financial performance, financial position or cashflows that are not defined or specified under IFRS but used by the Directors internally to assess the performance of the Group
“build-to-suit/BTS” means sites constructed by our Group on order by a MNO.
“CAGR” means Compound annual growth rate.
“CODM” means Chief Operating Decision Maker.
“colocation” means each additional tenant on a site in addition to the primary anchor tenant.
“colocation tenant” means an existing customer on a site (anchor tenant or standard colocation tenant) adding or modifying equipment, taking up additional vertical space, wind load capacity and/or power consumption, which leads to additional revenue billing under the menu pricing of an existing MLA agreement. The Group calculates amendment colocations using the additional revenue generated by the amendment on a weighted basis as compared to the market average rate for a standard tenancy in the month the amendment is added.
“Company” means Helios Towers, Ltd prior to 17 October 2019, and Helios Towers plc on or after 17 October 2019.
“committed colocation” means contractual commitments relating to prospective colocation tenancies with customers.
“Congo Brazzaville” otherwise also known as the Republic of Congo.
“contracted revenue” means total undiscounted revenue as at that date with local currency amounts converted at the applicable average rate for U.S. dollars held constant. Our contracted revenue calculation for each year presented assumes: (i) no escalation in fee rates, (ii) no increases in sites or tenancies other than our committed colocations (contractual commitments relating to prospective colocation tenancies with customers), (iii) our customers do not utilize any cancellation allowances set forth in their MLAs (iv) our customers do not terminate MLAs early for any reason and (v) no automatic renewal.
“corporate capital expenditure” is primarily for furniture, fixtures and equipment.
“DRC” means Democratic Republic of Congo.
“edge data centre” secure temperature-controlled technical facilities which are smaller than a standard core network data centre and positioned on the edge of a telecommunications network. They are used by operators to regenerate fibre signal, deliver cloud computing resources or cache streaming content for local users.

162
Helios Towers plcAnnual Report and Financial Statements 2019
‘‘G7 countries’’ means each of the United States, Canada, France, Germany, Italy, Japan and the United Kingdom.
“Ghana” means the Republic of Ghana.
“gross debt” means non-current loans and current loans and long-term and short-term lease liabilities.
“gross margin” means gross profit, adding site and warehouse depreciation, divided by revenue.
“growth capex” relates to (i) construction of build-to-suit sites (ii) installation of colocation tenants and (ii) and investments in power management solutions.
“Group” means Helios Towers, Ltd (“HTL”) and its subsidiaries prior to 17 October 2019, and Helios Towers plc and its subsidiaries on or after 17 October 2019.
‘‘Hardiman’’ means Hardiman Telecommunications Ltd.
“Helios Towers Ghana” or “HT Ghana” means HTG Managed Services Limited.
“Helios Towers Tanzania” or “HT Tanzania” means HTT Infraco Limited.
“Helios Towers Congo Brazzaville” or “HT Congo Brazzaville” means Helios Towers Congo Brazzaville SASU.
“Helios Towers plc” means the ultimate Company of the Group, post IPO.
“Helios Towers South Africa” or “HTSA” means Helios Towers South Africa Holdings (Pty) Ltd and its subsidiaries.
“IBS” means in-building solutions which provide cellular signal enhancement within buildings.
“ISA” means individual site agreement.
“ISP” means Internet Service Provider.
“IFRS” means International Financial Reporting Standards.
‘‘independent tower company’’ means a tower company that is not affiliated with a telecommunications operator.
“LCY” means Local Currency.
“liquidated damages” means provisions that generally require the Group to make a payment to the customer, most often by means of set-off against service fees payable by the customer, if the Group fails to uphold a specified level of uptime.
“levered portfolio free cash flow” defined as portfolio free cash flow less net finance costs paid.
“maintenance capital expenditure” means capital expenditures for periodic refurbishments and replacement of parts and equipment to keep existing sites in service.
“maintained sites” means to sites that are maintained by the Group on behalf of a telecommunications operator but which are not marketed by the Group to other telecommunications operators for colocation (and in respect of which the Company has no right to market).
“managed sites” means sites that the Group currently manages but does not own due to either: (i) certain conditions for transfer under the relevant acquisition documentation, ground lease and/or law not yet being satisfied; or (ii) the site being subject to an agreement with the relevant MNO under which the MNO retains ownership and outsources management and marketing to the Company.
“Mauritius” means the Republic of Mauritius.
“Millicom” means Millicom International Cellular SA.
“MLA” means master lease agreement.
“MNO” means mobile network operator.
“mobile penetration” means the measure of the amount of active mobile phone subscriptions compared to the total market for active mobile phones.
“MTN” means MTN Group Ltd.
“MTSAs” means master tower services agreements
“net basis debtor days” means net receivables divided by revenue reported in the period multiplied by number of days in the period.
“net debt” means gross debt less adjusted cash and cash equivalents.
“net leverage” means net debt divided by last quarter annualised Adjusted EBITDA.
“net receivables” means total trade receivables (including related parties) and accrued revenue, less deferred income.
“NOC” means network operating centre.
“Orange” means Orange S.A.
“our markets” or “markets in which we operate” refers to Tanzania, DRC, Congo Brazzaville, Ghana and South Africa.
‘‘owned sites’’ means freehold or leasehold sites where we own the telecommunications passive infrastructure and any equipment relating to power provision and security, we are responsible for maintaining and securing the site as well as obtaining the relevant permits and, if applicable, ground leases relating to the sites.
“portfolio free cash flow” defined as Adjusted EBITDA less maintenance and corporate capital expenditure, payments of lease liabilities (including interest and principal repayments of lease liabilities) and tax paid.
Financial Statements
Glossary(continued)

163
Helios Towers plcAnnual Report and Financial Statements 2019
Overview StrategicReport
GovernanceReport
Financial Statements
“PoS” means point of service, which is an MNO’s antennae equipment configuration located on a site to provide signal coverage to subscribers. At Helios a standard PoS is equivalent to one tenant on a tower.
‘‘Principal Shareholders’’ means Millicom Holding B.V., Quantum Strategic Partners, Ltd., Lath Holdings Ltd., ACM Africa Holdings, LP, RIT Capital Partners plc, IFC African, Latin American and Caribbean Fund, LP and International Finance Corporation.
“SA Towers” means SA Towers (Pty) Ltd.
‘‘Shareholders Agreement’’ means the agreement entered into between the Principal Shareholders and the Company on October 15, 2019, which grants certain governance rights to the Principal Shareholders and sets out a mechanism for future sales of shares in the capital of the Company.
“SHEQ” means Safety, Health, Environment and Quality.
“site acquisition” means a combination of MLAs or MTSAs, which provide the commercial terms governing the provision of site space, and individual ISA, which act as an appendix to the relevant MLA or MTSA, and include site-specific terms for each site.
“site agreement” means the MLA and ISA executed by us with our customers, which act as an appendix to the relevant MLA and includes certain site-specific information (for example, location and any grandfathered equipment).
“SLA” means service-level agreement.
“small cells” means low-powered cellular radio access nodes that operate in licensed and unlicensed spectrum that have a range of 10 meters to a few kilometres.
“South Africa” means the Republic of South Africa.
“standard colocation tenant” means a customer occupying tower space under a standard tenancy lease rate and configuration with defined limits in terms of the vertical space occupied, the wind load and power consumption.
“sub-Saharan Africa” means African countries that are fully or partially located south of the Sahara.
“Tanzania” means the United Republic of Tanzania.
“telecommunications operator” means a company licensed by the government to provide voice and data communications services.
“tenancy” means a space leased for installation of a base transmission site and associated antennae.
“tenancy ratio” means the total number of tenancies divided by the total number of our towers as of a given date and represents the average number of tenants per site within a portfolio.
“tenant” an MNO that leases vertical space on the tower and portions of the land underneath on which it installs its equipment.
“Tigo” refers to one or more subsidiaries of Millicom that operate under the commercial brand “Tigo”.
“total colocations” means standard colocations plus amendment colocations as of a given date.
“total sites” means total towers, IBS sites, edge data centres or sites with customer equipment installed on third-party infrastructure that are owned and/or managed by the Company with each reported site having at least one active customer tenancy as of a given date.
“total tenancies” means total sites plus total colocation tenants as of a given date.
“tower sites” means ground-based towers and rooftop towers and installations constructed and owned by us on property (including a rooftop) that is generally owned or leased by us.
‘‘UK Corporate Governance Code’’ means the UK Corporate Governance Code published by the Financial Reporting Council and dated July 2018, as amended from time to time.
“upgrade capex” comprises structural, refurbishment and consolidation activities carried out on selected acquired sites. “Viettel” means Viettel Tanzania Limited.
“Vodacom” means Vodacom Group Limited.
“Vodacom Tanzania” means Vodacom Tanzania plc.
“Vulatel” means Vulatel (Pty) Ltd.
“Zantel” means Zantel Telecom plc.

164
Helios Towers plcAnnual Report and Financial Statements 2019
Financial Statements
Notes

Disclaimer:This document does not constitute an offering of securities or otherwise constitute an invitation or inducement to any person to underwrite, subscribe for or otherwise acquire or dispose of securities in Helios Towers plc (the “Company”) or any other member of the Helios Towers group (the “Group”), nor should it be construed as legal, tax, financial, investment or accounting advice. This document contains forward-looking statements which are subject to known and unknown risks and uncertainties because they relate to future events, many of which are beyond the Group’s control. These forward-looking statements include, without limitation, statements in relation to the Company’s financial outlook and future performance. No assurance can be given that future results will be achieved; actual events or results may differ materially as a result of risks and uncertainties facing the Group. You are cautioned not to rely on these forward-looking statements, which speak only as of the date of this announcement. The Company undertakes no obligation to update or revise any forward-looking statement to reflect any change in its expectations or any change in events, conditions or circumstances. Nothing in this document is or should be relied upon as a warranty, promise or representation, express or implied, as to the future performance of the Company or the Group or their businesses.
This document also contains non-GAAP financial information which the Directors believe is valuable in understanding the performance of the Group. However, non-GAAP information is not uniformly defined by all companies and therefore it may not be comparable with similarly titled measures disclosed by other companies, including those in the Group’s industry. Although these measures are important in the assessment and management of the Group’s business, they should not be viewed in isolation or as replacements for, but rather as complementary to, the comparable GAAP measures.

Helios Tow
ers plc A
nnual Rep
ort and Financial Statem
ents 2019
www.heliostowers.com
Registered office address10th Floor5 Merchant Square WestLondonW2 1AS
T: +44 (0) 207 871 3670F: +44 (0) 207 235 6542
Registered Company Number12134855