2019 investor information - corporate.exxonmobil.com · c pathway, see 2018 em outlook for energy:...
TRANSCRIPT

2019 INVESTOR INFORMATION
ExxonMobil Investor Relations
All forward-looking statements included in this presentation speak only as of the March 6, 2019 date of their original presentation unless specifically noted herein. Inclusion of such forward-looking statements in this material does not represent an update or confirmation of such statements as of any later date.

Cautionary statement 3 Upstream Exploration 41-42 Chemical 622019 Key Messages 4 Portfolio Management 43 Chemical key messages 632018 Earnings 5 Upstream Volumes Outlook 44 Chemical business value chain 65
Upstream Performance 45 Product applications 65Delivering on commitments 6 Delivering on commitments 66Long-term fundamentals 7-10 Downstream and Chemical 46 Gulf Coast growth venture 67Competitive advantages 11 Increasing value 47 U.S. Gulf Coast olefin derivatives 68Investing 12-14 Cyclical businesses 48 New liquids steam cracker in China 69Portfolio management 15-16 Scale and market access capture growth 70
Growing earnings, cash flow, and ROCE potential 17-19 Downstream 49 Performance products 71-73Downstream key messages 50
Upstream 20 Value chain portfolio 51 Investment and Financial Plan 74Upstream key messages 21 Delivering on commitments 52 Growing value 75Upstream portfolio 22 Product mix improves profitability 53 Earnings and cash flow growth potential 76-77Permian 23-30 Maximizing existing assets 54 Capex profile 78Upstream Deepwater 31 Entering growth markets to deliver value 55 Execution capacity 79
Guyana 32-34 Permian integration 56 Financial capacity 80Brazil 35-36 Beaumont light crude expansion 57 Shareholder distributions 81
Upstream LNG 37 Rotterdam hydrocracker 58 Free cash flow potential 82
Mozambique 38 Higher-value basestocks demand growth 59
PNG 39 Lubricants value chain leadership 60 Growing shareholder value 83Golden Pass 40 Downstream earnings improvement 61
Reference material 84Investor Relations contacts 89
INDEX

FORWARD-LOOKING STATEMENTS. Outlooks, projections, estimates, goals, discussions of potential, descriptions of business plans, objectives and resource potential, market expectations and other statements of future events or conditions in this presentation or the subsequent discussion period are forward-looking statements. Actual future results, including future earnings, cash flows, returns, margins, asset sales, and other areas of financial and operating performance; demand growth and energy mix; ExxonMobil’s production growth, volumes, development and mix; the amount and mix of capital expenditures; future distributions; proved and other reserves; reserve and resource additions and recoveries; asset carrying values and future impairments; project plans, completion dates, timing, costs, and capacities; efficiency gains; operating costs and cost savings; integration benefits; product sales and mix; production rates and capacities; and the timing and impact of technology could differ materially due to a number of factors. These include changes in oil or gas demand, supply, prices or other market conditions affecting the oil, gas, petroleum and petrochemical industries, population growth, global economic growth, reservoir performance and depletion rates; timely completion of exploration, development and construction projects; regional differences in product concentration and demand; war and other political or security disturbances; changes in law, taxes or other government regulation or operation, including environmental regulations, taxes, and political sanctions; the outcome of commercial negotiations; the actions of competitors and customers; the outcome of research projects and the ability to scale new technologies on a cost-efficient basis; general economic conditions, including the occurrence and duration of economic recessions; unforeseen technical difficulties; and other factors discussed here, in Item 1A. Risk Factors in our Form 10-K for the year ended December 31, 2018 and under the heading "Factors Affecting Future Results" in the Investors section of our website at www.exxonmobil.com. The forward-looking statements and dates used in this presentation are based on management’s good faith plans and objectives as of the March 6, 2019 date of this presentation, unless otherwise stated. We assume no duty to update these statements as of any future date and neither future distribution of this material nor the continued availability of this material in archive form on our website should be deemed to constitute an update or re-affirmation of these figures as of any future date. Any future update of these figures will be provided only through a public disclosure indicating that fact.
SUPPLEMENTAL INFORMATION. See the Supplemental Information included on pages 91 through 99 of this presentation for additional important information concerning definitions and assumptions regarding the forward-looking statements included in this presentation, including illustrative assumptions regarding future crude prices and product margins; reconciliations and other information required by Regulation G with respect to non-GAAP measures used in this presentation including cash flow from operations and asset sales, earnings excluding effects of U.S. tax reform enactment and impairments, return on average capital employed (ROCE), operating costs, unit cash operating costs, upstream earnings per OEB, estimated operating cash contribution, net cash margin, and free cash flow; and definitions and additional information on other terms used including returns and resources.
CAUTIONARY STATEMENT

2019 KEY MESSAGESValue growth plans on track with additional upside
4
• Delivering on plans outlined in 2018 with upside
• Strong business fundamentals support investments
• Competitive advantages enable long-term value creation
• Progressing advantaged investments and highgrading portfolio
• Earnings, cash flow, and return profile grow in a flat price environment

0
15
30
2017Adjusted actual
2018 InvestorDay potential
2018Adjusted actual
2018 EARNINGSDelivering on plans outlined in 2018 with upside
5
2018 Investor Day potential, $60/bbl2
Adjusted actual1
Normalized to $60/bbl1,2
1 2 1
EARNINGSBillion USD
1 Excludes impact of U.S. tax reform and impairments in 2017 and 20182 2018 March Investor Day basis ($60/bbl Brent and 2017 margins, adjusted for inflation for future periods)
See supplemental information
• Earnings adjusted for tax reform and impairments up 40% relative to 2017
• Driven by higher prices, liquids growth, and value from North American integration
• 2018 actuals normalized to $60/bbl in line with March 2018 Investor Day

DELIVERING ON COMMITMENTSDelivering on plans outlined in 2018 with upside
6
2018 Investor Day 2019 Update3
UPSTREAM
GUYANA1 3.2 Boeb; 500 Kbd by 2025 >6 Boeb; 750 Kbd by 2025
BRAZIL 1.4 million net acres >2.3 million net acres
PERMIAN2 600 Koebd by 2025 >1,000 Koebd by 2024
LNG PNG, Mozambique FIDs on track; Golden Pass
DOWNSTREAMLOGISTICS Invest in Permian infrastructure 300 Kbd, JV pipeline
REFINING Start up 7 major investments by 2025 3 online, 4 FIDs
CHEMICAL PROJECTS 13 new facilities, 7 online by YE 2018 8 online, 4 FIDs, 1 progressing
SALES Deliver 30% growth by 2025 6% growth in 2018
1 Guyana volumes and resource gross2 Permian volumes net3Updated as of November 1, 2019See supplemental information

0
60
120
2016 2040
7
LONG-TERM FUNDAMENTALS UPSTREAMStrong business fundamentals support investments
New supplyrequired
Depletion without investment
0
300
600
2016 2040
New supplyrequired
Depletion without investment
EM outlook demand
Avg demand based on assessed 2oC scenarios2
EM outlook demand
Avg demand based on assessed 2oC scenarios2
OIL SUPPLY/DEMAND1
MoebdNATURAL GAS SUPPLY/DEMANDBcfd
Source: IEA, EM analysis1 Excludes biofuels2 Assessed 2oC scenarios based on EMF 27 full technology/450 ppm cases
targeting a 2oC pathway, see 2018 EM Outlook for Energy: A View to 2040
Source: IHS, EM analysis2 Assessed 2oC scenarios based on EMF 27 full technology/450 ppm cases
targeting a 2oC pathway, see 2018 EM Outlook for Energy: A View to 2040
See supplemental information
• Growth in population, GDP, and the middle class underpin energy demand growth
• Oil demand growth driven by commercial transportation and chemical feedstock
• Growth in natural gas demand led by electricity and industrial needs
• Depletion nature of business requires significant new supplies across range of scenarios

0
300
600
2016 20400
1,500
3,000
2016 2040
8
LONG-TERM FUNDAMENTALS UPSTREAMStrong business fundamentals support investments
ESTIMATED CUMULATIVE NEW OIL SUPPLY REQUIRED2
Billion barrelsESTIMATED CUMULATIVE NEW NATURAL GAS SUPPLY REQUIREDTrillion cubic feet
EM outlook demand
Avg demand based on assessed 2oC scenarios3
EM outlook demand
Avg demand based on assessed 2oC scenarios3
• New supply of 550 billion barrels of oil and 2,100 trillion cubic feet of natural gas required through 2040− Assessed 2oC scenarios indicate 370 billion barrels of oil and 1,750 trillion cubic feet of natural gas needed
• IEA estimates approximately $21 trillion of oil and natural gas investment needed by 2040− ExxonMobil share equates to annual average of $30-35 billion per year1
See supplemental information
Source: IEA, EM analysis
1 EM analysis; IEA New Policies Scenario estimate for total oil and gas investment needed across upstream, logistics, and downstream
2 Excludes biofuels
Source: IHS, EM analysis
3 Assessed 2oC scenarios based on EMF 27 full technology/450 ppm cases targeting a 2oC pathway, see 2018 EM Outlook for Energy: A View to 2040

9
LONG-TERM FUNDAMENTALS DOWNSTREAMStrong business fundamentals support investments
GasolineLubes3
60
100
140
2016 2020 2025
Chemical feedstock
Distillates2
Fuel oil1
LIQUIDS DEMAND GROWTH%, Indexed to 2016
Source: 2018 EM Outlook for Energy: A View to 2040, EM analysis1 Fuel oil represents high-sulfur fuel oil, International Maritime Organization (IMO)2 Include kerosene and jet3 Include Group I, II, III, and III+See supplemental information
• Fuel oil demand projected to decline 25% with new IMO low-sulfur standards1
• Demand for distillates grows due to increasing commercial transportation and aviation
• Increase in demand for chemical products underpins feedstocks growth
• Expansion in industrial activity and transportation supports lubes growth
• Gasoline consumption moderates with improved efficiency of light-duty fleet

100
125
150
2016 2020 2025
10
LONG-TERM FUNDAMENTALS CHEMICALStrong business fundamentals support investments
PE
GDP
PX
PP
• Population growth and improved living standards drive projected chemical demand above GDP
• Expanding middle class supports polyethylene (PE) growth for packaging and consumer goods
• Automotive and appliance applications drive demand for polypropylene (PP)
• Polyester supports paraxylene (PX) growth
Source: 2018 EM Outlook for Energy: A View to 2040, IHS, EM estimates
See supplemental information
CHEMICAL DEMAND GROWTH%, Indexed to 2016

11
COMPETITIVE ADVANTAGESCompetitive advantages enable long-term value creation
SCALE FUNCTIONAL EXCELLENCE
INTEGRATIONTECHNOLOGY PEOPLE
• Results in industry-advantaged assets, processes, products, and applications
• Enables investment in the development of advanced technologies
• Maximizes value across the entire value chain, ensuring whole is greater than sum of the parts
• Strong culture of doing the right things, the right way, at a high standard
• Competitive advantages realized through commitment and hard work of our people
• Facilitates response to changes in sources of supply, consumer demand, and regulatory requirements
• Accelerates experience and learning across global operations
• Provides diversification, helping mitigate the impact of commodity price cycles
• Translation of experience and knowledge to effective systems and procedures
• World-class capabilities developed through challenging, cross-functional assignments and global experiences
• Leads to advances in existing processes, products, and new discoveries
• Provides financial capacity to pursue value-accretive investments throughout price cycles
• Enables synergies in facilities, organizational capabilities, and competencies
• Consistent application of deep knowledge in critical disciplines; industry-leading execution capabilities
• Strong retention and career-long tenures result in unmatched capabilities and knowledge

0
20
40
2018Actual
2019 2020 '21-'25
12
VALUE INVESTINGProgressing advantaged investments and highgrading portfolio
Guyana, Permian26
30
Brazil, Indonesia
33 - 35 30 - 35
CAPEXBillion USD
See supplemental information
• Best portfolio of opportunities since Exxon and Mobil merger with average returns of ~20%
• Attractive acquisitions in Brazil and Indonesia resulted in incremental 2018 spend
• Investment profile on plan; upside identified
− Significant growth in Guyana resource
− Opportunity to accelerate value in Permian
• Improvements to investment plans generate additional ~$40 billion of net present value1
2018 Investor Day
2019 Investor Day update
1 NPV8

13
DISCIPLINED INVESTINGProgressing advantaged investments and highgrading portfolio
RDS
BP
CVX
TOT
XOM
25%
75%
125%
10 25 40
REINVESTMENT RATE, 2009 – 2018 Capex1/cash flow from operations
Source: Peer data based on publicly available information as of December 31, 20181 Capex excludes non-cash acquisitions
See supplemental information
Average annual capex1 (billion USD)
• Disciplined investment approach to meet demand growth and offset depletion
• Investments evaluated for advantages relative to competition
− Tested for robustness across range of prices and scenarios
• Consistent focus on highgrading portfolio; pursuing highest-value alternatives

14
DISCIPLINED INVESTINGProgressing advantaged investments and highgrading portfolio
RDSBP
CVX
TOT
XOM
XOM '09-'18
25%
75%
125%
10 25 40Average annual capex1 (billion USD)
REINVESTMENT RATE, 2019 – 2020 Capex1/cash flow from operations
Source: Peer data based on publicly available information as of December 31, 20181 Capex excludes non-cash acquisitions
See supplemental information
• Disciplined investment approach to meet demand growth and offset depletion
• Investments evaluated for advantages relative to competition
− Tested for robustness across range of prices and scenarios
• Consistent focus on highgrading portfolio; pursuing highest-value alternatives
• Reinvestment rate reflective of:
− Peer-leading investment opportunities
− Execution capability
− Financial capacity

15
PORTFOLIO MANAGEMENTProgressing advantaged investments and highgrading portfolio
• Strong history of highgrading portfolio
− Annual average of $3.5 billion in proceeds in past five years
• Rigorous evaluation of assets
− Long-term strategic fit
− Relative value
• Historical focus on highgrading Downstream and Chemical portfolio

16
PORTFOLIO MANAGEMENTProgressing advantaged investments and highgrading portfolio
• High-quality portfolio additions drive increased focus on Upstream
• Expect increased divestment activity over next 3 years
• Prioritizing overall portfolio value
• Anticipate asset sales of $15 billion by 2021

0
20
40
2019 2020 '21-'24Avg
2025
17
GROWING EARNINGS POTENTIALEarnings, cash flow, and return profile grow in a flat price environment
2018 Investor Day1
2019 Investor Day update1
EARNINGS POTENTIALBillion USD
1 2018 March Investor Day basis ($60/bbl Brent and 2017 margins, adjusted for inflation for future periods)2 Earnings growth potential by 2025, from 2017 excluding impacts of U.S. tax reform and impairments
See supplemental information
• Earnings growth on track with upside
• Earnings grow by more than $4 billion from 2019 to 2020
• Cumulative earnings increase by $9 billion1 versus 2018 Investor Day
• Robust to price environment: earnings grow approximately 40% in $40/bbl scenario2

0
35
70
2019 2020 '21-'24Avg
2025
18
GROWING CASH FLOW POTENTIALEarnings, cash flow, and return profile grow in a flat price environment
CASH FLOW FROM OPERATIONS AND ASSET SALES POTENTIALBillion USD
2018 Investor Day1
2019 Investor Day update1
1 2018 March Investor Day basis ($60/bbl Brent and 2017 margins, adjusted for inflation for future periods); 2018 Investor Day assumed no cash flow from asset sales; 2019 Investor Day update assumes $15 billion in asset sales2 Cash Flow growth potential by 2025, from 2017
See supplemental information
• Cash flow growth on track with upside
• Cash flow grows by more than $5 billion from 2019 to 2020
• Cumulative cash flow increases by $24 billionversus 2018 Investor Day1
• Robust to price environment: cash flow grows 55% in $40/bbl scenario2

19
ROCE GROWTH POTENTIALEarnings, cash flow, and return profile grow in a flat price environment
2025
2016-2018 Avg
2021-2024 Avg
2020
2019
0
5
10
15
0 20 40
RETURN ON CAPITAL EMPLOYED POTENTIAL1
%
1 ROCE potential reflects company plans as of the date of this presentation and additional management objectives over which management has significant control and confidence; 2018 March Investor Day basis ($60/bbl Brent flat real, 2017 margins); relative to 2016-2018 average; peer data based on publicly available information as of February 11, 2019; see supplemental information
Earnings (billion USD)
• Return on capital employed leads peer group1
• Return on capital employed doubles by 2025 in a $60/bbl flat price scenario1
• Confidence in execution with significant control over forward investment plans

UPSTREAM
UPSTREAM KEY MESSAGES
21
• Continuing to strengthen Upstream portfolio − Best opportunity portfolio since the merger− Exceeding plans laid out last year
• Growing value of portfolio driven by five outstanding developments− Permian, Guyana, Brazil, Mozambique, PNG− All attractive across a range of prices− Contribute 50% of Upstream earnings by 2025
• Aggressively enhancing portfolio competitiveness− Executing industry-leading exploration opportunities− Increasing divestments
• Plan to grow earnings ~3X by 2025 at $60/bbl1
1 2018 March Investor Day basis ($60/bbl Brent and 2017 margins, adjusted for inflation for future periods); earnings potential, relative to 2017, excluding the impact of U.S. tax reform and impairments

UPSTREAM PORTFOLIOStrengthening Upstream portfolio
22
2018 Investor Day
Peer range
2019 Investor Day update
ESTIMATED OPERATING CASH CONTRIBUTIONBillion USD
Source: Peer data from Wood Mackenzie data (GEM 3Q 2018 @ 60/bbl; adjusted for inflation over periods)1 Compound annual growth rate
See supplemental information
2018 Investor Day recap
• Industry-leading cash flow capacity by 2024/25
2019 update
• Outlook cash flow increased
− 2019/20 up >6%; 2024/25 up >9%
• Increases driven by Permian and Guyana
• 7% cash flow growth1 per year, higher than IOC average
0
30
60
XOM'19-'20
Peer'19-'20
XOM'24-'25
Peer'24-'25

23
UPSTREAM PERMIAN
Bakken
Permian
Five outstanding developments
See supplemental information
2018 Investor Day recap
• 600 Koebd by 2025
2019 update
• Production on plan; 100% growth YE17 to YE18
• Production outlook up significantly − >1,000 Koebd by 2024− Average >10% return at <$35/bbl
• Increases driven by: − Further Delaware delineation− Innovative development plan
1 Potential production as communicated at 2019 Investor Day. Actuals updated through 3Q19. Permian includes Midland and Delaware basins
Bakken
Permian

24
UPSTREAM PERMIAN
Stacked depositional stratum
HYDROCARBON DENSITY MAP
DelawareBasin
MidlandBasin
Five outstanding developments
• 10 Boeb resource1… and growing − Significant 2017 acquisition− Large blocks of contiguous acreage − Continuing to add and upgrade acreage
• Resource is complex − Significant stacked pay
• 2018 key for understanding Delaware resource− Well stack and spacing tests− Well length tests− Completion intensity tests− Reservoir quality tests
• Development planning critical to maximize value− Leveraging proprietary sub-surface software
1 Net resource
Conceptual well placement

UPSTREAM PERMIAN
ExxonMobil acreage
DelawareBasin
HYDROCARBON DENSITY MAP FOR PERMIAN TIGHT OIL
Five outstanding developments
25
Overview of development plan
• Established a unique low-cost development plan
− Significantly differentiated from competition
• Large blocks of contiguous acreage
• Enabling development on a larger, more efficient scale
• Delivered by industry-leading major project capability
• Leveraging corporate scale, financial capacity, technical capabilities to develop complex resource and technology
• Capturing full value from resource, through logistics position to refineries and chemical plants on Gulf Coast

UPSTREAM PERMIAN
26
• Plan based on efficient multi-well pad corridors; developing multi-bench resource; enhancing resource recovery
• Typical row development design, up to 10 miles end-to-end
• Enables design of optimum size and location for gas, liquids, water separation and compression facilities
• Capital efficient investment: modular phased approach to expansion, “Design one, build many”
• Simplifies field evacuation and logistics
POKER LAKE UNIT, DELAWARE BASIN
Five outstanding developments
10 MILES END-TO-END
UPSTREAM PERMIAN
27
Five outstanding developments
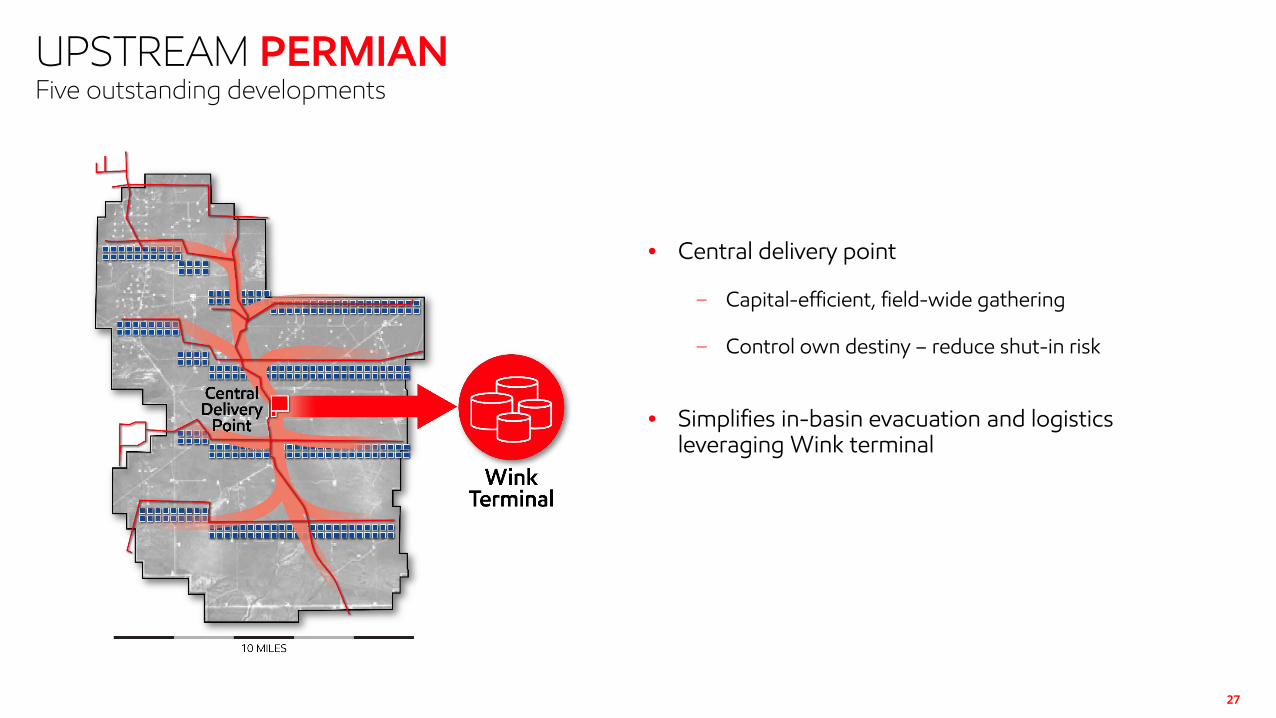
• Central delivery point
− Capital-efficient, field-wide gathering
− Control own destiny – reduce shut-in risk
• Simplifies in-basin evacuation and logistics leveraging Wink terminal
UPSTREAM PERMIAN
28
Five outstanding developments
See supplemental information
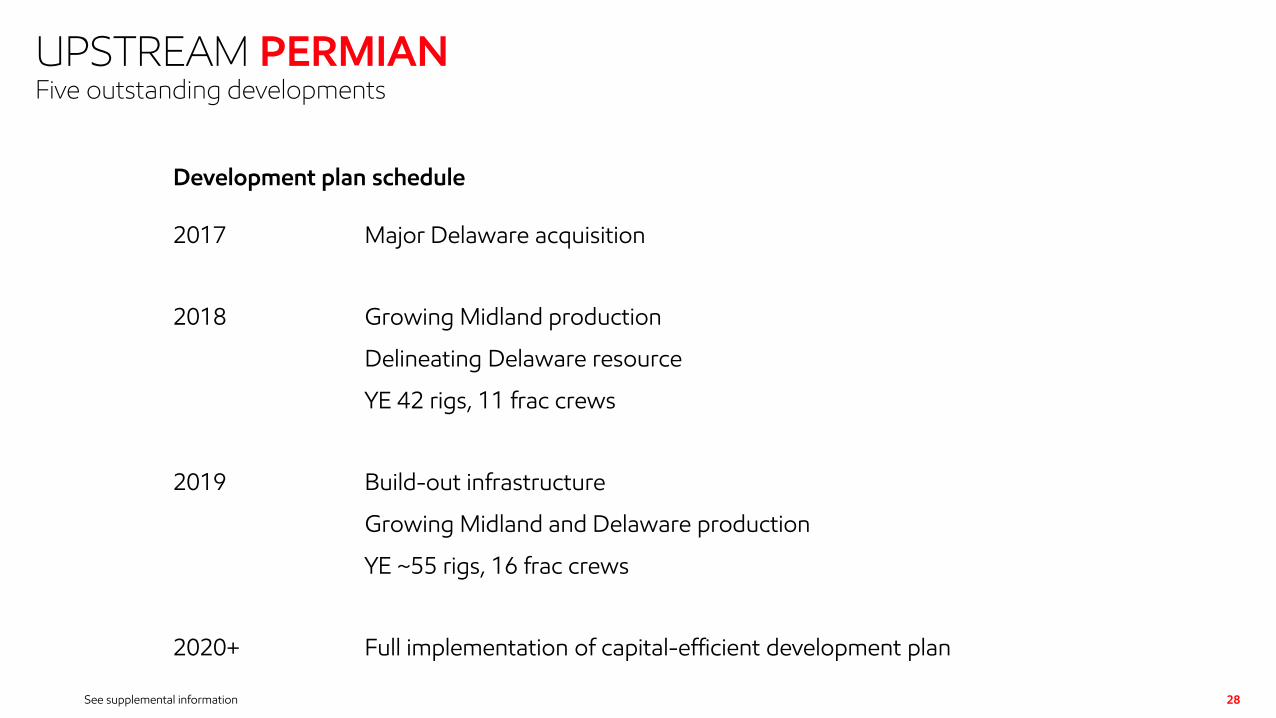
Development plan schedule
2017 Major Delaware acquisition
2018 Growing Midland production
Delineating Delaware resource
YE 42 rigs, 11 frac crews
2019 Build-out infrastructure
Growing Midland and Delaware production
YE ~55 rigs, 16 frac crews
2020+ Full implementation of capital-efficient development plan

29
UPSTREAM PERMIAN
• Increasing resource recovery
− Enhancing subsurface characterization
− Novel completions research
• Further optimizing development plan
− High-contact fracture research
− Subsurface modeling
− Rapid incorporation of learnings
• Maximizing production and reducing cost
− Extensive incorporation of leading-edge digital technologies
− Advanced data analytics supporting optimization and automation
Deploying high-impact technologies to further increase Permian value
Five outstanding developments

30
UPSTREAM PERMIAN
$40/bbl2
$60/bbl2 $60/bbl4
Five outstanding developments
1 Earnings potential; includes logistics, operated assets only2 2018 March Investor Day basis ($60/bbl and $40/bbl Brent and 2017 margins, adjusted for inflation for future periods)
See supplemental information
PERMIAN ESTIMATED EARNINGS1
Billion USDPERMIAN ESTIMATED OPERATING CASH CONTRIBUTION3
Billion USD
• Break-even after capex in 2021
• ~$5 billion in 2023 after capex
• Earnings growth robust, even at $40/bbl
0
4
8
'19 '20 '21 '22 '23 '24 '250
6
12
'19 '20 '21 '22 '23 '24 '25
3 Operating cash contribution potential; Including logistics, operated assets only4 2018 March Investor Day basis ($60/bbl Brent and 2017 margins, adjusted for inflation for future periods)

31
0
20
40
20 50 80
GuyanaStabroek
BrazilCarcara
Bubble size: NPV10 (entire development)
Five outstanding developmentsUPSTREAM DEEPWATER
GREENFIELD DEEPWATER IOC PROJECTS%, Internal rate of return
Source: Wood Mackenzie (FID Tracker for 2019-2023 FID; includes full ExxonMobil Guyana development)
See supplemental information
Brent breakeven price (USD, 10% discount rate)
• Industry-leading deepwater growth projects
• Guyana and Brazil among the most valuable plays in industry

UPSTREAM GUYANA
32
2015/16 2017 2018 2019/20
Gross resource1
(Boeb)>1 3 5 6+
DiscoveriesLiza,
Liza DeepPayara,Snoek,Turbot
Ranger, Pacora, Longtail, Pluma,
Hammerhead
Tripletail, Haimara,Tilapia,
Yellowtail>10 wells
Five outstanding developments
1 Cumulative resource, updated as of Nov 1, 2019; see supplemental information
A t l a n t i cO c e a n
G U Y A N A
VENEZUELA
S U R I N A M E
Ranger
STABROEK
Pacora
PayaraLizaLiza Deep
Hammerhead
Pluma
SnoekTilapia
HaimaraTurbot
Longtail
Yellowtail
Tripletail
Discoveries
• Adding to recoverable resource with successful exploration
• FPSO Liza Destiny (120 Kbd) arrived offshore Guyana
− Commissioning ongoing; targeting December start-up
• Liza Phase 2 FID (220 Kbd) on schedule for 2022 start-up
• Targeting Payara (220 Kbd) start-up in 2023; FID pending government approvals
• Tripletail marks fourth discovery in 2019– Additional hydrocarbon reservoirs encountered
• 4 drill ships in basin in 4Q19
Noble Tom Madden
Noble Bob Douglas
Stena Carron
Noble Don Taylor
Short-term drilling outlook
Uaru-1Hassa-1
Liza Phase 1 development
Ranger-2; Yellowtail-1 test
Mako-1; Longtail-2
0
400
800
2020 2022 2023 2025
UPSTREAM GUYANA
33
Liza Ph 1
Future Developments
Payara
Liza Ph 2
2018 Investor Day1
Five outstanding developments
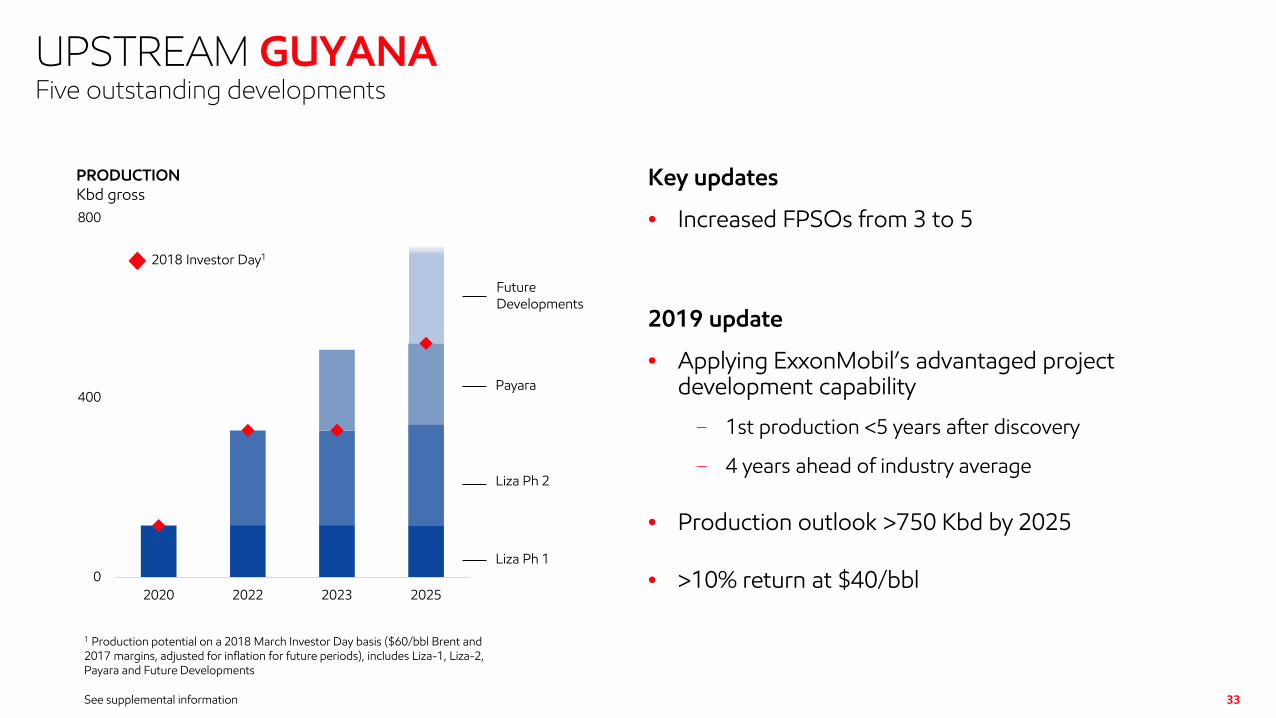
PRODUCTIONKbd gross
1 Production potential on a 2018 March Investor Day basis ($60/bbl Brent and 2017 margins, adjusted for inflation for future periods), includes Liza-1, Liza-2, Payara and Future Developments
See supplemental information
Key updates
• Increased FPSOs from 3 to 5
2019 update
• Applying ExxonMobil’s advantaged project development capability
− 1st production <5 years after discovery
− 4 years ahead of industry average
• Production outlook >750 Kbd by 2025
• >10% return at $40/bbl

UPSTREAM GUYANA
34
LIZA DESTINYPhase 1 FPSO
• Liza Phase 2 (220 Kbd)
− FID May 2019
− Leveraging learnings and designs of Phase 1
− On schedule for start-up 2022
• Payara (180-220 Kbd)
− Early engineering progressing
− FID pending government approvals
− Targeting start-up 2023
• Future Developments
− Defining projects 4 and 5
− Target FIDs 2021/22; start-up 2024/25
• Liza Phase 1 (120 Kbd1)
− Liza Destiny arrived offshore Guyana 3Q 2019
− Start-up December 2019
Five outstanding developments
See supplemental information
1 All volumes gross, Liza Phase 1 details updated as of Nov 1, 2019

Carcara
• Completed farm-in to BM-S-81
− Drilled 2018 exploration well
• North Carcara − Drilled 1st appraisal well in 2018 – analysis ongoing− 2019: 2nd appraisal well ongoing
• Development progressing on plan− First oil 2023/24 to produce 220 Kbd2
− >10% return at $40/bbl
Uirapuru
• Captured block in 2018
• Exploration drilling planned 2019/20
UPSTREAM BRAZIL
35
Uirapuru
Carcara
NorthCarcaraBM-S-8
AtlanticOcean
Five outstanding developments
1 EM interest is 36.5%; pending government approval, EM interest will be 40%2 Gross volume
See supplemental information
Campos Basin
Santos Basin

SergipeBasin
CamposBasin
Uirapuru
Carcara
North CarcaraBM-S-8
B R A Z I L0
3
XOM RDS BP TOT EQNR CVX
UPSTREAM BRAZIL
36
2018 Investor Day
2019 Investor Day update
Five outstanding developments
Titã
SEAL-351SEAL-430SEAL-428
SEAL-503SEAL-501SEAL-573
C-M-37C-M-67
S-M-536C-M-789
C-M-753C-M-657C-M-709
C-M-210C-M-277C-M-344
C-M-411C-M-413
C-M-346
S-M-647
NET ACREAGEMillion acres
Source: Wood Mackenzie
• High-quality position with >2.3 million net offshore acres− 840 thousand net acres added since 2018 Investor Day− ExxonMobil operates >60% of acreage position
• Aggressive exploration schedule− Planning >5 exploration wells as early as 2019/20
Santos Basin
2017 captures2018 captures

0
25
50
XOM RDS TOT CVX BP
UPSTREAM LNG
37
0
300
600
2015 2020 2025 2030 2035
2018
2025Demand
New supply required
Proposed projects <$5/Mbtucost of supply
Existing and under construction
Five outstanding developments
Source: Wood Mackenzie (4Q 2018)Source: Based on Wood Mackenzie (4Q 2018) supplemented with ExxonMobil analysis of future projects; excluded volumes under Force Majeure
See supplemental information
GLOBAL LNG GROWTHMta
EQUITY LNG SUPPLYMta
• EM additional 12 Mta equity capacity by 2025• Global demand to increase >70% by 2030

UPSTREAM MOZAMBIQUE
38
Five outstanding developments
1 All volumes gross2 Will reduce to 50% post government approval of QP farm-down
Updated November 1, 2019. See supplemental information
LNG development on plan
• Area 4 potential for >40 Mta1 through phased developments
• Coral floating LNG construction under way, on schedule
− 3.4 Mta capacity; start-up 2022
• Next stage: 2 trains x 7.6 Mta capacity
− LNG offtake commitments secured with affiliate buyers
− Development plan approved by Mozambique government
Exploring new opportunities
• Captured 3 blocks in 2018; access to 4 million gross acres
− ExxonMobil working interest 60%2
− Exploration drilling planned for 2020

UPSTREAM PNG
39
2016 2017 2018 2019/20
>3.5 8 9.4 >9.4
PNG LNG(Hides-Angore)
P’nyangElk-Antelope
P’nyangElk-Antelope
Explorationincl. Muruk
NET RESOURCE (Tcf)1
Five outstanding developments
See supplemental information
Continued high performance from existing operations
• Outstanding earthquake recovery; 2H18 reliability ~99%
• Facilities running at ~20% above design capacity
On plan to double LNG capacity to 16 Mta2
• Aligned on 3 train ~8 Mta expansion
• 2 trains for Papua LNG (Elk-Antelope)
− Signed gas agreement with PNG government in 1Q19
• 1 train for P’nyang, and future exploration
− P’nyang recoverable net resource up >80% to >2 Tcf
Exploration continues
• Further exploration/appraisal ongoing
1 Cumulative net resource2 Production volumes gross

UPSTREAM GOLDEN PASS
40
EXISTING GOLDEN PASS TERMINAL
1 Gross volume
• 3 trains, 16 Mta1 capacity
− 70% Qatar Petroleum (QP), 30% ExxonMobil
− FID January 2019; exports commence 2024
• Advantaged U.S. export facility
− Low-cost conversion of import regasification facility
− Atlantic Basin supply point providing logistics optimization benefits for global LNG portfolio and supply diversity for customers
− Further strengthening QP, ExxonMobil partnership

UPSTREAM EXPLORATIONPortfolio competitiveness
41
0
2,500
5,000
XOMAvg
PeerAvg
0
1,000
2,000
3,000
XOM RDS CVX BP TOT
TOTAL COMMERCIAL DISCOVERIES, 2013-2018Moeb, net
RESOURCE ADDITIONS INCLUDING ACQUISITIONS, 2013-2017Average Moeb, net
Source: Wood Mackenzie Source: Wood Mackenzie
• ~80% higher net resource additions than IOC average
• Discoveries 3 times greater than IOC average in past 6 years

0
7
14
2009 2013 2017
UPSTREAM EXPLORATIONPortfolio competitiveness
42
0
15
30
'12 '13 '14 '15 '16 '17 '18 '19 '20 '21
Deepwater
LNGOther
Peer range
ExxonMobil
EXPLORATION DRILLING1
Gross wells
EXPLORATION COSTS INCURREDBillion USD
See supplemental information
• Next 3 years of exploration focused on deepwater and LNG
• Average ~$2.5 billion exploration capex per year in 2019-21
Source: 10-K/20-F Company filings: XOM, BP, RDS, TOT, CVX; excludes unproved property acquisition costs
1 New field wildcats only
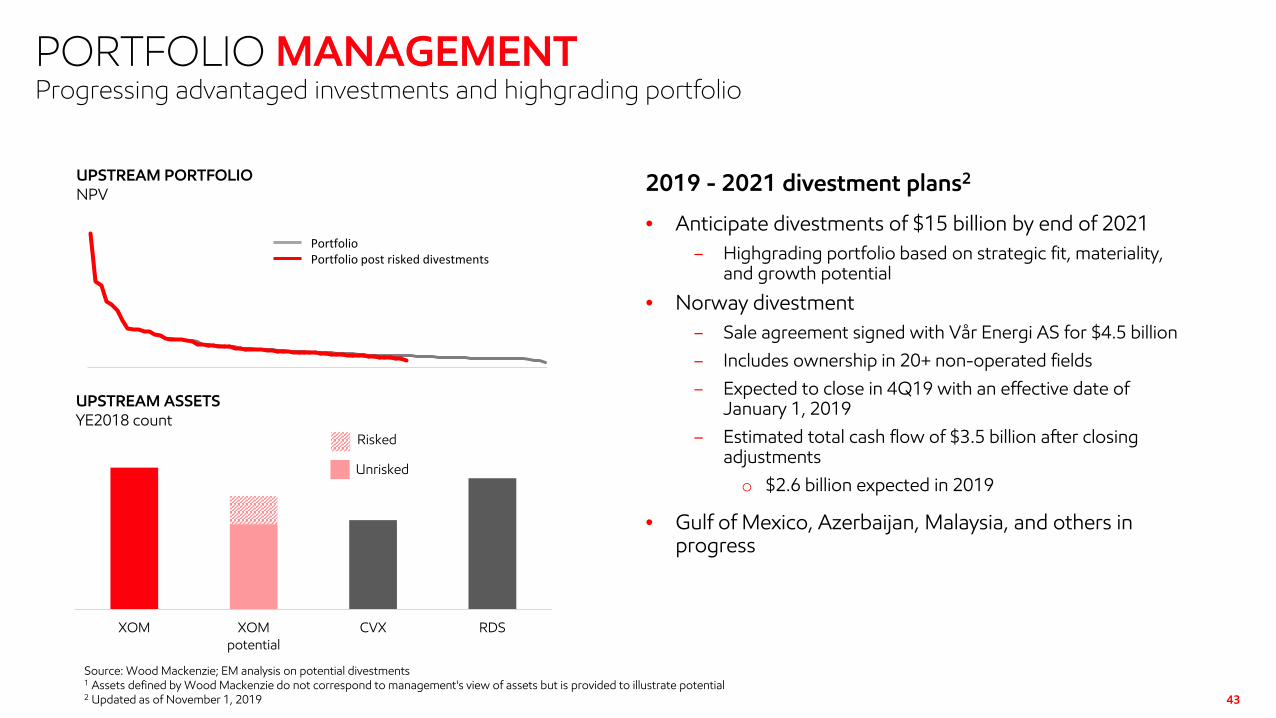
UPSTREAM ASSETSYE2018 count
43
PORTFOLIO MANAGEMENTProgressing advantaged investments and highgrading portfolio
XOM XOMpotential
CVX RDS
Source: Wood Mackenzie; EM analysis on potential divestments1 Assets defined by Wood Mackenzie do not correspond to management's view of assets but is provided to illustrate potential2 Updated as of November 1, 2019
2019 - 2021 divestment plans2
• Anticipate divestments of $15 billion by end of 2021– Highgrading portfolio based on strategic fit, materiality,
and growth potential
• Norway divestment– Sale agreement signed with Vår Energi AS for $4.5 billion– Includes ownership in 20+ non-operated fields– Expected to close in 4Q19 with an effective date of
January 1, 2019– Estimated total cash flow of $3.5 billion after closing
adjustmentso $2.6 billion expected in 2019
• Gulf of Mexico, Azerbaijan, Malaysia, and others in progress
PortfolioPortfolio post risked divestments
Unrisked
Risked
UPSTREAM PORTFOLIONPV
0
3
6
2018Actual
2019 2020 2021 2025
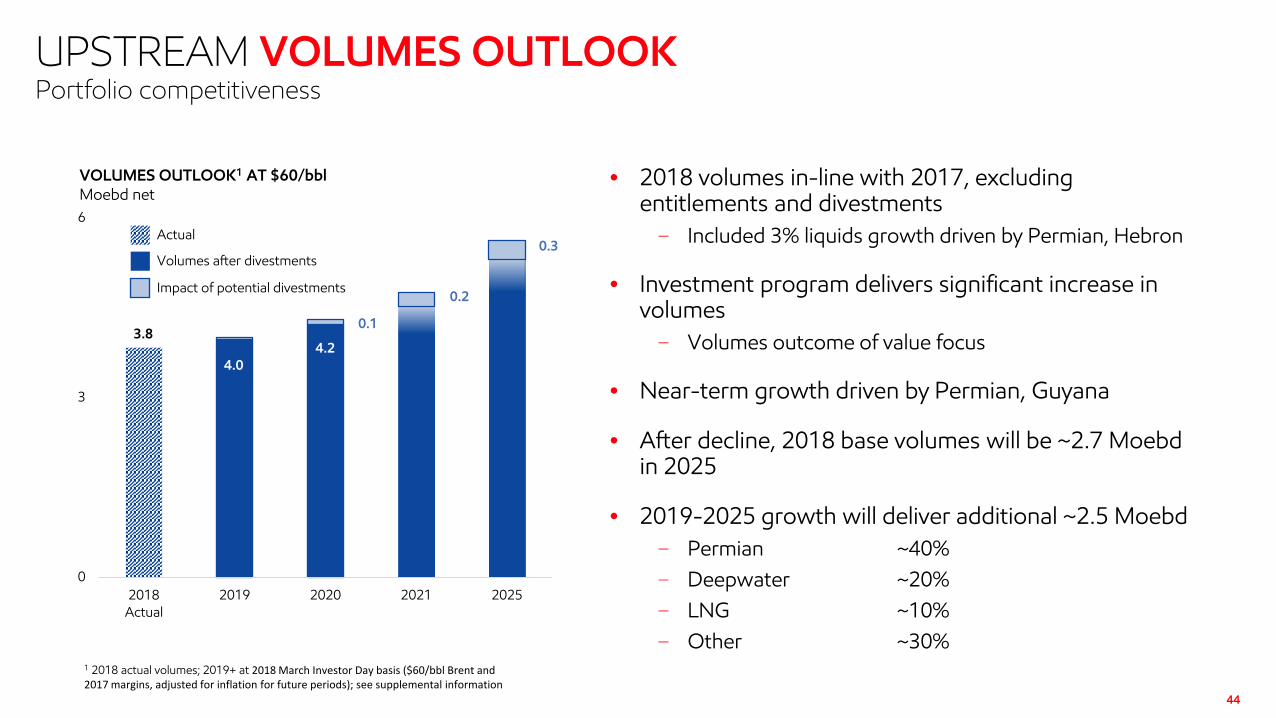
UPSTREAM VOLUMES OUTLOOKPortfolio competitiveness
44
4.04.2
3.8
VOLUMES OUTLOOK1 AT $60/bblMoebd net
• 2018 volumes in-line with 2017, excluding entitlements and divestments− Included 3% liquids growth driven by Permian, Hebron
• Investment program delivers significant increase in volumes− Volumes outcome of value focus
• Near-term growth driven by Permian, Guyana
• After decline, 2018 base volumes will be ~2.7 Moebd in 2025
• 2019-2025 growth will deliver additional ~2.5 Moebd− Permian ~40%− Deepwater ~20%− LNG ~10%− Other ~30%
1 2018 actual volumes; 2019+ at 2018 March Investor Day basis ($60/bbl Brent and 2017 margins, adjusted for inflation for future periods); see supplemental information
0.1
0.2
0.3
Impact of potential divestments
Volumes after divestments
Actual

85
100
'19 '20 '21 '22100
160
'19 '20-'24Avg
'25
45
UPSTREAM PERFORMANCESignificant increase in value
UPSTREAM EARNINGS PER OEB%, Indexed to 2019
UNIT CASH OPERATING COSTS1
%, Indexed to 2019
1 Normalized for price and forex impacts; excludes divestments
See supplemental information
• Low-cost supply additions drive down overall cost profile
• Earnings per barrel increases 50% in flat price environment

DOWNSTREAM AND CHEMICAL
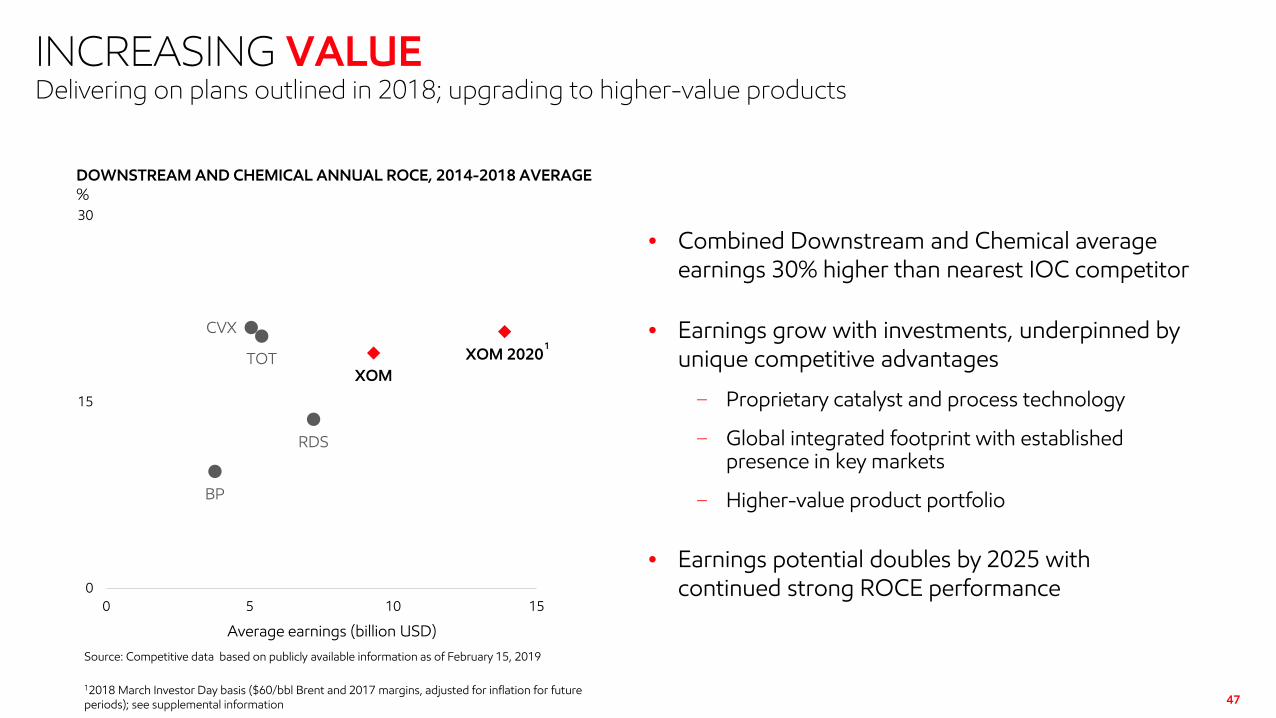
• Combined Downstream and Chemical average earnings 30% higher than nearest IOC competitor
• Earnings grow with investments, underpinned by unique competitive advantages
− Proprietary catalyst and process technology
− Global integrated footprint with established presence in key markets
− Higher-value product portfolio
• Earnings potential doubles by 2025 with continued strong ROCE performance
CVX
RDS
TOT
BP
XOMXOM 2020
0
15
30
0 5 10 15
47
INCREASING VALUEDelivering on plans outlined in 2018; upgrading to higher-value products
1
Source: Competitive data based on publicly available information as of February 15, 2019
12018 March Investor Day basis ($60/bbl Brent and 2017 margins, adjusted for inflation for future periods); see supplemental information
DOWNSTREAM AND CHEMICAL ANNUAL ROCE, 2014-2018 AVERAGE%
Average earnings (billion USD)

CYCLICAL BUSINESSES
1Exxon only before 1999See supplemental information
0
3
5
8
10
13
15
'01 '06 '10 '14 '18
EARNINGS AND AVERAGE ROCEBillion USD
DOWNSTREAM
14%
34%
20%
24%
• Downstream and Chemical businesses are cyclical
• Investing through cycles enables strong earnings and ROCE performance
• Both businesses experiencing challenging current industry margin environment
0
3
5
'78 '88 '98 '08 '18
EARNINGS AND AVERAGE ROCE1
Billion USD
11%
16%18%
19%
CHEMICAL
Average ROCE
48

DOWNSTREAM

• Delivering on plans outlined in 2018; upgrading to higher-value products
• Competitive advantages enable value capture across fuels and lubes value chains
• Advantaged projects, logistics, and new markets drive earnings growth
• Growing industry-leading lubricants business
DOWNSTREAM KEY MESSAGESOn track to upgrade production
50

51
VALUE CHAIN PORTFOLIO
Fuels Value Chain
Lubes Value Chain
Commercial and Trading
BrandedRetail
Commercial Business to
Business (B2B)
Basestocksand Specialties
FinishedLubricants
Research | Technology | Digital
ManufacturingCrudemovement
Crudeacquisition
Distribution
Blending and Packaging

DELIVERING ON COMMITMENTSDelivering on plans outlined in 2018; upgrading to higher-value products
52
2018 Investor Day 2019 Update
DOWNSTREAM
LOGISTICS Invest in Permian infrastructure FID Wink to Webster pipeline
REFINING Start up 6 major investments by 2025 3 online, 3 FIDs
FUELS VALUE CHAIN
Grow retail presence in Mexico and Indonesia
177 Mexico, 20 Indonesia>700 sites in 2019
LUBES VALUE CHAIN
Expand high-value synthetic lubricant sales
Sales up 12% in 2018
Updated as of November 1, 2019See supplemental information

53
PRODUCT MIX IMPROVES PROFITABILITYDelivering on plans outlined in 2018; upgrading to higher-value products
-50
0
50
Fuel oil Gasoline Chemicalfeedstock
Diesel /Jet
Lubebasestock
EXXONMOBIL DOWNSTREAM PRODUCT MIX1
%
$61/bbl $77/bbl $107/bbl $84/bbl $114/bbl
2018 Progress
2025 vs. 2017
See supplemental information
1 All columns reflect 2018 prices: Platts, Argus, and IHS, YE18 asset basis, excludes Augusta
REFINING PROFITABILITY
2 Weighted average refining net cash margin with investments disclosed at 2019 Investor Day
Source: ExxonMobil estimates based on 3rd party data and ExxonMobil analysis
Cumulative Crude Capacity
Net
Cas
h M
argi
n ExxonMobil Post-investment2
ExxonMobil Pre-investment2

54
MAXIMIZING EXISTING ASSETSLeveraging scale to capture value from manufacturing optimization
• Industry-leading refining capacity of 4.7 Mbd
• Global optimization team for each major refining technology platform
− Leveraging industry benchmarking to identify opportunities
− Hundreds of low-cost, high-value projects
• Combined with molecule management activities, deliver earnings of > $600 million/year1 by 2020
MANUFACTURING OPTIMIZATION PROJECTS BY TECHNOLOGY PLATFORM
See supplemental information
12018 March Investor Day basis ($60/bbl Brent and 2017 margins, adjusted for inflation for future periods)
Hydroprocessing, 108 Units
Reforming, 27 Units FCC,
17 Units
Distillation, 67 Units
Coking, 12 Units
Alkylation, 13 Units
Offsites
Basestocks, 21 Units
Hydrocracking, 9 Units

• Proximity to Singapore integrated complex
• Innovative microsites enable accelerated growth
• 20 microsites at YE18 with ~500 microsites at YE19
Indonesia
55
ENTERING GROWTH MARKETS TO DELIVER VALUEAdvantaged projects, logistics, and new markets drive earnings growth
• Industry-leading USGC refining supply cost
• 177 sites at YE18 with ~400 sites at YE19
Mexico

56
PERMIAN INTEGRATIONAdvantaged projects, logistics, and new markets drive earnings growth
Upstream Downstream Chemical
(Moebd)1 Logistics (Mbd)
Refining(light/total, Mbd)
(Mta)
2018 0.2 0.3 0.4/1.7 5.8
2022 0.8 1.0 0.8/2.1 7.6
• Unique position across full value chain
• Logistics/refining capacity grows with equity production
• Progressing Downstream projects:
− Cost-efficient 1+ Mbd JV pipeline
− Beaumont light-oil expansion
See supplemental information 1 All volumes net, year-end figures

57
BEAUMONT LIGHT CRUDE EXPANSIONAdvantaged projects, logistics, and new markets drive earnings growth
BEAUMONT PROFITABILITY AND CRUDE CAPACITYPre vs. post investment
Net
cas
h m
argi
n ($
/bbl
inpu
t)
Global crude capacity (Kbd)
Beaumontpost-investment
Beaumontpre-investment
• Expands light crude processing capacity by 250 Kbd
• Meets growing global demand for distillates
− >100 Kbd ultra-low-sulfur diesel; reduces intermediate feedstock purchases
• $1.9 billion investment; >$300 million/year earnings1
• Materially improves Beaumont competitiveness
• FID January 2019, start-up 2022
See supplemental information
Source: EM estimates based on 3rd Party data and EM analysis1 Average earnings based on 2018 March Investor Day basis ($60/bbl Brent and 2017 margins, adjusted for inflation for future periods)

Net
cas
h m
argi
n ($
/bbl
inpu
t)
Global crude capacity (Kbd)
58
ROTTERDAM HYDROCRACKERAdvantaged projects, logistics, and new markets drive earnings growth
Rotterdam post-investment
Rotterdam pre-investment
ROTTERDAM PROFITABILITY AND CRUDE CAPACITYPre vs. post investment
• Advantaged technology yields higher-value products
− 20 Kbd Group II basestocks
− 20 Kbd distillate
• $1.2 billion investment, >$300 million/year earnings1
• Doubles site earnings, becomes one of the world’s most profitable refineries
• Started-up 4Q18
See supplemental information
Source: EM estimates based on 3rd Party data and EM analysis1 Average earnings based on 2018 March Investor Day basis ($60/bbl Brent and 2017 margins, adjusted for inflation for future periods)

0 100 200 300 4000 50 100 150 200 250
59
HIGHER-VALUE BASESTOCKS DEMAND GROWTHGrowing industry-leading basestock cost of supply
Cumulative basestock production (Kbd)
Advantaged ExxonMobil production cost supports competitiveness
2025Projected demand
See supplemental information
Source: Publicly available information from Kline, Solomon, industry reports, and announcements as well as internal sources for EM data
Cumulative basestock production (Kbd)
2025Projected Demand
2025 BASESTOCK COST OF SUPPLY – GROUP IUSD/bbl
2025 BASESTOCK COST OF SUPPLY – GROUP IIUSD/bbl
Rotterdam
Singapore (2023)
ExxonMobil
Competitor
ExxonMobil
Competitor

100
250
400
'07 '18 '25
60
LUBRICANTS VALUE CHAIN LEADERSHIPGrowing industry-leading lubricants business
MARKET POSITIONGroup I-II basestocks market share (%)
SYNTHETIC LUBRICANTS SALES GROWTH%, Indexed to 2007
• Strongest combined market position in industry: #1 basestocks, #2 finished lubricants
• Value chain delivered more than $900 million earnings in 2018
• Industry-leading synthetics product lines led by Mobil 1
• Greater than 50% of lubes value chain earnings from synthetics
XOM
CVX
RDS
TOTBP
0
5
10
15
0 5 10 15
Finished lubricants market share (%)
Source: Kline (industry), EM estimates (ExxonMobil)
ExxonMobil 2018
ExxonMobil
Industry
See supplemental information
Source: Kline

61
DOWNSTREAM EARNINGS IMPROVEMENTIncreasing Downstream earnings profile
Markets
Manufacturing optimization
Revamps / improvements
Logistics and trading
Major projects
$3 BILLION EARNINGS GROWTH POTENTIAL1 2017-2020By activity
• Technology, scale, and integration increase earnings potential
− 3 of 7 major projects online
− Optimizations progressing with >300 projects
− New fuels market entries; lubricants growth
− 20 revamp / improvement projects, average returns of 30%
− Logistics and trading activities enhanced with value-chain focus
• Further earnings growth potential of $2 billion1
by 2025
Updated November 1, 2019See supplemental information
1 2018 March Investor Day basis ($60/bbl Brent and 2017 margins, adjusted for inflation for future periods); 2017 excludes impact of U.S. tax reform and impairments

CHEMICAL

CHEMICAL KEY MESSAGESOn track to grow advantaged performance products
63
• Growing new sales volume in North America and Asia1
− 8 new projects online; 6% annual global sales growth
− 3 U.S. Gulf Coast olefin derivative projects – FID completed
− 2 new major steam crackers under development – 1 FID, 1 progressing
• Increasing proportion of sales from higher-value performance products
− Unique catalyst, process, and application technology
− Continued stream of innovative new products – 8 delivered in 2018
• Leveraging global integration, scale advantages, and close connection with customers
1 Projects status updated as of November 1, 2019

ExxonMobilDerivatives / Products
SteamCracking
Crude
64
Elastomers Adhesions
Butyl Rubber
Synthetics
Paraxylene
Intermediates
Ethylene Glycol
Linear α-Olefin
Other Aromatics
Primary Petrochemicals
EthylenePropylene
C4/C5 Fraction
Intermediates
Polyethylene
Polypropylene
E/P Plastomers
Feedstock
Refining
EM Singapore
Commodity
Performance Products
GasoilNaphtha
Refinery Gas
Aromatics Plant Reformate
Xylenes
Ethane
Propane
ButaneNGLs
CHEMICAL BUSINESS VALUE CHAIN

Consumer / Personal Care Industrial / Agricultural
65
PRODUCT APPLICATIONS
Packaging Solutions Automotive

DELIVERING ON COMMITMENTSDelivering on plans outlined in 2018; upgrading to higher-value products
66
2018 Investor Day 2019 Update1
CHEMICAL
PROJECTS 13 new facilities, 7 online by YE 2018 8 online, 4 FID, 1 progressing
SALES Deliver 30% growth by 2025 6% growth in 2018
PERFORMANCE PRODUCTS
Provide 50% of earnings growth by 2025
On track
See supplemental information
1 Projects status updated as of November 1, 2019

GULF COAST GROWTH VENTUREGrowing sales volume with focus on performance products
67
~25%Lower Cost
1
LEVERAGING WORLD-CLASS PROJECT EXPERTISEProject unit cost (thousand USD/ton)
Industry Scale Designefficiency
Executionstrategy
EMGCGV
• World’s largest grassroots cracker (1.8 Mta); JV with SABIC 2
• 1.3 Mta polyethylene
• 1.1 Mta ethylene glycol
• 25% lower cost than industry
− Build world-scale units to maximize efficiency
− Optimize design to reduce footprint
− Leverage corporate project execution expertise
• Start-up by 2022; delivers ~$500 million/year in earnings3
See supplemental information
1 Based on public announcements and EM estimates2 All volumes gross3 At 2018 March Investor Day basis ($60/bbl Brent and 2017 margins, adjusted for inflation for future periods)

<$4 billion investment in performance product capacity additions generates nearly $600 million/year in earnings1 by 2023
Start-up Applications Advantages
Beaumont performancepolyethylene
2019 Packaging, agriculture film High-value performance product technology
Integration with existing sites
World-scale
Baton Rouge performance polypropylene
2021 Automotive, appliance
Baytown VistamaxxTM
performance polymers2022 Hygiene, diapers, compounding
Baytown linear alpha olefins
2022 Plastics, lubricants, detergents
U.S. GULF COAST OLEFIN DERIVATIVESGrowing sales volume with focus on performance products
68See supplemental information
1At 2018 March Investor Day basis ($60/bbl Brent and 2017 margins, adjusted for inflation for future periods), beginning in 2023

NEW LIQUIDS STEAM CRACKER IN CHINA Growing sales volume with focus on performance products
69
• 1.2 Mta steam cracker
• Applying proprietary crude-cracking technology
• Higher-value performance polyethylene and polypropylene products
• Construction cost advantage
• Start-up planned 2023; generates >$700M/year in earnings1
See supplemental information
1At 2018 Investor Day Basis ($60/bbl Brent 2017 flat real, 2017 margins)

SCALE AND MARKET ACCESS CAPTURE GROWTHLeveraging global integration, scale, and strong customer focus
70
• Chemical sales in more than 130 countries
• 20 world-class manufacturing sites provide supply flexibility

71
50%SALES GROWTH
BY 20251
Catalyst TechnologyHigh throughput labs
Process TechnologyPilot units for scale-up
Product TechnologyNew products tested and developed globally
Customer Solution TechnologyApplication development and customer trials
5,000customers
80application
development teams
200performance products
1Relative to 2017
PERFORMANCE PRODUCTS DEVELOPMENT

90
250
2007 2011 2015 2018
72
• Performance products growth achieved by creating value and providing solutions to our customers
• Positioned to serve growth in emerging economies driven by the growing middle class
• Investment portfolio combined with performance product growth generates future earnings growth
PERFORMANCE PRODUCT SALES GROWTHVolume, indexed
ExxonMobil performance products
Global GDP
Global chemicals commodities
Source: 2018 ExxonMobil Outlook for Energy: A View to 2040, IHS, ExxonMobil estimates
DEMONSTRATED PERFORMANCE PRODUCT GROWTH

PERFORMANCE PRODUCTS DRIVE EARNINGS GROWTHIncreasing Chemical earnings profile
73
0
5
10
2017 2025
Performance products
Commodity products
• Sales grow 30% by 2025 driven by North America and Asia
− Performance products grow 50% with pipeline of innovative new products
• ~60% of earnings1 from performance products
• Earnings1 double with volume growth and product portfolio upgrade
1 At 2018 March Investor Day basis ($60/bbl Brent and 2017 margins, adjusted for inflation for future periods); excludes impact of U.S. tax reform and impairments
See supplemental information
CHEMICAL EARNINGS GROWTH POTENTIAL1
Billion USD

INVESTMENT AND FINANCIAL PLAN

GROWING VALUEInvestment plans drive significant growth in shareholder value
75
• Structural improvement in capacity to generate earnings, cash flow, and ROCE
• Investments robust across range of prices and scenarios
• Financial strength and organizational capacity enable investment across business cycle
• Priority on value creation generates significant free cash flow potential

0
30
60
2019 2020 '21-'24Avg
2025
EARNINGS GROWTH POTENTIALStructural improvement in capacity to generate earnings, cash flow, and ROCE
76
$80/bbl1
$60/bbl1
$40/bbl1
EARNINGS POTENTIAL1
Billion USD
• Advantaged investments expand earnings generation capacity
• Earnings potential grows 140% by 2025 in a $60/bbl flat price scenario, relative to 20172
See supplemental information
1 2018 March Investor Day basis ($60/bbl Brent and 2017 margins, adjusted for inflation for future periods)2 2017 Excludes impact of U.S. tax reform and impairments

CASH FLOW GROWTH POTENTIALStructural improvement in capacity to generate earnings, cash flow, and ROCE
77
0
40
80
2019 2020 '21-'24Avg
2025
CASH FLOW FROM OPERATIONS AND ASSET SALES POTENTIAL1
Billion USD
$80/bbl1
$60/bbl1
$40/bbl1
• Cash flow potential nearly doubles by 2025 in a $60/bbl flat price scenario, relative to 2017
• Growth potential robust across range of prices and scenarios
See supplemental information
1 2018 March Investor Day basis ($60/bbl Brent and 2017 margins, adjusted for inflation for future periods)

CAPEX PROFILEInvestments robust across range of prices and scenarios
78
MAJOR INVESTMENTS
Segment 2019 - 2020 Capex Key projectsPotential start-up
Average discretionary project returns
Upstream $46-48 billion
• Conventional work programs Ongoing
~20%• U.S. tight oil Ongoing
• Deepwater – Guyana, Brazil 2020 forward
• LNG – Mozambique, PNG, Golden Pass 2022 forward
Downstream $9 billion
• Fawley hydrofiner 2021
~20%• Permian long haul pipeline 2021
• Beaumont light crude expansion 2022
• Singapore resid upgrade expansion 2023
Chemical $8 billion• USGC Polypropylene, Vistamaxx, LAO 2021 forward
~15%• Corpus cracker and derivatives 2022
Total $63-65 billion Average capex/cash flow from operations rate of ~75% for 2019 and 2020
See supplemental information

• Proven track record of project execution
− Decades of large-scale project experience across multiple geographies and resource types
− Strong unconventional development capability
− Securing contractor capacity in near term
• Anticipated level of investment below prior peak
• Leveraging centralized project organization
− Consolidates project delivery across business lines
− Optimizes deployment of global resources
− Enhances global application of learnings and experience
EXECUTION CAPACITYFinancial strength and organizational capacity enable investment across business cycle
79
Capex
Headcount
CAPEX AND PROJECT RESOURCESBillion USD / year Project resources
0
25
50
2013 2020-20250
2,500
5,000

LEVERAGE, YEAR-END 2018Total capitalization1, billion USD
RDSAa2/AA-
BPA1/A-
CVXAa2/AA
TOTAa3/A+
XOMAaa/AA+
150
250
350
5% 15% 25%
FINANCIAL CAPACITYFinancial strength and organizational capacity enable investment across the business cycle
80
• Industry-leading financial capacity
• Provides attractive terms for accessing capital
• Facilitates capture of advantaged opportunities across business cycles
Leverage2
Source: Peer data based on publicly available information as of December 31, 2018 1Total capitalization defined as “net debt + market capitalization”2Leverage defined as “net debt/total capitalization”

• Value-accretive investments provide capacity for shareholder distributions
• Dividend growth for 37 consecutive years
• Average annual growth rate well in excess of peers over past decade
-5
0
5
10
XOM CVX RDS TOT BP
SHAREHOLDER DISTRIBUTIONSPriority on value creation generates significant free cash flow capacity
81
2018
2014 - 2018 average
2009 - 2018 average
ANNUAL DIVIDEND GROWTH RATE%
1
Updated November 1, 2019See supplemental information
1 TOT growth rates based on dividends in Euros

• Portfolio generates significant free cash flow potential in a $60/bbl flat price scenario
• Provides available capacity to:
− Fund incremental accretive investments
− Grow annual dividend beyond 2018 levels
− Reduce debt
− Repurchase shares
FREE CASH FLOW POTENTIALPriority on value creation generates significant free cash flow potential
82
Free cash flow1
~$190 billion
Dividends2
~$100 billion
Available capacity3
~$90 billion
FREE CASH FLOW ALLOCATION POTENTIAL, 2019-2025
See supplemental information
1Potential free cash flow based on 2018 March Investor Day basis ($60/bbl Brent and 2017 margins, adjusted for inflation for future periods). Asset sales assumed $25 billion over period2Dividends assumed flat based on 2018 gross payout. Is not a guarantee of any declaration by the Board of any future dividend or any increase versus historical levels3Available Capacity - capacity for additional investments, potential dividend growth, balance sheet maintenance, and potential share buybacks

GROWING SHAREHOLDER VALUEValue growth plans on track with additional upside potential
83
• Leveraging competitive advantages to grow significant shareholder value
• Strengthening base while investing across full value chain
• Strongest set of opportunities since Exxon and Mobil merger
• Confident in organization’s ability to capture upside opportunities and execute plans

84
REFERENCE MATERIAL

85
100% EV DEMAND SCENARIOStrong business fundamentals support investments
0
60
120
2013 2040 2040100% Light-duty EV
Other
Chemicals
Commercial transportation
Source: 2018 EM Outlook for Energy: A View to 2040
See supplemental information
LIQUIDS DEMANDMoebd
Light-duty transportation
• Global liquids demand grows ~30%, led by commercial transportation and chemicals
• 100% electric light-duty vehicle scenario results in 2040 demand levels similar to 2013
86
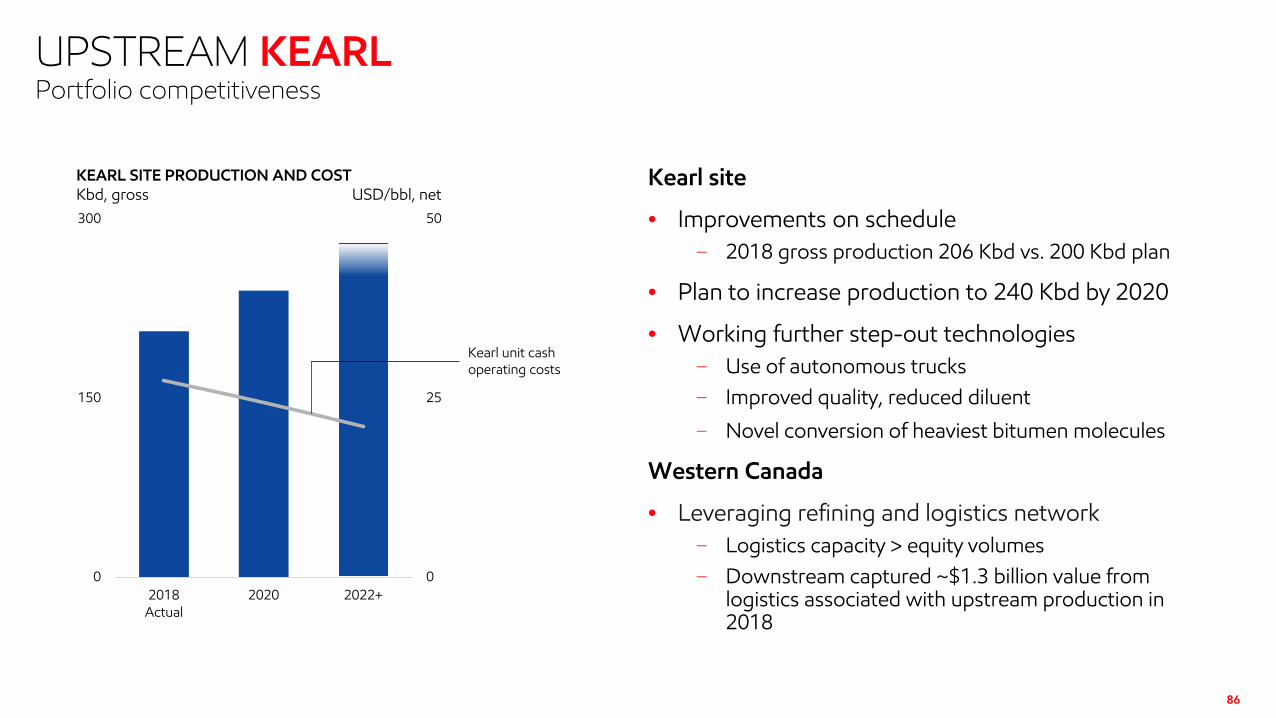
UPSTREAM KEARLPortfolio competitiveness
Kearl unit cash operating costs
0
25
50
0
150
300
2018Actual
2020 2022+
KEARL SITE PRODUCTION AND COSTKbd, gross USD/bbl, net
Kearl site
• Improvements on schedule− 2018 gross production 206 Kbd vs. 200 Kbd plan
• Plan to increase production to 240 Kbd by 2020
• Working further step-out technologies− Use of autonomous trucks− Improved quality, reduced diluent
− Novel conversion of heaviest bitumen molecules
Western Canada
• Leveraging refining and logistics network− Logistics capacity > equity volumes− Downstream captured ~$1.3 billion value from
logistics associated with upstream production in 2018

87
CHEMICAL PERFORMANCE PRODUCTS
High Performance Synthetic Base Stocks
EscaidTM High Performance Base Fluids
AchieveTM Advanced Polypropylene ExceedTM XP Polyethylene

0
5
10
2017 2025
88
PERFORMANCE PRODUCTS DRIVE EARNINGS GROWTH
Performance products
Commodity products
CHEMICAL EARNINGS GROWTH POTENTIAL1
Billion USD
Mix Upgrade
USGCGrowth
AsiaGrowth
12018 March Investor Day basis ($60/bbl Brent and 2017 margins, adjusted for inflation for future periods), relative to 2017 adjusted earnings, excludes impact of U.S. tax reform and impairments in 2017; see supplemental information
North America Growth
Gulf Coast Growth Venture
Baytown Chemicals Expansion
Beaumont Polyethylene Expansion
Baton Rouge Polypropylene Expansion
Singapore Butyl and Adhesion Plant
Banyan FacilityIntegrated Downstream and
Chemical Investment
China Venture

89
INVESTOR RELATIONS CONTACTS
Neil Hansen Vice President – Investor Relations and Secretary of Exxon Mobil Corporation
Molina Albright Investor Relations Manager
Michelle Rose Investor Relations Advisor
Kelli Wright Investor Relations Advisor
Janet Zhou Investor Relations Analyst
Pam Bell Investor Relations AssistantPhone: (972) 940-6724
Website ExxonMobil.com
Fax (972) 940-6720
Updated as of October 2019
90
BACKUP MATERIAL

SUPPLEMENTAL INFORMATIONImportant information and assumptions regarding certain forward-looking statements. Forward-looking statements contained in this presentation regarding the potential for future earnings, cash flow, project returns, return on average capital employed (ROCE), operating cash flows, and capital employed are not forecasts of actual future results. These figures are provided to help quantify the targeted future results and goals of currently-contemplated management plans and objectives including new project investments, plans to grow Upstream production volumes, plans to increase sales in our Downstream and Chemical segments and to shift our Downstream product mix toward higher-value products, continued highgrading of ExxonMobil’s portfolio through our ongoing asset management program, initiatives to improve efficiencies and reduce costs, and other efforts within management’s control to impact future results as discussed in this presentation. These figures are intended to quantify for illustrative purposes management’s view of the potentials for these efforts over the time periods shown, calculated on a basis consistent with our internal modelling assumptions for factors such as working capital and capital structure, as well as factors management does not control, such as interest, differentials, and exchange rates.
For all price point comparisons, unless otherwise indicated, crude prices and product margins are on a 2017 Brent adjusted for inflation for future periods. Unless otherwise specified, crude prices are Brent prices. Where price is not stated, we assume a $60/bbl Brent 2017 adjusted for inflation for future periods. These prices are not intended to reflect management’s forecast for future prices or the prices we use for internal planning purposes. For natural gas, except as otherwise explicitly noted in this presentation, we have used management’s internal planning prices for the relevant natural gas markets. We have assumed that Downstream product margins remain at 2017 levels. We have assumed Chemical margins reflect gas and market conditions. At $60/bbl Brent 2017 adjusted for inflation for future periods, we have assumed Chemical margins reflect 2017 margins. We have also assumed that other factors such as laws and regulations, including tax and environmental laws, and fiscal regimes remain consistent with current conditions for the relevant periods. Unless otherwise indicated, asset sales and proceeds are consistent with our internal planning. For 2018 earnings, Corporate & Financing expenses were $2.6 billion. For future periods, we have assumed Corporate & Financing expenses of $2.5 billion annually, consistent with March 2018 Analyst Meeting in order to enable the comparison of business activities.
See the Cautionary Statement at the front of this presentation for additional information regarding forward-looking statements.
91

SUPPLEMENTAL INFORMATIONNon-GAAP and other measures. In this presentation, cash flow from operations and asset sales, earnings excluding effects of U.S. tax reform enactment and impairments, return on average capital employed (ROCE), operating costs, unit cash operating costs, upstream earnings per OEB, estimated operating cash contribution, net cash margin, and free cash flow are non-GAAP measures. With respect to historical periods, reconciliation information is included with the relevant definition below or as noted below in the Frequently Used Terms available on the Investors page of our website at www.exxonmobil.com. For future periods, we are unable to provide a reconciliation of forward-looking non-GAAP measures to the most comparable GAAP financial measures because the information needed to reconcile these measures is dependent on future events, many of which are outside management’s control as described above. Additionally, estimating such GAAP measures and providing a meaningful reconciliation consistent with our accounting policies for future periods is extremely difficult and requires a level of precision that is unavailable for these future periods and cannot be accomplished without unreasonable effort. Forward-looking non-GAAP measures are estimated in a manner consistent with the relevant definitions and assumptions noted above.
Definitions and non-GAAP financial measure reconciliations
Cash Flow from operations and asset sales. For information concerning the calculation of cash flow from operations and asset sales for historical periods, see the Frequently Used Terms on the Investors page of our website at www.exxonmobil.com.
Earnings excluding effects of U.S. tax reform and impairments (Adjusted Earnings/Actuals). The tables below reconcile 2017 and 2018 earnings excluding effects of U.S. tax reform enactment and impairments used in this presentation to 2017 and 2018 U.S. GAAP earnings:
(millions of dollars) Upstream Downstream Chemical Corporate and
Financing Corporate Total
2017 Earnings (U.S. GAAP) 13,355 5,597 4,518 (3,760) 19,710
U.S. tax reform 7,122 618 335 (2,133) 5,942
Impairments (1,504) (17) - - (1,521)
2017 Earnings excluding U.S. tax reform and impairments 7,737 4,996 4,183 (1,627) 15,289
92

SUPPLEMENTAL INFORMATION
The following table bridges each of (1) “2018 earnings potential communicated at 2018 March Investor Day” and (2) “2018 normalized earnings” to “2018 earnings”:
*Estimated price effects to adjust back to 2018 March Investor Day basis represent the impact of Upstream oil and gas price changes, Downstream margins changes and Chemical margins changes based on best internal estimates of these external factors for illustrative purposes.
$ Billions2018 Earnings Potential communicated at 2018 March Investor Day 18.9 Volume (2.4)Value capture from North America strategic integrated investments 0.8 Divestment gains and other 1.4 2018 Normalized earnings (2018 March Investor Day basis) 18.7 Estimated price effects* 2.3 2018 Earnings excluding U.S. tax reform and impairments 21.0 U.S. tax reform enactment 0.3 Impairments (0.5)2018 Earnings 20.8
(millions of dollars) Upstream Downstream Chemical Corporate and
Financing Corporate Total
2018 Earnings (U.S. GAAP) 14,079 6,010 3,351 (2,600) 20,840
U.S. tax reform 271 - - 20 291
Impairments (439) (43) (7) - (489)
2018 Earnings excluding U.S. tax reform and impairments 14,247 6,053 3,358 (2,620) 21,038
93

SUPPLEMENTAL INFORMATIONEstimated Operating Cash Contribution. Estimated earnings before depreciation and depletion, including non-controlling interests and abandonment spend. Where applicable, pro-rata equity company earnings are net of depreciation and depletion.
Free cash flow. The definition of free cash flow is provided in our Frequently Used Terms available on the Investors page of our website at www.exxonmobil.com.
Divestments. Divestments represent the unadjusted sale price specified in the applicable contract of sale as of the effective date for asset divestiture agreements which the corporation or one of its affiliates has executed since January 1, 2019. Actual final sale price and cash proceeds may differ in amount and timing from the divestment value depending on applicable contract terms.
Net Cash Margin ($/bbl input). Net Cash Margin, following Solomon Associate’s definition, is defined as gross margin at a standard price set for feeds and products, less normalized operating costs on a unit basis, expressed as $/BBL of total input.
Operating costs. For information concerning the calculation and reconciliation of operating costs see the Frequently Used Terms available on the Investors page of our website at www.exxonmobil.com.
Unit cash operating costs ($/bbl). Operating costs (excluding depreciation and depletion) per net oil-equivalent barrel of production.
Permian Estimated Earnings. Permian’s estimated portion of earnings from Upstream operated assets in Midland and Delaware Basins and Downstream logistics.
Return on average capital employed (ROCE). For information concerning the calculation of average capital employed and ROCE for historical periods, which we also refer to as Return Profile in this presentation, see the Frequently Used Terms on the Investors page of our website at www.exxonmobil.com.
94

SUPPLEMENTAL INFORMATIONUpstream Earnings per OEB ($/bbl). Upstream’s net income attributable to ExxonMobil per net oil-equivalent barrel of production.
Performance product. Refer to high performance Chemical products, including plastics, synthetic rubber, chemical derivatives, fluids, and solvents that provide differentiated performance for multiple applications.
Project. The term “project” as used in this presentation can refer to a variety of different activities and does not necessarily have the same meaning as in any government payment transparency reports.
Resources, resource base, and recoverable resources. These and similar terms refer to the total remaining estimated quantities of oil and natural gas that are expected to be ultimately recoverable. ExxonMobil refers to new discoveries and acquisitions of discovered resources as resource additions. The resource base includes quantities of oil and natural gas classified as proved reserves, as well as quantities that are not yet classified as proved reserves but that are expected to be ultimately recoverable. The term “resource base” or similar terms are not intended to correspond to SEC definitions such as “probable” or “possible” reserves. “Potential” resource amounts are not currently included in the resource base.
Returns, investment returns, project returns. Unless referring specifically to ROCE, references to returns, investment returns, project returns, and similar terms mean discounted cash flow returns based on current company estimates. Future investment returns exclude prior exploration and acquisition costs.
100% electric light-duty scenario. Refers to the hypothetical 100% electric light-duty vehicle liquids demand sensitivity presented in our 2018 Outlook for Energy: A View to 2040.
95

SUPPLEMENTAL INFORMATIONOther informationAll references to production rates and project capacity are on a gross basis, unless otherwise noted. References to resource size are on a net basis, unless otherwise noted.
ExxonMobil has business relationships with thousands of customers, suppliers, governments, and others. For convenience and simplicity, words such as venture, joint venture, partnership, co-venturer, and partner are used to indicate business and other relationships involving common activities and interests, and those words may not indicate precise legal relationships.
Competitor data is based on publicly available information and, where estimated or derived (e.g., ROCE), done so on a consistent basis with ExxonMobil data. Future competitor data, unless otherwise noted, is taken from publicly available statements or disclosures by that competitor and has not been independently verified by ExxonMobil or any third party. We note that certain competitors report financial information under accounting standards other than U.S. GAAP (i.e., IFRS).
96

The following table contains segment earnings potentials communicated at the 2019 March Investor Day. These numbers assume a $60/bbl Brent 2017 adjusted for inflation for future periods and that Downstream and Chemical product margins remain at 2017 levels. Earnings potential numbers are calculated independently for each component and may not be additive due to rounding.
SUPPLEMENTAL INFORMATION
(billions of dollars) 2020 ‘21-’24 2025
Upstream 13.8 17.3 20.9
Downstream 7.8 8.7 9.5
Chemical 6.1 7.4 8.8
Corporate and Financing (2.5) (2.5) (2.5)
Earnings 25.1 30.7 36.7
97

SUPPLEMENTAL INFORMATION
Liquids (Kbd) Gas
(Mcfd)
ExxonMobil working
interest (%)Operator
Angola AB32 Kaombo Split Hub - Sul 125 - 15 CAustralia Gorgon Future Phases 20 2,700 25 CBrazil Carcara(2) 220 - 40 C
Aspen 75 - 100 ESyncrude Mildred Lake Extension 210 - 25 JLiza Phase 1 120 - 45 ELiza Phase 2 220 - 45 EPayara 180 - 45 EFuture Phases 230+ - 45 E
Iraq West Qurna I 1,600 - 34 JKazakhstan Kashagan Compression & De-bottlenecking 450 450 17 J
Tengiz Expansion 655 - 25 CMozambique Coral FLNG 5 575 25 C
Rovuma LNG Phase 1 10 2,400 25 ENigeria Bonga Southwest 150 - 16 C
Owowo West 180 - 27 ESatellite Field Development Phase 2 30 - 40 E
Norway Snorre Expansion Project 110 240 17 CPNG Papua LNG 15 800 28 E
PNG LNG Expansion - 400 33 EQatar Barzan 90 1,400 7 JRomania Neptun Deep - 630 50 EU.A.E. Upper Zakum 750 750 - 28 J
Upper Zakum 1MBD(3) 250 - 28 JU.K. Penguins Redevelopment 35 120 50 JU.S. Golden Pass LNG Export - 2,500 30 J
Permian Basin(4) 800+ 1,200+ 87-93 EVietnam Ca Voi Xanh (Blue Whale) 3 580 64 E
Facility capacity (gross)
MAJOR UPSTREAM PROJECTS1
2019-2025 (Projected)
Guyana
Canada
(1) The term “project” as used in this publication can refer to a variety of activities and does not necessarily have the same meaning as in any government payment transparency reports.(2) Anticipate regulatory approval of an additional 3.5-percent participating interest transfer in 2019 for BM-S-8 to increase equity to 40 percent. (3) Facility capacity incremental to Upper Zakum 750, resulting in 1 million barrels per day combined facility capacity.(4) Net production expected in 2025.
Kbd = thousand barrels per dayMcfd = million cubic feet per dayOperators: E=ExxonMobil operated, C=Co-venture operated, J=Joint operations
98

2019+ (Projected) Location DescriptionCanada Strathcona 18 Kt/y Cogeneration – emissions reductionIndia TBD 500 Kb/y Logistics – lubricant blendingSingapore Singapore 2 Kbd Lube dewaxing – Group II basestocks
Singapore 3 Mb Logistics expansionSingapore 80 Kbd Lubricant and diesel production
United Kingdom Fawley 38 Kbd Hydrofiner – diesel productionUnited States Baton Rouge 17 Kbd Crude expansion
Baytown 9 Kbd Jet expansionBaytown 36 Kbd Light-crude expansionBeaumont 250 Kbd Light-crude expansion
2019 (Projected) Location ProductUnited States Beaumont Polyethylene
2020+ (Projected)Asia Pacific China Ethylene
PolyethylenePolypropylene
Singapore Steam-cracked residual upgradeUnited States Baton Rouge Polypropylene
Baytown Linear alpha olefinsVistamaxx performance polymers
San Patricio EthyleneMonoethylene glycolPolyethylene1,300
1,100
MAJOR DOWNSTREAM PROJECTSCapacity
MAJOR CHEMICAL PROJECTSCapacity (Kta)
650
450350400
1,800
1,2001,300
850-
SUPPLEMENTAL INFORMATION
99