2019 pacific northwest loads and resources study
TRANSCRIPT

B O N N E V I L L E P O W E R A D M I N I S T R A T I O N
2019 Pacific Northwest Loads and Resources Study
October 2020


130 Department of Energy
Bonneville Power Administration P.O. Box 3621
Portland, Oregon 97208-3621
October 20, 2020
In reply refer to: PGPR-5
Dear Interested Parties:
The Pacific Northwest Loads and Resources Study, commonly called “The White Book”, is the
Bonneville Power Administration’s (BPA) annual publication of the Federal system and the Pacific
Northwest (PNW) region’s loads and resources for the upcoming ten year period.
The White Book is used by BPA as a planning tool, as an information source for customers, as a
published source of loads and resources information for regional interests, and as a data source for the
Columbia River Treaty studies. The White Book is not used to guide day-to-day operations of the
Federal Columbia River Power System or to determine BPA revenues or rates.
This 2019 White Book presents Federal system and the region’s load obligations, contracts, and resources
as of December 2019 for operating years (OY) 2021 through 2030. Due to the timing of this study being
completed and the decision making timing of the CRSO EIS, this White Book does not include all the
assumptions and results presented in the EIS. The 2019 White Book includes two distinct studies:
Federal System Analysis—forecast of Federal system firm loads and resources based on
expected load obligations and different levels of generating resources that vary by water
conditions. The results are summarized below:
Annual Energy Surplus/Deficits: Under critical water conditions; the Federal system is
projected to have annual energy deficits across the study period, ranging from as low as -
194 aMW, to as large as -354 aMW. These annual energy deficits projections are similar
to those projected in the 2018 White Book, however the first two years are forecasts to
have slightly greater deficits and rest of the study period has slightly smaller deficits.
Under average water conditions, the Federal system is projected to have annual energy
surpluses through the study period.
January 120-Hour Capacity Surplus/Deficits: Under critical water conditions; the Federal
system is projected to have January 120-Hour capacity deficits over the study period,
ranging from as low as -950 MW to as high as -1,226 MW. While these 120-Hour
capacity deficits are similar to those projected in the 2018 White Book, OY2021 is
forecasted to have greater deficits and the rest of the study period is forecasted to have
smaller deficits. Under average water conditions; the Federal system is projected to have
January 120-Hour capacity surpluses over the study period.
PNW Regional Analysis—forecast of regional firm loads and resources, based on expected retail
loads and different levels of generating resources that vary by water conditions. The
decommissioning of existing resources, the availability of uncommitted PNW Independent Power
Producer (IPP) generation, and new resource additions are key variables in the results of this
analysis. The results are summarized below:
Annual Energy Surplus/Deficits: Under critical water conditions; the PNW region is
projected to have annual energy surpluses as large as 3,974 aMW in OY 2021, slowly
decreasing to 698 aMW by OY 2030. These annual energy projections are similar to

2
those presented in the 2018 White Book, with the first two years forecasted for slightly
less surplus, and the rest of the study period expected to be slightly larger surpluses.
Under average water conditions; the PNW region would see even larger energy surpluses
over the study horizon.
January 120-Hour Capacity Surplus/Deficits: Under critical water conditions; the PNW
region is projected to have January 120-Hour capacity deficits over the study period,
ranging from -969 MW to -3,460 MW. These deficit projections are slightly smaller than
those shown in the 2018 White Book. Under average water conditions; the PNW region
has January 120-Hour capacity surpluses through the final year of this study.
The results of the 2019 White Book are similar to last year. However, the word ‘Uncertainty’ should be
highlighted at this time as we are in a time of great uncertainty, both in terms of loads and resources.
From resource retirements, to resource development, to resource adequacy, to carbon free resource
requirements, ‘Uncertainty’ is a common theme. As with resources, there is also much uncertainty with
loads. Some load forecasts associated with electrification of the transportation industry alone result in
load growth rates of 38% by 2030, to 44% by 2035, to 60% by 2050. From low carbon electrification of
new buildings, to refitting of old buildings, how loads will grow across the region also result in large
amounts of ‘Uncertainty’.
The 2019 White Book is available on BPA’s website: www.bpa.gov/goto/whitebook or from BPA’s
Visitor Center, which you can reach toll-free at 800-622-4520 (or 503-230-4636). Details regarding
regional loads, contracts, and generating resources are available in the 2019 Technical Appendix available
only in electronic format on BPA’s website: www.bpa.gov/goto/whitebook
Please send questions and/or comments to Steve Bellcoff (503) 230-3319.
Sincerely,
Kieran P. Connolly
Vice President, Generation Asset Management
Enclosure

2019 Pacific Northwest Loads and Resources Study i
2019 PACIFIC NORTHWEST LOADS AND RESOURCES STUDY
The White Book
BONNEVILLE POWER ADMINISTRATION
October 2020
i i Bonneville Power Administration
Cover Picture:
John Day Dam is a concrete gravity run-of-the-river dam spanning the Columbia River between Sherman County in Oregon and Klickitat County in Washington, owned and operated by the US
Army Corps of Engineers. The dam was completed in 1971 and creates Lake Umatilla, it includes 16 hydroelectric turbines with a nameplate capacity of 2,484 MW.
Errata

2019 Pacific Northwest Loads and Resources Study i i i
ACKNOWLEDGMENTS
Preparation of the annual Pacific Northwest loads and resources study is a complex, multidisciplinary effort. BPA wishes to acknowledge the team—BPA staff and others—whose diligence and dedication
result in a reliable, high quality document.
Bonneville Power Administration
Generation Asset Management:
Long Term Power Planning Group
Regional Coordination Group
Operational Planning Group
Customer Support Services:
Load Forecasting and Analysis Group
Bulk Marketing and Transmission Services:
Long Term Sales and Purchasing Group
NW Requirements Marketing:
Office of General Counsel
Pacific Northwest Utilities Conference Committee
Northwest Power & Conservation Council

iv Bonneville Power Administration

Table of Contents
SECTION 1: SUMMARY ..................................................................................................................................... 3 Planning Context ...........................................................................................................................................................3 Load Obligations............................................................................................................................................................4 Resource Types..............................................................................................................................................................5 Adjustments to Resources............................................................................................................................................7 Hydro Resources Modeling ..........................................................................................................................................7
Critical Water Planning .............................................................................................................................................9 Variability of Hydro Generation ...............................................................................................................................9 Hydro Capacity Modeling .........................................................................................................................................9
Notable Updates ........................................................................................................................................................ 10 Sources of Uncertainty .............................................................................................................................................. 10 Electrification Uncertainty ........................................................................................................................................ 11
SECTION 2: FEDERAL SYSTEM ANALYSIS ......................................................................................... .13 Load Obligations......................................................................................................................................................... 13
USBR obligations .................................................................................................................................................... 13 Regional Dialogue CHWM PSC obligations to Public & Federal agency customers .........................................13
Table 2-1............................................................................................................................................................. 14 IOU Load Service under Regional Dialogue PSCs .................................................................................................14 DSI contracts............................................................................................................................................................14 Other Contract Obligations ................................................................................................................................... 14 Firm Loads............................................................................................................................................................... 14 Conservation........................................................................................................................................................... 14
Table 2-2............................................................................................................................................................. 15 Resources .................................................................................................................................................................... .15
Federal System Resource Types ............................................................................................................................16 Table 2-3............................................................................................................................................................. 16 Table 2-4............................................................................................................................................................. 18 Table 2-5............................................................................................................................................................. 19
Federal System Hydro Generation Variability.....................................................................................................20 Table 2-6............................................................................................................................................................. 20 Table 2-7............................................................................................................................................................. 21 Table 2-8............................................................................................................................................................. 21
Key Results .................................................................................................................................................................. 22Annual Energy.........................................................................................................................................................22
Table 2-9............................................................................................................................................................. 22 Table 2-10........................................................................................................................................................... 22
120-Hour Capacity..................................................................................................................................................23 Table 2-11........................................................................................................................................................... 23 Table 2-12........................................................................................................................................................... 23
Federal System Annual Surplus/Deficits.............................................................................................................24 Table 2-13........................................................................................................................................................... 24
Federal System Monthly Surplus/Deficit............................................................................................................24 Table 2-14........................................................................................................................................................... 25
Conclusion................................................................................................................................................................... 25
_____________________________________________________________________________________________________________________
2019 Pacific Northwest Loads and Resources Study 1
SECTION 3: PACIFIC NORTHWEST REGIONAL ANALYSIS ...................................................... .27Regional Loads............................................................................................................................................................ 27
Table 3-1............................................................................................................................................................. 28 Regional Resources .................................................................................................................................................... 28
Table 3-2............................................................................................................................................................. 29 Regional Hydro Generation Variability .................................................................................................................29
Table 3-3............................................................................................................................................................. 30 Table 3-4............................................................................................................................................................. 31
Variability Due to IPP Generation Delivered to the PNW Region .......................................................................31 Table 3-5............................................................................................................................................................. 31 Table 3-6............................................................................................................................................................. 32
Key Results .................................................................................................................................................................. 33Annual Energy......................................................................................................................................................... 33
Table 3-7............................................................................................................................................................. 33 Table 3-8............................................................................................................................................................. 33 Table 3-9............................................................................................................................................................. 34
January 120-Hour Capacity...................................................................................................................................34 Table 3-10........................................................................................................................................................... 34 Table 3-11........................................................................................................................................................... 35 Table 3-12........................................................................................................................................................... 35
Regional Annual Surplus/Deficit ..........................................................................................................................36 Table 3-13........................................................................................................................................................... 36
Regional Monthly Surplus/Deficit ........................................................................................................................36 Table 3-14........................................................................................................................................................... 37
Conclusion................................................................................................................................................................... 37
SECTION 4: FEDERAL SYSTEM ANALYSIS EXHIBITS .................................................................. .39Exhibit 4-1: Annual Energy ...............................................................................................................................41 Exhibit 4-2: Monthly Energy ............................................................................................................................ 45 Exhibit 4-3: Annual 120-Hour Capacity ..........................................................................................................49 Exhibit 4-4: Monthly 120-Hour Capacity........................................................................................................53 Exhibit 4-5: 80-Water Conditions Monthly Energy .......................................................................................57
SECTION 5: PACIFIC NORTHWEST REGIONAL ANALYSIS EXHIBITS ................................ .61Exhibit 5-1: Annual Energy ...............................................................................................................................63 Exhibit 5-2: Monthly Energy ............................................................................................................................ 67 Exhibit 5-3: Annual 120-Hour Capacity ..........................................................................................................71 Exhibit 5-4: Monthly 120-Hour Capacity.........................................................................................................75 Exhibit 5-5: 80-Water Conditions Monthly Energy .......................................................................................79
_____________________________________________________________________________________________________________________
2 Bonniville Power Administration

Section 1: Summary
Planning Context
The Pacific Northwest Loads and Resources Study (commonly referred to as the “White Book”) is a planning document produced by the Bonneville Power Administration (Bonneville) that presents its projection of load and resource conditions for the upcoming 10-year period (OY 2021 through 2030). The White Book includes analysis of Bonneville’s forecasts of expected power obligations and resource generation for both the Federal system and the Pacific Northwest (PNW) region as a whole. The information contained in the White Book is used for: 1) long-term planning studies for Bonneville; 2) in planning studies for the Columbia River Treaty (Treaty); and 3) as a published record of information and data for customers and other regional planning entities. The White Book is not used to guide day-to-day operations of the Federal Columbia River Power System (FCRPS).
Bonneville’s White Book traditionally focuses on long-term deterministic power planning for the Federal system and the PNW region. Bonneville’s Federal System Analysis calculates the Federal system load and resource balance by comparing expected Federal system loads and contract obligations to forecasted Federal system resource generation and contract purchases. In the same manner, Bonneville’s PNW regional analysis calculates the PNW regional load and resource balance by comparing expected regional retail loads and contract obligations to forecasted regional resource generation and contract purchases. Hydro resources for the Federal system and PNW region include variability by incorporating a variety of generation forecasts, associated with streamflows from the 80-historical water conditions. These deterministic analyses are modeled by operating year (OY1) to be consistent with Bonneville’s water year planning processes. Results are presented in: 1) annual and monthly energy, expressed in average megawatts (aMW); and 2) monthly peak capacity, presented in 120-Hour peak megawatts (MW) (1-Hour peak megawatts are only presented in the Appendix). The Federal System Analysis is presented in Section 2, page 11, and the Pacific Northwest Regional Analysis is presented in Section 3, page 24.
Bonneville, like the rest of the electric power industry, continues to explore ways to more comprehensively assess the ability of the power system to meet long-term load obligations. Bonneville periodically incorporates into its planning additional studies that use different analytical methods and analyze different scenarios to meet load obligations, such as the Federal System Needs Assessment and Federal System Resource Adequacy studies. While a Federal System Needs Assessment was completed as part of the 2018 Resource Program, and has been updated as part of the 2020 Resource Program (under development), we have not included those results in this 2019 White Book. The 2018 results can be seen in the 2018 Resource Program, at http://www.bpa.gov/goto/ResourceProgram. Once published, the 2020 Resource Program will be available in the same location.
1/ Operating Year (OY) is the time frame August 1 through July 31. For example, OY 2020 is August 1, 2019 through July 31, 2020.
_____________________________________________________________________________________________________________________
2019 Pacific Northwest Loads and Resources Study 3

The 2019 White Book is published in three documents: 1) this document, the 2019 Loads and Resources Summary (commonly referred to as the White Book), which provides Bonneville’s deterministic Federal system and PNW regional loads and resources used for long-term planning; 2) the 2019 Loads and Resources Technical Appendix, Volume 1, Energy Analysis, whichprovides the detailed components of the annual and monthly energy for the Federal system andPNW regional retail loads, contracts, and resources; and 3) the 2019 Loads and ResourcesTechnical Appendix, Volume 2, Capacity Analysis, that presents the detailed components of themonthly 120-Hour and 1-Hour peak capacity for Federal system and PNW regional retail loads,contracts, and resources. The Technical Appendices are only available electronically, atwww.bpa.gov/goto/whitebook
The total retail load, contract, and generation forecasts used in this study were updated as of December 1, 2019. The 2019 White Book supersedes the 2018 White Book.
Load Obligations
The load obligations for the Federal system and PNW region contain multiple components in this study, and load obligation forecasts are categorized as follows: 1) Total Retail Loads (TRL), defined as each individual utility’s retail electric power consumption on its system, including electrical system losses; and 2) contract obligations, which include reported PNW utility long-term contract sales within the PNW region (Intra-Regional Transfers (Out)) and outside the PNW region (Exports). Contract obligations also include Federal system power sales delivered to Federal agencies, public bodies and cooperative, and tribal utility preference customers as stated under section 5 of the Northwest Electric Power Planning and Conservation Act (NW Power Act), 16 U.S.C. 839 et seq., (December 5, 1980).
Forecasts of the regional TRL and Federal system load obligations are produced by Bonneville’s Agency Load Forecasting (ALF) system. ALF forecasts are completed for individual PNW entities under two approaches; 1) using statistical approaches that are based on time-series-based regressions that follow the fundamental assumption that historical retail electricity consumption patterns will continue into the future, 2) for a limited number of customers, statistically adjusted end-use models. The statistically adjusted end-use models include calculated indexes for heating equipment, cooling equipment, and other equipment. ALF forecasts also assume normal weather conditions and do not include any explicit adjustments for the impacts of climate change. Contract obligations not associated with Bonneville’s Regional Dialogue contracts follow individual contract terms through the life of the contract and are not assumed to be renewed. All Federal system load and contract obligations are assumed to be firm and served by Bonneville regardless of weather, water, or economic conditions.
_____________________________________________________________________________________________________________________
4 Bonniville Power Administration

Resource Types
Regional resources consist of “on the ground” generating facilities and contract purchases that are used to serve retail loads. PNW resources (include the Federal system) and are predominately hydro based. Therefore, generation levels can vary greatly both from month-to-month and from year-to-year. This analysis classifies resources as; 1) Hydro resources, which include regulated, independent, and small hydro projects; 2) Non-hydro Renewable resources, which include wind, solar, and other projects; 3) Thermal resources, which include nuclear, coal, natural gas, petroleum, biofuel and cogeneration projects; and 4) Contract purchases, which include reported PNW utility long-term contract purchases from within the PNW region (Intra-Regional Transfers (In)) and from outside the PNW region (Imports). The generation forecasts for these resources are provided by Bonneville models or the project owners and are described below. The methodologies for calculating energy and capacity from these resources are consistent with previous White Books.
Hydro resources
Regulated Hydro: Regulated hydro projects mainly consist of PNW Columbia River Basinhydroelectric power projects for which the operation and generating capability ishydraulically coordinated to meet power and non-power requirements. Bonnevilleforecasts the coordinated energy and capacity production from these hydroelectric powerprojects using its Hydrosystem Simulator (HYDSIM) model. The HYDSIM model takesinto account individual project operating characteristics and conditions, to determineenergy production expected on a project-by-project basis. Generation forecasts for theseprojects incorporate the month-to-month power and non-power requirements under eachof the 80-historical water conditions of record, 1929 through 2008 water years. TheHYDSIM model is described further in the Hydro Resource Modeling, page 7.
Independent Hydro: Independent hydro projects include those hydro projects whosegeneration output typically varies by water condition but are not operated as part of thecoordinated Columbia River Basin system. Independent hydro generation forecasts varymonth-to-month for energy and capacity, and are developed and provided by individualproject owners/operators for the same 80-historical water conditions as the RegulatedHydro projects.
Small Hydro: Small hydro project generation forecasts are either provided by individual
project owners or are based on historical actual generation. These generation forecastscan vary month-to-month but are not assumed to vary by water condition.
_____________________________________________________________________________________________________________________
2019 Pacific Northwest Loads and Resources Study 5

Non-hydro renewable resources
Wind: Firm wind generation incorporates the statistical modeling of wind generation basedon historical weather data and actual generation from currently operating PNW windprojects. The operating year with the lowest total PNW wind generation is selected as thefirm wind year. The firm wind year generation performance determines each project’senergy forecast. The Federal system and PNW regional capacity analyses assume zerocapacity contribution from wind resources.
Solar: Solar projects are utility scale solar facilities that are metered and the generationis being sent to the grid, and does not include any behind the meter or net meteredresources.
Other: Other renewables include any other project identified as renewable, including
geothermal and biomass/biogas waste projects. Generation forecasts for these resourcesare based on energy and capacity forecasts submitted by individual project owners.
Thermal resources
Thermal resources include nuclear, coal, natural gas, petroleum, biofuel, and
cogeneration. Generation forecasts for these projects are based on energy and capacitycapabilities submitted by project owners. These forecasts typically vary month-to-month,and total plant generation is reduced in order to account for scheduled maintenance.Forecasts are adjusted to show actual operational capabilities and expectations, and notto reflect economic dispatch.
Contract purchases
Contract Purchases/Imports: Contract purchases include signed Federal systempurchases and regional contract purchases with power delivered to PNW entities, reportby utilities publically and in data submittals. These purchases are treated as resources inboth the Federal system and regional analyses. Purchases between entities within thePNW are called Intra-regional Transfers (In) and purchases from entities outside the PNWare called Imports. With the exception of contracts associated with the Treaty, all existingFederal system and regional contract purchases follow individual contract terms throughthe life of the contract and are not assumed to be renewed. Treaty power deliveries areassumed to be in place through the study period.
_____________________________________________________________________________________________________________________
6 Bonniville Power Administration

Adjustments to Resources
This White Book assumes that resource generation and contract purchases must be reliably delivered to load centers. To take this into account, this study makes adjustments to generation forecasts for: 1) Operating and Balancing Reserves, held to meet reliability standards; and 2) Transmission Losses, associated with power deliveries. These resource adjustments are reductions to both energy and capacity and are described below:
Operating and Balancing Reserves: Operating reserves consist of both spinning and non-spinning contingency reserves that respond to the unforeseen loss of a resource, whichare calculated by summing 3 percent of forecast load and 3 percent of forecast generation.Balancing reserves consist of regulating, load following, and imbalance reserves that arededicated to maintaining within-hour load and resource balance. The modeling ofreserves, including those for wind integration, is described in the Hydro ResourcesModeling section below. The reserve forecasts included in this 2019 White Book areconsistent with Bonneville’s BP-20 Final Rates Proposal.
Transmission Losses: During the transmission of power to load centers some of theelectrical energy is lost, usually in the form of heat, which is known as transmission losses.Transmission losses are calculated on a monthly basis, based on the sum of all generationand contract purchase forecasts. Transmission losses vary year-to-year and based onwater conditions. The transmission loss factor is 2.97 percent for energy and 3.38 percentfor peak deliveries. These loss factors are assumed to be the same for every month anddo not vary from year to year.
Hydro Resources Modeling
The HYDSIM model forecasts the energy production from the regulated hydroelectric power projects in the PNW. This includes the 14 coordinated hydro projects in the Federal system, the mid-Columbia hydro projects, and other major hydro projects in the PNW. Project level generation forecasts are produced for each of the 80-historical water conditions2 of record, for water years 1929 through 2008. Energy production is maximized by coordinating hydro operations while meeting power and non-power requirements. HYDSIM produces results for 14 periods; 10 complete months, plus two periods each for April and August. April and August are divided because natural streamflows and operations often change significantly during these months. Consequently, generation can differ significantly between the beginning and end of these months. For simplicity, the 14-period results are referred to as “monthly” in this report.
The HYDSIM studies encompass power and non-power operating requirements, including those non-power requirements described in applicable biological opinions issued by the National Oceanic and Atmospheric Administration (NOAA) Fisheries and the U.S. Fish and Wildlife Service (USFWS); relevant operations described in the Northwest Power and Conservation Council’s Fish and Wildlife Program published October 2014; and other mitigation measures such as those implemented under the 2019-2021 Spill Operation Agreement (December 2018). The HYDSIM studies incorporate spring and summer spill operations consistent with the 2019-2021 Spill Operation Agreement, which includes flexible spring spill to the 125% Total Dissolved Gas (TDG) cap, and summer spill cessation in August. At the time the White Book studies where completed, the CRSO was underway but a preferred alternative had not been finalized. Therefore this study
2 Bonneville is working on updating the modified flow data set, which will add 10 more water years to the historic
record. Once that is completed, Bonneville will incorporate the new 90 year modified flows historical record and review the critical water period based on that information.
_____________________________________________________________________________________________________________________
2019 Pacific Northwest Loads and Resources Study 7
does not necessarily include the CRSO Preferred Alternative measures. Each hydro regulation study specifies particular hydroelectric project operations for fish, such as seasonal flow objectives, minimum flow levels for fish, spill for juvenile fish passage, reservoir target elevations, drawdown limitations, and turbine operation requirements.
The Pacific Northwest Coordination Agreement (PNCA) coordinates the planning and operation of the members’ hydroelectric power projects in the PNW. PNCA project owners provide physical plant data as well as power and non-power constraints in an annual data submittal to the Northwest Power Pool. Bonneville incorporates this data into HYDSIM to simulate the coordinated operation of the PNW hydro system. This coordination agreement expires on September 15, 2024.
The construction of three large storage projects in Canada under the Treaty between the United States and Canada enhanced the volume of storage in the Columbia River Basin. These projects provide downstream power benefits by increasing the firm power generating capability of U.S. hydro projects. The Treaty calls for an Assured Operating Plan (AOP) to be completed six years prior to each operating year, and allows a Detailed Operating Plan (DOP) to be completed, if agreed upon, in the year prior to the operating year. The Canadian project operations simulated in HYDSIM are based on the best available information from the Treaty planning and coordination process. Canadian operations included in this 2019 White Book are based on the official 2020 AOP studies, with additional modifications that reflect updates expected in the official DOP studies.
Both the United States and Canada have the ability to terminate most of the provisions of the Treaty any time after September 16, 2024, with a minimum of 10 years’ notice. Neither Canada nor the United States have provided notice of termination; therefore, this study assumes the Treaty continues throughout the study period.
Bonneville has other operational agreements with Canada that are not part of the Treaty. One operational agreement is the Non-Treaty Storage Agreement (NTSA) that allows additional shaping of Columbia River flows for power and fish operations by utilizing storage not specified by the Treaty from Canadian reservoirs. The NTSA allows water to be released from Canadian project storage during the spring of dry years. The NTSA also allows water to be stored in the spring during years when the spring flow targets from the 2008 NOAA BiOp would be met with a subsequent release of water in the summer. These operations have been included in this study based on the NTSA signed with B.C. Hydro in April 2012.
Balancing reserves, both incremental and decremental, reduce the ability to shape Federal system generation. Incremental reserves are modeled by reducing the generation capability of several projects. In this study, the impacts of incremental reserves are shown as a reduction in the capacity analyses and are categorized as operating and balancing reserves. Decremental reserves are not specifically reported in this study; however, they are incorporated by increasing the minimum flow of modeled projects in Bonneville’s Hourly Operating and Scheduling Simulator (HOSS) discussed in the Hydro Capacity Modeling section of this study.
_____________________________________________________________________________________________________________________
8 Bonniville Power Administration
Critical Water Planning: To ensure sufficient generation to meet load, Bonneville bases its resource planning on critical water conditions. Critical water conditions are defined as when the PNW hydro system would produce the least amount of power while taking into account the historical streamflow record, power and non-power operating constraints, the planned operation of non-hydro resources, and system load requirements. For operational purposes, Bonneville considers critical water conditions to be the eight month critical period of September 1936 through April 1937. However, for planning purposes the “critical period” is currently represented by the historical streamflows from August 1936 through July 1937 ( referred to as 1937-critical water conditions). Bonneville periodically reviews the critical period, and could change or adjust that period in the future if appropriate. The hydro generation forecasts under 1937-critical water conditions determine the critical period firm energy for the regulated and independent hydro projects.
Variability of Hydro Generation: The generating capability of Federal system and regional hydro projects depends on the amount of water flowing through the facilities, the physical capacity of the facilities, any flow or operating requirements pursuant to biological opinions, and other operating limitations. Water conditions cause hydro generation to vary greatly year to year depending on factors such as precipitation, snowpack, and temperature. Project-level generation forecasts are produced using HYDSIM for each of the 80 historical water year conditions of record, which are based on the period from 1929 through 2008. This study uses three streamflow scenarios to demonstrate the magnitude of hydro generation variability:
Low water flows: 1937-critical water conditions represent the firm energy and
capacity capability of the hydro system.
Average water flows: 1958-water conditions represent the average energy andcapacity capability of the hydro system.
High water flows: 1974-water conditions represent high (better than average) energyand capacity capability of the hydro system.
Hydro Capacity Modeling: BPA uses the HOSS model to forecast usable hydro capacity for long-term planning purposes. The HOSS model is used to simulate the relationship of hydro energy to hydro peaking capability for Federal system regulated hydro resources. HOSS incorporates the monthly 80 historical water year reservoir storage and flows from HYDSIM. For each month, HOSS forecasts hourly Federal system hydro generation by maximizing heavy load hour generation while meeting non-power requirements. The forecasts take into account scheduled hydro maintenance as well as operating and balancing reserves. The hydro peaking capability from HOSS should not be interpreted as an indication of the Federal hydro system’s ability to react to system distress or extreme conditions.
The 120-Hour and 1-Hour capacity forecasts for hydro resources are created by evaluating hourly generation from the HOSS model, over a specific period of time. These capacity metrics are defined as follows:
120-Hour Capacity (or Super peak capability): the average generation forecasts from
the 6 highest heavy load hours per day, 5 days per week, for 4 weeks per month (6 x 5 x 4 = 120 hours); and
1-Hour Capacity: the highest single 1-Hour generation per month.
_____________________________________________________________________________________________________________________
2019 Pacific Northwest Loads and Resources Study 9

The 1-Hour hydro capacity forecasts do not present a sustainable generation, but a single hour peak, which does not consider the ability of the hydro system to sustain generation levels from hour-to-hour and/or day-to-day. The hydro system is unable to sustain full hydro generation at the 1-Hour capacity because there is often more hydro generating capability than available water supply. For this reason, the 120-Hour capacity analysis presented in this study better reflects the ability of the hydro system to sustain a generating peak energy level to meet load obligations throughout each month. The 1-Hour capacity forecasts are included in the Loads and Resources Technical Appendix, Volume 2: Capacity Analysis for informational purposes only. The 120-Hour capacity presented in this analysis can be expressed as either capacity in megawatts (MW) or energy over super peak load hours in average megawatts.
Notable Updates
The 2019 White Book includes updated forecasts of Federal system power sales contract (PSC) obligations, PNW regional Total Retail Loads, contract purchases, and generation as of December 1, 2019, including:
Change in regulated hydro spill assumptions from the 2019-2021 Spill Operation
Agreement (December 2018), for all years of the study.
Updated retirement dates associated with announced Thermal (coal) generationretirements.
Updated spill operations to incorporate spring and summer spill operations consistent withthe 2019-2021 Spill Operation Agreement, which includes flexible spring spill to the 125%Total Dissolved Gas (TDG) cap, and summer spill cessation in August
This study does not necessarily include the CRSO Preferred Alternative measures.
Sources of Uncertainty
The forecasts presented in this document represent the best information currently available under the defined metrics for loads and resources. However, almost all forecasts are affected by uncertainty in economic conditions, weather, environmental and governmental policies, and other factors that could significantly affect the magnitude, duration and timing of projected surpluses and/or deficits. Some of these uncertainties include:
Changes to hydro system operations in response to Endangered Species Actrequirements or other environmental considerations;
Changes to hydro system operations in response to CRSO EIS;
Natural variations in weather affecting electrical power demand and streamflow runoff thatinfluence hydroelectric power generation;
Potential increases or decreases in retail and industrial loads due to changes in local,regional, and/or national economic conditions;
Potential new large individual retail loads and/or other changes to major industrialoperations;
Potential service to new loads such as new public utilities or the Department of Energy’s
Richland vitrification plant operations;
Future policy requirements at local, state, and national levels regarding the amount andtype of renewable resources, conservation standards, electric vehicle saturation, and/orcarbon emissions;
Fuel cost and availability, which may be affected by environmental factors or competinguses for industry, transportation, and import/export markets;
_____________________________________________________________________________________________________________________
10 Bonniville Power Administration

Changes to operating limits on existing and future thermal resources resulting fromenvironmental or climate-change objectives;
Changes to retirement dates associated with operating resources;
Failures of existing or contracted generating resources to operate at anticipated timesand/or output levels;
Changes to Treaty obligations and/or operations;
PNW entities’ ability to purchase power from new and existing uncommitted regionalresources to serve retail load;
PNW entities’ ability to purchase and transmit power from extra-regional import/exportmarkets; and
Future climate change impacts to retail loads, streamflows, and resources.
The potential impacts of these and other sources of uncertainty are not quantified in this report.
Electrification Uncertainty
While specific forecasts of electrification are not included in this White Book, growing interest foreshadows a potential for significant load growth in the future. Many studies on the electrification of the transportation sector alone, point to a potential 60% increase in electrical load by 2050, and that by 2035 nearly 35% of all new vehicles produced will be electric. Northwest Power and Conservation Council 7th Power Plan studies assume 35% of new vehicles to be EV by 2035 and all new vehicles to be EV by 2050. When the EV penetration is combined with fuel switching in the residential and commercial sectors, the 7th Power Plan studies result in a projected 38% load growth in 2030 and a 44% regional load growth in 2035. Studies3 on electrifying all of British Columbia’s vehicles predict a need for 60% more electric generation capability than existed in 2015. Additionally, studies produced by NREL predict a doubling of the 2017 US electricity usage by 2050, due to electrification efforts. Given the electrification efforts underway across the region, and a continued interest to reduce carbon emitting sources, electrification seems to be a likely process. Forecasting how, and when electrification occurs holds a lot of uncertainty at this time. BPA will continue to monitor electrification and future studies will incorporate continued development and knowledge gained relating to electrification and its impact to loads.
3 Electrification of road transportation with utility controlled charging: A case study for British Columbia with a 93% renewable electricity target, Science Direct November 2019
_____________________________________________________________________________________________________________________
2019 Pacific Northwest Loads and Resources Study 11

THIS PAGE INTENTIONALLY LEFT BLANK
_____________________________________________________________________________________________________________________
12 Bonniville Power Administration

Section 2: Federal System Analysis
The Federal System Analysis provides a deterministic forecast of Federal system loads and resources over a 10-year period from OY 2021 through 2030. This analysis incorporates forecasts of the Federal system’s firm requirements power sales contract (PSC) obligations, contract sales and purchases, and resource generation. This section presents firm Federal system load and resource forecasts for energy and 120-Hour capacity. The detailed components of the Federal system study are available electronically in the 2019 Loads and Resources Technical Appendix, Volume 1, Energy Analysis, which provides annual and monthly energy in aMW; and the 2019 Loads and Resources Technical Appendix, Volume 2, Capacity Analysis, which provides monthly 120-Hour and 1-Hour peak capacity.
Load Obligations
Bonneville’s ALF system is used to forecast Federal system load obligations, as described on page 4. The types of Federal system load obligation forecasts include: 1) Federal reserve power obligations to the U.S. Bureau of Reclamation (USBR); 2) Bonneville’s Regional Dialogue PSC obligations to public, cooperative, and tribal utilities, and Federal agency customers; 3) contract obligations to investor-owned utilities (IOUs); 4) contract obligations to DSI customers; and 5) other Bonneville contract obligations, which include contract sales to entities within the PNWregion (Intra-Regional Transfers (Out) and to those outside the PNW region (Exports). Theseload obligations are all considered firm power deliveries and are assumed to be served by theFederal system regardless of weather, water, or economic conditions. Bonneville’s forecasts ofthese obligations are as follows:
USBR obligations: USBR is obligated by Federal statutes to provide reserve power to several irrigation facilities and districts associated with USBR projects. USBR project authorizations include congressional authorization for irrigation districts to receive reserve power from specific FCRPS projects. Bonneville markets the remaining power from USBR projects, in the PNW.
Regional Dialogue CHWM PSC obligations to Public & Federal agency customers: In December 2008, Bonneville executed Regional Dialogue Contract High Water Mark (RD CHWM) PSCs with public, cooperative, and tribal utilities, and Federal agency customers; Bonneville is obligated to provide firm power deliveries from October 1, 2011, through September 30, 2028. Three types of products were offered to customers: Load Following, Slice/Block, and Block. Of the 135 customers who have signed Regional Dialogue Contracts; 119 are currently Load Following, 13 are Slice/Block, and three are Block customers.
Under the RD contracts, customers must make periodic elections of how to serve their Above Rate Period High Water Mark (A-RHWM) load by 1) adding new non-Federal resources; 2) acquiring power from sources other than Bonneville; and/or 3) requesting Bonneville to supplyadditional power. The current customer elections have been set through fiscal year (FY) 2024,so this study assumes that the current elections continue through the study period. Based on thisassumption, Federal system RD CHWM PSC obligation forecasts include elected and forecastedA-RHWM load for the study period. Table 2-1, page 12, presents the A-RHWM load included inBonneville’s obligations by FY, which are consistent with the BP-20 Final Rate Proposal.
_____________________________________________________________________________________________________________________
2019 Pacific Northwest Loads and Resources Study 13
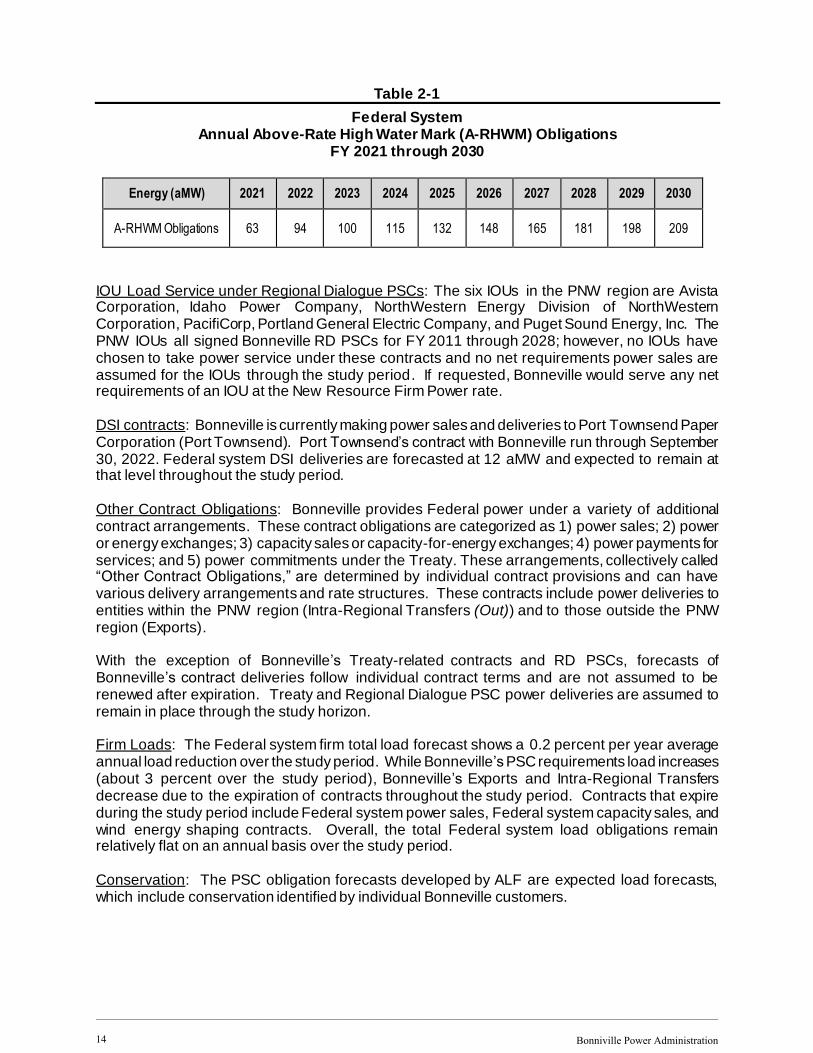
Table 2-1
Federal System Annual Above-Rate High Water Mark (A-RHWM) Obligations
FY 2021 through 2030
Energy (aMW) 2021 2022 2023 2024 2025 2026 2027 2028 2029 2030
A-RHWM Obligations 63 94 100 115 132 148 165 181 198 209
IOU Load Service under Regional Dialogue PSCs: The six IOUs in the PNW region are Avista Corporation, Idaho Power Company, NorthWestern Energy Division of NorthWestern Corporation, PacifiCorp, Portland General Electric Company, and Puget Sound Energy, Inc. The PNW IOUs all signed Bonneville RD PSCs for FY 2011 through 2028; however, no IOUs have chosen to take power service under these contracts and no net requirements power sales are assumed for the IOUs through the study period. If requested, Bonneville would serve any net requirements of an IOU at the New Resource Firm Power rate.
DSI contracts: Bonneville is currently making power sales and deliveries to Port Townsend Paper Corporation (Port Townsend). Port Townsend’s contract with Bonneville run through September 30, 2022. Federal system DSI deliveries are forecasted at 12 aMW and expected to remain at that level throughout the study period.
Other Contract Obligations: Bonneville provides Federal power under a variety of additional contract arrangements. These contract obligations are categorized as 1) power sales; 2) power or energy exchanges; 3) capacity sales or capacity-for-energy exchanges; 4) power payments for services; and 5) power commitments under the Treaty. These arrangements, collectively called “Other Contract Obligations,” are determined by individual contract provisions and can have various delivery arrangements and rate structures. These contracts include power deliveries to entities within the PNW region (Intra-Regional Transfers (Out)) and to those outside the PNW region (Exports).
With the exception of Bonneville’s Treaty-related contracts and RD PSCs, forecasts of Bonneville’s contract deliveries follow individual contract terms and are not assumed to be renewed after expiration. Treaty and Regional Dialogue PSC power deliveries are assumed to remain in place through the study horizon.
Firm Loads: The Federal system firm total load forecast shows a 0.2 percent per year average annual load reduction over the study period. While Bonneville’s PSC requirements load increases (about 3 percent over the study period), Bonneville’s Exports and Intra-Regional Transfers decrease due to the expiration of contracts throughout the study period. Contracts that expire during the study period include Federal system power sales, Federal system capacity sales, and wind energy shaping contracts. Overall, the total Federal system load obligations remain relatively flat on an annual basis over the study period.
Conservation: The PSC obligation forecasts developed by ALF are expected load forecasts, which include conservation identified by individual Bonneville customers.
_____________________________________________________________________________________________________________________
14 Bonniville Power Administration

Bonneville loads on a monthly basis can vary greatly throughout the year. At a high level, Bonneville forecasts represent higher loads in the winter (November through February) due to lower temperatures that increase heating loads, and lower loads during the spring, early summer and early fall when temperatures are mild. July and August loads tend to be slightly higher than the rest of the summer due to increased PNW air conditioning loads. Table 2-2, below, illustrates the monthly shape of the forecasted Federal system firm load obligations for OY 2022. Monthly energy and 120-Hour capacity are projected to maintain a similar shape over the study period.
Table 2-2
Federal System Monthly Energy and 120-Hour Capacity Load Obligations
OY 2022
Resources
In the PNW, Bonneville is a Federal power marketing agency charged with marketing and transmitting power from Federal hydroelectric projects and acquired resources to serve the firm electrical load needs of its customers. Bonneville does not own generating resources, rather, Bonneville markets power from Federal resources and certain non-Federal generating resources whose output Bonneville has acquired under contracts. These resources and contract purchases are collectively called “Federal system resources” in this study. Federal system resources are currently comprised of: 1) Hydro resources, which include regulated, independent, and small hydro projects; 2) Non-hydro renewable resources, which include wind, solar, and other projects; 3) Thermal resources, which includes nuclear (Columbia Generating Station); and 4) Contractpurchases, which include contract purchases from entities within the PNW region (Intra-RegionalTransfers (In)) and from those outside the PNW region (Imports), including Non-Federal CanadianEntitlement Return power and transmission loss returns under Slice contracts.
_____________________________________________________________________________________________________________________
2019 Pacific Northwest Loads and Resources Study 15

Federal System Resource Types: Table 2-3, below, summarizes Bonneville’s resources and contract purchases available to meet the Federal system load obligations. For OY 2022, Federal system resources are forecast to produce 7,673 annual aMW of generation under 1937-critical water conditions. Federal system energy resources are comprised of approximately 83 percent hydro, 15 percent nuclear (Columbia Generating Station), 2 percent contract purchases, less than 1 percent wind.
Table 2-3
Federal System Generation Forecast by Resource Type
OY 2022 1937-Critical Water Conditions
*Federal resource forecasts are before adjustments for reserves and transmission losses.
Annual Energy (aMW) January 120-Hour Capacity (MW)
Hydro 6,344 10,110
Nuclear 1,116 1,169
Wind 48 0
Other Renewables 0 0
Contract Purchases 165 286
83%
87%
15% 10%
1% 0%0 02% 3%
0
2,000
4,000
6,000
8,000
10,000
12,000
Fed
era
l Sys
tem
Re
sou
rce
s aM
W
_____________________________________________________________________________________________________________________
16 Bonniville Power Administration
The composition of the Federal system resources are detailed below.
Federal System Hydro Resources: Table 2-4, page 16, shows the Federal system hydroresources from which Bonneville markets firm and non-firm power. Additionally, Table 2-4 shows the variability of individual Federal system hydro project generation for the threewater conditions that represent critical, average and high water conditions. The variabilityof hydro generation is discussed above starting on page 8.
Federal System Non-Hydro Resources: Federal system non-hydro resources are
generating resources whose output have been purchased by Bonneville. Table 2-5, page17, shows these generating resources, which include: 1) Columbia Generating Station;2) wind projects (non-hydro renewable); and 3) solar projects (non-hydro renewable).Forecasts for these resources are generally consistent from year to year, but may changeannually based on scheduling for annual maintenance, refueling, and capitalimprovements.
Federal System Contract Purchases: Bonneville purchases or receives power under avariety of contract arrangements from entities within the PNW region (Intra-RegionalTransfers (In)) and from outside the PNW region (Imports), to meet Federal system loadobligations. These contract purchases, presented in Table 2-5, page 17, are made upof: 1) power purchases, 2) power or energy exchange purchases, 3) power assigned toBonneville under Treaty-related agreements, and 4) transmission loss returns under Slicecontracts. Bonneville’s contract purchases are considered firm resources that aredelivered to the Federal system regardless of weather, water, or economic conditions.Transmission loss returns capture the return of Slice transmission losses to the Federalsystem as specified in the Slice contracts, and these returns are also treated as Federalsystem resources. With the exception of deliveries from Treaty-related and Slicecontracts, each contract purchase follows specific delivery terms and expiration dates andis not assumed to be renewed. Treaty-related and Slice contracts are assumed to remainin place through the study horizon.
_____________________________________________________________________________________________________________________
2019 Pacific Northwest Loads and Resources Study 17
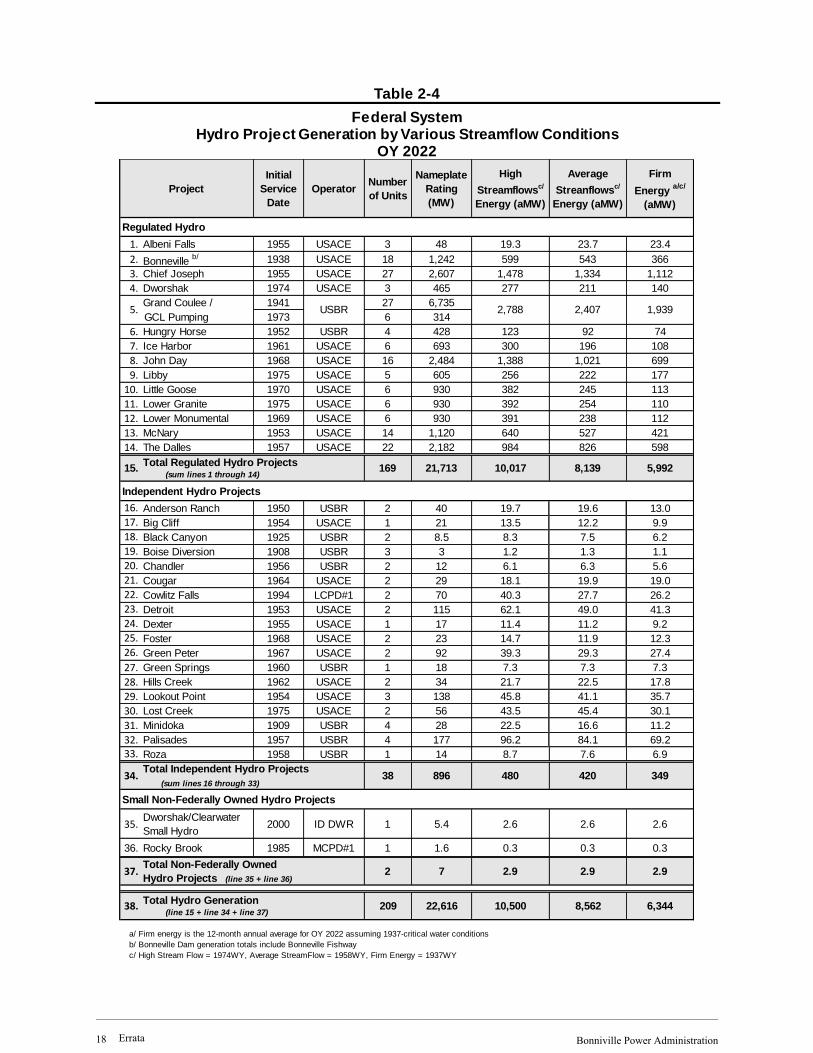
Table 2-4
Federal System Hydro Project Generation by Various Streamflow Conditions
OY 2022
Initial
Service
Date
OperatorNumber
of Units
Nameplate
Rating
(MW)
High
Streamflowsc/
Energy (aMW)
Average
Streanflowsc/
Energy (aMW)
Firm
Energy a/c/
(aMW)
1. Albeni Falls 1955 USACE 3 48 19.3 23.7 23.4
2. Bonneville b/ 1938 USACE 18 1,242 599 543 366
3. Chief Joseph 1955 USACE 27 2,607 1,478 1,334 1,112
4. Dworshak 1974 USACE 3 465 277 211 140
Grand Coulee / 1941 27 6,735
GCL Pumping 1973 6 314
6. Hungry Horse 1952 USBR 4 428 123 92 74
7. Ice Harbor 1961 USACE 6 693 300 196 108
8. John Day 1968 USACE 16 2,484 1,388 1,021 699
9. Libby 1975 USACE 5 605 256 222 177
10. Little Goose 1970 USACE 6 930 382 245 113
11. Lower Granite 1975 USACE 6 930 392 254 110
12. Lower Monumental 1969 USACE 6 930 391 238 112
13. McNary 1953 USACE 14 1,120 640 527 421
14. The Dalles 1957 USACE 22 2,182 984 826 598
15. 169 21,713 10,017 8,139 5,992
16. Anderson Ranch 1950 USBR 2 40 19.7 19.6 13.0
17. Big Cliff 1954 USACE 1 21 13.5 12.2 9.9
18. Black Canyon 1925 USBR 2 8.5 8.3 7.5 6.2
19. Boise Diversion 1908 USBR 3 3 1.2 1.3 1.1
20. Chandler 1956 USBR 2 12 6.1 6.3 5.6
21. Cougar 1964 USACE 2 29 18.1 19.9 19.0
22. Cowlitz Falls 1994 LCPD#1 2 70 40.3 27.7 26.2
23. Detroit 1953 USACE 2 115 62.1 49.0 41.3
24. Dexter 1955 USACE 1 17 11.4 11.2 9.2
25. Foster 1968 USACE 2 23 14.7 11.9 12.3
26. Green Peter 1967 USACE 2 92 39.3 29.3 27.4
27. Green Springs 1960 USBR 1 18 7.3 7.3 7.3
28. Hills Creek 1962 USACE 2 34 21.7 22.5 17.8
29. Lookout Point 1954 USACE 3 138 45.8 41.1 35.7
30. Lost Creek 1975 USACE 2 56 43.5 45.4 30.1
31. Minidoka 1909 USBR 4 28 22.5 16.6 11.2
32. Palisades 1957 USBR 4 177 96.2 84.1 69.2
33. Roza 1958 USBR 1 14 8.7 7.6 6.9
34. 38 896 480 420 349
35.Dworshak/Clearwater
Small Hydro2000 ID DWR 1 5.4 2.6 2.6 2.6
36. Rocky Brook 1985 MCPD#1 1 1.6 0.3 0.3 0.3
37. 2 7 2.9 2.9 2.9
38. 209 22,616 10,500 8,562 6,344
a/ Firm energy is the 12-month annual average for OY 2022 assuming 1937-critical water conditions
b/ Bonneville Dam generation totals include Bonneville Fishway
c/ High Stream Flow = 1974WY, Average StreamFlow = 1958WY, Firm Energy = 1937WY
Total Hydro Generation(line 15 + line 34 + line 37)
5. USBR 2,788
Independent Hydro Projects
Total Independent Hydro Projects
(sum lines 16 through 33)
Small Non-Federally Owned Hydro Projects
Total Non-Federally Owned
Hydro Projects (line 35 + line 36)
2,407 1,939
Total Regulated Hydro Projects(sum lines 1 through 14)
Regulated Hydro
Project
_____________________________________________________________________________________________________________________
18 Bonniville Power Administration Errata

Table 2-5
Federal System Non-Hydro Project Generation and Contract Purchases
OY 2022
Non-Hydro Resources
1. Columbia Generating Station 1984 Nuclear ENW 1,169 1,116
2. Condon Wind Project 2002 Wind Condon Wind Project, LLC 0 11.7
3. Foote Creek 1 1999 Wind Foote Creek 1, LLC 0 0.0
4. Foote Creek 4 2000 Wind Foote Creek 4, LLC 0 0.0
5. Stateline Wind Project 2001 Wind PPM, FLP 0 21.2
6. Klondike Phase I 2001 Wind NW Wind Power 0 3.7
7. Klondike Phase III 2007 Wind NW Wind Power 0 11.8
8. Fourmile Hill Geothermal b/
Not in Service Geo. Calpine 0 0
9. Total Federal System Non-Hydro Resources(sum lines 1 through 10)
1,169 1,164
Contract Purchases
237 135
1 1
0 0
0 0
48 29
15. Total Federal System Contract Purchases (sum lines 12 through 16)
286 165
1,455 1,329
a/ This is the maximum generation for January 2022b/ Fourmile Hill is not assumed to be in operation within the study period
16. Total Federal System Non-Hydro Resources and Contract Purchases
(line 11 + line 17)
Project
Initial
Service
Date
Resource
TypeOperator
Capacity a/
(Peak MW)
Firm Energy
(aMW)
10. Canadian Entitlement for Canada (non-Federal)
11. Canadian Imports
12. Pacific Southwest Imports
13. Intra-Regional Transfers In (Pacific Northwest Purchases)
14. Slice Transmission Loss Return
_____________________________________________________________________________________________________________________
2019 Pacific Northwest Loads and Resources Study 19

Federal System Hydro Generation Variability: The generating capability of Federal system hydroelectric projects depends on the amount of water flowing through the facilities, the physical capacity of the facilities, flow requirements pursuant to biological opinions, and other operating limitations. Table 2-6, below, shows the annual variability of hydro generation under three streamflow conditions: 1) 1937-critical water conditions, representing the firm energy capability of the hydro system; 2) 1958-water conditions, representing the average energy capability of the hydro system; and 3) 1974-water conditions, representing the high energy capability of the hydro system.
Table 2-6
Federal System Variability of Annual Hydro Generation
OY 2021 through 2030 Under Different Water Conditions
In OY 2022, annual Federal system hydro energy generation is forecasted to be 6,410 aMW under 1937-critical water conditions. However, under the high streamflow condition (represented by 1974-water conditions), these same Federal system hydro resources would generate 10,614 aMW. Table 2-6, above, shows the annual variability of Federal system hydro generation, and Table 2-7, on page 19, shows the monthly variability of the Federal system hydro generation for OY 2022, under the same three streamflow scenarios. High generation levels in the December through mid-April period is largely due to drafting reservoirs for power production and flood control, which can vary widely due to rainfall and snowpack levels in the Columbia River Basin. Power production from late-April through July is variable due to the timing and amount of the Columbia River Basin snowmelt runoff. Power production decreases through the end of the summer and early fall as streamflows are reduced due to depleted snowpack and lower precipitation levels. Annual water volume variability does not have a substantial impact on generation from the Federal system hydro resources from August through November. Hydro generation can vary by more than 8,500 aMW in a single month depending on project operations and the availability of water.
_____________________________________________________________________________________________________________________
20 Bonniville Power Administration

Table 2-7
Federal System Variability of Monthly Hydro Generation
OY 2022 Under Different Water Conditions
Total Federal System Resources: Table 2-8, below, illustrates the monthly shape of the forecasted total Federal system generation for energy and 120-Hour capacity for OY 2022, under 1937-critical water conditions. This includes generation from all Federal system hydro and non-hydro resources and Federal system contract purchases. The Federal system maintains similar monthly shapes over the study period, with the highest generation forecasted in late spring/early summer and early winter periods.
Table 2-8
Federal System Monthly Generation
OY2022 Energy and 120-Hour Capacity Under 1937-Critical Water Conditions
_____________________________________________________________________________________________________________________
2019 Pacific Northwest Loads and Resources Study 21

Key Results
Annual Energy: Table 2-9, below, shows that the Federal system is forecasted to have annual energy deficits over the rest of the study period. The individual components of the Federal system annual energy loads and resources are shown in Exhibit 4-1, page 37, for OY 2021 through 2030. The Federal system monthly energy loads and resources are shown in Exhibit 4-2, page 40, for OY 2021 through 2030. The details of each component are presented in the 2019 Loads and Resources Study Technical Appendix, Volume 1: Energy Analysis.
Table 2-9
Federal System Annual Energy Surplus/Deficit
OY 2021 through 2030 1937-Critical Water Conditions
Energy (aMW) 2021 2022 2023 2024 2025 2026 2027 2028 2029 2030
Surplus/Deficit -194 -270 -354 -236 -367 -148 -207 -118 -247 -148
Table 2-10, below, compares the 2019 White Book Federal system annual firm energy surplus/deficit results to those from the 2018 White Book. The 2019 White Book shows a deficit throughout the studying period, with larger deficit during the middle of the study period. These results reflect changes in both load obligations and Federal system generation.
Table 2-10
Federal System Annual Energy Surplus/Deficit Comparison
OY 2021 through 2030 1937-Critical Water Conditions
Energy (aMW) 2021 2022 2023 2024 2025 2026 2027 2028 2029 2030
2019 White Book -194 -270 -354 -236 -367 -148 -207 -118 -247 -148
2018 White Book -123 -256 -414 -300 -438 -224 -275 -190 -308 n/a
Difference (2019 WBK – 2018 WBK)
-71 -15 60 64 71 76 68 72 62 n/a
_____________________________________________________________________________________________________________________
22 Bonniville Power Administration

120-Hour Capacity: Table 2-11, next, shows that the Federal system January 120-Hourcapacity is deficit under 1937-critical water conditions throughout the study period. The detailedcomponents of the Federal system January 120-Hour capacity loads and resources for OY 2021through 2030 are shown in Exhibit 4-3, page 43. The Federal system monthly120-Hour capacity loads and resources are shown in Exhibit 4-4, page 46, for OY 2022. Thedetails of each component are presented in the 2019 Loads and Resources Study TechnicalAppendix, Volume 2: Capacity Analysis.
Table 2-11
Federal System January 120-Hour Capacity Surplus/Deficit
OY 2021 through 2030 1937-Critical Water Conditions
January 120-Hour Capacity
(MW) 2021 2022 2023 2024 2025 2026 2027 2028 2029 2030
Surplus/Deficit -1061 -1171 -1226 -1207 -1170 -950 -1083 -1085 -1056 -1047
Table 2-12, below, compares the 2019 White Book January firm 120-Hour capacity surplus/deficit results to those from the 2018 White Book. This study shows a decrease in January 120-Hour capacity deficits starting from 2022, due to a combination of decreased load obligations and increased January Federal system capabilities.
Table 2-12
Federal System January 120-Hour Capacity Surplus/Deficit Comparison
OY 2021 through 2030 1937-Critical Water Conditions
January 120-Hour Capacity
(MW) 2021 2022 2023 2024 2025 2026 2027 2028 2029 2030
2019 White Book -1061 -1171 -1226 -1207 -1170 -950 -1083 -1085 -1056 -1047
2018 White Book -994 -1312 -1406 -1367 -1371 -1209 -1289 -1340 -1258 n/a
Difference (2019 WBK – 2018WBK)
-67 141 180 160 202 259 206 255 202 n/a
_____________________________________________________________________________________________________________________
2019 Pacific Northwest Loads and Resources Study 23

Federal System Annual Surplus/Deficits: Table 2-13, below, graphically presents the annual firm energy and January 120-Hour capacity surplus/deficits. Over the study period, the Federal system is forecasted to have annual firm energy deficits as high as -367 aMW over the study period. The January firm 120-Hour capacity forecasts show the Federal system is deficit throughout the study period, ranging from -950 MW in OY 2026, to as high as -1,226 in OY 2023, and ending the study period -1,047 MW in OY 2030. Variations in the annual energy deficits between the odd and even OYs are due to the biennial Columbia Generation Station (CGS) maintenance schedule.4
Table 2-13
Federal System Annual Energy and January 120-Hour Capacity Surplus/Deficit
OY 2021 through 2030 1937-Critical Water Conditions
Federal System Monthly Surplus/Deficit: Table 2-14, page 23, graphically presents the Federal system monthly firm energy and 120-Hour capacity surpluses and deficits for OY 2022. Forecasts for energy and 120-Hour capacity maintain similar monthly shapes over the study period. This shows that for each month the Federal system energy and 120-Hour capacity surplus/deficit position changes across the year, with January, February, and the second half of April show the largest monthly deficits and the spring (May through June) showing the largest surpluses.
4 During even calendar years, CGS does not have scheduled maintenance and is forecast to produce 1,116 aMW annually. In odd calendar years, CGS has scheduled maintenance in May and June, and is forecasted to produce 994 aMW annually.
_____________________________________________________________________________________________________________________
24 Bonniville Power Administration

Table 2-14
Federal System Monthly Energy and 120-Hour Capacity Surplus/Deficit
OY 2022 1937-Critical Water Conditions
Conclusion
Under 1937 critical water conditions the Federal system shows annual firm energy deficits over the study period. These annual energy deficits range from -194 aMW in OY 2021 to as high as -367 aMW in OY 2025, followed by an adjustment which starts in OY2026 as contract obligations expire. Under critical water conditions the Federal system generally shows monthly energy deficits across the winter and early spring, with surpluses during the spring runoff in May and June.
The Federal system capacity analysis shows January 120-Hour capacity deficits throughout the study horizon. However, on a monthly basis, the study shows both 120-Hour capacity surpluses and deficits over the year. Like the Federal system energy analysis, the 120-Hour capacity analysis has large deficits during the winter and surpluses during the spring runoff (May and June), under 1937-water conditions.
As water conditions improve, the Federal system surplus/deficit forecasts can vary greatly. For example, the annual energy surpluses can increase by more than 3,100 aMW under better water conditions, while the monthly surplus/deficit position can vary by almost 7,000 aMW (January). Similarly, Federal system 120-Hour capacity surplus/deficits for OY 2021 can vary by almost 5,000 MW in January, and by almost 6,000 MW during the second half of April, depending on water conditions.
Federal system monthly energy deficits tend to be greater than the 120-Hour capacity deficits under 1937-critical water conditions. This result indicates that the Federal system is more energy constrained than capacity constrained across the study period. The range of Federal system monthly surpluses and deficits forecasts under all 80-historical water conditions is presented in Exhibit 4-5, page 49.
_____________________________________________________________________________________________________________________
2019 Pacific Northwest Loads and Resources Study 25

THIS PAGE INTENTIONALLY LEFT BLANK
_____________________________________________________________________________________________________________________
26 Bonniville Power Administration
Section 3: Pacific Northwest Regional Analysis
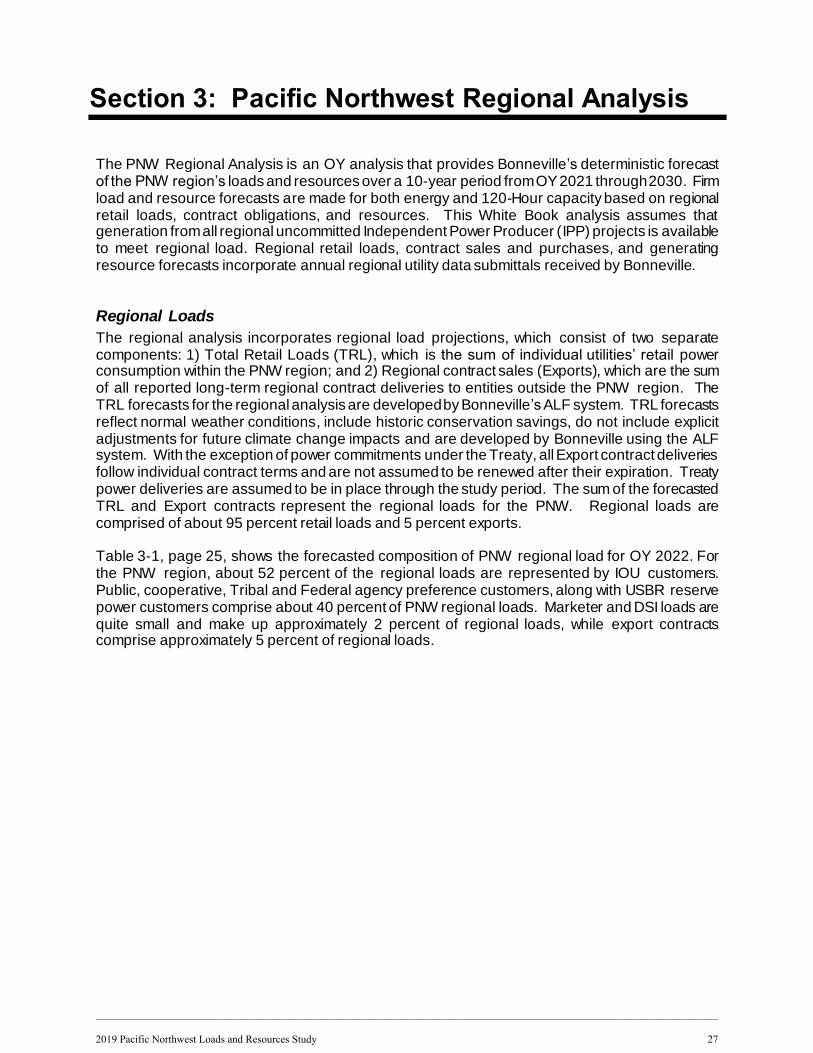
The PNW Regional Analysis is an OY analysis that provides Bonneville’s deterministic forecast of the PNW region’s loads and resources over a 10-year period from OY 2021 through 2030. Firm load and resource forecasts are made for both energy and 120-Hour capacity based on regional retail loads, contract obligations, and resources. This White Book analysis assumes that generation from all regional uncommitted Independent Power Producer (IPP) projects is available to meet regional load. Regional retail loads, contract sales and purchases, and generating resource forecasts incorporate annual regional utility data submittals received by Bonneville.
Regional Loads
The regional analysis incorporates regional load projections, which consist of two separate components: 1) Total Retail Loads (TRL), which is the sum of individual utilities’ retail power consumption within the PNW region; and 2) Regional contract sales (Exports), which are the sum of all reported long-term regional contract deliveries to entities outside the PNW region. The TRL forecasts for the regional analysis are developed by Bonneville’s ALF system. TRL forecasts reflect normal weather conditions, include historic conservation savings, do not include explicit adjustments for future climate change impacts and are developed by Bonneville using the ALF system. With the exception of power commitments under the Treaty, all Export contract deliveries follow individual contract terms and are not assumed to be renewed after their expiration. Treaty power deliveries are assumed to be in place through the study period. The sum of the forecasted TRL and Export contracts represent the regional loads for the PNW. Regional loads are comprised of about 95 percent retail loads and 5 percent exports.
Table 3-1, page 25, shows the forecasted composition of PNW regional load for OY 2022. For the PNW region, about 52 percent of the regional loads are represented by IOU customers. Public, cooperative, Tribal and Federal agency preference customers, along with USBR reserve power customers comprise about 40 percent of PNW regional loads. Marketer and DSI loads are quite small and make up approximately 2 percent of regional loads, while export contracts comprise approximately 5 percent of regional loads.
_____________________________________________________________________________________________________________________
2019 Pacific Northwest Loads and Resources Study 27

Table 3-1
PNW Region Firm Regional Loads by Customer Class
OY 2022
Customer Class Energy
(aMW)
Percent of
Energy
January
120-Hour
Capacity (MW)
Percent of
Capacity
Investor-Owned Utility 12,790 52% 18,905 51%
Public Utility District 4,720 19% 7,734 21%
Municipality 2,622 11% 4,353 12%
Cooperative 2,384 10% 3,711 10%
Federal Agency 153 1% 252 1%
USBR 178 1% 284 1%
Direct-Service Industry1 401 2% 413 1%
Marketer 3 0% 3 0%
Total Retail Load 23,252 95% 35,655 97%
Exports 1,142 5% 1,143 3%
Regional Load 24,394 100% 36,797 100%
1 Direct-Service Industry (DSI) loads include regional loads currently served by Bonneville through DSI service
contracts and former DSIs served by other energy suppliers.
Regional Resources
PNW resources and contract purchases are collectively called “regional resources” in this study. Like the Federal system, regional resources vary monthly by water conditions, resource type, and seasonality of generating resource potential. This analysis classifies resources as: 1) Hydro resources, which include regulated, independent, and small hydro projects; 2) Non-hydro renewable resources, which include wind, solar, and other projects; 3) Thermal resources, which include nuclear, coal, natural gas, petroleum, biofuel and cogeneration projects; and 4) Contract purchases, which are identified as Imports.
Table 3-2, next, summarizes the resource generation available to meet PNW regional loads. The generation forecasts for these resources are provided by Bonneville models or the project owners. New regional generating projects are included when those resources begin operating or are under construction and have a scheduled on-line date; similarly, retiring resources are removed from the forecasts based on the date of the announced retirement. Resource forecasts for the region assume the retirement of the following coal projects over the study period: Boardman (January 1, 2021), Centralia 1 (December 1, 2020), Centralia 2 (December 1, 2025), Colstrip 13 (June 30, 2022), Colstrip 25 (June 30, 2022), Valmy 1 (January 1, 2022), and Valmy 2 (January 1, 2026). Contract purchases are provided by individual utility, follow specific contract
5 Since completion of study retirement dates for Colstrip 1 and 2 accelerated to EOY 2019,
_____________________________________________________________________________________________________________________
28 Bonniville Power Administration

provisions and can have various delivery arrangements. For OY 2022, regional firm energy resources are comprised of approximately 43 percent hydro, 22 percent natural gas, 14 percent coal, 9 percent cogeneration, 7 percent wind, 4 percent nuclear, 2 percent imports, and about 1 percent solar and other renewables.
Table 3-2
PNW Region Generation by Resource Type
OY 2022 1937-Critical Water Conditions
_____________________________________________________________________________________________________________________
2019 Pacific Northwest Loads and Resources Study 29

Regional Hydro Generation Variability: The generating capability of the region’s hydroelectric projects depends upon the amount of water flowing through the facilities, the physical capacity of the facilities, flow requirements pursuant to non-power requirements, and other operating limitations. Bonneville utilizes an 80-year record of historical streamflows from 1929 through 2008 for planning purposes. To simplify the presentation of hydro generation variability, this study uses three water conditions to represent the magnitude of hydro generation variability.
Table 3-3, next, shows the annual variability of the region’s hydro generation under the three streamflow scenarios: 1) 1937-critical water conditions, representing the firm generating capability of the hydro system; 2) 1958-water conditions, representing the average generating capability of the hydro system; and 3) 1974-water conditions, representing the high generating capability of the hydro system. In OY 2022, annual firm energy generation from regional hydro projects is forecasted to be 11,564 aMW. This represents about 41 percent of region’s resources. However, the generating potential from regional hydro projects can annually vary by nearly 7,000 aMW depending on water conditions.
Table 3-3
PNW Region Variability of Annual Hydro Generation
OY 2021 through 2030 Under Different Water Conditions
Table 3-4, page 28, shows the monthly variability of the region’s hydro generation under the same three water conditions. High generation levels in the December through mid-April period is largely due to drafting reservoirs for power production and flood control, which can vary widely due to rainfall and snowpack levels in the Columbia River Basin. Power production in late-April through July is variable due to the timing and amount of Columbia River Basin snowmelt runoff. Power production decreases through the end of the summer and early fall as streamflows are reduced due to depleted snowpack and lower precipitation levels. Water variability does not have a substantial impact on regional hydro generation from August through November. Regional hydro generation capability can vary by almost 14,000 aMW in a month, depending on the availability of water.
_____________________________________________________________________________________________________________________
30 Bonniville Power Administration

Table 3-4
PNW Region Variability of Monthly Hydro Generation
OY 2022 Under Different Water Conditions
Variability Due to IPP Generation Delivered to the PNW Region: The PNW regional study includes uncommitted PNW IPP generation as regional resources. These resources, or the share of these resources, that are not committed to serving specific loads represent approximately 2,742 aMW of energy with an associated 3,351 MW of January 120-Hour capacity in OY 2022. The inclusion of this uncommitted IPP generation is reasonable from a long-term planning perspective given the fact that the PNW Regional Analysis does not include any reliance on market purchases. However, PNW utilities may have to compete with other western markets to secure this generation to meet electricity demand. Table 3-5, below, details the region’s total uncommitted IPP annual energy and January 120-Hour capacity generation forecasts over the OY 2021 through 2030 study period. Table 3-6, page 29, details the region’s uncommitted IPP projects and the associated fuel types. If uncommitted IPP generation is secured for long-term periods by load serving entities within the region or outside the region, the IPP forecasts will be updated in future studies to reflect these changes.
Table 3-5
PNW Region Uncommitted Independent Power Producer Generation
Annual Energy and January 120-Hour Capacity OY 2021 through 2030
Regional Uncommitted IPP 2021 2022 2023 2024 2025 2026 2027 2028 2029 2030
Annual Energy (aMW)
2942 2742 2712 2709 2710 2540 2466 2499 2506 2506
January 120-Hour Capacity (MW)
3391 3351 3162 3162 3162 2872 2872 2872 2872 2872
_____________________________________________________________________________________________________________________
2019 Pacific Northwest Loads and Resources Study 31
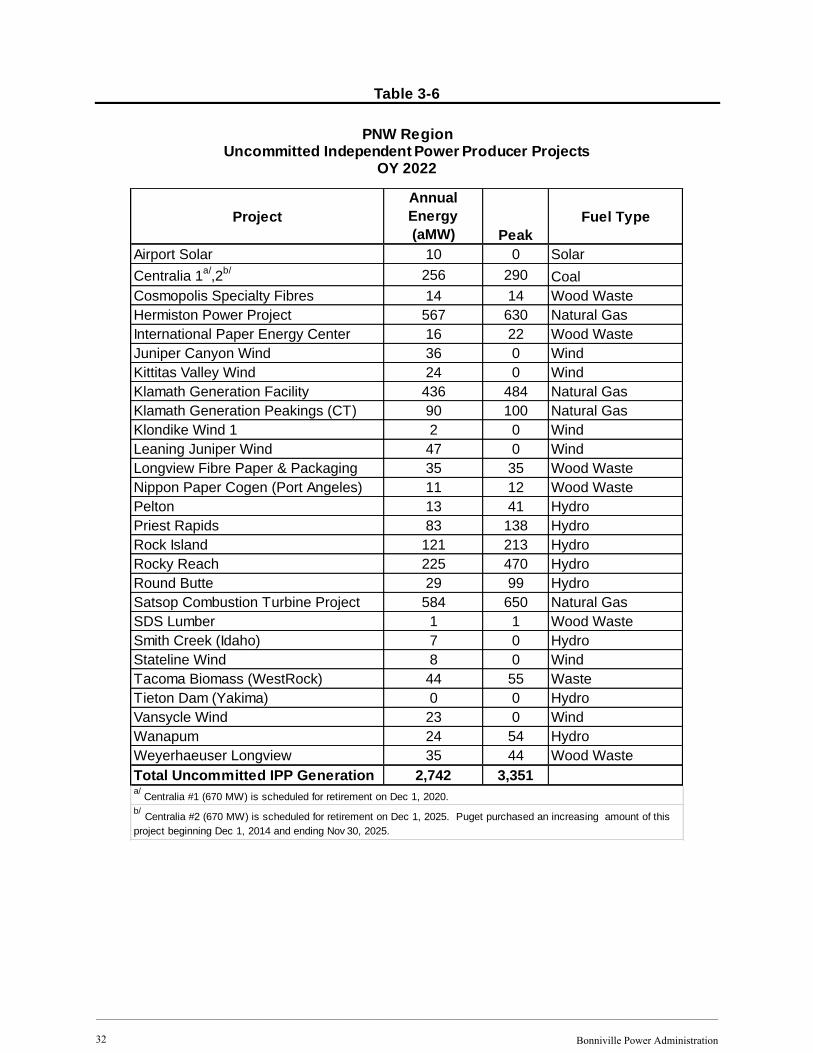
Table 3-6
PNW Region Uncommitted Independent Power Producer Projects
OY 2022
Project
Annual
Energy
(aMW) Peak
Fuel Type
Airport Solar 10 0 Solar
Centralia 1a/
,2b/ 256 290 Coal
Cosmopolis Specialty Fibres 14 14 Wood Waste
Hermiston Power Project 567 630 Natural Gas
International Paper Energy Center 16 22 Wood Waste
Juniper Canyon Wind 36 0 Wind
Kittitas Valley Wind 24 0 Wind
Klamath Generation Facility 436 484 Natural Gas
Klamath Generation Peakings (CT) 90 100 Natural Gas
Klondike Wind 1 2 0 Wind
Leaning Juniper Wind 47 0 Wind
Longview Fibre Paper & Packaging 35 35 Wood Waste
Nippon Paper Cogen (Port Angeles) 11 12 Wood Waste
Pelton 13 41 Hydro
Priest Rapids 83 138 Hydro
Rock Island 121 213 Hydro
Rocky Reach 225 470 Hydro
Round Butte 29 99 Hydro
Satsop Combustion Turbine Project 584 650 Natural Gas
SDS Lumber 1 1 Wood Waste
Smith Creek (Idaho) 7 0 Hydro
Stateline Wind 8 0 Wind
Tacoma Biomass (WestRock) 44 55 Waste
Tieton Dam (Yakima) 0 0 Hydro
Vansycle Wind 23 0 Wind
Wanapum 24 54 Hydro
Weyerhaeuser Longview 35 44 Wood Waste
Total Uncommitted IPP Generation 2,742 3,351a/
Centralia #1 (670 MW) is scheduled for retirement on Dec 1, 2020.
b/Centralia #2 (670 MW) is scheduled for retirement on Dec 1, 2025. Puget purchased an increasing amount of this
project beginning Dec 1, 2014 and ending Nov 30, 2025.
_____________________________________________________________________________________________________________________
32 Bonniville Power Administration

Key Results
Annual Energy: Table 3-7, below, shows significant annual energy surpluses for the PNW region throughout the study period, under 1937-water conditions. This study assumes that 100 percent of the PNW region’s uncommitted IPP generation (2,742 aMW in OY 2022) is available to serve the region’s loads. The individual components of the PNW regional annual energy loads and resources for OY 2021 through 2030 are shown in Exhibit 5-1, page 55. The PNW regional monthly energy loads and resources for OY 2022 are shown in Exhibit 5-2, page 58. The details of each component for OY 2021 through 2030 are presented in the 2019 Loads and Resources Study Technical Appendix, Volume 1: Energy Analysis.
Table 3-7
PNW Region Annual Energy Surplus/Deficit
Assuming 100% of Uncommitted IPP Generation is Available to the Region OY 2021 through 2030
1937-Critical Water Conditions
Energy (aMW)
2021 2022 2023 2024 2025 2026 2027 2028 2029 2030
Surplus/Deficit 2,974 2,132 1,800 1,892 1,571 1,150 798 780 590 698
Table 3-8, below, shows the significant variability in PNW regional annual firm energy surplus/deficit forecasts depending on the level of uncommitted IPP generation available to the region. IPP generation is detailed in Tables 3-5 and 3-6, pages 28 and 29.
Table 3-8
PNW Region Variability of Annual Energy Surplus/Deficit
Assuming Different Levels of Uncommitted IPP Generation OY 2021 through 2030
1937-Critical Water Conditions
Energy (aMW) 2021 2022 2023 2024 2025 2026 2027 2028 2029 2030
100% IPP 2,974 2,132 1,800 1,892 1,571 1,150 798 780 590 698
50% IPP 1,503 762 443 537 216 -120 -436 -470 -663 -555
0% IPP 32 -609 -913 -817 -1139 -1390 -1669 -1720 -1916 -1808
_____________________________________________________________________________________________________________________
2019 Pacific Northwest Loads and Resources Study 33

Table 3-9, below, compares the 2019 White Book PNW regional annual firm energy surplus/deficit forecasts to the 2018 White Book results. The PNW region continues to have annual energy surpluses throughout the study period. When compared to the 2018 White Book, the 2019 study shows lower annual energy surpluses at the start of the study period and increased surpluses in the rest of the study years, this is driver by flatter total retail loads then in the previous study.
Table 3-9
PNW Region Annual Energy Surplus/Deficit Comparison
Assuming 100% of Uncommitted IPP Generation is Available to the Region OY 2021 through 2030
1937-Critical Water Conditions
Energy (aMW) 2021 2022 2023 2024 2025 2026 2027 2028 2029 2030
2019 White Book 2,974 2,132 1,800 1,892 1,571 1,150 798 780 590 698
2018 White Book 3,141 2,303 1,637 1,750 1,416 965 614 579 403 n/a
Difference (2019 WBK – 2018 WBK)
-167 -170 163 142 155 185 184 201 187 n/a
January 120-Hour Capacity: Table 3-10, below, shows the January firm 120-Hour capacity surplus/deficits for the PNW region. The region is forecasted to have January 120-Hour capacity deficits over the entire study period. This assumes that 100 percent of PNW uncommitted IPP generation is available to serve regional loads. The individual components of the PNW regional January 120-Hour capacity loads and resources for OY 2021 through 2030 are shown in Exhibit 5-3, page 61. The monthly PNW regional 120-Hour capacity loads and resources for OY 2021are shown in Exhibit 5-4, page 64. The component details for OY 2021 through 2030 arepresented in the 2019 Loads and Resources Study Technical Appendix, Volume 2: CapacityAnalysis.
Table 3-10
PNW Region January 120-Hour Capacity Surplus/Deficit
Assuming 100% of Uncommitted IPP Generation is Available to the Region OY 2021 through 2030
1937-Critical Water Conditions
January 120-Hour Capacity (MW)
2021 2022 2023 2024 2025 2026 2027 2028 2029 2030
Surplus/Deficit -969 -1,398 -1,699 -1,954 -1,990 -2,911 -3,081 -3,229 -3.325 -3,460
_____________________________________________________________________________________________________________________
34 Bonniville Power Administration

Table 3-11, below, shows the significant variability in PNW regional January firm 120-Hour capacity surplus/deficit forecasts depending on the level of uncommitted IPP generation available to the region. IPP generation is detailed in Tables 3-5 and 3-6, pages 28 and 29.
Table 3-11
PNW Region Variability of January 120-Hour Capacity Surplus/Deficit
Assuming Different Levels of Uncommitted IPP Generation OY 2021 through 2030
1937-Critical Water Conditions
January 120-Hour Capacity (MW)
2021 2022 2023 2024 2025 2026 2027 2028 2029 2030
100% IPP -969 -1,398 -1,699 -1,954 -1,990 -2,911 -3,081 -3,229 -3.325 -3,460
50% IPP -2,665 -3,073 -3,280 -3,534 -3,571 -4,347 -4,517 -4,665 -4,761 -4,896
0% IPP -4,360 -4,749 -4,860 -5,115 -5,152 -5,783 -5,953 -6,100 -6,197 -6,332
Table 3-12, below, compares the 2019 White Book January firm 120-Hour capacity forecast to the 2018 White Book results. Regional January 120-Hour capacity surplus/deficits show less deficits over the study period. The decreased January 120-Hour capacity deficits, compared to the 2018 White Book, are mainly driven by reduced non coincidental peaks in the updated TRL forecasts from ALF.
Table 3-12
PNW Region January 120-Hour Capacity Surplus/Deficit Comparison
Assuming 100% of Uncommitted IPP Generation is Available to the Region OY 2021 through 2030
1937-Critical Water Conditions
January 120-Hour Capacity (MW)
2021 2022 2023 2024 2025 2026 2027 2028 2029 2030
2019 White Book -969 -1,398 -1,699 -1,954 -1,990 -2,911 -3,081 -3,229 -3,325 -3,460
2018 White Book -1,588 -2,456 -3,056 -3,337 -3,436 -4,482 -4,589 -4,866 -4,891 n/a
Difference (2019 WBK – 2018 WBK)
679 1,059 1,357 1,384 1,446 1,571 1,508 1,637 1,566 n/a
_____________________________________________________________________________________________________________________
2019 Pacific Northwest Loads and Resources Study 35

Regional Annual Surplus/Deficit: Table 3-13, below, graphically presents the annual firm energy and January 120-Hour capacity surplus/deficit forecasts for the PNW Region. These forecasts assume 100 percent availability of the PNW’s uncommitted IPP generation to serve regional loads. The regional annual energy and January 120-Hour capacity surplus/deficit declines over the 10-year study period. By the end of the period, the study shows an annual energy surplus of 698 aMW, while January 120-Hour capacity is deficit over the entire study period ending with a deficit of -3,460 MW. Continuing declines in the surplus/deficit position over the study period, for both annual energy and January 120-Hour capacity are driven by a combination of annual load growth, and the retirement of resources across the region.
Table 3-13
PNW Region Annual Energy and January 120-Hour Capacity Surplus/Deficit
OY 2021 through 2030 1937-Critical Water Conditions
Regional Monthly Surplus/Deficit: Table 3-14, page 34, graphically presents the monthly energy and 120-Hour capacity surplus/deficit forecasts for OY 2022. These forecasts assume 100 percent availability of the PNW’s uncommitted IPP generation to serve regional loads. This monthly view shows the variability that the region experiences across the year, with January showing a deficit and the spring months showing the largest surpluses. Forecasts for monthly energy and 120-Hour capacity maintain similar shaping over the study period.
_____________________________________________________________________________________________________________________
36 Bonniville Power Administration
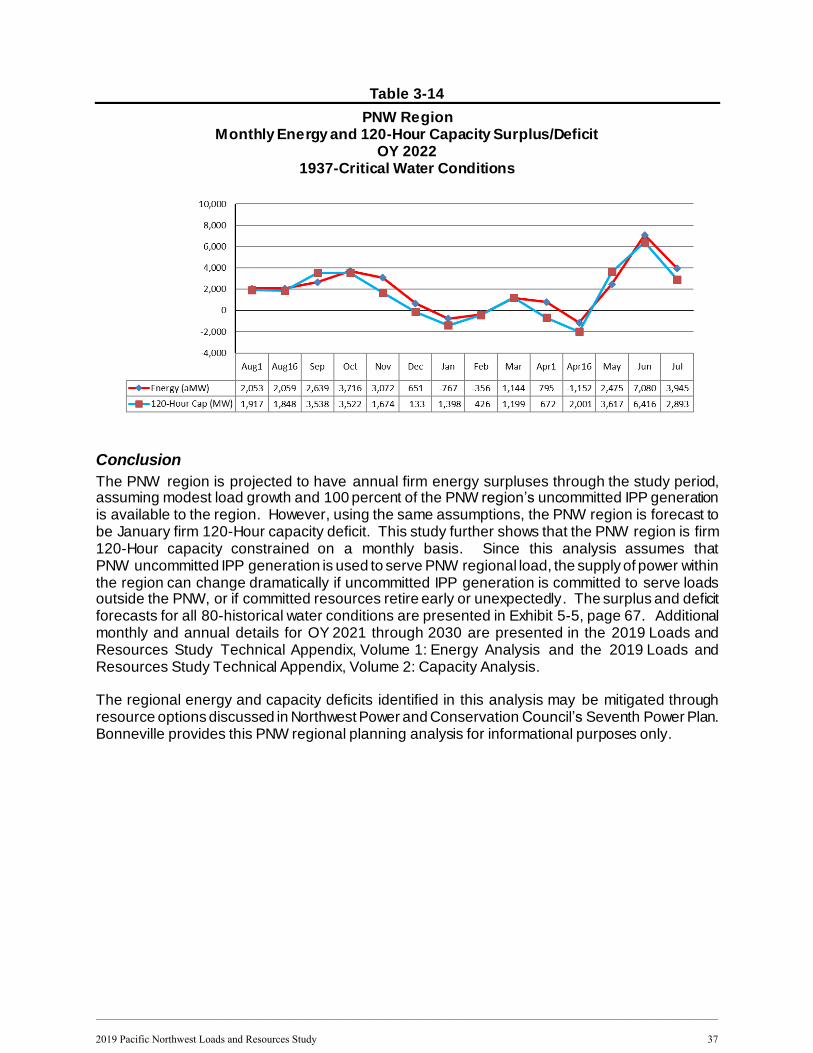
Table 3-14
PNW Region Monthly Energy and 120-Hour Capacity Surplus/Deficit
OY 2022 1937-Critical Water Conditions
Conclusion
The PNW region is projected to have annual firm energy surpluses through the study period, assuming modest load growth and 100 percent of the PNW region’s uncommitted IPP generation is available to the region. However, using the same assumptions, the PNW region is forecast to be January firm 120-Hour capacity deficit. This study further shows that the PNW region is firm 120-Hour capacity constrained on a monthly basis. Since this analysis assumes thatPNW uncommitted IPP generation is used to serve PNW regional load, the supply of power withinthe region can change dramatically if uncommitted IPP generation is committed to serve loadsoutside the PNW, or if committed resources retire early or unexpectedly. The surplus and deficitforecasts for all 80-historical water conditions are presented in Exhibit 5-5, page 67. Additionalmonthly and annual details for OY 2021 through 2030 are presented in the 2019 Loads andResources Study Technical Appendix, Volume 1: Energy Analysis and the 2019 Loads andResources Study Technical Appendix, Volume 2: Capacity Analysis.
The regional energy and capacity deficits identified in this analysis may be mitigated through resource options discussed in Northwest Power and Conservation Council’s Seventh Power Plan. Bonneville provides this PNW regional planning analysis for informational purposes only.
_____________________________________________________________________________________________________________________
2019 Pacific Northwest Loads and Resources Study 37

THIS PAGE INTENTIONALLY LEFT BLANK
_____________________________________________________________________________________________________________________
38 Bonniville Power Administration
Section 4: Federal System Analysis Exhibits
_____________________________________________________________________________________________________________________
2019 Pacific Northwest Loads and Resources Study 39

THIS PAGE INTENTIONALLY LEFT BLANK
_____________________________________________________________________________________________________________________
40 Bonniville Power Administration

Exhibit 4-1: Annual Energy
Federal System Analysis Surplus Deficit Operating Year 2021 to 2030
Using 1937-Water Conditions
_____________________________________________________________________________________________________________________
2019 Pacific Northwest Loads and Resources Study 41

THIS PAGE INTENTIONALLY LEFT BLANK
_____________________________________________________________________________________________________________________
42 Bonniville Power Administration

Energy-aMW 2021 2022 2023 2024 2025 2026 2027 2028 2029 2030
Firm Obligations
1 Load Following 3458 3472 3486 3496 3512 3529 3547 3560 3577 3593
2 Preference Customers 3146 3151 3164 3175 3190 3207 3224 3238 3253 3269
3 Federal Agencies 134 143 143 143 144 144 145 145 145 145
4 USBR 178 178 178 178 178 178 178 178 178 178
5 Federal Diversity 0 0 0 0 0 0 0 0 0 0
6 Tier 1 Block 572 571 564 552 550 549 549 548 548 548
7 Tier 1 Block 572 571 564 552 550 549 549 548 548 548
8 Slice 2818 2920 2928 2929 2922 2926 2915 2919 2907 2916
9 Slice Block 1314 1404 1442 1417 1437 1414 1434 1412 1427 1409
10 Slice Output from T1 System 1504 1516 1486 1513 1485 1512 1482 1508 1480 1508
11 Direct Service Industries 12.0 12.0 12.0 12.0 12.0 12.0 12.0 12.0 12.0 12.0
12 Direct Service Industry 12.0 12.0 12.0 12.0 12.0 12.0 12.0 12.0 12.0 12.0
13 Contract Deliveries 818 740 676 675 676 560 476 476 476 476
14 Exports 629 529 465 464 465 465 465 465 465 465
15 Intra-Regional Transfers (Out) 188 211 211 211 211 94.6 10.7 10.7 10.7 10.7
16 Firm Surplus Sale 0 0 0 0 0 0 0 0 0 0
17 Total Firm Obligations 7679 7714 7666 7664 7672 7577 7499 7515 7520 7545
Net Resources
18 Hydro 6410 6344 6344 6343 6339 6344 6339 6343 6339 6344
19 Regulated Hydro - Net 6058 5992 5992 5992 5987 5992 5987 5992 5987 5992
20 Independent Hydro - Net 349 349 349 349 349 349 349 349 349 349
21 Small Hydro - Net 2.88 2.88 2.88 2.88 2.88 2.88 2.88 2.88 2.88 2.88
22 Non-Hydro Renewable 51.0 48.5 34.8 33.0 33.0 33.0 19.8 1.90 0 0
23 Wind - Net 51.0 48.5 34.8 33.0 33.0 33.0 19.8 1.90 0 0
24 Solar - Net 0 0 0 0 0 0 0 0 0 0
25 Other - Net 0 0 0 0 0 0 0 0 0 0
26 Thermal 994 1116 994 1116 994 1116 994 1116 994 1116
27 Nuclear - Net 994 1116 994 1116 994 1116 994 1116 994 1116
28 Coal - Net 0 0 0 0 0 0 0 0 0 0
29 Natural Gas - Net 0 0 0 0 0 0 0 0 0 0
30 Petroleum - Net 0 0 0 0 0 0 0 0 0 0
31 Biofuel - Net 0 0 0 0 0 0 0 0 0 0
32 Cogeneration - Net 0 0 0 0 0 0 0 0 0 0
Loads and Resources - Federal System
Operating Year: 2021 to 2030 Water Year: 1937
2019 White Book Report Date: 4/6/2020
S184-WB-20191230-103442
_____________________________________________________________________________________________________________________
2019 Pacific Northwest Loads and Resources Study 43

Energy-aMW 2021 2022 2023 2024 2025 2026 2027 2028 2029 2030
Loads and Resources - Federal System
Operating Year: 2021 to 2030 Water Year: 1937
2019 White Book Report Date: 4/6/2020 ContinuedS184-WB-20191230-103442
33 Contract Purchases 261 165 165 165 164 165 164 165 164 165
34 Imports 84.5 1.00 1.00 1.00 1.00 1.00 1.00 1.00 1.00 1.00
35 Intra-Regional Transfers (In) 12.4 0 0 0 0 0 0 0 0 0
36 Non-Federal CER 135 135 135 135 135 135 135 135 135 135
37 Slice Transmission Loss Return 28.6 28.8 28.3 28.8 28.2 28.8 28.2 28.7 28.1 28.7
38 Augmentation Purchases 0 0 0 0 0 0 0 0 0 0
39 Reserves & Losses -231 -230 -226 -229 -225 -229 -225 -228 -224 -228
40 Operating Reserves 0 0 0 0 0 0 0 0 0 0
41 Balancing Reserves 0 0 0 0 0 0 0 0 0 0
42 Transmission Losses -231 -230 -226 -229 -225 -229 -225 -228 -224 -228
43 Total Net Resources 7484 7444 7312 7428 7305 7429 7292 7398 7273 7397
44 Total Surplus/Deficit -194 -270 -354 -236 -367 -148 -207 -118 -247 -148
_____________________________________________________________________________________________________________________
44 Bonniville Power Administration
Exhibit 4-2: Monthly Energy
Federal System Analysis Surplus Deficit Operating Year 2022
Using 1937-Water Conditions
_____________________________________________________________________________________________________________________
2019 Pacific Northwest Loads and Resources Study 45

THIS PAGE INTENTIONALLY LEFT BLANK
_____________________________________________________________________________________________________________________
46 Bonniville Power Administration

Energy-aMW Aug1 Aug16 Sep Oct Nov Dec Jan Feb Mar Apr1 Apr16 May Jun Jul Avg
Firm Obligations
45 Load Following 3545 3572 3174 2961 3436 3935 3894 3700 3253 3271 3271 3261 3476 3749 3472
46 Preference Customers 3102 3139 2792 2728 3269 3742 3705 3512 3040 2895 2895 2810 2999 3209 3151
47 Federal Agencies 128 129 119 125 152 179 178 172 148 132 132 123 124 137 143
48 USBR 315 304 263 108 15.3 14.5 10.4 16.3 64.9 244 244 327 353 403 178
49 Federal Diversity 0 0 0 0 0 0 0 0 0 0 0 0 0 0 0
50 Tier 1 Block 380 383 629 525 864 863 948 892 846 416 416 148 20.6 337 571
51 Tier 1 Block 380 383 629 525 864 863 948 892 846 416 416 148 20.6 337 571
52 Slice 2724 2738 2477 2659 3295 3432 3131 3079 2887 2530 2425 2724 3202 2948 2920
53 Slice Block 1214 1214 1158 1290 1499 1710 1701 1564 1447 1350 1350 1307 1279 1336 1404
54 Slice Output from T1 System 1510 1524 1319 1369 1797 1723 1431 1515 1440 1180 1075 1417 1923 1612 1516
55 Direct Service Industries 12.0 12.0 12.0 12.0 12.0 12.0 12.0 12.0 12.0 12.0 12.0 12.0 12.0 12.0 12.0
56 Direct Service Industry 12.0 12.0 12.0 12.0 12.0 12.0 12.0 12.0 12.0 12.0 12.0 12.0 12.0 12.0 12.0
57 Contract Deliveries 893 949 817 817 821 821 668 668 664 664 664 664 664 685 740
58 Exports 684 740 607 607 607 607 454 454 454 454 454 454 454 476 529
59 Intra-Regional Transfers (Out) 209 209 209 209 213 213 213 213 209 209 209 209 209 209 211
60 Firm Surplus Sale 0 0 0 0 0 0 0 0 0 0 0 0 0 0 0
61 Total Firm Obligations 7554 7654 7109 6973 8428 9063 8653 8352 7662 6893 6788 6808 7374 7730 7714
Net Resources
62 Hydro 6535 6623 5529 5596 7449 7119 5793 6174 5867 4835 4363 6028 8373 7024 6344
63 Regulated Hydro - Net 6171 6262 5187 5287 7190 6944 5677 6043 5634 4397 3917 5306 7662 6614 5992
64 Independent Hydro - Net 362 358 340 307 257 172 113 128 230 435 442 719 708 407 349
65 Small Hydro - Net 2.63 2.63 2.63 2.67 2.84 3.19 3.21 3.05 3.10 3.09 3.09 2.83 2.72 2.63 2.88
66 Non-Hydro Renewable 34.4 51.7 48.0 38.6 55.3 42.1 22.5 37.3 42.9 76.7 64.5 61.3 60.6 59.2 48.5
67 Wind - Net 34.4 51.7 48.0 38.6 55.3 42.1 22.5 37.3 42.9 76.7 64.5 61.3 60.6 59.2 48.5
68 Solar - Net 0 0 0 0 0 0 0 0 0 0 0 0 0 0 0
69 Other - Net 0 0 0 0 0 0 0 0 0 0 0 0 0 0 0
70 Thermal 1116 1116 1116 1116 1116 1116 1116 1116 1116 1116 1116 1116 1116 1116 1116
71 Nuclear - Net 1116 1116 1116 1116 1116 1116 1116 1116 1116 1116 1116 1116 1116 1116 1116
72 Coal - Net 0 0 0 0 0 0 0 0 0 0 0 0 0 0 0
73 Natural Gas - Net 0 0 0 0 0 0 0 0 0 0 0 0 0 0 0
74 Petroleum - Net 0 0 0 0 0 0 0 0 0 0 0 0 0 0 0
75 Biofuel - Net 0 0 0 0 0 0 0 0 0 0 0 0 0 0 0
76 Cogeneration - Net 0 0 0 0 0 0 0 0 0 0 0 0 0 0 0
77 Contract Purchases 156 168 163 160 172 171 160 165 166 160 158 160 175 164 165
78 Imports 1.00 1.00 1.00 1.00 1.00 1.00 1.00 1.00 1.00 1.00 1.00 1.00 1.00 1.00 1.00
Loads and Resources - Federal System
Operating Year: 2022 Water Year: 1937
2019 White Book Report Date: 2/3/2020
S184-WB-20191230-103442
_____________________________________________________________________________________________________________________
2019 Pacific Northwest Loads and Resources Study 47
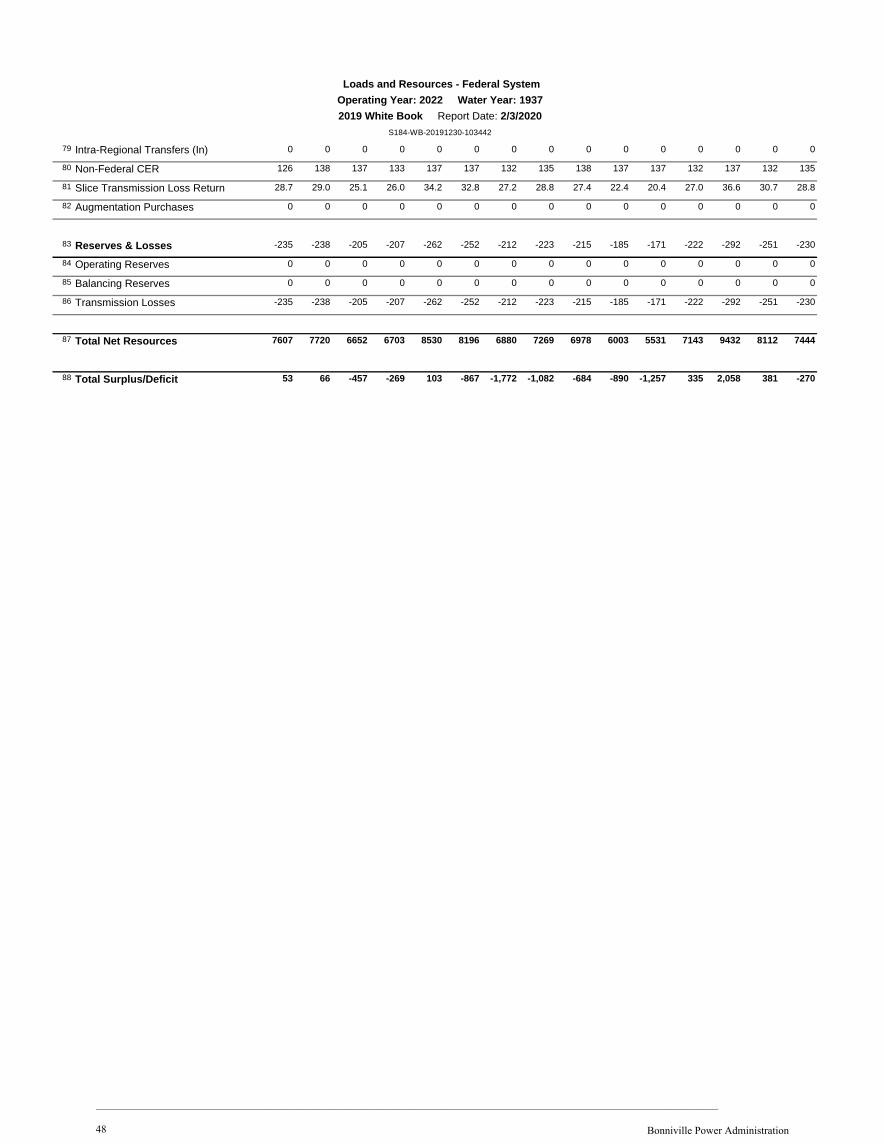
Loads and Resources - Federal System
Operating Year: 2022 Water Year: 1937
2019 White Book Report Date: 2/3/2020
S184-WB-20191230-103442
79 Intra-Regional Transfers (In) 0 0 0 0 0 0 0 0 0 0 0 0 0 0 0
80 Non-Federal CER 126 138 137 133 137 137 132 135 138 137 137 132 137 132 135
81 Slice Transmission Loss Return 28.7 29.0 25.1 26.0 34.2 32.8 27.2 28.8 27.4 22.4 20.4 27.0 36.6 30.7 28.8
82 Augmentation Purchases 0 0 0 0 0 0 0 0 0 0 0 0 0 0 0
83 Reserves & Losses -235 -238 -205 -207 -262 -252 -212 -223 -215 -185 -171 -222 -292 -251 -230
84 Operating Reserves 0 0 0 0 0 0 0 0 0 0 0 0 0 0 0
85 Balancing Reserves 0 0 0 0 0 0 0 0 0 0 0 0 0 0 0
86 Transmission Losses -235 -238 -205 -207 -262 -252 -212 -223 -215 -185 -171 -222 -292 -251 -230
87 Total Net Resources 7607 7720 6652 6703 8530 8196 6880 7269 6978 6003 5531 7143 9432 8112 7444
88 Total Surplus/Deficit 53 66 -457 -269 103 -867 -1,772 -1,082 -684 -890 -1,257 335 2,058 381 -270
_____________________________________________________________________________________________________________________
48 Bonniville Power Administration

Exhibit 4-3: Annual 120-Hour Capacity
Federal System Analysis Surplus Deficit Operating Year 2021 to 2030
Using 1937-Water Conditions
_____________________________________________________________________________________________________________________
2019 Pacific Northwest Loads and Resources Study 49

THIS PAGE INTENTIONALLY LEFT BLANK
_____________________________________________________________________________________________________________________
50 Bonniville Power Administration

Loads and Resources - Federal System Operating Year: 2021 to 2030 Water Year: 1937
2019 White Book Report Date: 10/5/2020
S184-WB-20191230-103442
January 120Hr-MW 2021 2022 2023 2024 2025 2026 2027 2028 2029 2030
Firm Obligations 1 Load Following 4640 4659 4694 4677 4696 4720 4783 4814 4803 48232 Preference Customers 5500 5514 5547 5575 5605 5634 5666 5696 5726 57543 Federal Agencies 231 244 241 241 243 244 245 245 245 2464 USBR 284 284 284 284 284 284 284 284 284 2845 Federal Diversity -1375 -1383 -1379 -1424 -1437 -1442 -1413 -1411 -1453 -1460
6 Tier 1 Block 1047 1045 1029 968 963 961 997 998 959 9597 Tier 1 Block 1047 1045 1029 968 963 961 997 998 959 959
8 Slice 3565 3674 3704 3642 3696 3655 3689 3658 3680 36509 Slice Block 1591 1701 1731 1696 1725 1688 1722 1691 1712 1682
10 Slice Output from T1 System 1974 1974 1973 1946 1971 1967 1967 1967 1968 1968
11 Direct Service Industries 12.0 12.0 12.0 12.0 12.0 12.0 12.0 12.0 12.0 12.012 Direct Service Industry 12.0 12.0 12.0 12.0 12.0 12.0 12.0 12.0 12.0 12.0
13 Contract Deliveries 1511 1358 1358 1358 1358 1158 1158 1158 1158 115814 Exports 1295 1142 1142 1142 1142 1142 1142 1142 1142 114215 Intra-Regional Transfers (Out) 216 216 216 216 216 16.4 16.4 16.4 16.4 16.416 Firm Surplus Sale 0 0 0 0 0 0 0 0 0 0
17 Total Firm Obligations 10775 10748 10796 10656 10725 10506 10639 10641 10612 10603
Net Resources 18 Hydro 10114 10110 10107 9983 10097 10078 10080 10081 10082 1008319 Regulated Hydro - Net 9911 9907 9905 9780 9894 9876 9877 9878 9880 988120 Independent Hydro - Net 198 198 198 198 198 198 198 198 198 19821 Small Hydro - Net 4.59 4.59 4.59 4.59 4.59 4.59 4.59 4.59 4.59 4.59
22 Non-Hydro Renewable 0 0 0 0 0 0 0 0 0 023 Wind - Net 0 0 0 0 0 0 0 0 0 024 Solar - Net 0 0 0 0 0 0 0 0 0 025 Other - Net 0 0 0 0 0 0 0 0 0 0
26 Thermal 1169 1169 1169 1169 1169 1169 1169 1169 1169 116927 Nuclear - Net 1169 1169 1169 1169 1169 1169 1169 1169 1169 116928 Coal - Net 0 0 0 0 0 0 0 0 0 029 Natural Gas - Net 0 0 0 0 0 0 0 0 0 030 Petroleum - Net 0 0 0 0 0 0 0 0 0 031 Biofuel - Net 0 0 0 0 0 0 0 0 0 032 Cogeneration - Net 0 0 0 0 0 0 0 0 0 0
33 Contract Purchases 411 286 285 285 285 285 285 285 285 28534 Imports 126 1.00 1.00 1.00 1.00 1.00 1.00 1.00 1.00 1.0035 Intra-Regional Transfers (In) 0 0 0 0 0 0 0 0 0 036 Non-Federal CER 237 237 237 237 237 237 237 237 237 23737 Slice Transmission Loss Return 47.5 47.5 47.5 46.8 47.4 47.3 47.3 47.4 47.4 47.438 Augmentation Purchases 0 0 0 0 0 0 0 0 0 0
39 Reserves & Losses -1979 -1987 -1992 -1987 -1996 -1977 -1978 -1980 -1981 -198240 Operating Reserves -735 -747 -753 -752 -757 -739 -740 -741 -742 -74341 Balancing Reserves -903 -903 -903 -903 -903 -903 -903 -903 -903 -903
_____________________________________________________________________________________________________________________
2019 Pacific Northwest Loads and Resources Study 51
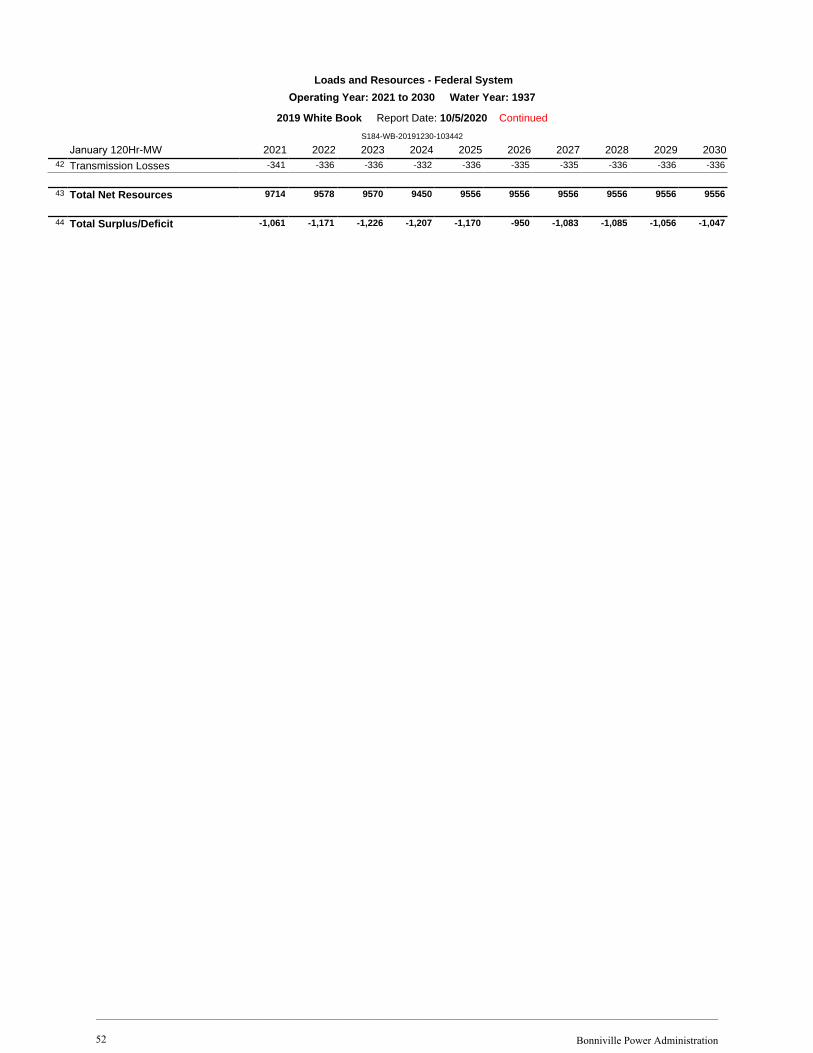
Loads and Resources - Federal System
Operating Year: 2021 to 2030 Water Year: 1937
2019 White Book Report Date: 10/5/2020 Continued
S184-WB-20191230-103442
January 120Hr-MW 2021 2022 2023 2024 2025 2026 2027 2028 2029 203042 Transmission Losses -341 -336 -336 -332 -336 -335 -335 -336 -336 -336
43 Total Net Resources 9714 9578 9570 9450 9556 9556 9556 9556 9556 9556
44 Total Surplus/Deficit -1,061 -1,171 -1,226 -1,207 -1,170 -950 -1,083 -1,085 -1,056 -1,047
_____________________________________________________________________________________________________________________
52 Bonniville Power Administration

Exhibit 4-4: Monthly 120-Hour Capacity
Federal System Analysis Surplus Deficit Operating Year 2022
Using 1937-Water Conditions
_____________________________________________________________________________________________________________________
2019 Pacific Northwest Loads and Resources Study 53

THIS PAGE INTENTIONALLY LEFT BLANK
_____________________________________________________________________________________________________________________
54 Bonniville Power Administration

Loads and Resources - Federal System
2019 White Book Report Date: 3/4/2020
Operating Year: 2022 Water Year: 1937
S184-WB-20191230-103442
120Hr-MW Aug1 Aug16 Sep Oct Nov Dec Jan Feb Mar Apr1 Apr16 May Jun Jul
Firm Obligations 45 Load Following 4182 3906 3573 3588 4099 4666 4659 4393 3915 3958 3782 3692 3899 427146 Preference Customers 4331 4331 3974 4209 4902 5553 5514 5225 4713 4444 4444 4095 4182 444047 Federal Agencies 162 162 152 162 198 234 244 227 202 172 172 161 157 17048 USBR 602 602 527 383 206 277 284 266 365 438 438 527 578 61849 Federal Diversity -914 -1189 -1080 -1166 -1208 -1398 -1383 -1325 -1364 -1095 -1272 -1089 -1018 -957
50 Tier 1 Block 406 406 674 559 928 919 1045 932 870 430 430 162 20.6 37051 Tier 1 Block 406 406 674 559 928 919 1045 932 870 430 430 162 20.6 370
52 Slice 3190 3123 2822 3046 3768 4006 3674 3540 3315 2836 2572 3138 3829 351053 Slice Block 1214 1214 1158 1289 1498 1710 1701 1564 1447 1350 1350 1307 1279 133554 Slice Output from T1 System 1976 1910 1664 1756 2269 2296 1974 1976 1868 1486 1222 1831 2550 2175
55 Direct Service Industries 12.0 12.0 12.0 12.0 12.0 12.0 12.0 12.0 12.0 12.0 12.0 12.0 12.0 12.056 Direct Service Industry 12.0 12.0 12.0 12.0 12.0 12.0 12.0 12.0 12.0 12.0 12.0 12.0 12.0 12.0
57 Contract Deliveries 1565 1650 1504 1504 1511 1511 1358 1358 1351 1351 1351 1351 1351 137258 Exports 1356 1441 1295 1295 1295 1295 1142 1142 1142 1142 1142 1142 1142 116359 Intra-Regional Transfers (Out) 209 209 209 209 216 216 216 216 209 209 209 209 209 20960 Firm Surplus Sale 0 0 0 0 0 0 0 0 0 0 0 0 0 0
61 Total Firm Obligations 9355 9099 8585 8709 10317 11114 10748 10235 9463 8587 8147 8355 9111 9535
Net Resources 62 Hydro 10509 10290 8921 9193 11380 11576 10110 10103 9699 8026 6813 9718 13076 1139763 Regulated Hydro - Net 9936 9726 8397 8717 10958 11261 9907 9873 9309 7409 6179 8899 12232 1078964 Independent Hydro - Net 569 560 522 472 417 311 198 225 385 613 629 815 840 60565 Small Hydro - Net 3.49 3.49 3.00 4.11 4.49 4.60 4.59 4.62 4.58 4.58 4.58 4.58 4.09 3.19
66 Non-Hydro Renewable 0 0 0 0 0 0 0 0 0 0 0 0 0 067 Wind - Net 0 0 0 0 0 0 0 0 0 0 0 0 0 068 Solar - Net 0 0 0 0 0 0 0 0 0 0 0 0 0 069 Other - Net 0 0 0 0 0 0 0 0 0 0 0 0 0 0
70 Thermal 1163 1163 1179 1181 1179 1180 1169 1169 1169 1160 1160 1151 1154 116871 Nuclear - Net 1163 1163 1179 1181 1179 1180 1169 1169 1169 1160 1160 1151 1154 116872 Coal - Net 0 0 0 0 0 0 0 0 0 0 0 0 0 073 Natural Gas - Net 0 0 0 0 0 0 0 0 0 0 0 0 0 074 Petroleum - Net 0 0 0 0 0 0 0 0 0 0 0 0 0 075 Biofuel - Net 0 0 0 0 0 0 0 0 0 0 0 0 0 076 Cogeneration - Net 0 0 0 0 0 0 0 0 0 0 0 0 0 0
77 Contract Purchases 286 284 278 280 293 293 286 286 283 274 267 282 299 29078 Imports 1.00 1.00 1.00 1.00 1.00 1.00 1.00 1.00 1.00 1.00 1.00 1.00 1.00 1.0079 Intra-Regional Transfers (In) 0 0 0 0 0 0 0 0 0 0 0 0 0 080 Non-Federal CER 237 237 237 237 237 237 237 237 237 237 237 237 237 23781 Slice Transmission Loss Return 47.6 46.0 40.0 42.3 54.6 55.3 47.5 47.6 45.0 35.8 29.4 44.1 61.4 52.382 Augmentation Purchases 0 0 0 0 0 0 0 0 0 0 0 0 0 0
83 Reserves & Losses -1931 -1917 -1815 -1856 -2028 -2072 -1987 -1967 -1921 -1789 -1710 -1878 -2088 -199984 Operating Reserves -675 -668 -611 -643 -745 -784 -747 -728 -694 -616 -577 -647 -747 -71485 Balancing Reserves -903 -903 -903 -903 -903 -903 -903 -903 -903 -903 -903 -903 -903 -903
_____________________________________________________________________________________________________________________
2019 Pacific Northwest Loads and Resources Study 55

Loads and Resources - Federal System
2019 White Book Report Date: 3/4/2020 Continued
Operating Year: 2023 Water Year: 1937
S184-WB-20191230-103442
120Hr-MW Aug1 Aug16 Sep Oct Nov Dec Jan Feb Mar Apr1 Apr16 May Jun Jul86 Transmission Losses -353 -346 -301 -310 -380 -385 -336 -336 -324 -270 -230 -328 -439 -382
87 Total Net Resources 10027 9819 8564 8798 10824 10977 9578 9590 9230 7671 6530 9273 12441 10857
88 Total Surplus/Deficit 671 721 -21 89 507 -136 -1,171 -644 -233 -917 -1,617 918 3,329 1,321
_____________________________________________________________________________________________________________________
56 Bonniville Power Administration

Exhibit 4-5: 80-Water Conditions Monthly Energy
Federal System Analysis Surplus Deficit Operating Year 2022
_____________________________________________________________________________________________________________________
2019 Pacific Northwest Loads and Resources Study 57

THIS PAGE INTENTIONALLY LEFT BLANK
_____________________________________________________________________________________________________________________
58 Bonniville Power Administration

Federal Report Surplus Deficit By Water Year
2019 White Book Report Date: 3/18/2020
Operating Year 2022
S184-WB-20191230-103442
Energy-aMW - Surplus Deficit Aug1 Aug16
Sep Oct Nov Dec Jan Feb Mar Apr1 Apr16 May Jun Jul Avg
1 1929 Federal Report Surplus Deficit 661 1113 -72.5 -350 -122 -1038 -881 -543 -367 -980 -1304 -13.2 2690 -293 -104
2 1930 Federal Report Surplus Deficit 148 126 -109 -290 16.0 -1025 -1660 -524 -413 -424 -895 301 916 670 -220
3 1931 Federal Report Surplus Deficit 324 227 -215 -286 -8.05 -846 -1578 -616 -354 -565 -1394 483 851 608 -220
4 1932 Federal Report Surplus Deficit 573 160 -171 -529 -373 -936 -962 -2055 1385 1656 3241 4481 3981 1979 817
5 1933 Federal Report Surplus Deficit 878 1090 274 -337 -234 595 1903 2117 1549 862 272 2612 5786 4220 1667
6 1934 Federal Report Surplus Deficit 2727 2535 390 255 2326 3900 4511 4434 3549 4153 3122 2887 3275 147 2650
7 1935 Federal Report Surplus Deficit -5.17 260 -466 -398 -713 -443 1697 1941 1581 -215 713 2263 1738 2046 799
8 1936 Federal Report Surplus Deficit 2113 434 -235 -416 -167 -1046 -1519 -965 -149 -527 2141 4609 3635 1246 595
9 1937 Federal Report Surplus Deficit 52.8 66.0 -457 -269 103 -867 -1772 -1082 -684 -890 -1257 335 2058 381 -270
10 1938 Federal Report Surplus Deficit 314 81.4 -51.6 -362 -151 -78.5 1127 1577 2153 2120 3788 3523 2877 2310 1336
11 1939 Federal Report Surplus Deficit 106 28.2 82.7 -330 -293 -1112 255 464 398 138 1294 2224 1456 811 393
12 1940 Federal Report Surplus Deficit -88.0 -14.3 -383 -219 155 106 539 17.4 1841 1123 416 2483 1504 -331 540
13 1941 Federal Report Surplus Deficit -207 -182 -243 -455 147 -272 -504 -220 275 -653 -1379 335 1293 514 -27.6
14 1942 Federal Report Surplus Deficit 457 263 69.6 -519 316 1219 1186 1177 -312 -705 26.2 1133 3968 2860 923
15 1943 Federal Report Surplus Deficit 1196 1258 523 -287 -373 -440 2244 1951 2267 5345 4401 2989 5170 4169 2021
16 1944 Federal Report Surplus Deficit 1359 1005 -31.9 -385 -95.9 -1025 -365 -500 -670 -1249 -1623 -125 787 -68.9 -226
17 1945 Federal Report Surplus Deficit 305 -84.4 -288 -467 -148 -864 -1261 -924 -489 -1002 -1399 2082 3755 106 36.1
18 1946 Federal Report Surplus Deficit 250 149 -225 -420 28.9 31.1 932 1352 1553 3196 3896 3698 3094 2865 1385
19 1947 Federal Report Surplus Deficit 1773 1471 257 -439 498 2352 3130 2938 2562 1936 1244 3880 3549 2560 2040
20 1948 Federal Report Surplus Deficit 892 694 152 1929 1606 1039 3037 2579 1470 1244 2683 5223 5862 3011 2387
21 1949 Federal Report Surplus Deficit 2781 2648 643 -62.0 194 -108 916 1076 2646 1963 3071 4541 2904 241 1521
22 1950 Federal Report Surplus Deficit -292 -378 -375 -431 -199 147 2811 3038 3072 3216 2137 3009 5259 4937 1960
23 1951 Federal Report Surplus Deficit 2699 2457 512 611 1900 2482 4271 5022 3853 3703 2751 3655 3234 3655 2906
24 1952 Federal Report Surplus Deficit 1946 816 238 1429 993 1141 2839 2664 1464 3430 4677 4785 3664 2377 2248
25 1953 Federal Report Surplus Deficit 1082 468 -431 -340 -145 -988 -178 3681 789 -1006 -380 2891 5735 3956 1235
26 1954 Federal Report Surplus Deficit 1312 1280 282 -127 496 582 2336 3163 2206 1285 1124 3557 4307 4716 1996
27 1955 Federal Report Surplus Deficit 3622 4040 1983 4.58 1048 554 -23.9 389 -844 -653 -731 2120 5473 4833 1562
28 1956 Federal Report Surplus Deficit 2540 1765 144 152 1509 2376 4138 4164 3883 3062 4726 5052 5193 3326 2991
29 1957 Federal Report Surplus Deficit 2165 2207 346 109 137 732 1181 405 2095 2950 1489 5545 5370 1468 1825
30 1958 Federal Report Surplus Deficit 1174 278 -206 -343 -50.8 -166 1910 1895 1374 463 1961 4883 4508 1177 1405
31 1959 Federal Report Surplus Deficit 952 356 -101 -126 1034 1873 3945 3757 1939 2419 1463 2879 4622 4014 2192
32 1960 Federal Report Surplus Deficit 2439 2658 2567 2683 2425 1718 2369 1825 1610 3862 2537 2465 3899 1994 2441
33 1961 Federal Report Surplus Deficit 1649 346 -37.5 -183 438 47.7 1741 2318 2737 2177 827 3162 4773 1417 1567
34 1962 Federal Report Surplus Deficit 997 585 -221 -442 29.5 55.7 1709 2005 179 805 3661 3110 3107 1300 1146
35 1963 Federal Report Surplus Deficit 1365 976 -86.2 345 1135 1568 2376 2008 298 -151 -565 2371 4024 1934 1396
36 1964 Federal Report Surplus Deficit 1036 578 412 -424 95.9 -1.58 641 870 -225 617 59.9 3204 6131 4407 1354
37 1965 Federal Report Surplus Deficit 2464 2452 1019 524 838 2624 4626 5378 3849 603 4317 3907 4294 2468 2857
38 1966 Federal Report Surplus Deficit 2390 2270 -9.90 35.4 234 290 1440 1546 271 1221 782 2014 3133 1868 1177
39 1967 Federal Report Surplus Deficit 1168 331 -93.0 -438 -187 714 3105 3186 2347 1055 -446 2658 5149 3507 1742
40 1968 Federal Report Surplus Deficit 1725 1699 361 -66.3 552 325 1898 2511 2564 -703 -795 1872 3976 2214 1426
41 1969 Federal Report Surplus Deficit 1903 2233 1453 644 1616 1149 3903 3936 2584 3185 3652 4539 4011 2486 2641
42 1970 Federal Report Surplus Deficit 829 197 -7.40 -8.69 226 -417 1787 2236 765 -515 -664 2742 4972 1293 1116
43 1971 Federal Report Surplus Deficit 449 292 -347 -330 35.3 147 4255 4666 3748 3017 2682 5111 5793 3995 2511
44 1972 Federal Report Surplus Deficit 2715 3024 558 132 379 622 3662 4207 5409 4395 2159 4498 5700 4116 2947
45 1973 Federal Report Surplus Deficit 2841 3310 713 71.0 381 243 1388 1578 119 -1462 -1667 209 1380 275 653
46 1974 Federal Report Surplus Deficit 339 -184 -302 -406 -157 1315 5225 5119 4709 4136 3644 4007 6021 5087 2868
47 1975 Federal Report Surplus Deficit 2981 3307 635 -510 -148 -295 1615 1804 2287 -48.6 48.2 3118 5504 4609 1817
48 1976 Federal Report Surplus Deficit 1782 1934 803 771 1825 3348 3818 3962 3001 3693 2516 4699 3954 4079 2932
49 1977 Federal Report Surplus Deficit 4030 4980 2494 136 -82.4 -868 -103 -330 -844 -1363 -1579 289 547 -137 351
50 1978 Federal Report Surplus Deficit 310 -28.2 -707 -761 -95.7 276 1239 1284 1228 3182 1099 3018 2447 2451 1054
51 1979 Federal Report Surplus Deficit 1261 1046 1328 160 267 -748 559 -13.6 1283 -329 390 3336 1611 -6.70 752
52 1980 Federal Report Surplus Deficit -69.2 -214 -114 -325 -111 -1157 639 -465 -172 906 1899 4301 4179 1392 790
53 1981 Federal Report Surplus Deficit 103 0.91 92.9 -361 349 1579 3239 3049 499 -1099 -506 3298 5093 3453 1621
54 1982 Federal Report Surplus Deficit 2624 2613 347 -223 635 302 2463 4700 4957 3018 1406 4145 5280 4989 2692
_____________________________________________________________________________________________________________________
2019 Pacific Northwest Loads and Resources Study 59

Federal Report Surplus Deficit By Water Year
2019 White Book Report Date: 3/18/2020 Continued
Operating Year 2022
S184-WB-20191230-103442
Energy-aMW - Surplus Deficit Aug1 Aug16
Sep Oct Nov Dec Jan Feb Mar Apr1 Apr16 May Jun Jul Avg
55 1983 Federal Report Surplus Deficit 2519 3029 1443 677 683 777 2859 3374 3880 2043 931 3417 3876 4006 2437
56 1984 Federal Report Surplus Deficit 2445 2728 743 -45.0 2104 1081 2589 2614 3143 1595 3166 3436 5275 3711 2466
57 1985 Federal Report Surplus Deficit 1977 1144 713 13.7 674 217 917 934 408 1406 1921 2742 1503 254 964
58 1986 Federal Report Surplus Deficit -399 -528 -107 237 1106 411 1902 3350 4392 3198 2791 2599 3714 985 1745
59 1987 Federal Report Surplus Deficit 605 114 -259 -494 505 300 316 -264 888 -222 90.5 3051 1760 -156 501
60 1988 Federal Report Surplus Deficit -119 -308 -333 -428 -204 -1251 -1446 -723 -374 -870 -306 510 1582 980 -207
61 1989 Federal Report Surplus Deficit 326 115 -171 -417 45.9 -221 -662 -1431 1118 948 3519 2749 1651 551 482
62 1990 Federal Report Surplus Deficit 10.0 33.9 -150 -287 333 779 1485 2638 1790 1097 2895 2654 3842 1985 1413
63 1991 Federal Report Surplus Deficit 1570 1596 -149 -457 2001 1280 3105 2721 1925 1601 1118 2884 3740 3802 1979
64 1992 Federal Report Surplus Deficit 2535 1973 -58.7 -466 48.7 -1189 -141 -61.4 179 -916 -650 2344 1237 -227 265
65 1993 Federal Report Surplus Deficit 10.1 -99.7 -459 -436 -25.9 -752 -1032 -1617 434 -205 -1023 3717 2797 1221 279
66 1994 Federal Report Surplus Deficit 329 482 -87.5 -291 183 -646 -1010 -234 -404 -808 259 1588 1505 762 126
67 1995 Federal Report Surplus Deficit 190 -71.9 -242 -382 -375 -696 459 1339 2045 190 -903 2806 3999 2093 893
68 1996 Federal Report Surplus Deficit 864 534 379 626 2701 4644 4867 5144 5098 3364 4164 3856 4382 3881 3327
69 1997 Federal Report Surplus Deficit 2303 2198 365 -165 564 1217 5109 5250 5177 3884 4361 5425 5600 4215 3251
70 1998 Federal Report Surplus Deficit 2344 3114 1359 2135 1477 215 1007 2448 1112 -325 -468 4700 4868 2358 2000
71 1999 Federal Report Surplus Deficit 1857 1681 -127 -312 -214 1020 3546 3758 4293 1593 2276 3378 4828 4521 2362
72 2000 Federal Report Surplus Deficit 3525 3547 458 -183 2271 1616 1706 1867 1890 2698 3456 3031 1214 1900 1867
73 2001 Federal Report Surplus Deficit 1338 -5.42 -233 -283 -154 -944 -405 -536 -370 -1267 -1567 224 383 101 -245
74 2002 Federal Report Surplus Deficit 397 -117 -678 -842 -210 -272 -820 -250 136 676 2435 2352 4520 3212 738
75 2003 Federal Report Surplus Deficit 567 612 -84.1 -238 97.6 -893 -602 300 1813 375 372 1241 4017 685 605
76 2004 Federal Report Surplus Deficit -419 -235 -606 -383 461 228 -177 -642 289 212 116 1668 2536 686 330
77 2005 Federal Report Surplus Deficit -166 383 663 131 288 529 1155 1774 303 -1067 -803 1752 2283 1074 755
78 2006 Federal Report Surplus Deficit 347 106 -369 -343 457 238 2322 3017 1700 3765 3454 4683 4480 1554 1785
79 2007 Federal Report Surplus Deficit 246 -115 -670 -437 492 308 1753 1127 2913 1661 516 3258 3154 1733 1235
80 2008 Federal Report Surplus Deficit -10.2 -382 -880 -251 330 -468 -60.0 169 442 -112 -684 3586 5753 2964 918
Ranked Averages
81 Bottom 10 pct 444 255 -212 -343 -39.8 -908 -1076 -593 -369 -862 -1216 256 1320 362 -190
82 Middle 80 pct 1204 1036 178 -85.9 414 264 1397 1599 1485 1096 1223 3076 3735 2169 1374
83 Top 10 pct 1963 1773 435 281 1195 2328 4465 4781 4372 3355 3580 4387 4797 3854 3010
_____________________________________________________________________________________________________________________
60 Bonniville Power Administration

Section 5: Pacific Northwest Regional Analysis Exhibits
_____________________________________________________________________________________________________________________
2019 Pacific Northwest Loads and Resources Study 61

THIS PAGE INTENTIONALLY LEFT BLANK
_____________________________________________________________________________________________________________________ 62 Bonniville Power Administration

Exhibit 5-1: Annual Energy
Regional Analysis Surplus Deficit
Operating Year 2021 to 2030 Using 1937-Water Conditions
_____________________________________________________________________________________________________________________
2019 Pacific Northwest Loads and Resources Study
63

THIS PAGE INTENTIONALLY LEFT BLANK
_____________________________________________________________________________________________________________________ 64 Bonniville Power Administration

Energy-aMW 2021 2022 2023 2024 2025 2026 2027 2028 2029 2030
Regional Loads
1 Retail Loads 22895 23252 23528 23616 23731 23825 23909 23960 24050 24130
2 Federal Agency 144 153 153 153 154 154 155 155 155 155
3 USBR 178 178 178 178 178 178 178 178 178 178
4 Cooperative 2311 2384 2470 2537 2570 2586 2601 2613 2630 2645
5 Municipality 2620 2622 2624 2626 2627 2628 2629 2631 2632 2634
6 Public Utility District 4501 4720 4855 4835 4852 4879 4899 4901 4912 4927
7 Investor-Owned Utility 12737 12790 12843 12884 12946 12995 13043 13079 13138 13187
8 Marketer 2.50 2.50 2.50 2.50 2.50 2.50 2.50 2.50 2.50 2.50
9 Direct-Service Industry 401 401 401 401 401 401 401 401 401 401
10 Federal Diversity 0 0 0 0 0 0 0 0 0 0
11 Exports 1288 1142 1049 1018 1018 1018 1018 1018 1016 1014
12 Canada 465 465 465 464 465 465 465 465 465 465
13 East Continental Divide 1.00 1.00 1.00 1.00 1.00 1.00 1.00 1.00 1.00 1.00
14 Inland Southwest 21.6 0 0 0 0 0 0 0 0 0
15 Pacific Southwest 771 655 583 553 552 552 552 552 550 548
16 Other 29.0 21.0 0 0 0 0 0 0 0 0
17 Total Regional Loads 24183 24394 24577 24634 24749 24843 24928 24978 25066 25144
Regional Resources
18 Hydro 11667 11564 11566 11556 11547 11559 11547 11556 11547 11559
19 Regulated Hydro - Net 10391 10298 10300 10292 10281 10293 10281 10292 10281 10293
20 Independent Hydro - Net 1035 1024 1024 1023 1024 1024 1024 1023 1024 1024
21 Small Hydro - Net 242 242 242 241 242 242 242 241 242 242
22 Hon-Hydro Renewable 2163 2166 2166 2166 2167 2166 2166 2164 2160 2159
23 Wind - Net 1811 1814 1814 1813 1814 1814 1814 1811 1807 1807
24 Solar - Net 175 175 175 175 175 175 175 175 175 175
25 Other - Net 177 176 176 178 177 176 176 178 177 176
26 Thermal 13499 13029 12868 13028 12821 12469 12201 12223 12128 12305
27 Nuclear - Net 994 1116 994 1116 994 1116 994 1116 994 1116
28 Coal - Net 4290 3699 3677 3741 3666 3191 3039 2945 2971 3024
29 Natural Gas - Net 5874 5872 5865 5827 5826 5824 5824 5827 5826 5821
30 Petroleum - Net 0 0 0 0 0 0 0 0 0 0
31 Biofuel - Net 25.7 25.7 25.7 25.7 25.7 25.7 25.7 25.7 25.7 25.7
32 Cogeneration - Net 2315 2316 2306 2319 2309 2311 2318 2310 2312 2318
Loads and Resources - Pacific Northwest Region
Operating Year: 2021 to 2030 Water Year: 1937
2019 White Book Report Date: 4/6/2020
S184-WB-20191230-103442
_____________________________________________________________________________________________________________________
2019 Pacific Northwest Loads and Resources Study
65

Energy-aMW 2021 2022 2023 2024 2025 2026 2027 2028 2029 2030
Loads and Resources - Pacific Northwest Region
Operating Year: 2021 to 2030 Water Year: 1937
2019 White Book Report Date: 4/6/2020 Continued S184-WB-20191230-103442
33 Imports 660 580 584 588 591 595 599 603 607 610
34 Canada 38.8 38.8 38.8 38.8 38.8 38.8 38.8 38.8 38.8 38.8
35 East of Continental Divide 0 0 0 0 0 0 0 0 0 0
36 Inland Southwest 491 494 498 502 506 509 513 517 521 525
37 Pacific Southwest 131 47.1 47.1 47.1 47.1 47.1 47.1 47.1 47.1 47.1
38 Other 0 0 0 0 0 0 0 0 0 0
39 Reserves & Losses -831 -812 -807 -812 -806 -796 -787 -788 -785 -791
40 Operating Reserves 0 0 0 0 0 0 0 0 0 0
41 Balancing Reserves 0 0 0 0 0 0 0 0 0 0
42 Transmission Losses -831 -812 -807 -812 -806 -796 -787 -788 -785 -791
43 Total Regional Resources 27158 26527 26376 26526 26320 25993 25725 25758 25656 25842
44 Total Surplus/Deficit 2974 2132 1800 1892 1571 1150 798 780 590 698
_____________________________________________________________________________________________________________________ 66 Bonniville Power Administration
Exhibit 5-2: Monthly Energy
Regional Analysis Surplus Deficit
Operating Year 2022 Using 1937-Water Conditions
_____________________________________________________________________________________________________________________
2019 Pacific Northwest Loads and Resources Study
67

THIS PAGE INTENTIONALLY LEFT BLANK
_____________________________________________________________________________________________________________________
68 Bonniville Power Administration

Energy-aMW Aug1 Aug16 Sep Oct Nov Dec Jan Feb Mar Apr1 Apr16 May Jun Jul Avg
Regional Loads
45 Retail Loads 22852 23070 21021 21030 23860 26182 26163 25236 22911 22044 22044 21575 22207 23897 23252
46 Federal Agency 139 140 130 136 159 186 186 180 156 143 143 135 136 149 153
47 USBR 315 304 263 108 15.3 14.5 10.4 16.3 64.9 244 244 327 353 403 178
48 Cooperative 2423 2447 2161 2060 2362 2668 2621 2533 2254 2212 2212 2259 2446 2602 2384
49 Municipality 2357 2387 2280 2461 2867 3083 3135 3046 2700 2526 2526 2343 2314 2366 2622
50 Public Utility District 4275 4310 4012 4208 4844 5438 5675 5404 4889 4554 4554 4320 4408 4631 4720
51 Investor-Owned Utility 12940 13077 11771 11651 13208 14388 14131 13654 12442 11959 11959 11787 12147 13343 12790
52 Marketer 2.50 2.50 2.50 2.50 2.50 2.50 2.50 2.50 2.50 2.50 2.50 2.50 2.50 2.50 2.50
53 Direct-Service Industry 401 402 401 402 402 402 402 401 401 402 402 401 401 401 401
54 Federal Diversity 0 0 0 0 0 0 0 0 0 0 0 0 0 0 0
55 Exports 1266 1513 1324 1044 1222 1076 705 869 931 1306 1179 1229 1273 1385 1142
56 Canada 531 587 454 454 454 454 454 454 454 454 454 454 454 476 465
57 East Continental Divide 1.00 1.00 1.00 1.00 1.00 1.00 1.00 1.00 1.00 1.00 1.00 1.00 1.00 1.00 1.00
58 Inland Southwest 0 0 0 0 0 0 0 0 0 0 0 0 0 0 0
59 Pacific Southwest 684 876 819 539 716 571 250 414 476 851 724 774 818 908 655
60 Other 50.0 50.0 50.0 50.0 50.0 50.0 0 0 0 0 0 0 0 0 21.0
61 Total Regional Loads 24118 24583 22345 22074 25082 27258 26869 26105 23842 23350 23223 22804 23480 25282 24394
Regional Resources
62 Hydro 11121 11009 9493 10649 12106 12133 11284 10433 10325 10043 9564 12159 16131 13113 11564
63 Regulated Hydro - Net 9831 9726 8299 9609 11198 11182 10491 9576 9277 8521 8025 10176 14101 11565 10298
64 Independent Hydro - Net 1000 995 967 874 778 822 667 723 883 1238 1254 1577 1605 1141 1024
65 Small Hydro - Net 290 288 228 165 131 129 127 135 165 284 285 406 425 408 242
66 Hon-Hydro Renewable 1691 2281 2116 1740 2298 1817 1127 1667 1863 3042 2643 2845 2837 2836 2166
67 Wind - Net 1295 1885 1736 1393 1981 1519 849 1362 1528 2680 2280 2463 2460 2399 1814
68 Solar - Net 218 218 203 168 139 119 111 126 156 185 185 213 223 237 175
69 Other - Net 178 178 178 179 179 179 168 178 179 177 177 168 154 200 176
Loads and Resources - Pacific Northwest Region
Operating Year: 2022 Water Year: 1937
2019 White Book Report Date: 4/7/2020
S184-WB-20191230-103442
_____________________________________________________________________________________________________________________
2019 Pacific Northwest Loads and Resources Study
69
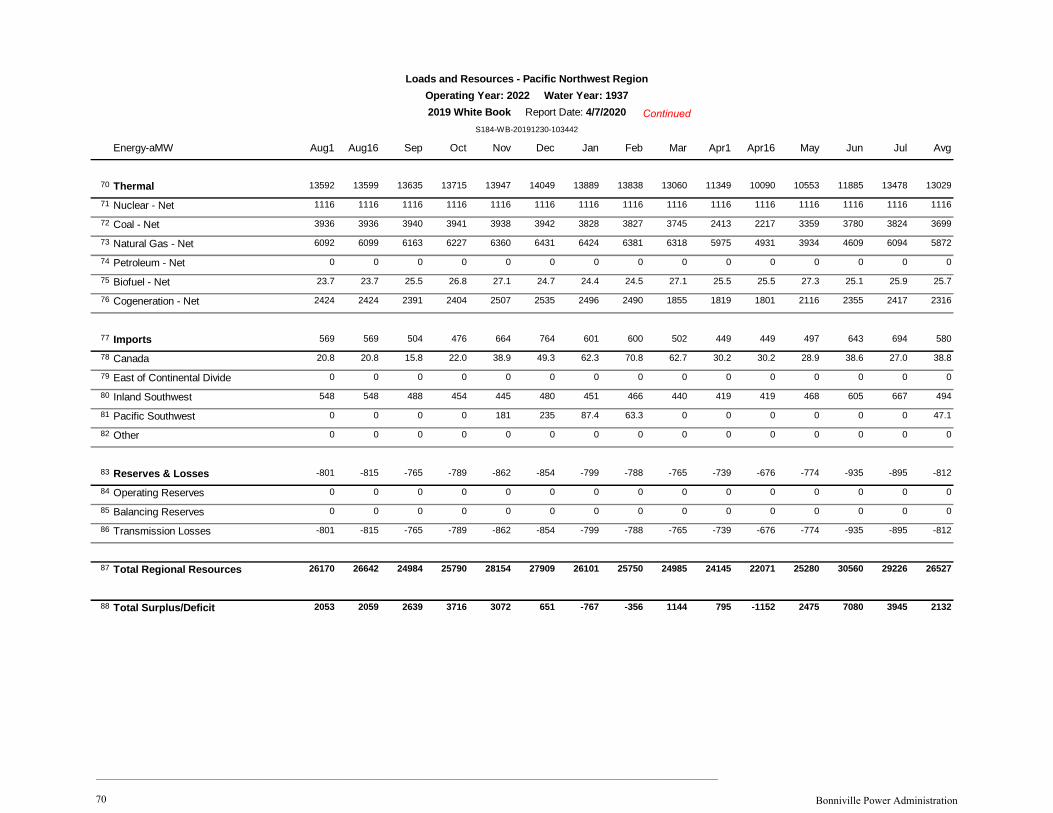
Energy-aMW Aug1 Aug16 Sep Oct Nov Dec Jan Feb Mar Apr1 Apr16 May Jun Jul Avg
Loads and Resources - Pacific Northwest Region
Operating Year: 2022 Water Year: 1937
2019 White Book Report Date: 4/7/2020
S184-WB-20191230-103442
70 Thermal 13592 13599 13635 13715 13947 14049 13889 13838 13060 11349 10090 10553 11885 13478 13029
71 Nuclear - Net 1116 1116 1116 1116 1116 1116 1116 1116 1116 1116 1116 1116 1116 1116 1116
72 Coal - Net 3936 3936 3940 3941 3938 3942 3828 3827 3745 2413 2217 3359 3780 3824 3699
73 Natural Gas - Net 6092 6099 6163 6227 6360 6431 6424 6381 6318 5975 4931 3934 4609 6094 5872
74 Petroleum - Net 0 0 0 0 0 0 0 0 0 0 0 0 0 0 0
75 Biofuel - Net 23.7 23.7 25.5 26.8 27.1 24.7 24.4 24.5 27.1 25.5 25.5 27.3 25.1 25.9 25.7
76 Cogeneration - Net 2424 2424 2391 2404 2507 2535 2496 2490 1855 1819 1801 2116 2355 2417 2316
77 Imports 569 569 504 476 664 764 601 600 502 449 449 497 643 694 580
78 Canada 20.8 20.8 15.8 22.0 38.9 49.3 62.3 70.8 62.7 30.2 30.2 28.9 38.6 27.0 38.8
79 East of Continental Divide 0 0 0 0 0 0 0 0 0 0 0 0 0 0 0
80 Inland Southwest 548 548 488 454 445 480 451 466 440 419 419 468 605 667 494
81 Pacific Southwest 0 0 0 0 181 235 87.4 63.3 0 0 0 0 0 0 47.1
82 Other 0 0 0 0 0 0 0 0 0 0 0 0 0 0 0
83 Reserves & Losses -801 -815 -765 -789 -862 -854 -799 -788 -765 -739 -676 -774 -935 -895 -812
84 Operating Reserves 0 0 0 0 0 0 0 0 0 0 0 0 0 0 0
85 Balancing Reserves 0 0 0 0 0 0 0 0 0 0 0 0 0 0 0
86 Transmission Losses -801 -815 -765 -789 -862 -854 -799 -788 -765 -739 -676 -774 -935 -895 -812
87 Total Regional Resources 26170 26642 24984 25790 28154 27909 26101 25750 24985 24145 22071 25280 30560 29226 26527
88 Total Surplus/Deficit 2053 2059 2639 3716 3072 651 -767 -356 1144 795 -1152 2475 7080 3945 2132
Continued
_____________________________________________________________________________________________________________________ 70 Bonniville Power Administration

Exhibit 5-3: Annual 120-Hour Capacity
Regional Analysis Surplus Deficit
Operating Year 2021 to 2030 Using 1937-Water Conditions
_____________________________________________________________________________________________________________________
2019 Pacific Northwest Loads and Resources Study
71

THIS PAGE INTENTIONALLY LEFT BLANK
_____________________________________________________________________________________________________________________ 72 Bonniville Power Administration

2019 White Book Report Date: 10/5/2020
Loads and Resources - Pacific Northwest Region
Operating Year: 2021 to 2030 Water Year: 1937
S184-WB-20191230-103442
January 120Hr-MW 2021 2022 2023 2024 2025 2026 2027 2028 2029 2030
Regional Loads 1 Retail Loads 33742 34272 34535 34671 34828 34980 35151 35299 35395 355312 Federal Agency 239 252 249 250 252 252 253 253 253 2543 USBR 284 284 284 284 284 284 284 284 284 2844 Cooperative 3631 3711 3835 3916 3956 3983 4008 4033 4057 40815 Municipality 4348 4353 4356 4358 4361 4364 4366 4369 4371 43746 Public Utility District 7393 7734 7772 7775 7811 7855 7881 7908 7929 79477 Investor-Owned Utility 18808 18905 19002 19096 19185 19270 19356 19447 19538 196368 Marketer 2.50 2.50 2.50 2.50 2.50 2.50 2.50 2.50 2.50 2.509 Direct-Service Industry 413 413 413 413 413 413 413 413 413 413
10 Federal Diversity -1375 -1383 -1379 -1424 -1437 -1442 -1413 -1411 -1453 -1460
11 Exports 1352 1143 1143 1143 1143 1143 1143 1143 1143 114312 Canada 1142 1142 1142 1142 1142 1142 1142 1142 1142 114213 East Continental Divide 1.00 1.00 1.00 1.00 1.00 1.00 1.00 1.00 1.00 1.0014 Inland Southwest 0 0 0 0 0 0 0 0 0 015 Pacific Southwest 160 0 0 0 0 0 0 0 0 016 Other 50.0 0 0 0 0 0 0 0 0 0
17 Total Regional Loads 35094 35414 35677 35814 35970 36122 36293 36441 36537 36673
Regional Resources 18 Hydro 21596 21752 21749 21625 21739 21720 21722 21723 21724 2172519 Regulated Hydro - Net 20198 20354 20351 20227 20341 20322 20324 20325 20326 2032720 Independent Hydro - Net 1243 1243 1243 1243 1243 1243 1243 1243 1243 124321 Small Hydro - Net 156 156 156 156 156 156 156 156 156 156
22 Hon-Hydro Renewable 343 343 343 343 343 343 343 343 343 34323 Wind - Net 137 137 137 137 137 137 137 137 137 13724 Solar - Net 0 0 0 0 0 0 0 0 0 025 Other - Net 206 206 206 206 206 206 206 206 206 206
26 Thermal 15100 14973 14941 14941 14941 14138 14138 14138 14138 1413827 Nuclear - Net 1169 1169 1169 1169 1169 1169 1169 1169 1169 116928 Coal - Net 4322 4195 4195 4195 4195 3392 3392 3392 3392 339229 Natural Gas - Net 6825 6825 6793 6793 6793 6793 6793 6793 6793 679330 Petroleum - Net 38.5 38.5 38.5 38.5 38.5 38.5 38.5 38.5 38.5 38.531 Biofuel - Net 30.7 30.7 30.7 30.7 30.7 30.7 30.7 30.7 30.7 30.732 Cogeneration - Net 2715 2715 2715 2715 2715 2715 2715 2715 2715 2715
33 Imports 1180 1059 1062 1065 1068 1071 1075 1078 1081 108534 Canada 155 155 155 155 155 155 155 155 155 15535 East of Continental Divide 0 0 0 0 0 0 0 0 0 036 Inland Southwest 600 604 607 610 613 616 620 623 626 63037 Pacific Southwest 425 300 300 300 300 300 300 300 300 30038 Other 0 0 0 0 0 0 0 0 0 0
39 Reserves & Losses -4093 -4110 -4116 -4114 -4110 -4060 -4065 -4069 -4073 -407740 Operating Reserves -1997 -2017 -2024 -2026 -2019 -1996 -2000 -2004 -2008 -201341 Balancing Reserves -903 -903 -903 -903 -903 -903 -903 -903 -903 -903
_____________________________________________________________________________________________________________________
2019 Pacific Northwest Loads and Resources Study
73

Loads and Resources - Pacific Northwest Region Operating Year: 2021 to 2030 Water Year: 1937
2019 White Book Report Date: 10/5/2020 Continued
S184-WB-20191230-103442
January 120Hr-MW 2021 2022 2023 2024 2025 2026 2027 2028 2029 203042 Transmission Losses -1194 -1190 -1189 -1185 -1189 -1162 -1162 -1162 -1162 -1162
43 Total Regional Resources 34125 34016 33979 33860 33980 33211 33212 33212 33212 33213
44 Total Surplus/Deficit -969 -1398 -1699 -1954 -1990 -2911 -3081 -3229 -3325 -3460
_____________________________________________________________________________________________________________________ 74 Bonniville Power Administration

Exhibit 5-4: Monthly 120-Hour Capacity
Regional Analysis Surplus Deficit Operating Year 2022
Using 1937-Water Conditions
_____________________________________________________________________________________________________________________
2019 Pacific Northwest Loads and Resources Study 75

THIS PAGE INTENTIONALLY LEFT BLANK
_____________________________________________________________________________________________________________________ 76 Bonniville Power Administration

120Hr-MW Aug1 Aug16 Sep Oct Nov Dec Jan Feb Mar Apr1 Apr16 May Jun Jul
Regional Loads
45 Retail Loads 30354 30078 27115 27743 31634 34275 34272 32884 30084 28520 28344 27272 28641 30882
46 Federal Agency 174 174 164 174 207 242 252 235 210 184 184 173 170 182
47 USBR 602 602 527 383 206 277 284 266 365 438 438 527 578 618
48 Cooperative 3222 3222 2945 2986 3363 3777 3711 3563 3262 3197 3197 3125 3233 3418
49 Municipality 3233 3233 3032 3456 3945 4348 4353 4162 3825 3479 3479 3004 3064 3253
50 Public Utility District 5672 5672 5270 5803 6741 7444 7734 7286 6755 6248 6248 5689 5640 5947
51 Investor-Owned Utility 17951 17951 15843 15692 17966 19169 18905 18282 16617 15655 15655 15429 16560 18007
52 Marketer 2.50 2.50 2.50 2.50 2.50 2.50 2.50 2.50 2.50 2.50 2.50 2.50 2.50 2.50
53 Direct-Service Industry 412 412 412 413 412 412 413 412 412 413 413 412 412 412
54 Federal Diversity -914 -1189 -1080 -1166 -1208 -1398 -1383 -1325 -1364 -1095 -1272 -1089 -1018 -957
55 Exports 1724 1809 1663 1354 1346 1346 1143 1143 1143 1143 1151 1151 1460 1481
56 Canada 1203 1288 1142 1142 1142 1142 1142 1142 1142 1142 1142 1142 1142 1163
57 East Continental Divide 1.00 1.00 1.00 1.00 1.00 1.00 1.00 1.00 1.00 1.00 1.00 1.00 1.00 1.00
58 Inland Southwest 0 0 0 0 0 0 0 0 0 0 0 0 0 0
59 Pacific Southwest 420 420 420 111 103 103 0 0 0 0 8.04 8.04 317 317
60 Other 100.0 100.0 100.0 100.0 100.0 100.0 0 0 0 0 0 0 0 0
61 Total Regional Loads 32077 31887 28778 29097 32980 35620 35414 34027 31227 29663 29494 28422 30101 32363
Regional Resources
62 Hydro 22016 21738 20176 20441 22313 23095 21752 21272 20931 19043 18256 21055 25223 23403
63 Regulated Hydro - Net 19988 19720 18287 18725 20713 21542 20354 19896 19239 16954 16142 18613 22702 21212
64 Independent Hydro - Net 1664 1656 1605 1515 1432 1392 1243 1207 1485 1765 1789 1997 2059 1749
65 Small Hydro - Net 365 363 284 201 168 161 156 169 207 324 325 446 463 443
66 Hon-Hydro Renewable 354 354 354 355 354 354 343 355 354 354 354 355 353 353
67 Wind - Net 137 137 137 137 137 137 137 137 137 137 137 137 137 137
68 Solar - Net 0 0 0 0 0 0 0 0 0 0 0 0 0 0
69 Other - Net 217 217 217 218 217 217 206 218 217 217 217 218 216 216
70 Thermal 14630 14630 14723 14866 15017 15103 14973 14920 14231 12550 11732 13672 14060 14506
71 Nuclear - Net 1163 1163 1179 1181 1179 1180 1169 1169 1169 1160 1160 1151 1154 1168
72 Coal - Net 4321 4321 4320 4321 4321 4322 4195 4195 4194 3119 3119 4196 4193 4193
73 Natural Gas - Net 6463 6463 6523 6618 6749 6819 6825 6778 6730 6307 5252 6144 6025 6465
74 Petroleum - Net 38.5 38.5 38.5 38.5 38.5 38.5 38.5 38.5 38.5 38.5 38.5 38.5 38.5 38.5
75 Biofuel - Net 30.7 30.7 30.7 30.7 30.7 30.7 30.7 30.7 30.7 30.7 30.7 30.7 30.7 30.7
76 Cogeneration - Net 2614 2614 2632 2677 2699 2713 2715 2709 2069 1896 2133 2112 2618 2611
77 Imports 925 925 790 731 980 1085 1059 1091 793 697 697 740 998 1078
78 Canada 146 146 146 147 102 124 155 188 213 147 147 147 146 146
79 East of Continental Divide 0 0 0 0 0 0 0 0 0 0 0 0 0 0
80 Inland Southwest 779 779 644 584 578 661 604 603 580 550 550 593 852 932
81 Pacific Southwest 0 0 0 0 300 300 300 300 0 0 0 0 0 0
82 Other 0 0 0 0 0 0 0 0 0 0 0 0 0 0
83 Reserves & Losses -3980 -3963 -3778 -3825 -4061 -4200 -4110 -4037 -3883 -3653 -3547 -3782 -4118 -4085
84 Operating Reserves -1890 -1881 -1746 -1782 -1947 -2057 -2017 -1959 -1846 -1736 -1682 -1758 -1938 -1948
85 Balancing Reserves -903 -903 -903 -903 -903 -903 -903 -903 -903 -903 -903 -903 -903 -903
86 Transmission Losses -1187 -1178 -1129 -1139 -1211 -1240 -1190 -1175 -1134 -1014 -962 -1121 -1277 -1233
87 Total Regional Resources 33945 33685 32266 32568 34603 35437 34016 33601 32426 28991 27493 32039 36516 35256
88 Total Surplus/Deficit 1867 1798 3488 3472 1624 -183 -1398 -426 1199 -672 -2001 3617 6416 2893
Loads and Resources - Pacific Northwest Region
Operating Year: 2022 Water Year: 1937
2019 White Book Report Date: 2/5/2020
S184-WB-20191230-103442
_____________________________________________________________________________________________________________________
2019 Pacific Northwest Loads and Resources Study
77

THIS PAGE INTENTIONALLY LEFT BLANK
_____________________________________________________________________________________________________________________
78 Bonniville Power Administration

Exhibit 5-5: 80-Water Conditions Monthly Energy
Regional Analysis Surplus Deficit
Operating Year 2022
_____________________________________________________________________________________________________________________
2019 Pacific Northwest Loads and Resources Study
79

THIS PAGE INTENTIONALLY LEFT BLANK
_____________________________________________________________________________________________________________________ 80 Bonniville Power Administration

Regional Report Surplus Deficit By Water Year
2019 White Book Report Date: 3/18/2020
Operating Year 2022
S184-WB-20191230-103442
Energy-aMW - Surplus Deficit Aug1 Aug16
Sep Oct Nov Dec Jan Feb Mar Apr1 Apr16 May Jun Jul Avg
1 1929 Regional Report Surplus Deficit 4031 3990 3602 3655 3887 903 249 1095 1701 218 -740 2526 8565 2428 2696
2 1930 Regional Report Surplus Deficit 2133 1995 3301 3618 3022 404 -398 1468 1659 1252 -542 2797 4377 3971 2220
3 1931 Regional Report Surplus Deficit 2249 2076 3154 3487 3202 616 -153 800 1877 692 -1224 2835 3760 3302 2071
4 1932 Regional Report Surplus Deficit 2417 1731 3135 3160 2790 664 1074 -965 5223 5866 7478 9934 10534 6860 4288
5 1933 Regional Report Surplus Deficit 4229 3777 3889 3344 4137 4308 6013 6032 5726 4136 1657 7219 13589 11716 6072
6 1934 Regional Report Surplus Deficit 7609 6882 4637 5429 9077 10709 11196 10767 9712 10005 7173 7763 8338 3077 8026
7 1935 Regional Report Surplus Deficit 1940 2298 2670 3272 3585 2518 5674 6151 5524 1710 2342 6848 7109 7155 4549
8 1936 Regional Report Surplus Deficit 5944 2907 3199 3082 3225 638 195 229 2114 1423 5323 10357 10108 5390 3875
9 1937 Regional Report Surplus Deficit 2053 2059 2639 3716 3072 651 -767 -356 1144 795 -1152 2475 7080 3945 2132
10 1938 Regional Report Surplus Deficit 2654 1890 3446 3266 4096 3098 4750 5314 6563 6550 8460 9526 8573 7435 5483
11 1939 Regional Report Surplus Deficit 2672 2281 3524 3265 3340 977 3146 3352 3416 2850 4147 6496 5989 4357 3650
12 1940 Regional Report Surplus Deficit 1776 1922 2905 3482 3624 3072 3217 2708 6171 4308 1714 6768 5547 1875 3693
13 1941 Regional Report Surplus Deficit 1192 1412 2874 3442 3343 1947 1033 1922 2767 641 -1668 2508 4985 3076 2392
14 1942 Regional Report Surplus Deficit 2170 1892 3338 3375 3711 5171 4143 4547 1747 812 1474 4217 10274 8384 4335
15 1943 Regional Report Surplus Deficit 4084 4181 4408 3287 3677 2423 6528 6346 7113 12154 9882 8315 12692 11827 6805
16 1944 Regional Report Surplus Deficit 5085 4011 3913 3906 3203 1053 1382 1453 1279 606 -1758 1475 4118 2383 2347
17 1945 Regional Report Surplus Deficit 2154 1635 2770 3149 2613 583 872 990 1632 302 -1049 5783 10069 3396 2785
18 1946 Regional Report Surplus Deficit 2441 2134 3272 3888 3700 3265 4681 5178 5762 8640 8983 9812 9295 9034 5747
19 1947 Regional Report Surplus Deficit 5502 4822 4146 3412 5332 8076 7877 8549 8047 6585 4730 9063 9758 7915 6909
20 1948 Regional Report Surplus Deficit 3809 3429 4007 8608 7660 5169 7884 7149 5285 5074 6576 11733 13946 9189 7505
21 1949 Regional Report Surplus Deficit 7800 7359 5006 4157 4730 2661 3715 4594 7760 6726 7549 10600 9221 4065 5939
22 1950 Regional Report Surplus Deficit 2060 1701 3098 3565 3940 3513 7924 8575 9132 9333 6427 8262 13145 13206 6996
23 1951 Regional Report Surplus Deficit 7960 7307 4836 6081 8723 8979 10542 12623 10494 10180 7496 9555 9507 10492 9006
24 1952 Regional Report Surplus Deficit 6156 3946 4497 7688 6496 5554 7438 7663 5619 8652 10175 11478 10183 7602 7382
25 1953 Regional Report Surplus Deficit 4183 3534 2914 3916 2914 592 3109 9549 4367 829 577 8077 13522 10870 5334
26 1954 Regional Report Surplus Deficit 4908 4652 4249 3992 5340 4719 7324 8736 7196 5909 3827 9025 11364 12856 7029
27 1955 Regional Report Surplus Deficit 9184 9693 7744 4333 6607 4231 2576 3505 1073 1755 -773 5719 13246 12631 5976
28 1956 Regional Report Surplus Deficit 7361 5475 4201 5215 7791 8393 10489 10144 10383 8804 10756 11593 13345 10170 8984
29 1957 Regional Report Surplus Deficit 6597 6448 4522 4796 4658 5014 4784 3877 6924 8455 4144 12398 13040 5936 6580
30 1958 Regional Report Surplus Deficit 4429 2628 3262 3421 3518 2695 6278 6794 5452 3954 5211 11200 11450 5314 5611
31 1959 Regional Report Surplus Deficit 3945 2560 3460 3835 6475 7219 9783 9453 6652 7778 4875 8031 11521 11002 7234
32 1960 Regional Report Surplus Deficit 6847 7046 9107 10122 9394 6598 6482 6380 5839 10280 6551 7156 10192 7112 7808
33 1961 Regional Report Surplus Deficit 5396 2997 3671 3690 5409 3180 5953 7487 7852 6823 2453 8141 11705 5629 5942
34 1962 Regional Report Surplus Deficit 4307 2860 3261 3451 3736 3029 5574 6026 2830 4922 8684 8179 9043 5474 5066
35 1963 Regional Report Surplus Deficit 4898 3955 3716 4697 6760 6411 6480 7305 3362 2294 -197 6685 10753 6597 5674
36 1964 Regional Report Surplus Deficit 3867 3149 4421 3393 4528 3104 4056 4339 2319 4242 1526 8295 14441 11922 5600
37 1965 Regional Report Surplus Deficit 7201 6830 5855 5315 5790 8659 10890 12487 10317 4483 9753 9882 10752 7941 8480
38 1966 Regional Report Surplus Deficit 6906 6567 3979 4334 4701 3549 5159 5160 3560 5722 2971 6296 9042 6715 5297
39 1967 Regional Report Surplus Deficit 4133 2700 3689 3321 3734 4806 8347 8614 7445 4826 473 7732 13142 10177 6409
40 1968 Regional Report Surplus Deficit 5551 5206 4334 4534 5430 3846 6480 7902 8220 1043 -951 5925 11016 7659 5888
41 1969 Regional Report Surplus Deficit 5771 6568 6871 5948 7778 5619 9531 9522 7599 9259 9076 11086 10852 7913 8156
42 1970 Regional Report Surplus Deficit 4168 2664 3736 4010 4475 2336 6211 7014 4260 1452 -642 7753 12000 5774 5098
43 1971 Regional Report Surplus Deficit 3181 2678 3206 3965 3577 3318 10521 11699 10405 9009 7100 11630 14292 11764 7922
44 1972 Regional Report Surplus Deficit 7901 7900 4872 4707 5242 4418 9590 10920 14134 11998 6368 10842 14339 11687 8976
45 1973 Regional Report Surplus Deficit 8143 8532 5397 4532 4976 4148 5178 5347 2843 528 -1956 2783 5408 3375 4299
46 1974 Regional Report Surplus Deficit 2460 1426 3544 3328 3598 5836 12706 12739 12251 10552 9009 10080 14603 13415 8624
47 1975 Regional Report Surplus Deficit 8384 8521 5046 3360 3989 3026 5966 6275 7071 2924 1746 8763 13233 12578 6683
48 1976 Regional Report Surplus Deficit 5822 6140 5413 6201 8297 10329 9995 10055 8523 9703 6605 11036 10823 11352 8844
49 1977 Regional Report Surplus Deficit 9953 11123 8654 4269 3744 1184 1830 1639 1210 194 -2227 2186 3053 1875 3275
50 1978 Regional Report Surplus Deficit 2045 1507 2554 2244 3173 3820 4649 4657 5046 8778 3865 8479 7795 8031 4879
51 1979 Regional Report Surplus Deficit 4645 4306 6722 4342 4479 1614 2986 2763 5467 1458 1589 8143 6266 3135 4334
52 1980 Regional Report Surplus Deficit 1824 1748 3359 3293 3297 1155 3545 2277 2578 4394 5389 10449 11043 5924 4471
53 1981 Regional Report Surplus Deficit 2275 2170 3796 3246 4753 7015 8333 8660 3727 211 176 8073 12037 9437 5944
54 1982 Regional Report Surplus Deficit 6927 6676 4290 3799 5332 3929 6937 11697 12261 8629 4426 10128 12645 12934 8086
_____________________________________________________________________________________________________________________
2019 Pacific Northwest Loads and Resources Study
81

Regional Report Surplus Deficit By Water Year
2019 White Book Report Date: 3/18/2020 Continued
Operating Year 2022
S184-WB-20191230-103442
Energy-aMW - Surplus Deficit Aug1 Aug16
Sep Oct Nov Dec Jan Feb Mar Apr1 Apr16 May Jun Jul Avg
55 1983 Regional Report Surplus Deficit 7138 7708 6469 5604 5592 5073 8484 9317 10537 6790 3304 8967 10437 11203 7845
56 1984 Regional Report Surplus Deficit 7186 7324 5100 4231 8833 5431 8218 7655 8726 5470 6738 8312 12675 10283 7731
57 1985 Regional Report Surplus Deficit 6183 4391 5171 4338 5948 3417 3963 4170 3617 5539 5035 7906 6293 3519 4905
58 1986 Regional Report Surplus Deficit 1420 1230 3630 4789 6804 3686 6454 9009 11751 9047 6737 7528 9981 4827 6445
59 1987 Regional Report Surplus Deficit 3258 2301 3390 3766 4721 3461 2932 2331 4938 2018 1843 7702 5823 2454 3862
60 1988 Regional Report Surplus Deficit 1602 1330 3682 3034 2567 88.1 111 725 1814 719 871 2893 5867 4598 2306
61 1989 Regional Report Surplus Deficit 2263 1818 3052 3688 3728 2336 1224 -381 4656 4605 8404 7654 6554 4337 3803
62 1990 Regional Report Surplus Deficit 2262 2123 3445 3401 5039 4989 5944 7386 6299 5060 6795 7325 10386 7241 5780
63 1991 Regional Report Surplus Deficit 5114 4999 3499 3699 8696 5505 7956 8006 6667 6114 3687 7660 10139 10740 6869
64 1992 Regional Report Surplus Deficit 7108 5852 3544 2958 4006 789 2121 2528 2991 493 -576 5827 4293 1881 3120
65 1993 Regional Report Surplus Deficit 1556 1391 3175 3057 3076 802 349 -524 3331 2158 -878 8950 8140 5317 3172
66 1994 Regional Report Surplus Deficit 3209 2749 3407 3587 3371 1310 704 1684 2078 868 2410 5114 5384 3955 2938
67 1995 Regional Report Surplus Deficit 2042 1595 3060 3586 2631 1805 3348 5517 7066 3082 -779 7616 10805 7008 4612
68 1996 Regional Report Surplus Deficit 4172 2818 4186 5353 10148 12251 12074 13179 13053 9694 10048 9903 11323 10563 9593
69 1997 Regional Report Surplus Deficit 6651 6244 4423 3893 5421 5685 12198 12643 13135 10342 10245 12268 13859 11828 9322
70 1998 Regional Report Surplus Deficit 7124 8112 6840 9223 7464 3939 5042 7295 5360 2410 524 10825 12247 7517 7070
71 1999 Regional Report Surplus Deficit 5506 5594 3574 4071 3372 5503 9433 9725 11093 6335 6189 8866 12677 12352 7703
72 2000 Regional Report Surplus Deficit 9262 8936 4613 3921 9051 6648 5858 6029 6148 8115 8421 8075 6095 6520 6696
73 2001 Regional Report Surplus Deficit 4558 2442 3263 3413 3160 680 906 1034 1496 475 -2059 2413 3099 2432 2055
74 2002 Regional Report Surplus Deficit 2089 1393 2456 1950 2679 2330 1575 2035 2808 3787 5921 6864 11362 9577 4190
75 2003 Regional Report Surplus Deficit 3718 2991 3391 3203 3631 854 1486 3080 6019 2967 2012 4412 9880 3911 3803
76 2004 Regional Report Surplus Deficit 962 1271 2980 3290 4179 3002 2135 1236 3023 2497 1528 5114 7636 4365 3349
77 2005 Regional Report Surplus Deficit 1666 2676 5030 4188 4598 4039 4470 5249 2985 140 -800 5188 7167 4865 4128
78 2006 Regional Report Surplus Deficit 2407 1961 3446 3244 3968 3113 7458 7952 5886 9332 7805 10542 11553 5689 6110
79 2007 Regional Report Surplus Deficit 2755 1833 2973 3014 5158 3606 5749 4742 8877 6038 2197 8035 8548 6043 5266
80 2008 Regional Report Surplus Deficit 2219 1305 2513 3217 3696 1963 2149 2421 3381 2059 -344 8575 13564 9212 4450
Ranked Averages
81 Bottom 10 pct 2863 2414 3304 3534 3182 793 295 1018 1717 675 -1034 2490 5231 3267 2277
82 Middle 80 pct 4443 3982 4104 4067 4824 3627 5179 5630 5630 4777 3705 8024 10033 7312 5570
83 Top 10 pct 6191 5518 4666 5012 6876 8069 11060 11849 11536 9469 8785 10645 12319 10931 8979
_____________________________________________________________________________________________________________________
82 Bonniville Power Administration


BONNEVILLE POWER ADMINISTRATION DOE/BP-4968 ▪ October 2020