2019 state of the homeless address - ahomewithhope.org · andy taft, business community...
TRANSCRIPT

2019
State of the Homeless AddressMarch 21, 2019
Fort Worth, TX
The Honorable Beth Van Duyne
Regional Administrator
US Department of Housing and
Urban Development

Mayor Betsy Price
City of Fort Worth

Thank You CoC Board MembersLEADERSHIP COUNCIL
Mayor Betsy Price, City of Fort Worth
Mayor Jeff Williams, City of Arlington
Judge Glen Whitley, Tarrant County
Mayor Brian Johnson, Tarrant County Mayor’s Council
Judge Pat Deen, Parker County
MEMBERSHIP COUNCIL
CHAIR- Dr. Victoria Farrar-Myers, City of Arlington
VICE-CHAIR- Toby Owen, Nonprofit representative
SECRETARY- James Tapscott Consumer Representative
Jerome Johnson, Neighborhood representative
Tori Sisk, School District representative
TD Smyers, United Way of Tarrant County representative
Steve Montgomery, Business community representative
Andy Taft, Business community representative
Dierdre Brown, MHMR representative
Naomi Byrne, Affordable Housing Developer representative
Judge Brent Carr, Criminal Court representative
Dr. Bill Coppola, Higher education representative
Chief Joel Fitzgerald, Law enforcement representative
Pat Jacob, Mayor’s Council representative
Mary-Margaret Lemons, Fort Worth Housing Solutions representative
Andy Miller, Foundation representative
Robyn Michalove, Faith-based representative
Tara Perez, City of Fort Worth representative
Paula Robinson, Parker County representative
Scott Rule, JPS Health Network representative
Shannon Sprigg, Workforce Solutions representative
Cassandra Walker, Consumer representative
Patricia Ward, Tarrant County representative
Norbert White, Nonprofit representative
Artie Williams, VA representative
Gage Yager, Affordable housing developer representative
Jason Hall, Immediate Past Chair, ex-officio member
Debby Kratky, TCHC Board Chair, ex-officio member
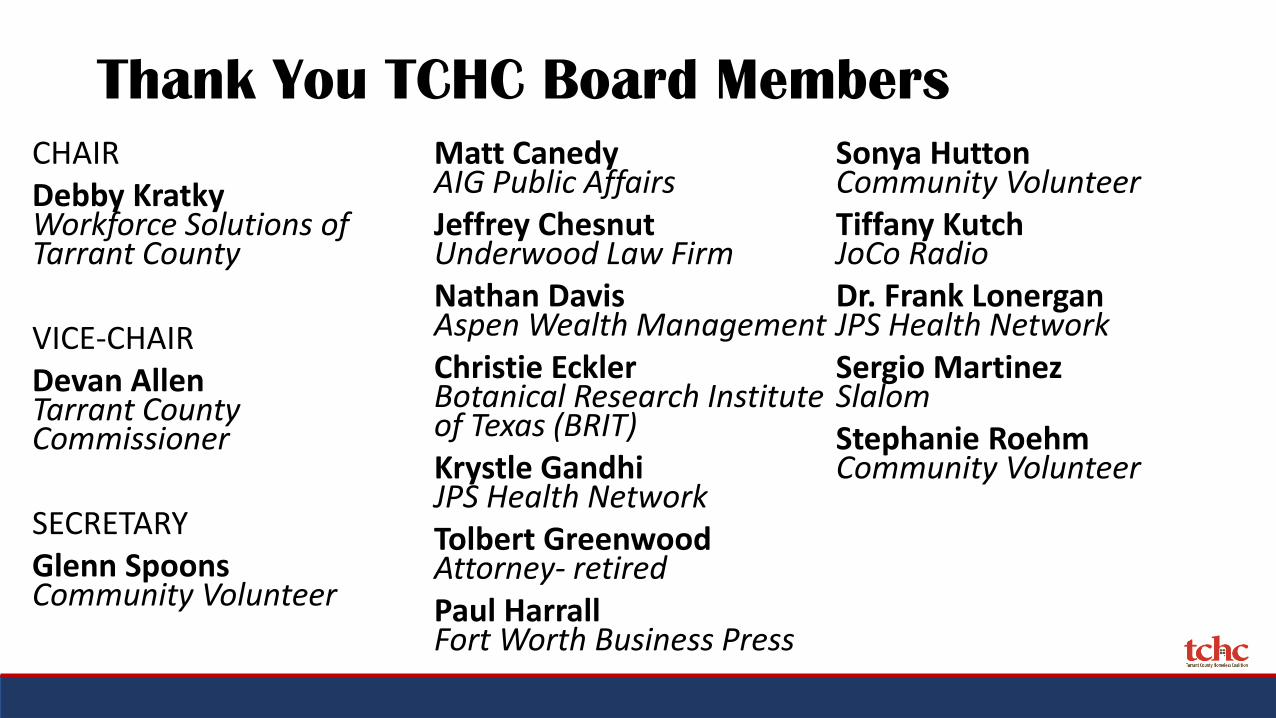
Thank You TCHC Board Members
CHAIRDebby KratkyWorkforce Solutions of Tarrant County
VICE-CHAIRDevan AllenTarrant County Commissioner
SECRETARYGlenn SpoonsCommunity Volunteer
Matt CanedyAIG Public AffairsJeffrey ChesnutUnderwood Law FirmNathan DavisAspen Wealth ManagementChristie EcklerBotanical Research Institute of Texas (BRIT)Krystle GandhiJPS Health NetworkTolbert GreenwoodAttorney- retiredPaul HarrallFort Worth Business Press
Sonya HuttonCommunity VolunteerTiffany KutchJoCo RadioDr. Frank LonerganJPS Health NetworkSergio MartinezSlalomStephanie RoehmCommunity Volunteer
Where We Are…
• 2019 Point In Time Count
• 2019 Point In Time Count Results
• 2019 Homeless Crisis Response System of Care

Point In Time Count- January 24, 2019
Why do we count?• To know the nature and extent of Literal
Homelessness
• Measure success and identify gaps
• Plan for improvements and solutions
• Federal requirement to support nearly $20million in funds
Where does the data come from?• Unsheltered: Volunteer Surveys
• Emergency Shelter and Transitional Housing-HMIS
Counting Effort:• Tarrant and Parker Counties
• 567 Volunteers
• Over 100 Law Enforcement Officers
• 5 Deployment Areas
• New App- Outreach Grid Mapping Tool and Survey

Point in Time Count: 2019 Results
Unsheltered (UN)
EmergencyShelter
(ES)
SafeHaven(SH)
TransitionalHousing
(TH)Total
AnnualChange
2019 560 1,263 20 185 2028 +0.6%2018 678 1,228 20 89 2,015 +5%2017 390 1,294 20 220 1,924 -0.70%2016 423 1,088 20 407 1,938 +1.25%2015 217 1,245 20 432 1,914 -21.07%

Persons Counted Experiencing Homelessness
in any given day
217
423 390
678560
1,697
1,515 1,534
1,3371,468
2015 2016 2017 2018 2019
Unsheltered Total Shelter
17.4%
Reduction
Unsheltered
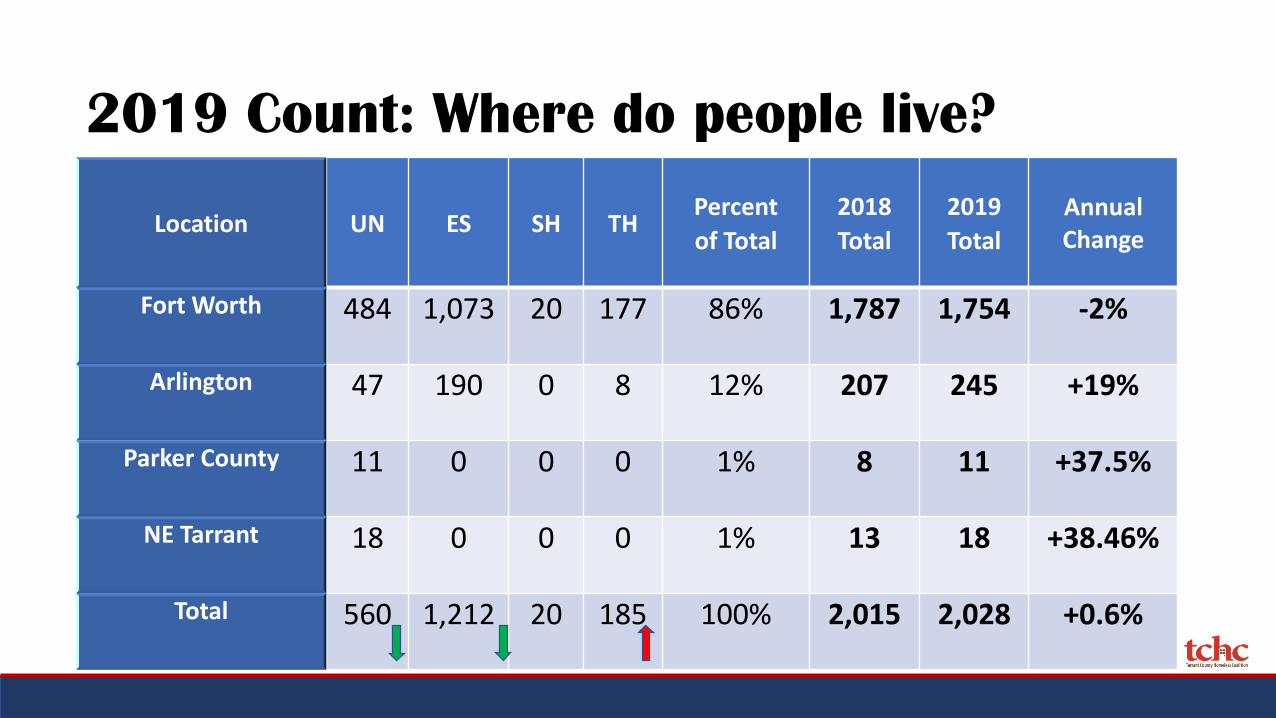
2019 Count: Where do people live?
Location UN ES SH THPercent
of Total
2018
Total
2019
Total
AnnualChange
Fort Worth 484 1,073 20 177 86% 1,787 1,754 -2%
Arlington 47 190 0 8 12% 207 245 +19%
Parker County 11 0 0 0 1% 8 11 +37.5%
NE Tarrant 18 0 0 0 1% 13 18 +38.46%
Total 560 1,212 20 185 100% 2,015 2,028 +0.6%

Unsheltered by Geography
0
100
200
300
400
500
600
700
2013 2014 2015 2016 2017 2018 2019
Fort Worth Arlington
Parker County NE Tarrant

2019 Count: Who is homeless?
36% FEMALE
49% WHITE
12% DOMESTIC
VIOLENCE
18% MENTAL
ILLNESS & SUBSTANCE
ABUSE
21% FAMILIES
15% CHILDREN
8% VETERANS
15% CHRONIC
64% MALE

1. Loss of job/unemployment/lack of income
2. Inability to pay rent
3. Substance Abuse / Domestic Violence
Why are people homeless?

Lack of Income
Hourly Wages 1 Adult1 Adult
1 Child
1 Adult
2 Children2 Adults
2 Adults
1 Child
2 Adults
2 Children
2 Adults
3 Children
Living Wage$11.75 $23.84 $27.44 $9.47 $13.00 $14.99 $17.45
Poverty Wage$5.84 $7.91 $9.99 $3.96 $5.00 $6.03 $7.07
Minimum Wage$7.25 $7.25 $7.25 $7.25 $7.25 $7.25 $7.25
Homelessness is a math problem.
$7.25 x 40= $1,160 – $160 taxes = $1,000 gross x .30 = $300 recommended for housing
DISABLED OR ELDERLY may find themselves relying on Social Security Income averaging $750 per month which leaves them spending over 80% of their monthly income on housing alone.
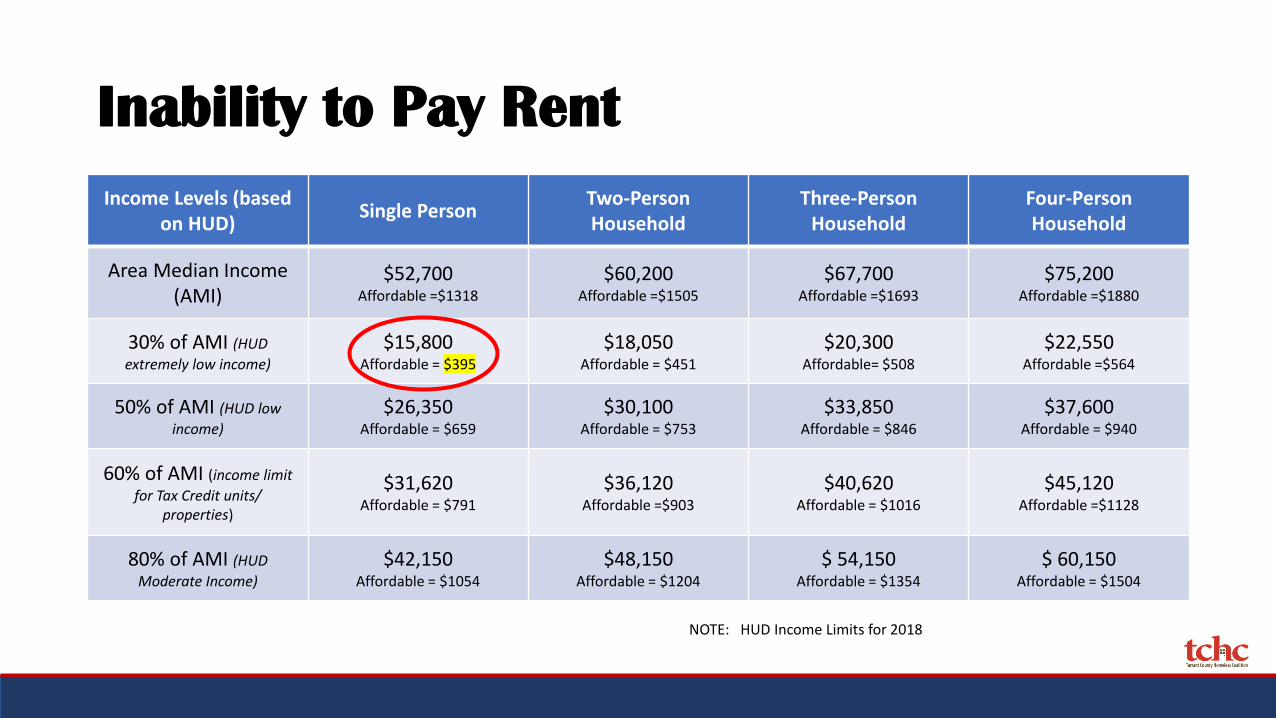
Inability to Pay Rent
Income Levels (based on HUD)
Single PersonTwo-PersonHousehold
Three-PersonHousehold
Four-Person Household
Area Median Income (AMI)
$52,700Affordable =$1318
$60,200Affordable =$1505
$67,700Affordable =$1693
$75,200Affordable =$1880
30% of AMI (HUD
extremely low income)
$15,800Affordable = $395
$18,050 Affordable = $451
$20,300Affordable= $508
$22,550Affordable =$564
50% of AMI (HUD low
income)
$26,350Affordable = $659
$30,100Affordable = $753
$33,850Affordable = $846
$37,600Affordable = $940
60% of AMI (income limit
for Tax Credit units/ properties)
$31,620Affordable = $791
$36,120Affordable =$903
$40,620Affordable = $1016
$45,120Affordable =$1128
80% of AMI (HUD
Moderate Income)
$42,150Affordable = $1054
$48,150Affordable = $1204
$ 54,150Affordable = $1354
$ 60,150Affordable = $1504
15
NOTE: HUD Income Limits for 2018

Where We Are Going…
• Shared Community Vision
• CoC Mission
• Shared Community Values
• Shared Community Competencies

COMMUNITY VISION

COMMUNITY MISSION

COMMUNITY VALUES
EMPOWERING
COMPASSIONATE
INTENTIONAL
ENSURING DIGNITY
INNOVATION

COMMUNITY COMPETENCIES
HOUSING FIRST
TRAUMA INFORMED
STRENGTHS BASED
CLIENT CENTERED
CULTURALLY COMPETENT

How We Are Going To Get There…
• Continuum of Care Strategic Plan

Community Wide Strategic Goals
Effective Response
System
• Build an effective and efficient housing crisis
system of care.
Data Driven Solutions
• Better understanding of scope and need
through data analysis and data sharing.
Housing Focused
• Ensure adequate housing stock and access for
those experiencing
homelessness.
Engaged Community
• Increase knowledge and
community response around
the issue of homelessness.
Committed Resources
• Maximize resources by
strengthening commitment to
support community
members at risk of or
experiencing homelessness.

Goal 1- Build
an effective
and efficient
housing
crisis
system of
care.
Identify and target priority populations.
Pinpoint and engage in targeted interventions.
Implement streamlined services.
Ensure capacity to deliver best practices.

2019 Homeless Crisis Response System of
Care
24
8 agencies9 programs
1,039 served 1 agency1 program554 served
6 agencies6 programs
5,547 served
8 agencies19 programs1,604 beds
9,599 served
7 agencies7 programs178 beds
392 served
14 agencies23 programs
990 beds2,293 served
11 agencies29 programs1,713 beds
1,549 served3 agencies7 programs222 beds
250 served
58 agencies | 101 programs | 4,707 beds | 21,223 servedTOTALS
RAPID EXIT
2019

Proposed Population Focus Timeline
• 2018 Priority
Veterans• 2019 Priority
Youth• 2020-21 Priority
Chronic• 2022-23 Priority
Families
All Homelessness decrease by 2025

2018 ACCOMPLISHMENTS• Successful 100-in-100 Challenge: Exceeded goal and housed 181• Enhanced integration with Coordinated Entry Process• Created CoC-wide Veteran Policies & Procedures• Targeted Housing Blitz for Veterans
UN ES SH TH Rate2018Total
2019Total
AnnualChange
Veterans 32 61 0 74 8% 159 167 5%
2019 GOALS• Fine tune reports to measure community progress towards USICH benchmarks• Support on-going efforts of Veteran’s Leadership Committee• Declare end to veterans homelessness
Priority Population Success Story: Veterans

Goal 2: Better
understanding
of scope and
need through
data analysis
and data
sharing.
Increase thoughtful and deliberate analysis of key data points to provide more objective perspective for partners and stakeholders.
Expand external partnerships for increased data sharing.
Cross-sector data sharing.
Implement cross-systems analysis for accurate analysis of resource utilization.

•3 to 6 times more likely to become sick•36% shorter life expectancy
• Life expectancy for people who are housed = 78 years• Life expectancy for people who are homeless = 50 years
•Disproportionate rate of health problems, chronic conditions•Poor health causes homelessness OR homelessness
causes poor health
Health of the homeless

Cross System Analysis Success Story:
Pathways to Housing
• Permanent Supportive Housing program which began in November of 2015
• Provides rental assistance, case management, and supportive services for chronically homeless high utilizers of the JPS Emergency Room
• Collaborative Partnership: Tarrant County, JPS, The Salvation Army, Amerigroup
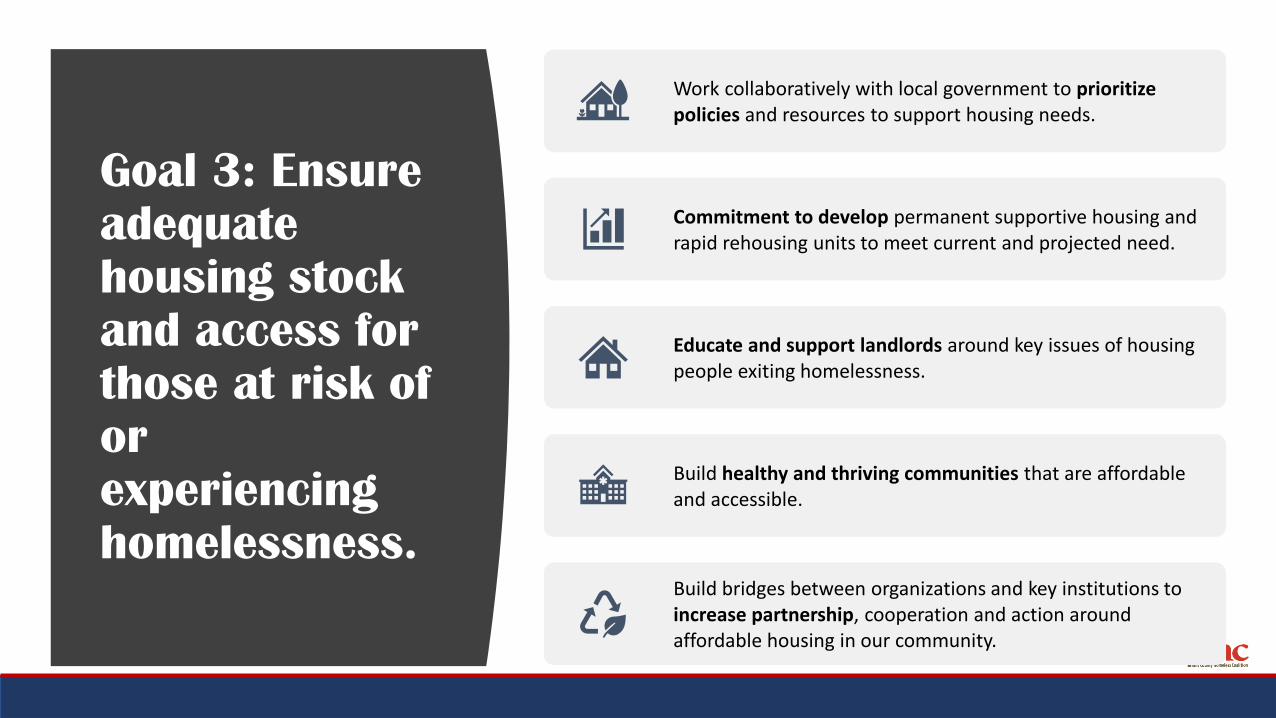
Goal 3: Ensure
adequate
housing stock
and access for
those at risk of
or
experiencing
homelessness.
Work collaboratively with local government to prioritize policies and resources to support housing needs.
Commitment to develop permanent supportive housing and rapid rehousing units to meet current and projected need.
Educate and support landlords around key issues of housing people exiting homelessness.
Build healthy and thriving communities that are affordable and accessible.
Build bridges between organizations and key institutions to increase partnership, cooperation and action around affordable housing in our community.

Lack of Affordable Housing
Income Level Number of Renter Units Affordable to this Income Level
Number of Renter Households at this Income Level
Gap / Number of Affordable Rental Units Needed
0-30% AMI 21,512 62,214 (40,702)
30%-50% AMI 73,100 43,504 29,596
50-80% AMI 135,155 119,863 15,292
31
Source: National Low Income Housing Coalition: 2012-2016 5yr ACS PUMS
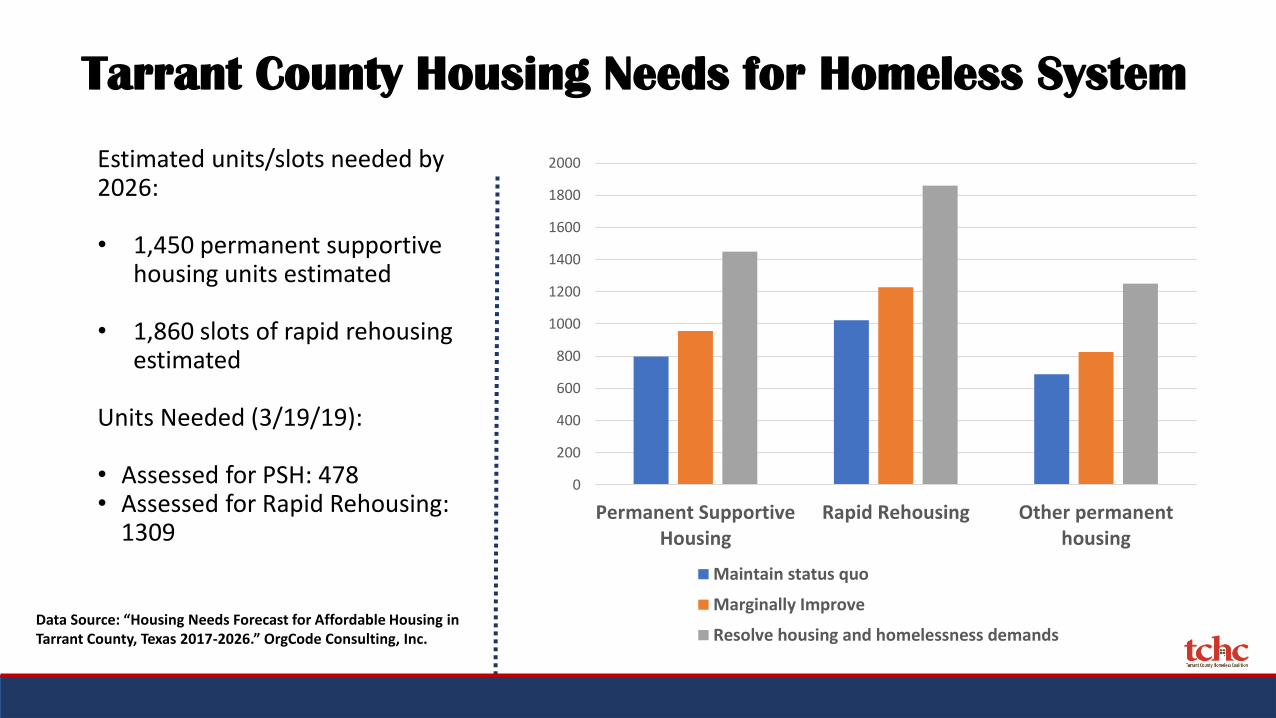
Data Source: “Housing Needs Forecast for Affordable Housing in Tarrant County, Texas 2017-2026.” OrgCode Consulting, Inc.
Estimated units/slots needed by 2026:
• 1,450 permanent supportive housing units estimated
• 1,860 slots of rapid rehousing estimated
Units Needed (3/19/19):
• Assessed for PSH: 478• Assessed for Rapid Rehousing:
1309
Tarrant County Housing Needs for Homeless System
32
0
200
400
600
800
1000
1200
1400
1600
1800
2000
Permanent SupportiveHousing
Rapid Rehousing Other permanenthousing
Maintain status quo
Marginally Improve
Resolve housing and homelessness demands

Goal 4:
Increase
knowledge and
community
response
around the
issue of
homelessness.
Increase the capacity of partners and stakeholders so they can influence the conversation around homelessness.
Strengthen engagement to increase the community’s understanding of the issue.
Mobilize the community to create reasonable, viable solutions.
Engaged and informed leaders.
Intentional Calls to action.

Ending homelessness is a community effort!

Race and Housing
35%
54%
67%
56%
16%
62%
44%
32%
43%
49%
16%
11%
18%
9%
28%
UN
ES
RRH
PSH
TC POP
Black / African American White Hispanic

•Homelessness is expensive…housing is not!
•Average day in jail = $70•Average day in emergency shelter = $48•Average day in permanent housing = $25
The cost to our community
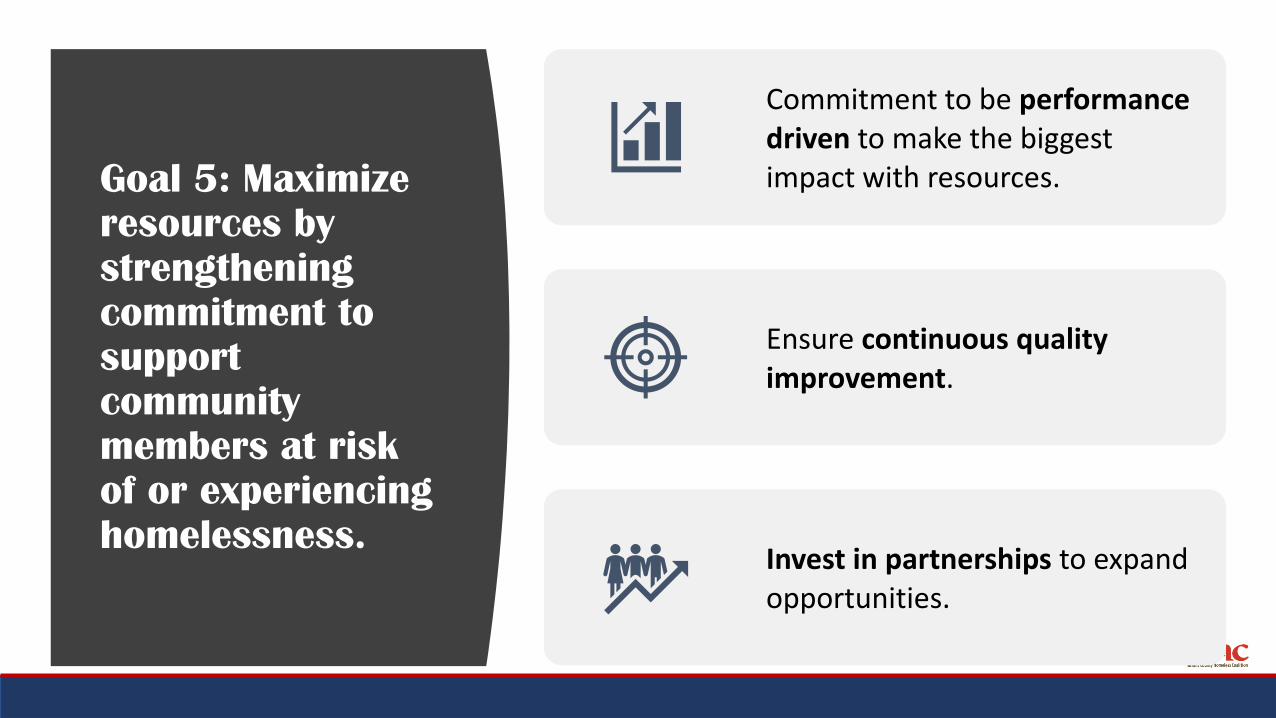
Goal 5: Maximize
resources by
strengthening
commitment to
support
community
members at risk
of or experiencing
homelessness.
Commitment to be performance driven to make the biggest impact with resources.
Ensure continuous quality improvement.
Invest in partnerships to expand opportunities.

Where does the money go?
0%
10%
20%
30%
40%
50%
60%
0
2000000
4000000
6000000
8000000
10000000
12000000
14000000
Prevention Diversion Outreach EmergencyShelter
TransitionalHousing
RRH PSH
Total $ %
HUD INVESTMENT

Public Forum
What is working well in our system?
What needs improvement?
Where do you see opportunities?

Council Member
Dr. Victoria Farrar-Myers
City of Arlington
CoC Board Chair