2020 annual financial statements - pepkor
TRANSCRIPT
2020 ANNUAL
FINANCIAL STATEMENTS
CONTENTSApproval of the annual financial statements 01
Secretary certification 02
Report of the directors 03
Audit committee report 07
Independent auditor’s report 15
Consolidated financial statementsConsolidated income statement 23Consolidated statement of comprehensive income 24Consolidated statement of financial position 25Consolidated statement of changes in equity 26Consolidated statement of cash flows 28Summary of accounting policies 29Significant judgements and estimates 45Notes to the consolidated annual financial statements 51
Separate financial statementsSeparate income statement 116Separate statement of comprehensive income 116Separate statement of financial position 117Separate statement of changes in equity 118Separate statement of cash flows 118Notes to the separate annual financial statements 119
Shareholder analysis 131
Corporate information 132
PEPKOR CONSOLIDATED AND SEPARATE ANNUAL FINANCIAL STATEMENTS for the year ended 30 September 2020
01
APPROVAL OF THE ANNUAL FINANCIAL STATEMENTS
The preparation and presentation of the consolidated and separate annual financial statements, and all information included in this report, is the responsibility of the directors. The consolidated and separate annual financial statements were prepared in accordance with the provisions of the South African Companies Act, No. 71 of 2008, as amended (Companies Act) and comply with International Financial Reporting Standards (IFRS). In discharging their responsibilities, the directors rely on the internal controls and risk management procedures applied by management for both the integrity and fairness of these statements, and are satisfied that the controls and procedures are in operation.
Based on the information and explanations provided by management and the internal auditors, the directors are of the opinion that:
� the internal controls are adequate;
� the financial records may be relied upon in the preparation of the annual financial statements;
� appropriate accounting policies, supported by reasonable judgements and estimates, have been applied; and
� the annual financial statements fairly present the results and the financial position of the company and the group.
The annual financial statements are prepared on the going concern basis and nothing has come to the attention of the directors to indicate that the company and the group will not remain a going concern.
These annual financial statements as at 30 September 2020, which appear on pages 03 to 130, have been prepared under the supervision of the chief financial officer, Mr RG Hanekom CA(SA). The consolidated and separate financial statements have been audited by PricewaterhouseCoopers Inc. in compliance with the Companies Act. The annual financial statements of the company and the group were approved by the board on 15 December 2020, and are signed on its behalf by:
LM LOURENSChief executive officer
RG HANEKOMChief financial officer
FOR THE YEAR ENDED 30 SEPTEMBER 2020
PEPKOR CONSOLIDATED AND SEPARATE ANNUAL FINANCIAL STATEMENTS for the year ended 30 September 2020
02
FOR THE YEAR ENDED 30 SEPTEMBER 2020
SECRETARYCERTIFICATION
We certify, in accordance with section 88(2)(e) of the Companies Act, that the company has lodged with the Companies and Intellectual Properties Commission all such returns as are required for a public company in terms of the Act and that all such returns are true, correct and up to date.
Company secretary15 December 2020On behalf of Pepkor Proprietary Limited
PEPKOR CONSOLIDATED AND SEPARATE ANNUAL FINANCIAL STATEMENTS for the year ended 30 September 2020
03
FOR THE YEAR ENDED 30 SEPTEMBER 2020
REPORT OF THEDIRECTORS
Nature of businessThe group is a diversified retailer of significant size and scale operating across four segments. All the retail brands within the segments focus on discount, value and specialised goods and retail clothing, general merchandise, household goods, furniture, appliances, consumer electronics, building materials, cellular products and services and financial services in Angola, Botswana, eSwatini, Lesotho, Malawi, Mozambique, Namibia, Nigeria, South Africa and Zambia.
The four operating segments include the following brands:
Clothing and general merchandiseThis segment includes all clothing, footwear and homeware (CFH) retail brands:
� PEP
� PEP Africa
� Ackermans
� Pepkor Speciality, which includes Rapitrade 141 Proprietary Limited (CODE), Dunns, John Craig (reflected as an asset classified as held for sale), Refinery, Shoe City, Sergeant Pepper Clothing Company Proprietary Limited (S.P.C.C) and Tekkie Town
� Dealz
Other components included in this segment:
� Tenacity Financial Services support the Ackermans and Pepkor Speciality CFH brands in terms of credit sales through store cards to customers.
� The Pepkor central office cost, excluding IT cost, property management cost and internal audit cost, are fully allocated to the clothing and general merchandise segment, on the basis that it represents the dominant segment in the group. Corporate costs are not allocated to individual segments, although all segments enjoy support and services from the central corporate functions.
Furniture, appliances and electronicsThis segment includes the JD Group and Abacus businesses. The JD Group provides value-conscious mass-market customers in southern Africa with the opportunity and means to create a comfortable lifestyle through its diversified retail brands:
� Bradlows
� Russells
� Rochester
� Sleepmasters
� Incredible Connection
� HiFi Corp
Other components included in this segment:
� Connect Financial Solutions provides credit through instalment sale receivables to the furniture, appliances and electronics brands.
� Abacus provides insurance products via its subsidiaries to customers of the JD Group and other group businesses. It was acquired effective 1 December 2019.
Building materials – discontinued operationsThis segment includes The Building Company and comprises retail, wholesale and specialised divisions that serve the full spectrum of the construction industry, including the residential, commercial and industrial markets. The retail brands include:
� BUCO
� Timbercity
� Chipbase
The wholesale division comprises:
� MacNeil
� Cachet
� Brands 4 Africa
� Citiwood
Specialist building material brands, servicing both the retail and wholesale market, include Buchel, W&B Hardware,
PEPKOR CONSOLIDATED AND SEPARATE ANNUAL FINANCIAL STATEMENTS for the year ended 30 September 2020
04
Bildware, B-One, Tiletoria and Floors Direct. The Building Company, which comprises this entire segment, has been classified as a discontinued operation. Refer to note 7 for further detail.
FinTechThis segment includes unique businesses that do not support the Pepkor retail brands’ performance. Rather, these businesses utilise certain parts of the Pepkor retail store footprint to varying degrees in terms of interaction with their respective consumer markets.
� Flash is a technology-driven company committed to adding value to the lives of traders in the informal retail market. Using smart technology, traders are able to offer their customers greater convenience, providing access to mobile data and airtime, prepaid electricity, money transfers and Lotto.
� Capfin SA provides unsecured credit to customers under the Capfin brand. Pepkor commenced funding of the loan book in the prior year on 20 March 2019.
Retail footprintThe group sold its products across a retail footprint consisting of 5 480 (2019: 5 435) stores at 30 September 2020. When discontinued operations and assets classified as held for sale are excluded, the retail footprint equates to 5 254 (2019: 5 182) stores.
Financial reviewThe financial results are set out in the attached annual financial statements.
Effect of the COVID-19 pandemicThe Pepkor group achieved a pleasing performance during a challenging year as COVID-19 and the resultant lockdown protocols exacerbated an already weak consumer retail market.
The effect of the COVID-19 pandemic had a significant impact on the group’s trading performance, as most of our retails stores were not able to trade during the lockdown. This resulted in partial impairment of goodwill and the impairment of indefinite useful life intangible assets. Refer to notes 9 and 10 respectively.
The effect of COVID-19 was further noted in the increase in expected credit losses (ECLs) due to additional risk factors. Provision levels on the Tenacity credit book, which facilitates credit sales in Ackermans and Pepkor Speciality in the clothing and general merchandise segment, were increased to 22% (FY19: 17%), while provision levels on the Connect credit book, which facilitates sales for the furniture, appliances and electronics segment, and the Abacus book increased to 43%
(FY19: 33%). Provision levels on the Capfin unsecured lending credit book, which forms part of the FinTech segment, were increased to 26% (FY19: 15%). Refer to note 31 for further detail.
Impairment of goodwill and intangible assetsFollowing the completion of the impairment assessments, an impairment of R4.8 billion was recognised during the year. The impairment is a result of constrained future growth expectations in PEP Africa, Shoe City, Tekkie Town and Incredible Connection, in addition to an increased weighted average cost of capital. The impairment is allocated to the respective cash-generating units (CGUs) as follows:
� R3.0 billion relates to the Ackermans, Dunns, John Craig, PEP, PEP Africa, Refinery, Shoe City and Tenacity group of CGUs included in the clothing and general merchandise segment;
� R1.6 billion relates to the Tekkie Town CGU, included in the clothing and general merchandise segment;
� R103 million relates to the Incredible Connection CGU included in the furniture, appliances and electronics segment; and
� R35 million relates to the newly acquired CGU, Eezi, included in the FinTech segment.
Refer to notes 9 and 10 for further detail. The effect of the impairments should be excluded from earnings when determining headline earnings per share.
Share capitalThe authorised and issued share capital of the company as at 30 September 2020 is set out in note 21 of the annual financial statements.
The following movements in ordinary shares were recorded during the year:
� The group issued 37.9 million ordinary shares on 27 January 2020, as scrip dividend, as an alternative to receiving a cash dividend.
� On 11 March 2020, shareholders resolved that 172.5 million of the company’s authorised but unissued shares of no par value be placed under the control of the directors with a general authority to allot and issue shares for cash, subject to certain conditions outlined in the resolution. At the time of the issue of the notice of the annual general meeting of shareholders, 172.5 million shares constituted 5% of the issued share capital but, as a consequence of the scrip dividend issue, at the time of the issue of the shares, it constituted approximately 4.95% of the then issued share capital.
REPORT OF THE DIRECTORS continuedfor the year ended 30 September 2020
PEPKOR CONSOLIDATED AND SEPARATE ANNUAL FINANCIAL STATEMENTS for the year ended 30 September 2020
05
Share rightsDuring the course of the year, 15.9 million shares rights (2019: 13.2 million) were granted in terms of the Pepkor Executive Share Rights Scheme (Pepkor Scheme). Refer to note 27.
Corporate activityDiscontinued operations – ZimbabweDuring the latter part of the 2019 financial year, the board decided to exit the group’s Zimbabwe business, under the Power Sales brand. The decision was mainly driven by the increasing difficulty of trading in Zimbabwe as a result of adverse macroeconomic conditions. The sale was concluded and all conditions precedent were met on 30 September 2020. Refer to note 7 for further detail.
Discontinued operations – The Building CompanyThe group entered into a sale and purchase agreement with Cashbuild Limited for the disposal of the entire issued share capital of The Building Company for a total purchase price, including permitted leakages, of R1.2 billion. The transaction will enable the group to streamline its portfolio of businesses and focus on its core business of discount and value retail. Refer to note 7 for further detail.
Assets held for saleThe group decided to dispose of the John Craig business. The business mainly operates in the smart/formalwear sector of the men’s wear market. This sector does not represent a strategic fit with the group’s main business proposition of supplying discounted value-added products to our customers. An active sales plan has been put in place to dispose of these assets and liabilities. Refer to note 20 for further detail.
Bond programmeSubsequent to the approval of the group’s R10 billion domestic medium-term note programme by the JSE Limited on 2 March 2020, senior unsecured floating rate notes amounting to R1 billion were issued on 10 March 2020. The bonds issued consist of R800 million three-year floating rate notes with a coupon rate of three-month JIBAR plus 159 bps and R206 million five-year floating rate notes with a coupon rate of three-month JIBAR plus 174 bps. Refer to note 22.
Interest-bearing loans and borrowings The group benefited from proactive expense management, conservative credit granting, better-than-expected credit book collections, the successful completion of an accelerated book-build and the issue of a bond programme. Refer to note 22 for further detail. The increased cash allowed the following:
� early settlement of the R1.5 billion bridge loan facility that was due for repayment in August 2020; and
� early settlement of R4.0 billion of the total R6.0 billion preference share funding due to mature in May 2022.
The process of refinancing debt due for repayment in 2021, was successfully concluded and implemented on 30 September 2020. This included the refinancing of:
� R5.0 billion in debt due for repayment in May 2021, now repayable in September 2023; and
� R1.0 billion bridge revolving credit facility due to expire in November 2021, now repayable in September 2023.
As part of the same process, debt covenants were amended to create sufficient headroom and enhanced flexibility going forward. Refer to note 31.6 for further detail.
Guarantee to Rand Merchant Bank (RMB) in relation to an investment company During the year, Pepkor advanced a bridge loan facility amounting to R519 million to an investment company, Business Venture Investments 1499 (RF) Proprietary Limited (BVI), to settle the external funding, including guarantee, with RMB, where Pepkor was a guarantor. The group is in the process of negotiating the issuance of an alternative instrument by BVI to Pepkor to replace the bridge loan facility advanced during the year. This enabled BVI to settle its debt with RMB. The group provided for the full exposure relating to the guarantee during the 2018 financial year. Refer to note 31.6 for further detail.
Acquisition of businessesThe group acquired the following businesses during the financial year. Refer to note 29 for further detail:
� Effective 1 December 2019, 100% of the issued share capital of Abacus Holdco Proprietary Limited and its subsidiaries (Abacus) for a purchase price of R183 million. The acquisition has been approved by the relevant regulatory authorities. The Abacus product offering includes life and short-term insurance. Abacus provides insurance products via its subsidiaries to customers of the JD Group and other group businesses.
� Effective 1 March 2020, 100% of the issued share capital of Eezi Global Limited (Eezi) for a purchase price of GBP1. Eezi offers similar products and services to Flash in the European market and is included in the FinTech segment as part of the Flash business.
� Effective 1 June 2020 and 1 September 2020 respectively, the group acquired S.P.C.C. and CODE for a combined purchase price of R46 million. Both entities are retailers of clothing and general merchandise.
The board is of the opinion that these acquisitions present attractive investment opportunities that are aligned with the group’s strategy to grow through value-accretive acquisitions.
REPORT OF THE DIRECTORS continuedfor the year ended 30 September 2020
PEPKOR CONSOLIDATED AND SEPARATE ANNUAL FINANCIAL STATEMENTS for the year ended 30 September 2020
06
DirectorsThe following changes in the directorate occurred during the year:
MJ Harris, an independent non-executive director, resigned on 19 February 2020.
Subsequent to year-end, J Naidoo’s term as chairman of the board of directors came to an end, effective 30 November 2020 and he elected to not continue for another term. The board has appointed WYN Luhabe as the new chairman, effective 1 December 2020.
Particulars of the present directors are provided in note 32.3 of the annual financial statements. None of the directors have long-term services contracts with the company or any of its controlled entities.
Directors’ shareholding The directors’ shareholding was 306 226 659 (2019: 302 518 994) shares. From 1 October 2020 to the date of approval of the company’s consolidated financial statements, there were no dealings by directors in the company’s ordinary shares.
Details of individual direct and indirect holdings are disclosed in note 32.4.
Events subsequent to the reporting dateThe board is not aware of any significant events after the reporting date that will have a material effect on the group’s results or financial position as presented in these financial statements.
Distribution to ordinary shareholdersNo dividends have been declared for the year ended 30 September 2020, in order to preserve cash in the current uncertain economic environment.
Going concernThe board of directors evaluated the going concern assumption as at 30 September 2020, taking into account the current financial position and their best estimate of the cash flow forecasts in terms of their current knowledge and expectations of ongoing developments of the COVID-19 pandemic. They considered it to be appropriate in the presentation of these financial statements.
The cash flows and liquidity projections of the group have been prepared for a period exceeding 12 months from the reporting date and included performing sensitivity analyses based on various scenarios. The group has made substantial progress in reducing net debt, strengthening its financial position. Refer to
note 22. Covenants were renegotiated to create further flexibility into the future. Refer to note 31.6 for further detail.
Litigation reportThe directors are not aware of any legal or arbitration proceedings, including proceedings that are pending or threatened, that may have or had in the recent past, being at least the previous 12 months, a material effect on the group’s financial results. Details of the earn-out dispute with the previous Tekkie Town management is set out in note 30.5.
Corporate governanceThe group complies with the Listings Requirements of the JSE and, in all material respects, with the Code of Corporate Practice and Conduct published in the King IV Report on Corporate Governance™ for South Africa, 2016 (King IV™)*.
AuditorThe group’s auditor, PricewaterhouseCoopers Inc., will continue in office in accordance with section 90(6) of the Companies Act.
SecretaryThe company secretary’s responsibilities are fulfilled by Pepkor Proprietary Limited. The board is satisfied that the company secretarial role is carried out by persons who have the necessary competence, qualifications and experience, and that there is an arm’s-length relationship between the company secretarial function and the board members as required by JSE Listings Requirement 3.84(h).
ClosingThe group achieved exceptional results for the 2020 financial year in a challenging and volatile trading environment. The group’s defensive discount and value market positioning, disciplined focus on customer needs and low cost of doing business proved resilient in tough operating conditions as evidenced through continued market share gains in most of the retail brands. Pepkor’s strong corporate culture and execution ability ensured a swift response to the COVID-19 crises with stores and supply chain reacting very quickly to the challenge. The positive trading performance since the reopening of stores has resulted in unprecedented levels of cash generation. This contributed significantly to the reduction of net debt levels. The Pepkor board and management wish to thank our stakeholders for their continued support.
Business address36 Stellenberg RoadParow Industria7493
Postal addressPO Box 6100 Parow East7501
* Copyright and trade marks are owned by the Institute of Directors in South Africa NPC and all of its rights are reserved.
REPORT OF THE DIRECTORS continuedfor the year ended 30 September 2020
PEPKOR CONSOLIDATED AND SEPARATE ANNUAL FINANCIAL STATEMENTS for the year ended 30 September 2020
07
FOR THE YEAR ENDED 30 SEPTEMBER 2020
AUDIT COMMITTEEREPORT
IntroductionThe audit and risk committee (the audit committee or the committee) is established as a statutory committee in terms of section 94(2) of the Companies Act, No. 71 of 2008, as amended (the Companies Act) and oversees audit and risk matters for Pepkor Holdings Limited and all its subsidiaries (the group), as permitted by section 94(2)(a) of the Companies Act.
The operation of the audit committee is guided by a formal detailed Terms of Reference (ToR) that is in line with the Companies Act, the JSE Listings Requirements, the King Report on Corporate Governance™ for South Africa, 2016 (King IV™) which has been approved by the company’s board. During the period under review, the committee has discharged its responsibilities as required by the ToR.
The committee is pleased to present its report for the financial period ended 30 September 2020.
MembershipThe audit committee consists of three (3) members, who all are independent non-executive directors of the company and are as follows:
Director Designation Date appointed Qualifications
JB Cilliers Chairman 2018 AGM BAcc (Cum laude), BAcc Hons, CA(SA)
SH Müller Member 2018 AGM BAcc, BAcc (Hons), CA(SA), Sanlam EDP, IoD
F Petersen-Cook Member 16 April 2018 BBusSc (Act.Sc.), FIFoA, FASSA, PGDip (MgtPrac), CD(SA), IoDSA (Cert.Dir.)
The nomination committee and the board are satisfied that these members have the required knowledge and experience as set out in section 94(5) of the Companies Act and regulation 42 of the Companies Regulations, 2011. The appointment of committee members will be a matter for consideration by shareholders at the forthcoming annual general meeting (AGM).
The chief executive officer (CEO), chief financial officer (CFO), internal and external auditors, specialist members of the group finance function, the financial directors of the main group businesses, and specialists contributing to combined assurance attended the audit committee meetings by invitation. In addition, the CFO of the controlling shareholder also attended the meetings by invitation. The company secretary of the group acted as the secretary to this committee.
Meeting date Nature of meeting JB Cilliers S Müller F Peterson-Cook
19 November 2019 Scheduled √ √ √
14 February 2020 Scheduled √ √ √
21 May 2020 Scheduled √ √ √
17 September 2020 Scheduled √ √ √
Note: A representative quorum for meetings shall be a majority of members present, which was attained at all meetings.
Meetings of the audit committeeThe committee performs the duties required of it by section 94(7) of the Companies Act by holding meetings with the key role players on a regular basis and by the unrestricted access granted to the external auditor. Audit committee meetings are required to be held at least twice a year in terms of the ToR. During the period under review, until 30 September 2020, the committee held four (4) scheduled meetings. This was augmented by several ad hoc interim meetings with limited agendas to consider specific matters. After financial year-end, the committee held a further scheduled meeting on 17 November 2020, which was attended by all members of the committee. The attendance of the committee members for the period under review is recorded below:
PEPKOR CONSOLIDATED AND SEPARATE ANNUAL FINANCIAL STATEMENTS for the year ended 30 September 2020
08
AUDIT COMMITTEE REPORT continuedfor the year ended 30 September 2020
Responsibilities of the audit committeeThe audit committee has the following specific responsibilities, which must be undertaken in compliance with all applicable legislation, regulations and accounting practices, as amended/introduced from time to time and to ensure the application by the committee of the relevant principles of King IV™:
1. Oversee integrated reporting and, in particular:
� have regard to all known factors and risks that may impact on the integrity of the integrated report;
� review the annual financial statements, interim reports, preliminary or provisional results announcements, summarised integrated information and prospectuses, trading statements and similar documents;
� review the principles, policies and practices adopted in the preparation of the financial statements of the group and ensure that the financial statements of the group and any other formal announcements relating to the financial performance comply with all statutory and regulatory requirements as may be required;
� review the effectiveness of the internal financial controls; and
� in co-operation with the group social and ethics committee, oversee the disclosure of sustainability issues in the integrated report to ensure that it does not conflict with the financial information.
2. Ensure that a combined assurance model is applied to provide a coordinated approach to all assurance activities and, in particular, ensure that the combined assurance received is appropriate to address all the significant risks facing the group. The committee shall also monitor the relationship between the external assurance providers and the group.
3. Review the expertise, resources and experience of the company’s finance function, and satisfy itself annually as to the suitability of the expertise and experience of the CFO.
4. Monitor and review the effectiveness of the internal audit function and, in particular, review and approve the annual internal audit plan, ensure that the internal audit function is subject to an independent quality review, as and when appropriate, and obtain assurance as to whether the internal audit function has adequate resources, skills and qualifications and appropriate access to information to enable it to perform its function effectively.
5. Oversee risk management and, in particular :
� consider financial reporting risks, internal financial controls, fraud risks as they relate to financial reporting, IT risks as they relate to financial reporting and the risk of cybercrime;
� oversee the development and regular review of a policy and plan for risk management and, recommending the same to the board for approval, monitor implementation of the policy and plan by means of risk management systems and processes;
� review the group’s arrangements for its employees to raise concerns, in confidence, about possible wrongdoing in financial or other matters and receive reports on the investigation of such matters and the appropriate follow-up action; and
� ensure that risk management assessments are performed on a continuous basis, that management continuously monitors risk and implements appropriate risk responses.
6. External audit review and, in particular:
� assess the suitability of the audit firm and designated individual partner both when they are appointed for the first time and thereafter annually for every re-appointment;
� consider and make recommendations to the board, to be put to the shareholders for approval at the AGMs of the company, in relation to the appointment, re-appointment and removal of the company’s independent external registered auditor in compliance with the provisions of the Companies Act;
� review and approve the terms of engagement and audit plan and approve the remuneration for the external audit;
� meet with the external auditors and review the findings of the audit, including but not limited to any major issues that arose during the audit, disagreements between management and the auditors, accounting and audit judgements and the level of errors identified during the audit;
� verify and report on the independence of the external auditor in the annual financial statements;
� establish and implement a policy for non-audit services provided by the external auditor and determine the level of non-audit services provided by the external auditor that will require pre-approval by the committee; and
� ensure that there is a process for the committee to be informed of any reportable irregularities (as identified in the Auditing Profession Act, 2005) identified and reported by the external auditor.
7. To perform duties which are attributed to it by its mandate from the board, the Companies Act, the JSE Limited and regulatory requirements, and such other oversight functions as may be determined by the board.
PEPKOR CONSOLIDATED AND SEPARATE ANNUAL FINANCIAL STATEMENTS for the year ended 30 September 2020
09
AUDIT COMMITTEE REPORT continuedfor the year ended 30 September 2020
Overview of activities of the audit committee During the year under review, the committee’s general activities included the following:
� received and reviewed a quarterly business performance review report presented by the CFO, assessing group and divisional operating performances, key financial indicators pertaining to underlying drivers and considered indications of unmitigated business risk;
� monitored compliance with the group’s foreign exchange forward cover policy, and monitored the board approved borrowings limits, and external debt covenants;
� monitored the status quo of completion of tax returns and assessments for the group and its subsidiaries;
� monitored the progress on the introduction of a more simplified group structure through the deregistration of dormant subsidiaries and reduction of intermediate holding companies. This will, inter alia, assist in the reduction of legacy intercompany loans that causes tax inefficiencies;
� considered the effectiveness of internal audit, approved the three-year internal audit plan and monitored the adherence of internal audit to its annual plan;
� received and reviewed reports from both internal and external auditors concerning the effectiveness of the internal control environment, systems and processes;
� reviewed the reports of both internal and external auditors detailing their concerns arising out of their audits and requested appropriate responses from management to ensure that their concerns were being addressed;
� considered the independence and objectivity of the external auditors and ensured that the scope of any additional services provided was not such that they could be seen to have impaired their independence;
� reviewed the governance over group information and communication technology, including IT risk assessments;
� reviewed the governance and ongoing development of the group risk management function, including review of material risks the group is exposed to;
� reviewed the group’s dividend policy, and made recommendations to the board in this regard; and
� reviewed and recommended for adoption by the board, such financial information that is publicly disclosed which, for the year, included the interim reports and consolidated financial statements for the year ended 30 September 2020.
In the sections that follow, more information is provided on the specific areas of responsibility of the committee.
Reporting Matters and risk areas pertaining to the 2020 consolidated annual financial statements:
With reference to the group’s results for the current financial year, the committee, among others, paid specific attention to the matters highlighted below:
� The COVID-19 pandemic, which has created economic uncertainty and weak projected macroeconomic activity. Careful consideration was given to management’s budgets and forecasts, given the uncertainty. These forecasts directly impacted the goodwill and intangible asset impairment assessments, IFRS 9 impairment assessments, as well as the impairment of the right-of-use assets. These matters are discussed in further detail below.
� Goodwill and indefinite life intangible asset impairment assessments of all operating segments resulted in impairment of the goodwill and other intangible assets within the clothing and general merchandise segment as result of constrained future growth expectations within the PEP Africa, Speciality and Tekkie Town divisions, as well as the furniture, appliances and electronics segment. The value of the impairment as disclosed in the annual financial statements amounts to R4.8 billion.
� The IFRS 9-based expected credit loss models and the resultant provisioning on instalment sales, credit sales through store cards and loans to customer books, as disclosed in the annual financial statements. The effect of COVID-19 was further noted in the increase in expected credit losses (ECLs) due to uncertainty created by the pandemic.
� The adoption of IFRS 16: Leases, in the current financial year, which is disclosed in the accompanying annual financial statements. The group adopted the modified retrospective approach with no restatement of prior year results.
� The impairment assessment relating to the right-of-use assets which are tested for impairment as part of the cash-generating unit (CGU) it relates to (i.e. retail store), when indicators of impairment are identified.
� Provision for taxation, including deferred taxation, the factors impacting the effective rate of taxation, and remedial measures possible within the scope of taxation regulations of the countries within which the group is doing business, which may improve the effective rate. The tax provisions were evaluated based on IFRIC 23: Uncertainty over Income Tax Treatments.
� Provision for slow-moving and obsolete stock, as well as ongoing levels of shrinkage.
� Impairment of the asset held for sale to its fair value less cost to sell and other closure cost provisions.
� The scope and extent of other general and specific provisions recognised.
� Considered transactions for related-party disclosure, and the adequacy of the disclosure.
PEPKOR CONSOLIDATED AND SEPARATE ANNUAL FINANCIAL STATEMENTS for the year ended 30 September 2020
10
The committee, in forming a view of the specific matters highlighted, considered the opinion of the external auditors on all of these matters, in addition to that of management. No differences of opinion were noted by the committee.
The committee accordingly considers the group’s accounting policies, accounting practices and financial disclosures, as amended, to be appropriate.
Internal controlsInternal controls and systems have been designed to provide reasonable assurance as to the integrity and reliability of the financial information represented in the financial statements, and to safeguard, verify and maintain the assets of the group.
The systems of internal control are based on established organisational structures, together with written policies and procedures, and provide for suitably qualified employees, segregation of duties, clearly defined lines of authority and accountability. They also include cost and budgeting controls, and comprehensive management reporting.
Nothing has come to the attention of the committee to indicate that any material breakdown in the functioning of the group’s key internal control systems has occurred during the period under review.
Combined assurance modelThe committee oversees that the assurance arrangements in place are effective. The combined assurance model comprises management, the internal audit function, external audit services and other specialists contributing to combined assurance. The committee is satisfied that these arrangements are effective in providing a robust control environment which enables the provision of reliable information for decision-making purposes.
Evaluation of the finance function As required by JSE Listings Requirement 3.84(h), as well as the recommended practices as per King IV™, the committee has formally assessed the competence and performance of the CFO, and believes that he possesses the appropriate expertise and experience to meet his responsibilities.
The manpower, roles and responsibilities, qualifications and experience of senior members of the group finance function, including the financial directors of the main group businesses, were also considered. Based on this assessment, the audit committee is satisfied with the expertise and adequacy of resources within the finance function and the experience of financial staff in this function.
The committee believes the group has appropriate financial reporting procedures and is satisfied that these procedures are operating adequately.
Internal auditThe group’s internal audit function operates in terms of an internal audit charter (which was reviewed by the committee during the year), and under the direction of the committee, which approves the scope of the work to be performed. Internal audit’s activities are measured against that approved scope and an approved annual internal audit plan. The head of internal audit tables a progress report in this regard to the audit committee at each meeting.
Internal audit is independent of all other organisational functions and reports functionally to the audit and risk committee and administratively to the CFO. Internal audit has direct access to the audit and risk committee, primarily through the chairman, as well as free and unrestricted access to all areas within the group.
The internal audit function maintains general conformance to the Institute of Internal Auditors’ (IIA’s) International Standards for the Professional Practice of Internal Auditing (Standards) and Code of Ethics. An audit quality assessment review (QAR) programme is in place and is maintained by the head of internal audit.
The group internal audit function adopts a risk-based audit approach and is responsible for providing assurance and consulting services on the adequacy of the internal control environment across all the operating and support divisions of the group. The internal audit scope covers the significant financial, regulatory, operational and IT areas of each operating division, and group support function. The internal audit plan has been informed by the group strategies, risk registers, comprehensive risk assessment, compliance requirements and input from management, the audit committee and external audit.
The efforts of internal audit are aligned with those of the external auditor in order to integrate assurance activities for the group. Internal audit regularly interacts with the external auditor on matters such as sharing audit plans, working papers and reports. The external auditor, as permitted, places reliance on internal audit work performed.
Significant findings are reported to both executive management and the committee, and corrective action is taken to address identified internal control deficiencies. Internal audit follows up on any significant audit findings to assess implementation of such agreed corrective actions.
Financial year overviewDuring the past financial year, the internal audit function was impacted by the COVID-19 pandemic and resultant lockdown, in line with the rest of the business. Some items on the internal audit plan were reprioritised or cancelled and replaced with new items, to respond to new risks brought on by the pandemic and work-from-home arrangements. The digital
AUDIT COMMITTEE REPORT continuedfor the year ended 30 September 2020
PEPKOR CONSOLIDATED AND SEPARATE ANNUAL FINANCIAL STATEMENTS for the year ended 30 September 2020
11
transformation the internal audit function underwent in preceding years enabled internal audit to function remotely during the lockdown, with a relatively minimal impact on coverage and levels of assurance provided.
Internal audit covered key business processes, focusing on known or anticipated areas of business risk. In addition, internal audit completed a number of special projects and consulting engagements relating to key strategic initiatives, emerging risks, new regulation and the impact of the COVID-19 pandemic on ways of working and business risks. This included reviews of Occupational Health and Safety, cybersecurity (penetration tests and work-from-home network security assessments), IFRS 16 property lease audits, an assessment of the impact of the Protection of Personal Information Act (POPIA), corporate governance (King IV™), ethics and fraud prevention, and project governance on the new SAP system implementation.
The results of the reviews performed indicated that governance and internal control systems and processes were generally adequate and reliable across the group, subject to defined risk tolerance levels. No material instance of control breakdown was identified.
Digital transformation and advanced integrated analytics initiativeThe internal audit function started with digital transformation more than two years ago, with the implementation of cloud-based internal audit management software. This software platform, coupled with established analytic tools, has enabled the function to be fully digitally enabled since then. New tools and technologies have since been implemented to facilitate planning, communication and collaboration internally and externally. As a result, the function successfully transitioned its workforce to work remotely during the COVID-19 pandemic.
A digital strategy is in place and is continuously refined and improved. In contemplating next-generation internal auditing, principles such as agility, dynamic and real-time assessment of risks and controls, and the effective leveraging of data have been adopted. Advantages of this mindset have been magnified during the novel coronavirus crisis. Annual risk assessments, for instance, have become almost redundant. The process has been structured to be more dynamic and even real-time to respond to risks as quickly as they change, and to provide the assurance needed from internal audit.
The internal audit function has embraced enabling technology, which includes robotic process automation (RPA), integration with geographic information system (GIS) data, and advanced integrated analytics. This drives the delivery of more efficient audits, deeper insights and increased risk assurance. For example, the property lease audit conducted this year incorporated advanced data extraction and RPA technology.
The new approach substantially reduced the time to verify property lease information. Through advanced analytics, internal audit identified numerous opportunities in business units to reclaim unrecovered revenue, and through integrated robotics, the function saved more than 80 man-days per annum capturing manual data.
Through the digital transformation initiative, audit teams are moving towards advanced analytics to leverage data-driven insights to deliver more proactive, effective and efficient assurance. Continuous monitoring capabilities are being developed and will be launched within the function as well as the business during 2021.
Performance and independenceThe committee is satisfied with the effectiveness and performance of the internal auditors and compliance with their mandate.
The committee is further of the view that the internal auditors have the necessary resources, budget, standing and authority to enable them to effectively discharge their functions.
Internal audit reported that there were no undue scope limitations or impairments to its independence.
Scope of risk-related oversight by the audit and risk committee The committee is responsible for overseeing risk management in the group. This function includes regular review of:
� the group risk analysis and major business and operational risks reported, including actions to mitigate those risks, and opportunities inherent to such risks (reported on in more detail below);
� insurance strategy, adequacy and cost of insurance cover, and claims experience; material legal claims against and by the group, and potential exposure based on advice of the group’s legal counsel, and taken in account in the assessment of provisions raised;
� reported occurrences of fraud; although numerous occurrences were reported, especially in the store environment, the impact and frequency were not assessed as abnormal, and no material frauds were brought to the attention of the committee, nor are the overall amounts reported viewed as material or significant;
� regulatory compliance (reported on in more detail below); and
� IT governance and risk management (reported on in more detail below).
Risk managementThe focus of risk management is centred on establishing a common risk management framework based on ISO 31000.
AUDIT COMMITTEE REPORT continuedfor the year ended 30 September 2020
PEPKOR CONSOLIDATED AND SEPARATE ANNUAL FINANCIAL STATEMENTS for the year ended 30 September 2020
12
The board, through the audit and risk committee, has prioritised risk management at an operational level to ensure that risk management and control activities are effectively implemented, monitored and reported to the appropriate governance structures.
The adoption of the Pepkor risk management framework has provided a group-wide view of the operations’ key risks, the strategic group risks, as well as interrelated risks that have a compounding effect on the overall group risk profile. A formal risk appetite and tolerance has been defined and each operation continues to develop and enhance their risk management activities. The group will continue to drive risk management initiatives to identify significant threats and opportunities.
During the past year, the focus remained on refining risk appetite and tolerance thresholds, completing operational risk assessments, developing a robust risk management methodology and nomenclature, evaluating material risks across each risk category, and enhancing risk management assurance.
Risk management oversight, implementation and assuranceThe group risk management framework is designed to ensure that effective oversight, implementation and assurance of risk management and control systems are achieved throughout the group. The audit and risk committee serves as a combined oversight structure mandated by the board to monitor risk management activities. Operational risk management forums are held regularly to discuss prevailing and emerging risks, as well as to consider effective risk treatment plans.
The audit and risk committee is committed to improving risk management and achieving Pepkor’s strategic objectives in accordance with the requirements of King IV™. Each operating entity is mandated to adopt and implement a risk management methodology to ensure risks are effectively identified, evaluated, mitigated, monitored and communicated. The methodology ensures that regular risk management assessments are completed by each operation.
This approach ensures that risk management is continuously being embedded in business activities and decision-making processes at all levels of the group. The Pepkor risk appetite and tolerance thresholds provide a common risk nomenclature and set impact guidelines for each category of risk (Strategic, Operational, Financial, Compliance, Sustainability, Health and Safety, Business Continuity and Disaster Recovery). Executive management are held accountable by the group audit and risk committee for designing, implementing and monitoring the systems and processes underpinning risk management.
Risk management approachRisks are identified from both a bottom-up and top-down perspective. The primary output of the top-down approach is
the annual identification, evaluation and reporting of the material group risks. The bottom-up approach delivers the quarterly operational risk report, which presents the material risks per operating segment. The group prescribes strict minimum standards for the control environment and regularly deploys internal and independent audit teams to test control effectiveness across operating entities. Failure to implement significant/key controls within set time frames is escalated to the operational executive management and/or the group audit and risk committee.
Risk retention and transfer strategyThe risk retention and transfer strategy continues to be evaluated to identify opportunities for alternative risk transfer structures, which may improve risk retention and reduce risk transfer costs. This has become an increasingly significant cost as corporates continue to experience escalating insurance costs. Incident management by operations support the identification of potential exposures and emerging trends, and informs decision-making for enhanced mitigation activities for losses, where the frequency of incidents continues to rise. Incidents are investigated by operational management, internal and/or independent teams to identify and rectify any current and future exposure of the group.
Significant events, resilience and future considerationsThe COVID-19 pandemic and lockdown initiated by governments across the world caused significant disruption to the supply chain and forced the digitisation of business activities, as well as stakeholder engagement practices across the group. The underlying operations proved to be resilient and resumed operations by adopting new ways of working. We continue to monitor emerging risks and the long-term impact of the pandemic on an industry and country-wide basis.
The consolidation of risk management information across a decentralised group provides valuable insights into the risk management and control activities. Material risks are consolidated and assessed to identify interconnected risks. Risk management is a key agenda point at the divisional executive committee meetings and the increased awareness is translating into more focus around business continuity initiatives. The COVID-19 crisis has further highlighted the importance of good risk management as part of good strategic and business management.
Risk management assuranceRisk management plays an important role in the combined assurance efforts of the group and serves as a second line of assurance to the board audit and risk committee. Internal audit regularly engages with operational management and group risk management to discuss current and emerging risks and use the operational risk registers and reports as an input for the internal audit requirements.
AUDIT COMMITTEE REPORT continuedfor the year ended 30 September 2020
PEPKOR CONSOLIDATED AND SEPARATE ANNUAL FINANCIAL STATEMENTS for the year ended 30 September 2020
13
Regulatory complianceThe group legal and compliance function is responsible for the day-to-day management of regulatory compliance, including coordinating the identification and management of compliance risk and identifying and assessing compliance obligations, including legislative updates and reporting. Each business manages its own specific regulatory compliance risk, with oversight and support from group legal and compliance. Reporting from the various business units on litigation and compliance takes place on at least a quarterly basis and is reported to the audit committee.
The group’s compliance officer provides a regular written report to the audit committee as substantive compliance assurance. For the period under review, the regulatory compliance universe for the Pepkor group has remained stable. There have been no material fines or penalties as a result of statutory or regulatory contraventions. Businesses across the group continue to resolve consumer complaints adequately and, where complaints are received from regulators and industry ombudsmen, it is dealt with in a timely manner and with acceptable outcomes.
New regulatory developments are monitored by the group compliance function and presented for discussion and awareness at regular meetings with representation from all the businesses. This includes regulatory developments in countries besides South Africa.
IT governance and risk managementIT governance in the group is premised on decentralised operating divisions being responsible for decisions relating to IT within an agreed strategic framework, supported at group level through enablement and support, the building of capacity where required, and facilitation of initiatives where possible.
Divisional strategic IT projects and change portfolios are managed through IT steering committees in each division, in co-operation with each division’s Exco. Strategic alignment and prioritisation within each divisional portfolio are achieved through these steering committees. IT risks are managed through continuous risk assessment and monitoring, and risk registers are updated quarterly within each division.
Pepkor IT, a business unit within the Central Services division, is an enabler of business, providing IT services through a shared services model. Pepkor IT currently manages the IT functions on behalf of the clothing and general merchandise segment of the group only. The furniture, appliances and electronics, building materials, and FinTech segments have their own integrated IT functions serving their respective businesses.
Progress made during the year included the following:
� The group chose COBIT 5 as an overarching framework for IT governance and process maturity, which is at varying levels of implementation within each division.
� IT governance maturity for each division is measured through self-assessments against those COBIT objectives selected for initial focus, combined with a gap analysis to identify the necessary improvements to move to the next level of maturity, and/or increase maturity levels towards the ideal target state. The maturity assessments are reported to the committee for consideration.
� Cybersecurity risk in particular has been reduced through enhanced systems, and no weaknesses have been identified during the latest external penetration tests performed in each division. Further key initiatives are underway across the group to further reduce the risk.
� The process maturity for disaster recovery (DR) processes across the group has shown significant improvement from last year, due to a concerted effort during the year to implement more robust DR processes and systems.
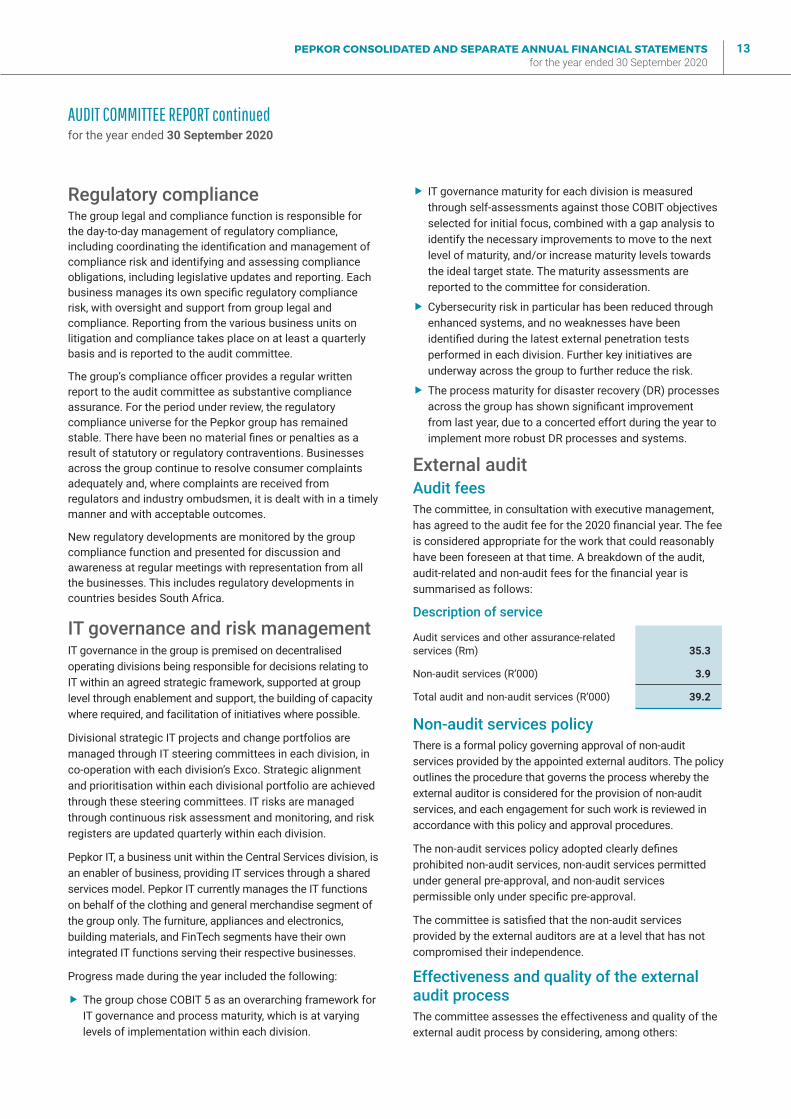
External audit Audit feesThe committee, in consultation with executive management, has agreed to the audit fee for the 2020 financial year. The fee is considered appropriate for the work that could reasonably have been foreseen at that time. A breakdown of the audit, audit-related and non-audit fees for the financial year is summarised as follows:
Description of service
Audit services and other assurance-related services (Rm) 35.3
Non-audit services (R’000) 3.9
Total audit and non-audit services (R’000) 39.2
Non-audit services policyThere is a formal policy governing approval of non-audit services provided by the appointed external auditors. The policy outlines the procedure that governs the process whereby the external auditor is considered for the provision of non-audit services, and each engagement for such work is reviewed in accordance with this policy and approval procedures.
The non-audit services policy adopted clearly defines prohibited non-audit services, non-audit services permitted under general pre-approval, and non-audit services permissible only under specific pre-approval.
The committee is satisfied that the non-audit services provided by the external auditors are at a level that has not compromised their independence.
Effectiveness and quality of the external audit processThe committee assesses the effectiveness and quality of the external audit process by considering, among others:
AUDIT COMMITTEE REPORT continuedfor the year ended 30 September 2020
PEPKOR CONSOLIDATED AND SEPARATE ANNUAL FINANCIAL STATEMENTS for the year ended 30 September 2020
14
� the extent and focus of the external audit plan submitted and discussed by the auditor;
� assessment of key audit matters disclosed by the external auditors in the external audit plan submitted to the committee;
� the nature of the aspects reported on to the audit committee by the auditor;
� the quality of the discussions with the external auditor regarding audit, accounting and reporting matters at audit committee meetings; and
� ongoing progress towards the completion of the audit.
The external auditor was given the opportunity to engage at each meeting with the audit committee members without management being present, if deemed necessary. In addition, the committee chairman privately meets with the auditors prior to the final meeting of the committee after year-end to facilitate confidential inputs on audit progress and matters of sensitivity.
The committee can report that it is satisfied with the effectiveness and quality of the external audit.
Independence of the external auditorThe committee has to satisfy itself that the auditors of Pepkor and its subsidiaries (PwC) are independent as defined by the Companies Act. This was assessed through, inter alia, consideration of:
� the composition of the auditor’s total fees and remuneration earned from the group from its appointment, and its materiality in relation to the audit firm’s overall fees generated from its national client base;
� the quantum and nature of non-audit services performed;
� the existence of an audit partner rotation process;
� the auditor’s confirmation that they remain independent as required by section 94(8) of the Companies Act and the relevant provision in the JSE Listings Requirements; and
� the existence of any relationships between the auditor and the group which may impede the auditor’s independence.
Based on the above assessment, the audit committee is satisfied that PwC is independent of the group.
Recommendation on appointment for 2020 financial yearThe audit committee has satisfied itself that PwC and the designated audit partner remain accredited by the JSE for 2021. The committee is also satisfied with the last inspection findings of the IRBA as presented by PwC.
The committee has further established that no reportable irregularities (as identified in the Auditing Profession Act, 2005) have been identified and reported by the external auditor.
On the basis of the assessment of independence, the assessment of the effectiveness and quality of the external
audit process, and the assurances obtained on qualification for appointment, the committee recommends to the board and shareholders that PwC be re-appointed as the independent external auditor, and that, in terms of the regulations and policies governing rotation of designated auditors, Mr Dawid de Jager be appointed as the designated auditor for the 2021 financial year.
Going concernThe audit committee has reviewed a documented assessment, including key assumptions, prepared by the financial function on the going concern status of the group. The board’s statement on the going concern status of the group, as supported by the audit committee, is contained in the report of the directors.
Financial statementsThe audit committee has evaluated the consolidated financial statements for the year ended 30 September 2020, and considers that they comply, in all material aspects, with the requirements of the Companies Act and International Financial Reporting Standards. The committee has therefore recommended the financial statements for approval to the board. The board has subsequently approved the financial statements, which will be open for discussion at the forthcoming AGM.
Functioning of the audit and risk committeeThe committee has performed a self-evaluation in order to assess the efficiency of its operations. Overall, the committee is satisfied that it has discharged its duties efficiently and that it has functioned in accordance with its ToR for the 2020 financial year.
All members of the audit committee meet the independence requirements.
RecognitionTo conclude, I wish to express my gratitude to the other members of the audit committee for their invaluable inputs, advice and support. My thanks also to the CFO, all Pepkor finance function staff, the financial directors of the main group businesses, our internal and external auditors, and all other contributors to the combined assurance process, for enabling the audit committee to execute its mandate.
JB CilliersAudit and risk committee chairman15 December 2020
AUDIT COMMITTEE REPORT continuedfor the year ended 30 September 2020
PEPKOR CONSOLIDATED AND SEPARATE ANNUAL FINANCIAL STATEMENTS for the year ended 30 September 2020
15
INDEPENDENT AUDITOR’S REPORTTO THE SHAREHOLDERS OF PEPKOR HOLDINGS LIMITED
FOR THE YEAR ENDED 30 SEPTEMBER 2020
Report on the audit of the consolidated and separate financial statementsOur opinionIn our opinion, the consolidated and separate financial statements present fairly, in all material respects, the consolidated and separate financial position of Pepkor Holdings Limited (the company) and its subsidiaries (together the group) as at 30 September 2020, and its consolidated and separate financial performance and its consolidated and separate cash flows for the year then ended in accordance with International Financial Reporting Standards and the requirements of the Companies Act of South Africa.
What we have auditedPepkor Holdings Limited’s consolidated and separate financial statements set out on pages 23 to 130 comprise:
� the consolidated statement of financial position and separate statement of financial position as at 30 September 2020;
� the consolidated income statement and separate income statement for the year then ended;
� the consolidated statement of comprehensive income and separate statement of comprehensive income for the year then ended;
� the consolidated statement of changes in equity and separate statement of changes in equity for the year then ended;
� the consolidated statement of cash flows and separate statement of cash flows for the year then ended; and
� the notes to the financial statements, which include a summary of significant accounting policies.
Basis for opinionWe conducted our audit in accordance with International Standards on Auditing (ISAs). Our responsibilities under those standards are further described in the Auditor’s responsibilities for the audit of the consolidated and separate financial statements section of our report.
We believe that the audit evidence we have obtained is sufficient and appropriate to provide a basis for our opinion.
IndependenceWe are independent of the group in accordance with the Independent Regulatory Board for Auditors’ Code of Professional Conduct for Registered Auditors (IRBA Code) and other independence requirements applicable to performing audits of financial statements in South Africa. We have fulfilled our other ethical responsibilities in accordance with the IRBA Code and in accordance with other ethical requirements applicable to performing audits in South Africa. The IRBA Code is consistent with the corresponding sections of the International Ethics Standards Board for Accountants’ International Code of Ethics for Professional Accountants (including International Independence Standards).
PEPKOR CONSOLIDATED AND SEPARATE ANNUAL FINANCIAL STATEMENTS for the year ended 30 September 2020
16
INDEPENDENT AUDITOR’S REPORT TO THE SHAREHOLDERS OF PEPKOR HOLDINGS LIMITED continuedfor the year ended 30 September 2020
Our audit approachOverview
Group scoping
Key audit matters
Materiality
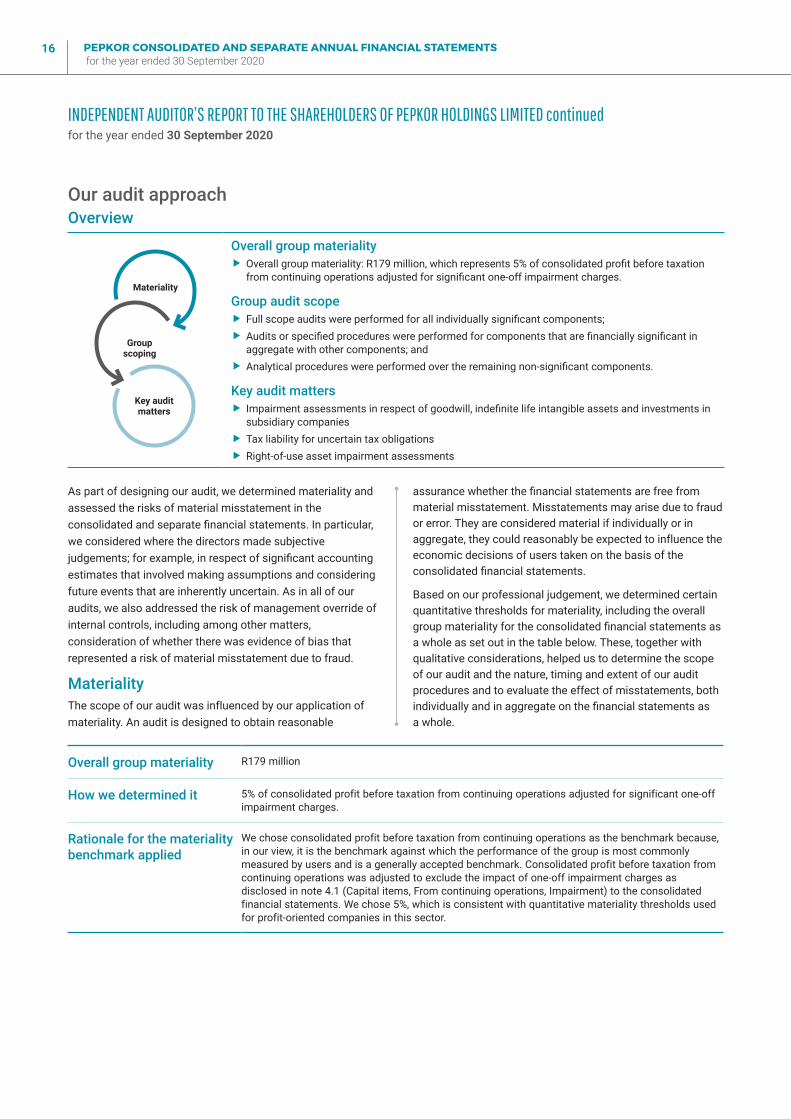
Overall group materiality � Overall group materiality: R179 million, which represents 5% of consolidated profit before taxation from continuing operations adjusted for significant one-off impairment charges.
Group audit scope � Full scope audits were performed for all individually significant components; � Audits or specified procedures were performed for components that are financially significant in aggregate with other components; and
� Analytical procedures were performed over the remaining non-significant components.
Key audit matters � Impairment assessments in respect of goodwill, indefinite life intangible assets and investments in subsidiary companies
� Tax liability for uncertain tax obligations � Right-of-use asset impairment assessments
As part of designing our audit, we determined materiality and assessed the risks of material misstatement in the consolidated and separate financial statements. In particular, we considered where the directors made subjective judgements; for example, in respect of significant accounting estimates that involved making assumptions and considering future events that are inherently uncertain. As in all of our audits, we also addressed the risk of management override of internal controls, including among other matters, consideration of whether there was evidence of bias that represented a risk of material misstatement due to fraud.
MaterialityThe scope of our audit was influenced by our application of materiality. An audit is designed to obtain reasonable
assurance whether the financial statements are free from material misstatement. Misstatements may arise due to fraud or error. They are considered material if individually or in aggregate, they could reasonably be expected to influence the economic decisions of users taken on the basis of the consolidated financial statements.
Based on our professional judgement, we determined certain quantitative thresholds for materiality, including the overall group materiality for the consolidated financial statements as a whole as set out in the table below. These, together with qualitative considerations, helped us to determine the scope of our audit and the nature, timing and extent of our audit procedures and to evaluate the effect of misstatements, both individually and in aggregate on the financial statements as a whole.
Overall group materiality R179 million
How we determined it 5% of consolidated profit before taxation from continuing operations adjusted for significant one-off impairment charges.
Rationale for the materiality benchmark applied
We chose consolidated profit before taxation from continuing operations as the benchmark because, in our view, it is the benchmark against which the performance of the group is most commonly measured by users and is a generally accepted benchmark. Consolidated profit before taxation from continuing operations was adjusted to exclude the impact of one-off impairment charges as disclosed in note 4.1 (Capital items, From continuing operations, Impairment) to the consolidated financial statements. We chose 5%, which is consistent with quantitative materiality thresholds used for profit-oriented companies in this sector.
PEPKOR CONSOLIDATED AND SEPARATE ANNUAL FINANCIAL STATEMENTS for the year ended 30 September 2020
17
INDEPENDENT AUDITOR’S REPORT TO THE SHAREHOLDERS OF PEPKOR HOLDINGS LIMITED continuedfor the year ended 30 September 2020
by us, as the group engagement team and by component auditors from other PwC network firms operating under our instruction, in order to issue our audit opinion on the consolidated financial statements of the group. Where the work was performed by component auditors, we determined the level of involvement necessary in the audit work at those components to be able to conclude whether sufficient appropriate audit evidence has been obtained as a basis for our opinion on the consolidated financial statements as a whole.
Detailed group audit instructions were communicated to all components in scope and the group engagement team was involved in determining the audit approaches adopted in relation to significant risk areas. Throughout the audit, various discussions were held with the component auditors and we inspected component auditors’ working papers relating to areas of significant risks in the consolidated financial statements.
Key audit mattersKey audit matters are those matters that, in our professional judgement, were of most significance in our audit of the consolidated and separate financial statements of the current period. These matters were addressed in the context of our audit of the consolidated and separate financial statements as a whole, and in forming our opinion thereon, and we do not provide a separate opinion on these matters.
How we tailored our group audit scope We tailored the scope of our audit in order to perform sufficient work to enable us to provide an opinion on the consolidated financial statements as a whole, taking into account the structure of the group, the accounting processes and controls, and the industry in which the group operates.
Our scoping assessment included consideration of the financial significance of the group’s components as well as the sufficiency of work planned to be performed over material consolidated financial statement line items. We identified two financially significant components in the group, namely PEP and Ackermans, both divisions of Pepkor Trading Proprietary Limited. We performed full scope audits for these components. Based on indicators such as the contribution to consolidated revenue and consolidated profit before taxation, we also included several other components in the scope of our group audit. For these components, we performed a combination of full scope audits, audit of balances and/or classes of transactions, analytical review procedures and specified audit procedures. The remainder of the components were insignificant to the group, individually and in aggregate.
The above, together with additional procedures performed at the group level, including substantive procedures over the consolidation process, gave us sufficient and appropriate audit evidence to form an opinion on the consolidated financial statements as a whole.
In establishing the overall approach to the group audit, we determined the extent of the work that needed to be performed
PEPKOR CONSOLIDATED AND SEPARATE ANNUAL FINANCIAL STATEMENTS for the year ended 30 September 2020
18
Key audit matter How our audit addressed the key audit matter
Impairment assessments in respect of goodwill, indefinite life intangible assets and investments in subsidiary companiesThis key audit matter relates to both the consolidated and separate financial statements. The group’s net assets include a significant amount of goodwill amounting to R37.3 billion, and trade and brand names amounting to R17.6 billion classified as indefinite life intangible assets, allocated to groups of cash-generating units (CGUs). Please refer to note 9 (Goodwill) and note 10 (Intangible assets) to the consolidated financial statements. The company holds investments in subsidiary companies amounting to R59.6 billion (refer to note 5 to the separate financial statements).
Management performs annual impairment tests to assess the recoverability of the carrying value of goodwill and indefinite life intangible assets. The recoverable amount of the CGUs to which goodwill has been allocated is based on fair value less cost of disposal calculations, determined using discounted cash flow models.
Based on their impairment assessments and calculations, management recognised impairment losses of R4.7 billion against goodwill relating to the clothing and general merchandise and R103 million against indefinite life intangible assets relating to the furniture, appliances and electronics groups of CGUs. Management recognised an impairment of R8.6 billion in the separate financial statements pertaining to investment in subsidiary companies.
No further impairment losses were recognised to goodwill and indefinite life intangible assets in relation to the other groups of CGUs.
We considered this area to be a matter of most significance to our current year audit due to the following:
� the significant judgement and key assumptions applied by management in performing the impairment assessments, which included the discount rate, long-term growth rate, medium-term revenue growth rate and future cash flows; and
� the magnitude of the related goodwill and indefinite life intangible asset balances.
Our audit procedures included testing of the principles, integrity and mathematical accuracy of the group’s discounted cash flow models. The details of these audit procedures are listed below:
� Through inspection of relevant documentation and discussions, we assessed management’s judgements relating to the allocation of goodwill and indefinite life intangible assets to the lowest level at which it is being monitored.
� We utilised our internal valuations expertise to test the principles of management’s calculation for each model. We challenged key inputs in the calculations which included the discount rate, long-term growth rate and short- to medium-term revenue growth rate by comparing them to approved business plans and independent market and economic data. We noted no material differences and, based on our work performed, accepted the key inputs used by management.
� In assessing management’s forecasts, we evaluated sales and margin forecasts by comparing it to the past performance of each of the groups of CGUs. We considered the extent and appropriateness of the impact of the COVID-19 pandemic and lockdown restrictions on the market-related assumptions through discussions with management and our valuation specialists. We further assessed management’s forecasts by testing the most sensitive assumptions (assumptions to which the outcome of the impairment test could have the most significant effect on the determination of the recoverable amount) and found it to be within acceptable ranges.
� We performed independent sensitivity calculations on the impairment assessments where no impairments were recognised, to assess the degree by which the key assumptions needed to change in order to trigger an impairment. The results of our sensitivity analyses were consistent with management’s conclusions.
Investments in subsidiary companies:
In addition to the work described above, we compared the carrying values of the investments in the subsidiary companies to the respective recoverable amounts of the underlying subsidiaries, as tested by us as part of the impairment assessment of the relevant groups of CGUs.
INDEPENDENT AUDITOR’S REPORT TO THE SHAREHOLDERS OF PEPKOR HOLDINGS LIMITED continuedfor the year ended 30 September 2020
PEPKOR CONSOLIDATED AND SEPARATE ANNUAL FINANCIAL STATEMENTS for the year ended 30 September 2020
19
Key audit matter How our audit addressed the key audit matter
Tax liability for uncertain tax obligationsThis key audit matter relates to the consolidated financial statements only. The group operates across numerous jurisdictions which have differing tax legislation.
Determination of the amounts which should be recognised for uncertain tax liabilities is subject to management’s judgement, including consideration of regulations by various tax authorities. Taxation positions are provided for based on either the most probable outcome method or the expected value of the taxation position for each type of taxation exposure.
Determining the tax liability amount that should be recognised for uncertain tax positions for the group was considered to be a matter of most significance to our current year audit due to the significant judgement applied by management in the application of existing tax laws in each jurisdiction and in accordance with relevant tax regulations.
Tax liabilities for uncertain tax obligations are provided for in current income tax liabilities as disclosed in the consolidated statement of financial position.
Refer to ‘Income taxation provisions’ accounting policy, included in the significant judgements and estimates note to the consolidated financial statements.
Making use of our tax expertise, we performed the following procedures:
� We challenged management’s judgement of the most probable outcome by considering alternative views and probability factors in terms of assessing tax risks, legislative developments, tax regulations, contingencies and the recognition thereof.
� We performed sensitivity analyses around the key assumptions, such as probability, used in management’s assessments and the calculation of the tax liability.
� Making use of the information obtained as referred to above, we independently calculated an expected range in respect of the group’s tax liability. Based on the results of our evaluation, we accepted management’s estimation, taking into account the significant judgement involved in management’s assessment.
INDEPENDENT AUDITOR’S REPORT TO THE SHAREHOLDERS OF PEPKOR HOLDINGS LIMITED continuedfor the year ended 30 September 2020
PEPKOR CONSOLIDATED AND SEPARATE ANNUAL FINANCIAL STATEMENTS for the year ended 30 September 2020
20
Key audit matter How our audit addressed the key audit matter
Right-of-use asset impairment assessmentsThis key audit matter relates to the consolidated financial statements only. The group adopted IFRS 16: Leases during the current reporting period commencing 1 October 2019, using a modified retrospective approach with no restatement of prior period reported results.
The effect of adopting IFRS 16 resulted in recognition of right-of-use assets of R12.7 billion on date of transition, and R10.8 billion as at 30 September 2020.
Right-of-use assets are tested for impairment as part of the CGU it relates to (i.e. retail store) when indicators of impairment are identified and periodically reduced by the impairment losses, if required. The recoverable amount of the CGU is determined by way of a value-in-use calculation, determined using discounted cash flow models.
Based on their impairment assessments and calculations, management recognised impairment losses of R235 million from continuing operations against right-of-use assets.
Refer to the accounting policies note, note 4.1 (Capital items, From continuing operations, Impairment) and note 12 (Right-of-use assets) to the consolidated financial statements.
We considered this area to be a matter of most significance to our current year audit due to the following:
� the significant judgement and key assumptions applied by management in performing the impairment assessments, which included consideration of impairment trigger, discount rate and medium-term growth rates; and
� the magnitude of the related right-of-use asset balances.
Our audit procedures included testing of the principles, integrity and mathematical accuracy of the group’s discounted cash flow models.
The details of these audit procedures are listed below:
� We assessed the group’s policy, which sets out the conditions considered by management as impairment indicators, against the requirements of International Accounting Standard (IAS) 36: Impairment of Assets. The purpose of this assessment was to evaluate the impairment indicators for the CGUs (e.g. loss-making retail store) to be tested for impairment and the application of the group’s policy on the portfolio of retail stores.
� We challenged key inputs in the calculations which included the discount rate and short- to medium-term growth rate over the period of the lease by comparing them to approved business plans and independent market data. We noted no material differences.
� We utilised our internal valuations expertise to assess the reasonability of the discount rate by comparing this to independent market data and inspection of the valuation methodologies used by management. Based on our work performed, we noted that the discount rate fell within an acceptable range and accepted the valuation methodology applied.
� We assessed the completeness and accuracy of disclosures with reference to the requirements of IFRS 16. No material differences were noted.
Other informationThe directors are responsible for the other information. The other information comprises the information included in the document titled ‘Pepkor Holdings Limited consolidated and separate annual financial statements for the year ended 30 September 2020’, which includes the report of the directors, the audit committee report and the secretary certification as required by the Companies Act of South Africa, which we obtained prior to the date of this auditor’s report, and the other sections of the document titled ‘Pepkor Holdings Limited integrated report 2020’, which is expected to be made available to us after that date. The other information does not include the consolidated or the separate financial statements and our auditor’s report thereon.
Our opinion on the consolidated and separate financial statements does not cover the other information and we do not and will not express an audit opinion or any form of assurance conclusion thereon.
In connection with our audit of the consolidated and separate financial statements, our responsibility is to read the other information identified above and, in doing so, consider whether the other information is materially inconsistent with the consolidated and separate financial statements or our knowledge obtained in the audit, or otherwise appears to be materially misstated.
If, based on the work we have performed on the other information that we obtained prior to the date of this auditor’s
INDEPENDENT AUDITOR’S REPORT TO THE SHAREHOLDERS OF PEPKOR HOLDINGS LIMITED continuedfor the year ended 30 September 2020
PEPKOR CONSOLIDATED AND SEPARATE ANNUAL FINANCIAL STATEMENTS for the year ended 30 September 2020
21
report, we conclude that there is a material misstatement of this other information, we are required to report that fact. We have nothing to report in this regard.
Responsibilities of the directors for the consolidated and separate financial statementsThe directors are responsible for the preparation and fair presentation of the consolidated and separate financial statements in accordance with International Financial Reporting Standards and the requirements of the Companies Act of South Africa, and for such internal control as the directors determine is necessary to enable the preparation of consolidated and separate financial statements that are free from material misstatement, whether due to fraud or error.
In preparing the consolidated and separate financial statements, the directors are responsible for assessing the group and the company’s ability to continue as a going concern, disclosing, as applicable, matters related to going concern and using the going concern basis of accounting unless the directors either intend to liquidate the group and/or the company or to cease operations, or have no realistic alternative but to do so.
Auditor’s responsibilities for the audit of the consolidated and separate financial statementsOur objectives are to obtain reasonable assurance about whether the consolidated and separate financial statements as a whole are free from material misstatement, whether due to fraud or error, and to issue an auditor’s report that includes our opinion. Reasonable assurance is a high level of assurance, but is not a guarantee that an audit conducted in accordance with ISAs will always detect a material misstatement when it exists. Misstatements can arise from fraud or error and are considered material if, individually or in the aggregate, they could reasonably be expected to influence the economic decisions of users taken on the basis of these consolidated and separate financial statements.
As part of an audit in accordance with ISAs, we exercise professional judgement and maintain professional scepticism throughout the audit. We also:
� Identify and assess the risks of material misstatement of the consolidated and separate financial statements, whether due to fraud or error, design and perform audit procedures responsive to those risks, and obtain audit evidence that is sufficient and appropriate to provide a basis for our opinion. The risk of not detecting a material misstatement resulting from fraud is higher than for one resulting from error, as fraud may involve collusion, forgery,
intentional omissions, misrepresentations, or the override of internal control.
� Obtain an understanding of internal control relevant to the audit in order to design audit procedures that are appropriate in the circumstances, but not for the purpose of expressing an opinion on the effectiveness of the group’s and the company’s internal control.
� Evaluate the appropriateness of accounting policies used and the reasonableness of accounting estimates and related disclosures made by the directors.
� Conclude on the appropriateness of the directors’ use of the going concern basis of accounting and, based on the audit evidence obtained, whether a material uncertainty exists related to events or conditions that may cast significant doubt on the group’s and the company’s ability to continue as a going concern. If we conclude that a material uncertainty exists, we are required to draw attention in our auditor’s report to the related disclosures in the consolidated and separate financial statements or, if such disclosures are inadequate, to modify our opinion. Our conclusions are based on the audit evidence obtained up to the date of our auditor’s report. However, future events or conditions may cause the group and/or company to cease to continue as a going concern.
� Evaluate the overall presentation, structure and content of the consolidated and separate financial statements, including the disclosures, and whether the consolidated and separate financial statements represent the underlying transactions and events in a manner that achieves fair presentation.
� Obtain sufficient appropriate audit evidence regarding the financial information of the entities or business activities within the group to express an opinion on the consolidated financial statements. We are responsible for the direction, supervision and performance of the group audit. We remain solely responsible for our audit opinion.
We communicate with the directors regarding, among other matters, the planned scope and timing of the audit and significant audit findings, including any significant deficiencies in internal control that we identify during our audit.
We also provide the directors with a statement that we have complied with relevant ethical requirements regarding independence, and to communicate with them all relationships and other matters that may reasonably be thought to bear on our independence, and where applicable, actions taken to eliminate threats or safeguards applied.
From the matters communicated with the directors, we determine those matters that were of most significance in the audit of the consolidated and separate financial statements of the current period and are therefore the key audit matters. We
INDEPENDENT AUDITOR’S REPORT TO THE SHAREHOLDERS OF PEPKOR HOLDINGS LIMITED continuedfor the year ended 30 September 2020
PEPKOR CONSOLIDATED AND SEPARATE ANNUAL FINANCIAL STATEMENTS for the year ended 30 September 2020
22
describe these matters in our auditor’s report unless law or regulation precludes public disclosure about the matter or when, in extremely rare circumstances, we determine that a matter should not be communicated in our report because the adverse consequences of doing so would reasonably be expected to outweigh the public interest benefits of such communication.
Report on other legal and regulatory requirements In terms of the IRBA Rule published in Government Gazette Number 39475 dated 4 December 2015, we report that PricewaterhouseCoopers Inc. has been the auditor of Pepkor Holdings Limited for three years.
PricewaterhouseCoopers Inc.Director: D de JagerRegistered auditorStellenbosch15 December 2020
INDEPENDENT AUDITOR’S REPORT TO THE SHAREHOLDERS OF PEPKOR HOLDINGS LIMITED continuedfor the year ended 30 September 2020
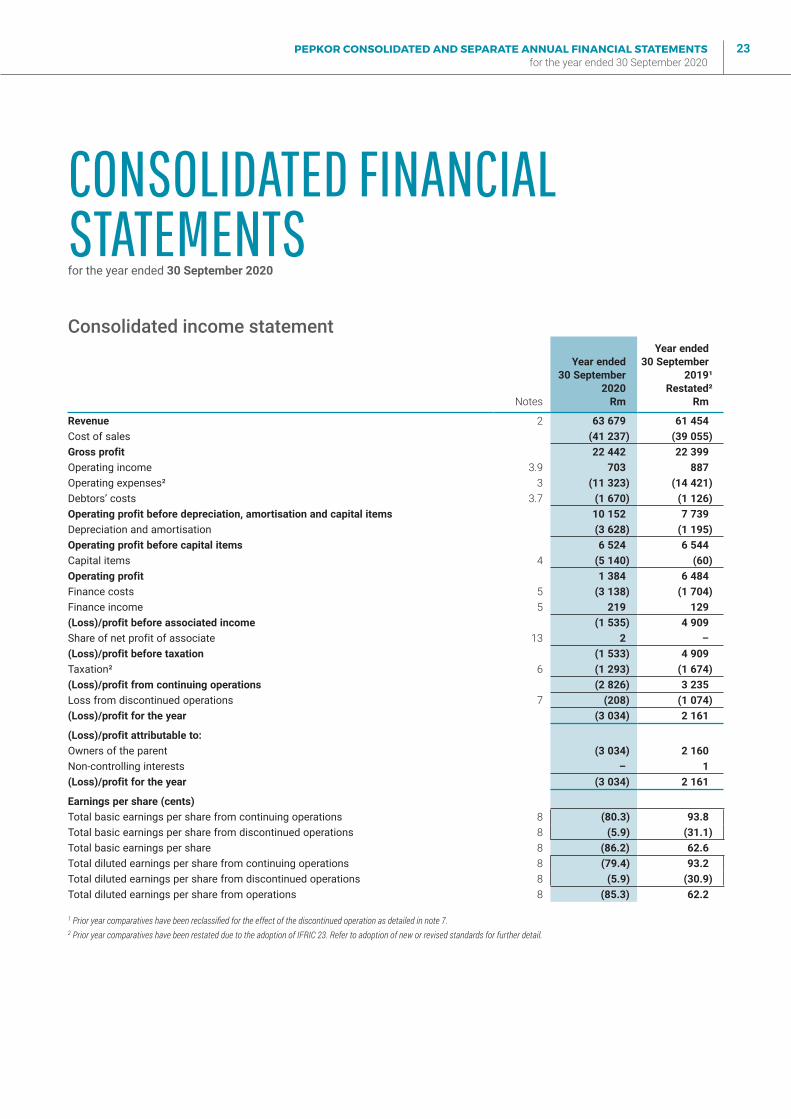
PEPKOR CONSOLIDATED AND SEPARATE ANNUAL FINANCIAL STATEMENTS for the year ended 30 September 2020
23
CONSOLIDATED FINANCIAL STATEMENTSfor the year ended 30 September 2020
Consolidated income statement
Notes
Year ended30 September
2020Rm
Year ended30 September
2019¹Restated²
Rm
Revenue 2 63 679 61 454 Cost of sales (41 237) (39 055)Gross profit 22 442 22 399 Operating income 3.9 703 887 Operating expenses² 3 (11 323) (14 421)Debtors’ costs 3.7 (1 670) (1 126)Operating profit before depreciation, amortisation and capital items 10 152 7 739 Depreciation and amortisation (3 628) (1 195)Operating profit before capital items 6 524 6 544 Capital items 4 (5 140) (60)Operating profit 1 384 6 484 Finance costs 5 (3 138) (1 704)Finance income 5 219 129 (Loss)/profit before associated income (1 535) 4 909 Share of net profit of associate 13 2 – (Loss)/profit before taxation (1 533) 4 909 Taxation² 6 (1 293) (1 674)(Loss)/profit from continuing operations (2 826) 3 235 Loss from discontinued operations 7 (208) (1 074)(Loss)/profit for the year (3 034) 2 161
(Loss)/profit attributable to:Owners of the parent (3 034) 2 160 Non-controlling interests – 1 (Loss)/profit for the year (3 034) 2 161
Earnings per share (cents)Total basic earnings per share from continuing operations 8 (80.3) 93.8Total basic earnings per share from discontinued operations 8 (5.9) (31.1)Total basic earnings per share 8 (86.2) 62.6Total diluted earnings per share from continuing operations 8 (79.4) 93.2 Total diluted earnings per share from discontinued operations 8 (5.9) (30.9)Total diluted earnings per share from operations 8 (85.3) 62.2
1 Prior year comparatives have been reclassified for the effect of the discontinued operation as detailed in note 7.2 Prior year comparatives have been restated due to the adoption of IFRIC 23. Refer to adoption of new or revised standards for further detail.
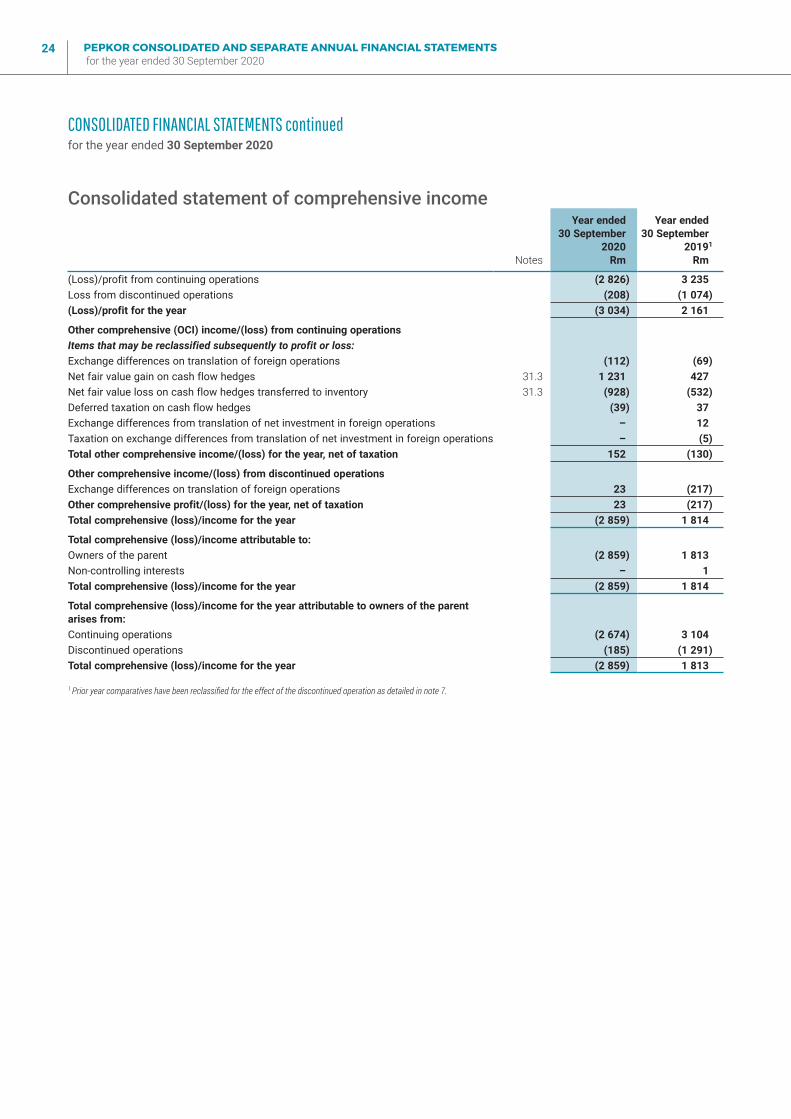
PEPKOR CONSOLIDATED AND SEPARATE ANNUAL FINANCIAL STATEMENTS for the year ended 30 September 2020
24
CONSOLIDATED FINANCIAL STATEMENTS continuedfor the year ended 30 September 2020
Consolidated statement of comprehensive income
Notes
Year ended30 September
2020Rm
Year ended 30 September
20191
Rm
(Loss)/profit from continuing operations (2 826) 3 235 Loss from discontinued operations (208) (1 074)(Loss)/profit for the year (3 034) 2 161
Other comprehensive (OCI) income/(loss) from continuing operationsItems that may be reclassified subsequently to profit or loss:Exchange differences on translation of foreign operations (112) (69)Net fair value gain on cash flow hedges 31.3 1 231 427 Net fair value loss on cash flow hedges transferred to inventory 31.3 (928) (532)Deferred taxation on cash flow hedges (39) 37 Exchange differences from translation of net investment in foreign operations – 12 Taxation on exchange differences from translation of net investment in foreign operations – (5)Total other comprehensive income/(loss) for the year, net of taxation 152 (130)
Other comprehensive income/(loss) from discontinued operationsExchange differences on translation of foreign operations 23 (217)Other comprehensive profit/(loss) for the year, net of taxation 23 (217)Total comprehensive (loss)/income for the year (2 859) 1 814
Total comprehensive (loss)/income attributable to:Owners of the parent (2 859) 1 813 Non-controlling interests – 1 Total comprehensive (loss)/income for the year (2 859) 1 814
Total comprehensive (loss)/income for the year attributable to owners of the parent arises from:Continuing operations (2 674) 3 104 Discontinued operations (185) (1 291)Total comprehensive (loss)/income for the year (2 859) 1 813
1 Prior year comparatives have been reclassified for the effect of the discontinued operation as detailed in note 7.
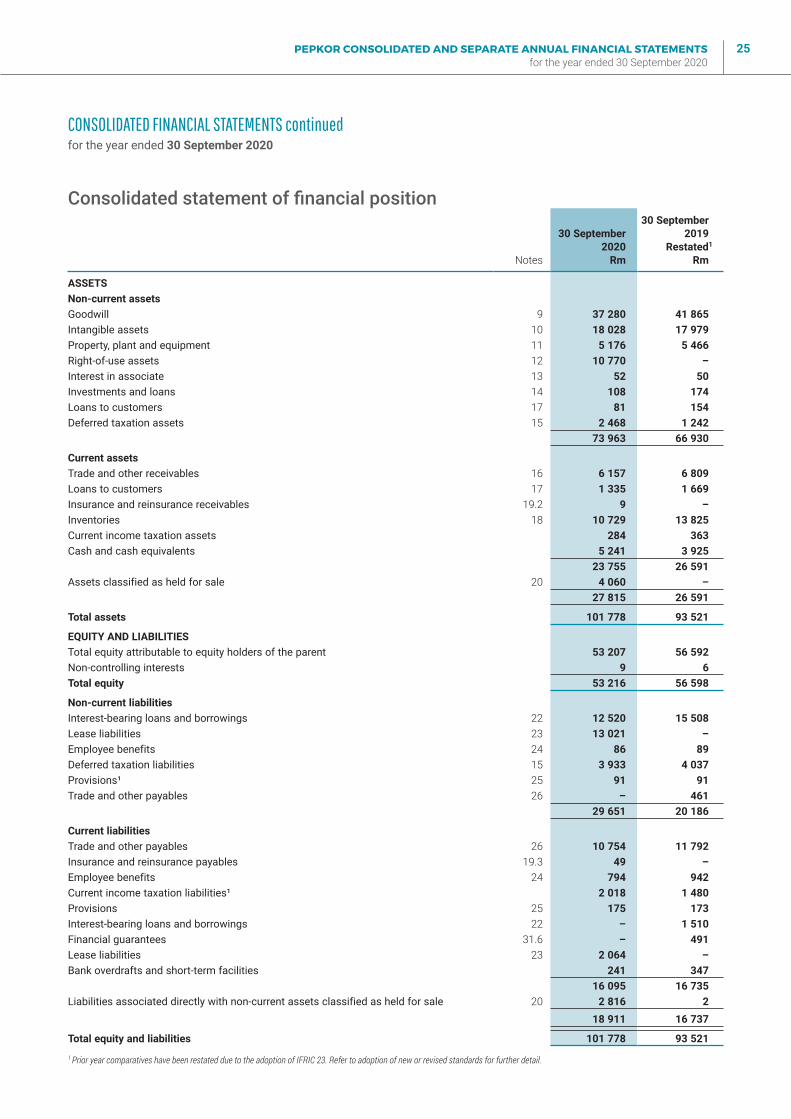
PEPKOR CONSOLIDATED AND SEPARATE ANNUAL FINANCIAL STATEMENTS for the year ended 30 September 2020
25
CONSOLIDATED FINANCIAL STATEMENTS continuedfor the year ended 30 September 2020
Consolidated statement of financial position
Notes
30 September2020
Rm
30 September2019
Restated1
Rm
ASSETSNon-current assetsGoodwill 9 37 280 41 865 Intangible assets 10 18 028 17 979 Property, plant and equipment 11 5 176 5 466 Right-of-use assets 12 10 770 –Interest in associate 13 52 50 Investments and loans 14 108 174 Loans to customers 17 81 154 Deferred taxation assets 15 2 468 1 242
73 963 66 930
Current assetsTrade and other receivables 16 6 157 6 809 Loans to customers 17 1 335 1 669 Insurance and reinsurance receivables 19.2 9 –Inventories 18 10 729 13 825 Current income taxation assets 284 363 Cash and cash equivalents 5 241 3 925
23 755 26 591 Assets classified as held for sale 20 4 060 –
27 815 26 591
Total assets 101 778 93 521
EQUITY AND LIABILITIESTotal equity attributable to equity holders of the parent 53 207 56 592 Non-controlling interests 9 6 Total equity 53 216 56 598
Non-current liabilitiesInterest-bearing loans and borrowings 22 12 520 15 508 Lease liabilities 23 13 021 –Employee benefits 24 86 89 Deferred taxation liabilities 15 3 933 4 037 Provisions¹ 25 91 91 Trade and other payables 26 – 461
29 651 20 186
Current liabilitiesTrade and other payables 26 10 754 11 792 Insurance and reinsurance payables 19.3 49 –Employee benefits 24 794 942 Current income taxation liabilities¹ 2 018 1 480 Provisions 25 175 173 Interest-bearing loans and borrowings 22 – 1 510 Financial guarantees 31.6 – 491 Lease liabilities 23 2 064 –Bank overdrafts and short-term facilities 241 347
16 095 16 735 Liabilities associated directly with non-current assets classified as held for sale 20 2 816 2
18 911 16 737
Total equity and liabilities 101 778 93 521
1 Prior year comparatives have been restated due to the adoption of IFRIC 23. Refer to adoption of new or revised standards for further detail.
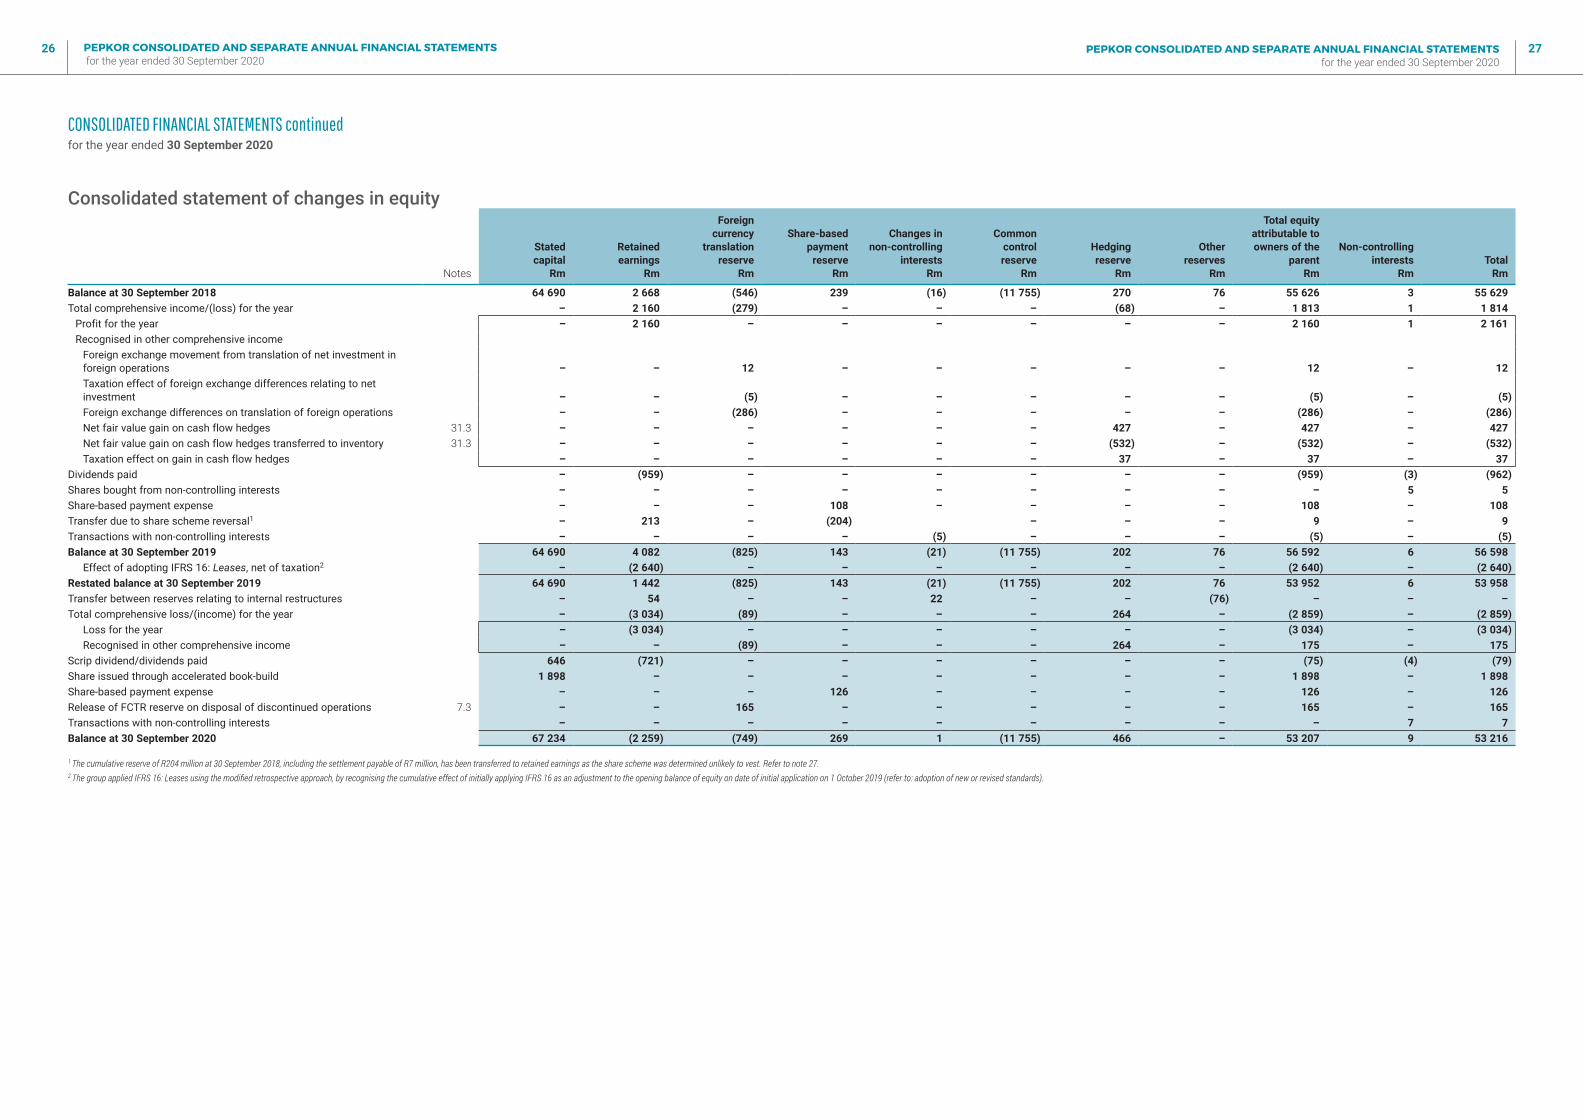
PEPKOR CONSOLIDATED AND SEPARATE ANNUAL FINANCIAL STATEMENTS for the year ended 30 September 2020
27PEPKOR CONSOLIDATED AND SEPARATE ANNUAL FINANCIAL STATEMENTS for the year ended 30 September 2020
26
CONSOLIDATED FINANCIAL STATEMENTS continuedfor the year ended 30 September 2020
Consolidated statement of changes in equity
Notes
Statedcapital
Rm
Retainedearnings
Rm
Foreigncurrency
translationreserve
Rm
Share-basedpayment
reserveRm
Changes innon-controlling
interestsRm
Commoncontrolreserve
Rm
Hedgingreserve
Rm
Otherreserves
Rm
Total equityattributable toowners of the
parentRm
Non-controllinginterests
RmTotal
Rm
Balance at 30 September 2018 64 690 2 668 (546) 239 (16) (11 755) 270 76 55 626 3 55 629 Total comprehensive income/(loss) for the year – 2 160 (279) – – – (68) – 1 813 1 1 814
Profit for the year – 2 160 – – – – – – 2 160 1 2 161 Recognised in other comprehensive income
Foreign exchange movement from translation of net investment in foreign operations – – 12 – – – – – 12 – 12 Taxation effect of foreign exchange differences relating to net investment – – (5) – – – – – (5) – (5)Foreign exchange differences on translation of foreign operations – – (286) – – – – – (286) – (286)Net fair value gain on cash flow hedges 31.3 – – – – – – 427 – 427 – 427 Net fair value gain on cash flow hedges transferred to inventory 31.3 – – – – – – (532) – (532) – (532)Taxation effect on gain in cash flow hedges – – – – – – 37 – 37 – 37
Dividends paid – (959) – – – – – – (959) (3) (962)Shares bought from non-controlling interests – – – – – – – – – 5 5 Share-based payment expense – – – 108 – – – – 108 – 108 Transfer due to share scheme reversal1 – 213 – (204) – – – 9 – 9 Transactions with non-controlling interests – – – – (5) – – – (5) – (5)Balance at 30 September 2019 64 690 4 082 (825) 143 (21) (11 755) 202 76 56 592 6 56 598
Effect of adopting IFRS 16: Leases, net of taxation2 – (2 640) – – – – – – (2 640) – (2 640)Restated balance at 30 September 2019 64 690 1 442 (825) 143 (21) (11 755) 202 76 53 952 6 53 958 Transfer between reserves relating to internal restructures – 54 – – 22 – – (76) – – –Total comprehensive loss/(income) for the year – (3 034) (89) – – – 264 – (2 859) – (2 859)
Loss for the year – (3 034) – – – – – – (3 034) – (3 034)Recognised in other comprehensive income – – (89) – – – 264 – 175 – 175
Scrip dividend/dividends paid 646 (721) – – – – – – (75) (4) (79)Share issued through accelerated book-build 1 898 – – – – – – – 1 898 – 1 898 Share-based payment expense – – – 126 – – – – 126 – 126 Release of FCTR reserve on disposal of discontinued operations 7.3 – – 165 – – – – – 165 – 165 Transactions with non-controlling interests – – – – – – – – – 7 7 Balance at 30 September 2020 67 234 (2 259) (749) 269 1 (11 755) 466 – 53 207 9 53 216
1 The cumulative reserve of R204 million at 30 September 2018, including the settlement payable of R7 million, has been transferred to retained earnings as the share scheme was determined unlikely to vest. Refer to note 27.2 The group applied IFRS 16: Leases using the modified retrospective approach, by recognising the cumulative effect of initially applying IFRS 16 as an adjustment to the opening balance of equity on date of initial application on 1 October 2019 (refer to: adoption of new or revised standards).
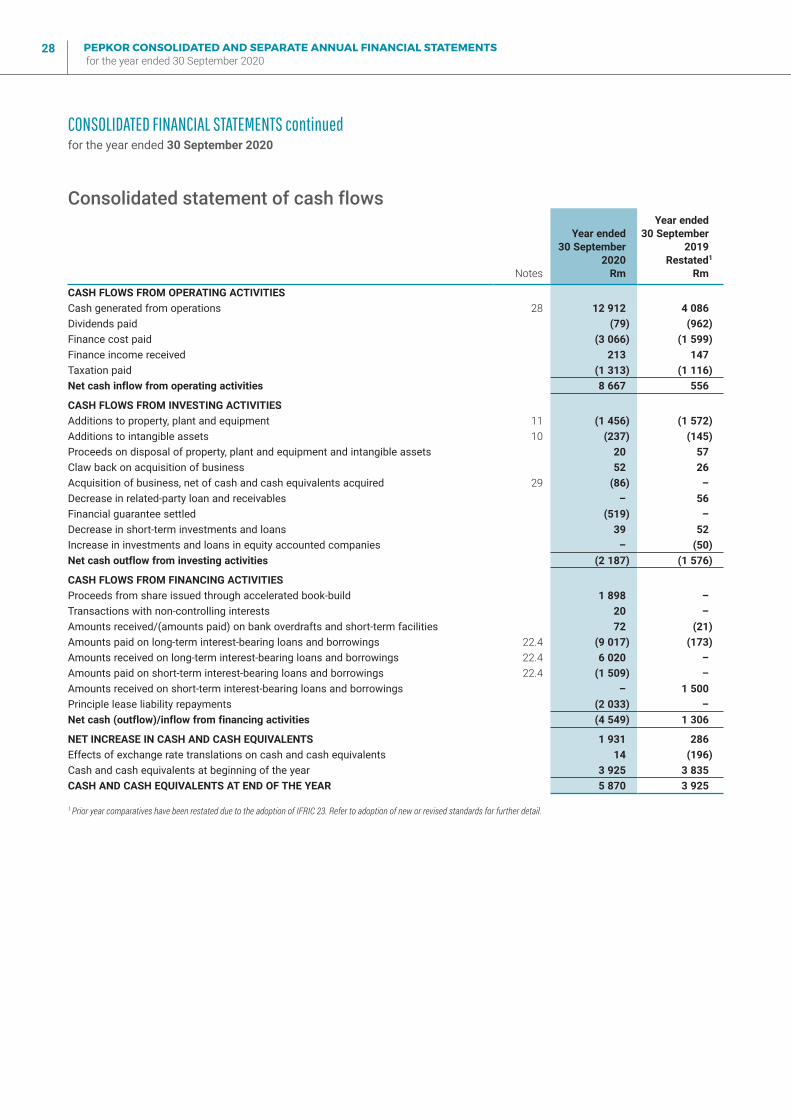
PEPKOR CONSOLIDATED AND SEPARATE ANNUAL FINANCIAL STATEMENTS for the year ended 30 September 2020
28
Consolidated statement of cash flows
Notes
Year ended30 September
2020Rm
Year ended30 September
2019Restated1
Rm
CASH FLOWS FROM OPERATING ACTIVITIESCash generated from operations 28 12 912 4 086 Dividends paid (79) (962)Finance cost paid (3 066) (1 599)Finance income received 213 147 Taxation paid (1 313) (1 116)Net cash inflow from operating activities 8 667 556
CASH FLOWS FROM INVESTING ACTIVITIESAdditions to property, plant and equipment 11 (1 456) (1 572)Additions to intangible assets 10 (237) (145)Proceeds on disposal of property, plant and equipment and intangible assets 20 57 Claw back on acquisition of business 52 26 Acquisition of business, net of cash and cash equivalents acquired 29 (86) –Decrease in related-party loan and receivables – 56 Financial guarantee settled (519) –Decrease in short-term investments and loans 39 52 Increase in investments and loans in equity accounted companies – (50)Net cash outflow from investing activities (2 187) (1 576)
CASH FLOWS FROM FINANCING ACTIVITIESProceeds from share issued through accelerated book-build 1 898 –Transactions with non-controlling interests 20 –Amounts received/(amounts paid) on bank overdrafts and short-term facilities 72 (21)Amounts paid on long-term interest-bearing loans and borrowings 22.4 (9 017) (173)Amounts received on long-term interest-bearing loans and borrowings 22.4 6 020 –Amounts paid on short-term interest-bearing loans and borrowings 22.4 (1 509) –Amounts received on short-term interest-bearing loans and borrowings – 1 500 Principle lease liability repayments (2 033) –Net cash (outflow)/inflow from financing activities (4 549) 1 306
NET INCREASE IN CASH AND CASH EQUIVALENTS 1 931 286 Effects of exchange rate translations on cash and cash equivalents 14 (196)Cash and cash equivalents at beginning of the year 3 925 3 835 CASH AND CASH EQUIVALENTS AT END OF THE YEAR 5 870 3 925
1 Prior year comparatives have been restated due to the adoption of IFRIC 23. Refer to adoption of new or revised standards for further detail.
CONSOLIDATED FINANCIAL STATEMENTS continuedfor the year ended 30 September 2020
PEPKOR CONSOLIDATED AND SEPARATE ANNUAL FINANCIAL STATEMENTS for the year ended 30 September 2020
29
Statement of complianceThe consolidated and separate annual financial statements have been prepared in accordance with IFRS and its interpretations adopted by the International Accounting Standards Board (IASB), the South African Institute of Chartered Accountants (SAICA), Financial Reporting Guides as issued by the Accounting Practices Committee, Financial Pronouncements as issued by the Financial Reporting Standards Council (FRSC), the requirements of the Companies Act and the JSE Listings and Debt Listings Requirements.
Basis of preparationThe consolidated and separate annual financial statements are prepared on the historical cost and going concern bases, except where otherwise indicated. The presentation and functional currency is the South African rand, rounded to the nearest million, except where otherwise indicated.
The preparation of financial statements in conformity with IFRS requires management to make judgements, estimates and assumptions that may affect the application of policies and reported amounts of assets, liabilities, income and expenses. The estimates and associated assumptions are based on historical experience and various other factors that are believed to be reasonable under the circumstances, the results of which form the basis of making the judgements about carrying values of assets and liabilities that are not readily apparent from other sources.
The financial statements are prepared under the historical cost convention adjusted for the effects of inflation where entities operate in hyperinflationary economies and for the revaluation of certain financial instruments to fair value. During the year, the Angolan economy was considered in accordance with the accounting principles set out in IAS 29: Financial Reporting in Hyperinflationary Economies, and has been considered to be out of hyperinflation for the 2020 and 2019 financial years. The Zimbabwean economy was deemed to be in hyperinflation for the 2020 and 2019 financial years, but the effect thereof has been assessed to be immaterial for the group.
The estimates and underlying assumptions are reviewed on an ongoing basis. Revisions to accounting estimates are recognised in the period in which the estimate is revised if the revision only affects that period, or in the period of the revision and future periods if the revision affects both current and future periods.
SUMMARY OF ACCOUNTING POLICIESfor the year ended 30 September 2020
Judgements made by management in the application of IFRS that have a significant effect on the financial statements and estimates with a significant risk of material adjustment in the next financial year are discussed under judgements and estimates.
Fair value is the price that would be received to sell an asset or paid to transfer a liability in an orderly transaction between market participants at the measurement date, regardless of whether that price is directly observable or estimated using another valuation technique. In estimating the fair value of an asset or a liability, the group takes into account the characteristics of the asset or liability if market participants would take those characteristics into account when pricing the asset or liability at the measurement date. Fair value for measurement and/or disclosure purposes in these annual financial statements is determined on such a basis, except for share-based payment transactions that are within the scope of IFRS 2: Share-based Payments, leasing transactions that are within the scope of IAS 17: Leases in the prior financial year, and measurements that have some similarities to fair value but are not fair value, such as net realisable value in IAS 2: Inventories or value in use in IAS 36: Impairment of Assets.
In addition, for financial reporting purposes, fair value measurements are categorised into level 1, 2 or 3 based on the degree to which the inputs to the fair value measurements are observable and the significance of the inputs to the fair value measurement in its entirety, which are defined as follows:
� Level 1 inputs are quoted prices (unadjusted) in active markets for identical assets or liabilities that the entity can assess at the measurement date.
� Level 2 inputs are inputs, other than quoted prices included in level 1, that are observable for the asset or liability, either directly or indirectly.
� Level 3 inputs are unobservable inputs for the asset or liability.
The material accounting policies applied by the group and the company, as well as accounting policies where IFRS allows choice, are set out below and have been applied consistently to the periods presented in these consolidated annual financial statements, except where stated otherwise.
The accounting policies have been applied consistently by all the group entities.
PEPKOR CONSOLIDATED AND SEPARATE ANNUAL FINANCIAL STATEMENTS for the year ended 30 September 2020
30
Basis of preparation – common control transactionsIFRS do not provide guidance on the accounting for common control transactions. In the absence of specific guidance relating to common control transactions, entities should select an appropriate accounting policy using the hierarchy described in IAS 8: Accounting policies, Changes in Accounting Estimates and Errors. The hierarchy permits the consideration of pronouncements of other standard-setting bodies.
The acquisition by the group of Pepkor Holdco group, SA Poco Retail Proprietary Limited, JD Group Proprietary Limited and Tekkie Town Proprietary Limited from Steinhoff in 2017 meets the definition of a common control transaction as all the combining entities are ultimately controlled by the same party, being Steinhoff, before and after the combination, and that control is not transitory.
The group accounted for the common control transaction by applying the predecessor method, that is the assets and liabilities of the acquired entities are stated at their predecessor carrying amounts, being the carrying amount of these assets and liabilities in Steinhoff’s consolidated financial statements.
The transaction was accounted for retrospectively as though the group was always in existence, using the results from the date that each entity joined the group, where such a date is later.
No new goodwill arises on the transaction. Instead, any difference between the value of the shares issued and the aggregate book value of the assets and liabilities of the acquired entities at the date of the transaction is included in a common control reserve within equity.
Earnings per share, diluted earnings per share and headline earnings per shareThe calculation of the weighted average number of shares weighed the shares issued in terms of IAS 33: Earnings per share.
Basis of consolidationSubsidiariesSubsidiaries are entities controlled by the group (including structured entities). An investor controls an investee when the investor is exposed, or has rights, to variable returns from its involvement with the investee and has the ability to affect those returns through its power over the investee. In assessing control, substantive rights relating to an investee are taken into account. For a right to be substantive, the holder must have the practical ability to exercise that right.
On acquisition, the assets, liabilities and contingent liabilities of a subsidiary are measured at their fair value at the date of acquisition. Any difference between the cost of acquisition and the group’s share of the net identifiable assets, liabilities and contingent liabilities, fairly valued, is recognised and treated in terms of the group’s accounting policy for goodwill. All intergroup assets, liabilities, equity, income, expenses and cash flows relating to transactions between group entities are eliminated.
Non-controlling interests in the net assets (excluding goodwill) of consolidated subsidiaries are identified separately from the group’s equity therein. Non-controlling interests consist of the amount of those interests at the date of the original business combination and the non-controlling interests’ share of changes in equity since the date of the combination (the proportionate share method).
Subsequently, any losses applicable to the non-controlling interests are allocated to the non-controlling interests even if this results in the non-controlling interests having deficit balances.
Consolidation of a subsidiary begins when a company obtains control over a subsidiary and ceases when the company loses control over the subsidiary.
Contingent considerationContingent consideration is measured at fair value at each reporting date, and changes in fair value are recognised in profit or loss.
Premiums and discounts arising on subsequent purchases from, or sales to non-controlling interests in subsidiariesAny increases or decreases in ownership interest in subsidiaries without a change in control are recognised as equity transactions. The carrying amounts of the group’s interests and the non-controlling interests are adjusted to reflect the changes in their relative interests in the subsidiaries. Any differences between the amount by which the non-controlling interests are adjusted and the fair value of the consideration paid or received are recognised directly in equity and attributed to owners of the company.
Associate companiesThe company’s investments in the ordinary shares of its associates are carried at cost less impairment losses. Purchases and sales of these investments are recognised on the trade date at cost, including transaction costs.
Associates are those entities over which the group exercises significant influence but not control. Significant influence is presumed to exist when the group holds between 20% and 50% of the voting rights of another entity. The group’s investments in associates are accounted for using the equity
SUMMARY OF ACCOUNTING POLICIES continuedfor the year ended 30 September 2020
PEPKOR CONSOLIDATED AND SEPARATE ANNUAL FINANCIAL STATEMENTS for the year ended 30 September 2020
31
method and are initially recognised at cost. Investments in associates include goodwill identified on acquisition, net of any accumulated impairment losses.
The group’s share of post-acquisition profit or loss and its share of post-acquisition movements in OCI are recognised in the statement of comprehensive income and in OCI respectively, with a corresponding adjustment to the carrying amount of the investment, from the date that significant influence commences until the date that significant influence ceases. When the group’s share of losses in an associate equals or exceeds its investment in the associate, the group does not recognise further losses, unless it has incurred legal or constructive obligations or made payments on behalf of the associate.
GoodwillAll business combinations are accounted for by applying the acquisition method. Goodwill arising on the acquisition of a subsidiary represents the excess of the aggregate consideration transferred, non-controlling interest in the acquisition and in business combinations achieved in stages, the acquisition-date fair value of the acquirer’s previously held equity interest in the acquiree, over the group’s interest in the net fair value of the identifiable assets, liabilities and contingent liabilities of the subsidiary recognised at the date of acquisition. Goodwill is initially recognised as an asset at cost and is subsequently measured at cost less any accumulated impairment losses. An impairment loss in respect of goodwill is not reversed. Gains on bargain purchases arising on acquisition are recognised directly as capital items in profit or loss. Refer to significant judgements and estimates note, capital items (use of adjusted measures), for the treatment of the impairment.
Goodwill is allocated to groups of CGUs and is tested annually for impairment, or more frequently when there is an indication that the unit may be impaired. If the recoverable amount of the CGU is less than the carrying amount of the unit, the impairment loss is allocated first to reduce the carrying amount of any goodwill allocated to the unit and then to the other assets of the unit pro rata on the basis of the carrying amount of each asset in the unit.
On disposal of a subsidiary, the attributable amount of goodwill is included in the determination of the profit or loss on disposal.
Measurement period adjustments are adjustments that arise from additional information obtained during the ’measurement period’ (which cannot exceed one year from the acquisition date) about facts and circumstances that existed at the acquisition date.
If the initial accounting for a business combination is incomplete by the end of the reporting period in which the
combination occurs, the group reports provisional amounts for the items for which the accounting is incomplete. Those provisional amounts are adjusted during the measurement period, or additional assets or liabilities are recognised, to reflect new information obtained about facts and circumstances that existed at the acquisition date that, if known, would have affected the amounts recognised at that date.
Intangible assetsIntangible assets that are acquired by the group are stated at cost less accumulated amortisation and impairment losses. If an intangible asset is acquired in a business combination, the cost of that intangible asset is measured at its fair value at the acquisition date.
Computer softwareComputer software acquired from external suppliers is initially recognised at cost. Computer software development costs are capitalised if the recognition criteria outlined below under Research and development are met.
Research and developmentResearch costs are expensed as incurred. Development costs are recognised as an expense in the period in which they are incurred unless the technical feasibility of the asset has been demonstrated and the intention to complete and utilise the asset is confirmed. Capitalisation commences when it can be demonstrated how the intangible asset will generate probable future economic benefits, that it is technically feasible to complete the asset, that the intention and ability to complete and use the asset exist, that adequate financial, technical and other resources to complete the development are available and the costs attributable to the process or product can be identified separately and measured reliably. Where development costs are recognised, it has a finite useful life and is amortised over its useful life on a straight-line basis and is tested for impairment if indications of impairment exist.
Subsequent expenditureSubsequent expenditure on capitalised intangible assets is capitalised only when it increases the future economic benefits embodied in the specific asset to which it relates. All other expenditure is expensed as incurred.
AmortisationAmortisation of intangible assets is recognised in profit or loss on a straight-line basis over the assets’ estimated useful lives, unless such lives are indefinite. An intangible asset is regarded as having an indefinite useful life when, based on analysis of all relevant factors, there is no foreseeable limit to the period over which the asset is expected to generate net
SUMMARY OF ACCOUNTING POLICIES continuedfor the year ended 30 September 2020
PEPKOR CONSOLIDATED AND SEPARATE ANNUAL FINANCIAL STATEMENTS for the year ended 30 September 2020
32
cash inflows. Intangible assets with indefinite useful lives and intangible assets not yet available for use are not amortised but are tested annually for impairment, or more often when there is an indication that the asset may be impaired.
Other intangible assets are amortised from the date they are available for use.
Trade and brand names IndefiniteSoftware and enterprise resource planning (ERP) systems 1 – 8 years
The amortisation methods, estimated useful lives and residual values are reassessed annually, with the effect of any changes in estimate being accounted for on a prospective basis.
LeasesWhere the group is the lessee (until 30 September 2019)Leases of assets under which a significant portion of the risks and rewards of ownership are effectively retained by the lessor are classified as operating leases. Certain premises and other assets are leased. Payments made in respect of operating leases with a fixed escalation clause are charged to the statement of comprehensive income on a straight-line basis over the lease term. All other lease payments are expensed as they become due. Incentives paid to enter into a lease agreement are expensed in the statement of comprehensive income as operating lease expense over the lease term. Minimum rentals due for the non-cancellable periods after year-end are reflected under commitments. When an operating lease is terminated before the lease period has expired, any payment required to be made to the lessor by way of penalty is recognised as an expense and any unamortised portion of the fixed escalation lease accrual is recognised in the statement of comprehensive income in the period in which termination takes place.
Where the group is the lessee (from 1 October 2019)The group’s main leasing activities relate to that of retail stores, office space and distribution centres. On entering a contract, the group assesses whether a contract is, or contains, a lease based on the definition of a lease as per IFRS 16: Leases. The criteria to assess a contract include whether a contract involves the use of an identified asset, the group has the right to obtain substantially all of the economic benefits from the use of the asset throughout the period in use, and the group has the right to direct the use of the asset. The group then allocates the consideration in the contract to each lease component on the basis of its stand-alone price. The group has applied the practical expedient not to reassess any contract entered into before the initial recognition date.
If a contract is assessed to be, or contains, a lease, the group recognises a right-of-use asset and corresponding lease liability at the lease commencement date over the lease term. The group determines the lease term as the non-cancellable period of a lease, including any beneficial occupation periods, and assesses if the lessee is reasonably certain to exercise an option available on a lease to extend or terminate the lease.
Management exercises judgement to assess the likelihood of whether a lessee is reasonably certain to exercise an option to extend a lease, or not to exercise an option to terminate a lease. The lease term will not include any renewal options where there is no reasonable certainty that the lease will be renewed until the option is exercised.
Right-of-use assets are initially measured at cost, which is made up of the initial measurement of the lease liabilities, any initial direct costs incurred by the group, and any lease payments made in advance of the lease commencement date, less any lease incentives received. Right-of-use assets are subsequently measured at cost, less accumulated depreciation and impairment losses, and adjusted for any remeasurement of the related lease liabilities. The recognised right-of-use assets are depreciated on a straight-line basis over the shorter of the useful life or lease term as noted above. Right-of-use assets are tested for impairment as part of the CGU it relates to (i.e. retail store) when indicators of impairment are identified and are periodically reduced by the impairment losses, if required.
Lease liabilities are initially measured at the present value of future lease payments discounted using the discount rate implicit in the lease or, where this has not been stipulated, the group’s incremental borrowing rate. The lease payments include fixed payments less any lease incentives receivable, variable lease payments that are based on an index or rate, and amounts expected to be paid under residual value guarantees. The lease payments also include the exercise price of a purchase option reasonably certain to be exercised by the group and payments of penalties for terminating a lease, if the group exercises the option to terminate. Variable lease payments, that do not depend on an index or a rate, are recognised as an expense in the period in which the event or condition that triggers the payment occurs.
The incremental borrowing rate is the rate of interest that a lessee would have to pay to borrow over a similar term, and with a similar security, the funds necessary to obtain an asset of a similar value to the right-of-use asset in a similar economic environment.
Lease liabilities are subsequently measured at amortised cost using the effective interest method and reduced by future lease payments net of interest charged. It is remeasured, with a corresponding adjustment to right-of-use assets, when there
SUMMARY OF ACCOUNTING POLICIES continuedfor the year ended 30 September 2020
PEPKOR CONSOLIDATED AND SEPARATE ANNUAL FINANCIAL STATEMENTS for the year ended 30 September 2020
33
is a change in future lease payments resulting from a rent review, change in relevant index or rate, such as inflation, or change in the group’s assessment of whether it is reasonably certain to exercise a renewal or termination option and thus a change in lease term. The lease liability is remeasured by discounting the revised lease payments using a revised discount rate when there is a change in the lease terms. The remeasurement results in a corresponding adjustment to the carrying amount of right-of-use assets, with the difference recorded in profit or loss if the carrying amount of right-of-use assets has been reduced to zero.
Where the group is the lessorPortions of owner-occupied properties and leased properties are leased or subleased under operating leases. The owner-occupied properties are included in property, plant and equipment in the statement of financial position. Rental income in respect of operating leases with a fixed escalation clause is recognised on a straight-line basis over the lease term. Incentives received to enter into a lease agreement are released to the statement of comprehensive income as operating lease income over the lease term. All other rental income is recognised as it becomes due. When an operating lease is terminated before the lease period has expired, any payment received from the lessee by way of penalty is recognised as income and any unamortised portion of the fixed escalation lease accrual is recognised in the statement of comprehensive income in the period in which termination takes place. The group did not need to make any adjustments to the accounting for assets held as lessor as a result of adopting IFRS 16: Leases.
Property, plant and equipmentOwned assetsProperty, plant and equipment are stated at cost to the group, less accumulated depreciation and impairment losses.
Leased assets (until 30 September 2019)Leases that transfer substantially all the risks and rewards of ownership of the underlying asset to the group are classified as finance leases. All other leases are classified as operating leases. Assets acquired in terms of finance leases are capitalised at the lower of fair value and the present value of the minimum lease payments at inception of the lease.
The capital element of future obligations under the leases is included as a liability in the statement of financial position. Lease payments are allocated using the effective interest method to determine the lease finance costs, which are charged against income over the lease period, and the capital repayment, which reduces the liability to the lessor.
Subsequent costsThe group recognises in the carrying amount of an item of property, plant and equipment the cost of replacing part of such an item when the cost is incurred, if it is probable that additional future economic benefits embodied within the item will flow to the group and the cost of such item can be measured reliably. Costs of the day-to-day servicing of property, plant and equipment are recognised in profit or loss as an expense when incurred.
DepreciationDepreciation is recognised in profit or loss on a straight-line basis at rates that will reduce the book values to estimated residual values over the estimated useful lives of the assets.
Land is not depreciated. Leasehold improvements on premises occupied under operating leases are written off over their expected useful lives or, where shorter, the term of the relevant lease.
The depreciation methods, estimated useful lives and residual values are reassessed annually, with the effect of any changes in estimate being accounted for on a prospective basis.
Management determines the estimated useful lives, residual values and the related depreciation charges at acquisition. The estimates are reviewed at each reporting date. If appropriate, adjustments are made and accounted for prospectively as a change in estimate:
Buildings 5 – 50 yearsComputer equipment 2 – 4 yearsMotor vehicles 4 – 10 yearsOffice equipment 3 – 16 yearsFurniture and fittings 3 – 10 years
Until 30 September 2019: Assets held under finance leases are depreciated over their expected useful lives on the same basis as owned assets or, where shorter, the term of the relevant lease.
Effect of hyperinflationIn the current year, PEP Africa’s Angolan operations were assessed in accordance with the criteria stipulated in IAS 29: Financial Reporting in Hyperinflationary Economies and, based on the factors indicated under judgements, concluded that the country was no longer considered in a hyperinflationary economy. During the prior year, PEP Africa’s operations in Angola were reported in accordance with IAS 29: Financial Reporting in Hyperinflationary Economies following its classification as a hyperinflationary economy. Contributing less than 1% to group revenue, the classification did not significantly affect Pepkor’s results in the prior year, increasing operating profit by R35 million.
SUMMARY OF ACCOUNTING POLICIES continuedfor the year ended 30 September 2020
PEPKOR CONSOLIDATED AND SEPARATE ANNUAL FINANCIAL STATEMENTS for the year ended 30 September 2020
34
TaxationCurrent taxationIncome taxation on the profit or loss for the year comprises current and deferred taxation. Income taxation is recognised in profit or loss except to the extent that it relates to items recognised directly in OCI or equity, in which case it is recognised directly in OCI or equity.
Current taxation is the expected taxation payable on the taxable income for the year, using taxation rates enacted or substantially enacted at the reporting date, and any adjustment to taxation payable in respect of previous years.
Deferred taxationDeferred taxation is provided for using the statement of financial position liability method in respect of temporary differences arising from differences between the carrying amount of assets and liabilities for financial reporting purposes and the amounts used in the computation of taxable income. The following temporary differences are not provided for: goodwill not deductible for taxation purposes; the initial recognition of assets or liabilities that affect neither accounting nor taxable profit; and differences relating to investments in subsidiaries to the extent that they will not reverse in the foreseeable future.
Deferred taxation liabilities are recognised for taxable temporary differences arising on investments in subsidiaries, except where the group is able to control the reversal of the temporary differences and it is probable that the temporary differences will not reverse in the foreseeable future.
Deferred taxation assets and liabilities are offset when there is a legally enforceable right to set off current taxation assets against current taxation liabilities and when they relate to income taxes levied by the same taxation authority and the group intends to settle its current taxation assets and liabilities on a net basis.
Deferred taxation assets and liabilities are measured at the taxation rates that are expected to apply in the period in which the liability is settled or the asset realised, based on the taxation rates (and taxation laws) that have been enacted or substantively enacted by the reporting date. The measurement of deferred taxation liabilities and assets reflects the taxation consequences that would follow from the manner in which the group expects, at the reporting date, to recover or settle the carrying amount of its assets and liabilities.
A deferred taxation asset is recognised only to the extent that it is probable that future taxable profits will be available against which the asset will be utilised. Deferred taxation assets are reduced to the extent that it is no longer probable that the related taxation benefit will be realised.
InventoriesInventories are stated at the lower of cost and net realisable value. Net realisable value is the estimated selling price in the ordinary course of business, less the estimated costs of completion and selling and distribution expenses. Merchandise, raw materials and consumables are initially recognised at cost, determined using the weighted average cost formula.
The cost of inventories includes expenditure incurred in acquiring the inventories and bringing them to their existing location and condition. The cost of inventory is the net of: invoice price of merchandise, insurance, freight; customs duties, an appropriate allocation of distribution costs between distribution centres and stores, trade discounts, advertising and other rebates and settlement discounts.
Where necessary, the carrying amounts of inventory are adjusted for shrinkage, obsolescence and markdowns.
Insurance receivables and payablesClassification Insurance contracts are those contracts that transfer significant risk. The group defines significant insurance risk as the possibility of having to pay benefits on the occurrence of an insured event in terms of the cover given to the insured.
Contracts entered into with reinsurers under which the group’s insurer is compensated for losses on contracts issued by it and that meet the requirements for insurance contracts are classified as reinsurance contracts held. Insurance contracts entered into by the group’s insurer under which the contract holder is another insurer (inward reinsurance) are included with insurance contracts.
Initial recognition and measurement Insurance receivables Insurance receivables are recognised when due and measured on initial recognition at the fair value of the consideration received or receivable. Subsequent to initial recognition, insurance receivables are measured at amortised cost, using the effective interest rate method. The carrying value of insurance receivables is reviewed for impairment using the general expected credit loss (ECL) model, with the impairment loss recorded in the income statement. Insurance receivables are derecognised when the derecognition criteria for financial assets have been met.
Insurance payables Insurance contract liabilities include the outstanding claims provision and the provision for unearned premiums. The outstanding claims provision is based on the estimated ultimate cost of all claims incurred but not settled at the
SUMMARY OF ACCOUNTING POLICIES continuedfor the year ended 30 September 2020
PEPKOR CONSOLIDATED AND SEPARATE ANNUAL FINANCIAL STATEMENTS for the year ended 30 September 2020
35
reporting date, whether reported or not, together with related claims handling costs. The liability is calculated at the reporting date using a range of standard actuarial claim projection techniques, based on empirical data and current assumptions that may include a margin for adverse deviation. The liability is not discounted for the time value of money. No provision is recognised for equalisation or catastrophe reserves. The liabilities are derecognised when the obligation to pay a claim expires, is discharged or is cancelled.
The provision for unearned premiums represents that portion of premiums received or receivable that relates to risks that have not yet expired at the reporting date. The provision is recognised when contracts are entered into and premiums are charged. It is brought to account as premium income over the term of the contract in accordance with the pattern of insurance service provided under the contract.
Non-current assets held for sale and discontinued operationsNon-current assets and disposal groups are classified as held for sale if their carrying amount will be recovered principally through a sale transaction rather than through continuing use. This condition is regarded as met only when the sale is highly probable and the asset (or disposal group) is available for immediate sale in its present condition. Management must be committed to the sale, which should be expected to qualify for recognition as a completed sale within one year from the date of classification. These assets may be a component of an entity, a disposal group or an individual non-current asset. On initial classification as held for sale, non-current assets and disposal groups are recognised at the lower of its carrying amount and fair value less costs to sell.
A discontinued operation is a component of the group’s business that represents a separate major line of business or geographical area of operation, or a subsidiary acquired exclusively with a view to resell. Classification as a discontinued operation occurs on disposal or when the operation meets the criteria to be classified as held for sale.
Share capitalDividendsNon-discretionary dividends on preference shares are recognised as a liability and recognised as an interest expense using the effective interest method. Other dividends are recognised as a liability in the period in which they are declared.
Share-based payment transactionsEquity settledThe fair value of the share rights granted to employees is recognised as an employee expense with a corresponding increase in equity. The fair value is measured at grant date and is expensed over the period during which the employees are required to provide services in order to become unconditionally entitled to the equity instruments. The fair value of the instruments granted is measured using the Monte Carlo simulation model, taking into account the terms and conditions on which the instruments are granted. At the end of each period, the entity revises its estimates of the number of share rights that are expected to vest based on the non-market vesting and service conditions. It recognises the impact of the revision to original estimates, if any, in profit or loss, with a corresponding adjustment to equity.
Group share-based payment transactionsTransactions in which a parent grants rights to its equity instruments directly to the employees of its subsidiaries are classified as equity settled in the financial statements of the subsidiary as the entity does not have the obligation to settle the share-based payment transaction.
The subsidiary recognises the services acquired with the share-based payment as an expense and recognises a corresponding increase in equity representing a capital contribution from the parent for those services acquired. The parent recognises in equity the equity-settled share-based payment and recognises a corresponding increase in the investment in subsidiary.
A recharge arrangement exists whereby the subsidiary is required to fund the difference between the exercise price on the share rights and the market price of the share at the time of exercising the right. The recharge arrangement is accounted for separately from the underlying equity-settled share-based payment as follows on initial recognition:
� The subsidiary recognises a share scheme settlement provision at fair value, using cash-settled share-based payment principles; and
� The parent recognises a corresponding share scheme settlement asset at fair value and a corresponding adjustment to the carrying amount of the investment in the subsidiary.
Subsequent to initial recognition, the recharge arrangement is remeasured at fair value at each subsequent reporting date until settlement date to the extent vested. At each reporting date, the unvested rights are adjusted by the number of rights forfeited during the year, to reflect the actual number of instruments outstanding. Where the settlement provision recognised is greater than the initial capital contribution recognised by the subsidiary in respect of the share-based
SUMMARY OF ACCOUNTING POLICIES continuedfor the year ended 30 September 2020
PEPKOR CONSOLIDATED AND SEPARATE ANNUAL FINANCIAL STATEMENTS for the year ended 30 September 2020
36
payment, the excess is recognised as a net capital distribution to the parent. The amount of the settlement asset in excess of the capital contribution recognised as an increase in the investment in subsidiary is deferred and recognised as dividend income by the parent when settled by the subsidiary.
ProvisionsProvisions are recognised when the group has a present constructive or legal obligation as a result of a past event, and when it is probable that it will result in an outflow of economic benefits that can be reasonably estimated.
If the effect is material, provisions are determined by discounting the expected future cash flows that reflect current market assessments of the time value of money and, where appropriate, the risks specific to the liability.
WarrantiesA provision for warranties is recognised when the underlying products or services are sold. The provision is based on historical warranty data and a weighting of all possible outcomes against their associated probabilities.
Financial guaranteesFinancial guarantee contracts issued by the group are those contracts that require a payment to be made to reimburse the holder for a loss it incurs because the specified party fails to make a payment when it becomes due, in accordance with the terms of a debt instrument. The liability is initially measured at fair value and subsequently at the higher of the amount determined in accordance with the expected credit loss model under IFRS 9: Financial Instruments and the amount initially recognised less, where appropriate, the cumulative amount of income recognised in accordance with the principles of IFRS 15: Revenue from Contracts with Customers. Intragroup financial guarantees are eliminated on consolidation.
RestructuringA provision for restructuring is recognised when the group has approved a detailed and formal restructuring plan, and the restructuring has either commenced or has been announced publicly. Future operating costs are not provided for.
Dilapidation and onerous contracts (until 30 September 2019)A provision for dilapidation and onerous contracts is recognised when the expected benefits to be derived by the group from a contract are lower than the unavoidable cost of meeting the obligation under the contract.
Foreign currencyForeign currency transactionsThe presentation currency of the group and the company’s annual financial statements is the South African rand. Certain individual companies in the group have different functional currencies and are translated on consolidation. Transactions in currencies other than the functional currency of entities are initially recorded at the rates of exchange ruling on the dates of the transactions. Monetary assets and liabilities denominated in such currencies are translated at the rates ruling on the reporting date. Foreign exchange differences arising on translation are recognised in profit or loss. Non-monetary assets and liabilities that are measured in terms of historical cost in a foreign currency are translated using the exchange rate at the date of the transaction. Non-monetary assets and liabilities denominated in foreign currencies that are stated at fair value are translated at rates ruling at the dates the fair value was determined.
Financial statements of foreign operationsThe assets and liabilities of all foreign operations, including goodwill and fair value adjustments arising on consolidation, are translated at rates of exchange ruling at the reporting date. The revenues and expenses of foreign operations are translated at rates approximating the foreign exchange rates ruling at the date of the transactions.
Foreign exchange differences arising on translation are recognised in OCI and aggregated in the foreign currency translation reserve (FCTR). The FCTR applicable to a foreign operation is released to profit or loss as a capital item on disposal of that foreign operation.
The results and the financial position of group entities that are accounted for as entities that operate in hyperinflationary economies and that have a functional currency that is different from the presentation currency of the group are translated into the presentation currency of its immediate parent at the exchange rates ruling at the reporting date.
HyperinflationThe results and the financial position, including comparative amounts, of group entities whose functional currencies are the currencies of hyperinflationary economies are adjusted in terms of the measuring unit current at the end of the reporting period.
As the presentation currency of the group is that of a non-hyperinflationary economy, comparative amounts are not adjusted for changes in the price level or exchange rates in the current year. Differences between these comparative amounts and the hyperinflation-adjusted equity opening balances are recognised in OCI.
SUMMARY OF ACCOUNTING POLICIES continuedfor the year ended 30 September 2020
PEPKOR CONSOLIDATED AND SEPARATE ANNUAL FINANCIAL STATEMENTS for the year ended 30 September 2020
37
The carrying amounts of non-monetary assets and liabilities are adjusted to reflect the change in the general price index from the date of acquisition to the end of the reporting period. An impairment loss is recognised in profit or loss if the restated amount of a non-monetary item exceeds its estimated recoverable amount.
Gains or losses on the net monetary position are recognised in profit or loss and included in operating profit.
All items recognised in the statement of comprehensive income are restated by applying the change in the general price index from the dates when the items of income and expenses were initially earned or incurred.
At the beginning of the first period of application, the components of owners’ equity, except retained earnings, are restated by applying a general price index from the dates the components were contributed or otherwise arose. These restatements are recognised in OCI. Restated retained earnings are derived from all other amounts in the restated statement of financial position.
At the end of the first period and in the subsequent periods, all components of owners’ equity are restated by applying a general price index from the beginning of the period or the date of contribution, if later.
All items in the statement of cash flows are expressed in terms of the general price index at the end of the reporting period.
Net investment in foreign operationsExchange differences arising from the translation of the net investment in foreign operations, and of related hedges, are recognised in OCI and accumulated in the FCTR. They are released to profit or loss as a capital item on disposal of that foreign operation.
Exchange differences arising from the translation of monetary items receivable to a foreign operation for which settlement is neither planned nor likely to occur (therefore forming part of the net investment in the foreign operation) are recognised initially in OCI and reclassified from equity to profit or loss on repayment of the monetary items.
Financial instrumentsInitial recognition Financial assets and financial liabilities are recognised on the group’s statement of financial position when the group becomes a party to the contractual provisions of the instrument.
Financial instruments are initially recognised at fair value, with the exception of trade debtors where there is no significant financing component, which is initially recognised at transaction price. Financial instruments include transaction costs that are incremental to the group and directly
attributable to the acquisition or issue of the financial asset or financial liability, except for those classified as fair value through profit or loss, where the transaction costs are recognised immediately in profit or loss.
Financial assets are classified into the following specified categories: financial assets ’at fair value through profit or loss’ (FVTPL), ’at fair value through other comprehensive income’ (FVTOCI) and ’loans and receivables at amortised cost’. The classification depends on the entity’s business model for managing the financial assets and the contractual terms of the cash flows.
Financial liabilities are classified as either financial liabilities at FVTPL or financial liabilities at amortised cost.
Classification and measurement Financial assets at FVTPLThe group classifies financial assets at FVTPL when the assets are held within a different business model other than ’hold to collect’, unless the group has elected to classify an equity instrument at FVTOCI. Financial assets where contractual cash flows are not solely payments of principal and interest are also recognised as FVTPL irrespective of business model. All derivative financial instruments fall into this category, except those designated and effective as hedging instruments, for which the hedge accounting requirements apply.
Assets in this category are measured at fair value with gains or losses recognised in profit or loss. The fair values of financial assets in this category are determined by reference to active market transactions or using a valuation technique where no active market exists.
Financial assets at FYTOCIThe group classifies financial assets at FVTOCI where management has made an irrevocable election at initial recognition to present fair value gains and losses on equity instruments not held for trading in OCI.
Fair value gains and losses on equity investments carried at FVTOCI are recognised in OCI with no subsequent reclassification/recycling of fair value gains and losses to profit or loss following the derecognition of the investment. Dividends from these investments continue to be recognised in profit or loss as revenue when the group’s right to receive payments is established.
Financial assets at amortised costThe group classifies financial assets as at amortised cost only if the asset is held within a business model with the objective of collecting the contractual cash flows, and the contractual terms give rise to fixed or determinable cash flow that are solely payments of principal and interest on the principal amount outstanding.
SUMMARY OF ACCOUNTING POLICIES continuedfor the year ended 30 September 2020
PEPKOR CONSOLIDATED AND SEPARATE ANNUAL FINANCIAL STATEMENTS for the year ended 30 September 2020
38
Financial assets are carried at amortised cost, with interest recognised in profit or loss for the period, using the effective interest method.
Current and non-current financial assetsCurrent assets have maturity terms of less than 12 months, except for instalment sale receivables. Instalment sale receivables, which are included in trade and other receivables, have maturity terms of between one and five years, but are classified as current as they form part of the normal operating cycle.
Financial liabilities at FVTPLFinancial liabilities are classified as at FVTPL where the financial liability is either ’held for trading’ or where management has designated it as at FVTPL. (Management has not designated financial liabilities at FVTPL.)
Financial liabilities at FVTPL are measured at fair value, with any gains or losses arising on remeasurement recognised in profit or loss. The net gain or loss recognised in profit or loss incorporates any interest paid on the financial liability.
Other financial liabilitiesFinancial liabilities that are not classified as at FVTPL are classified as other financial liabilities and are carried at amortised cost, with interest recognised in profit or loss for the period, using the effective interest method.
Trade and other payablesThese amounts represent liabilities for goods and services provided to the group prior to the end of the financial year, which are unpaid. The amounts are unsecured and are presented as current liabilities unless payment is not due within 12 months after the reporting period. They are recognised initially at fair value and subsequently measured at amortised cost using the effective interest method.
DerecognitionThe group derecognises a financial asset when the rights to receive cash flows from the asset have expired or have been transferred and the group has transferred substantially all risks and rewards of ownership.
A financial liability is derecognised when, and only when, the liability is extinguished, i.e. when the obligation specified in the contract is discharged, cancelled or has expired.
Impairment of financial assetsImpairment of loans measured at amortised cost are measured using the ECL model under IFRS 9. The ECL model factors in information regarding past events, current conditions, supportable forecasts and economic conditions that affect the expected collectability of future cash flows at reporting date. The estimation of ECL takes into account the time value of money.
For trade and other receivables without a significant financing component, the group has adopted the simplified approach that recognises lifetime ECL regardless of the stage classification. The group applied a provision matrix based on historical credit loss experience, which was adjusted for forward-looking factors applicable to the trade and other receivables balances and economic factors.
Cash and cash equivalentsCash and cash equivalents comprise cash at banks and on hand, as well as short-term deposits held at call with banks.
Effective interest methodThe effective interest method is a method of calculating the amortised cost of a financial instrument and allocating interest income over the relevant period. The effective interest rate is the rate that exactly discounts estimated future cash receipts (including all fees on points paid or received that form an integral part of the effective interest rate, transaction costs and other premiums or discounts) through the expected life of a financial instrument or, where appropriate, a shorter period.
Hedge accountingThe group designates certain hedging instruments, which include derivatives and non-derivatives in respect of foreign currency risk, as either fair value hedges, cash flow hedges, or hedges of net investments in foreign operations. Hedges in foreign exchange risk on firm commitments are accounted for as cash flow hedges. These derivatives are initially recognised at fair value on the date a derivative contract is entered into, and they are subsequently remeasured to their fair value at the end of each reporting period.
At inception of the hedge relationship, the group documents the economic relationship between hedging instruments and hedged items, including whether changes in the cash flows of the hedging instruments are expected to offset changes in the cash flows of hedged items. The group documents its risk management objective and strategy for undertaking its hedge transactions.
Cash flow hedgesThe effective portion of changes in the fair value of derivatives that are designated and qualify as cash flow hedges is recognised in the cash flow hedge reserve in equity. The gain or loss relating to the ineffective portion is recognised immediately in profit or loss through cost of sales.
When forward contracts are used to hedge forecast transactions, the group generally designates only the change in fair value of the forward contract related to the spot component as the hedging instrument. In accordance with the provisions of IFRS 9, the application of hedge accounting requires management to adjust the cost of inventory to incorporate the impact of forward exchange hedging contracts. Gains or losses
SUMMARY OF ACCOUNTING POLICIES continuedfor the year ended 30 September 2020
PEPKOR CONSOLIDATED AND SEPARATE ANNUAL FINANCIAL STATEMENTS for the year ended 30 September 2020
39
relating to the effective portion of the change in the spot component of the forward contracts are recognised in the cash flow hedge reserve within equity. The change in the forward element of the contract that relates to the hedged item (forward points) is recognised within operating expenses.
Amounts accumulated in equity are reclassified to profit and loss in the periods when the hedged item is recognised in profit or loss, and it is included in the same line of the income statement as the recognised hedged item.
When a hedging instrument expires, or is sold or terminated, or when a hedge no longer meets the criteria for hedge accounting, any cumulative deferred gain or loss in equity at that time remains in equity until the forecast transaction occurs, resulting in the recognition of a non-financial asset such as inventory. When the forecast transaction is no longer expected to occur, the cumulative gain or loss that was reported in equity is immediately reclassified to profit or loss.
Revenue recognitionRevenue from contracts with customersRevenue is recognised when the group satisfies performance obligations and transfers control of goods or services to its customers at an amount that reflects the consideration the group expects to be entitled to in exchange for these goods or services, allocated to each specific performance obligation. Revenue is measured at the fair value of consideration received or receivable.
The main categories of revenue and the basis of recognition are as follows:
Sale of goods and related revenue – retail salesRevenue from the sale of goods from ordinary group operating activities, which comprise clothing and general merchandise, furniture, appliances and electronics and building materials, is measured net of value-added taxation, rebates and discounts and after eliminating sales within the group.
Revenue from the sale of goods is recognised at a point in time when control of goods is transferred to the customer at the point of sale. For goods that are due for delivery to the customer, the sale is recognised on delivery, as this is deemed to be when the performance indicators are met and control is transferred to the customer.
Payment is usually received via cash, debit card or credit card. Related card transaction costs are recognised in the statement of comprehensive income as other expenses. When goods are sold under instalment sale agreements in the furniture, appliances and electronics segment, the present value of the instalment sale payments is recognised as a receivable using the effective interest rate computed at initial recognition over the one- to five-year term of the agreement.
The group earns ongoing revenue on starter packs that have been sold in stores. The recognition of ongoing revenue under IFRS 15 requires a certain level of judgement (refer to significant accounting judgements below). The group’s policy is only to recognise the variable consideration as revenue as and when it is received, because it is only at this point that it is highly probable that a significant reversal in revenue for that contract will not occur in the future.
Deposits received from customers are recognised as deferred revenue. These balances are considered contract liabilities, as they are received prior to the satisfaction of performance obligations.
Sale of goods and related revenue – right of returnThe group estimates variable consideration to be included in the transaction price for the sale of goods where customers are entitled to a right of return within a specified time frame. The group uses projection methods to forecast sales returns that are based on historical return data. Any significant changes in experience as compared to historical return patterns will impact the expected return percentages estimated by the group. Estimated return percentages are updated regularly and the refund liability adjusted accordingly.
Sale of goods and related revenue – lay-by salesLay-by revenue is recognised on the initiation of the contract with the customer for the clothing and general merchandise segment, as this is deemed to be when control of the goods passes to the customer. The group recognises revenue at the amount of consideration to which they expect to be entitled and for which a significant reversal of revenue is not considered probable. A contract liability for the expected possible unsuccessful lay-bys is recognised as an adjustment to revenue as well as an asset (with a corresponding adjustment to cost of sales) representing its right to recover the products from the customer. The group uses projection methods to forecast unsuccessful lay-bys that are based on historical data. Any significant changes in experience as compared to historical patterns will impact the percentages estimated by the group. Estimated percentages are updated regularly and the contract liability for unsuccessful lay-bys is adjusted accordingly.
Lay-by revenue is recognised when the final payment for the goods is received from the customer for the furniture, appliances and electronics segment, as this is deemed to be when control of the goods passes to the customer and all performance obligations are met. Proceeds from these lay-by sales are recognised as contract liabilities, and the revenue is deferred until all the performance obligations are met.
SUMMARY OF ACCOUNTING POLICIES continuedfor the year ended 30 September 2020
PEPKOR CONSOLIDATED AND SEPARATE ANNUAL FINANCIAL STATEMENTS for the year ended 30 September 2020
40
Sale of goods and related revenue – gift vouchersPrepaid gift cards provide rights to customers that are deemed to be accounted for as separate performance obligations. The consideration allocated to unredeemed gift cards is measured by reference to its stand-alone selling prices adjusted for an expected forfeiture rate. The group applies projection methods in its estimation of forfeiture rates by using customers’ historical redemption patterns as the main input.
Service fee incomeService fee income is recognised on a monthly basis when charged to a customer’s account as the services are provided by the group.
Insurance revenueInsurance revenue consists of gross insurance premiums and reinsurance commission earned less reinsurance premiums. Insurance premiums are recognised on a straight-line basis over the period of the contract, after an appropriate allowance is made for commission and reinsurance. Reinsurance commissions are earned on a straight-line basis over the period of the contract.
Other revenue – collection revenueService fee revenue is earned based on a fixed percentage of outstanding debtor balances collected on behalf of third parties. Performance obligations are deemed to be met once the group recovers the outstanding balance from a debtor or a portion thereof, at which point the revenue is recognised.
Financial services revenue – effective interest incomeInterest income earned is recognised on a time-proportion basis. The group calculates interest income by applying the effective interest rate to the gross carrying amount of financial assets other than credit-impaired assets. When a financial asset becomes credit-impaired, the group calculates interest income by applying the effective interest rate to the net amortised cost (gross carrying amount less the allowance for expected credit losses) of the financial asset. If the financial asset is no longer deemed to be credit-impaired, the group reverts to calculating interest income on a gross basis.
Other operating incomeOther operating income is recognised as follows:
Income earned from suppliers The group enters into various agreements with suppliers, which provide for various purchase rebates and other income. Rebates are recognised as part of the cost of merchandise sold when they are closely related to the purchase of
inventory. Where the income earned relates to inventories that are held by the group at year-end, the income is included within the cost of those inventories, and recognised in cost of sales when the inventory is sold.
Other income earned from suppliers is recognised in other income when services are provided to suppliers that are not closely related to the purchase of inventory and when the group can reasonably estimate the fair value of the service. Management uses judgement in determining whether the services provided to suppliers are sufficiently separable from the purchase of inventory, by determining if the supplier could have entered into an agreement with a party, other than a purchaser of its inventory, in order to receive those services.
Income earned from suppliers that is in substance, a cost recovery is offset against the operating expense to which the recovery relates.
Commission receivedThe group acts as an agent for the services and products provided by a variety of third parties to the group’s customers through its retail footprint. The agent’s commissions received by the businesses, other than the FinTech segment, from the third parties for the services are recognised as other income. Commissions relating to third-party products, money transfers and bill payments are recognised at the point in time when the underlying third-party payment takes place, as control is transferred to the customer and all performance obligations are deemed to be met.
Dividend incomeDividend income from investments is recognised when the shareholders’ right to receive payment has been established.
Operating lease incomePayments and receipts under operating leases are recognised in profit or loss on a straight-line basis over the term of the lease.
Discontinued operationNon-current assets (or disposal groups) are classified as held for sale if their carrying amount will be recovered principally through a sale transaction rather than through continuing use and a sale is considered highly probable. They are measured at the lower of their carrying amount and fair value less costs to sell, except for assets such as deferred taxation assets, assets arising from employee benefits, financial assets and investment property that are carried at fair value and contractual rights under insurance contracts, which are specifically exempt from this requirement.
An impairment loss is recognised for any initial or subsequent write-down of the asset (or disposal group) to fair value less costs to sell. A gain is recognised for any subsequent increases
SUMMARY OF ACCOUNTING POLICIES continuedfor the year ended 30 September 2020
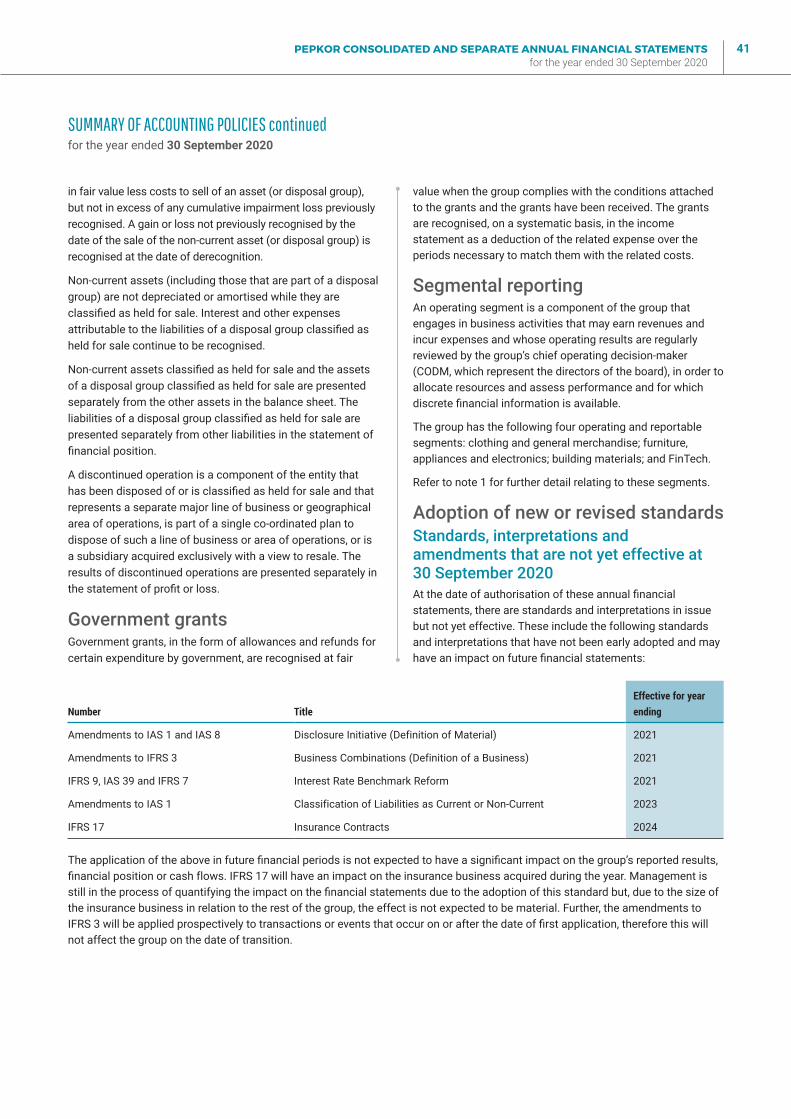
PEPKOR CONSOLIDATED AND SEPARATE ANNUAL FINANCIAL STATEMENTS for the year ended 30 September 2020
41
in fair value less costs to sell of an asset (or disposal group), but not in excess of any cumulative impairment loss previously recognised. A gain or loss not previously recognised by the date of the sale of the non-current asset (or disposal group) is recognised at the date of derecognition.
Non-current assets (including those that are part of a disposal group) are not depreciated or amortised while they are classified as held for sale. Interest and other expenses attributable to the liabilities of a disposal group classified as held for sale continue to be recognised.
Non-current assets classified as held for sale and the assets of a disposal group classified as held for sale are presented separately from the other assets in the balance sheet. The liabilities of a disposal group classified as held for sale are presented separately from other liabilities in the statement of financial position.
A discontinued operation is a component of the entity that has been disposed of or is classified as held for sale and that represents a separate major line of business or geographical area of operations, is part of a single co-ordinated plan to dispose of such a line of business or area of operations, or is a subsidiary acquired exclusively with a view to resale. The results of discontinued operations are presented separately in the statement of profit or loss.
Government grants Government grants, in the form of allowances and refunds for certain expenditure by government, are recognised at fair
value when the group complies with the conditions attached to the grants and the grants have been received. The grants are recognised, on a systematic basis, in the income statement as a deduction of the related expense over the periods necessary to match them with the related costs.
Segmental reporting An operating segment is a component of the group that engages in business activities that may earn revenues and incur expenses and whose operating results are regularly reviewed by the group’s chief operating decision-maker (CODM, which represent the directors of the board), in order to allocate resources and assess performance and for which discrete financial information is available.
The group has the following four operating and reportable segments: clothing and general merchandise; furniture, appliances and electronics; building materials; and FinTech.
Refer to note 1 for further detail relating to these segments.
Adoption of new or revised standardsStandards, interpretations and amendments that are not yet effective at 30 September 2020At the date of authorisation of these annual financial statements, there are standards and interpretations in issue but not yet effective. These include the following standards and interpretations that have not been early adopted and may have an impact on future financial statements:
SUMMARY OF ACCOUNTING POLICIES continuedfor the year ended 30 September 2020
Number TitleEffective for yearending
Amendments to IAS 1 and IAS 8 Disclosure Initiative (Definition of Material) 2021
Amendments to IFRS 3 Business Combinations (Definition of a Business) 2021
IFRS 9, IAS 39 and IFRS 7 Interest Rate Benchmark Reform 2021
Amendments to IAS 1 Classification of Liabilities as Current or Non-Current 2023
IFRS 17 Insurance Contracts 2024
The application of the above in future financial periods is not expected to have a significant impact on the group’s reported results, financial position or cash flows. IFRS 17 will have an impact on the insurance business acquired during the year. Management is still in the process of quantifying the impact on the financial statements due to the adoption of this standard but, due to the size of the insurance business in relation to the rest of the group, the effect is not expected to be material. Further, the amendments to IFRS 3 will be applied prospectively to transactions or events that occur on or after the date of first application, therefore this will not affect the group on the date of transition.
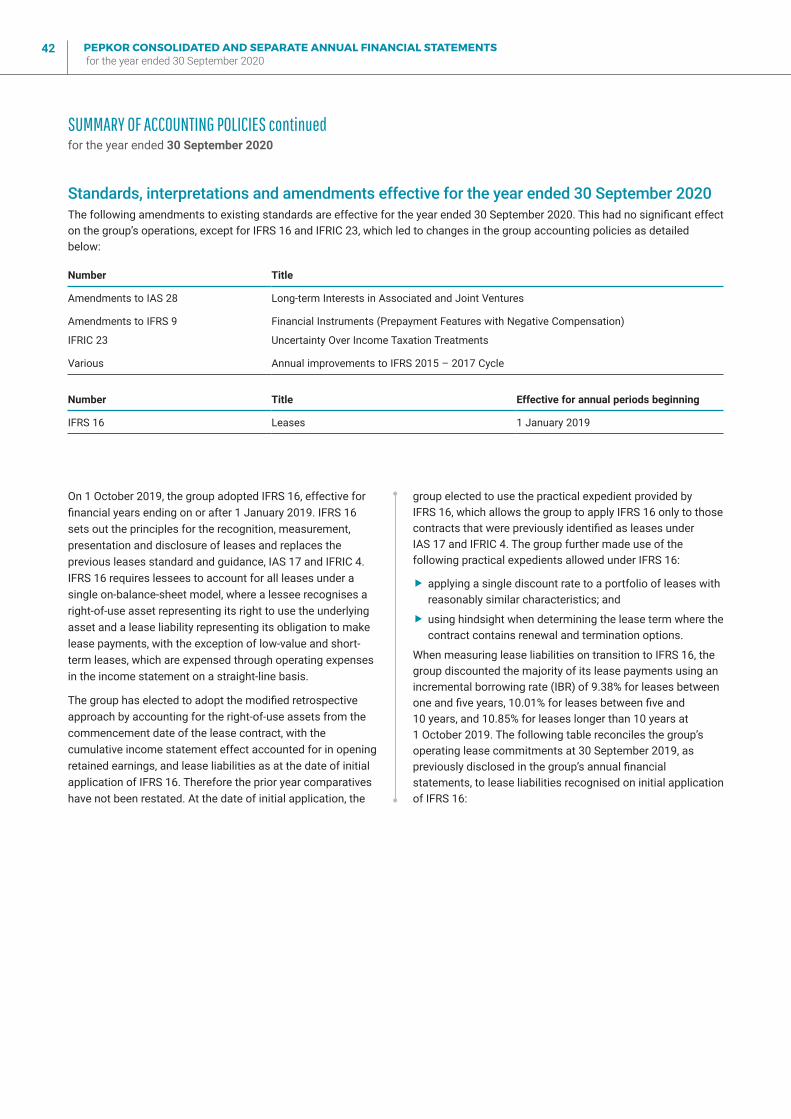
PEPKOR CONSOLIDATED AND SEPARATE ANNUAL FINANCIAL STATEMENTS for the year ended 30 September 2020
42
Standards, interpretations and amendments effective for the year ended 30 September 2020The following amendments to existing standards are effective for the year ended 30 September 2020. This had no significant effect on the group’s operations, except for IFRS 16 and IFRIC 23, which led to changes in the group accounting policies as detailed below:
Number Title
Amendments to IAS 28 Long-term Interests in Associated and Joint Ventures
Amendments to IFRS 9
IFRIC 23
Financial Instruments (Prepayment Features with Negative Compensation)
Uncertainty Over Income Taxation Treatments
Various Annual improvements to IFRS 2015 – 2017 Cycle
Number Title Effective for annual periods beginning
IFRS 16 Leases 1 January 2019
On 1 October 2019, the group adopted IFRS 16, effective for financial years ending on or after 1 January 2019. IFRS 16 sets out the principles for the recognition, measurement, presentation and disclosure of leases and replaces the previous leases standard and guidance, IAS 17 and IFRIC 4. IFRS 16 requires lessees to account for all leases under a single on-balance-sheet model, where a lessee recognises a right-of-use asset representing its right to use the underlying asset and a lease liability representing its obligation to make lease payments, with the exception of low-value and short-term leases, which are expensed through operating expenses in the income statement on a straight-line basis.
The group has elected to adopt the modified retrospective approach by accounting for the right-of-use assets from the commencement date of the lease contract, with the cumulative income statement effect accounted for in opening retained earnings, and lease liabilities as at the date of initial application of IFRS 16. Therefore the prior year comparatives have not been restated. At the date of initial application, the
group elected to use the practical expedient provided by IFRS 16, which allows the group to apply IFRS 16 only to those contracts that were previously identified as leases under IAS 17 and IFRIC 4. The group further made use of the following practical expedients allowed under IFRS 16:
� applying a single discount rate to a portfolio of leases with reasonably similar characteristics; and
� using hindsight when determining the lease term where the contract contains renewal and termination options.
When measuring lease liabilities on transition to IFRS 16, the group discounted the majority of its lease payments using an incremental borrowing rate (IBR) of 9.38% for leases between one and five years, 10.01% for leases between five and 10 years, and 10.85% for leases longer than 10 years at 1 October 2019. The following table reconciles the group’s operating lease commitments at 30 September 2019, as previously disclosed in the group’s annual financial statements, to lease liabilities recognised on initial application of IFRS 16:
SUMMARY OF ACCOUNTING POLICIES continuedfor the year ended 30 September 2020
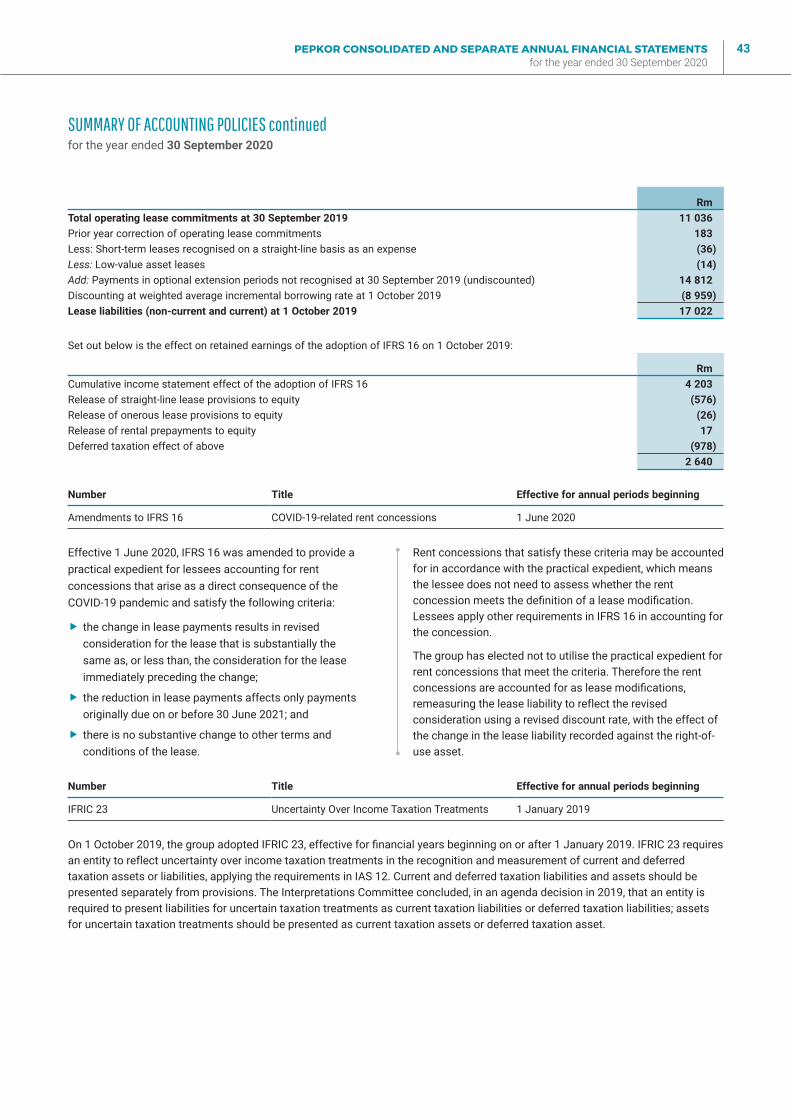
PEPKOR CONSOLIDATED AND SEPARATE ANNUAL FINANCIAL STATEMENTS for the year ended 30 September 2020
43
RmTotal operating lease commitments at 30 September 2019 11 036 Prior year correction of operating lease commitments 183 Less: Short-term leases recognised on a straight-line basis as an expense (36)Less: Low-value asset leases (14)Add: Payments in optional extension periods not recognised at 30 September 2019 (undiscounted) 14 812 Discounting at weighted average incremental borrowing rate at 1 October 2019 (8 959)Lease liabilities (non-current and current) at 1 October 2019 17 022
Set out below is the effect on retained earnings of the adoption of IFRS 16 on 1 October 2019:
RmCumulative income statement effect of the adoption of IFRS 16 4 203 Release of straight-line lease provisions to equity (576)Release of onerous lease provisions to equity (26)Release of rental prepayments to equity 17 Deferred taxation effect of above (978)
2 640
Number Title Effective for annual periods beginning
Amendments to IFRS 16 COVID-19-related rent concessions 1 June 2020
Effective 1 June 2020, IFRS 16 was amended to provide a practical expedient for lessees accounting for rent concessions that arise as a direct consequence of the COVID-19 pandemic and satisfy the following criteria:
� the change in lease payments results in revised consideration for the lease that is substantially the same as, or less than, the consideration for the lease immediately preceding the change;
� the reduction in lease payments affects only payments originally due on or before 30 June 2021; and
� there is no substantive change to other terms and conditions of the lease.
Rent concessions that satisfy these criteria may be accounted for in accordance with the practical expedient, which means the lessee does not need to assess whether the rent concession meets the definition of a lease modification. Lessees apply other requirements in IFRS 16 in accounting for the concession.
The group has elected not to utilise the practical expedient for rent concessions that meet the criteria. Therefore the rent concessions are accounted for as lease modifications, remeasuring the lease liability to reflect the revised consideration using a revised discount rate, with the effect of the change in the lease liability recorded against the right-of-use asset.
On 1 October 2019, the group adopted IFRIC 23, effective for financial years beginning on or after 1 January 2019. IFRIC 23 requires an entity to reflect uncertainty over income taxation treatments in the recognition and measurement of current and deferred taxation assets or liabilities, applying the requirements in IAS 12. Current and deferred taxation liabilities and assets should be presented separately from provisions. The Interpretations Committee concluded, in an agenda decision in 2019, that an entity is required to present liabilities for uncertain taxation treatments as current taxation liabilities or deferred taxation liabilities; assets for uncertain taxation treatments should be presented as current taxation assets or deferred taxation asset.
Number Title Effective for annual periods beginning
IFRIC 23 Uncertainty Over Income Taxation Treatments 1 January 2019
SUMMARY OF ACCOUNTING POLICIES continuedfor the year ended 30 September 2020
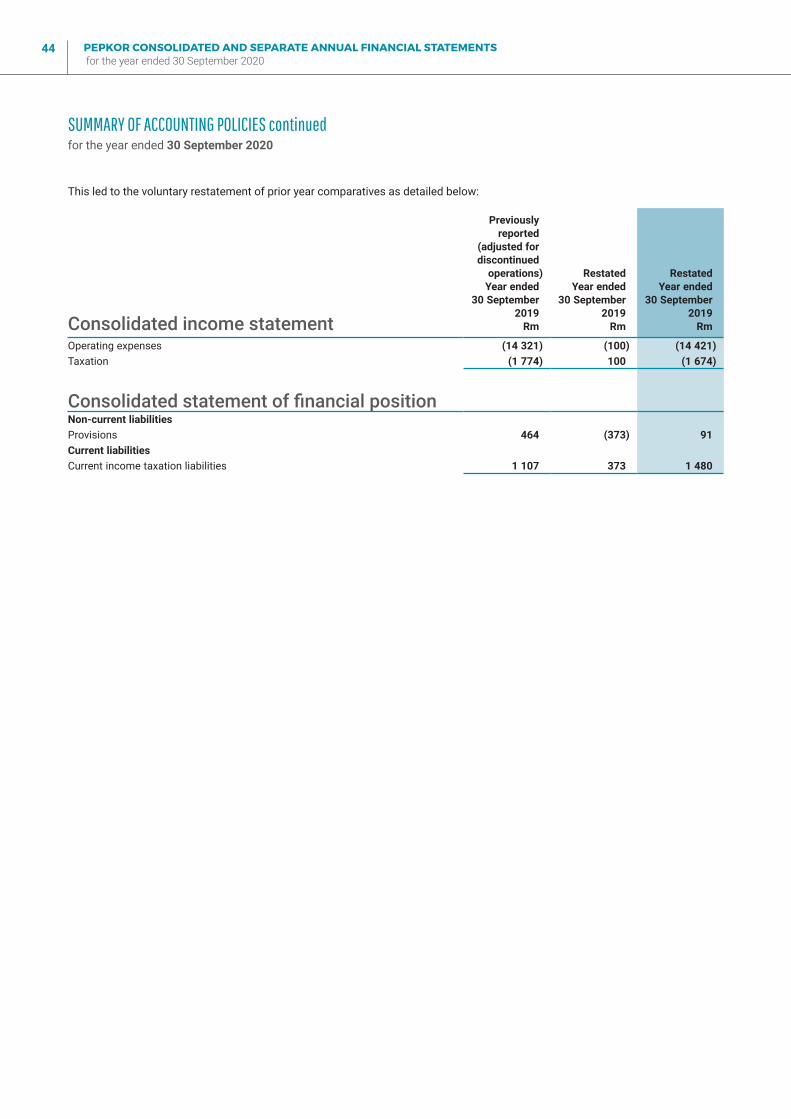
PEPKOR CONSOLIDATED AND SEPARATE ANNUAL FINANCIAL STATEMENTS for the year ended 30 September 2020
44
This led to the voluntary restatement of prior year comparatives as detailed below:
Consolidated income statement
Previouslyreported
(adjusted fordiscontinued
operations) Year ended
30 September2019
Rm
RestatedYear ended
30 September2019
Rm
RestatedYear ended
30 September2019
Rm
Operating expenses (14 321) (100) (14 421)Taxation (1 774) 100 (1 674)
Consolidated statement of financial positionNon-current liabilitiesProvisions 464 (373) 91Current liabilitiesCurrent income taxation liabilities 1 107 373 1 480
SUMMARY OF ACCOUNTING POLICIES continuedfor the year ended 30 September 2020
PEPKOR CONSOLIDATED AND SEPARATE ANNUAL FINANCIAL STATEMENTS for the year ended 30 September 2020
45
SIGNIFICANT JUDGEMENTS AND ESTIMATESfor the year ended 30 September 2020
Judgements and estimates are continually evaluated and are based on historical experience and other factors, including expectations of future events that are believed to be reasonable under the circumstances.
The group makes estimates and assumptions concerning the future. The resulting accounting estimates will, by definition, seldom equal the related actual results. The estimates and assumptions that have a significant risk of causing a material adjustment to the carrying amounts of assets and liabilities during the next financial year are discussed below.
The following areas require significant estimates to be made by management in the application of the group’s accounting policies:
Intangible assetsTrade names and brand names, which are considered to be well-established growing brands and product lines for which there is no foreseeable limit to the period in which these assets are expected to generate cash flows, are classified as indefinite useful life assets. The classification of such assets is reviewed annually.
Indefinite useful life intangible assets, excluding goodwill, recognised at fair value in business combinations, are expected to generate cash flows indefinitely and the carrying value would only be recovered in the event of disposal of such assets. Accordingly, deferred taxation is raised at the capital gains taxation rate on the fair value of such assets exceeding its taxation base.
The estimated useful lives and residual values are reviewed annually, taking cognisance of the forecasted commercial and economic realities and through benchmarking of accounting treatments in the specific industries in which these assets are used. Refer to note 10 where this significant estimate is discussed.
LeasesLease terms applicable to lease agreements, relating to the group’s lease liabilities, are negotiated on an individual basis and contain a wide range of different terms and conditions. The group determines the lease term as the non-cancellable term of the lease, together with any periods covered by an option to extend the lease if it is reasonably certain to be
exercised, or any periods covered by an option to terminate the lease, if it is reasonably certain not to be exercised. Judgement is exercised in determining the likelihood of exercising termination or extension options in determining the lease term, including considerations of the initial term/age of the lease, economic uncertainty of countries the group trades in and uncertainty over the feasibility of certain business units.
Subsequent to the commencement date of lease agreements, lease terms are reassessed when there is a significant event or change in circumstances that is within the group’s control and affects its ability to exercise or not to exercise the option to renew or to terminate. Significant events could include a change in the group’s assessment of whether it is reasonably certain to exercise a renewal or termination option, which includes if a store is flagged for relocation or closure, or if it is more favourable not to exercise the option.
Incremental borrowing rates applied in the measurement of certain lease liabilities are specific to the country, term, currency and commencement date of the applicable lease agreement. Incremental borrowing rates are based on a series of inputs, including the prime lending rate, the JIBAR rate, a credit risk adjustment and a country-specific adjustment.
Impairment of assetsGoodwill and intangible assets that have an indefinite useful life, or are not yet ready for use, are assessed annually for impairment. Investments, property, plant and equipment, right-of-use assets and finite intangibles are only tested if an impairment indicator is identified. Refer to notes 9, 10, 11 and 12 for detail of impairment of assets where applicable. The impairment review requires estimation uncertainty (refer to note 10). The group evaluates, among other things, losses incurred, duration and the extent of losses and near-term business outlook.
Allocation of goodwill to CGUsGoodwill is allocated to a group of CGUs based on the lowest level at which goodwill is monitored.
Fair values in business combinationsManagement uses valuation techniques to determine the fair value of assets, liabilities and contingent liabilities acquired in business combination.
PEPKOR CONSOLIDATED AND SEPARATE ANNUAL FINANCIAL STATEMENTS for the year ended 30 September 2020
46
Although a comprehensive valuation exercise is performed for each business combination, the group applies initial accounting for its business combinations that will allow it a period of one year after the acquisition date to adjust the provisional amounts recognised for a business combination. Refer to note 29 for business combinations concluded during the year.
The following areas require significant judgements to be made by management in the application of the group’s accounting policies:
Recoverability of deferred taxation assetsDeferred taxation assets are recognised to the extent that it is probable that taxable income will be available in the future against which these can be utilised. Future taxable profits are estimated based on business plans that include estimates and assumptions regarding economic growth, interest, inflation, taxation rates and competitive forces. Refer to note 15.
Income taxation provisionThe group is subject to income taxation in more than one jurisdiction. Significant judgement is required in determining the provision for income taxes. There are many transactions and calculations for which the ultimate taxation determination is uncertain during the ordinary course of business. Taxation positions are provided for based on either the most probable outcome method (the single most likely amount in a range of possible outcomes: the most likely amount may better predict the resolution of the uncertainty if the possible outcomes are binary or are concentrated on one value) or the expected value of the taxation position (the sum of the probability-weighted amounts in a range of possible outcomes: the expected value may better predict the resolution of the
uncertainty if there is a range of possible outcomes that are neither binary nor concentrated on one value), for each type of taxation provision.
Contingent liabilitiesManagement apply their judgement to the fact patterns and advice they receive from their attorneys, advocates and other advisors in assessing whether an obligation is probable, more likely than not, or remote. This judgement application is used to determine whether the obligation is recognised as a liability or disclosed as a contingent liability. Refer to note 30.5.
Provision for inventory shrinkage, obsolescence and markdownsThe provision for inventory obsolescence and markdowns represents management’s judgement in relation to the extent to which merchandise on hand at the reporting date will be sold below cost. This estimate takes into consideration the nature of the product and/or product category, past trends (including historical sales volumes and prices of the product and/or similar products), evidence of impairment at year-end (including damaged goods and days on hand) and an assessment of future saleability (product seasonality, technological obsolescence and aesthetic obsolescence).
Impairment of financial assetsThe impairment provisions for financial assets are based on assumptions about risk of default and expected loss rates. The group uses judgements in making these assumptions and selecting the inputs to the impairment calculation, based on the history, existing market conditions, as well as forward-looking estimates at the end of each reporting period. Key assumptions and inputs used are detailed in note 31.5, of which the most significant are as follows:
SIGNIFICANT JUDGEMENTS AND ESTIMATES continuedfor the year ended 30 September 2020
PEPKOR CONSOLIDATED AND SEPARATE ANNUAL FINANCIAL STATEMENTS for the year ended 30 September 2020
47
Impairment of financial assets judgements Significant increases in credit risk (SICR)In terms of IFRS 9: Financial Instruments, all loans and other receivables are assessed at each reporting date to determine whether there has been an SICR. In cases where an SICR has occurred, an impairment equal to the lifetime ECL is recognised. If, at reporting date, the credit risk has not significantly increased, the group recognises a 12-month ECL. The group identifies an SICR on clients that are up to date on their loans and other receivables, but who have been subject to SICR events of which the most significant are detailed below:
Event trigger Loans to customers Instalment sale agreementsCredit sales through store cards
Change in customer behaviour Triggers includes: a customer entering into debt review or rescheduling an existing loan or a customer that is in arrears as defined below.
Application and behavioural scorecards are segmented into ratings. For each application rating, an appropriate notch deterioration in behavioural scorecard will result in an SICR. In the event that no application rating is available, the loan will be classified as an SICR.
Not deemed to be an SICR event.
Customer defaulting on repayments A customer’s loan is in default when 90% of an instalment is not paid or the account is 30 days in arrears.
A customer is in default when their account is 30 days in arrears. All debt counselling accounts that are less than 90 days in arrears will be classified as SICRs.
A customer is in default when their account is 30 days in arrears.
Shifting of the SICR threshold by 5% (reflects the full stage 2 ECL if the deterioration or improvement in the factor used as a behavioural or granting scores threshold is stressed by 5%) at 30 September 2020:
Impact of SICR on ECL Loans to customers Instalment sale agreementsCredit sales through
store cards
Positive 486 705 643% change in ECL (0.64%) (0.35%) (1.30%)Base 489 707 651% change in ECL 0.00% 0.00% 0.00%Negative 492 711 659% change in ECL 0.64% 0.62% 1.30%
Shifting of the SICR threshold by 5% (reflects the full stage 2 ECL if the deterioration or improvement in the factor used as a behavioural or granting scores threshold is stressed by 5%) at 30 September 2019:
Impact of SICR on ECL Loans to customers Instalment sale agreementsCredit sales through
store cards
Positive 329 488 469% change in ECL (0.69%) (0.47%) (2.10%)Base 331 490 479% change in ECL 0.00% 0.00% 0.00%Negative 333 494 489% change in ECL 0.69% 0.80% 2.10%
Loan write-off point
Event trigger Loans to customers Instalment sale agreementsCredit sales through store cards
Loan write-off policy Five consecutive instalments in arrears and three consecutive instalments in arrears on rescheduled accounts.
Nine consecutive instalments in arrears with no qualifying payments made in the last 90 days.
Eight instalments in arrears with no payment in the previous three months.
SIGNIFICANT JUDGEMENTS AND ESTIMATES continuedfor the year ended 30 September 2020
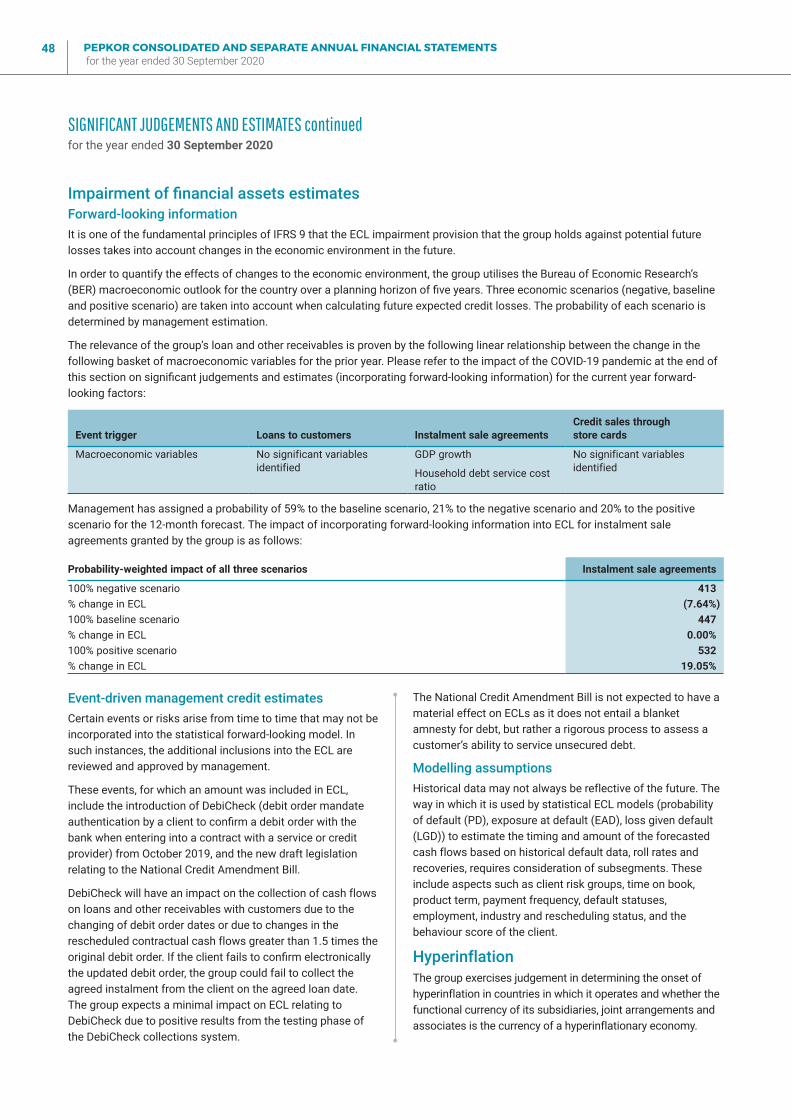
PEPKOR CONSOLIDATED AND SEPARATE ANNUAL FINANCIAL STATEMENTS for the year ended 30 September 2020
48
Impairment of financial assets estimatesForward-looking informationIt is one of the fundamental principles of IFRS 9 that the ECL impairment provision that the group holds against potential future losses takes into account changes in the economic environment in the future.
In order to quantify the effects of changes to the economic environment, the group utilises the Bureau of Economic Research’s (BER) macroeconomic outlook for the country over a planning horizon of five years. Three economic scenarios (negative, baseline and positive scenario) are taken into account when calculating future expected credit losses. The probability of each scenario is determined by management estimation.
The relevance of the group’s loan and other receivables is proven by the following linear relationship between the change in the following basket of macroeconomic variables for the prior year. Please refer to the impact of the COVID-19 pandemic at the end of this section on significant judgements and estimates (incorporating forward-looking information) for the current year forward-looking factors:
Event trigger Loans to customers Instalment sale agreementsCredit sales through store cards
Macroeconomic variables No significant variables identified
GDP growth
Household debt service cost ratio
No significant variables identified
Management has assigned a probability of 59% to the baseline scenario, 21% to the negative scenario and 20% to the positive scenario for the 12-month forecast. The impact of incorporating forward-looking information into ECL for instalment sale agreements granted by the group is as follows:
Probability-weighted impact of all three scenarios Instalment sale agreements
100% negative scenario 413% change in ECL (7.64%)100% baseline scenario 447% change in ECL 0.00%100% positive scenario 532% change in ECL 19.05%
Event-driven management credit estimatesCertain events or risks arise from time to time that may not be incorporated into the statistical forward-looking model. In such instances, the additional inclusions into the ECL are reviewed and approved by management.
These events, for which an amount was included in ECL, include the introduction of DebiCheck (debit order mandate authentication by a client to confirm a debit order with the bank when entering into a contract with a service or credit provider) from October 2019, and the new draft legislation relating to the National Credit Amendment Bill.
DebiCheck will have an impact on the collection of cash flows on loans and other receivables with customers due to the changing of debit order dates or due to changes in the rescheduled contractual cash flows greater than 1.5 times the original debit order. If the client fails to confirm electronically the updated debit order, the group could fail to collect the agreed instalment from the client on the agreed loan date. The group expects a minimal impact on ECL relating to DebiCheck due to positive results from the testing phase of the DebiCheck collections system.
The National Credit Amendment Bill is not expected to have a material effect on ECLs as it does not entail a blanket amnesty for debt, but rather a rigorous process to assess a customer’s ability to service unsecured debt.
Modelling assumptionsHistorical data may not always be reflective of the future. The way in which it is used by statistical ECL models (probability of default (PD), exposure at default (EAD), loss given default (LGD)) to estimate the timing and amount of the forecasted cash flows based on historical default data, roll rates and recoveries, requires consideration of subsegments. These include aspects such as client risk groups, time on book, product term, payment frequency, default statuses, employment, industry and rescheduling status, and the behaviour score of the client.
HyperinflationThe group exercises judgement in determining the onset of hyperinflation in countries in which it operates and whether the functional currency of its subsidiaries, joint arrangements and associates is the currency of a hyperinflationary economy.
SIGNIFICANT JUDGEMENTS AND ESTIMATES continuedfor the year ended 30 September 2020
PEPKOR CONSOLIDATED AND SEPARATE ANNUAL FINANCIAL STATEMENTS for the year ended 30 September 2020
49
Various characteristics of the economic environment of each country are taken into account to assess whether an economy is hyperinflationary or not. These characteristics include, but are not limited to, the following:
� the general population prefer to keep their wealth in non-monetary assets or in a relatively stable foreign currency;
� prices are quoted in a relatively stable foreign currency;
� sales and purchases on credit take place at prices that compensate for the expected loss of purchasing power during the credit period, even if the period is short;
� interest rates, wages and prices are linked to a price index; and
� the cumulative inflation rate over three years is approaching, or exceeds, 100%.
Management exercises judgement as to when a restatement of the financial statements of a group entity becomes necessary.
The economy of Angola was reassessed in accordance with IAS 29: Financial Reporting in Hyperinflationary Economies and was found no longer to be in hyperinflation for the years ended 30 September 2020 and 2019. Hyperinflation accounting therefore ceased, and the 2018 adjustments will unwind over time.
Accordingly, the results and financial position of the group’s Angolan subsidiary have been expressed in terms of the measuring units current at the reporting date.
The general price indices, as published by the National Institute of Statistics of Angola, were used in adjusting the historical cost local currency results and financial positions of the group’s Angolan subsidiaries. As at 30 September 2020, the cumulative three-year inflation rate was 70.99% (2019: 73.22%).
Segmental reportingManagement identified operating segments in line with internal reporting structures in accordance with IFRS 8: Operating Segments. Refer to note 1.
Ongoing revenueThe group earns ongoing revenue on starter packs that have been sold in stores. The group earns this ongoing revenue on all future prepaid airtime loaded and/or spent on these prepaid starter packs by the subscriber, even if the subscriber does not top up through group companies in the future.
Ongoing revenue earned is variable in nature as the group’s entitlement to these amounts is dependent on the future spending patterns of the prepaid customers, and therefore contingent on a future event occurring or not occurring. IFRS 15 requires an entity to estimate the amount of variable consideration it will be entitled to for the contracts it has entered into with its customers and include this in the transaction price at contract inception, to the extent the variable consideration is not constrained.
The group has concluded that the ongoing revenue is fully constrained at the individual contract level due to the high variability in behaviour of the individual customers, including:
� the period over which prepaid customers remain on the same SIM card (this can range from one day to a number of years); and
� the spending patterns of individual customers, which are also highly variable.
In addition, because the terms of the ongoing revenue structure with the telecommunication companies are regularly up for negotiation, the group is not able to predict the likelihood or magnitude of a revenue reversal. The group’s policy is therefore only to recognise the variable consideration as revenue as and when it is received, because it is only at this point that it is highly probable that a significant reversal in revenue for that contract will not occur in the future.
Share schemeVarious assumptions are applied in determining the valuations of share-based payment reserves and the number of share rights expected to vest at the end of the vesting period. Refer to note 27.
Capital items (use of adjusted measures)The measure listed below is presented as management believes it to be relevant to the understanding of the group’s financial performance. The measure is used to provide additional useful information on underlying trends to shareholders. The measure is not defined under IFRS and may therefore not be comparable with similarly titled measures reported by other entities. It is not intended to be a substitute for, or superior to, measures as required by IFRS.
Capital items on the face of the statement of comprehensive income include all remeasurements excluded from the calculation of headline earnings per share (HEPS) in accordance with the guidance contained in SAICA Circular 1/2019: Headline Earnings. The principal items that will be included under this measure are: gains and losses on disposal and scrapping of property, plant and equipment, intangible assets and assets held for sale, impairments or reversal of impairments, and any non-trading items, such as gains and losses on disposal of investments, operations and subsidiaries. Refer to note 8.
Assessment of risk and rewardsThe group sold its lending book and shares in JD Consumer Finance Proprietary Limited and JDG Investments Holdings Proprietary Limited to Wands Investments Proprietary Limited on 1 January 2016. The group remains exposed to a certain extent to the risks and rewards of the commission structure of the lending book. IFRS requires the book to be recognised to the extent that the initial consideration received on sale could be returned. However, as the group does not have any
SIGNIFICANT JUDGEMENTS AND ESTIMATES continuedfor the year ended 30 September 2020
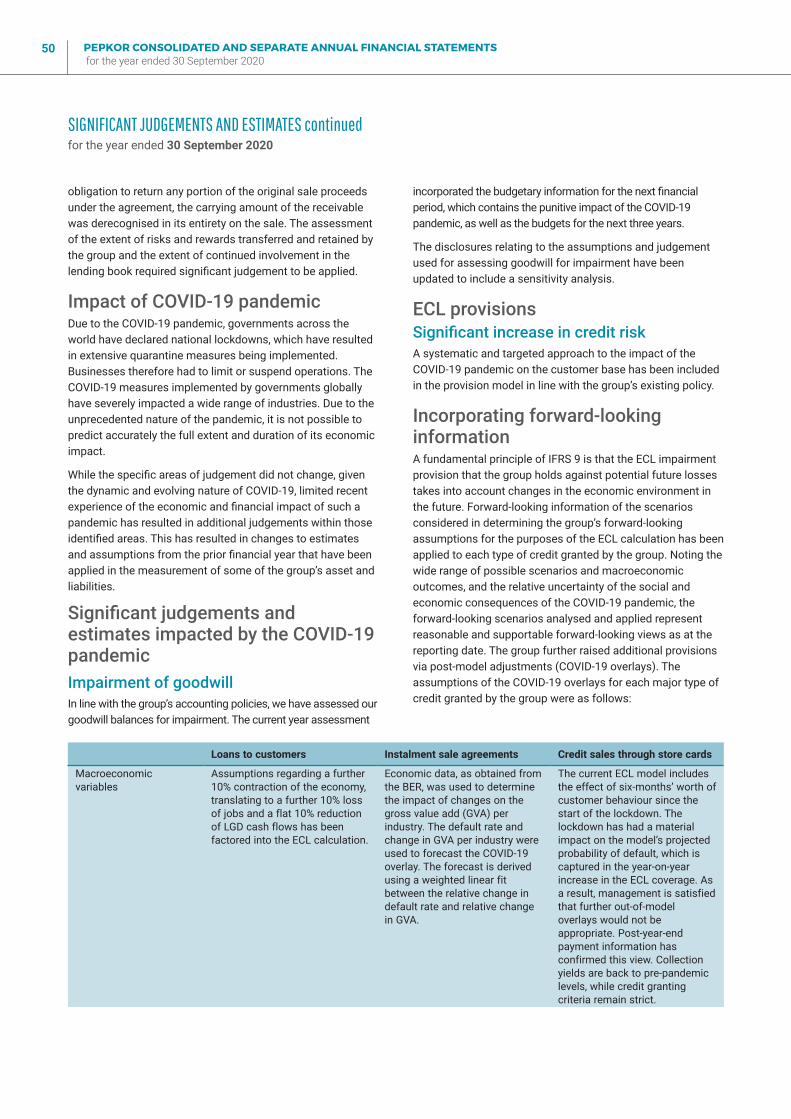
PEPKOR CONSOLIDATED AND SEPARATE ANNUAL FINANCIAL STATEMENTS for the year ended 30 September 2020
50
obligation to return any portion of the original sale proceeds under the agreement, the carrying amount of the receivable was derecognised in its entirety on the sale. The assessment of the extent of risks and rewards transferred and retained by the group and the extent of continued involvement in the lending book required significant judgement to be applied.
Impact of COVID-19 pandemicDue to the COVID-19 pandemic, governments across the world have declared national lockdowns, which have resulted in extensive quarantine measures being implemented. Businesses therefore had to limit or suspend operations. The COVID-19 measures implemented by governments globally have severely impacted a wide range of industries. Due to the unprecedented nature of the pandemic, it is not possible to predict accurately the full extent and duration of its economic impact.
While the specific areas of judgement did not change, given the dynamic and evolving nature of COVID-19, limited recent experience of the economic and financial impact of such a pandemic has resulted in additional judgements within those identified areas. This has resulted in changes to estimates and assumptions from the prior financial year that have been applied in the measurement of some of the group’s asset and liabilities.
Significant judgements and estimates impacted by the COVID-19 pandemicImpairment of goodwillIn line with the group’s accounting policies, we have assessed our goodwill balances for impairment. The current year assessment
incorporated the budgetary information for the next financial period, which contains the punitive impact of the COVID-19 pandemic, as well as the budgets for the next three years.
The disclosures relating to the assumptions and judgement used for assessing goodwill for impairment have been updated to include a sensitivity analysis.
ECL provisionsSignificant increase in credit riskA systematic and targeted approach to the impact of the COVID-19 pandemic on the customer base has been included in the provision model in line with the group’s existing policy.
Incorporating forward-looking informationA fundamental principle of IFRS 9 is that the ECL impairment provision that the group holds against potential future losses takes into account changes in the economic environment in the future. Forward-looking information of the scenarios considered in determining the group’s forward-looking assumptions for the purposes of the ECL calculation has been applied to each type of credit granted by the group. Noting the wide range of possible scenarios and macroeconomic outcomes, and the relative uncertainty of the social and economic consequences of the COVID-19 pandemic, the forward-looking scenarios analysed and applied represent reasonable and supportable forward-looking views as at the reporting date. The group further raised additional provisions via post-model adjustments (COVID-19 overlays). The assumptions of the COVID-19 overlays for each major type of credit granted by the group were as follows:
Loans to customers Instalment sale agreements Credit sales through store cards
Macroeconomic variables
Assumptions regarding a further 10% contraction of the economy, translating to a further 10% loss of jobs and a flat 10% reduction of LGD cash flows has been factored into the ECL calculation.
Economic data, as obtained from the BER, was used to determine the impact of changes on the gross value add (GVA) per industry. The default rate and change in GVA per industry were used to forecast the COVID-19 overlay. The forecast is derived using a weighted linear fit between the relative change in default rate and relative change in GVA.
The current ECL model includes the effect of six-months’ worth of customer behaviour since the start of the lockdown. The lockdown has had a material impact on the model’s projected probability of default, which is captured in the year-on-year increase in the ECL coverage. As a result, management is satisfied that further out-of-model overlays would not be appropriate. Post-year-end payment information has confirmed this view. Collection yields are back to pre-pandemic levels, while credit granting criteria remain strict.
SIGNIFICANT JUDGEMENTS AND ESTIMATES continuedfor the year ended 30 September 2020
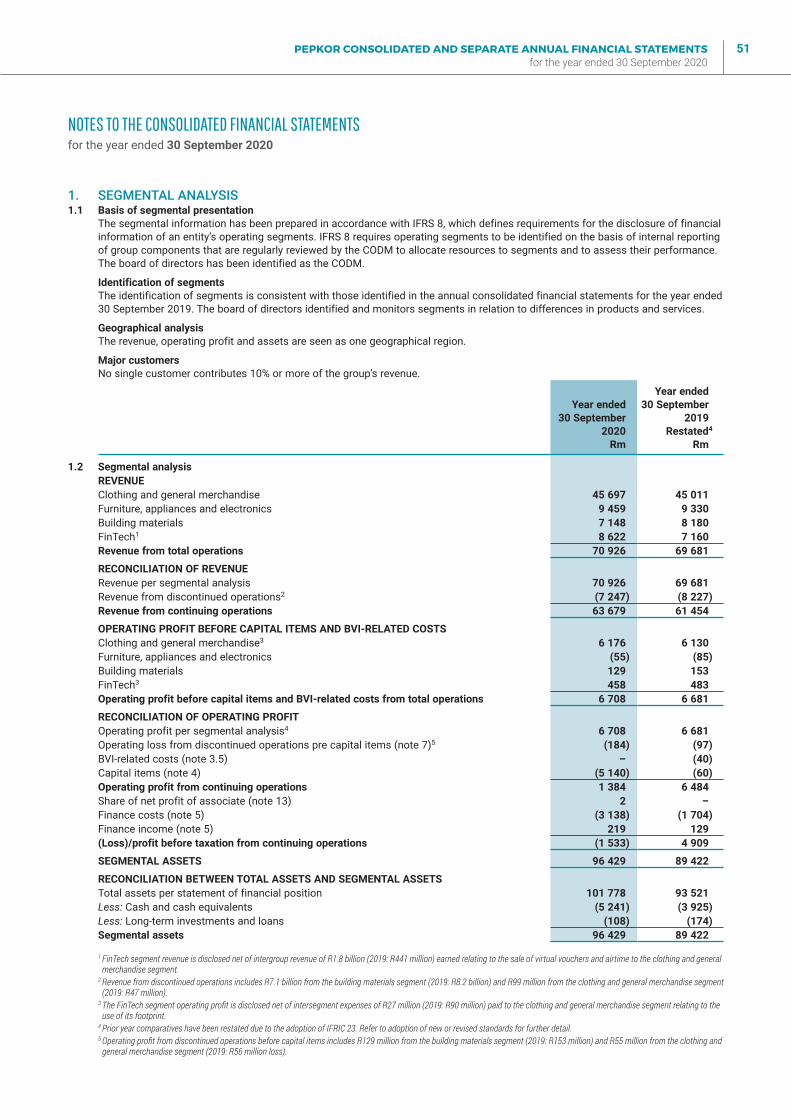
PEPKOR CONSOLIDATED AND SEPARATE ANNUAL FINANCIAL STATEMENTS for the year ended 30 September 2020
51
NOTES TO THE CONSOLIDATED FINANCIAL STATEMENTSfor the year ended 30 September 2020
1. SEGMENTAL ANALYSIS1.1 Basis of segmental presentation
The segmental information has been prepared in accordance with IFRS 8, which defines requirements for the disclosure of financial information of an entity’s operating segments. IFRS 8 requires operating segments to be identified on the basis of internal reporting of group components that are regularly reviewed by the CODM to allocate resources to segments and to assess their performance. The board of directors has been identified as the CODM.
Identification of segmentsThe identification of segments is consistent with those identified in the annual consolidated financial statements for the year ended 30 September 2019. The board of directors identified and monitors segments in relation to differences in products and services.
Geographical analysisThe revenue, operating profit and assets are seen as one geographical region.
Major customers No single customer contributes 10% or more of the group’s revenue.
Year ended30 September
2020Rm
Year ended30 September
2019Restated4
Rm
1.2 Segmental analysisREVENUEClothing and general merchandise 45 697 45 011 Furniture, appliances and electronics 9 459 9 330 Building materials 7 148 8 180 FinTech1 8 622 7 160 Revenue from total operations 70 926 69 681
RECONCILIATION OF REVENUERevenue per segmental analysis 70 926 69 681 Revenue from discontinued operations2 (7 247) (8 227)Revenue from continuing operations 63 679 61 454
OPERATING PROFIT BEFORE CAPITAL ITEMS AND BVI-RELATED COSTSClothing and general merchandise3 6 176 6 130 Furniture, appliances and electronics (55) (85)Building materials 129 153 FinTech3 458 483 Operating profit before capital items and BVI-related costs from total operations 6 708 6 681
RECONCILIATION OF OPERATING PROFITOperating profit per segmental analysis4 6 708 6 681 Operating loss from discontinued operations pre capital items (note 7)5 (184) (97)BVI-related costs (note 3.5) – (40)Capital items (note 4) (5 140) (60)Operating profit from continuing operations 1 384 6 484 Share of net profit of associate (note 13) 2 –Finance costs (note 5) (3 138) (1 704)Finance income (note 5) 219 129 (Loss)/profit before taxation from continuing operations (1 533) 4 909
SEGMENTAL ASSETS 96 429 89 422
RECONCILIATION BETWEEN TOTAL ASSETS AND SEGMENTAL ASSETSTotal assets per statement of financial position 101 778 93 521 Less: Cash and cash equivalents (5 241) (3 925)Less: Long-term investments and loans (108) (174)Segmental assets 96 429 89 422
1 FinTech segment revenue is disclosed net of intergroup revenue of R1.8 billion (2019: R441 million) earned relating to the sale of virtual vouchers and airtime to the clothing and general merchandise segment.
2 Revenue from discontinued operations includes R7.1 billion from the building materials segment (2019: R8.2 billion) and R99 million from the clothing and general merchandise segment (2019: R47 million).
3 The FinTech segment operating profit is disclosed net of intersegment expenses of R27 million (2019: R90 million) paid to the clothing and general merchandise segment relating to the use of its footprint.
4 Prior year comparatives have been restated due to the adoption of IFRIC 23. Refer to adoption of new or revised standards for further detail.5 Operating profit from discontinued operations before capital items includes R129 million from the building materials segment (2019: R153 million) and R55 million from the clothing and
general merchandise segment (2019: R56 million loss).
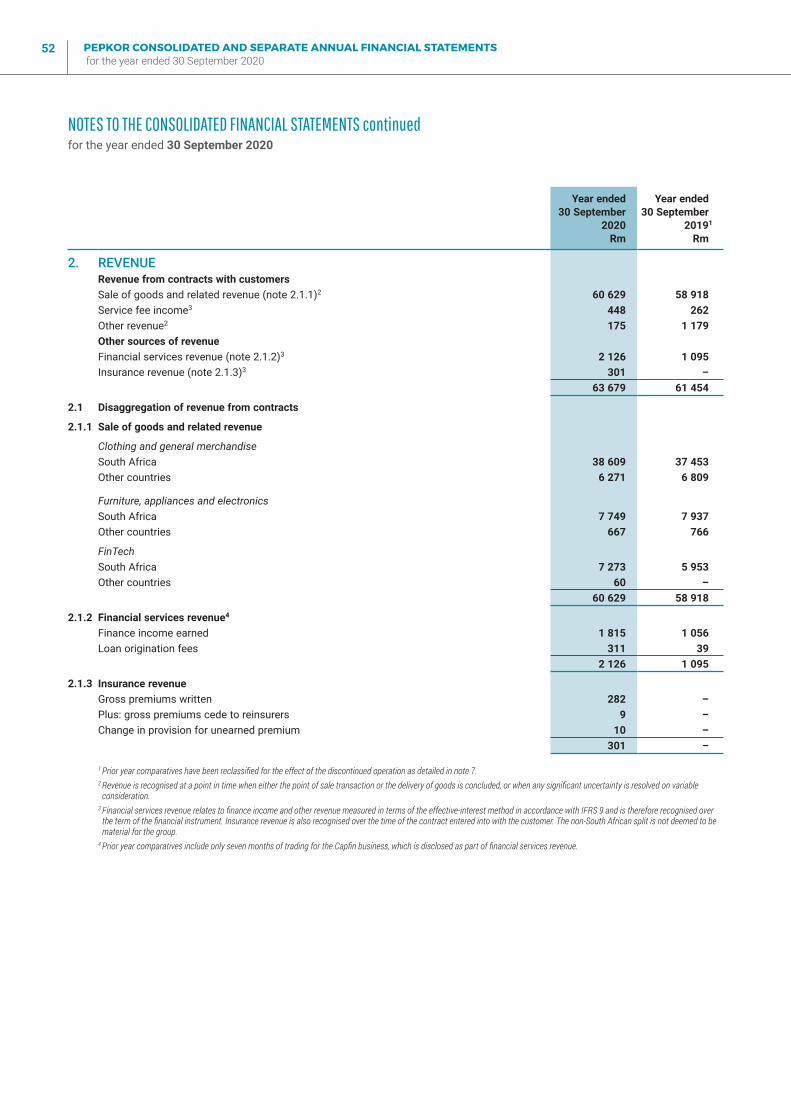
PEPKOR CONSOLIDATED AND SEPARATE ANNUAL FINANCIAL STATEMENTS for the year ended 30 September 2020
52
NOTES TO THE CONSOLIDATED FINANCIAL STATEMENTS continuedfor the year ended 30 September 2020
Year ended30 September
2020Rm
Year ended30 September
20191
Rm
2. REVENUERevenue from contracts with customersSale of goods and related revenue (note 2.1.1)2 60 629 58 918 Service fee income3 448 262 Other revenue2 175 1 179 Other sources of revenueFinancial services revenue (note 2.1.2)3 2 126 1 095 Insurance revenue (note 2.1.3)3 301 –
63 679 61 454
2.1 Disaggregation of revenue from contracts
2.1.1 Sale of goods and related revenue
Clothing and general merchandiseSouth Africa 38 609 37 453 Other countries 6 271 6 809
Furniture, appliances and electronicsSouth Africa 7 749 7 937 Other countries 667 766
FinTechSouth Africa 7 273 5 953 Other countries 60 –
60 629 58 918
2.1.2 Financial services revenue4
Finance income earned 1 815 1 056Loan origination fees 311 39
2 126 1 095
2.1.3 Insurance revenueGross premiums written 282 –Plus: gross premiums cede to reinsurers 9 –Change in provision for unearned premium 10 –
301 –
1 Prior year comparatives have been reclassified for the effect of the discontinued operation as detailed in note 7.2 Revenue is recognised at a point in time when either the point of sale transaction or the delivery of goods is concluded, or when any significant uncertainty is resolved on variable
consideration.3 Financial services revenue relates to finance income and other revenue measured in terms of the effective-interest method in accordance with IFRS 9 and is therefore recognised over
the term of the financial instrument. Insurance revenue is also recognised over the time of the contract entered into with the customer. The non-South African split is not deemed to be material for the group.
4 Prior year comparatives include only seven months of trading for the Capfin business, which is disclosed as part of financial services revenue.
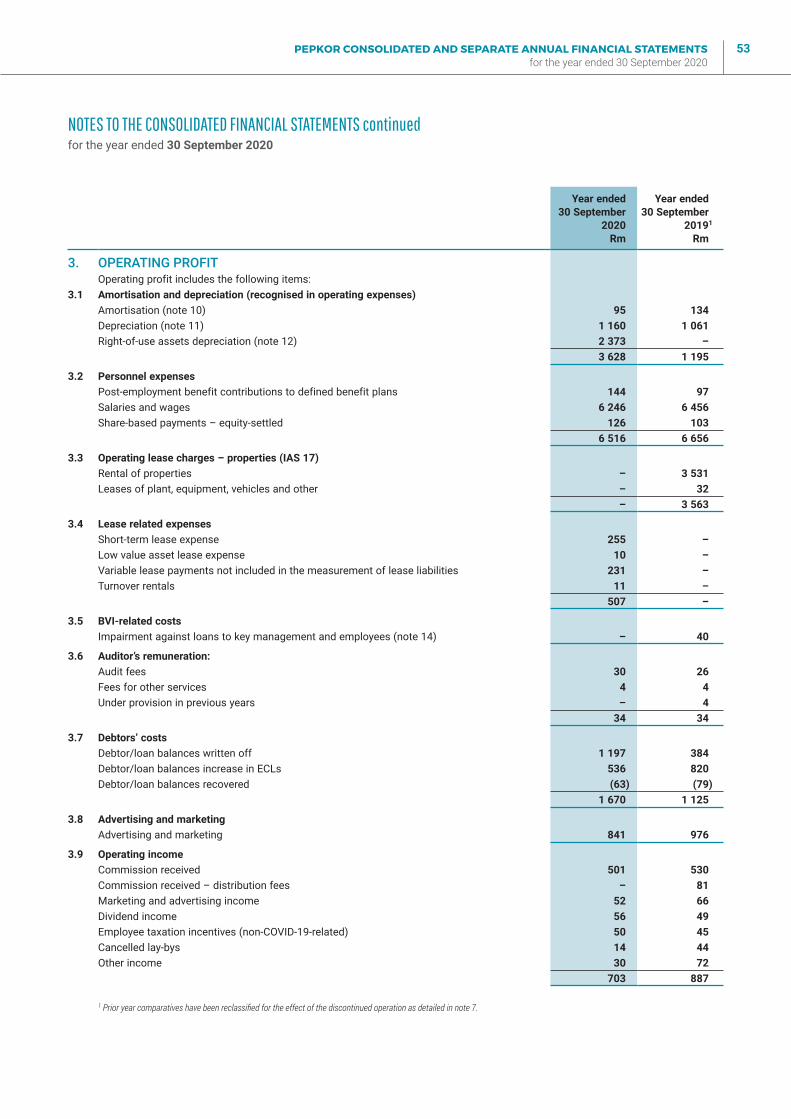
PEPKOR CONSOLIDATED AND SEPARATE ANNUAL FINANCIAL STATEMENTS for the year ended 30 September 2020
53
NOTES TO THE CONSOLIDATED FINANCIAL STATEMENTS continuedfor the year ended 30 September 2020
Year ended30 September
2020Rm
Year ended30 September
20191
Rm
3. OPERATING PROFITOperating profit includes the following items:
3.1 Amortisation and depreciation (recognised in operating expenses)Amortisation (note 10) 95 134 Depreciation (note 11) 1 160 1 061 Right-of-use assets depreciation (note 12) 2 373 –
3 628 1 195
3.2 Personnel expensesPost-employment benefit contributions to defined benefit plans 144 97 Salaries and wages 6 246 6 456 Share-based payments – equity-settled 126 103
6 516 6 656
3.3 Operating lease charges – properties (IAS 17)Rental of properties – 3 531 Leases of plant, equipment, vehicles and other – 32
– 3 563
3.4 Lease related expensesShort-term lease expense 255 –Low value asset lease expense 10 –Variable lease payments not included in the measurement of lease liabilities 231 –Turnover rentals 11 –
507 –
3.5 BVI-related costsImpairment against loans to key management and employees (note 14) – 40
3.6 Auditor’s remuneration: Audit fees 30 26 Fees for other services 4 4 Under provision in previous years – 4
34 34
3.7 Debtors’ costsDebtor/loan balances written off 1 197 384 Debtor/loan balances increase in ECLs 536 820 Debtor/loan balances recovered (63) (79)
1 670 1 125
3.8 Advertising and marketingAdvertising and marketing 841 976
3.9 Operating incomeCommission received 501 530 Commission received – distribution fees – 81 Marketing and advertising income 52 66 Dividend income 56 49 Employee taxation incentives (non-COVID-19-related) 50 45 Cancelled lay-bys 14 44 Other income 30 72
703 887
1 Prior year comparatives have been reclassified for the effect of the discontinued operation as detailed in note 7.
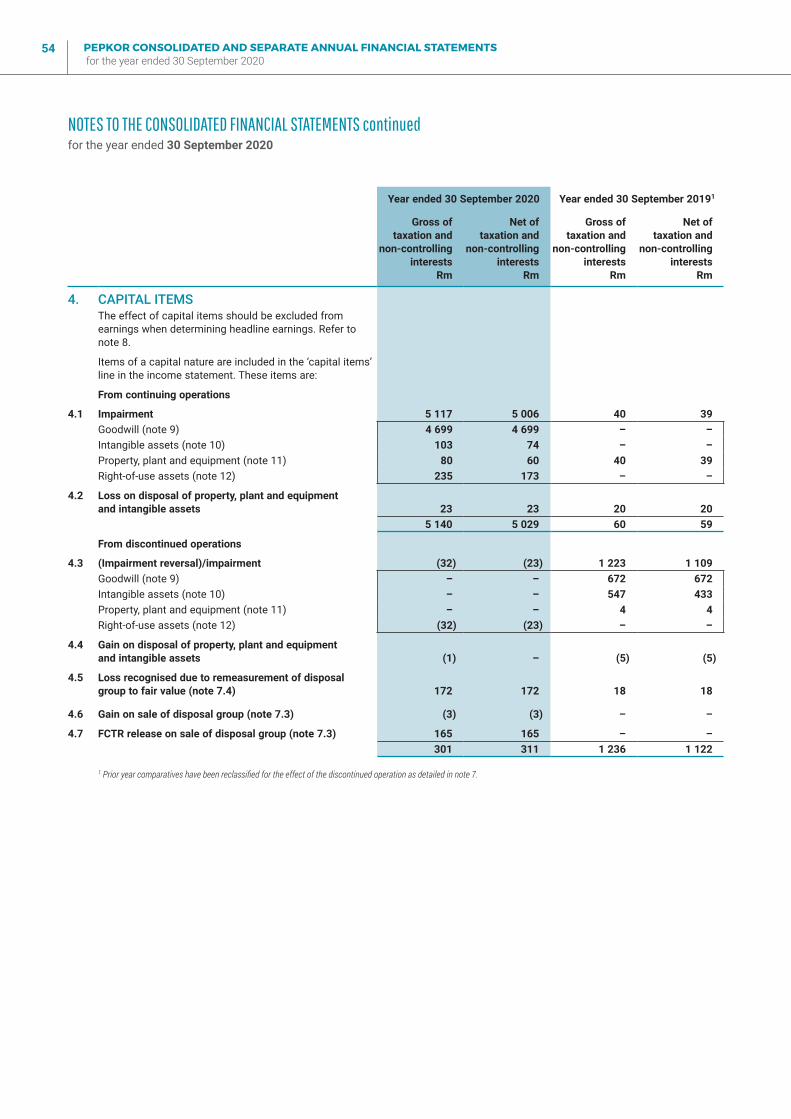
PEPKOR CONSOLIDATED AND SEPARATE ANNUAL FINANCIAL STATEMENTS for the year ended 30 September 2020
54
Year ended 30 September 2020 Year ended 30 September 20191
Gross oftaxation and
non-controllinginterests
Rm
Net oftaxation and
non-controllinginterests
Rm
Gross oftaxation and
non-controllinginterests
Rm
Net oftaxation and
non-controllinginterests
Rm
4. CAPITAL ITEMSThe effect of capital items should be excluded from earnings when determining headline earnings. Refer to note 8.
Items of a capital nature are included in the ‘capital items’ line in the income statement. These items are:
From continuing operations
4.1 Impairment 5 117 5 006 40 39 Goodwill (note 9) 4 699 4 699 – –Intangible assets (note 10) 103 74 – –Property, plant and equipment (note 11) 80 60 40 39 Right-of-use assets (note 12) 235 173 – –
4.2 Loss on disposal of property, plant and equipment and intangible assets 23 23 20 20
5 140 5 029 60 59
From discontinued operations
4.3 (Impairment reversal)/impairment (32) (23) 1 223 1 109 Goodwill (note 9) – – 672 672 Intangible assets (note 10) – – 547 433 Property, plant and equipment (note 11) – – 4 4 Right-of-use assets (note 12) (32) (23) – –
4.4 Gain on disposal of property, plant and equipment and intangible assets (1) – (5) (5)
4.5 Loss recognised due to remeasurement of disposal group to fair value (note 7.4) 172 172 18 18
4.6 Gain on sale of disposal group (note 7.3) (3) (3) – –
4.7 FCTR release on sale of disposal group (note 7.3) 165 165 – –301 311 1 236 1 122
1 Prior year comparatives have been reclassified for the effect of the discontinued operation as detailed in note 7.
NOTES TO THE CONSOLIDATED FINANCIAL STATEMENTS continuedfor the year ended 30 September 2020
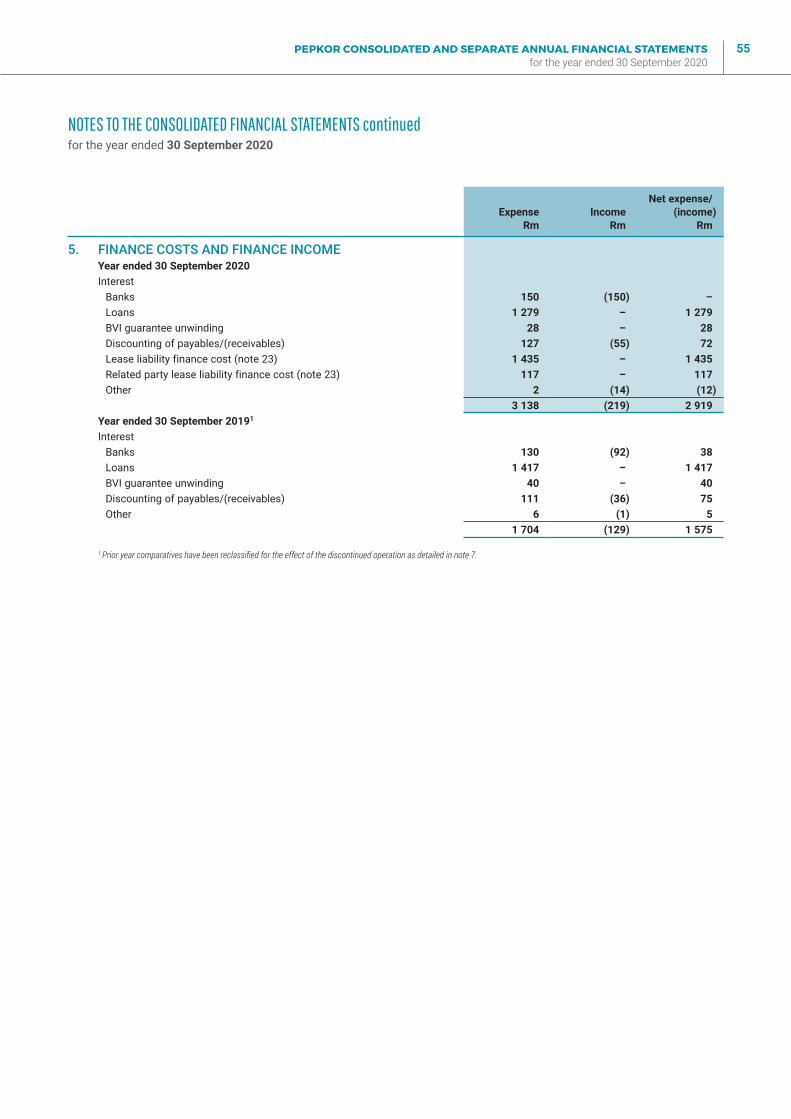
PEPKOR CONSOLIDATED AND SEPARATE ANNUAL FINANCIAL STATEMENTS for the year ended 30 September 2020
55
ExpenseRm
IncomeRm
Net expense/(income)
Rm
5. FINANCE COSTS AND FINANCE INCOMEYear ended 30 September 2020Interest
Banks 150 (150) –Loans 1 279 – 1 279 BVI guarantee unwinding 28 – 28 Discounting of payables/(receivables) 127 (55) 72 Lease liability finance cost (note 23) 1 435 – 1 435 Related party lease liability finance cost (note 23) 117 – 117 Other 2 (14) (12)
3 138 (219) 2 919 Year ended 30 September 20191
InterestBanks 130 (92) 38 Loans 1 417 – 1 417 BVI guarantee unwinding 40 – 40 Discounting of payables/(receivables) 111 (36) 75 Other 6 (1) 5
1 704 (129) 1 575
1 Prior year comparatives have been reclassified for the effect of the discontinued operation as detailed in note 7.
NOTES TO THE CONSOLIDATED FINANCIAL STATEMENTS continuedfor the year ended 30 September 2020
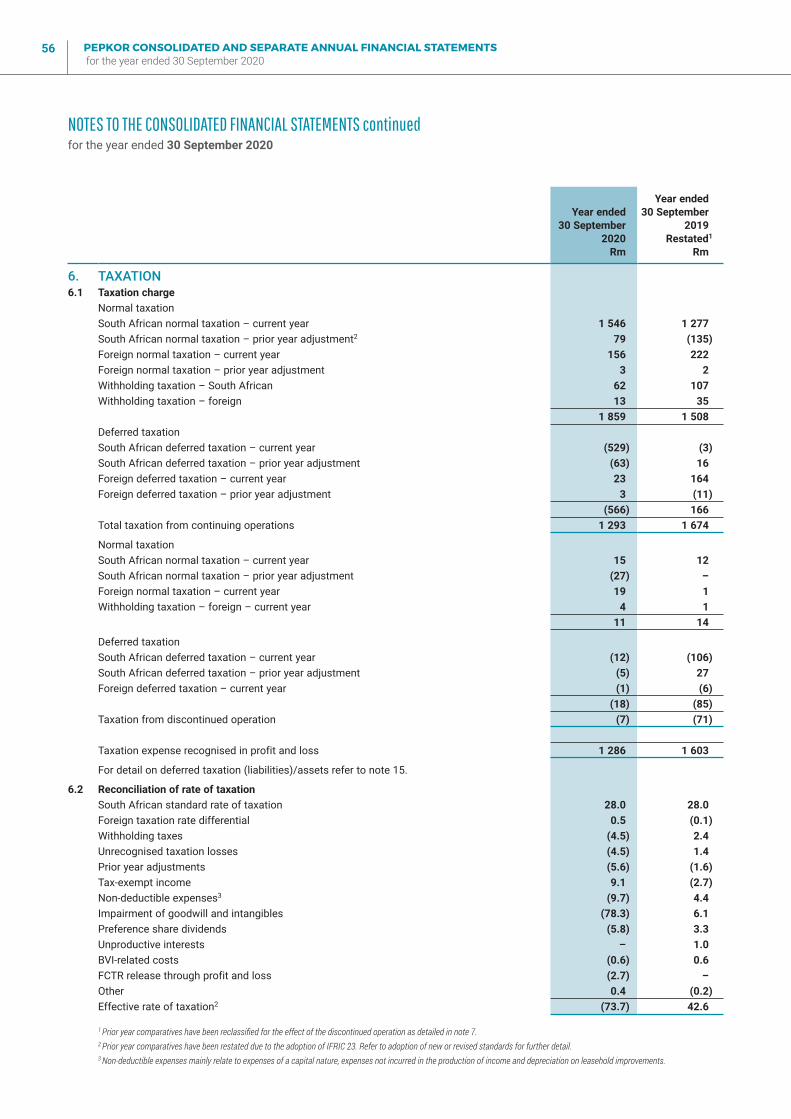
PEPKOR CONSOLIDATED AND SEPARATE ANNUAL FINANCIAL STATEMENTS for the year ended 30 September 2020
56
Year ended30 September
2020Rm
Year ended30 September
2019Restated1
Rm
6. TAXATION6.1 Taxation charge
Normal taxationSouth African normal taxation – current year 1 546 1 277 South African normal taxation – prior year adjustment2 79 (135)Foreign normal taxation – current year 156 222 Foreign normal taxation – prior year adjustment 3 2 Withholding taxation – South African 62 107 Withholding taxation – foreign 13 35
1 859 1 508 Deferred taxationSouth African deferred taxation – current year (529) (3)South African deferred taxation – prior year adjustment (63) 16 Foreign deferred taxation – current year 23 164 Foreign deferred taxation – prior year adjustment 3 (11)
(566) 166 Total taxation from continuing operations 1 293 1 674
Normal taxationSouth African normal taxation – current year 15 12 South African normal taxation – prior year adjustment (27) –Foreign normal taxation – current year 19 1 Withholding taxation – foreign – current year 4 1
11 14
Deferred taxationSouth African deferred taxation – current year (12) (106)South African deferred taxation – prior year adjustment (5) 27 Foreign deferred taxation – current year (1) (6)
(18) (85)Taxation from discontinued operation (7) (71)
Taxation expense recognised in profit and loss 1 286 1 603
For detail on deferred taxation (liabilities)/assets refer to note 15.
6.2 Reconciliation of rate of taxationSouth African standard rate of taxation 28.0 28.0 Foreign taxation rate differential 0.5 (0.1)Withholding taxes (4.5) 2.4 Unrecognised taxation losses (4.5) 1.4 Prior year adjustments (5.6) (1.6)Tax-exempt income 9.1 (2.7)Non-deductible expenses3 (9.7) 4.4 Impairment of goodwill and intangibles (78.3) 6.1 Preference share dividends (5.8) 3.3 Unproductive interests – 1.0 BVI-related costs (0.6) 0.6 FCTR release through profit and loss (2.7) –Other 0.4 (0.2)Effective rate of taxation2 (73.7) 42.6
1 Prior year comparatives have been reclassified for the effect of the discontinued operation as detailed in note 7.2 Prior year comparatives have been restated due to the adoption of IFRIC 23. Refer to adoption of new or revised standards for further detail.3 Non-deductible expenses mainly relate to expenses of a capital nature, expenses not incurred in the production of income and depreciation on leasehold improvements.
NOTES TO THE CONSOLIDATED FINANCIAL STATEMENTS continuedfor the year ended 30 September 2020
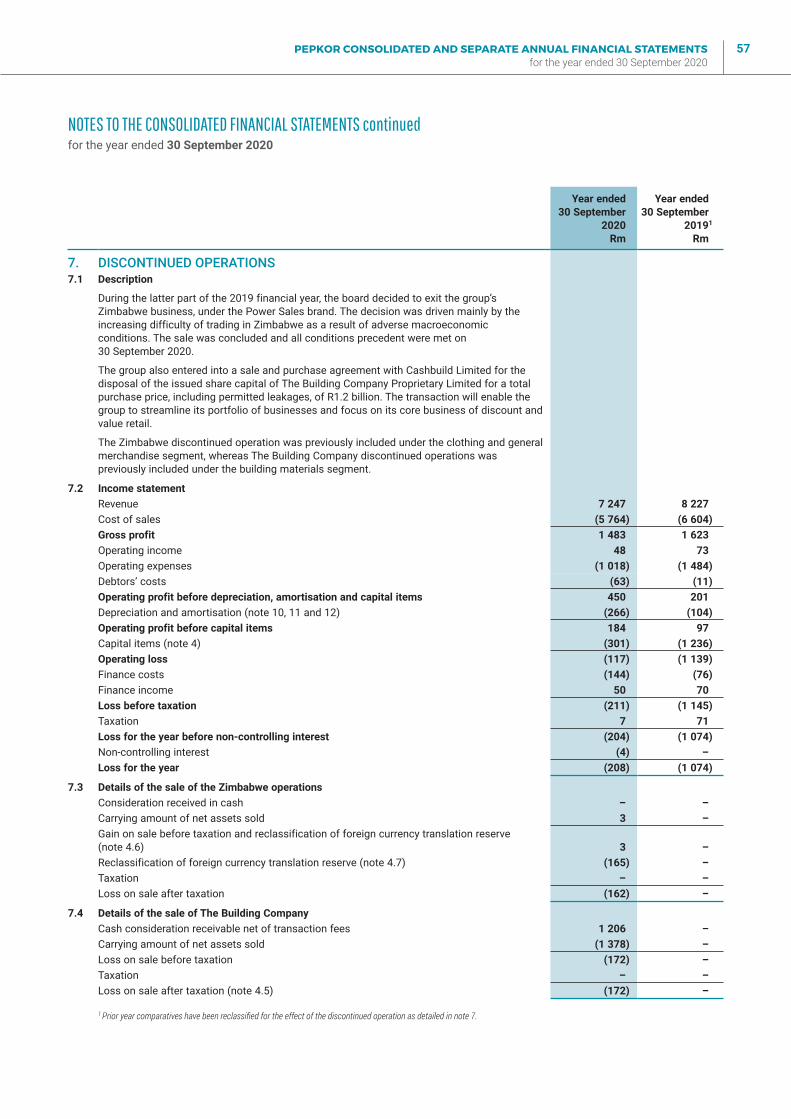
PEPKOR CONSOLIDATED AND SEPARATE ANNUAL FINANCIAL STATEMENTS for the year ended 30 September 2020
57
Year ended30 September
2020Rm
Year ended30 September
20191
Rm
7. DISCONTINUED OPERATIONS7.1 Description
During the latter part of the 2019 financial year, the board decided to exit the group’s Zimbabwe business, under the Power Sales brand. The decision was driven mainly by the increasing difficulty of trading in Zimbabwe as a result of adverse macroeconomic conditions. The sale was concluded and all conditions precedent were met on 30 September 2020.
The group also entered into a sale and purchase agreement with Cashbuild Limited for the disposal of the issued share capital of The Building Company Proprietary Limited for a total purchase price, including permitted leakages, of R1.2 billion. The transaction will enable the group to streamline its portfolio of businesses and focus on its core business of discount and value retail.
The Zimbabwe discontinued operation was previously included under the clothing and general merchandise segment, whereas The Building Company discontinued operations was previously included under the building materials segment.
7.2 Income statementRevenue 7 247 8 227 Cost of sales (5 764) (6 604)Gross profit 1 483 1 623 Operating income 48 73 Operating expenses (1 018) (1 484)Debtors’ costs (63) (11)Operating profit before depreciation, amortisation and capital items 450 201 Depreciation and amortisation (note 10, 11 and 12) (266) (104)Operating profit before capital items 184 97 Capital items (note 4) (301) (1 236)Operating loss (117) (1 139)Finance costs (144) (76)Finance income 50 70 Loss before taxation (211) (1 145)Taxation 7 71 Loss for the year before non-controlling interest (204) (1 074)Non-controlling interest (4) –Loss for the year (208) (1 074)
7.3 Details of the sale of the Zimbabwe operationsConsideration received in cash – –Carrying amount of net assets sold 3 –Gain on sale before taxation and reclassification of foreign currency translation reserve (note 4.6) 3 –Reclassification of foreign currency translation reserve (note 4.7) (165) –Taxation – –Loss on sale after taxation (162) –
7.4 Details of the sale of The Building CompanyCash consideration receivable net of transaction fees 1 206 –Carrying amount of net assets sold (1 378) –Loss on sale before taxation (172) –Taxation – –Loss on sale after taxation (note 4.5) (172) –
1 Prior year comparatives have been reclassified for the effect of the discontinued operation as detailed in note 7.
NOTES TO THE CONSOLIDATED FINANCIAL STATEMENTS continuedfor the year ended 30 September 2020
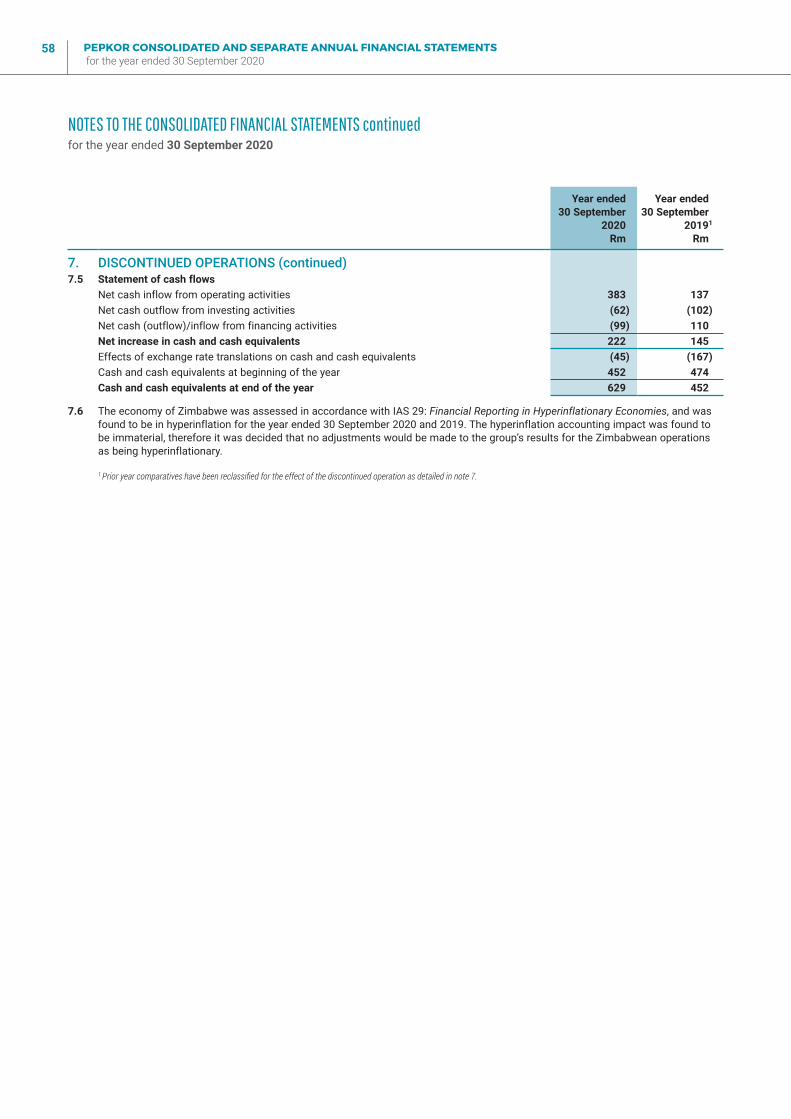
PEPKOR CONSOLIDATED AND SEPARATE ANNUAL FINANCIAL STATEMENTS for the year ended 30 September 2020
58
Year ended 30 September
2020Rm
Year ended 30 September
20191
Rm
7. DISCONTINUED OPERATIONS (continued)7.5 Statement of cash flows
Net cash inflow from operating activities 383 137 Net cash outflow from investing activities (62) (102)Net cash (outflow)/inflow from financing activities (99) 110 Net increase in cash and cash equivalents 222 145 Effects of exchange rate translations on cash and cash equivalents (45) (167)Cash and cash equivalents at beginning of the year 452 474 Cash and cash equivalents at end of the year 629 452
7.6 The economy of Zimbabwe was assessed in accordance with IAS 29: Financial Reporting in Hyperinflationary Economies, and was found to be in hyperinflation for the year ended 30 September 2020 and 2019. The hyperinflation accounting impact was found to be immaterial, therefore it was decided that no adjustments would be made to the group’s results for the Zimbabwean operations as being hyperinflationary.
1 Prior year comparatives have been reclassified for the effect of the discontinued operation as detailed in note 7.
NOTES TO THE CONSOLIDATED FINANCIAL STATEMENTS continuedfor the year ended 30 September 2020
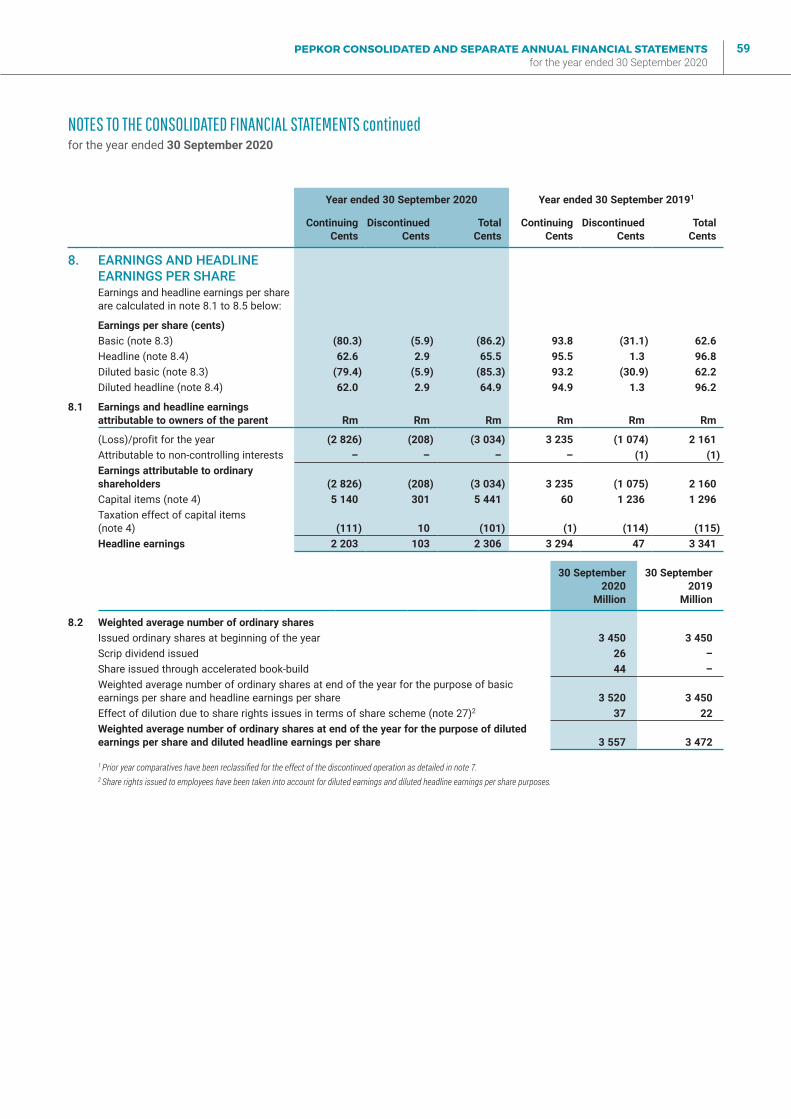
PEPKOR CONSOLIDATED AND SEPARATE ANNUAL FINANCIAL STATEMENTS for the year ended 30 September 2020
59
Year ended 30 September 2020 Year ended 30 September 20191
ContinuingCents
DiscontinuedCents
Total Cents
ContinuingCents
DiscontinuedCents
Total Cents
8. EARNINGS AND HEADLINE EARNINGS PER SHAREEarnings and headline earnings per share are calculated in note 8.1 to 8.5 below:
Earnings per share (cents)Basic (note 8.3) (80.3) (5.9) (86.2) 93.8 (31.1) 62.6 Headline (note 8.4) 62.6 2.9 65.5 95.5 1.3 96.8 Diluted basic (note 8.3) (79.4) (5.9) (85.3) 93.2 (30.9) 62.2 Diluted headline (note 8.4) 62.0 2.9 64.9 94.9 1.3 96.2
8.1 Earnings and headline earnings attributable to owners of the parent Rm Rm Rm Rm Rm Rm
(Loss)/profit for the year (2 826) (208) (3 034) 3 235 (1 074) 2 161 Attributable to non-controlling interests – – – – (1) (1)Earnings attributable to ordinary shareholders (2 826) (208) (3 034) 3 235 (1 075) 2 160 Capital items (note 4) 5 140 301 5 441 60 1 236 1 296 Taxation effect of capital items (note 4) (111) 10 (101) (1) (114) (115)Headline earnings 2 203 103 2 306 3 294 47 3 341
30 September2020
Million
30 September2019
Million
8.2 Weighted average number of ordinary sharesIssued ordinary shares at beginning of the year 3 450 3 450 Scrip dividend issued 26 –Share issued through accelerated book-build 44 –Weighted average number of ordinary shares at end of the year for the purpose of basic earnings per share and headline earnings per share 3 520 3 450 Effect of dilution due to share rights issues in terms of share scheme (note 27)2 37 22 Weighted average number of ordinary shares at end of the year for the purpose of diluted earnings per share and diluted headline earnings per share 3 557 3 472
1 Prior year comparatives have been reclassified for the effect of the discontinued operation as detailed in note 7.2 Share rights issued to employees have been taken into account for diluted earnings and diluted headline earnings per share purposes.
NOTES TO THE CONSOLIDATED FINANCIAL STATEMENTS continuedfor the year ended 30 September 2020
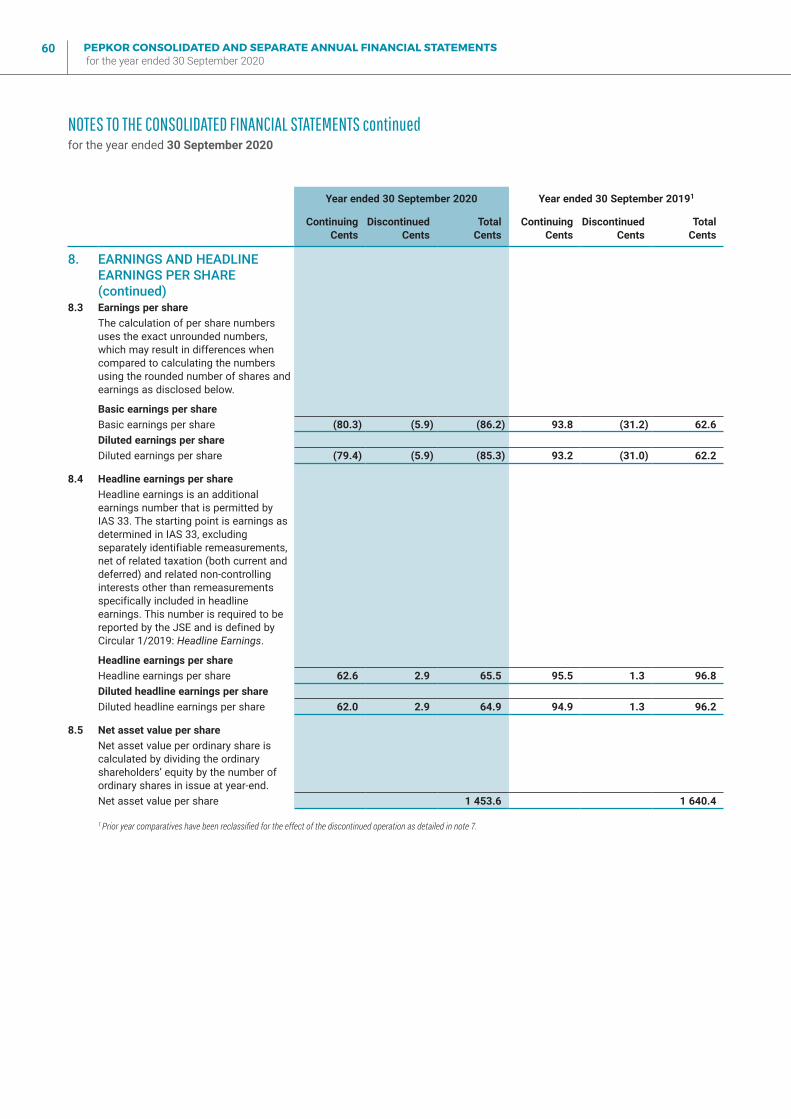
PEPKOR CONSOLIDATED AND SEPARATE ANNUAL FINANCIAL STATEMENTS for the year ended 30 September 2020
60
Year ended 30 September 2020 Year ended 30 September 20191
ContinuingCents
DiscontinuedCents
Total Cents
ContinuingCents
DiscontinuedCents
Total Cents
8. EARNINGS AND HEADLINE EARNINGS PER SHARE (continued)
8.3 Earnings per shareThe calculation of per share numbers uses the exact unrounded numbers, which may result in differences when compared to calculating the numbers using the rounded number of shares and earnings as disclosed below.
Basic earnings per shareBasic earnings per share (80.3) (5.9) (86.2) 93.8 (31.2) 62.6 Diluted earnings per shareDiluted earnings per share (79.4) (5.9) (85.3) 93.2 (31.0) 62.2
8.4 Headline earnings per shareHeadline earnings is an additional earnings number that is permitted by IAS 33. The starting point is earnings as determined in IAS 33, excluding separately identifiable remeasurements, net of related taxation (both current and deferred) and related non-controlling interests other than remeasurements specifically included in headline earnings. This number is required to be reported by the JSE and is defined by Circular 1/2019: Headline Earnings.
Headline earnings per shareHeadline earnings per share 62.6 2.9 65.5 95.5 1.3 96.8 Diluted headline earnings per shareDiluted headline earnings per share 62.0 2.9 64.9 94.9 1.3 96.2
8.5 Net asset value per shareNet asset value per ordinary share is calculated by dividing the ordinary shareholders’ equity by the number of ordinary shares in issue at year-end.Net asset value per share 1 453.6 1 640.4
1 Prior year comparatives have been reclassified for the effect of the discontinued operation as detailed in note 7.
NOTES TO THE CONSOLIDATED FINANCIAL STATEMENTS continuedfor the year ended 30 September 2020
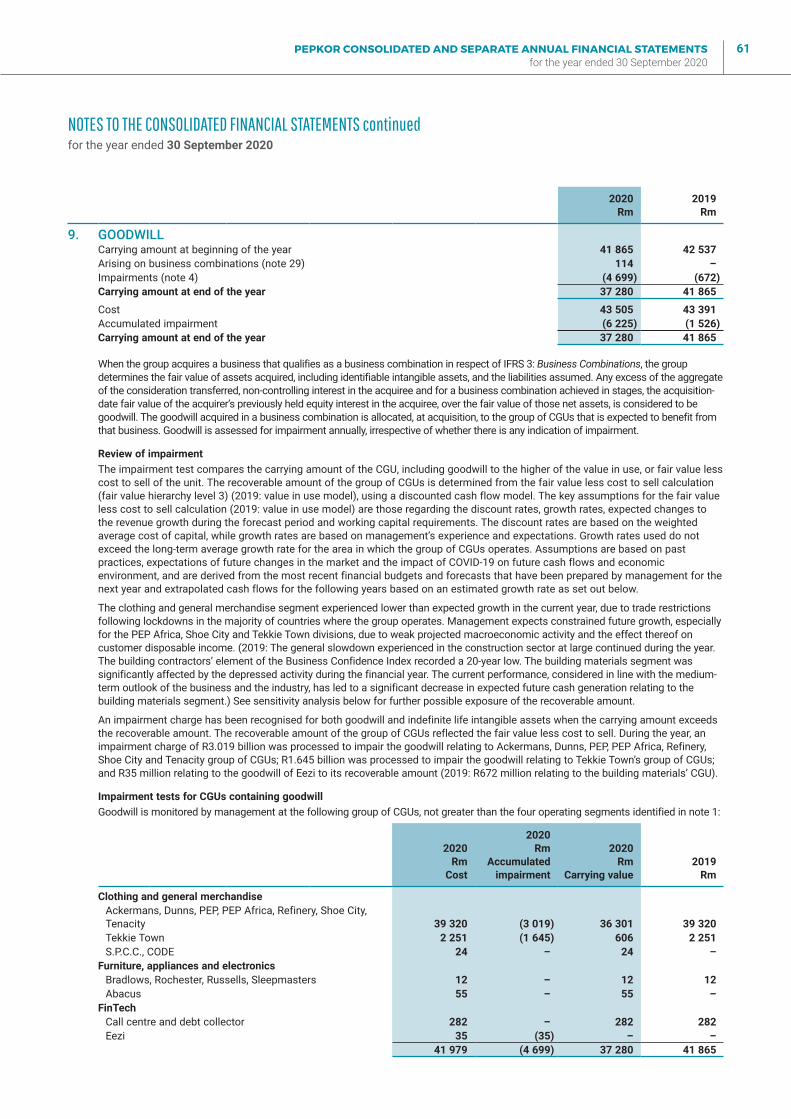
PEPKOR CONSOLIDATED AND SEPARATE ANNUAL FINANCIAL STATEMENTS for the year ended 30 September 2020
61
2020Rm
2019Rm
9. GOODWILLCarrying amount at beginning of the year 41 865 42 537 Arising on business combinations (note 29) 114 –Impairments (note 4) (4 699) (672)Carrying amount at end of the year 37 280 41 865
Cost 43 505 43 391 Accumulated impairment (6 225) (1 526)Carrying amount at end of the year 37 280 41 865
When the group acquires a business that qualifies as a business combination in respect of IFRS 3: Business Combinations, the group determines the fair value of assets acquired, including identifiable intangible assets, and the liabilities assumed. Any excess of the aggregate of the consideration transferred, non-controlling interest in the acquiree and for a business combination achieved in stages, the acquisition-date fair value of the acquirer’s previously held equity interest in the acquiree, over the fair value of those net assets, is considered to be goodwill. The goodwill acquired in a business combination is allocated, at acquisition, to the group of CGUs that is expected to benefit from that business. Goodwill is assessed for impairment annually, irrespective of whether there is any indication of impairment.
Review of impairmentThe impairment test compares the carrying amount of the CGU, including goodwill to the higher of the value in use, or fair value less cost to sell of the unit. The recoverable amount of the group of CGUs is determined from the fair value less cost to sell calculation (fair value hierarchy level 3) (2019: value in use model), using a discounted cash flow model. The key assumptions for the fair value less cost to sell calculation (2019: value in use model) are those regarding the discount rates, growth rates, expected changes to the revenue growth during the forecast period and working capital requirements. The discount rates are based on the weighted average cost of capital, while growth rates are based on management’s experience and expectations. Growth rates used do not exceed the long-term average growth rate for the area in which the group of CGUs operates. Assumptions are based on past practices, expectations of future changes in the market and the impact of COVID-19 on future cash flows and economic environment, and are derived from the most recent financial budgets and forecasts that have been prepared by management for the next year and extrapolated cash flows for the following years based on an estimated growth rate as set out below.
The clothing and general merchandise segment experienced lower than expected growth in the current year, due to trade restrictions following lockdowns in the majority of countries where the group operates. Management expects constrained future growth, especially for the PEP Africa, Shoe City and Tekkie Town divisions, due to weak projected macroeconomic activity and the effect thereof on customer disposable income. (2019: The general slowdown experienced in the construction sector at large continued during the year. The building contractors’ element of the Business Confidence Index recorded a 20-year low. The building materials segment was significantly affected by the depressed activity during the financial year. The current performance, considered in line with the medium-term outlook of the business and the industry, has led to a significant decrease in expected future cash generation relating to the building materials segment.) See sensitivity analysis below for further possible exposure of the recoverable amount.
An impairment charge has been recognised for both goodwill and indefinite life intangible assets when the carrying amount exceeds the recoverable amount. The recoverable amount of the group of CGUs reflected the fair value less cost to sell. During the year, an impairment charge of R3.019 billion was processed to impair the goodwill relating to Ackermans, Dunns, PEP, PEP Africa, Refinery, Shoe City and Tenacity group of CGUs; R1.645 billion was processed to impair the goodwill relating to Tekkie Town’s group of CGUs; and R35 million relating to the goodwill of Eezi to its recoverable amount (2019: R672 million relating to the building materials’ CGU).
Impairment tests for CGUs containing goodwillGoodwill is monitored by management at the following group of CGUs, not greater than the four operating segments identified in note 1:
2020Rm
Cost
2020Rm
Accumulatedimpairment
2020Rm
Carrying value2019
Rm
Clothing and general merchandiseAckermans, Dunns, PEP, PEP Africa, Refinery, Shoe City, Tenacity 39 320 (3 019) 36 301 39 320 Tekkie Town 2 251 (1 645) 606 2 251 S.P.C.C., CODE 24 – 24 –
Furniture, appliances and electronicsBradlows, Rochester, Russells, Sleepmasters 12 – 12 12 Abacus 55 – 55 –
FinTechCall centre and debt collector 282 – 282 282 Eezi 35 (35) – –
41 979 (4 699) 37 280 41 865
NOTES TO THE CONSOLIDATED FINANCIAL STATEMENTS continuedfor the year ended 30 September 2020
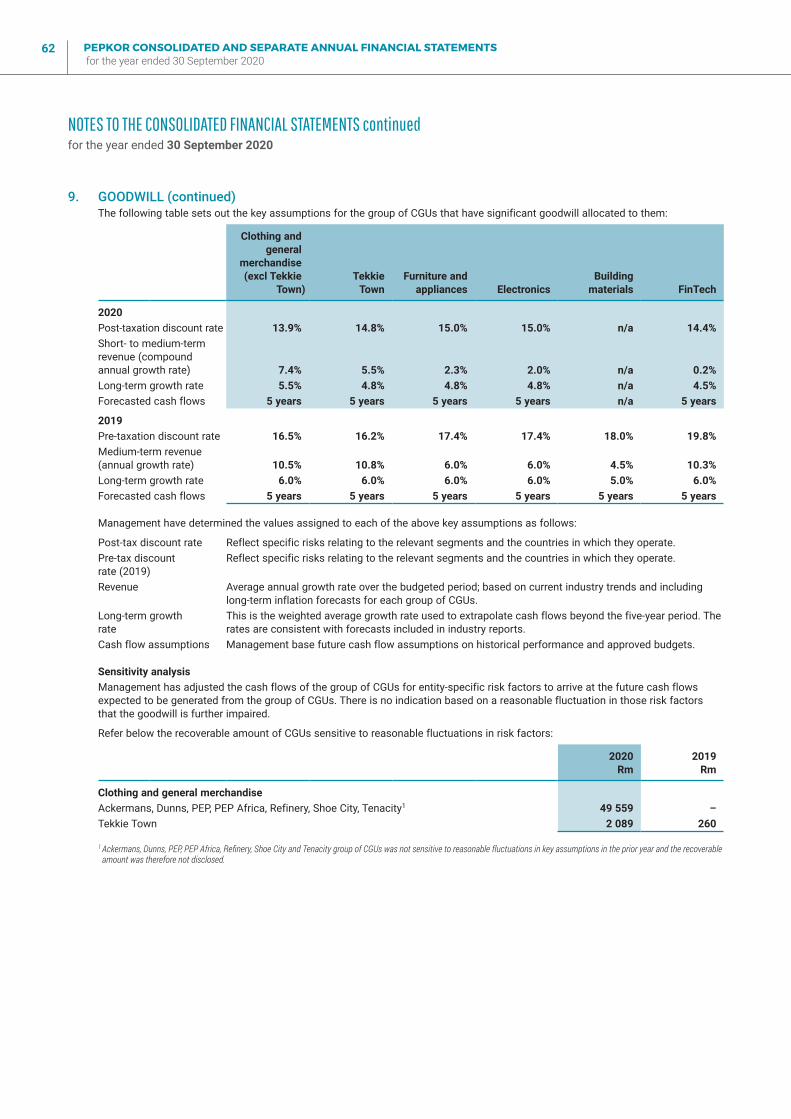
PEPKOR CONSOLIDATED AND SEPARATE ANNUAL FINANCIAL STATEMENTS for the year ended 30 September 2020
62
9. GOODWILL (continued)The following table sets out the key assumptions for the group of CGUs that have significant goodwill allocated to them:
Clothing andgeneral
merchandise(excl Tekkie
Town)Tekkie
TownFurniture and
appliances ElectronicsBuilding
materials FinTech
2020Post-taxation discount rate 13.9% 14.8% 15.0% 15.0% n/a 14.4%Short- to medium-term revenue (compound annual growth rate) 7.4% 5.5% 2.3% 2.0% n/a 0.2%Long-term growth rate 5.5% 4.8% 4.8% 4.8% n/a 4.5%Forecasted cash flows 5 years 5 years 5 years 5 years n/a 5 years
2019Pre-taxation discount rate 16.5% 16.2% 17.4% 17.4% 18.0% 19.8%Medium-term revenue (annual growth rate) 10.5% 10.8% 6.0% 6.0% 4.5% 10.3%Long-term growth rate 6.0% 6.0% 6.0% 6.0% 5.0% 6.0%Forecasted cash flows 5 years 5 years 5 years 5 years 5 years 5 years
Management have determined the values assigned to each of the above key assumptions as follows:
Post-tax discount rate Reflect specific risks relating to the relevant segments and the countries in which they operate.Pre-tax discount rate (2019)
Reflect specific risks relating to the relevant segments and the countries in which they operate.
Revenue Average annual growth rate over the budgeted period; based on current industry trends and including long-term inflation forecasts for each group of CGUs.
Long-term growth rate
This is the weighted average growth rate used to extrapolate cash flows beyond the five-year period. The rates are consistent with forecasts included in industry reports.
Cash flow assumptions Management base future cash flow assumptions on historical performance and approved budgets.
Sensitivity analysisManagement has adjusted the cash flows of the group of CGUs for entity-specific risk factors to arrive at the future cash flows expected to be generated from the group of CGUs. There is no indication based on a reasonable fluctuation in those risk factors that the goodwill is further impaired.
Refer below the recoverable amount of CGUs sensitive to reasonable fluctuations in risk factors:
2020Rm
2019Rm
Clothing and general merchandiseAckermans, Dunns, PEP, PEP Africa, Refinery, Shoe City, Tenacity1 49 559 –Tekkie Town 2 089 260
1 Ackermans, Dunns, PEP, PEP Africa, Refinery, Shoe City and Tenacity group of CGUs was not sensitive to reasonable fluctuations in key assumptions in the prior year and the recoverable amount was therefore not disclosed.
NOTES TO THE CONSOLIDATED FINANCIAL STATEMENTS continuedfor the year ended 30 September 2020
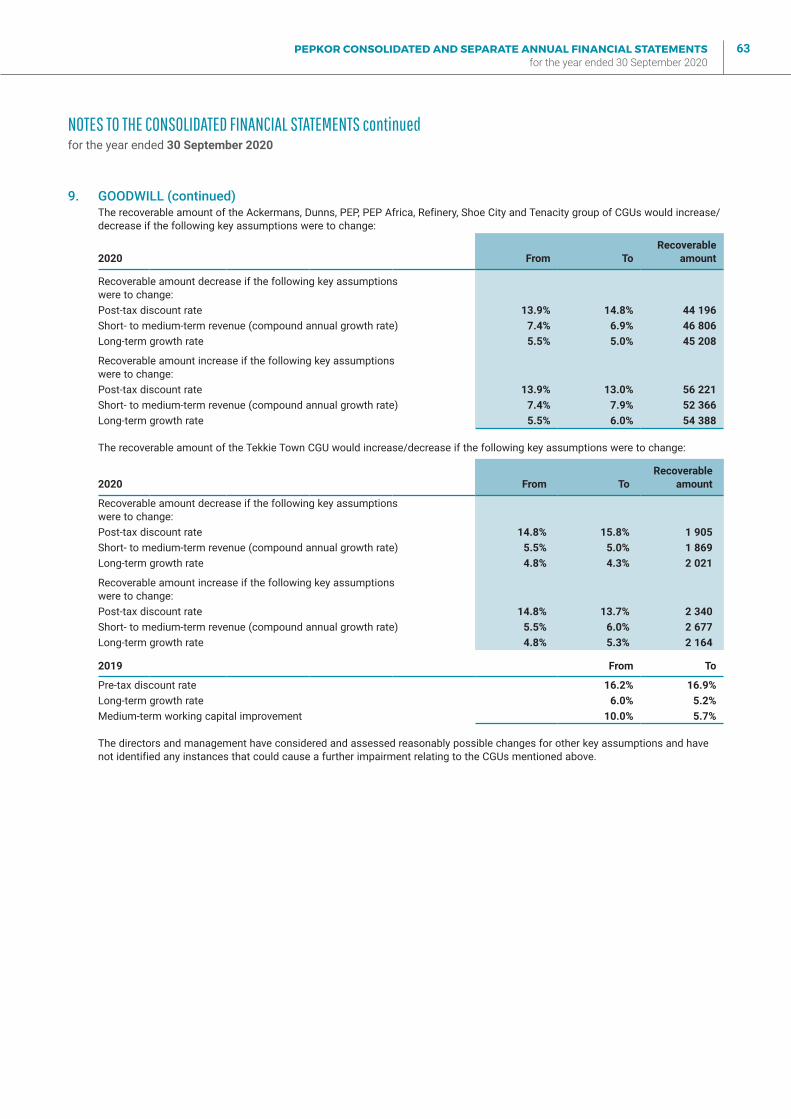
PEPKOR CONSOLIDATED AND SEPARATE ANNUAL FINANCIAL STATEMENTS for the year ended 30 September 2020
63
9. GOODWILL (continued)The recoverable amount of the Ackermans, Dunns, PEP, PEP Africa, Refinery, Shoe City and Tenacity group of CGUs would increase/decrease if the following key assumptions were to change:
2020 From ToRecoverable
amount
Recoverable amount decrease if the following key assumptions were to change:Post-tax discount rate 13.9% 14.8% 44 196 Short- to medium-term revenue (compound annual growth rate) 7.4% 6.9% 46 806 Long-term growth rate 5.5% 5.0% 45 208
Recoverable amount increase if the following key assumptions were to change:Post-tax discount rate 13.9% 13.0% 56 221 Short- to medium-term revenue (compound annual growth rate) 7.4% 7.9% 52 366 Long-term growth rate 5.5% 6.0% 54 388
The recoverable amount of the Tekkie Town CGU would increase/decrease if the following key assumptions were to change:
2020 From ToRecoverable
amount
Recoverable amount decrease if the following key assumptions were to change:Post-tax discount rate 14.8% 15.8% 1 905 Short- to medium-term revenue (compound annual growth rate) 5.5% 5.0% 1 869 Long-term growth rate 4.8% 4.3% 2 021
Recoverable amount increase if the following key assumptions were to change:Post-tax discount rate 14.8% 13.7% 2 340 Short- to medium-term revenue (compound annual growth rate) 5.5% 6.0% 2 677 Long-term growth rate 4.8% 5.3% 2 164
2019 From To
Pre-tax discount rate 16.2% 16.9%Long-term growth rate 6.0% 5.2%Medium-term working capital improvement 10.0% 5.7%
The directors and management have considered and assessed reasonably possible changes for other key assumptions and have not identified any instances that could cause a further impairment relating to the CGUs mentioned above.
NOTES TO THE CONSOLIDATED FINANCIAL STATEMENTS continuedfor the year ended 30 September 2020
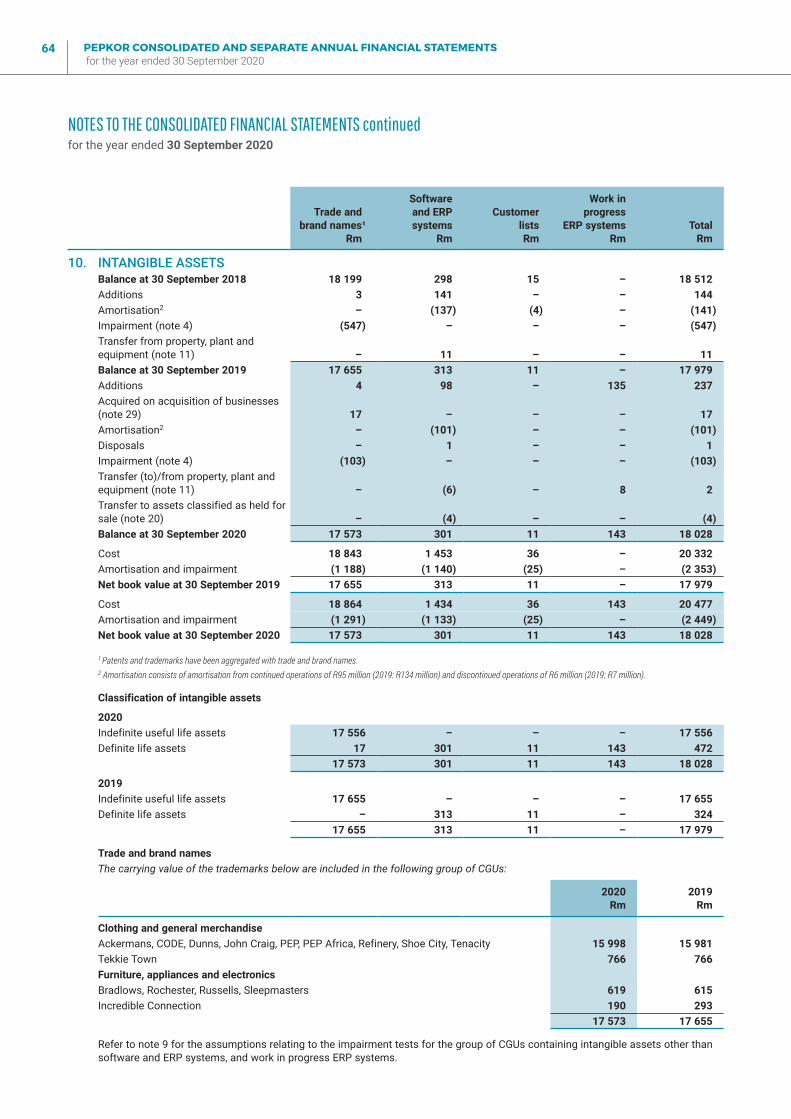
PEPKOR CONSOLIDATED AND SEPARATE ANNUAL FINANCIAL STATEMENTS for the year ended 30 September 2020
64
Trade andbrand names¹
Rm
Software and ERP systems
Rm
Customerlists Rm
Work in progress
ERP systems Rm
Total Rm
10. INTANGIBLE ASSETSBalance at 30 September 2018 18 199 298 15 – 18 512 Additions 3 141 – – 144 Amortisation2 – (137) (4) – (141)Impairment (note 4) (547) – – – (547)Transfer from property, plant and equipment (note 11) – 11 – – 11 Balance at 30 September 2019 17 655 313 11 – 17 979 Additions 4 98 – 135 237 Acquired on acquisition of businesses (note 29) 17 – – – 17 Amortisation2 – (101) – – (101)Disposals – 1 – – 1 Impairment (note 4) (103) – – – (103)Transfer (to)/from property, plant and equipment (note 11) – (6) – 8 2 Transfer to assets classified as held for sale (note 20) – (4) – – (4)Balance at 30 September 2020 17 573 301 11 143 18 028
Cost 18 843 1 453 36 – 20 332 Amortisation and impairment (1 188) (1 140) (25) – (2 353)Net book value at 30 September 2019 17 655 313 11 – 17 979
Cost 18 864 1 434 36 143 20 477 Amortisation and impairment (1 291) (1 133) (25) – (2 449)Net book value at 30 September 2020 17 573 301 11 143 18 028
1 Patents and trademarks have been aggregated with trade and brand names.2 Amortisation consists of amortisation from continued operations of R95 million (2019: R134 million) and discontinued operations of R6 million (2019: R7 million).
Classification of intangible assets
2020Indefinite useful life assets 17 556 – – – 17 556 Definite life assets 17 301 11 143 472
17 573 301 11 143 18 028
2019Indefinite useful life assets 17 655 – – – 17 655 Definite life assets – 313 11 – 324
17 655 313 11 – 17 979
Trade and brand namesThe carrying value of the trademarks below are included in the following group of CGUs:
2020Rm
2019Rm
Clothing and general merchandiseAckermans, CODE, Dunns, John Craig, PEP, PEP Africa, Refinery, Shoe City, Tenacity 15 998 15 981 Tekkie Town 766 766 Furniture, appliances and electronicsBradlows, Rochester, Russells, Sleepmasters 619 615 Incredible Connection 190 293
17 573 17 655
Refer to note 9 for the assumptions relating to the impairment tests for the group of CGUs containing intangible assets other than software and ERP systems, and work in progress ERP systems.
NOTES TO THE CONSOLIDATED FINANCIAL STATEMENTS continuedfor the year ended 30 September 2020
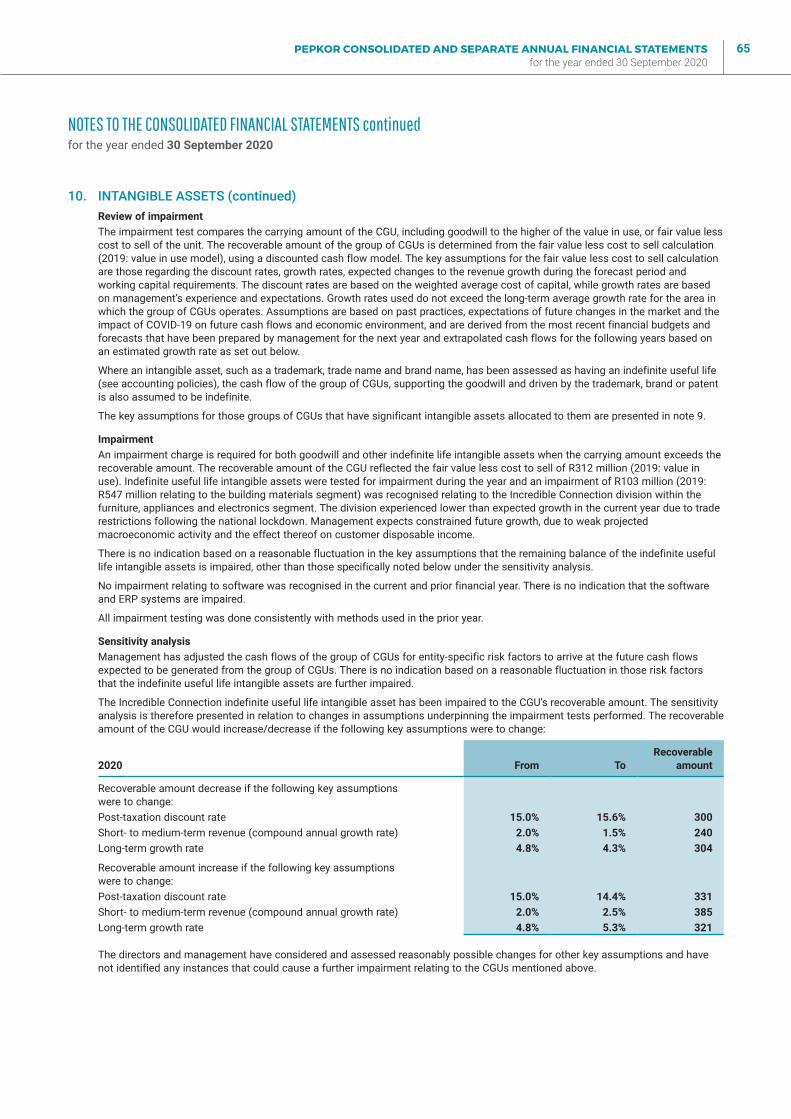
PEPKOR CONSOLIDATED AND SEPARATE ANNUAL FINANCIAL STATEMENTS for the year ended 30 September 2020
65
10. INTANGIBLE ASSETS (continued)Review of impairmentThe impairment test compares the carrying amount of the CGU, including goodwill to the higher of the value in use, or fair value less cost to sell of the unit. The recoverable amount of the group of CGUs is determined from the fair value less cost to sell calculation (2019: value in use model), using a discounted cash flow model. The key assumptions for the fair value less cost to sell calculation are those regarding the discount rates, growth rates, expected changes to the revenue growth during the forecast period and working capital requirements. The discount rates are based on the weighted average cost of capital, while growth rates are based on management’s experience and expectations. Growth rates used do not exceed the long-term average growth rate for the area in which the group of CGUs operates. Assumptions are based on past practices, expectations of future changes in the market and the impact of COVID-19 on future cash flows and economic environment, and are derived from the most recent financial budgets and forecasts that have been prepared by management for the next year and extrapolated cash flows for the following years based on an estimated growth rate as set out below.
Where an intangible asset, such as a trademark, trade name and brand name, has been assessed as having an indefinite useful life (see accounting policies), the cash flow of the group of CGUs, supporting the goodwill and driven by the trademark, brand or patent is also assumed to be indefinite.
The key assumptions for those groups of CGUs that have significant intangible assets allocated to them are presented in note 9.
ImpairmentAn impairment charge is required for both goodwill and other indefinite life intangible assets when the carrying amount exceeds the recoverable amount. The recoverable amount of the CGU reflected the fair value less cost to sell of R312 million (2019: value in use). Indefinite useful life intangible assets were tested for impairment during the year and an impairment of R103 million (2019: R547 million relating to the building materials segment) was recognised relating to the Incredible Connection division within the furniture, appliances and electronics segment. The division experienced lower than expected growth in the current year due to trade restrictions following the national lockdown. Management expects constrained future growth, due to weak projected macroeconomic activity and the effect thereof on customer disposable income.
There is no indication based on a reasonable fluctuation in the key assumptions that the remaining balance of the indefinite useful life intangible assets is impaired, other than those specifically noted below under the sensitivity analysis.
No impairment relating to software was recognised in the current and prior financial year. There is no indication that the software and ERP systems are impaired.
All impairment testing was done consistently with methods used in the prior year.
Sensitivity analysisManagement has adjusted the cash flows of the group of CGUs for entity-specific risk factors to arrive at the future cash flows expected to be generated from the group of CGUs. There is no indication based on a reasonable fluctuation in those risk factors that the indefinite useful life intangible assets are further impaired.
The Incredible Connection indefinite useful life intangible asset has been impaired to the CGU’s recoverable amount. The sensitivity analysis is therefore presented in relation to changes in assumptions underpinning the impairment tests performed. The recoverable amount of the CGU would increase/decrease if the following key assumptions were to change:
2020 From ToRecoverable
amount
Recoverable amount decrease if the following key assumptions were to change:Post-taxation discount rate 15.0% 15.6% 300 Short- to medium-term revenue (compound annual growth rate) 2.0% 1.5% 240 Long-term growth rate 4.8% 4.3% 304
Recoverable amount increase if the following key assumptions were to change:Post-taxation discount rate 15.0% 14.4% 331 Short- to medium-term revenue (compound annual growth rate) 2.0% 2.5% 385 Long-term growth rate 4.8% 5.3% 321
The directors and management have considered and assessed reasonably possible changes for other key assumptions and have not identified any instances that could cause a further impairment relating to the CGUs mentioned above.
NOTES TO THE CONSOLIDATED FINANCIAL STATEMENTS continuedfor the year ended 30 September 2020
PEPKOR CONSOLIDATED AND SEPARATE ANNUAL FINANCIAL STATEMENTS for the year ended 30 September 2020
66
10. INTANGIBLE ASSETS (continued)Useful livesUnder IAS 38, the useful life of an asset is either finite or indefinite. An indefinite life does not mean an infinite useful life, but rather that there is no foreseeable limit to the period over which the asset can be expected to generate cash flows for the entity. Intangible assets with an indefinite useful life are not amortised; an impairment test is performed at least annually, as well as an annual review of the assumptions used to determine the useful life.
The majority of the group’s trade names, brand names and/or trademarks have been assessed as having an indefinite useful life. The majority of these trade names and brand names were assessed independently at the time of the acquisitions, and the indefinite useful life assumptions were supported by the following evidence:
� The industry is mature and well established.
� The trade names, brand names and/or trademarks are long established relative to the market and have been in existence for a long time.
� The intangible assets relate to trade names, brand names, trademarks and patents rather than products and are therefore not vulnerable to typical product life cycles or to the technical, technological, commercial or other types of obsolescence that can be seen to limit the useful lives of other trade names and brand names.
� There is a relatively low turnover of comparable intangible assets, implying stability within the industry.
NOTES TO THE CONSOLIDATED FINANCIAL STATEMENTS continuedfor the year ended 30 September 2020
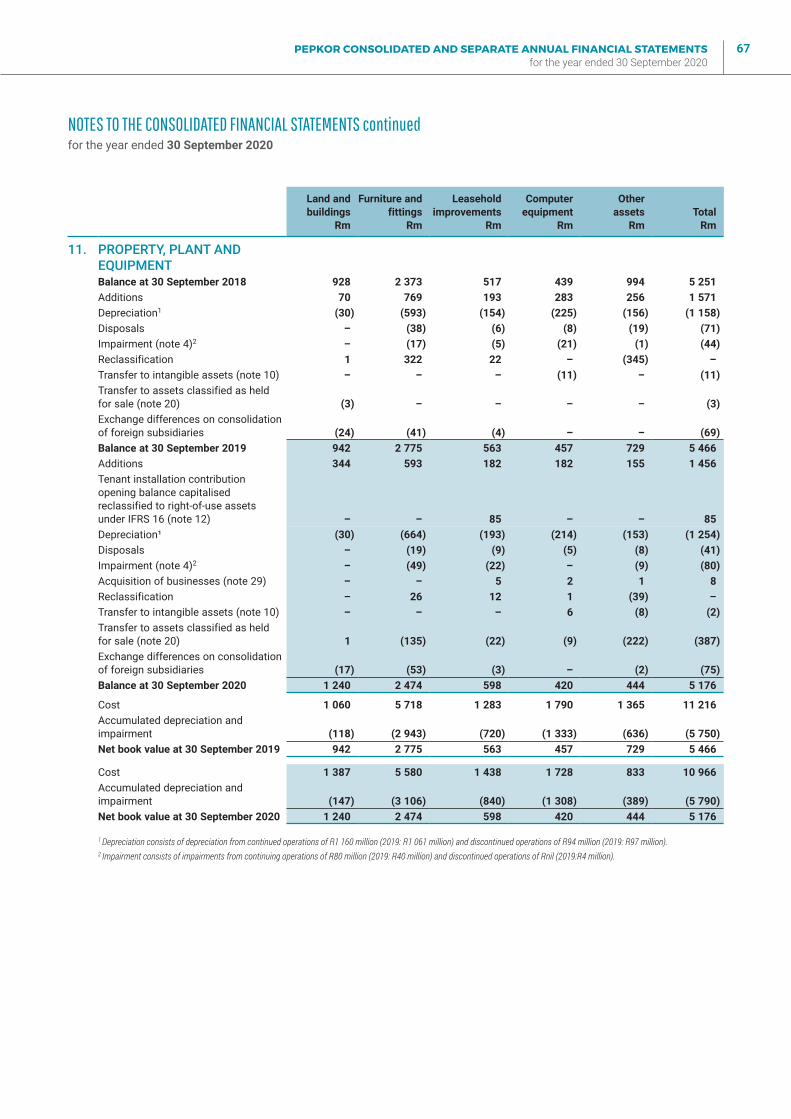
PEPKOR CONSOLIDATED AND SEPARATE ANNUAL FINANCIAL STATEMENTS for the year ended 30 September 2020
67
Land andbuildings
Rm
Furniture andfittings
Rm
Leaseholdimprovements
Rm
Computerequipment
Rm
Otherassets
Rm Total Rm
11. PROPERTY, PLANT AND EQUIPMENTBalance at 30 September 2018 928 2 373 517 439 994 5 251 Additions 70 769 193 283 256 1 571 Depreciation1 (30) (593) (154) (225) (156) (1 158)Disposals – (38) (6) (8) (19) (71)Impairment (note 4)2 – (17) (5) (21) (1) (44)Reclassification 1 322 22 – (345) –Transfer to intangible assets (note 10) – – – (11) – (11)Transfer to assets classified as held for sale (note 20) (3) – – – – (3)Exchange differences on consolidation of foreign subsidiaries (24) (41) (4) – – (69)Balance at 30 September 2019 942 2 775 563 457 729 5 466 Additions 344 593 182 182 155 1 456 Tenant installation contribution opening balance capitalised reclassified to right-of-use assets under IFRS 16 (note 12) – – 85 – – 85 Depreciation¹ (30) (664) (193) (214) (153) (1 254)Disposals – (19) (9) (5) (8) (41)Impairment (note 4)2 – (49) (22) – (9) (80)Acquisition of businesses (note 29) – – 5 2 1 8 Reclassification – 26 12 1 (39) –Transfer to intangible assets (note 10) – – – 6 (8) (2)Transfer to assets classified as held for sale (note 20) 1 (135) (22) (9) (222) (387)Exchange differences on consolidation of foreign subsidiaries (17) (53) (3) – (2) (75)Balance at 30 September 2020 1 240 2 474 598 420 444 5 176
Cost 1 060 5 718 1 283 1 790 1 365 11 216 Accumulated depreciation and impairment (118) (2 943) (720) (1 333) (636) (5 750)Net book value at 30 September 2019 942 2 775 563 457 729 5 466
Cost 1 387 5 580 1 438 1 728 833 10 966 Accumulated depreciation and impairment (147) (3 106) (840) (1 308) (389) (5 790)Net book value at 30 September 2020 1 240 2 474 598 420 444 5 176
1 Depreciation consists of depreciation from continued operations of R1 160 million (2019: R1 061 million) and discontinued operations of R94 million (2019: R97 million).2 Impairment consists of impairments from continuing operations of R80 million (2019: R40 million) and discontinued operations of Rnil (2019:R4 million).
NOTES TO THE CONSOLIDATED FINANCIAL STATEMENTS continuedfor the year ended 30 September 2020
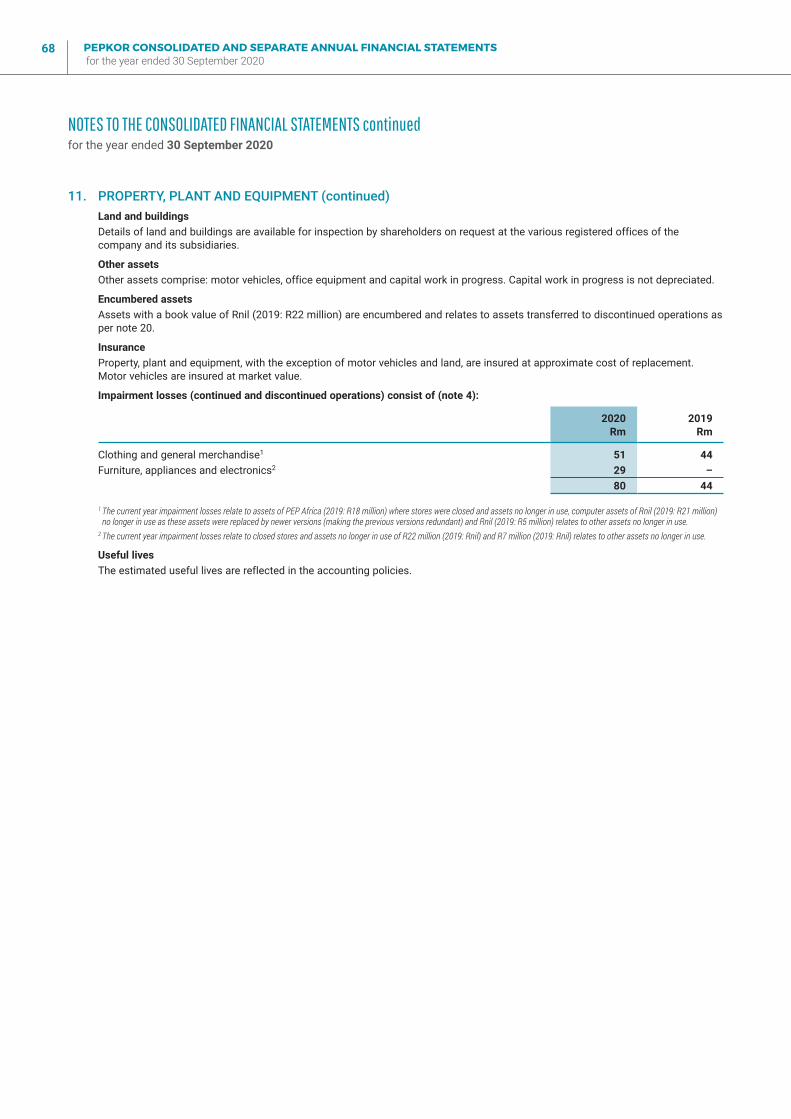
PEPKOR CONSOLIDATED AND SEPARATE ANNUAL FINANCIAL STATEMENTS for the year ended 30 September 2020
68
11. PROPERTY, PLANT AND EQUIPMENT (continued)Land and buildingsDetails of land and buildings are available for inspection by shareholders on request at the various registered offices of the company and its subsidiaries.
Other assetsOther assets comprise: motor vehicles, office equipment and capital work in progress. Capital work in progress is not depreciated.
Encumbered assetsAssets with a book value of Rnil (2019: R22 million) are encumbered and relates to assets transferred to discontinued operations as per note 20.
InsuranceProperty, plant and equipment, with the exception of motor vehicles and land, are insured at approximate cost of replacement. Motor vehicles are insured at market value.
Impairment losses (continued and discontinued operations) consist of (note 4):
2020Rm
2019Rm
Clothing and general merchandise1 51 44 Furniture, appliances and electronics2 29 –
80 44
1 The current year impairment losses relate to assets of PEP Africa (2019: R18 million) where stores were closed and assets no longer in use, computer assets of Rnil (2019: R21 million) no longer in use as these assets were replaced by newer versions (making the previous versions redundant) and Rnil (2019: R5 million) relates to other assets no longer in use.
2 The current year impairment losses relate to closed stores and assets no longer in use of R22 million (2019: Rnil) and R7 million (2019: Rnil) relates to other assets no longer in use.
Useful livesThe estimated useful lives are reflected in the accounting policies.
NOTES TO THE CONSOLIDATED FINANCIAL STATEMENTS continuedfor the year ended 30 September 2020
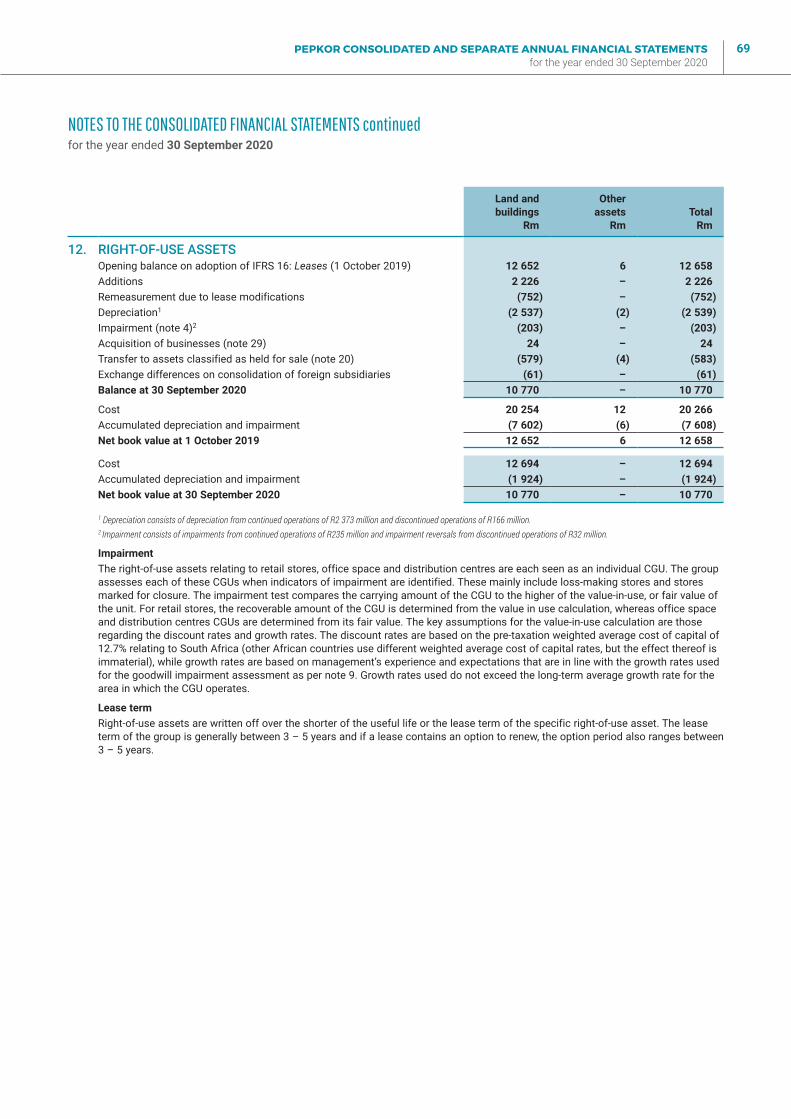
PEPKOR CONSOLIDATED AND SEPARATE ANNUAL FINANCIAL STATEMENTS for the year ended 30 September 2020
69
Land andbuildings
Rm
Otherassets
Rm Total Rm
12. RIGHT-OF-USE ASSETSOpening balance on adoption of IFRS 16: Leases (1 October 2019) 12 652 6 12 658 Additions 2 226 – 2 226 Remeasurement due to lease modifications (752) – (752)Depreciation1 (2 537) (2) (2 539)Impairment (note 4)2 (203) – (203)Acquisition of businesses (note 29) 24 – 24 Transfer to assets classified as held for sale (note 20) (579) (4) (583)Exchange differences on consolidation of foreign subsidiaries (61) – (61)Balance at 30 September 2020 10 770 – 10 770
Cost 20 254 12 20 266 Accumulated depreciation and impairment (7 602) (6) (7 608)Net book value at 1 October 2019 12 652 6 12 658
Cost 12 694 – 12 694 Accumulated depreciation and impairment (1 924) – (1 924)Net book value at 30 September 2020 10 770 – 10 770
1 Depreciation consists of depreciation from continued operations of R2 373 million and discontinued operations of R166 million.2 Impairment consists of impairments from continued operations of R235 million and impairment reversals from discontinued operations of R32 million.
ImpairmentThe right-of-use assets relating to retail stores, office space and distribution centres are each seen as an individual CGU. The group assesses each of these CGUs when indicators of impairment are identified. These mainly include loss-making stores and stores marked for closure. The impairment test compares the carrying amount of the CGU to the higher of the value-in-use, or fair value of the unit. For retail stores, the recoverable amount of the CGU is determined from the value in use calculation, whereas office space and distribution centres CGUs are determined from its fair value. The key assumptions for the value-in-use calculation are those regarding the discount rates and growth rates. The discount rates are based on the pre-taxation weighted average cost of capital of 12.7% relating to South Africa (other African countries use different weighted average cost of capital rates, but the effect thereof is immaterial), while growth rates are based on management’s experience and expectations that are in line with the growth rates used for the goodwill impairment assessment as per note 9. Growth rates used do not exceed the long-term average growth rate for the area in which the CGU operates.
Lease termRight-of-use assets are written off over the shorter of the useful life or the lease term of the specific right-of-use asset. The lease term of the group is generally between 3 – 5 years and if a lease contains an option to renew, the option period also ranges between 3 – 5 years.
NOTES TO THE CONSOLIDATED FINANCIAL STATEMENTS continuedfor the year ended 30 September 2020
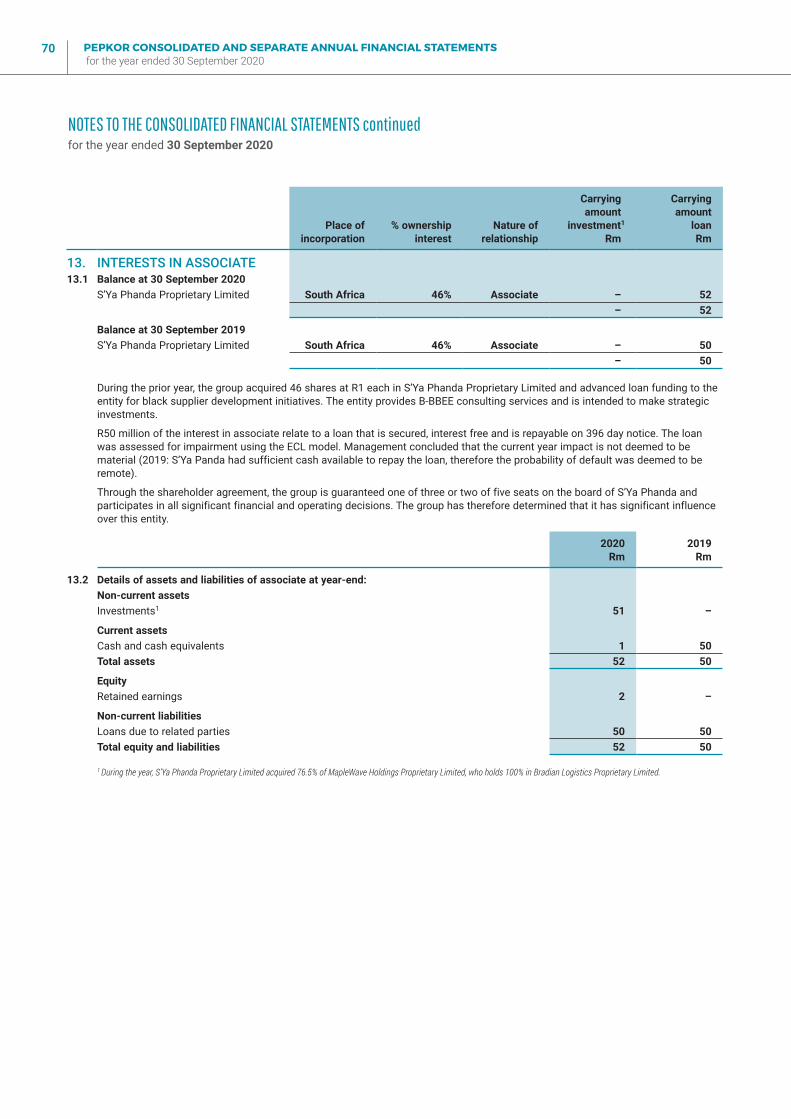
PEPKOR CONSOLIDATED AND SEPARATE ANNUAL FINANCIAL STATEMENTS for the year ended 30 September 2020
70
Place ofincorporation
% ownershipinterest
Nature ofrelationship
Carryingamount
investment1
Rm
Carryingamount
loan Rm
13. INTERESTS IN ASSOCIATE13.1 Balance at 30 September 2020
S’Ya Phanda Proprietary Limited South Africa 46% Associate – 52 – 52
Balance at 30 September 2019S’Ya Phanda Proprietary Limited South Africa 46% Associate – 50
– 50
During the prior year, the group acquired 46 shares at R1 each in S’Ya Phanda Proprietary Limited and advanced loan funding to the entity for black supplier development initiatives. The entity provides B-BBEE consulting services and is intended to make strategic investments.
R50 million of the interest in associate relate to a loan that is secured, interest free and is repayable on 396 day notice. The loan was assessed for impairment using the ECL model. Management concluded that the current year impact is not deemed to be material (2019: S’Ya Panda had sufficient cash available to repay the loan, therefore the probability of default was deemed to be remote).
Through the shareholder agreement, the group is guaranteed one of three or two of five seats on the board of S’Ya Phanda and participates in all significant financial and operating decisions. The group has therefore determined that it has significant influence over this entity.
2020Rm
2019Rm
13.2 Details of assets and liabilities of associate at year-end:Non-current assetsInvestments1 51 –
Current assetsCash and cash equivalents 1 50 Total assets 52 50
EquityRetained earnings 2 –
Non-current liabilitiesLoans due to related parties 50 50 Total equity and liabilities 52 50
1 During the year, S’Ya Phanda Proprietary Limited acquired 76.5% of MapleWave Holdings Proprietary Limited, who holds 100% in Bradian Logistics Proprietary Limited.
NOTES TO THE CONSOLIDATED FINANCIAL STATEMENTS continuedfor the year ended 30 September 2020
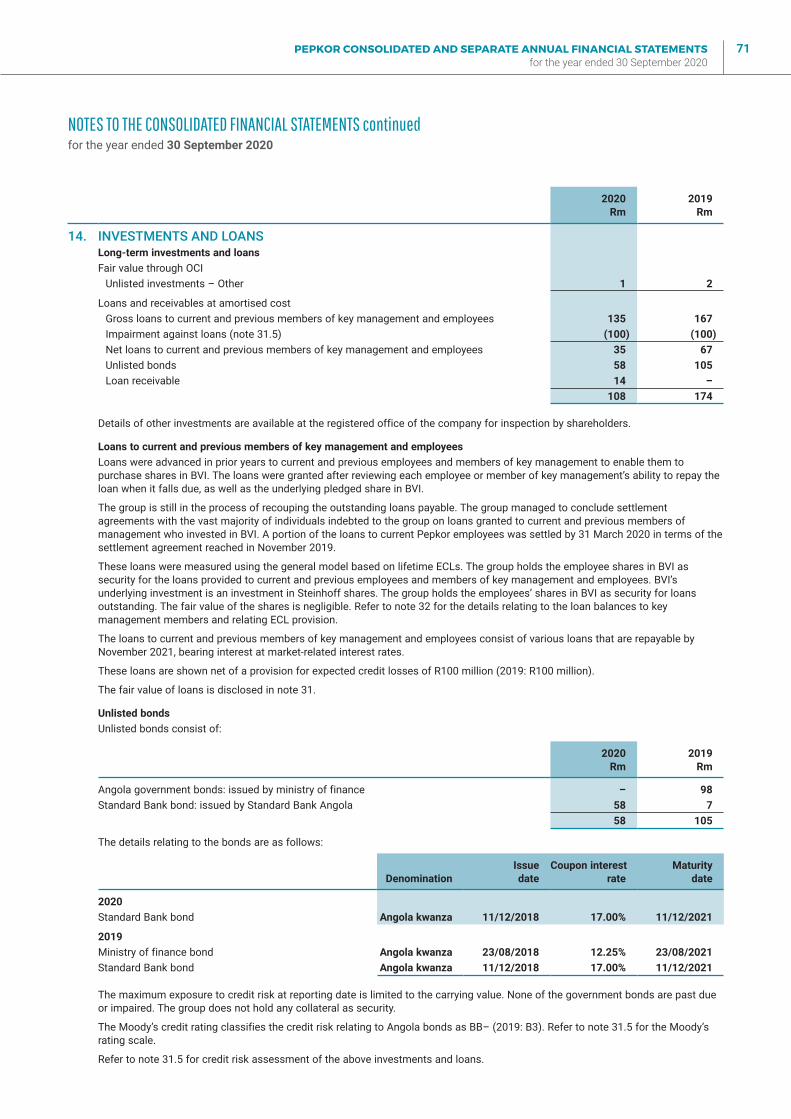
PEPKOR CONSOLIDATED AND SEPARATE ANNUAL FINANCIAL STATEMENTS for the year ended 30 September 2020
71
2020Rm
2019Rm
14. INVESTMENTS AND LOANSLong-term investments and loansFair value through OCI
Unlisted investments – Other 1 2
Loans and receivables at amortised costGross loans to current and previous members of key management and employees 135 167 Impairment against loans (note 31.5) (100) (100)Net loans to current and previous members of key management and employees 35 67 Unlisted bonds 58 105 Loan receivable 14 –
108 174
Details of other investments are available at the registered office of the company for inspection by shareholders.
Loans to current and previous members of key management and employeesLoans were advanced in prior years to current and previous employees and members of key management to enable them to purchase shares in BVI. The loans were granted after reviewing each employee or member of key management’s ability to repay the loan when it falls due, as well as the underlying pledged share in BVI.
The group is still in the process of recouping the outstanding loans payable. The group managed to conclude settlement agreements with the vast majority of individuals indebted to the group on loans granted to current and previous members of management who invested in BVI. A portion of the loans to current Pepkor employees was settled by 31 March 2020 in terms of the settlement agreement reached in November 2019.
These loans were measured using the general model based on lifetime ECLs. The group holds the employee shares in BVI as security for the loans provided to current and previous employees and members of key management and employees. BVI’s underlying investment is an investment in Steinhoff shares. The group holds the employees’ shares in BVI as security for loans outstanding. The fair value of the shares is negligible. Refer to note 32 for the details relating to the loan balances to key management members and relating ECL provision.
The loans to current and previous members of key management and employees consist of various loans that are repayable by November 2021, bearing interest at market-related interest rates.
These loans are shown net of a provision for expected credit losses of R100 million (2019: R100 million).
The fair value of loans is disclosed in note 31.
Unlisted bondsUnlisted bonds consist of:
2020Rm
2019Rm
Angola government bonds: issued by ministry of finance – 98 Standard Bank bond: issued by Standard Bank Angola 58 7
58 105
The details relating to the bonds are as follows:
DenominationIssuedate
Coupon interestrate
Maturitydate
2020Standard Bank bond Angola kwanza 11/12/2018 17.00% 11/12/2021
2019Ministry of finance bond Angola kwanza 23/08/2018 12.25% 23/08/2021Standard Bank bond Angola kwanza 11/12/2018 17.00% 11/12/2021
The maximum exposure to credit risk at reporting date is limited to the carrying value. None of the government bonds are past due or impaired. The group does not hold any collateral as security.
The Moody’s credit rating classifies the credit risk relating to Angola bonds as BB– (2019: B3). Refer to note 31.5 for the Moody’s rating scale.
Refer to note 31.5 for credit risk assessment of the above investments and loans.
NOTES TO THE CONSOLIDATED FINANCIAL STATEMENTS continuedfor the year ended 30 September 2020
PEPKOR CONSOLIDATED AND SEPARATE ANNUAL FINANCIAL STATEMENTS for the year ended 30 September 2020
72
14. INVESTMENTS AND LOANS (continued)Loan receivableDuring the year, the group granted a loan of R14 million to the Share Empowerment Academy as part of enterprise and supplier development. Management has assessed the ECL for the loan and found it to be immaterial.
Consolidated structured entitiesDuring the current financial year, a loan facility was advanced by the group amounting to R519 million in order to settle the external guarantee with RMB and thereby settling the outstanding guarantee. Proceeds that BVI may receive in respect of a claim that was instituted by BVI against Steinhoff, must be used to repay the group for its settlement of the external debt. Since extinguishing the BVI guarantee exposure to RMB, in exchange for direct credit exposure to BVI, the assessment of the group’s ability to control BVI has changed to that of a control nature, therefore leading to the consolidation thereof. The impact was, however, immaterial to the group.
NOTES TO THE CONSOLIDATED FINANCIAL STATEMENTS continuedfor the year ended 30 September 2020
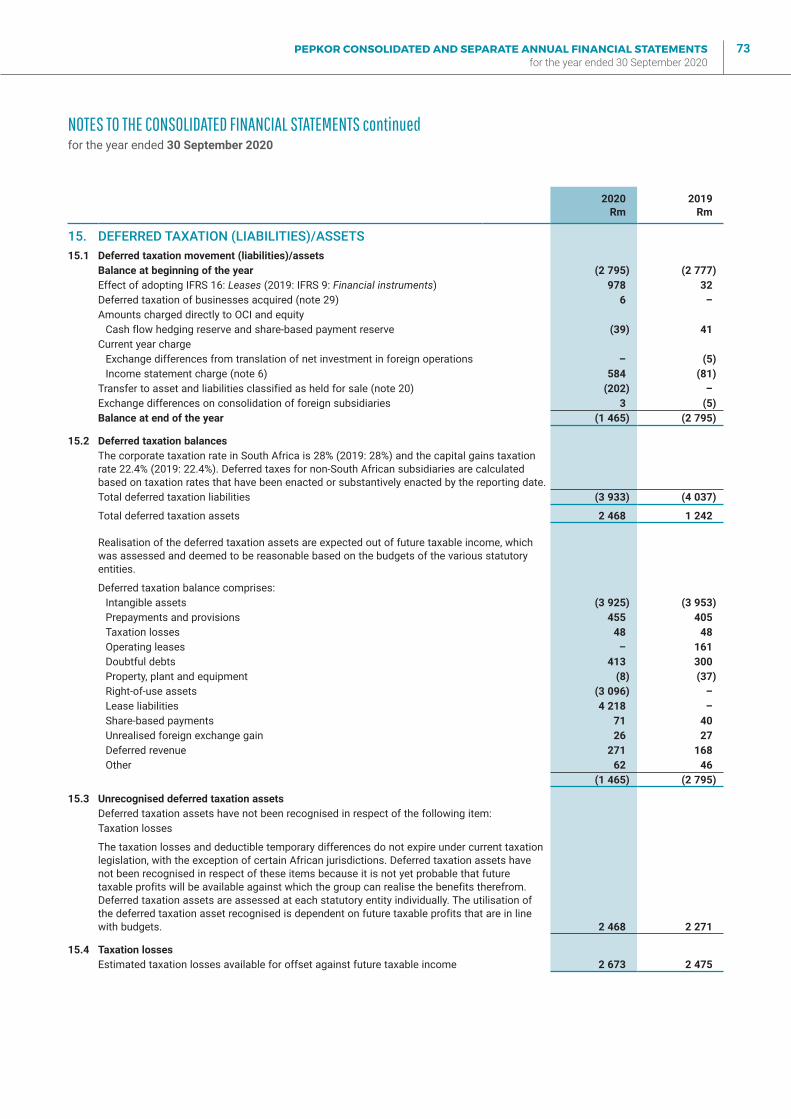
PEPKOR CONSOLIDATED AND SEPARATE ANNUAL FINANCIAL STATEMENTS for the year ended 30 September 2020
73
2020Rm
2019Rm
15. DEFERRED TAXATION (LIABILITIES)/ASSETS15.1 Deferred taxation movement (liabilities)/assets
Balance at beginning of the year (2 795) (2 777)Effect of adopting IFRS 16: Leases (2019: IFRS 9: Financial instruments) 978 32 Deferred taxation of businesses acquired (note 29) 6 – Amounts charged directly to OCI and equity
Cash flow hedging reserve and share-based payment reserve (39) 41 Current year charge
Exchange differences from translation of net investment in foreign operations – (5)Income statement charge (note 6) 584 (81)
Transfer to asset and liabilities classified as held for sale (note 20) (202) – Exchange differences on consolidation of foreign subsidiaries 3 (5)Balance at end of the year (1 465) (2 795)
15.2 Deferred taxation balancesThe corporate taxation rate in South Africa is 28% (2019: 28%) and the capital gains taxation rate 22.4% (2019: 22.4%). Deferred taxes for non-South African subsidiaries are calculated based on taxation rates that have been enacted or substantively enacted by the reporting date. Total deferred taxation liabilities (3 933) (4 037)
Total deferred taxation assets 2 468 1 242
Realisation of the deferred taxation assets are expected out of future taxable income, which was assessed and deemed to be reasonable based on the budgets of the various statutory entities.
Deferred taxation balance comprises:Intangible assets (3 925) (3 953)Prepayments and provisions 455 405 Taxation losses 48 48 Operating leases – 161 Doubtful debts 413 300 Property, plant and equipment (8) (37)Right-of-use assets (3 096) – Lease liabilities 4 218 – Share-based payments 71 40 Unrealised foreign exchange gain 26 27 Deferred revenue 271 168 Other 62 46
(1 465) (2 795)
15.3 Unrecognised deferred taxation assetsDeferred taxation assets have not been recognised in respect of the following item:Taxation losses
The taxation losses and deductible temporary differences do not expire under current taxation legislation, with the exception of certain African jurisdictions. Deferred taxation assets have not been recognised in respect of these items because it is not yet probable that future taxable profits will be available against which the group can realise the benefits therefrom. Deferred taxation assets are assessed at each statutory entity individually. The utilisation of the deferred taxation asset recognised is dependent on future taxable profits that are in line with budgets. 2 468 2 271
15.4 Taxation lossesEstimated taxation losses available for offset against future taxable income 2 673 2 475
NOTES TO THE CONSOLIDATED FINANCIAL STATEMENTS continuedfor the year ended 30 September 2020
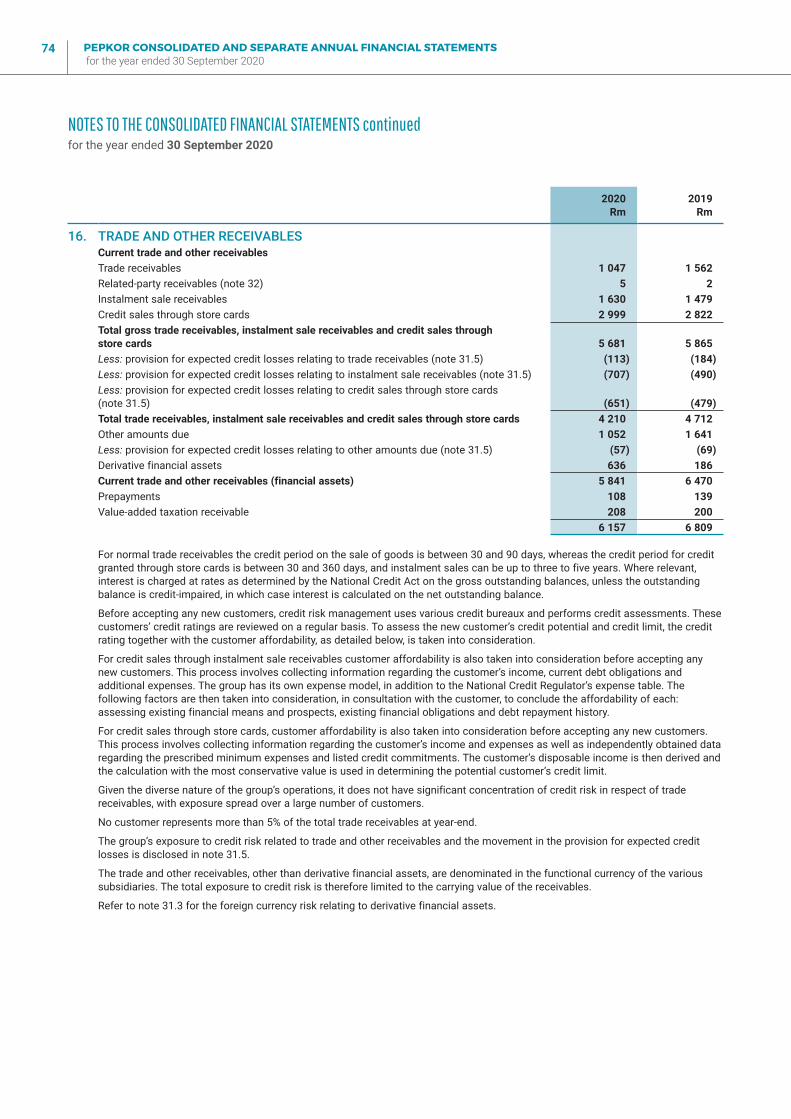
PEPKOR CONSOLIDATED AND SEPARATE ANNUAL FINANCIAL STATEMENTS for the year ended 30 September 2020
74
2020Rm
2019Rm
16. TRADE AND OTHER RECEIVABLESCurrent trade and other receivablesTrade receivables 1 047 1 562 Related-party receivables (note 32) 5 2 Instalment sale receivables 1 630 1 479 Credit sales through store cards 2 999 2 822 Total gross trade receivables, instalment sale receivables and credit sales through store cards 5 681 5 865 Less: provision for expected credit losses relating to trade receivables (note 31.5) (113) (184)Less: provision for expected credit losses relating to instalment sale receivables (note 31.5) (707) (490)Less: provision for expected credit losses relating to credit sales through store cards (note 31.5) (651) (479)Total trade receivables, instalment sale receivables and credit sales through store cards 4 210 4 712 Other amounts due 1 052 1 641 Less: provision for expected credit losses relating to other amounts due (note 31.5) (57) (69)Derivative financial assets 636 186 Current trade and other receivables (financial assets) 5 841 6 470 Prepayments 108 139 Value-added taxation receivable 208 200
6 157 6 809
For normal trade receivables the credit period on the sale of goods is between 30 and 90 days, whereas the credit period for credit granted through store cards is between 30 and 360 days, and instalment sales can be up to three to five years. Where relevant, interest is charged at rates as determined by the National Credit Act on the gross outstanding balances, unless the outstanding balance is credit-impaired, in which case interest is calculated on the net outstanding balance.
Before accepting any new customers, credit risk management uses various credit bureaux and performs credit assessments. These customers’ credit ratings are reviewed on a regular basis. To assess the new customer’s credit potential and credit limit, the credit rating together with the customer affordability, as detailed below, is taken into consideration.
For credit sales through instalment sale receivables customer affordability is also taken into consideration before accepting any new customers. This process involves collecting information regarding the customer’s income, current debt obligations and additional expenses. The group has its own expense model, in addition to the National Credit Regulator’s expense table. The following factors are then taken into consideration, in consultation with the customer, to conclude the affordability of each: assessing existing financial means and prospects, existing financial obligations and debt repayment history.
For credit sales through store cards, customer affordability is also taken into consideration before accepting any new customers. This process involves collecting information regarding the customer’s income and expenses as well as independently obtained data regarding the prescribed minimum expenses and listed credit commitments. The customer’s disposable income is then derived and the calculation with the most conservative value is used in determining the potential customer’s credit limit.
Given the diverse nature of the group’s operations, it does not have significant concentration of credit risk in respect of trade receivables, with exposure spread over a large number of customers.
No customer represents more than 5% of the total trade receivables at year-end.
The group’s exposure to credit risk related to trade and other receivables and the movement in the provision for expected credit losses is disclosed in note 31.5.
The trade and other receivables, other than derivative financial assets, are denominated in the functional currency of the various subsidiaries. The total exposure to credit risk is therefore limited to the carrying value of the receivables.
Refer to note 31.3 for the foreign currency risk relating to derivative financial assets.
NOTES TO THE CONSOLIDATED FINANCIAL STATEMENTS continuedfor the year ended 30 September 2020
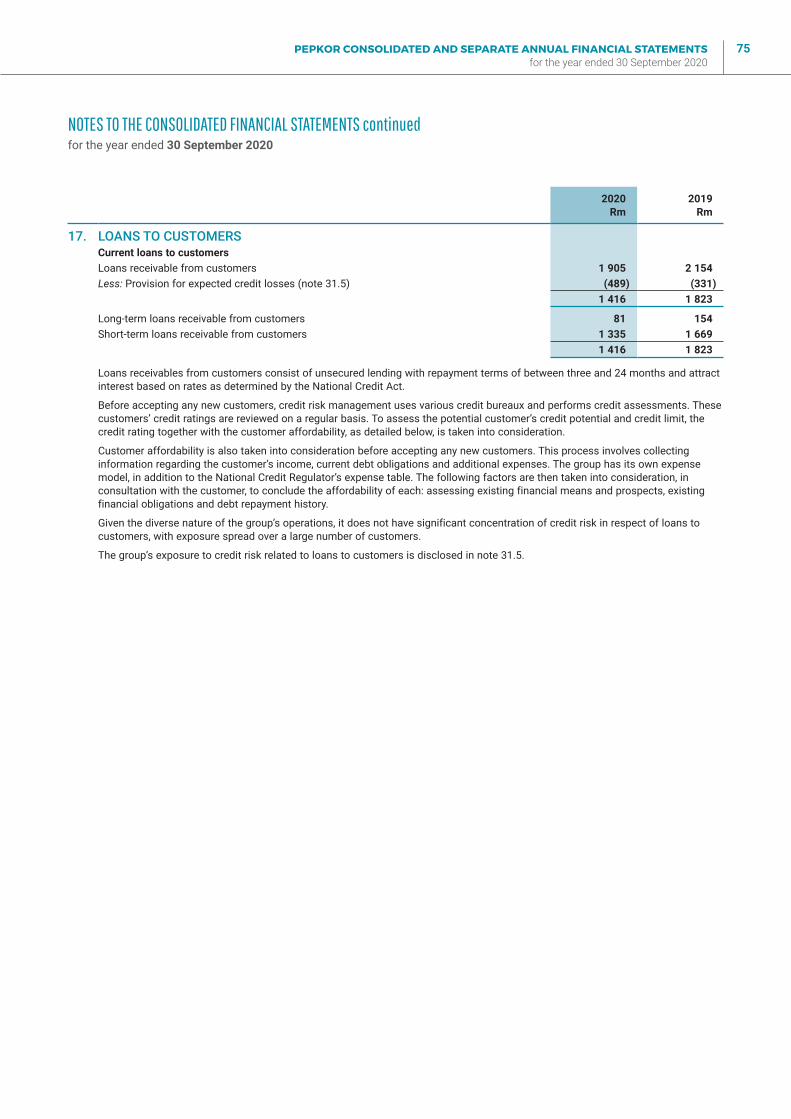
PEPKOR CONSOLIDATED AND SEPARATE ANNUAL FINANCIAL STATEMENTS for the year ended 30 September 2020
75
2020Rm
2019Rm
17. LOANS TO CUSTOMERSCurrent loans to customersLoans receivable from customers 1 905 2 154 Less: Provision for expected credit losses (note 31.5) (489) (331)
1 416 1 823
Long-term loans receivable from customers 81 154 Short-term loans receivable from customers 1 335 1 669
1 416 1 823
Loans receivables from customers consist of unsecured lending with repayment terms of between three and 24 months and attract interest based on rates as determined by the National Credit Act.
Before accepting any new customers, credit risk management uses various credit bureaux and performs credit assessments. These customers’ credit ratings are reviewed on a regular basis. To assess the potential customer’s credit potential and credit limit, the credit rating together with the customer affordability, as detailed below, is taken into consideration.
Customer affordability is also taken into consideration before accepting any new customers. This process involves collecting information regarding the customer’s income, current debt obligations and additional expenses. The group has its own expense model, in addition to the National Credit Regulator’s expense table. The following factors are then taken into consideration, in consultation with the customer, to conclude the affordability of each: assessing existing financial means and prospects, existing financial obligations and debt repayment history.
Given the diverse nature of the group’s operations, it does not have significant concentration of credit risk in respect of loans to customers, with exposure spread over a large number of customers.
The group’s exposure to credit risk related to loans to customers is disclosed in note 31.5.
NOTES TO THE CONSOLIDATED FINANCIAL STATEMENTS continuedfor the year ended 30 September 2020
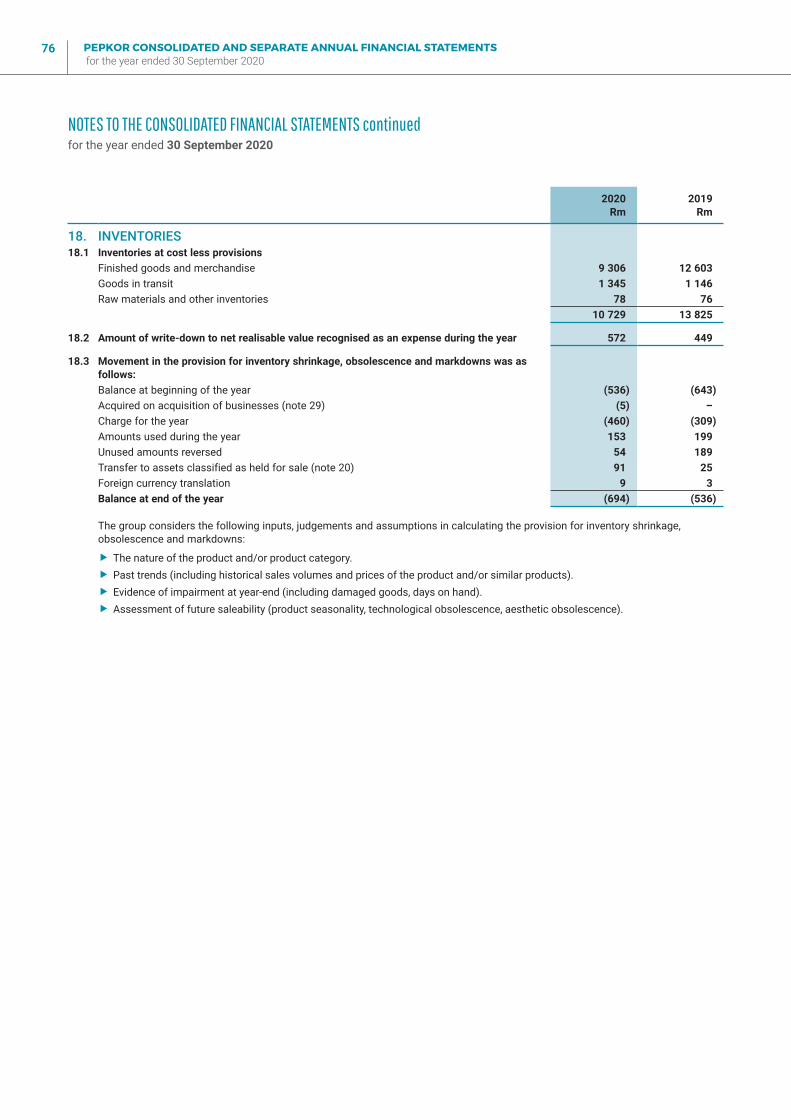
PEPKOR CONSOLIDATED AND SEPARATE ANNUAL FINANCIAL STATEMENTS for the year ended 30 September 2020
76
2020Rm
2019Rm
18. INVENTORIES18.1 Inventories at cost less provisions
Finished goods and merchandise 9 306 12 603 Goods in transit 1 345 1 146 Raw materials and other inventories 78 76
10 729 13 825
18.2 Amount of write-down to net realisable value recognised as an expense during the year 572 449
18.3 Movement in the provision for inventory shrinkage, obsolescence and markdowns was as follows:Balance at beginning of the year (536) (643)Acquired on acquisition of businesses (note 29) (5) –Charge for the year (460) (309)Amounts used during the year 153 199 Unused amounts reversed 54 189 Transfer to assets classified as held for sale (note 20) 91 25 Foreign currency translation 9 3 Balance at end of the year (694) (536)
The group considers the following inputs, judgements and assumptions in calculating the provision for inventory shrinkage, obsolescence and markdowns:
� The nature of the product and/or product category. � Past trends (including historical sales volumes and prices of the product and/or similar products). � Evidence of impairment at year-end (including damaged goods, days on hand). � Assessment of future saleability (product seasonality, technological obsolescence, aesthetic obsolescence).
NOTES TO THE CONSOLIDATED FINANCIAL STATEMENTS continuedfor the year ended 30 September 2020
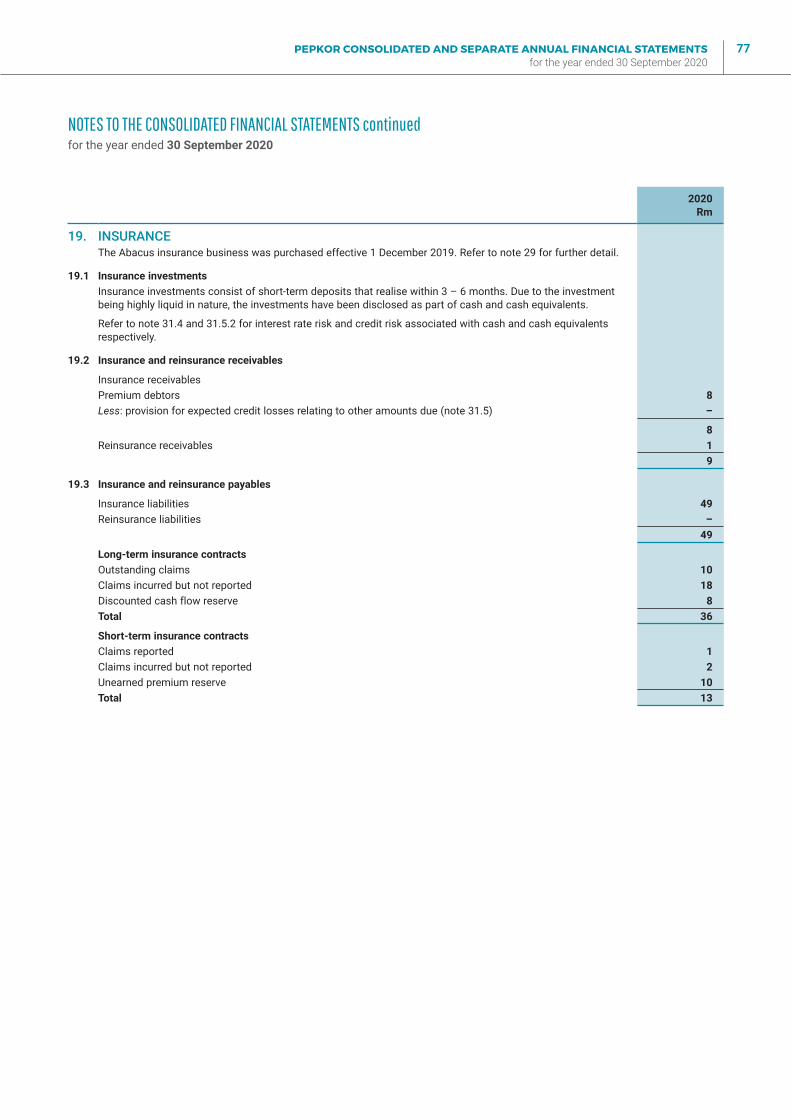
PEPKOR CONSOLIDATED AND SEPARATE ANNUAL FINANCIAL STATEMENTS for the year ended 30 September 2020
77
2020Rm
19. INSURANCEThe Abacus insurance business was purchased effective 1 December 2019. Refer to note 29 for further detail.
19.1 Insurance investmentsInsurance investments consist of short-term deposits that realise within 3 – 6 months. Due to the investment being highly liquid in nature, the investments have been disclosed as part of cash and cash equivalents.
Refer to note 31.4 and 31.5.2 for interest rate risk and credit risk associated with cash and cash equivalents respectively.
19.2 Insurance and reinsurance receivables
Insurance receivablesPremium debtors 8 Less: provision for expected credit losses relating to other amounts due (note 31.5) –
8 Reinsurance receivables 1
9
19.3 Insurance and reinsurance payables
Insurance liabilities 49 Reinsurance liabilities –
49
Long-term insurance contractsOutstanding claims 10 Claims incurred but not reported 18 Discounted cash flow reserve 8 Total 36
Short-term insurance contractsClaims reported 1 Claims incurred but not reported 2 Unearned premium reserve 10 Total 13
NOTES TO THE CONSOLIDATED FINANCIAL STATEMENTS continuedfor the year ended 30 September 2020
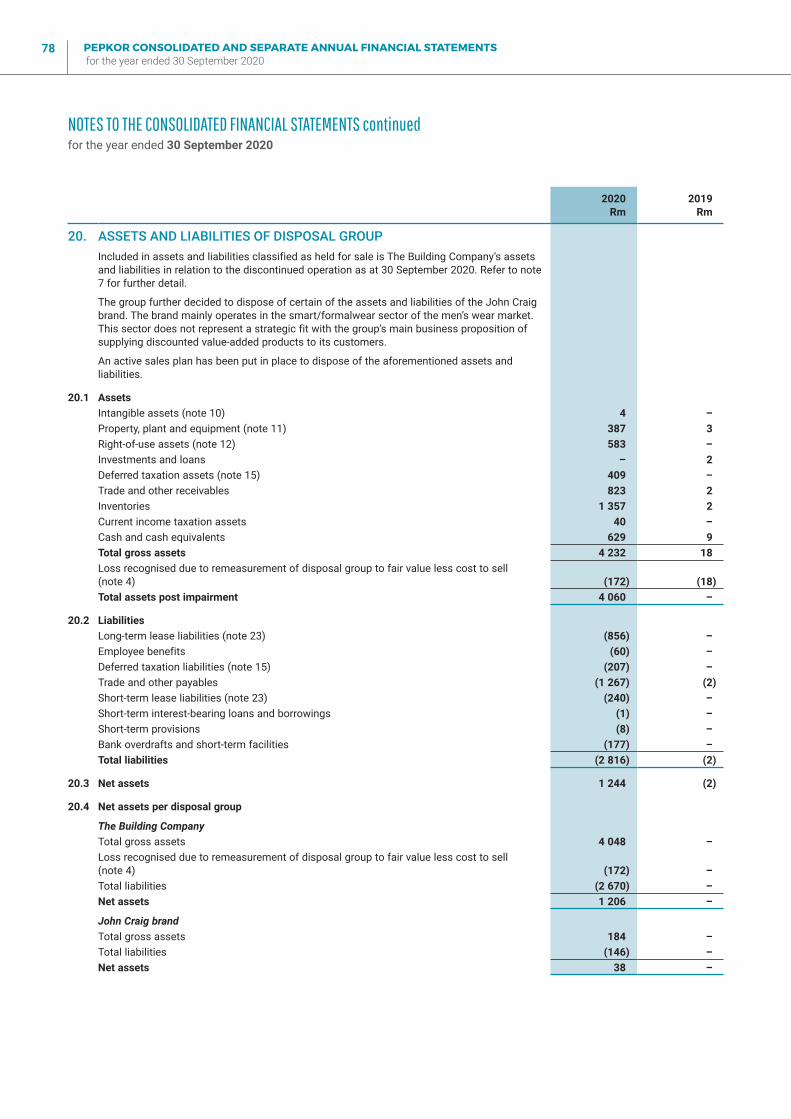
PEPKOR CONSOLIDATED AND SEPARATE ANNUAL FINANCIAL STATEMENTS for the year ended 30 September 2020
78
2020Rm
2019Rm
20. ASSETS AND LIABILITIES OF DISPOSAL GROUPIncluded in assets and liabilities classified as held for sale is The Building Company’s assets and liabilities in relation to the discontinued operation as at 30 September 2020. Refer to note 7 for further detail.
The group further decided to dispose of certain of the assets and liabilities of the John Craig brand. The brand mainly operates in the smart/formalwear sector of the men’s wear market. This sector does not represent a strategic fit with the group’s main business proposition of supplying discounted value-added products to its customers.
An active sales plan has been put in place to dispose of the aforementioned assets and liabilities.
20.1 AssetsIntangible assets (note 10) 4 –Property, plant and equipment (note 11) 387 3 Right-of-use assets (note 12) 583 –Investments and loans – 2 Deferred taxation assets (note 15) 409 –Trade and other receivables 823 2 Inventories 1 357 2 Current income taxation assets 40 –Cash and cash equivalents 629 9 Total gross assets 4 232 18 Loss recognised due to remeasurement of disposal group to fair value less cost to sell (note 4) (172) (18)Total assets post impairment 4 060 –
20.2 LiabilitiesLong-term lease liabilities (note 23) (856) –Employee benefits (60) –Deferred taxation liabilities (note 15) (207) –Trade and other payables (1 267) (2)Short-term lease liabilities (note 23) (240) –Short-term interest-bearing loans and borrowings (1) –Short-term provisions (8) –Bank overdrafts and short-term facilities (177) –Total liabilities (2 816) (2)
20.3 Net assets 1 244 (2)
20.4 Net assets per disposal group
The Building CompanyTotal gross assets 4 048 –Loss recognised due to remeasurement of disposal group to fair value less cost to sell (note 4) (172) –Total liabilities (2 670) –Net assets 1 206 –
John Craig brandTotal gross assets 184 –Total liabilities (146) –Net assets 38 –
NOTES TO THE CONSOLIDATED FINANCIAL STATEMENTS continuedfor the year ended 30 September 2020
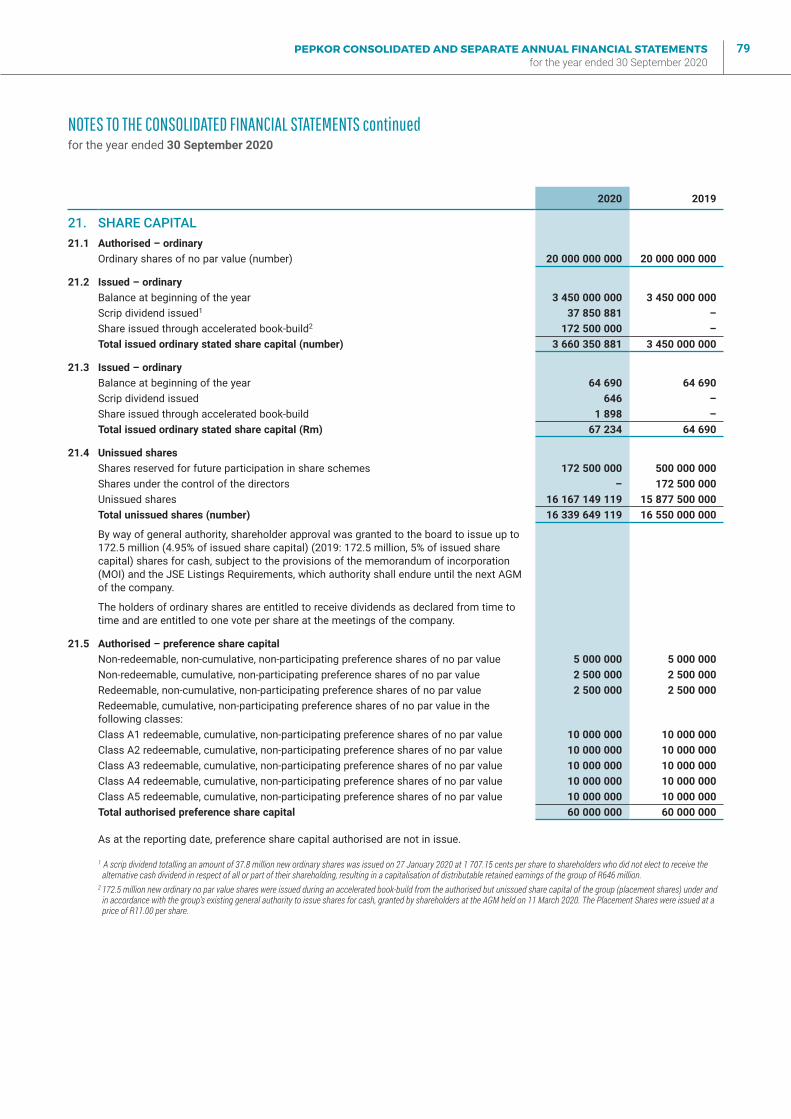
PEPKOR CONSOLIDATED AND SEPARATE ANNUAL FINANCIAL STATEMENTS for the year ended 30 September 2020
79
2020 2019
21. SHARE CAPITAL21.1 Authorised – ordinary
Ordinary shares of no par value (number) 20 000 000 000 20 000 000 000
21.2 Issued – ordinaryBalance at beginning of the year 3 450 000 000 3 450 000 000 Scrip dividend issued1 37 850 881 –Share issued through accelerated book-build2 172 500 000 –Total issued ordinary stated share capital (number) 3 660 350 881 3 450 000 000
21.3 Issued – ordinaryBalance at beginning of the year 64 690 64 690 Scrip dividend issued 646 –Share issued through accelerated book-build 1 898 –Total issued ordinary stated share capital (Rm) 67 234 64 690
21.4 Unissued sharesShares reserved for future participation in share schemes 172 500 000 500 000 000 Shares under the control of the directors – 172 500 000 Unissued shares 16 167 149 119 15 877 500 000 Total unissued shares (number) 16 339 649 119 16 550 000 000
By way of general authority, shareholder approval was granted to the board to issue up to 172.5 million (4.95% of issued share capital) (2019: 172.5 million, 5% of issued share capital) shares for cash, subject to the provisions of the memorandum of incorporation (MOI) and the JSE Listings Requirements, which authority shall endure until the next AGM of the company.
The holders of ordinary shares are entitled to receive dividends as declared from time to time and are entitled to one vote per share at the meetings of the company.
21.5 Authorised – preference share capitalNon-redeemable, non-cumulative, non-participating preference shares of no par value 5 000 000 5 000 000 Non-redeemable, cumulative, non-participating preference shares of no par value 2 500 000 2 500 000 Redeemable, non-cumulative, non-participating preference shares of no par value 2 500 000 2 500 000 Redeemable, cumulative, non-participating preference shares of no par value in the following classes:Class A1 redeemable, cumulative, non-participating preference shares of no par value 10 000 000 10 000 000 Class A2 redeemable, cumulative, non-participating preference shares of no par value 10 000 000 10 000 000 Class A3 redeemable, cumulative, non-participating preference shares of no par value 10 000 000 10 000 000 Class A4 redeemable, cumulative, non-participating preference shares of no par value 10 000 000 10 000 000 Class A5 redeemable, cumulative, non-participating preference shares of no par value 10 000 000 10 000 000 Total authorised preference share capital 60 000 000 60 000 000
As at the reporting date, preference share capital authorised are not in issue.
1 A scrip dividend totalling an amount of 37.8 million new ordinary shares was issued on 27 January 2020 at 1 707.15 cents per share to shareholders who did not elect to receive the alternative cash dividend in respect of all or part of their shareholding, resulting in a capitalisation of distributable retained earnings of the group of R646 million.
2 172.5 million new ordinary no par value shares were issued during an accelerated book-build from the authorised but unissued share capital of the group (placement shares) under and in accordance with the group’s existing general authority to issue shares for cash, granted by shareholders at the AGM held on 11 March 2020. The Placement Shares were issued at a price of R11.00 per share.
NOTES TO THE CONSOLIDATED FINANCIAL STATEMENTS continuedfor the year ended 30 September 2020
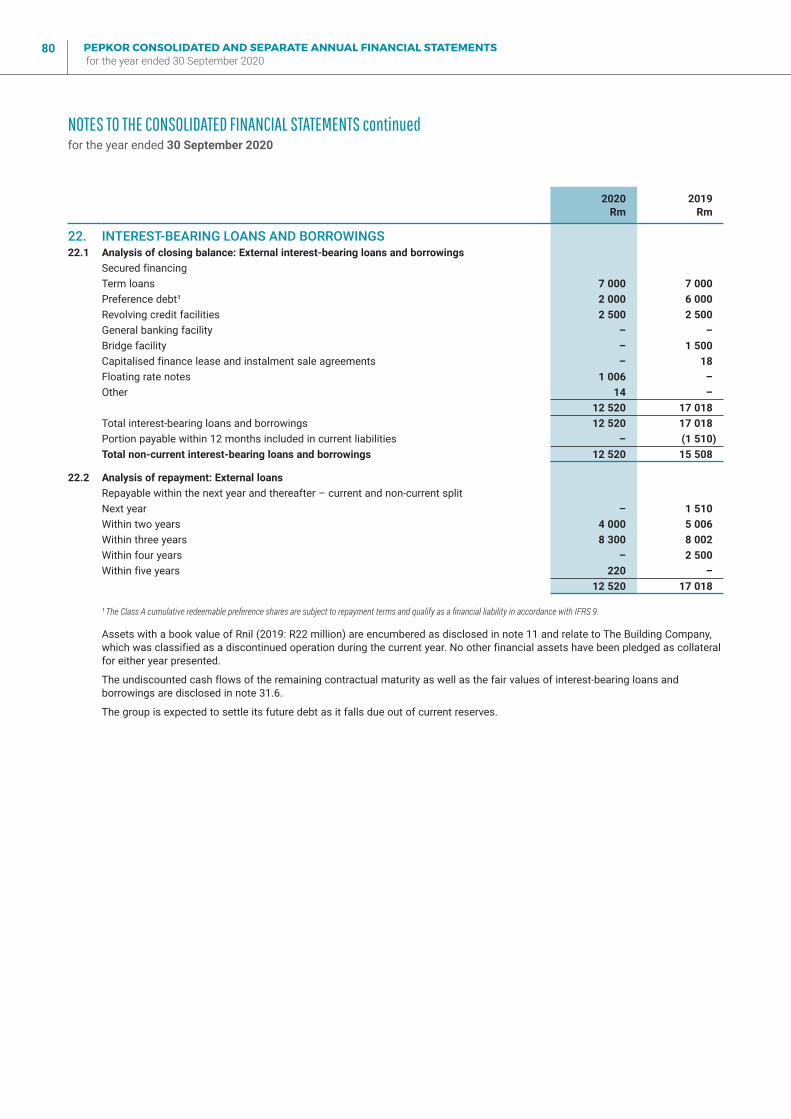
PEPKOR CONSOLIDATED AND SEPARATE ANNUAL FINANCIAL STATEMENTS for the year ended 30 September 2020
80
2020Rm
2019Rm
22. INTEREST-BEARING LOANS AND BORROWINGS22.1 Analysis of closing balance: External interest-bearing loans and borrowings
Secured financingTerm loans 7 000 7 000 Preference debt¹ 2 000 6 000 Revolving credit facilities 2 500 2 500 General banking facility – –Bridge facility – 1 500 Capitalised finance lease and instalment sale agreements – 18 Floating rate notes 1 006 –Other 14 –
12 520 17 018 Total interest-bearing loans and borrowings 12 520 17 018 Portion payable within 12 months included in current liabilities – (1 510)Total non-current interest-bearing loans and borrowings 12 520 15 508
22.2 Analysis of repayment: External loansRepayable within the next year and thereafter – current and non-current splitNext year – 1 510 Within two years 4 000 5 006 Within three years 8 300 8 002 Within four years – 2 500 Within five years 220 –
12 520 17 018
¹ The Class A cumulative redeemable preference shares are subject to repayment terms and qualify as a financial liability in accordance with IFRS 9.
Assets with a book value of Rnil (2019: R22 million) are encumbered as disclosed in note 11 and relate to The Building Company, which was classified as a discontinued operation during the current year. No other financial assets have been pledged as collateral for either year presented.
The undiscounted cash flows of the remaining contractual maturity as well as the fair values of interest-bearing loans and borrowings are disclosed in note 31.6.
The group is expected to settle its future debt as it falls due out of current reserves.
NOTES TO THE CONSOLIDATED FINANCIAL STATEMENTS continuedfor the year ended 30 September 2020
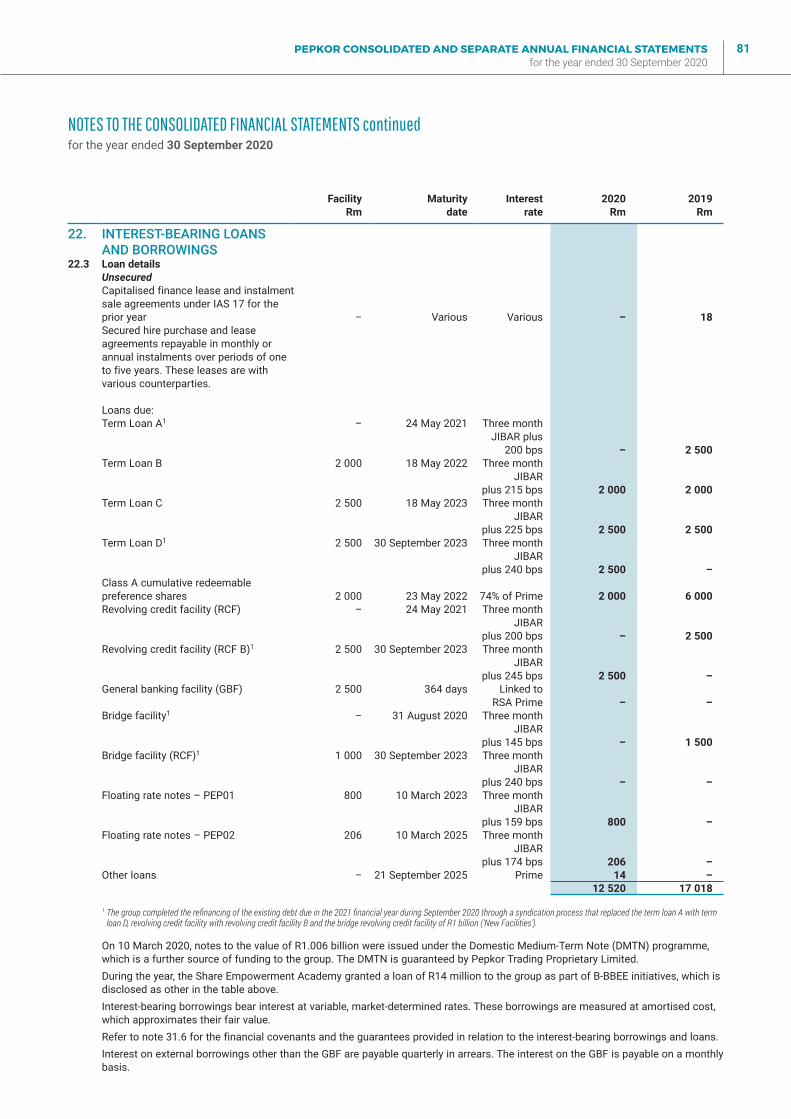
PEPKOR CONSOLIDATED AND SEPARATE ANNUAL FINANCIAL STATEMENTS for the year ended 30 September 2020
81
FacilityRm
Maturitydate
Interest rate
2020 Rm
2019 Rm
22. INTEREST-BEARING LOANS AND BORROWINGS
22.3 Loan detailsUnsecuredCapitalised finance lease and instalment sale agreements under IAS 17 for the prior year – Various Various – 18 Secured hire purchase and lease agreements repayable in monthly or annual instalments over periods of one to five years. These leases are with various counterparties.
Loans due:Term Loan A1 – 24 May 2021 Three month
JIBAR plus 200 bps – 2 500
Term Loan B 2 000 18 May 2022 Three monthJIBAR
plus 215 bps 2 000 2 000 Term Loan C 2 500 18 May 2023 Three month
JIBAR plus 225 bps 2 500 2 500
Term Loan D1 2 500 30 September 2023 Three monthJIBAR
plus 240 bps 2 500 –Class A cumulative redeemable preference shares 2 000 23 May 2022 74% of Prime 2 000 6 000 Revolving credit facility (RCF) – 24 May 2021 Three month
JIBARplus 200 bps – 2 500
Revolving credit facility (RCF B)1 2 500 30 September 2023 Three monthJIBAR
plus 245 bps 2 500 –General banking facility (GBF) 2 500 364 days Linked to
RSA Prime – –Bridge facility1 – 31 August 2020 Three month
JIBARplus 145 bps – 1 500
Bridge facility (RCF)1 1 000 30 September 2023 Three monthJIBAR
plus 240 bps – –Floating rate notes – PEP01 800 10 March 2023 Three month
JIBARplus 159 bps 800 –
Floating rate notes – PEP02 206 10 March 2025 Three monthJIBAR
plus 174 bps 206 –Other loans – 21 September 2025 Prime 14 –
12 520 17 018
1 The group completed the refinancing of the existing debt due in the 2021 financial year during September 2020 through a syndication process that replaced the term loan A with term loan D, revolving credit facility with revolving credit facility B and the bridge revolving credit facility of R1 billion (‘New Facilities’).
On 10 March 2020, notes to the value of R1.006 billion were issued under the Domestic Medium-Term Note (DMTN) programme, which is a further source of funding to the group. The DMTN is guaranteed by Pepkor Trading Proprietary Limited.During the year, the Share Empowerment Academy granted a loan of R14 million to the group as part of B-BBEE initiatives, which is disclosed as other in the table above.Interest-bearing borrowings bear interest at variable, market-determined rates. These borrowings are measured at amortised cost, which approximates their fair value.Refer to note 31.6 for the financial covenants and the guarantees provided in relation to the interest-bearing borrowings and loans.Interest on external borrowings other than the GBF are payable quarterly in arrears. The interest on the GBF is payable on a monthly basis.
NOTES TO THE CONSOLIDATED FINANCIAL STATEMENTS continuedfor the year ended 30 September 2020
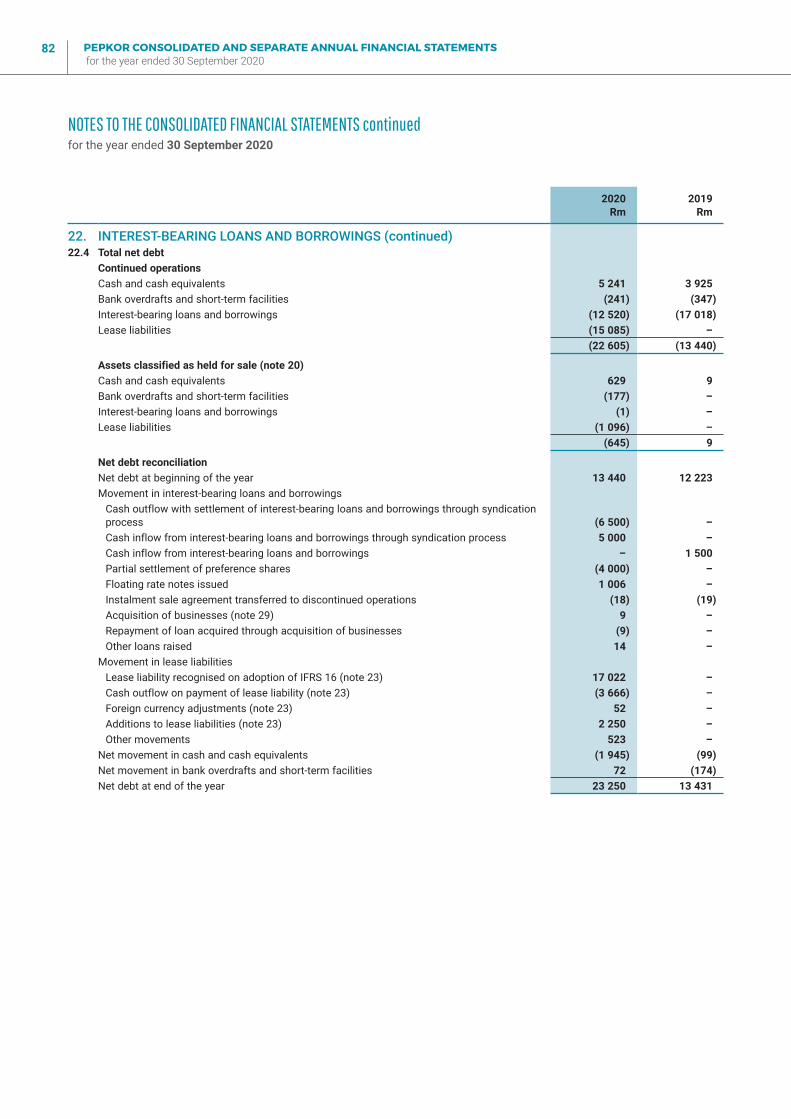
PEPKOR CONSOLIDATED AND SEPARATE ANNUAL FINANCIAL STATEMENTS for the year ended 30 September 2020
82
2020 Rm
2019 Rm
22. INTEREST-BEARING LOANS AND BORROWINGS (continued)22.4 Total net debt
Continued operationsCash and cash equivalents 5 241 3 925 Bank overdrafts and short-term facilities (241) (347)Interest-bearing loans and borrowings (12 520) (17 018)Lease liabilities (15 085) –
(22 605) (13 440)
Assets classified as held for sale (note 20)Cash and cash equivalents 629 9Bank overdrafts and short-term facilities (177) –Interest-bearing loans and borrowings (1) –Lease liabilities (1 096) –
(645) 9
Net debt reconciliationNet debt at beginning of the year 13 440 12 223 Movement in interest-bearing loans and borrowings
Cash outflow with settlement of interest-bearing loans and borrowings through syndication process (6 500) –Cash inflow from interest-bearing loans and borrowings through syndication process 5 000 –Cash inflow from interest-bearing loans and borrowings – 1 500 Partial settlement of preference shares (4 000) –Floating rate notes issued 1 006 –Instalment sale agreement transferred to discontinued operations (18) (19)Acquisition of businesses (note 29) 9 –Repayment of loan acquired through acquisition of businesses (9) –Other loans raised 14 –
Movement in lease liabilitiesLease liability recognised on adoption of IFRS 16 (note 23) 17 022 –Cash outflow on payment of lease liability (note 23) (3 666) –Foreign currency adjustments (note 23) 52 –Additions to lease liabilities (note 23) 2 250 –Other movements 523 –
Net movement in cash and cash equivalents (1 945) (99)Net movement in bank overdrafts and short-term facilities 72 (174)Net debt at end of the year 23 250 13 431
NOTES TO THE CONSOLIDATED FINANCIAL STATEMENTS continuedfor the year ended 30 September 2020
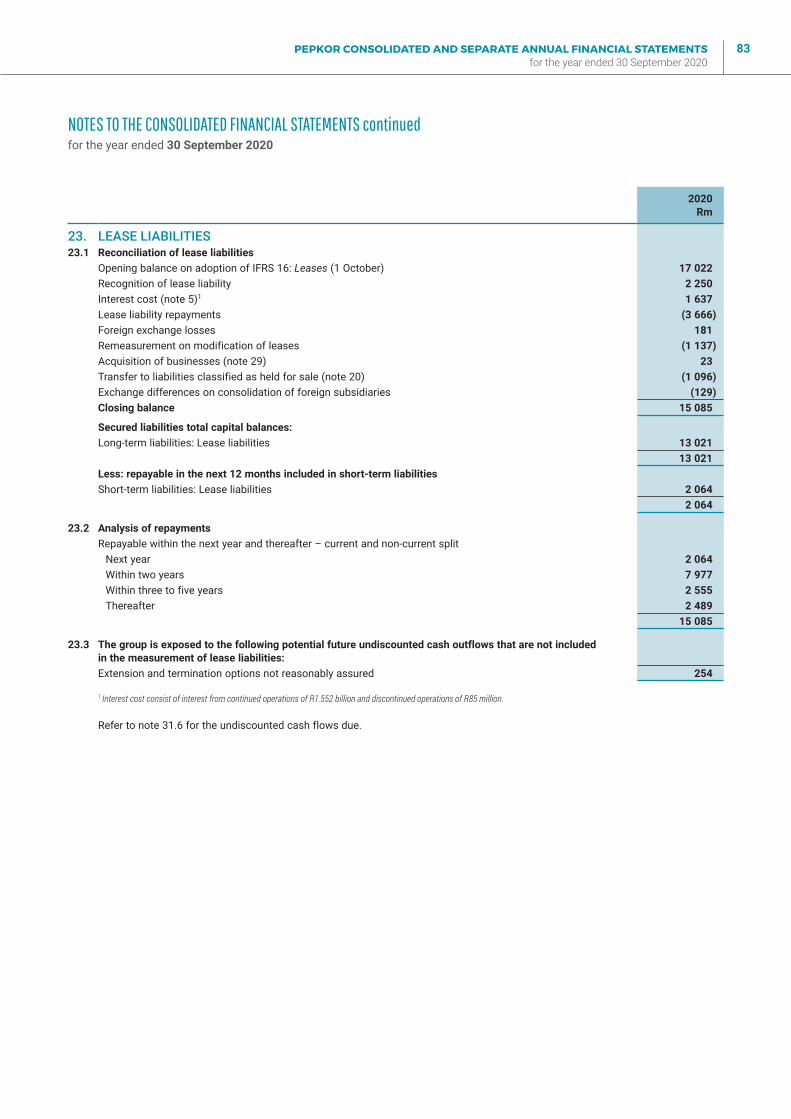
PEPKOR CONSOLIDATED AND SEPARATE ANNUAL FINANCIAL STATEMENTS for the year ended 30 September 2020
83
2020Rm
23. LEASE LIABILITIES23.1 Reconciliation of lease liabilities
Opening balance on adoption of IFRS 16: Leases (1 October) 17 022Recognition of lease liability 2 250 Interest cost (note 5)1 1 637 Lease liability repayments (3 666)Foreign exchange losses 181 Remeasurement on modification of leases (1 137)Acquisition of businesses (note 29) 23 Transfer to liabilities classified as held for sale (note 20) (1 096)Exchange differences on consolidation of foreign subsidiaries (129)Closing balance 15 085
Secured liabilities total capital balances: Long-term liabilities: Lease liabilities 13 021
13 021 Less: repayable in the next 12 months included in short-term liabilitiesShort-term liabilities: Lease liabilities 2 064
2 064
23.2 Analysis of repaymentsRepayable within the next year and thereafter – current and non-current split
Next year 2 064 Within two years 7 977 Within three to five years 2 555 Thereafter 2 489
15 085
23.3 The group is exposed to the following potential future undiscounted cash outflows that are not included in the measurement of lease liabilities:Extension and termination options not reasonably assured 254
1 Interest cost consist of interest from continued operations of R1.552 billion and discontinued operations of R85 million.
Refer to note 31.6 for the undiscounted cash flows due.
NOTES TO THE CONSOLIDATED FINANCIAL STATEMENTS continuedfor the year ended 30 September 2020
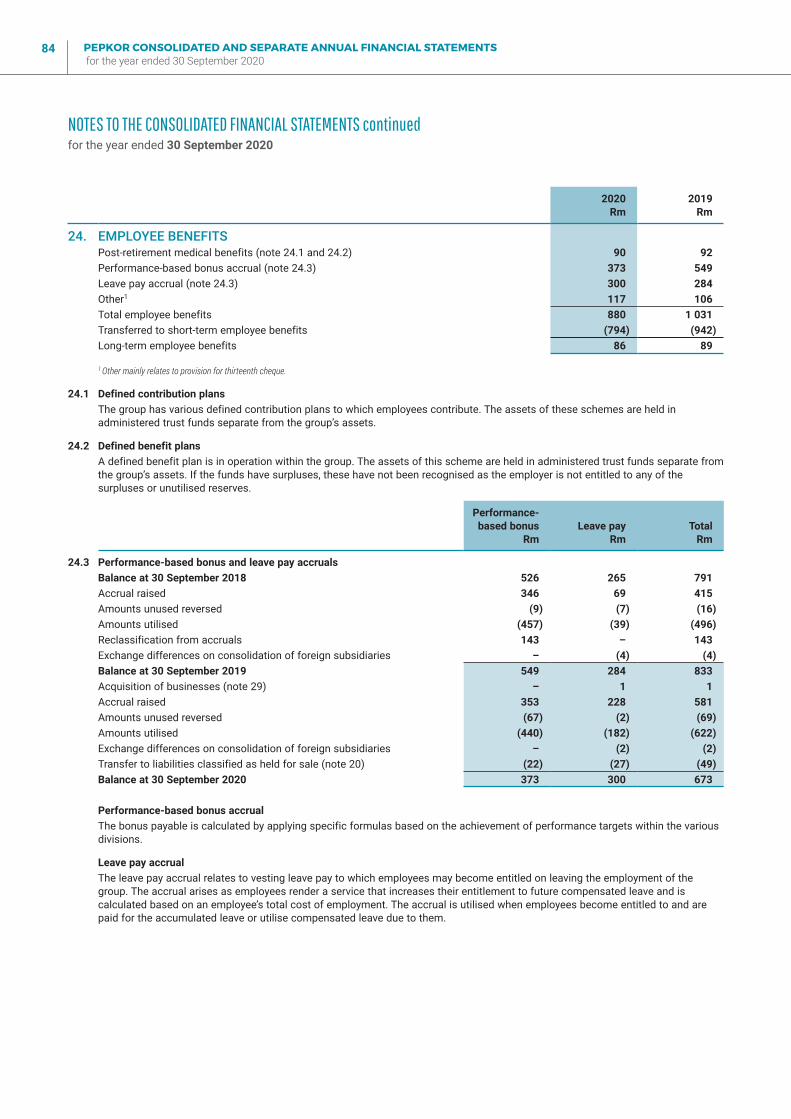
PEPKOR CONSOLIDATED AND SEPARATE ANNUAL FINANCIAL STATEMENTS for the year ended 30 September 2020
84
2020Rm
2019Rm
24. EMPLOYEE BENEFITSPost-retirement medical benefits (note 24.1 and 24.2) 90 92 Performance-based bonus accrual (note 24.3) 373 549 Leave pay accrual (note 24.3) 300 284 Other1 117 106 Total employee benefits 880 1 031 Transferred to short-term employee benefits (794) (942)Long-term employee benefits 86 89
1 Other mainly relates to provision for thirteenth cheque.
24.1 Defined contribution plansThe group has various defined contribution plans to which employees contribute. The assets of these schemes are held in administered trust funds separate from the group’s assets.
24.2 Defined benefit plansA defined benefit plan is in operation within the group. The assets of this scheme are held in administered trust funds separate from the group’s assets. If the funds have surpluses, these have not been recognised as the employer is not entitled to any of the surpluses or unutilised reserves.
Performance-based bonus
RmLeave pay
RmTotal
Rm
24.3 Performance-based bonus and leave pay accrualsBalance at 30 September 2018 526 265 791 Accrual raised 346 69 415 Amounts unused reversed (9) (7) (16)Amounts utilised (457) (39) (496)Reclassification from accruals 143 – 143 Exchange differences on consolidation of foreign subsidiaries – (4) (4)Balance at 30 September 2019 549 284 833 Acquisition of businesses (note 29) – 1 1 Accrual raised 353 228 581 Amounts unused reversed (67) (2) (69)Amounts utilised (440) (182) (622)Exchange differences on consolidation of foreign subsidiaries – (2) (2)Transfer to liabilities classified as held for sale (note 20) (22) (27) (49)Balance at 30 September 2020 373 300 673
Performance-based bonus accrualThe bonus payable is calculated by applying specific formulas based on the achievement of performance targets within the various divisions.
Leave pay accrualThe leave pay accrual relates to vesting leave pay to which employees may become entitled on leaving the employment of the group. The accrual arises as employees render a service that increases their entitlement to future compensated leave and is calculated based on an employee’s total cost of employment. The accrual is utilised when employees become entitled to and are paid for the accumulated leave or utilise compensated leave due to them.
NOTES TO THE CONSOLIDATED FINANCIAL STATEMENTS continuedfor the year ended 30 September 2020
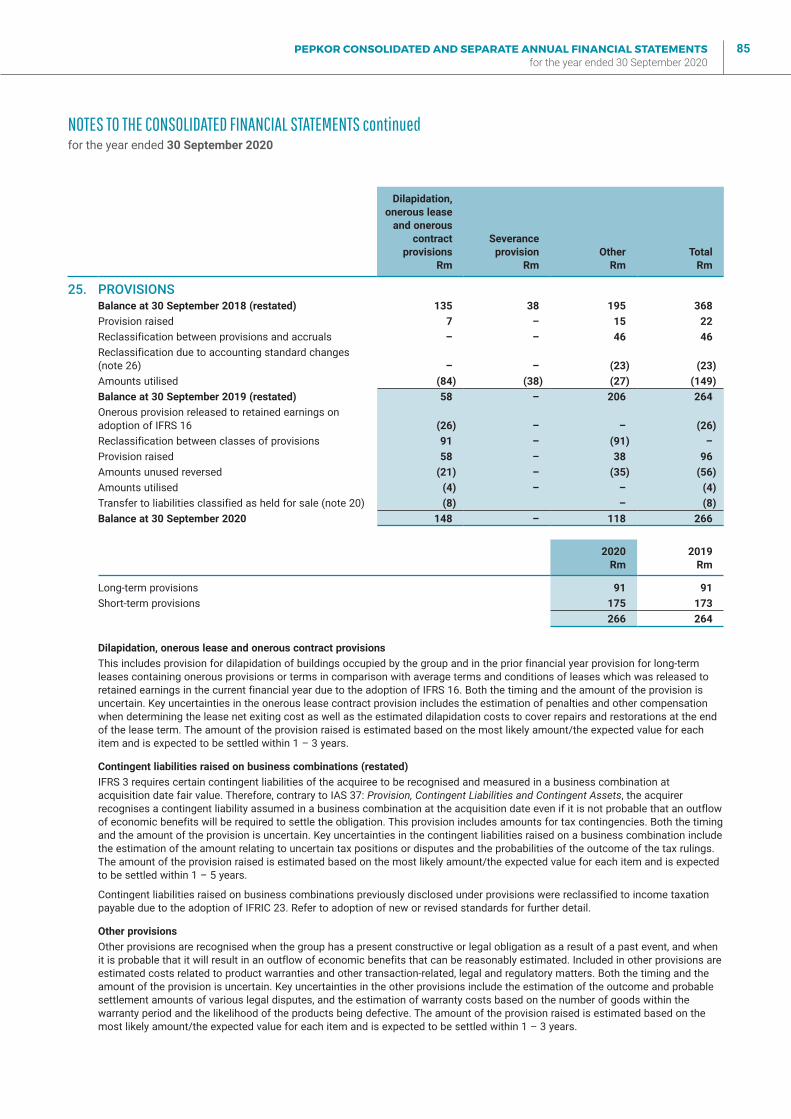
PEPKOR CONSOLIDATED AND SEPARATE ANNUAL FINANCIAL STATEMENTS for the year ended 30 September 2020
85
Dilapidation,onerous lease
and onerouscontract
provisions Rm
Severanceprovision
Rm Other
Rm Total
Rm
25. PROVISIONSBalance at 30 September 2018 (restated) 135 38 195 368 Provision raised 7 – 15 22 Reclassification between provisions and accruals – – 46 46 Reclassification due to accounting standard changes (note 26) – – (23) (23)Amounts utilised (84) (38) (27) (149)Balance at 30 September 2019 (restated) 58 – 206 264 Onerous provision released to retained earnings on adoption of IFRS 16 (26) – – (26)Reclassification between classes of provisions 91 – (91) –Provision raised 58 – 38 96 Amounts unused reversed (21) – (35) (56)Amounts utilised (4) – – (4)Transfer to liabilities classified as held for sale (note 20) (8) – (8)Balance at 30 September 2020 148 – 118 266
2020Rm
2019Rm
Long-term provisions 91 91 Short-term provisions 175 173
266 264
Dilapidation, onerous lease and onerous contract provisionsThis includes provision for dilapidation of buildings occupied by the group and in the prior financial year provision for long-term leases containing onerous provisions or terms in comparison with average terms and conditions of leases which was released to retained earnings in the current financial year due to the adoption of IFRS 16. Both the timing and the amount of the provision is uncertain. Key uncertainties in the onerous lease contract provision includes the estimation of penalties and other compensation when determining the lease net exiting cost as well as the estimated dilapidation costs to cover repairs and restorations at the end of the lease term. The amount of the provision raised is estimated based on the most likely amount/the expected value for each item and is expected to be settled within 1 – 3 years.
Contingent liabilities raised on business combinations (restated)IFRS 3 requires certain contingent liabilities of the acquiree to be recognised and measured in a business combination at acquisition date fair value. Therefore, contrary to IAS 37: Provision, Contingent Liabilities and Contingent Assets, the acquirer recognises a contingent liability assumed in a business combination at the acquisition date even if it is not probable that an outflow of economic benefits will be required to settle the obligation. This provision includes amounts for tax contingencies. Both the timing and the amount of the provision is uncertain. Key uncertainties in the contingent liabilities raised on a business combination include the estimation of the amount relating to uncertain tax positions or disputes and the probabilities of the outcome of the tax rulings. The amount of the provision raised is estimated based on the most likely amount/the expected value for each item and is expected to be settled within 1 – 5 years.
Contingent liabilities raised on business combinations previously disclosed under provisions were reclassified to income taxation payable due to the adoption of IFRIC 23. Refer to adoption of new or revised standards for further detail.
Other provisionsOther provisions are recognised when the group has a present constructive or legal obligation as a result of a past event, and when it is probable that it will result in an outflow of economic benefits that can be reasonably estimated. Included in other provisions are estimated costs related to product warranties and other transaction-related, legal and regulatory matters. Both the timing and the amount of the provision is uncertain. Key uncertainties in the other provisions include the estimation of the outcome and probable settlement amounts of various legal disputes, and the estimation of warranty costs based on the number of goods within the warranty period and the likelihood of the products being defective. The amount of the provision raised is estimated based on the most likely amount/the expected value for each item and is expected to be settled within 1 – 3 years.
NOTES TO THE CONSOLIDATED FINANCIAL STATEMENTS continuedfor the year ended 30 September 2020
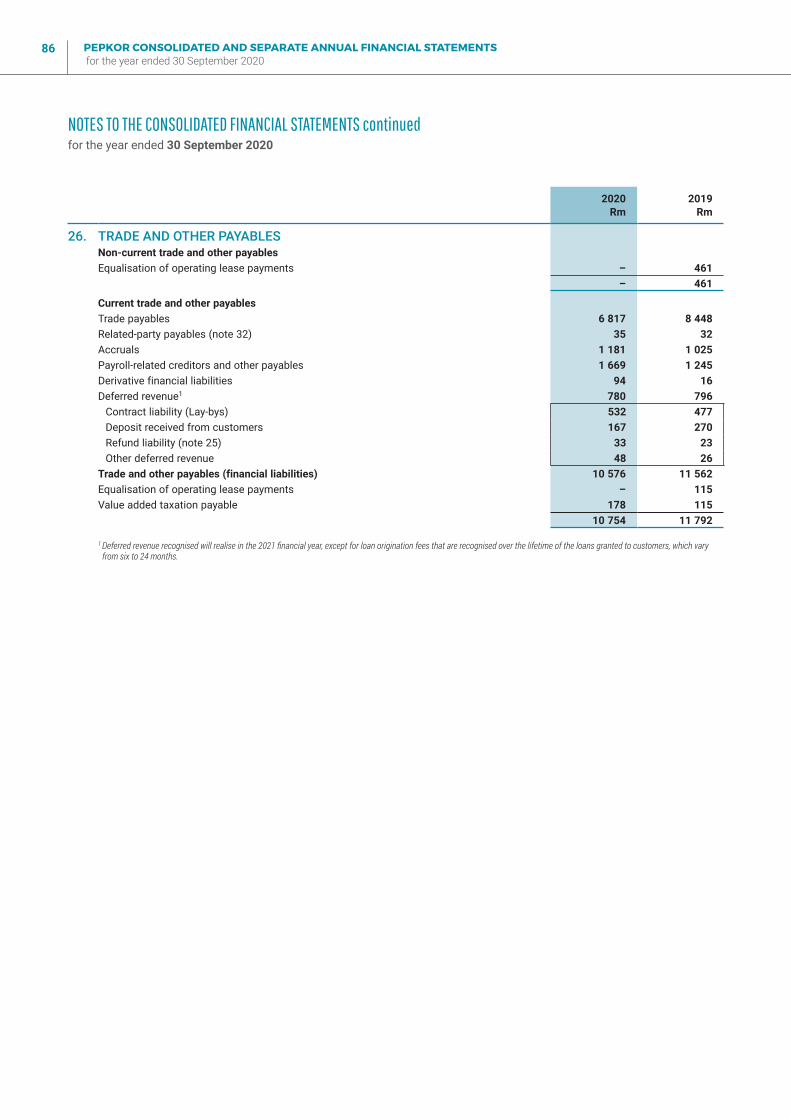
PEPKOR CONSOLIDATED AND SEPARATE ANNUAL FINANCIAL STATEMENTS for the year ended 30 September 2020
86
2020Rm
2019Rm
26. TRADE AND OTHER PAYABLESNon-current trade and other payablesEqualisation of operating lease payments – 461
– 461
Current trade and other payablesTrade payables 6 817 8 448 Related-party payables (note 32) 35 32 Accruals 1 181 1 025 Payroll-related creditors and other payables 1 669 1 245 Derivative financial liabilities 94 16 Deferred revenue1 780 796
Contract liability (Lay-bys) 532 477 Deposit received from customers 167 270 Refund liability (note 25) 33 23 Other deferred revenue 48 26
Trade and other payables (financial liabilities) 10 576 11 562 Equalisation of operating lease payments – 115 Value added taxation payable 178 115
10 754 11 792
1 Deferred revenue recognised will realise in the 2021 financial year, except for loan origination fees that are recognised over the lifetime of the loans granted to customers, which vary from six to 24 months.
NOTES TO THE CONSOLIDATED FINANCIAL STATEMENTS continuedfor the year ended 30 September 2020
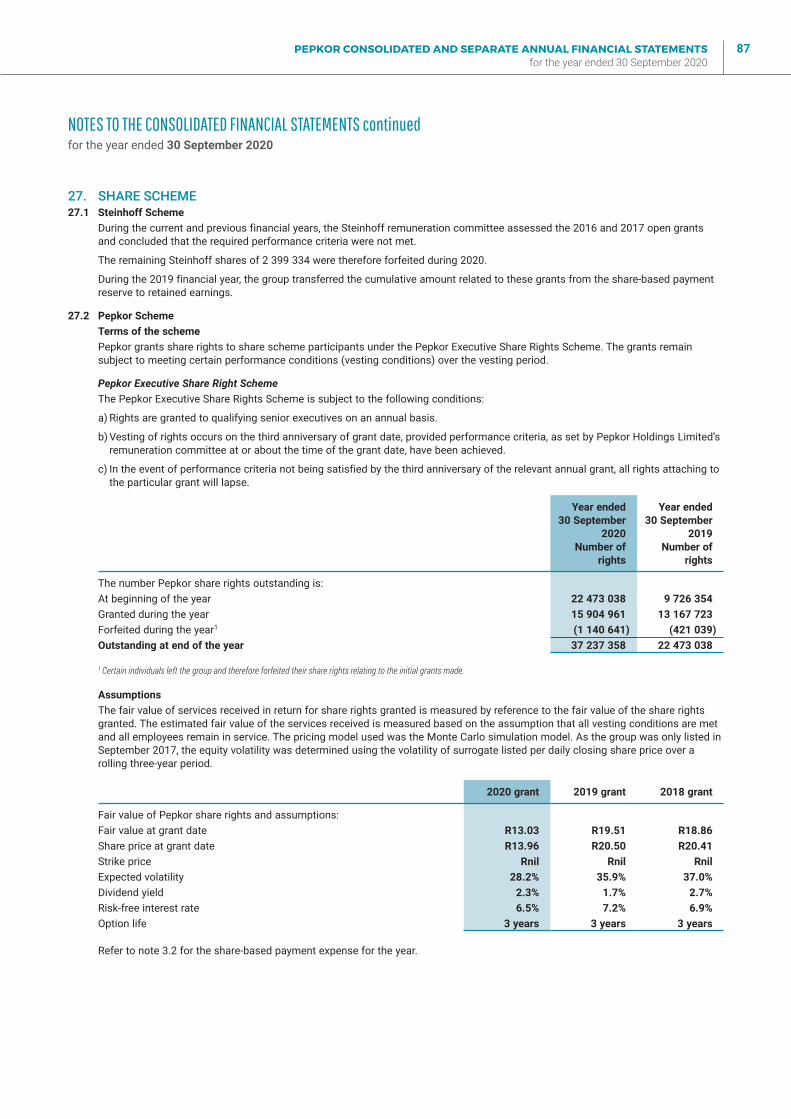
PEPKOR CONSOLIDATED AND SEPARATE ANNUAL FINANCIAL STATEMENTS for the year ended 30 September 2020
87
27. SHARE SCHEME27.1 Steinhoff Scheme
During the current and previous financial years, the Steinhoff remuneration committee assessed the 2016 and 2017 open grants and concluded that the required performance criteria were not met.
The remaining Steinhoff shares of 2 399 334 were therefore forfeited during 2020.
During the 2019 financial year, the group transferred the cumulative amount related to these grants from the share-based payment reserve to retained earnings.
27.2 Pepkor SchemeTerms of the schemePepkor grants share rights to share scheme participants under the Pepkor Executive Share Rights Scheme. The grants remain subject to meeting certain performance conditions (vesting conditions) over the vesting period.
Pepkor Executive Share Right SchemeThe Pepkor Executive Share Rights Scheme is subject to the following conditions:
a) Rights are granted to qualifying senior executives on an annual basis.
b) Vesting of rights occurs on the third anniversary of grant date, provided performance criteria, as set by Pepkor Holdings Limited’s remuneration committee at or about the time of the grant date, have been achieved.
c) In the event of performance criteria not being satisfied by the third anniversary of the relevant annual grant, all rights attaching to the particular grant will lapse.
Year ended30 September
2020 Number of
rights
Year ended30 September
2019 Number of
rights
The number Pepkor share rights outstanding is:At beginning of the year 22 473 038 9 726 354 Granted during the year 15 904 961 13 167 723 Forfeited during the year1 (1 140 641) (421 039)Outstanding at end of the year 37 237 358 22 473 038
1 Certain individuals left the group and therefore forfeited their share rights relating to the initial grants made.
AssumptionsThe fair value of services received in return for share rights granted is measured by reference to the fair value of the share rights granted. The estimated fair value of the services received is measured based on the assumption that all vesting conditions are met and all employees remain in service. The pricing model used was the Monte Carlo simulation model. As the group was only listed in September 2017, the equity volatility was determined using the volatility of surrogate listed per daily closing share price over a rolling three-year period.
2020 grant 2019 grant 2018 grant
Fair value of Pepkor share rights and assumptions:Fair value at grant date R13.03 R19.51 R18.86 Share price at grant date R13.96 R20.50 R20.41 Strike price Rnil Rnil Rnil Expected volatility 28.2% 35.9% 37.0%Dividend yield 2.3% 1.7% 2.7%Risk-free interest rate 6.5% 7.2% 6.9%Option life 3 years 3 years 3 years
Refer to note 3.2 for the share-based payment expense for the year.
NOTES TO THE CONSOLIDATED FINANCIAL STATEMENTS continuedfor the year ended 30 September 2020
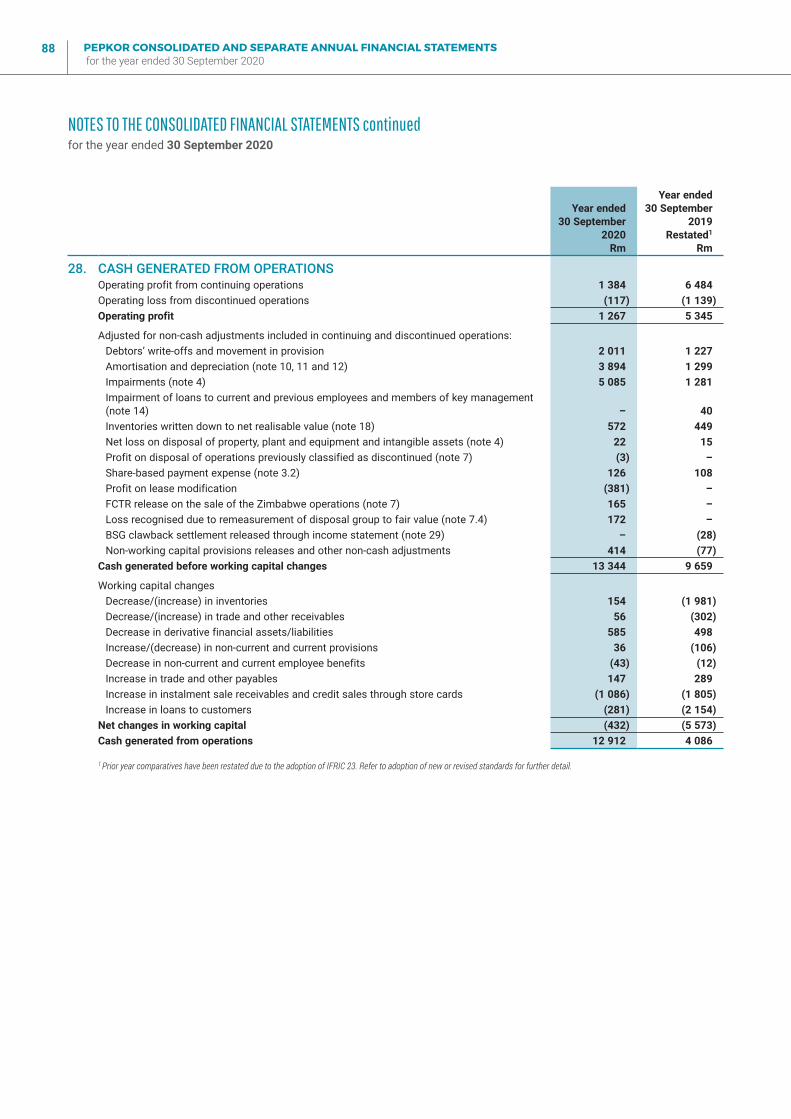
PEPKOR CONSOLIDATED AND SEPARATE ANNUAL FINANCIAL STATEMENTS for the year ended 30 September 2020
88
Year ended30 September
2020Rm
Year ended30 September
2019Restated1
Rm
28. CASH GENERATED FROM OPERATIONSOperating profit from continuing operations 1 384 6 484 Operating loss from discontinued operations (117) (1 139)Operating profit 1 267 5 345
Adjusted for non-cash adjustments included in continuing and discontinued operations:Debtors’ write-offs and movement in provision 2 011 1 227 Amortisation and depreciation (note 10, 11 and 12) 3 894 1 299 Impairments (note 4) 5 085 1 281 Impairment of loans to current and previous employees and members of key management (note 14) – 40 Inventories written down to net realisable value (note 18) 572 449 Net loss on disposal of property, plant and equipment and intangible assets (note 4) 22 15 Profit on disposal of operations previously classified as discontinued (note 7) (3) –Share-based payment expense (note 3.2) 126 108 Profit on lease modification (381) –FCTR release on the sale of the Zimbabwe operations (note 7) 165 –Loss recognised due to remeasurement of disposal group to fair value (note 7.4) 172 –BSG clawback settlement released through income statement (note 29) – (28)Non-working capital provisions releases and other non-cash adjustments 414 (77)
Cash generated before working capital changes 13 344 9 659
Working capital changesDecrease/(increase) in inventories 154 (1 981)Decrease/(increase) in trade and other receivables 56 (302)Decrease in derivative financial assets/liabilities 585 498 Increase/(decrease) in non-current and current provisions 36 (106)Decrease in non-current and current employee benefits (43) (12)Increase in trade and other payables 147 289 Increase in instalment sale receivables and credit sales through store cards (1 086) (1 805)Increase in loans to customers (281) (2 154)
Net changes in working capital (432) (5 573)Cash generated from operations 12 912 4 086
1 Prior year comparatives have been restated due to the adoption of IFRIC 23. Refer to adoption of new or revised standards for further detail.
NOTES TO THE CONSOLIDATED FINANCIAL STATEMENTS continuedfor the year ended 30 September 2020
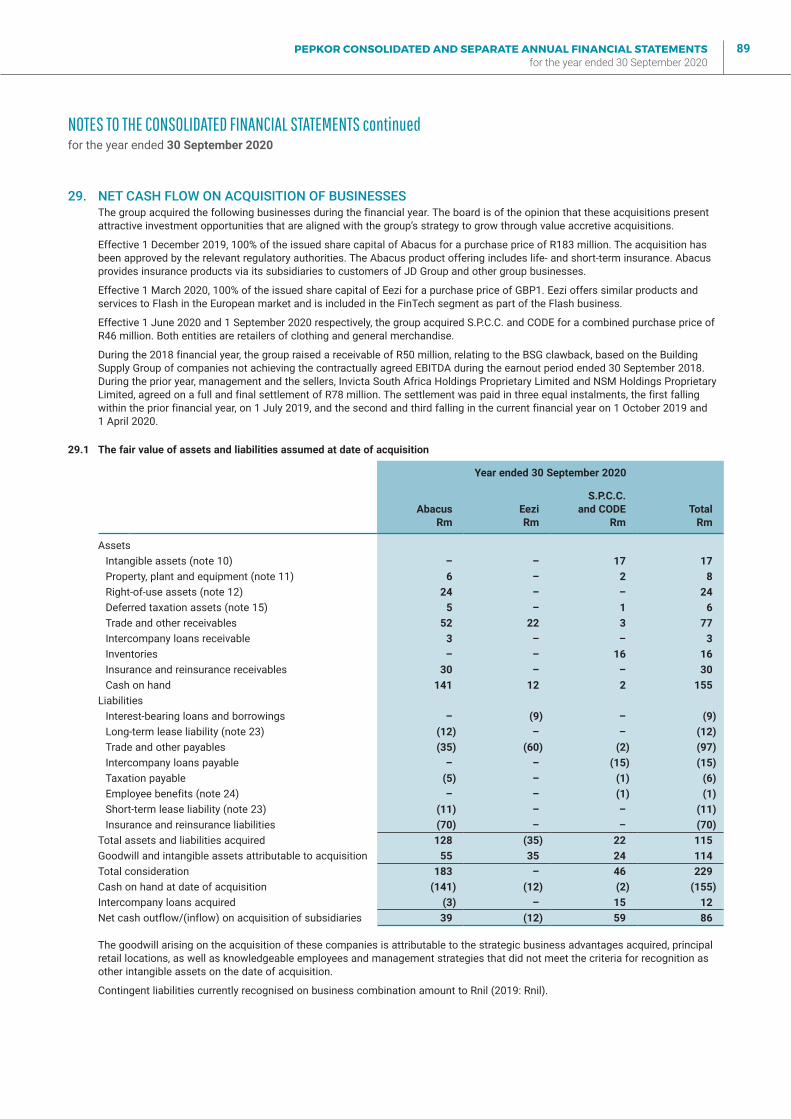
PEPKOR CONSOLIDATED AND SEPARATE ANNUAL FINANCIAL STATEMENTS for the year ended 30 September 2020
89
29. NET CASH FLOW ON ACQUISITION OF BUSINESSESThe group acquired the following businesses during the financial year. The board is of the opinion that these acquisitions present attractive investment opportunities that are aligned with the group’s strategy to grow through value accretive acquisitions.
Effective 1 December 2019, 100% of the issued share capital of Abacus for a purchase price of R183 million. The acquisition has been approved by the relevant regulatory authorities. The Abacus product offering includes life- and short-term insurance. Abacus provides insurance products via its subsidiaries to customers of JD Group and other group businesses.
Effective 1 March 2020, 100% of the issued share capital of Eezi for a purchase price of GBP1. Eezi offers similar products and services to Flash in the European market and is included in the FinTech segment as part of the Flash business.
Effective 1 June 2020 and 1 September 2020 respectively, the group acquired S.P.C.C. and CODE for a combined purchase price of R46 million. Both entities are retailers of clothing and general merchandise.
During the 2018 financial year, the group raised a receivable of R50 million, relating to the BSG clawback, based on the Building Supply Group of companies not achieving the contractually agreed EBITDA during the earnout period ended 30 September 2018. During the prior year, management and the sellers, Invicta South Africa Holdings Proprietary Limited and NSM Holdings Proprietary Limited, agreed on a full and final settlement of R78 million. The settlement was paid in three equal instalments, the first falling within the prior financial year, on 1 July 2019, and the second and third falling in the current financial year on 1 October 2019 and 1 April 2020.
29.1 The fair value of assets and liabilities assumed at date of acquisition
Year ended 30 September 2020
AbacusRm
EeziRm
S.P.C.C. and CODE
RmTotal
Rm
AssetsIntangible assets (note 10) – – 17 17 Property, plant and equipment (note 11) 6 – 2 8 Right-of-use assets (note 12) 24 – – 24 Deferred taxation assets (note 15) 5 – 1 6 Trade and other receivables 52 22 3 77 Intercompany loans receivable 3 – – 3 Inventories – – 16 16 Insurance and reinsurance receivables 30 – – 30 Cash on hand 141 12 2 155
LiabilitiesInterest-bearing loans and borrowings – (9) – (9)Long-term lease liability (note 23) (12) – – (12)Trade and other payables (35) (60) (2) (97)Intercompany loans payable – – (15) (15)Taxation payable (5) – (1) (6)Employee benefits (note 24) – – (1) (1)Short-term lease liability (note 23) (11) – – (11)Insurance and reinsurance liabilities (70) – – (70)
Total assets and liabilities acquired 128 (35) 22 115 Goodwill and intangible assets attributable to acquisition 55 35 24 114 Total consideration 183 – 46 229 Cash on hand at date of acquisition (141) (12) (2) (155)Intercompany loans acquired (3) – 15 12 Net cash outflow/(inflow) on acquisition of subsidiaries 39 (12) 59 86
The goodwill arising on the acquisition of these companies is attributable to the strategic business advantages acquired, principal retail locations, as well as knowledgeable employees and management strategies that did not meet the criteria for recognition as other intangible assets on the date of acquisition.
Contingent liabilities currently recognised on business combination amount to Rnil (2019: Rnil).
NOTES TO THE CONSOLIDATED FINANCIAL STATEMENTS continuedfor the year ended 30 September 2020
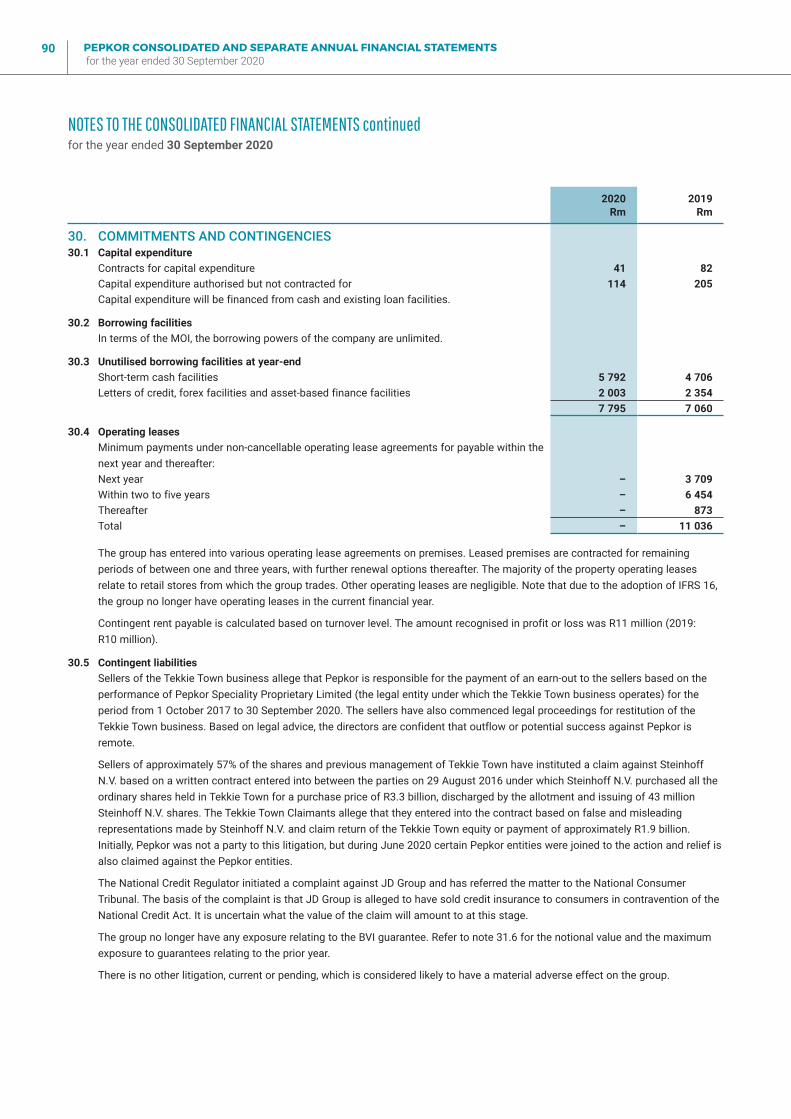
PEPKOR CONSOLIDATED AND SEPARATE ANNUAL FINANCIAL STATEMENTS for the year ended 30 September 2020
90
2020Rm
2019Rm
30. COMMITMENTS AND CONTINGENCIES30.1 Capital expenditure
Contracts for capital expenditure 41 82 Capital expenditure authorised but not contracted for 114 205 Capital expenditure will be financed from cash and existing loan facilities.
30.2 Borrowing facilitiesIn terms of the MOI, the borrowing powers of the company are unlimited.
30.3 Unutilised borrowing facilities at year-endShort-term cash facilities 5 792 4 706 Letters of credit, forex facilities and asset-based finance facilities 2 003 2 354
7 795 7 060
30.4 Operating leasesMinimum payments under non-cancellable operating lease agreements for payable within the next year and thereafter:Next year – 3 709 Within two to five years – 6 454 Thereafter – 873 Total – 11 036
The group has entered into various operating lease agreements on premises. Leased premises are contracted for remaining periods of between one and three years, with further renewal options thereafter. The majority of the property operating leases relate to retail stores from which the group trades. Other operating leases are negligible. Note that due to the adoption of IFRS 16, the group no longer have operating leases in the current financial year.
Contingent rent payable is calculated based on turnover level. The amount recognised in profit or loss was R11 million (2019: R10 million).
30.5 Contingent liabilitiesSellers of the Tekkie Town business allege that Pepkor is responsible for the payment of an earn-out to the sellers based on the performance of Pepkor Speciality Proprietary Limited (the legal entity under which the Tekkie Town business operates) for the period from 1 October 2017 to 30 September 2020. The sellers have also commenced legal proceedings for restitution of the Tekkie Town business. Based on legal advice, the directors are confident that outflow or potential success against Pepkor is remote.
Sellers of approximately 57% of the shares and previous management of Tekkie Town have instituted a claim against Steinhoff N.V. based on a written contract entered into between the parties on 29 August 2016 under which Steinhoff N.V. purchased all the ordinary shares held in Tekkie Town for a purchase price of R3.3 billion, discharged by the allotment and issuing of 43 million Steinhoff N.V. shares. The Tekkie Town Claimants allege that they entered into the contract based on false and misleading representations made by Steinhoff N.V. and claim return of the Tekkie Town equity or payment of approximately R1.9 billion. Initially, Pepkor was not a party to this litigation, but during June 2020 certain Pepkor entities were joined to the action and relief is also claimed against the Pepkor entities.
The National Credit Regulator initiated a complaint against JD Group and has referred the matter to the National Consumer Tribunal. The basis of the complaint is that JD Group is alleged to have sold credit insurance to consumers in contravention of the National Credit Act. It is uncertain what the value of the claim will amount to at this stage.
The group no longer have any exposure relating to the BVI guarantee. Refer to note 31.6 for the notional value and the maximum exposure to guarantees relating to the prior year.
There is no other litigation, current or pending, which is considered likely to have a material adverse effect on the group.
NOTES TO THE CONSOLIDATED FINANCIAL STATEMENTS continuedfor the year ended 30 September 2020
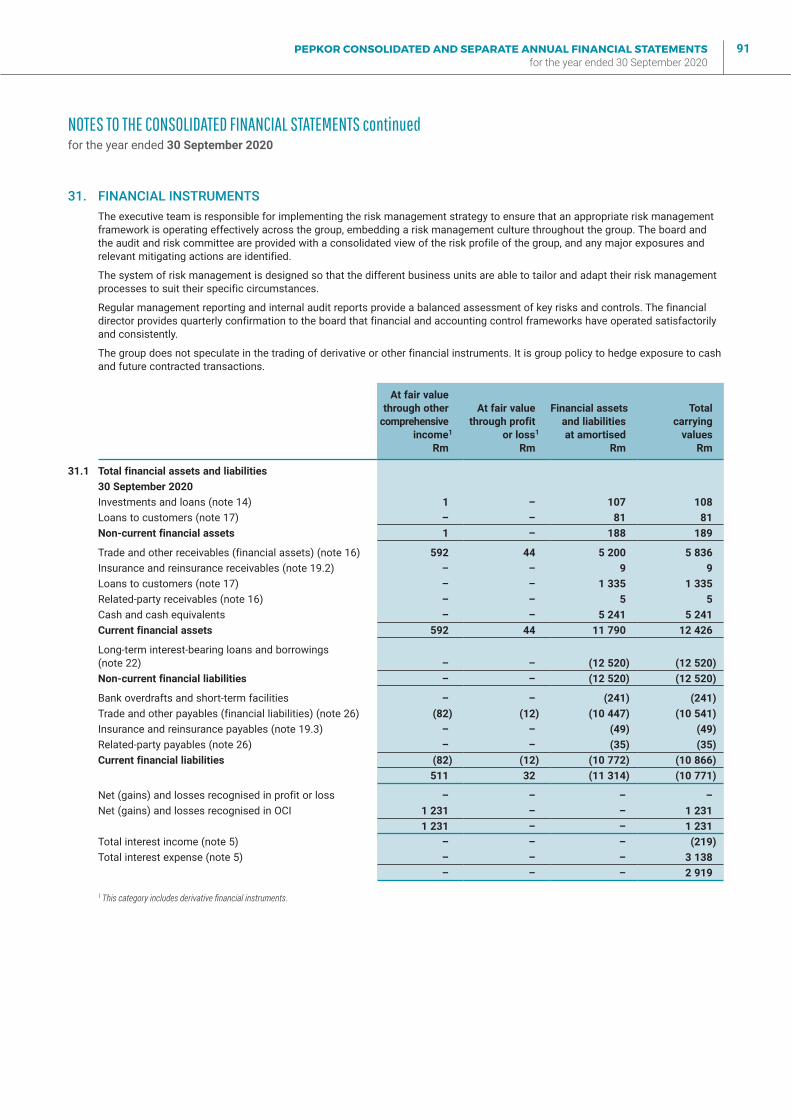
PEPKOR CONSOLIDATED AND SEPARATE ANNUAL FINANCIAL STATEMENTS for the year ended 30 September 2020
91
31. FINANCIAL INSTRUMENTSThe executive team is responsible for implementing the risk management strategy to ensure that an appropriate risk management framework is operating effectively across the group, embedding a risk management culture throughout the group. The board and the audit and risk committee are provided with a consolidated view of the risk profile of the group, and any major exposures and relevant mitigating actions are identified.
The system of risk management is designed so that the different business units are able to tailor and adapt their risk management processes to suit their specific circumstances.
Regular management reporting and internal audit reports provide a balanced assessment of key risks and controls. The financial director provides quarterly confirmation to the board that financial and accounting control frameworks have operated satisfactorily and consistently.
The group does not speculate in the trading of derivative or other financial instruments. It is group policy to hedge exposure to cash and future contracted transactions.
At fair valuethrough other
comprehensiveincome1
Rm
At fair valuethrough profit
or loss1
Rm
Financial assetsand liabilitiesat amortised
Rm
Total carrying
valuesRm
31.1 Total financial assets and liabilities30 September 2020Investments and loans (note 14) 1 – 107 108 Loans to customers (note 17) – – 81 81 Non-current financial assets 1 – 188 189
Trade and other receivables (financial assets) (note 16) 592 44 5 200 5 836 Insurance and reinsurance receivables (note 19.2) – – 9 9 Loans to customers (note 17) – – 1 335 1 335 Related-party receivables (note 16) – – 5 5 Cash and cash equivalents – – 5 241 5 241 Current financial assets 592 44 11 790 12 426
Long-term interest-bearing loans and borrowings (note 22) – – (12 520) (12 520)Non-current financial liabilities – – (12 520) (12 520)
Bank overdrafts and short-term facilities – – (241) (241)Trade and other payables (financial liabilities) (note 26) (82) (12) (10 447) (10 541)Insurance and reinsurance payables (note 19.3) – – (49) (49)Related-party payables (note 26) – – (35) (35)Current financial liabilities (82) (12) (10 772) (10 866)
511 32 (11 314) (10 771)
Net (gains) and losses recognised in profit or loss – – – –Net (gains) and losses recognised in OCI 1 231 – – 1 231
1 231 – – 1 231 Total interest income (note 5) – – – (219)Total interest expense (note 5) – – – 3 138
– – – 2 919
1 This category includes derivative financial instruments.
NOTES TO THE CONSOLIDATED FINANCIAL STATEMENTS continuedfor the year ended 30 September 2020
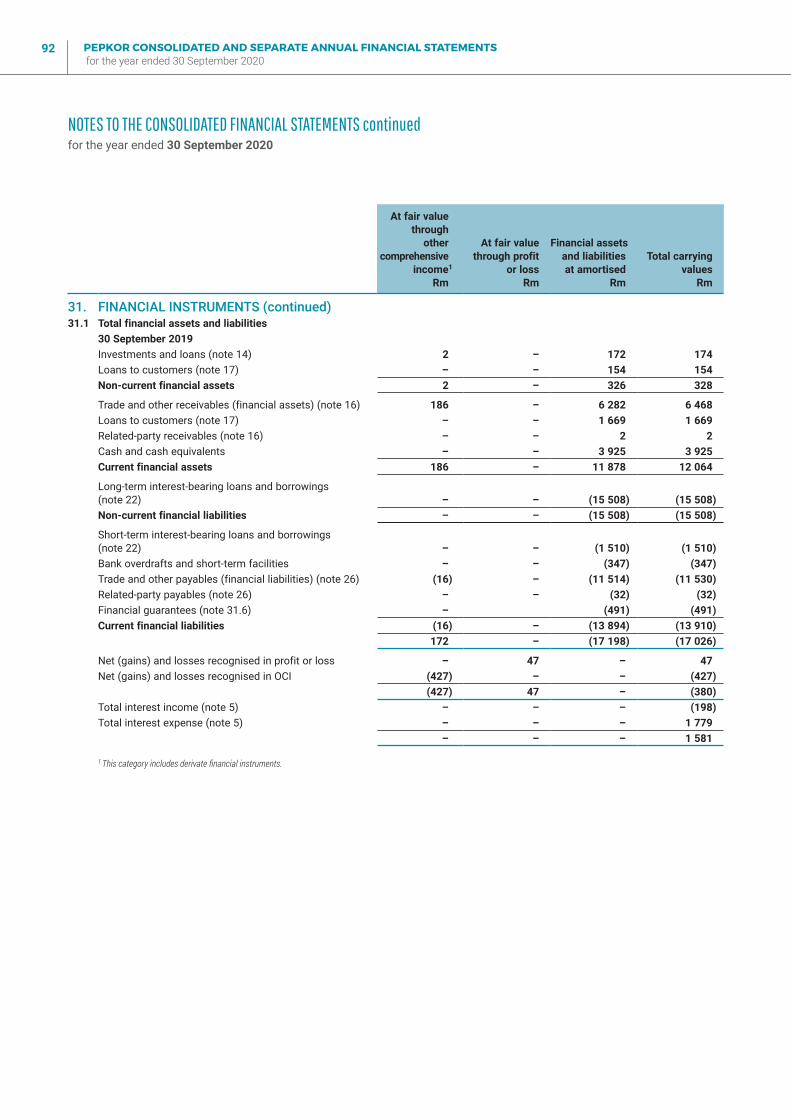
PEPKOR CONSOLIDATED AND SEPARATE ANNUAL FINANCIAL STATEMENTS for the year ended 30 September 2020
92
At fair valuethrough
othercomprehensive
income1
Rm
At fair valuethrough profit
or lossRm
Financial assetsand liabilitiesat amortised
Rm
Total carryingvalues
Rm
31. FINANCIAL INSTRUMENTS (continued)31.1 Total financial assets and liabilities
30 September 2019Investments and loans (note 14) 2 – 172 174 Loans to customers (note 17) – – 154 154 Non-current financial assets 2 – 326 328
Trade and other receivables (financial assets) (note 16) 186 – 6 282 6 468 Loans to customers (note 17) – – 1 669 1 669 Related-party receivables (note 16) – – 2 2 Cash and cash equivalents – – 3 925 3 925 Current financial assets 186 – 11 878 12 064
Long-term interest-bearing loans and borrowings (note 22) – – (15 508) (15 508)Non-current financial liabilities – – (15 508) (15 508)
Short-term interest-bearing loans and borrowings (note 22) – – (1 510) (1 510)Bank overdrafts and short-term facilities – – (347) (347)Trade and other payables (financial liabilities) (note 26) (16) – (11 514) (11 530)Related-party payables (note 26) – – (32) (32)Financial guarantees (note 31.6) – (491) (491)Current financial liabilities (16) – (13 894) (13 910)
172 – (17 198) (17 026)
Net (gains) and losses recognised in profit or loss – 47 – 47 Net (gains) and losses recognised in OCI (427) – – (427)
(427) 47 – (380)Total interest income (note 5) – – – (198)Total interest expense (note 5) – – – 1 779
– – – 1 581
1 This category includes derivate financial instruments.
NOTES TO THE CONSOLIDATED FINANCIAL STATEMENTS continuedfor the year ended 30 September 2020
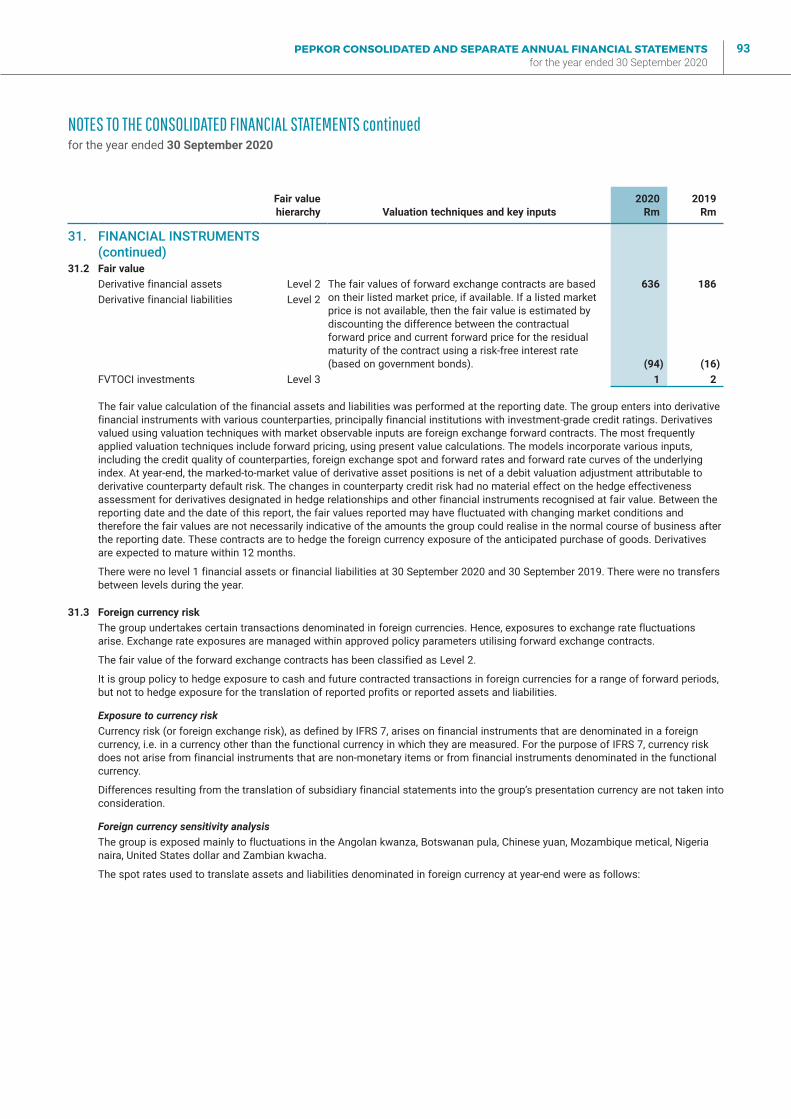
PEPKOR CONSOLIDATED AND SEPARATE ANNUAL FINANCIAL STATEMENTS for the year ended 30 September 2020
93
Fair valuehierarchy Valuation techniques and key inputs
2020 Rm
2019 Rm
31. FINANCIAL INSTRUMENTS (continued)
31.2 Fair valueDerivative financial assets Level 2 The fair values of forward exchange contracts are based
on their listed market price, if available. If a listed market price is not available, then the fair value is estimated by discounting the difference between the contractual forward price and current forward price for the residual maturity of the contract using a risk-free interest rate (based on government bonds).
636 186 Derivative financial liabilities Level 2
(94) (16)FVTOCI investments Level 3 1 2
The fair value calculation of the financial assets and liabilities was performed at the reporting date. The group enters into derivative financial instruments with various counterparties, principally financial institutions with investment-grade credit ratings. Derivatives valued using valuation techniques with market observable inputs are foreign exchange forward contracts. The most frequently applied valuation techniques include forward pricing, using present value calculations. The models incorporate various inputs, including the credit quality of counterparties, foreign exchange spot and forward rates and forward rate curves of the underlying index. At year-end, the marked-to-market value of derivative asset positions is net of a debit valuation adjustment attributable to derivative counterparty default risk. The changes in counterparty credit risk had no material effect on the hedge effectiveness assessment for derivatives designated in hedge relationships and other financial instruments recognised at fair value. Between the reporting date and the date of this report, the fair values reported may have fluctuated with changing market conditions and therefore the fair values are not necessarily indicative of the amounts the group could realise in the normal course of business after the reporting date. These contracts are to hedge the foreign currency exposure of the anticipated purchase of goods. Derivatives are expected to mature within 12 months.
There were no level 1 financial assets or financial liabilities at 30 September 2020 and 30 September 2019. There were no transfers between levels during the year.
31.3 Foreign currency riskThe group undertakes certain transactions denominated in foreign currencies. Hence, exposures to exchange rate fluctuations arise. Exchange rate exposures are managed within approved policy parameters utilising forward exchange contracts.
The fair value of the forward exchange contracts has been classified as Level 2.
It is group policy to hedge exposure to cash and future contracted transactions in foreign currencies for a range of forward periods, but not to hedge exposure for the translation of reported profits or reported assets and liabilities.
Exposure to currency riskCurrency risk (or foreign exchange risk), as defined by IFRS 7, arises on financial instruments that are denominated in a foreign currency, i.e. in a currency other than the functional currency in which they are measured. For the purpose of IFRS 7, currency risk does not arise from financial instruments that are non-monetary items or from financial instruments denominated in the functional currency.
Differences resulting from the translation of subsidiary financial statements into the group’s presentation currency are not taken into consideration.
Foreign currency sensitivity analysisThe group is exposed mainly to fluctuations in the Angolan kwanza, Botswanan pula, Chinese yuan, Mozambique metical, Nigeria naira, United States dollar and Zambian kwacha.
The spot rates used to translate assets and liabilities denominated in foreign currency at year-end were as follows:
NOTES TO THE CONSOLIDATED FINANCIAL STATEMENTS continuedfor the year ended 30 September 2020
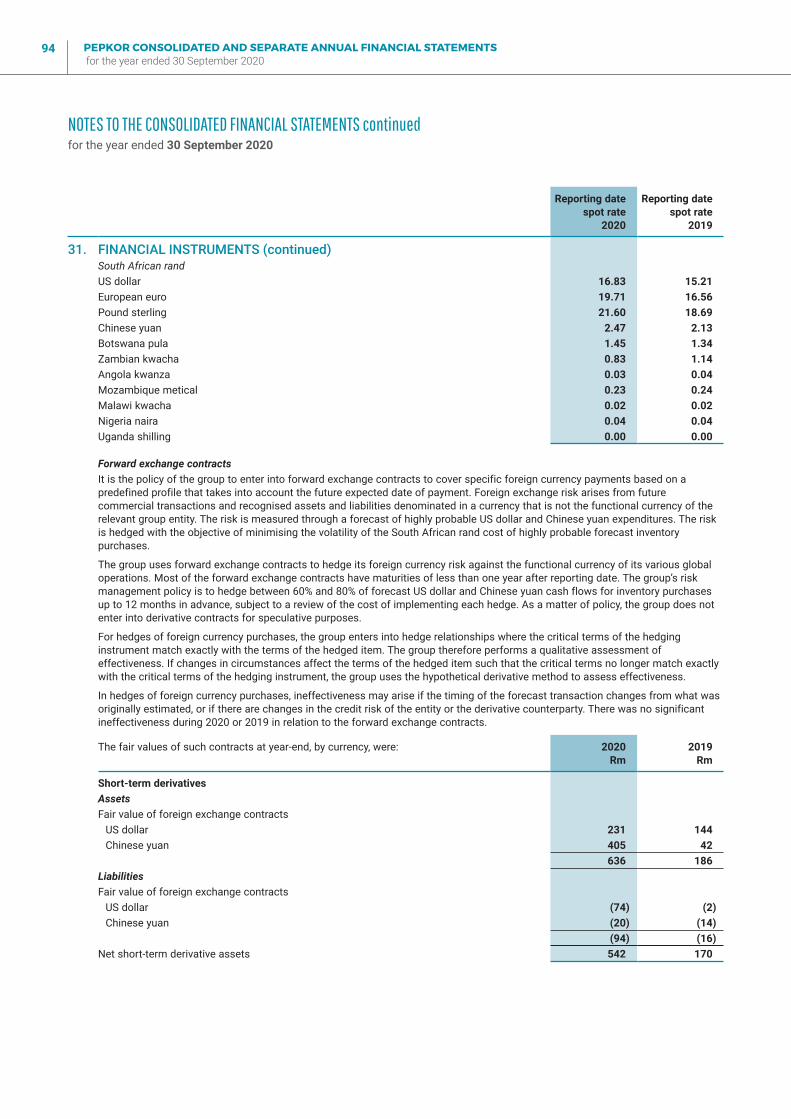
PEPKOR CONSOLIDATED AND SEPARATE ANNUAL FINANCIAL STATEMENTS for the year ended 30 September 2020
94
Reporting date spot rate
2020
Reporting date spot rate
2019
31. FINANCIAL INSTRUMENTS (continued)South African randUS dollar 16.83 15.21 European euro 19.71 16.56 Pound sterling 21.60 18.69 Chinese yuan 2.47 2.13 Botswana pula 1.45 1.34 Zambian kwacha 0.83 1.14 Angola kwanza 0.03 0.04 Mozambique metical 0.23 0.24 Malawi kwacha 0.02 0.02 Nigeria naira 0.04 0.04 Uganda shilling 0.00 0.00
Forward exchange contractsIt is the policy of the group to enter into forward exchange contracts to cover specific foreign currency payments based on a predefined profile that takes into account the future expected date of payment. Foreign exchange risk arises from future commercial transactions and recognised assets and liabilities denominated in a currency that is not the functional currency of the relevant group entity. The risk is measured through a forecast of highly probable US dollar and Chinese yuan expenditures. The risk is hedged with the objective of minimising the volatility of the South African rand cost of highly probable forecast inventory purchases.
The group uses forward exchange contracts to hedge its foreign currency risk against the functional currency of its various global operations. Most of the forward exchange contracts have maturities of less than one year after reporting date. The group’s risk management policy is to hedge between 60% and 80% of forecast US dollar and Chinese yuan cash flows for inventory purchases up to 12 months in advance, subject to a review of the cost of implementing each hedge. As a matter of policy, the group does not enter into derivative contracts for speculative purposes.
For hedges of foreign currency purchases, the group enters into hedge relationships where the critical terms of the hedging instrument match exactly with the terms of the hedged item. The group therefore performs a qualitative assessment of effectiveness. If changes in circumstances affect the terms of the hedged item such that the critical terms no longer match exactly with the critical terms of the hedging instrument, the group uses the hypothetical derivative method to assess effectiveness.
In hedges of foreign currency purchases, ineffectiveness may arise if the timing of the forecast transaction changes from what was originally estimated, or if there are changes in the credit risk of the entity or the derivative counterparty. There was no significant ineffectiveness during 2020 or 2019 in relation to the forward exchange contracts.
The fair values of such contracts at year-end, by currency, were: 2020 Rm
2019 Rm
Short-term derivativesAssetsFair value of foreign exchange contracts
US dollar 231 144 Chinese yuan 405 42
636 186 LiabilitiesFair value of foreign exchange contracts
US dollar (74) (2)Chinese yuan (20) (14)
(94) (16)Net short-term derivative assets 542 170
NOTES TO THE CONSOLIDATED FINANCIAL STATEMENTS continuedfor the year ended 30 September 2020
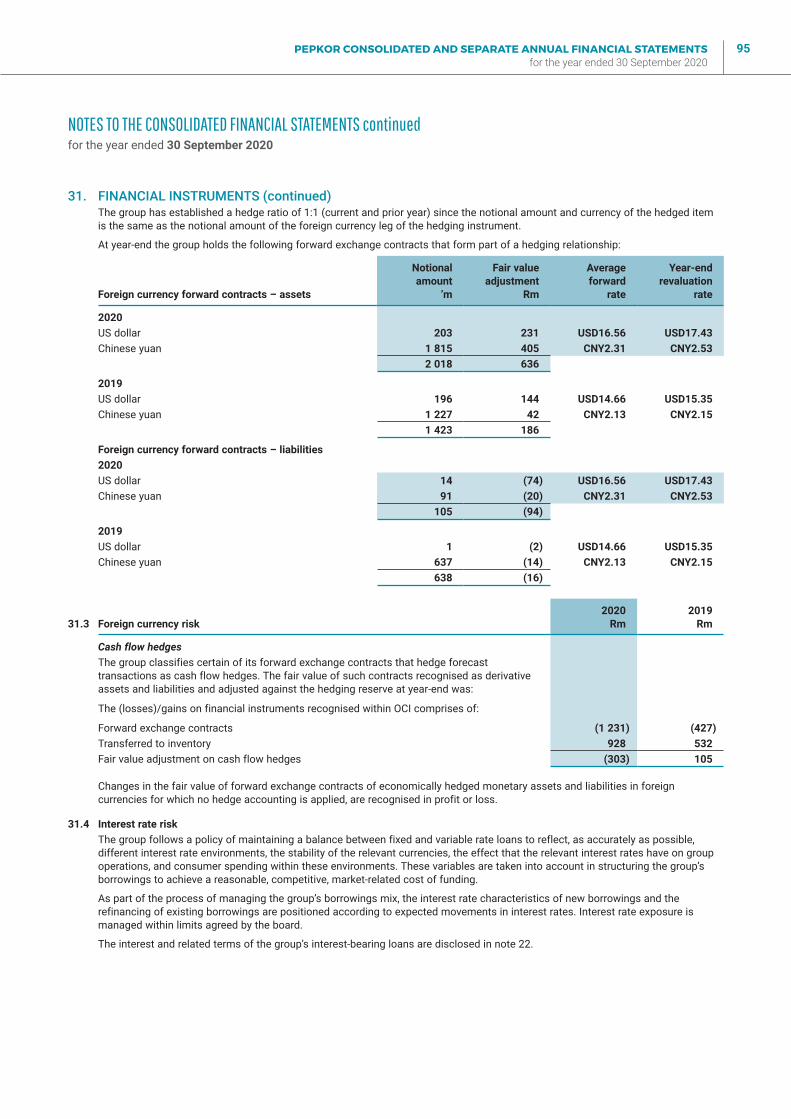
PEPKOR CONSOLIDATED AND SEPARATE ANNUAL FINANCIAL STATEMENTS for the year ended 30 September 2020
95
31. FINANCIAL INSTRUMENTS (continued)The group has established a hedge ratio of 1:1 (current and prior year) since the notional amount and currency of the hedged item is the same as the notional amount of the foreign currency leg of the hedging instrument.
At year-end the group holds the following forward exchange contracts that form part of a hedging relationship:
Foreign currency forward contracts – assets
Notionalamount
’m
Fair valueadjustment
Rm
Averageforward
rate
Year-endrevaluation
rate
2020US dollar 203 231 USD16.56 USD17.43Chinese yuan 1 815 405 CNY2.31 CNY2.53
2 018 636
2019US dollar 196 144 USD14.66 USD15.35Chinese yuan 1 227 42 CNY2.13 CNY2.15
1 423 186
Foreign currency forward contracts – liabilities2020US dollar 14 (74) USD16.56 USD17.43Chinese yuan 91 (20) CNY2.31 CNY2.53
105 (94)
2019US dollar 1 (2) USD14.66 USD15.35Chinese yuan 637 (14) CNY2.13 CNY2.15
638 (16)
31.3 Foreign currency risk2020
Rm2019
Rm
Cash flow hedgesThe group classifies certain of its forward exchange contracts that hedge forecast transactions as cash flow hedges. The fair value of such contracts recognised as derivative assets and liabilities and adjusted against the hedging reserve at year-end was:
The (losses)/gains on financial instruments recognised within OCI comprises of:
Forward exchange contracts (1 231) (427)Transferred to inventory 928 532 Fair value adjustment on cash flow hedges (303) 105
Changes in the fair value of forward exchange contracts of economically hedged monetary assets and liabilities in foreign currencies for which no hedge accounting is applied, are recognised in profit or loss.
31.4 Interest rate riskThe group follows a policy of maintaining a balance between fixed and variable rate loans to reflect, as accurately as possible, different interest rate environments, the stability of the relevant currencies, the effect that the relevant interest rates have on group operations, and consumer spending within these environments. These variables are taken into account in structuring the group’s borrowings to achieve a reasonable, competitive, market-related cost of funding.
As part of the process of managing the group’s borrowings mix, the interest rate characteristics of new borrowings and the refinancing of existing borrowings are positioned according to expected movements in interest rates. Interest rate exposure is managed within limits agreed by the board.
The interest and related terms of the group’s interest-bearing loans are disclosed in note 22.
NOTES TO THE CONSOLIDATED FINANCIAL STATEMENTS continuedfor the year ended 30 September 2020
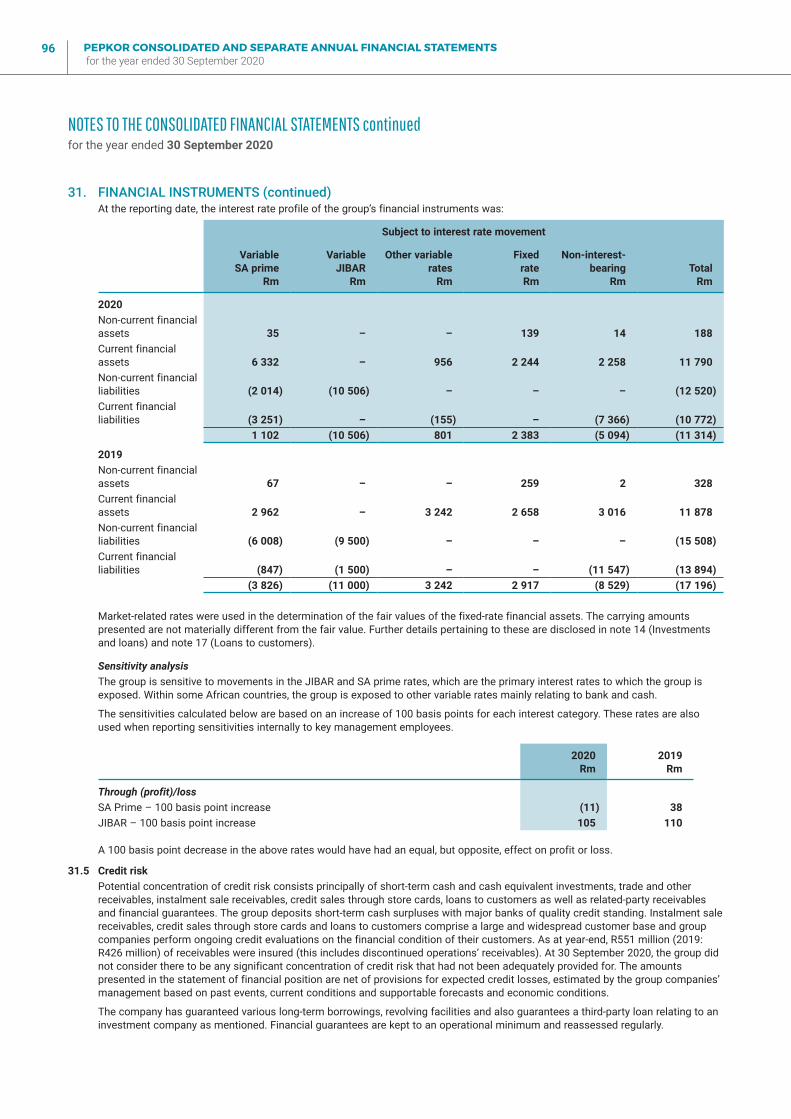
PEPKOR CONSOLIDATED AND SEPARATE ANNUAL FINANCIAL STATEMENTS for the year ended 30 September 2020
96
31. FINANCIAL INSTRUMENTS (continued)At the reporting date, the interest rate profile of the group’s financial instruments was:
Subject to interest rate movement
VariableSA prime
Rm
VariableJIBAR
Rm
Other variablerates
Rm
FixedrateRm
Non-interest-bearing
RmTotal
Rm
2020Non-current financial assets 35 – – 139 14 188 Current financial assets 6 332 – 956 2 244 2 258 11 790 Non-current financial liabilities (2 014) (10 506) – – – (12 520)Current financial liabilities (3 251) – (155) – (7 366) (10 772)
1 102 (10 506) 801 2 383 (5 094) (11 314)
2019Non-current financial assets 67 – – 259 2 328 Current financial assets 2 962 – 3 242 2 658 3 016 11 878 Non-current financial liabilities (6 008) (9 500) – – – (15 508)Current financial liabilities (847) (1 500) – – (11 547) (13 894)
(3 826) (11 000) 3 242 2 917 (8 529) (17 196)
Market-related rates were used in the determination of the fair values of the fixed-rate financial assets. The carrying amounts presented are not materially different from the fair value. Further details pertaining to these are disclosed in note 14 (Investments and loans) and note 17 (Loans to customers).
Sensitivity analysisThe group is sensitive to movements in the JIBAR and SA prime rates, which are the primary interest rates to which the group is exposed. Within some African countries, the group is exposed to other variable rates mainly relating to bank and cash.
The sensitivities calculated below are based on an increase of 100 basis points for each interest category. These rates are also used when reporting sensitivities internally to key management employees.
2020Rm
2019Rm
Through (profit)/lossSA Prime – 100 basis point increase (11) 38 JIBAR – 100 basis point increase 105 110
A 100 basis point decrease in the above rates would have had an equal, but opposite, effect on profit or loss.
31.5 Credit riskPotential concentration of credit risk consists principally of short-term cash and cash equivalent investments, trade and other receivables, instalment sale receivables, credit sales through store cards, loans to customers as well as related-party receivables and financial guarantees. The group deposits short-term cash surpluses with major banks of quality credit standing. Instalment sale receivables, credit sales through store cards and loans to customers comprise a large and widespread customer base and group companies perform ongoing credit evaluations on the financial condition of their customers. As at year-end, R551 million (2019: R426 million) of receivables were insured (this includes discontinued operations’ receivables). At 30 September 2020, the group did not consider there to be any significant concentration of credit risk that had not been adequately provided for. The amounts presented in the statement of financial position are net of provisions for expected credit losses, estimated by the group companies’ management based on past events, current conditions and supportable forecasts and economic conditions.
The company has guaranteed various long-term borrowings, revolving facilities and also guarantees a third-party loan relating to an investment company as mentioned. Financial guarantees are kept to an operational minimum and reassessed regularly.
NOTES TO THE CONSOLIDATED FINANCIAL STATEMENTS continuedfor the year ended 30 September 2020

PEPKOR CONSOLIDATED AND SEPARATE ANNUAL FINANCIAL STATEMENTS for the year ended 30 September 2020
97
2020Rm
2019Rm
31. FINANCIAL INSTRUMENTS (continued)The maximum exposure to credit risk at the reporting date without taking account the value of any collateral obtained was:Investments and loans (note 14) 73 107 Loans to employees and key management (note 14) 35 67 Cash and cash equivalents (note 31.5.2) 5 241 3 925 Loan to associate (note 13) 50 50 Instalment sale agreements (note 31.5.1) 923 989 Credit sales through store cards (note 31.5.1) 2 348 2 343 Trade and other receivables (note 31.5.1) 1 934 2 952 Insurance and reinsurance receivables (note 19.2) 9 –Loans to customers (note 31.5.1) 1 416 1 823 Financial assets 12 029 12 256Financial guarantees (note 31.6) – 491
12 029 12 747
31.5.1 Credit risk modelling applied to financial assets at amortised costThe group’s financial assets measured at amortised cost are subject to impairment under the ECL model. The inputs, assumptions and estimation techniques used in measuring ECL are explained below.
Measurement of ECL in terms of the general model for impairmentECLs are measured on either a 12-month or lifetime basis depending on whether a significant increase in credit risk has occurred since initial recognition or whether an asset is considered to be credit-impaired. ECLs are the discounted value of the PD and EAD, of which PD represents the likelihood of a counterparty defaulting on its financial obligation, either over 12 months (12-month PD) or over the remaining lifetime (lifetime PD) of the obligation. EAD is based on the amounts the group expects to be owed at the time of default over the next 12 months (12-month EAD) or over the remaining lifetime (lifetime EAD). The group calculates LGD as discounted EAD.
These three components are multiplied together, which effectively calculates the ECL. The ECL is then discounted back to the reporting date, using the original effective interest rate, and aggregated. ECL is a probability weighted outcome.
The 12-month and lifetime EADs are determined based on the probability of default, which varies by type of financial asset.
The group considers the probability of default on initial recognition of its financial asset measured at amortised cost and whether there has been a SICR on an ongoing basis throughout each reporting period. To assess whether there is an SICR, the group compares the risk of a default occurring on these asset as at the reporting date with the risk of default as at the date of initial recognition. The criteria used to identify an SICR are monitored and reviewed periodically for appropriateness by the credit risk team (refer to significant judgements and estimates for the groups of significant judgement exercised in assessing the SICR). Receivables with a significant financing component are grouped into stage 1, 2 and 3 as described below:
Stage 1: On recognition of financial assets, the group recognises a loss allowance based on 12 months ECLs. For disclosure purposes the stage 1 ECLs are split between performing and in arrears, where performing represents up to date debt outstanding and its corresponding ECL provision and in arrears represents debt outstanding where debt is outstanding for more than 30 days and its corresponding ECL provision.
Stage 2: When there is an indication that the financial assets has an SICR since origination, the group records a loss allowance for the lifetime ECLs.
Stage 3: Financial assets are considered to be credit-impaired. Financial assets are considered to be credit-impaired when one of more events that have an unfavourable impact on its estimated future cash flows have occurred. The group records a loss allowance for the lifetime ECLs.
Regardless of the analysis above, a significant increase in credit risk is presumed if a debtor is more than 30 days past due in making a contractual payment
NOTES TO THE CONSOLIDATED FINANCIAL STATEMENTS continuedfor the year ended 30 September 2020
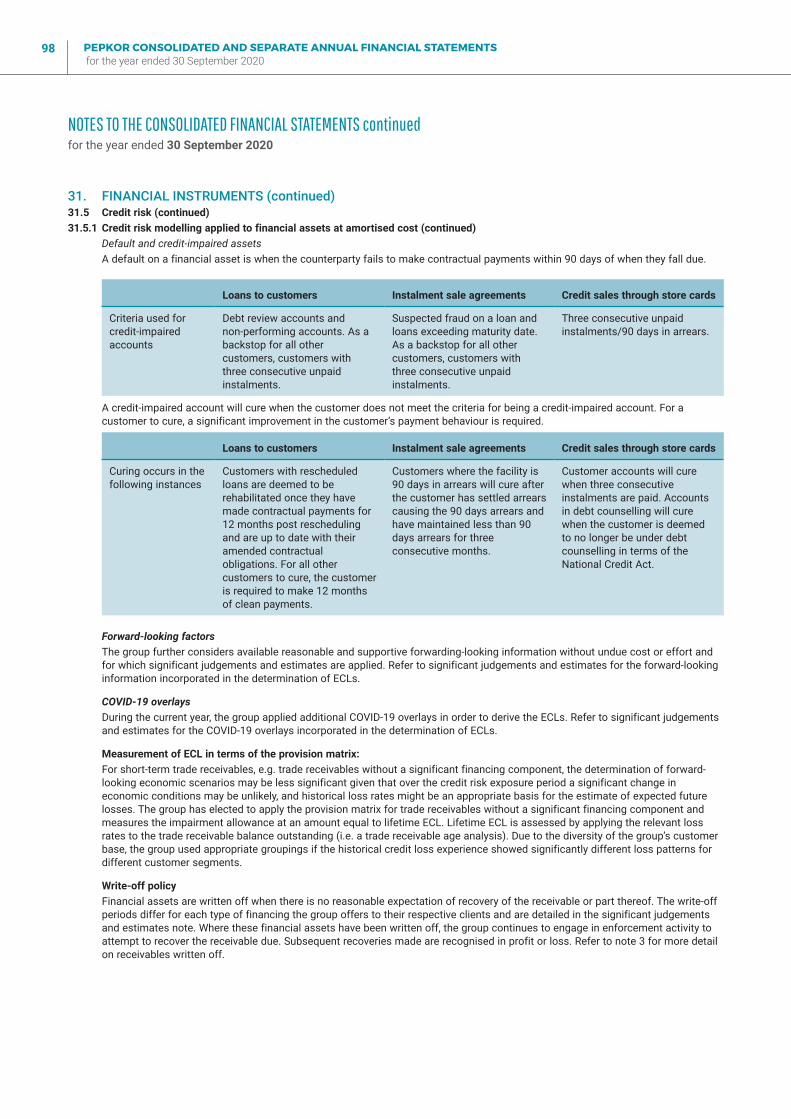
PEPKOR CONSOLIDATED AND SEPARATE ANNUAL FINANCIAL STATEMENTS for the year ended 30 September 2020
98
31. FINANCIAL INSTRUMENTS (continued)31.5 Credit risk (continued)31.5.1 Credit risk modelling applied to financial assets at amortised cost (continued)
Default and credit-impaired assetsA default on a financial asset is when the counterparty fails to make contractual payments within 90 days of when they fall due.
Loans to customers Instalment sale agreements Credit sales through store cards
Criteria used for credit-impaired accounts
Debt review accounts and non-performing accounts. As a backstop for all other customers, customers with three consecutive unpaid instalments.
Suspected fraud on a loan and loans exceeding maturity date. As a backstop for all other customers, customers with three consecutive unpaid instalments.
Three consecutive unpaid instalments/90 days in arrears.
A credit-impaired account will cure when the customer does not meet the criteria for being a credit-impaired account. For a customer to cure, a significant improvement in the customer’s payment behaviour is required.
Loans to customers Instalment sale agreements Credit sales through store cards
Curing occurs in the following instances
Customers with rescheduled loans are deemed to be rehabilitated once they have made contractual payments for 12 months post rescheduling and are up to date with their amended contractual obligations. For all other customers to cure, the customer is required to make 12 months of clean payments.
Customers where the facility is 90 days in arrears will cure after the customer has settled arrears causing the 90 days arrears and have maintained less than 90 days arrears for three consecutive months.
Customer accounts will cure when three consecutive instalments are paid. Accounts in debt counselling will cure when the customer is deemed to no longer be under debt counselling in terms of the National Credit Act.
Forward-looking factorsThe group further considers available reasonable and supportive forwarding-looking information without undue cost or effort and for which significant judgements and estimates are applied. Refer to significant judgements and estimates for the forward-looking information incorporated in the determination of ECLs.
COVID-19 overlaysDuring the current year, the group applied additional COVID-19 overlays in order to derive the ECLs. Refer to significant judgements and estimates for the COVID-19 overlays incorporated in the determination of ECLs.
Measurement of ECL in terms of the provision matrix:For short-term trade receivables, e.g. trade receivables without a significant financing component, the determination of forward-looking economic scenarios may be less significant given that over the credit risk exposure period a significant change in economic conditions may be unlikely, and historical loss rates might be an appropriate basis for the estimate of expected future losses. The group has elected to apply the provision matrix for trade receivables without a significant financing component and measures the impairment allowance at an amount equal to lifetime ECL. Lifetime ECL is assessed by applying the relevant loss rates to the trade receivable balance outstanding (i.e. a trade receivable age analysis). Due to the diversity of the group’s customer base, the group used appropriate groupings if the historical credit loss experience showed significantly different loss patterns for different customer segments.
Write-off policyFinancial assets are written off when there is no reasonable expectation of recovery of the receivable or part thereof. The write-off periods differ for each type of financing the group offers to their respective clients and are detailed in the significant judgements and estimates note. Where these financial assets have been written off, the group continues to engage in enforcement activity to attempt to recover the receivable due. Subsequent recoveries made are recognised in profit or loss. Refer to note 3 for more detail on receivables written off.
NOTES TO THE CONSOLIDATED FINANCIAL STATEMENTS continuedfor the year ended 30 September 2020
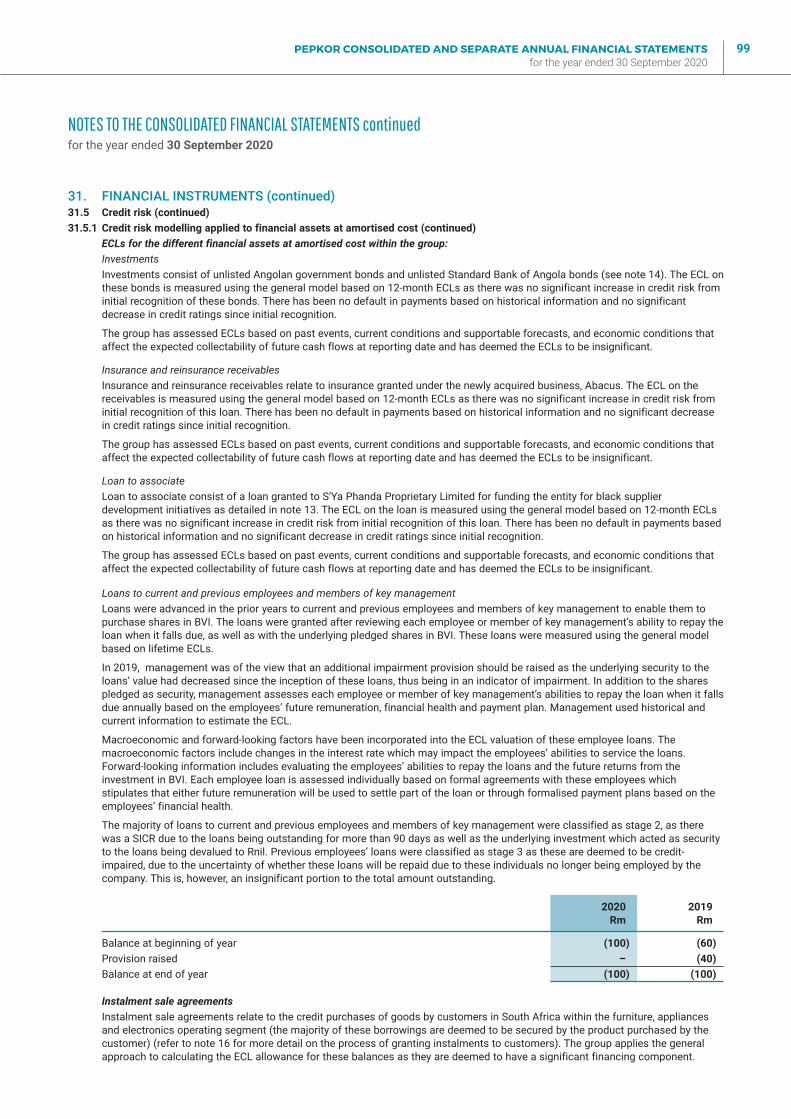
PEPKOR CONSOLIDATED AND SEPARATE ANNUAL FINANCIAL STATEMENTS for the year ended 30 September 2020
99
31. FINANCIAL INSTRUMENTS (continued)31.5 Credit risk (continued)31.5.1 Credit risk modelling applied to financial assets at amortised cost (continued)
ECLs for the different financial assets at amortised cost within the group:InvestmentsInvestments consist of unlisted Angolan government bonds and unlisted Standard Bank of Angola bonds (see note 14). The ECL on these bonds is measured using the general model based on 12-month ECLs as there was no significant increase in credit risk from initial recognition of these bonds. There has been no default in payments based on historical information and no significant decrease in credit ratings since initial recognition.
The group has assessed ECLs based on past events, current conditions and supportable forecasts, and economic conditions that affect the expected collectability of future cash flows at reporting date and has deemed the ECLs to be insignificant.
Insurance and reinsurance receivablesInsurance and reinsurance receivables relate to insurance granted under the newly acquired business, Abacus. The ECL on the receivables is measured using the general model based on 12-month ECLs as there was no significant increase in credit risk from initial recognition of this loan. There has been no default in payments based on historical information and no significant decrease in credit ratings since initial recognition.
The group has assessed ECLs based on past events, current conditions and supportable forecasts, and economic conditions that affect the expected collectability of future cash flows at reporting date and has deemed the ECLs to be insignificant.
Loan to associateLoan to associate consist of a loan granted to S’Ya Phanda Proprietary Limited for funding the entity for black supplier development initiatives as detailed in note 13. The ECL on the loan is measured using the general model based on 12-month ECLs as there was no significant increase in credit risk from initial recognition of this loan. There has been no default in payments based on historical information and no significant decrease in credit ratings since initial recognition.
The group has assessed ECLs based on past events, current conditions and supportable forecasts, and economic conditions that affect the expected collectability of future cash flows at reporting date and has deemed the ECLs to be insignificant.
Loans to current and previous employees and members of key managementLoans were advanced in the prior years to current and previous employees and members of key management to enable them to purchase shares in BVI. The loans were granted after reviewing each employee or member of key management’s ability to repay the loan when it falls due, as well as with the underlying pledged shares in BVI. These loans were measured using the general model based on lifetime ECLs.
In 2019, management was of the view that an additional impairment provision should be raised as the underlying security to the loans’ value had decreased since the inception of these loans, thus being in an indicator of impairment. In addition to the shares pledged as security, management assesses each employee or member of key management’s abilities to repay the loan when it falls due annually based on the employees’ future remuneration, financial health and payment plan. Management used historical and current information to estimate the ECL.
Macroeconomic and forward-looking factors have been incorporated into the ECL valuation of these employee loans. The macroeconomic factors include changes in the interest rate which may impact the employees’ abilities to service the loans. Forward-looking information includes evaluating the employees’ abilities to repay the loans and the future returns from the investment in BVI. Each employee loan is assessed individually based on formal agreements with these employees which stipulates that either future remuneration will be used to settle part of the loan or through formalised payment plans based on the employees’ financial health.
The majority of loans to current and previous employees and members of key management were classified as stage 2, as there was a SICR due to the loans being outstanding for more than 90 days as well as the underlying investment which acted as security to the loans being devalued to Rnil. Previous employees’ loans were classified as stage 3 as these are deemed to be credit-impaired, due to the uncertainty of whether these loans will be repaid due to these individuals no longer being employed by the company. This is, however, an insignificant portion to the total amount outstanding.
2020 Rm
2019Rm
Balance at beginning of year (100) (60)Provision raised – (40)Balance at end of year (100) (100)
Instalment sale agreementsInstalment sale agreements relate to the credit purchases of goods by customers in South Africa within the furniture, appliances and electronics operating segment (the majority of these borrowings are deemed to be secured by the product purchased by the customer) (refer to note 16 for more detail on the process of granting instalments to customers). The group applies the general approach to calculating the ECL allowance for these balances as they are deemed to have a significant financing component.
NOTES TO THE CONSOLIDATED FINANCIAL STATEMENTS continuedfor the year ended 30 September 2020
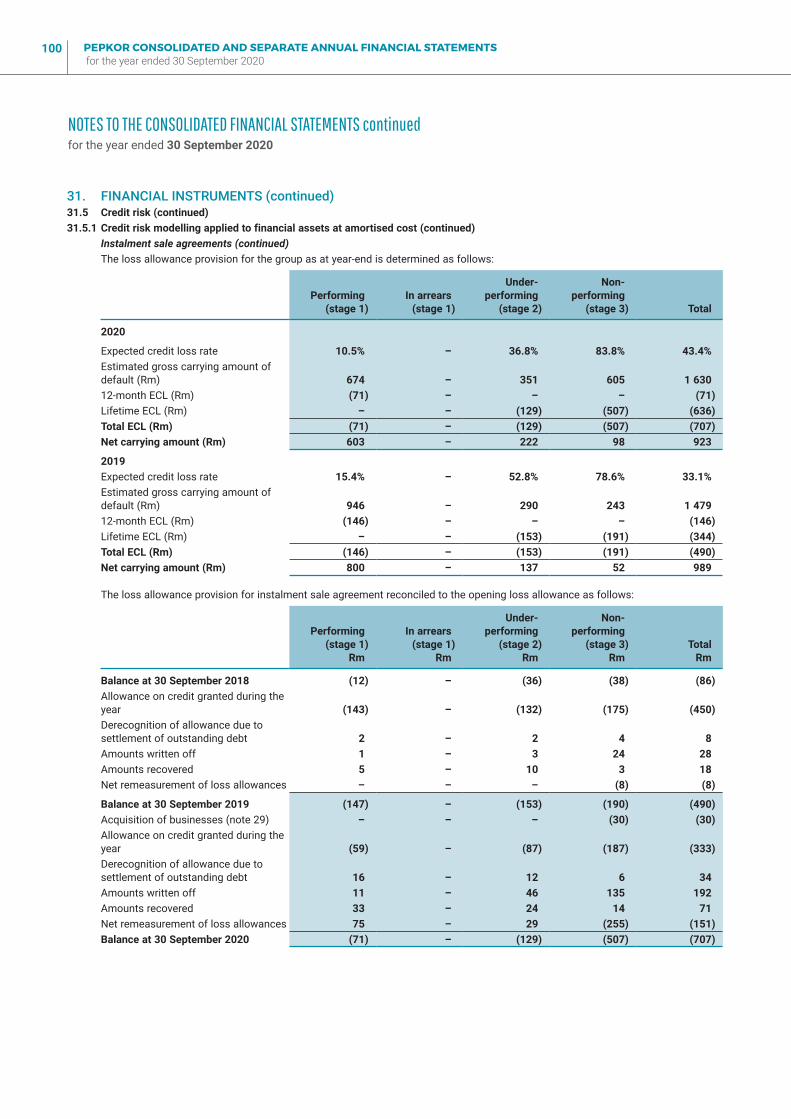
PEPKOR CONSOLIDATED AND SEPARATE ANNUAL FINANCIAL STATEMENTS for the year ended 30 September 2020
100
31. FINANCIAL INSTRUMENTS (continued)31.5 Credit risk (continued)31.5.1 Credit risk modelling applied to financial assets at amortised cost (continued)
Instalment sale agreements (continued)The loss allowance provision for the group as at year-end is determined as follows:
Performing(stage 1)
In arrears(stage 1)
Under-performing
(stage 2)
Non-performing
(stage 3) Total
2020
Expected credit loss rate 10.5% – 36.8% 83.8% 43.4%Estimated gross carrying amount of default (Rm) 674 – 351 605 1 630 12-month ECL (Rm) (71) – – – (71)Lifetime ECL (Rm) – – (129) (507) (636)Total ECL (Rm) (71) – (129) (507) (707)Net carrying amount (Rm) 603 – 222 98 923
2019Expected credit loss rate 15.4% – 52.8% 78.6% 33.1%Estimated gross carrying amount of default (Rm) 946 – 290 243 1 479 12-month ECL (Rm) (146) – – – (146)Lifetime ECL (Rm) – – (153) (191) (344)Total ECL (Rm) (146) – (153) (191) (490)Net carrying amount (Rm) 800 – 137 52 989
The loss allowance provision for instalment sale agreement reconciled to the opening loss allowance as follows:
Performing(stage 1)
Rm
In arrears(stage 1)
Rm
Under-performing
(stage 2) Rm
Non-performing
(stage 3) Rm
Total Rm
Balance at 30 September 2018 (12) – (36) (38) (86)Allowance on credit granted during the year (143) – (132) (175) (450)Derecognition of allowance due to settlement of outstanding debt 2 – 2 4 8 Amounts written off 1 – 3 24 28 Amounts recovered 5 – 10 3 18 Net remeasurement of loss allowances – – – (8) (8)
Balance at 30 September 2019 (147) – (153) (190) (490)Acquisition of businesses (note 29) – – – (30) (30)Allowance on credit granted during the year (59) – (87) (187) (333)Derecognition of allowance due to settlement of outstanding debt 16 – 12 6 34 Amounts written off 11 – 46 135 192 Amounts recovered 33 – 24 14 71 Net remeasurement of loss allowances 75 – 29 (255) (151)Balance at 30 September 2020 (71) – (129) (507) (707)
NOTES TO THE CONSOLIDATED FINANCIAL STATEMENTS continuedfor the year ended 30 September 2020
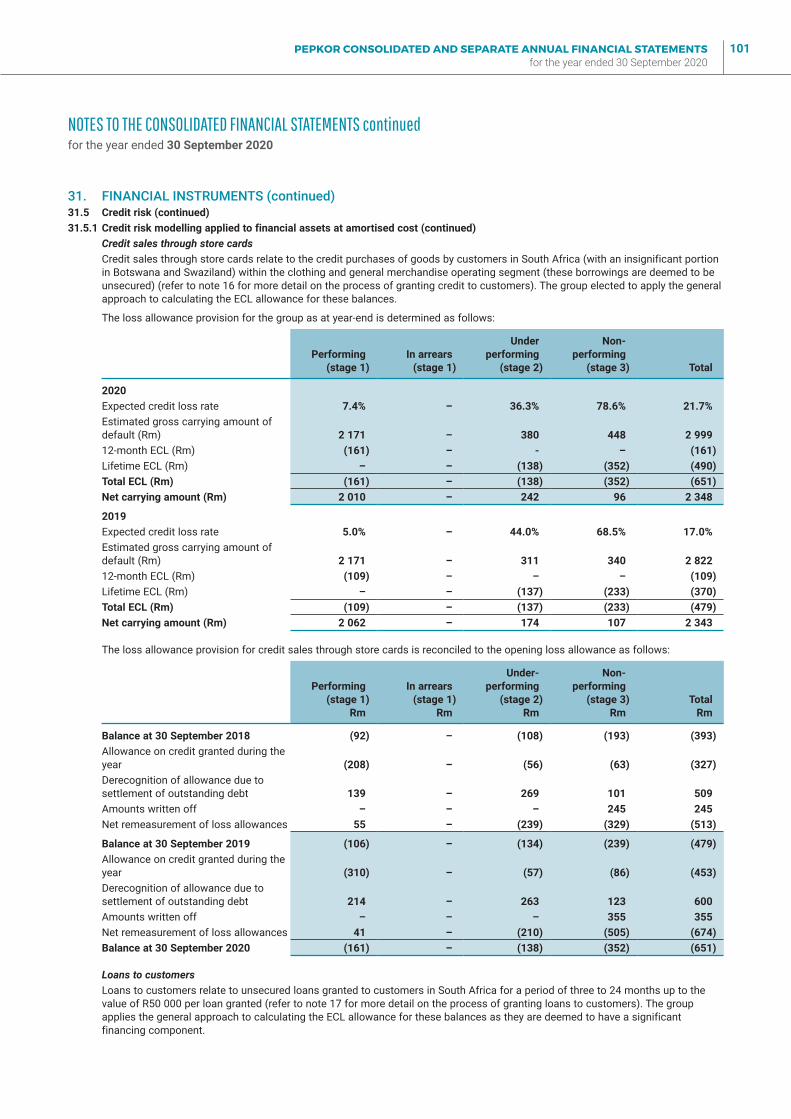
PEPKOR CONSOLIDATED AND SEPARATE ANNUAL FINANCIAL STATEMENTS for the year ended 30 September 2020
101
31. FINANCIAL INSTRUMENTS (continued)31.5 Credit risk (continued)31.5.1 Credit risk modelling applied to financial assets at amortised cost (continued)
Credit sales through store cardsCredit sales through store cards relate to the credit purchases of goods by customers in South Africa (with an insignificant portion in Botswana and Swaziland) within the clothing and general merchandise operating segment (these borrowings are deemed to be unsecured) (refer to note 16 for more detail on the process of granting credit to customers). The group elected to apply the general approach to calculating the ECL allowance for these balances.
The loss allowance provision for the group as at year-end is determined as follows:
Performing(stage 1)
In arrears(stage 1)
Underperforming
(stage 2)
Non-performing
(stage 3) Total
2020Expected credit loss rate 7.4% – 36.3% 78.6% 21.7%Estimated gross carrying amount of default (Rm) 2 171 – 380 448 2 999 12-month ECL (Rm) (161) – - – (161)Lifetime ECL (Rm) – – (138) (352) (490)Total ECL (Rm) (161) – (138) (352) (651)Net carrying amount (Rm) 2 010 – 242 96 2 348
2019Expected credit loss rate 5.0% – 44.0% 68.5% 17.0%Estimated gross carrying amount of default (Rm) 2 171 – 311 340 2 822 12-month ECL (Rm) (109) – – – (109)Lifetime ECL (Rm) – – (137) (233) (370)Total ECL (Rm) (109) – (137) (233) (479)Net carrying amount (Rm) 2 062 – 174 107 2 343
The loss allowance provision for credit sales through store cards is reconciled to the opening loss allowance as follows:
Performing(stage 1)
Rm
In arrears(stage 1)
Rm
Under-performing
(stage 2) Rm
Non-performing
(stage 3) Rm
Total Rm
Balance at 30 September 2018 (92) – (108) (193) (393)Allowance on credit granted during the year (208) – (56) (63) (327)Derecognition of allowance due to settlement of outstanding debt 139 – 269 101 509 Amounts written off – – – 245 245 Net remeasurement of loss allowances 55 – (239) (329) (513)
Balance at 30 September 2019 (106) – (134) (239) (479)Allowance on credit granted during the year (310) – (57) (86) (453)Derecognition of allowance due to settlement of outstanding debt 214 – 263 123 600 Amounts written off – – – 355 355 Net remeasurement of loss allowances 41 – (210) (505) (674)Balance at 30 September 2020 (161) – (138) (352) (651)
Loans to customersLoans to customers relate to unsecured loans granted to customers in South Africa for a period of three to 24 months up to the value of R50 000 per loan granted (refer to note 17 for more detail on the process of granting loans to customers). The group applies the general approach to calculating the ECL allowance for these balances as they are deemed to have a significant financing component.
NOTES TO THE CONSOLIDATED FINANCIAL STATEMENTS continuedfor the year ended 30 September 2020
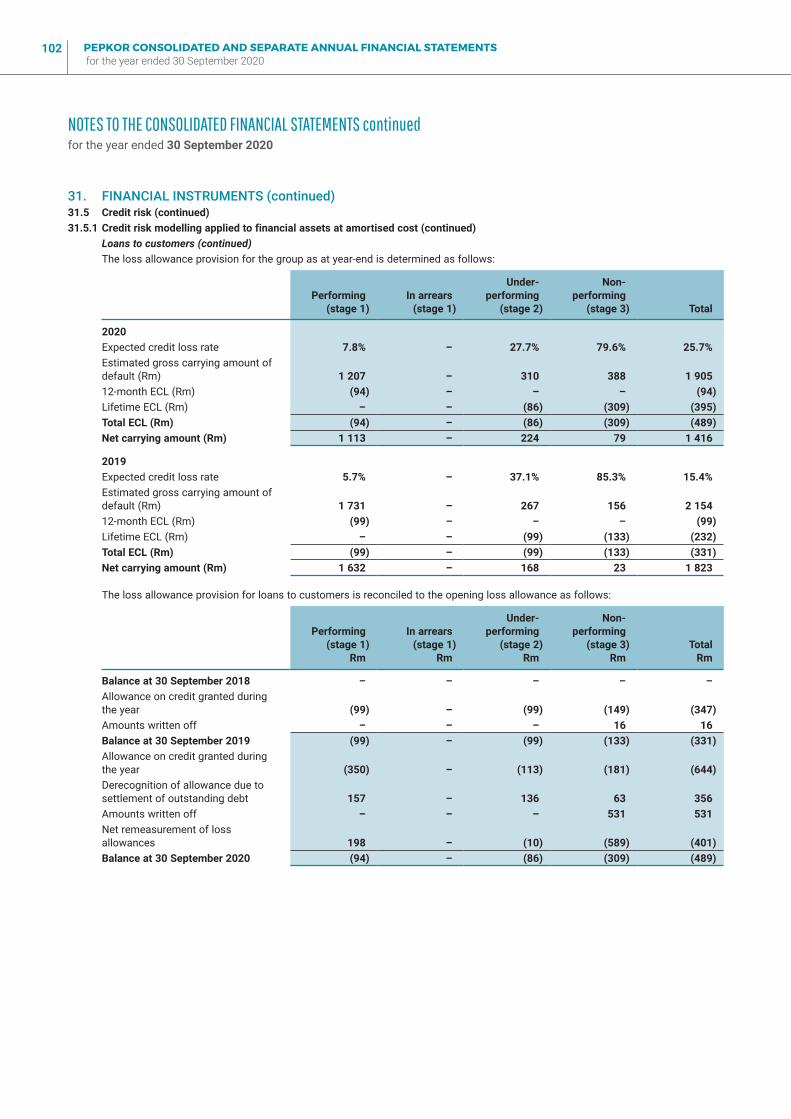
PEPKOR CONSOLIDATED AND SEPARATE ANNUAL FINANCIAL STATEMENTS for the year ended 30 September 2020
102
31. FINANCIAL INSTRUMENTS (continued)31.5 Credit risk (continued)31.5.1 Credit risk modelling applied to financial assets at amortised cost (continued)
Loans to customers (continued)The loss allowance provision for the group as at year-end is determined as follows:
Performing(stage 1)
In arrears(stage 1)
Under-performing
(stage 2)
Non-performing
(stage 3) Total
2020Expected credit loss rate 7.8% – 27.7% 79.6% 25.7%Estimated gross carrying amount of default (Rm) 1 207 – 310 388 1 905 12-month ECL (Rm) (94) – – – (94)Lifetime ECL (Rm) – – (86) (309) (395)Total ECL (Rm) (94) – (86) (309) (489)Net carrying amount (Rm) 1 113 – 224 79 1 416
2019Expected credit loss rate 5.7% – 37.1% 85.3% 15.4%Estimated gross carrying amount of default (Rm) 1 731 – 267 156 2 154 12-month ECL (Rm) (99) – – – (99)Lifetime ECL (Rm) – – (99) (133) (232)Total ECL (Rm) (99) – (99) (133) (331)Net carrying amount (Rm) 1 632 – 168 23 1 823
The loss allowance provision for loans to customers is reconciled to the opening loss allowance as follows:
Performing(stage 1)
Rm
In arrears(stage 1)
Rm
Under-performing
(stage 2) Rm
Non-performing
(stage 3) Rm
Total Rm
Balance at 30 September 2018 – – – – –Allowance on credit granted during the year (99) – (99) (149) (347)Amounts written off – – – 16 16 Balance at 30 September 2019 (99) – (99) (133) (331)Allowance on credit granted during the year (350) – (113) (181) (644)Derecognition of allowance due to settlement of outstanding debt 157 – 136 63 356 Amounts written off – – – 531 531 Net remeasurement of loss allowances 198 – (10) (589) (401)Balance at 30 September 2020 (94) – (86) (309) (489)
NOTES TO THE CONSOLIDATED FINANCIAL STATEMENTS continuedfor the year ended 30 September 2020
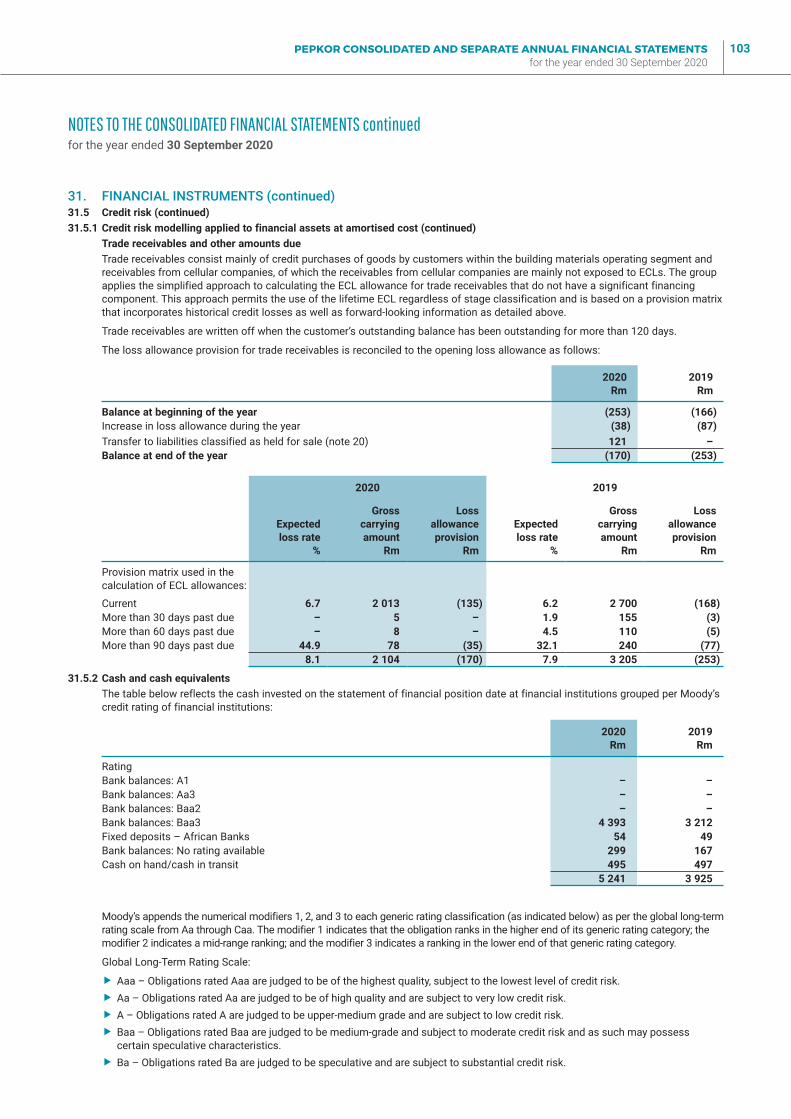
PEPKOR CONSOLIDATED AND SEPARATE ANNUAL FINANCIAL STATEMENTS for the year ended 30 September 2020
103
31. FINANCIAL INSTRUMENTS (continued)31.5 Credit risk (continued)31.5.1 Credit risk modelling applied to financial assets at amortised cost (continued)
Trade receivables and other amounts dueTrade receivables consist mainly of credit purchases of goods by customers within the building materials operating segment and receivables from cellular companies, of which the receivables from cellular companies are mainly not exposed to ECLs. The group applies the simplified approach to calculating the ECL allowance for trade receivables that do not have a significant financing component. This approach permits the use of the lifetime ECL regardless of stage classification and is based on a provision matrix that incorporates historical credit losses as well as forward-looking information as detailed above.
Trade receivables are written off when the customer’s outstanding balance has been outstanding for more than 120 days.
The loss allowance provision for trade receivables is reconciled to the opening loss allowance as follows:
2020Rm
2019Rm
Balance at beginning of the year (253) (166)Increase in loss allowance during the year (38) (87)Transfer to liabilities classified as held for sale (note 20) 121 –Balance at end of the year (170) (253)
2020 2019
Expected loss rate
%
Grosscarryingamount
Rm
Lossallowanceprovision
Rm
Expected loss rate
%
Grosscarryingamount
Rm
Lossallowanceprovision
Rm
Provision matrix used in the calculation of ECL allowances:
Current 6.7 2 013 (135) 6.2 2 700 (168)More than 30 days past due – 5 – 1.9 155 (3)More than 60 days past due – 8 – 4.5 110 (5)More than 90 days past due 44.9 78 (35) 32.1 240 (77)
8.1 2 104 (170) 7.9 3 205 (253)
31.5.2 Cash and cash equivalentsThe table below reflects the cash invested on the statement of financial position date at financial institutions grouped per Moody’s credit rating of financial institutions:
2020Rm
2019Rm
RatingBank balances: A1 – –Bank balances: Aa3 – –Bank balances: Baa2 – –Bank balances: Baa3 4 393 3 212 Fixed deposits – African Banks 54 49 Bank balances: No rating available 299 167 Cash on hand/cash in transit 495 497
5 241 3 925
Moody’s appends the numerical modifiers 1, 2, and 3 to each generic rating classification (as indicated below) as per the global long-term rating scale from Aa through Caa. The modifier 1 indicates that the obligation ranks in the higher end of its generic rating category; the modifier 2 indicates a mid-range ranking; and the modifier 3 indicates a ranking in the lower end of that generic rating category.
Global Long-Term Rating Scale:
� Aaa – Obligations rated Aaa are judged to be of the highest quality, subject to the lowest level of credit risk. � Aa – Obligations rated Aa are judged to be of high quality and are subject to very low credit risk. � A – Obligations rated A are judged to be upper-medium grade and are subject to low credit risk. � Baa – Obligations rated Baa are judged to be medium-grade and subject to moderate credit risk and as such may possess certain speculative characteristics.
� Ba – Obligations rated Ba are judged to be speculative and are subject to substantial credit risk.
NOTES TO THE CONSOLIDATED FINANCIAL STATEMENTS continuedfor the year ended 30 September 2020
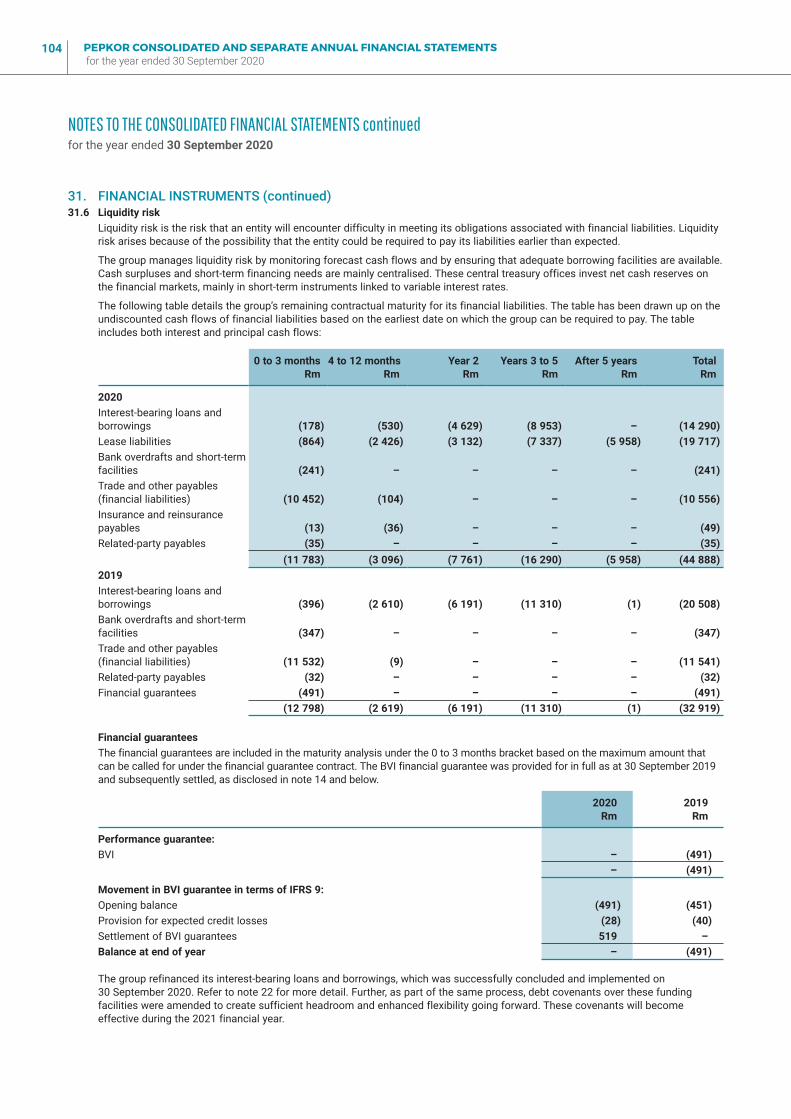
PEPKOR CONSOLIDATED AND SEPARATE ANNUAL FINANCIAL STATEMENTS for the year ended 30 September 2020
104
31. FINANCIAL INSTRUMENTS (continued)31.6 Liquidity risk
Liquidity risk is the risk that an entity will encounter difficulty in meeting its obligations associated with financial liabilities. Liquidity risk arises because of the possibility that the entity could be required to pay its liabilities earlier than expected.
The group manages liquidity risk by monitoring forecast cash flows and by ensuring that adequate borrowing facilities are available. Cash surpluses and short-term financing needs are mainly centralised. These central treasury offices invest net cash reserves on the financial markets, mainly in short-term instruments linked to variable interest rates.
The following table details the group’s remaining contractual maturity for its financial liabilities. The table has been drawn up on the undiscounted cash flows of financial liabilities based on the earliest date on which the group can be required to pay. The table includes both interest and principal cash flows:
0 to 3 monthsRm
4 to 12 monthsRm
Year 2Rm
Years 3 to 5Rm
After 5 yearsRm
TotalRm
2020Interest-bearing loans and borrowings (178) (530) (4 629) (8 953) – (14 290)Lease liabilities (864) (2 426) (3 132) (7 337) (5 958) (19 717)Bank overdrafts and short-term facilities (241) – – – – (241)Trade and other payables (financial liabilities) (10 452) (104) – – – (10 556)Insurance and reinsurance payables (13) (36) – – – (49)Related-party payables (35) – – – – (35)
(11 783) (3 096) (7 761) (16 290) (5 958) (44 888)2019Interest-bearing loans and borrowings (396) (2 610) (6 191) (11 310) (1) (20 508)Bank overdrafts and short-term facilities (347) – – – – (347)Trade and other payables (financial liabilities) (11 532) (9) – – – (11 541)Related-party payables (32) – – – – (32)Financial guarantees (491) – – – – (491)
(12 798) (2 619) (6 191) (11 310) (1) (32 919)
Financial guaranteesThe financial guarantees are included in the maturity analysis under the 0 to 3 months bracket based on the maximum amount that can be called for under the financial guarantee contract. The BVI financial guarantee was provided for in full as at 30 September 2019 and subsequently settled, as disclosed in note 14 and below.
2020Rm
2019Rm
Performance guarantee:BVI – (491)
– (491)
Movement in BVI guarantee in terms of IFRS 9:Opening balance (491) (451)Provision for expected credit losses (28) (40)Settlement of BVI guarantees 519 –Balance at end of year – (491)
The group refinanced its interest-bearing loans and borrowings, which was successfully concluded and implemented on 30 September 2020. Refer to note 22 for more detail. Further, as part of the same process, debt covenants over these funding facilities were amended to create sufficient headroom and enhanced flexibility going forward. These covenants will become effective during the 2021 financial year.
NOTES TO THE CONSOLIDATED FINANCIAL STATEMENTS continuedfor the year ended 30 September 2020
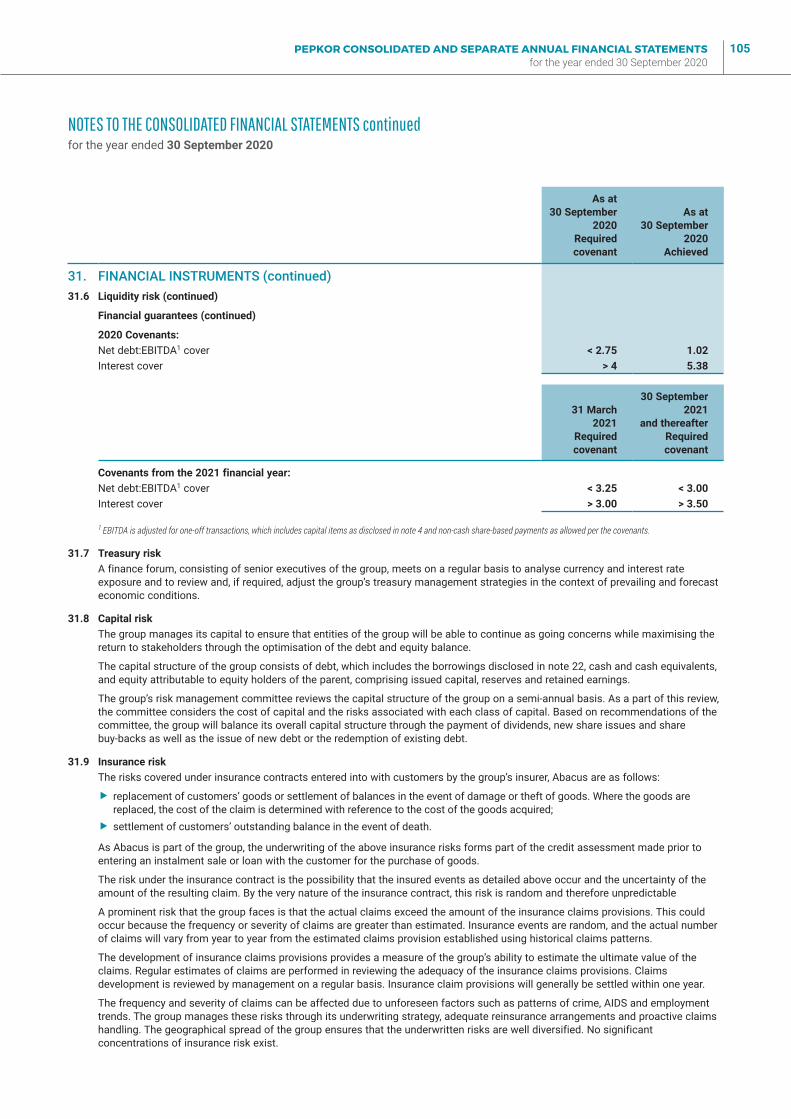
PEPKOR CONSOLIDATED AND SEPARATE ANNUAL FINANCIAL STATEMENTS for the year ended 30 September 2020
105
As at 30 September
2020Requiredcovenant
As at 30 September
2020Achieved
31. FINANCIAL INSTRUMENTS (continued)31.6 Liquidity risk (continued)
Financial guarantees (continued)
2020 Covenants:Net debt:EBITDA1 cover < 2.75 1.02Interest cover > 4 5.38
31 March2021
Requiredcovenant
30 September2021
and thereafterRequiredcovenant
Covenants from the 2021 financial year:Net debt:EBITDA1 cover < 3.25 < 3.00Interest cover > 3.00 > 3.50
1 EBITDA is adjusted for one-off transactions, which includes capital items as disclosed in note 4 and non-cash share-based payments as allowed per the covenants.
31.7 Treasury riskA finance forum, consisting of senior executives of the group, meets on a regular basis to analyse currency and interest rate exposure and to review and, if required, adjust the group’s treasury management strategies in the context of prevailing and forecast economic conditions.
31.8 Capital riskThe group manages its capital to ensure that entities of the group will be able to continue as going concerns while maximising the return to stakeholders through the optimisation of the debt and equity balance.
The capital structure of the group consists of debt, which includes the borrowings disclosed in note 22, cash and cash equivalents, and equity attributable to equity holders of the parent, comprising issued capital, reserves and retained earnings.
The group’s risk management committee reviews the capital structure of the group on a semi-annual basis. As a part of this review, the committee considers the cost of capital and the risks associated with each class of capital. Based on recommendations of the committee, the group will balance its overall capital structure through the payment of dividends, new share issues and share buy-backs as well as the issue of new debt or the redemption of existing debt.
31.9 Insurance riskThe risks covered under insurance contracts entered into with customers by the group’s insurer, Abacus are as follows:
� replacement of customers’ goods or settlement of balances in the event of damage or theft of goods. Where the goods are replaced, the cost of the claim is determined with reference to the cost of the goods acquired;
� settlement of customers’ outstanding balance in the event of death.
As Abacus is part of the group, the underwriting of the above insurance risks forms part of the credit assessment made prior to entering an instalment sale or loan with the customer for the purchase of goods.
The risk under the insurance contract is the possibility that the insured events as detailed above occur and the uncertainty of the amount of the resulting claim. By the very nature of the insurance contract, this risk is random and therefore unpredictable
A prominent risk that the group faces is that the actual claims exceed the amount of the insurance claims provisions. This could occur because the frequency or severity of claims are greater than estimated. Insurance events are random, and the actual number of claims will vary from year to year from the estimated claims provision established using historical claims patterns.
The development of insurance claims provisions provides a measure of the group’s ability to estimate the ultimate value of the claims. Regular estimates of claims are performed in reviewing the adequacy of the insurance claims provisions. Claims development is reviewed by management on a regular basis. Insurance claim provisions will generally be settled within one year.
The frequency and severity of claims can be affected due to unforeseen factors such as patterns of crime, AIDS and employment trends. The group manages these risks through its underwriting strategy, adequate reinsurance arrangements and proactive claims handling. The geographical spread of the group ensures that the underwritten risks are well diversified. No significant concentrations of insurance risk exist.
NOTES TO THE CONSOLIDATED FINANCIAL STATEMENTS continuedfor the year ended 30 September 2020
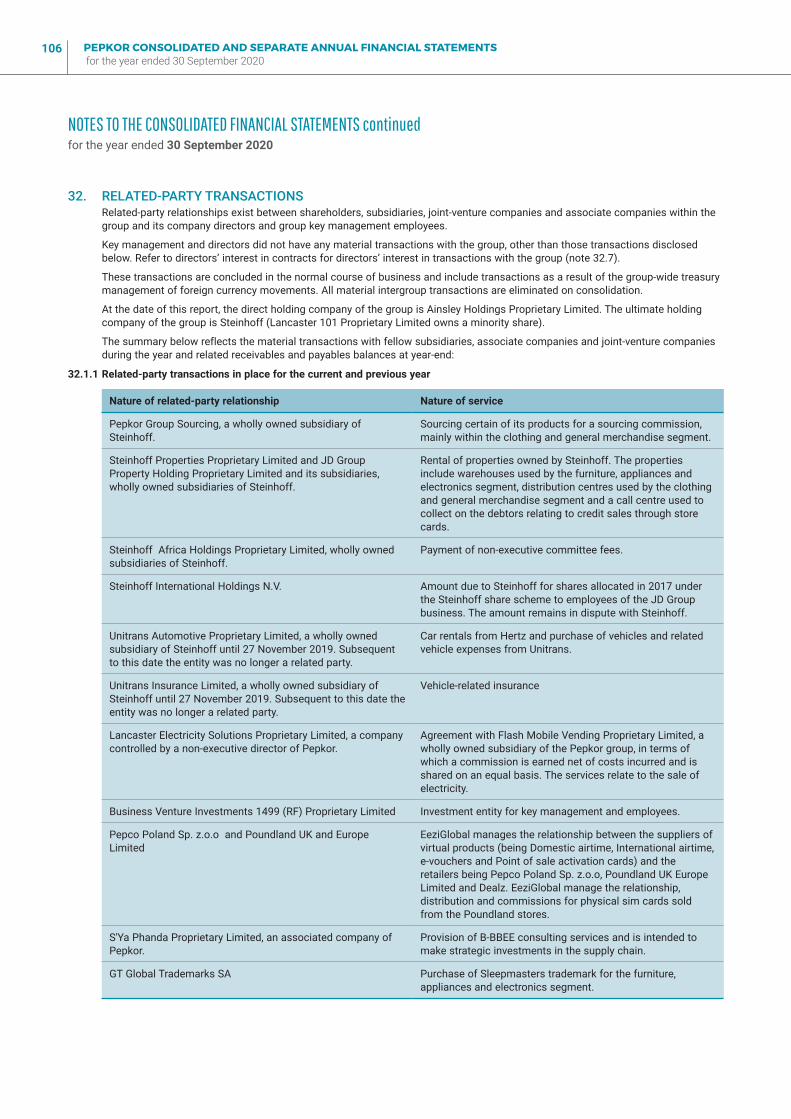
PEPKOR CONSOLIDATED AND SEPARATE ANNUAL FINANCIAL STATEMENTS for the year ended 30 September 2020
106
32. RELATED-PARTY TRANSACTIONSRelated-party relationships exist between shareholders, subsidiaries, joint-venture companies and associate companies within the group and its company directors and group key management employees.
Key management and directors did not have any material transactions with the group, other than those transactions disclosed below. Refer to directors’ interest in contracts for directors’ interest in transactions with the group (note 32.7).
These transactions are concluded in the normal course of business and include transactions as a result of the group-wide treasury management of foreign currency movements. All material intergroup transactions are eliminated on consolidation.
At the date of this report, the direct holding company of the group is Ainsley Holdings Proprietary Limited. The ultimate holding company of the group is Steinhoff (Lancaster 101 Proprietary Limited owns a minority share).
The summary below reflects the material transactions with fellow subsidiaries, associate companies and joint-venture companies during the year and related receivables and payables balances at year-end:
32.1.1 Related-party transactions in place for the current and previous year
Nature of related-party relationship Nature of service
Pepkor Group Sourcing, a wholly owned subsidiary of Steinhoff.
Sourcing certain of its products for a sourcing commission, mainly within the clothing and general merchandise segment.
Steinhoff Properties Proprietary Limited and JD Group Property Holding Proprietary Limited and its subsidiaries, wholly owned subsidiaries of Steinhoff.
Rental of properties owned by Steinhoff. The properties include warehouses used by the furniture, appliances and electronics segment, distribution centres used by the clothing and general merchandise segment and a call centre used to collect on the debtors relating to credit sales through store cards.
Steinhoff Africa Holdings Proprietary Limited, wholly owned subsidiaries of Steinhoff.
Payment of non-executive committee fees.
Steinhoff International Holdings N.V. Amount due to Steinhoff for shares allocated in 2017 under the Steinhoff share scheme to employees of the JD Group business. The amount remains in dispute with Steinhoff.
Unitrans Automotive Proprietary Limited, a wholly owned subsidiary of Steinhoff until 27 November 2019. Subsequent to this date the entity was no longer a related party.
Car rentals from Hertz and purchase of vehicles and related vehicle expenses from Unitrans.
Unitrans Insurance Limited, a wholly owned subsidiary of Steinhoff until 27 November 2019. Subsequent to this date the entity was no longer a related party.
Vehicle-related insurance
Lancaster Electricity Solutions Proprietary Limited, a company controlled by a non-executive director of Pepkor.
Agreement with Flash Mobile Vending Proprietary Limited, a wholly owned subsidiary of the Pepkor group, in terms of which a commission is earned net of costs incurred and is shared on an equal basis. The services relate to the sale of electricity.
Business Venture Investments 1499 (RF) Proprietary Limited Investment entity for key management and employees.
Pepco Poland Sp. z.o.o and Poundland UK and Europe Limited
EeziGlobal manages the relationship between the suppliers of virtual products (being Domestic airtime, International airtime, e-vouchers and Point of sale activation cards) and the retailers being Pepco Poland Sp. z.o.o, Poundland UK Europe Limited and Dealz. EeziGlobal manage the relationship, distribution and commissions for physical sim cards sold from the Poundland stores.
S'Ya Phanda Proprietary Limited, an associated company of Pepkor.
Provision of B-BBEE consulting services and is intended to make strategic investments in the supply chain.
GT Global Trademarks SA Purchase of Sleepmasters trademark for the furniture, appliances and electronics segment.
NOTES TO THE CONSOLIDATED FINANCIAL STATEMENTS continuedfor the year ended 30 September 2020
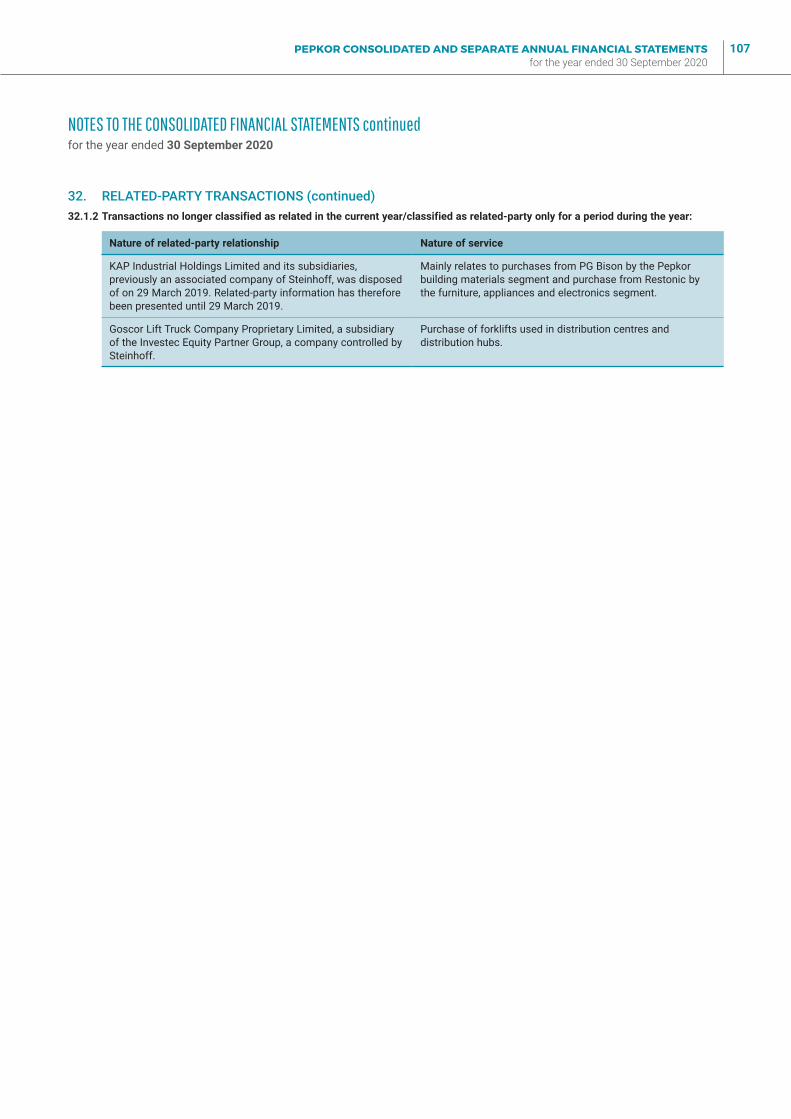
PEPKOR CONSOLIDATED AND SEPARATE ANNUAL FINANCIAL STATEMENTS for the year ended 30 September 2020
107
32. RELATED-PARTY TRANSACTIONS (continued)32.1.2 Transactions no longer classified as related in the current year/classified as related-party only for a period during the year:
Nature of related-party relationship Nature of service
KAP Industrial Holdings Limited and its subsidiaries, previously an associated company of Steinhoff, was disposed of on 29 March 2019. Related-party information has therefore been presented until 29 March 2019.
Mainly relates to purchases from PG Bison by the Pepkor building materials segment and purchase from Restonic by the furniture, appliances and electronics segment.
Goscor Lift Truck Company Proprietary Limited, a subsidiary of the Investec Equity Partner Group, a company controlled by Steinhoff.
Purchase of forklifts used in distribution centres and distribution hubs.
NOTES TO THE CONSOLIDATED FINANCIAL STATEMENTS continuedfor the year ended 30 September 2020
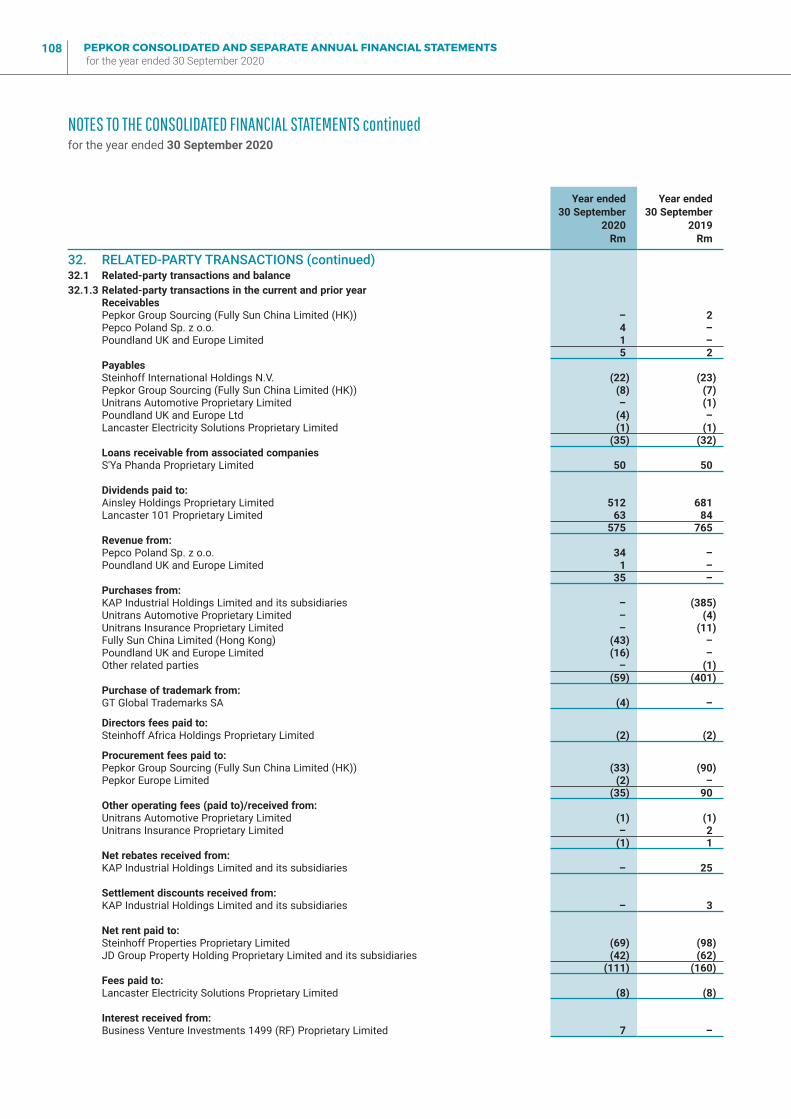
PEPKOR CONSOLIDATED AND SEPARATE ANNUAL FINANCIAL STATEMENTS for the year ended 30 September 2020
108
Year ended30 September
2020 Rm
Year ended30 September
2019 Rm
32. RELATED-PARTY TRANSACTIONS (continued)32.1 Related-party transactions and balance32.1.3 Related-party transactions in the current and prior year
ReceivablesPepkor Group Sourcing (Fully Sun China Limited (HK)) – 2 Pepco Poland Sp. z o.o. 4 –Poundland UK and Europe Limited 1 –
5 2 PayablesSteinhoff International Holdings N.V. (22) (23)Pepkor Group Sourcing (Fully Sun China Limited (HK)) (8) (7)Unitrans Automotive Proprietary Limited – (1)Poundland UK and Europe Ltd (4) –Lancaster Electricity Solutions Proprietary Limited (1) (1)
(35) (32)Loans receivable from associated companiesS'Ya Phanda Proprietary Limited 50 50
Dividends paid to:Ainsley Holdings Proprietary Limited 512 681 Lancaster 101 Proprietary Limited 63 84
575 765 Revenue from:Pepco Poland Sp. z o.o. 34 –Poundland UK and Europe Limited 1 –
35 –Purchases from:KAP Industrial Holdings Limited and its subsidiaries – (385)Unitrans Automotive Proprietary Limited – (4)Unitrans Insurance Proprietary Limited – (11)Fully Sun China Limited (Hong Kong) (43) –Poundland UK and Europe Limited (16) –Other related parties – (1)
(59) (401)Purchase of trademark from:GT Global Trademarks SA (4) –
Directors fees paid to:Steinhoff Africa Holdings Proprietary Limited (2) (2)
Procurement fees paid to:Pepkor Group Sourcing (Fully Sun China Limited (HK)) (33) (90)Pepkor Europe Limited (2) –
(35) 90Other operating fees (paid to)/received from:Unitrans Automotive Proprietary Limited (1) (1)Unitrans Insurance Proprietary Limited – 2
(1) 1Net rebates received from:KAP Industrial Holdings Limited and its subsidiaries – 25
Settlement discounts received from:KAP Industrial Holdings Limited and its subsidiaries – 3
Net rent paid to:Steinhoff Properties Proprietary Limited (69) (98)JD Group Property Holding Proprietary Limited and its subsidiaries (42) (62)
(111) (160)Fees paid to:Lancaster Electricity Solutions Proprietary Limited (8) (8)
Interest received from:Business Venture Investments 1499 (RF) Proprietary Limited 7 –
NOTES TO THE CONSOLIDATED FINANCIAL STATEMENTS continuedfor the year ended 30 September 2020
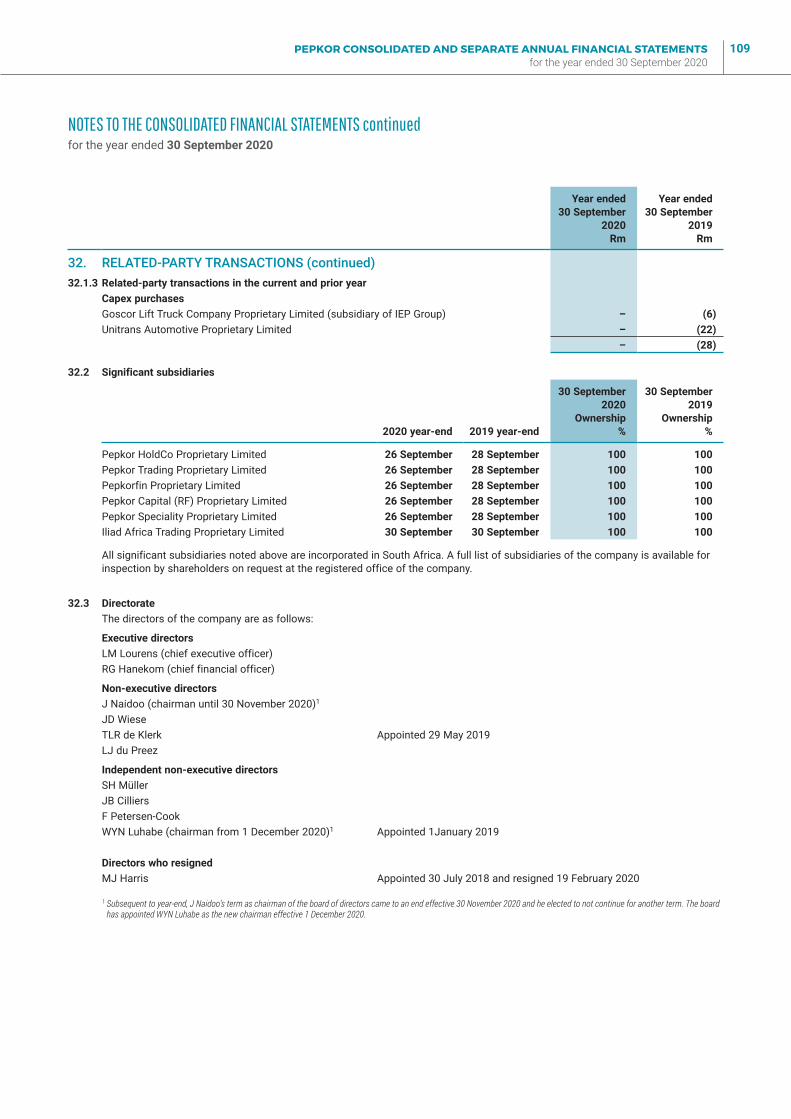
PEPKOR CONSOLIDATED AND SEPARATE ANNUAL FINANCIAL STATEMENTS for the year ended 30 September 2020
109
Year ended30 September
2020 Rm
Year ended30 September
2019 Rm
32. RELATED-PARTY TRANSACTIONS (continued)32.1.3 Related-party transactions in the current and prior year
Capex purchasesGoscor Lift Truck Company Proprietary Limited (subsidiary of IEP Group) – (6)Unitrans Automotive Proprietary Limited – (22)
– (28)
32.2 Significant subsidiaries
2020 year-end 2019 year-end
30 September2020
Ownership %
30 September 2019
Ownership %
Pepkor HoldCo Proprietary Limited 26 September 28 September 100 100 Pepkor Trading Proprietary Limited 26 September 28 September 100 100 Pepkorfin Proprietary Limited 26 September 28 September 100 100 Pepkor Capital (RF) Proprietary Limited 26 September 28 September 100 100 Pepkor Speciality Proprietary Limited 26 September 28 September 100 100 Iliad Africa Trading Proprietary Limited 30 September 30 September 100 100
All significant subsidiaries noted above are incorporated in South Africa. A full list of subsidiaries of the company is available for inspection by shareholders on request at the registered office of the company.
32.3 DirectorateThe directors of the company are as follows:
Executive directorsLM Lourens (chief executive officer)RG Hanekom (chief financial officer)
Non-executive directorsJ Naidoo (chairman until 30 November 2020)1
JD WieseTLR de Klerk Appointed 29 May 2019LJ du Preez
Independent non-executive directorsSH MüllerJB CilliersF Petersen-CookWYN Luhabe (chairman from 1 December 2020)1 Appointed 1January 2019
Directors who resignedMJ Harris Appointed 30 July 2018 and resigned 19 February 2020
1 Subsequent to year-end, J Naidoo’s term as chairman of the board of directors came to an end effective 30 November 2020 and he elected to not continue for another term. The board has appointed WYN Luhabe as the new chairman effective 1 December 2020.
NOTES TO THE CONSOLIDATED FINANCIAL STATEMENTS continuedfor the year ended 30 September 2020
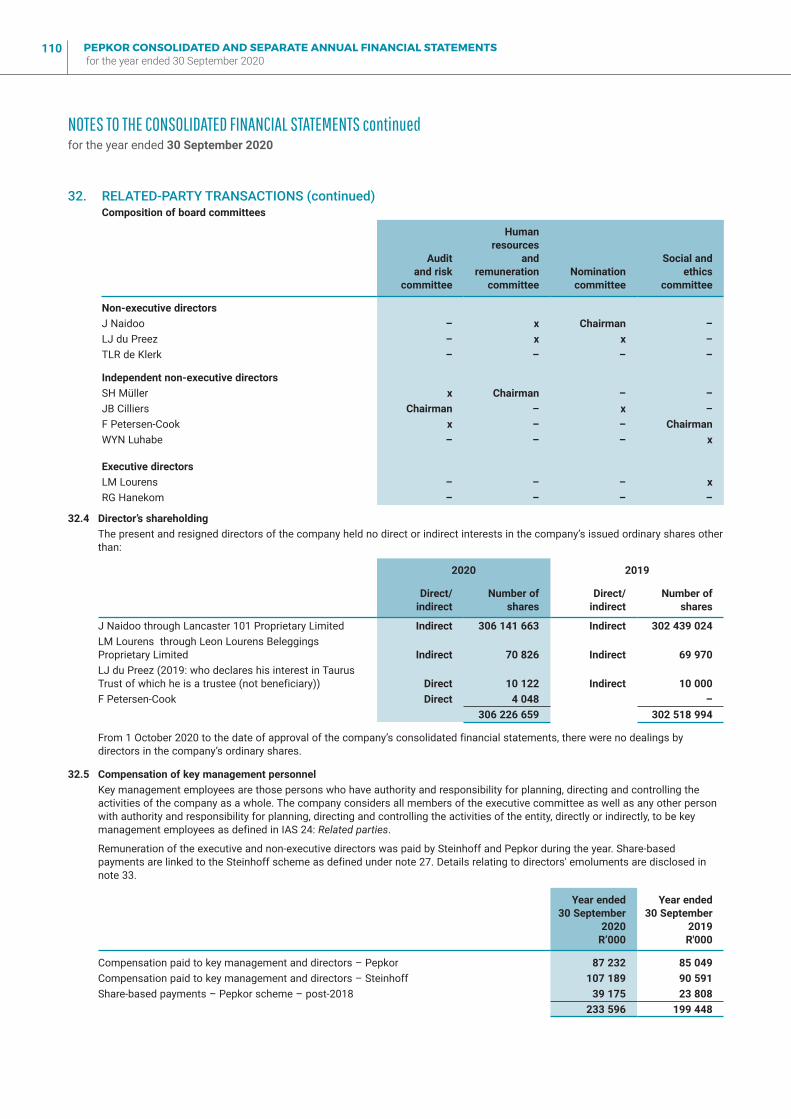
PEPKOR CONSOLIDATED AND SEPARATE ANNUAL FINANCIAL STATEMENTS for the year ended 30 September 2020
110
32. RELATED-PARTY TRANSACTIONS (continued)Composition of board committees
Audit and risk
committee
Human resources
and remuneration
committee Nomination
committee
Social andethics
committee
Non-executive directorsJ Naidoo – x Chairman –LJ du Preez – x x –TLR de Klerk – – – –
Independent non-executive directorsSH Müller x Chairman – –JB Cilliers Chairman – x –F Petersen-Cook x – – Chairman WYN Luhabe – – – x
Executive directorsLM Lourens – – – x RG Hanekom – – – –
32.4 Director’s shareholdingThe present and resigned directors of the company held no direct or indirect interests in the company’s issued ordinary shares other than:
2020 2019
Direct/indirect
Number ofshares
Direct/indirect
Number ofshares
J Naidoo through Lancaster 101 Proprietary Limited Indirect 306 141 663 Indirect 302 439 024 LM Lourens through Leon Lourens Beleggings Proprietary Limited Indirect 70 826 Indirect 69 970 LJ du Preez (2019: who declares his interest in Taurus Trust of which he is a trustee (not beneficiary)) Direct 10 122 Indirect 10 000 F Petersen-Cook Direct 4 048 –
306 226 659 302 518 994
From 1 October 2020 to the date of approval of the company’s consolidated financial statements, there were no dealings by directors in the company’s ordinary shares.
32.5 Compensation of key management personnelKey management employees are those persons who have authority and responsibility for planning, directing and controlling the activities of the company as a whole. The company considers all members of the executive committee as well as any other person with authority and responsibility for planning, directing and controlling the activities of the entity, directly or indirectly, to be key management employees as defined in IAS 24: Related parties.
Remuneration of the executive and non-executive directors was paid by Steinhoff and Pepkor during the year. Share-based payments are linked to the Steinhoff scheme as defined under note 27. Details relating to directors' emoluments are disclosed in note 33.
Year ended 30 September
2020 R’000
Year ended 30 September
2019 R'000
Compensation paid to key management and directors – Pepkor 87 232 85 049 Compensation paid to key management and directors – Steinhoff 107 189 90 591 Share-based payments – Pepkor scheme – post-2018 39 175 23 808
233 596 199 448
NOTES TO THE CONSOLIDATED FINANCIAL STATEMENTS continuedfor the year ended 30 September 2020
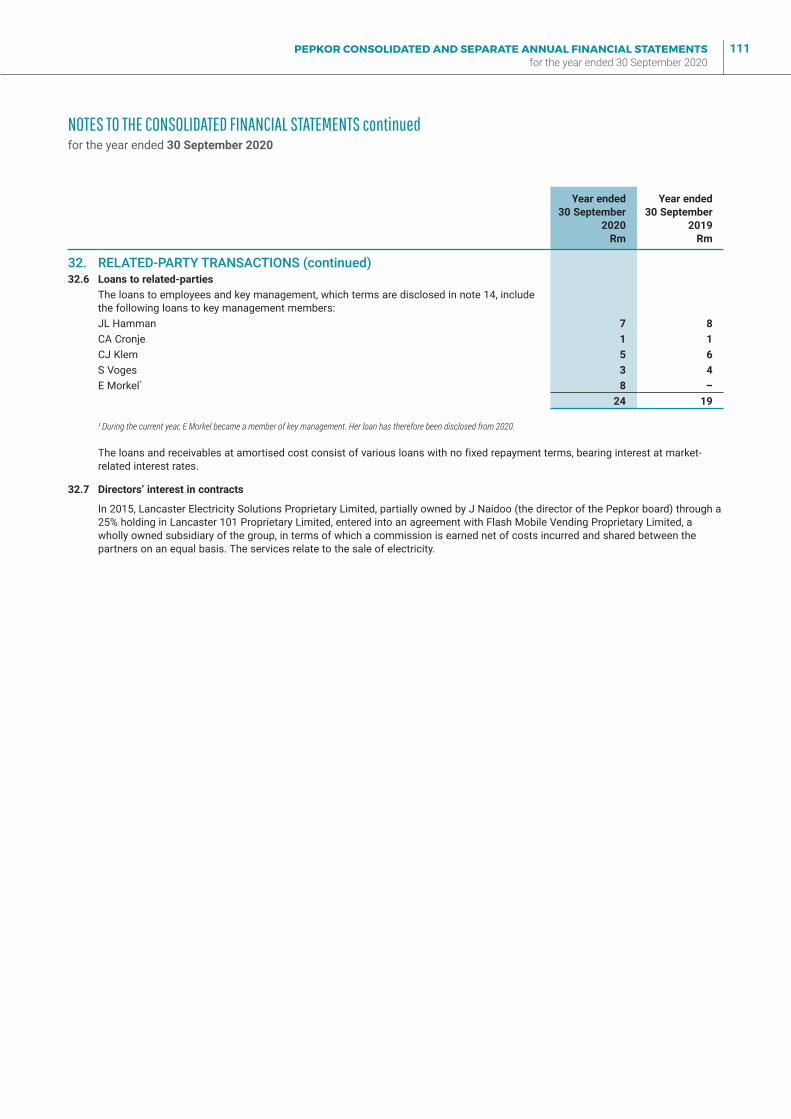
PEPKOR CONSOLIDATED AND SEPARATE ANNUAL FINANCIAL STATEMENTS for the year ended 30 September 2020
111
Year ended 30 September
2020 Rm
Year ended 30 September
2019 Rm
32. RELATED-PARTY TRANSACTIONS (continued)32.6 Loans to related-parties
The loans to employees and key management, which terms are disclosed in note 14, include the following loans to key management members:JL Hamman 7 8 CA Cronje 1 1 CJ Klem 5 6 S Voges 3 4 E Morkel¹ 8 –
24 19
¹ During the current year, E Morkel became a member of key management. Her loan has therefore been disclosed from 2020.
The loans and receivables at amortised cost consist of various loans with no fixed repayment terms, bearing interest at market-related interest rates.
32.7 Directors’ interest in contracts
In 2015, Lancaster Electricity Solutions Proprietary Limited, partially owned by J Naidoo (the director of the Pepkor board) through a 25% holding in Lancaster 101 Proprietary Limited, entered into an agreement with Flash Mobile Vending Proprietary Limited, a wholly owned subsidiary of the group, in terms of which a commission is earned net of costs incurred and shared between the partners on an equal basis. The services relate to the sale of electricity.
NOTES TO THE CONSOLIDATED FINANCIAL STATEMENTS continuedfor the year ended 30 September 2020
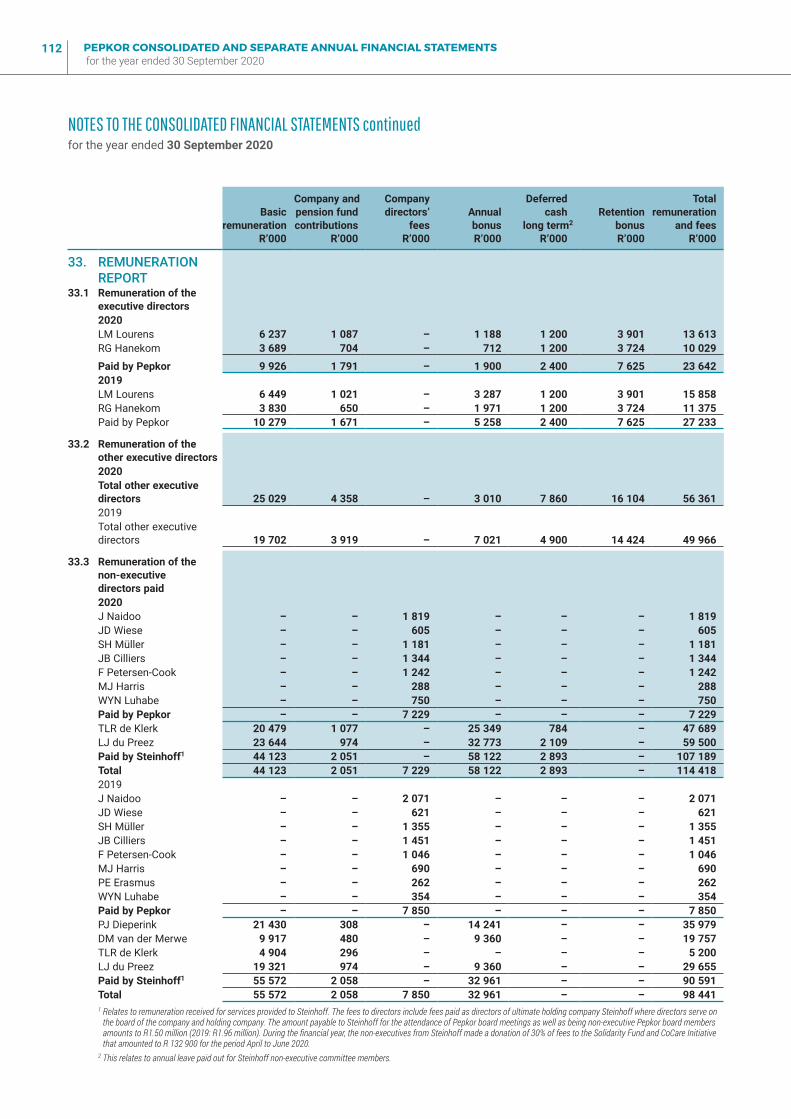
PEPKOR CONSOLIDATED AND SEPARATE ANNUAL FINANCIAL STATEMENTS for the year ended 30 September 2020
112
Basicremuneration
R’000
Company andpension fundcontributions
R’000
Companydirectors’
feesR’000
AnnualbonusR’000
Deferredcash
long term2
R’000
RetentionbonusR’000
Totalremuneration
and feesR’000
33. REMUNERATION REPORT
33.1 Remuneration of the executive directors2020LM Lourens 6 237 1 087 – 1 188 1 200 3 901 13 613 RG Hanekom 3 689 704 – 712 1 200 3 724 10 029
Paid by Pepkor 9 926 1 791 – 1 900 2 400 7 625 23 642 2019LM Lourens 6 449 1 021 – 3 287 1 200 3 901 15 858 RG Hanekom 3 830 650 – 1 971 1 200 3 724 11 375 Paid by Pepkor 10 279 1 671 – 5 258 2 400 7 625 27 233
33.2 Remuneration of the other executive directors2020Total other executive directors 25 029 4 358 – 3 010 7 860 16 104 56 361 2019 Total other executive directors 19 702 3 919 – 7 021 4 900 14 424 49 966
33.3 Remuneration of the non-executive directors paid 2020J Naidoo – – 1 819 – – – 1 819 JD Wiese – – 605 – – – 605 SH Müller – – 1 181 – – – 1 181 JB Cilliers – – 1 344 – – – 1 344 F Petersen-Cook – – 1 242 – – – 1 242 MJ Harris – – 288 – – – 288 WYN Luhabe – – 750 – – – 750 Paid by Pepkor – – 7 229 – – – 7 229 TLR de Klerk 20 479 1 077 – 25 349 784 – 47 689 LJ du Preez 23 644 974 – 32 773 2 109 – 59 500 Paid by Steinhoff1 44 123 2 051 – 58 122 2 893 – 107 189 Total 44 123 2 051 7 229 58 122 2 893 – 114 418 2019J Naidoo – – 2 071 – – – 2 071 JD Wiese – – 621 – – – 621 SH Müller – – 1 355 – – – 1 355 JB Cilliers – – 1 451 – – – 1 451 F Petersen-Cook – – 1 046 – – – 1 046 MJ Harris – – 690 – – – 690 PE Erasmus – – 262 – – – 262 WYN Luhabe – – 354 – – – 354 Paid by Pepkor – – 7 850 – – – 7 850 PJ Dieperink 21 430 308 – 14 241 – – 35 979 DM van der Merwe 9 917 480 – 9 360 – – 19 757 TLR de Klerk 4 904 296 – – – – 5 200 LJ du Preez 19 321 974 – 9 360 – – 29 655 Paid by Steinhoff1 55 572 2 058 – 32 961 – – 90 591 Total 55 572 2 058 7 850 32 961 – – 98 441 1 Relates to remuneration received for services provided to Steinhoff. The fees to directors include fees paid as directors of ultimate holding company Steinhoff where directors serve on
the board of the company and holding company. The amount payable to Steinhoff for the attendance of Pepkor board meetings as well as being non-executive Pepkor board members amounts to R1.50 million (2019: R1.96 million). During the financial year, the non-executives from Steinhoff made a donation of 30% of fees to the Solidarity Fund and CoCare Initiative that amounted to R 132 900 for the period April to June 2020.
2 This relates to annual leave paid out for Steinhoff non-executive committee members.
NOTES TO THE CONSOLIDATED FINANCIAL STATEMENTS continuedfor the year ended 30 September 2020
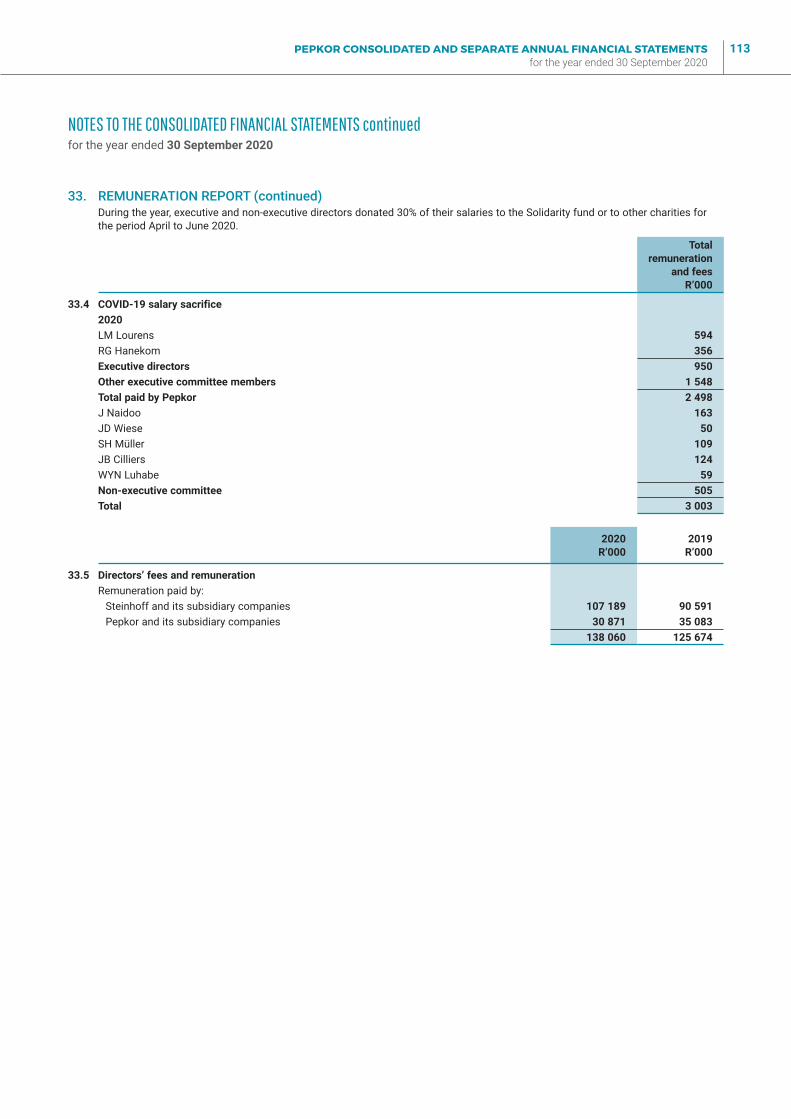
PEPKOR CONSOLIDATED AND SEPARATE ANNUAL FINANCIAL STATEMENTS for the year ended 30 September 2020
113
33. REMUNERATION REPORT (continued)During the year, executive and non-executive directors donated 30% of their salaries to the Solidarity fund or to other charities for the period April to June 2020.
Totalremuneration
and feesR’000
33.4 COVID-19 salary sacrifice2020LM Lourens 594 RG Hanekom 356 Executive directors 950 Other executive committee members 1 548 Total paid by Pepkor 2 498 J Naidoo 163 JD Wiese 50 SH Müller 109 JB Cilliers 124 WYN Luhabe 59 Non-executive committee 505 Total 3 003
2020R’000
2019R’000
33.5 Directors’ fees and remunerationRemuneration paid by:
Steinhoff and its subsidiary companies 107 189 90 591 Pepkor and its subsidiary companies 30 871 35 083
138 060 125 674
NOTES TO THE CONSOLIDATED FINANCIAL STATEMENTS continuedfor the year ended 30 September 2020
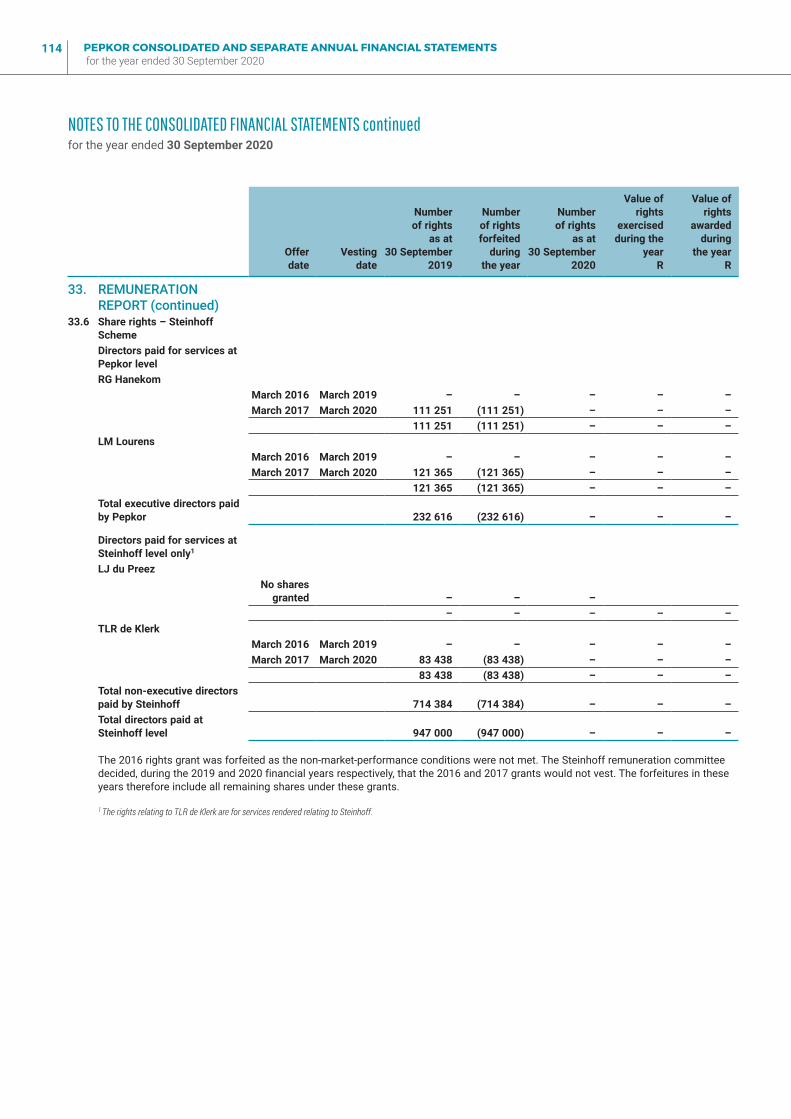
PEPKOR CONSOLIDATED AND SEPARATE ANNUAL FINANCIAL STATEMENTS for the year ended 30 September 2020
114
Offer date
Vestingdate
Number of rights
as at 30 September
2019
Number of rightsforfeited
duringthe year
Numberof rights
as at 30 September
2020
Value ofrights
exercisedduring the
yearR
Value ofrights
awardedduring
the year R
33. REMUNERATION REPORT (continued)
33.6 Share rights – Steinhoff SchemeDirectors paid for services at Pepkor levelRG Hanekom
March 2016 March 2019 – – – – –March 2017 March 2020 111 251 (111 251) – – –
111 251 (111 251) – – –LM Lourens
March 2016 March 2019 – – – – –March 2017 March 2020 121 365 (121 365) – – –
121 365 (121 365) – – –Total executive directors paid by Pepkor 232 616 (232 616) – – –
Directors paid for services at Steinhoff level only1
LJ du PreezNo shares
granted – – –– – – – –
TLR de KlerkMarch 2016 March 2019 – – – – –March 2017 March 2020 83 438 (83 438) – – –
83 438 (83 438) – – –Total non-executive directors paid by Steinhoff 714 384 (714 384) – – –Total directors paid at Steinhoff level 947 000 (947 000) – – –
The 2016 rights grant was forfeited as the non-market-performance conditions were not met. The Steinhoff remuneration committee decided, during the 2019 and 2020 financial years respectively, that the 2016 and 2017 grants would not vest. The forfeitures in these years therefore include all remaining shares under these grants.
1 The rights relating to TLR de Klerk are for services rendered relating to Steinhoff.
NOTES TO THE CONSOLIDATED FINANCIAL STATEMENTS continuedfor the year ended 30 September 2020
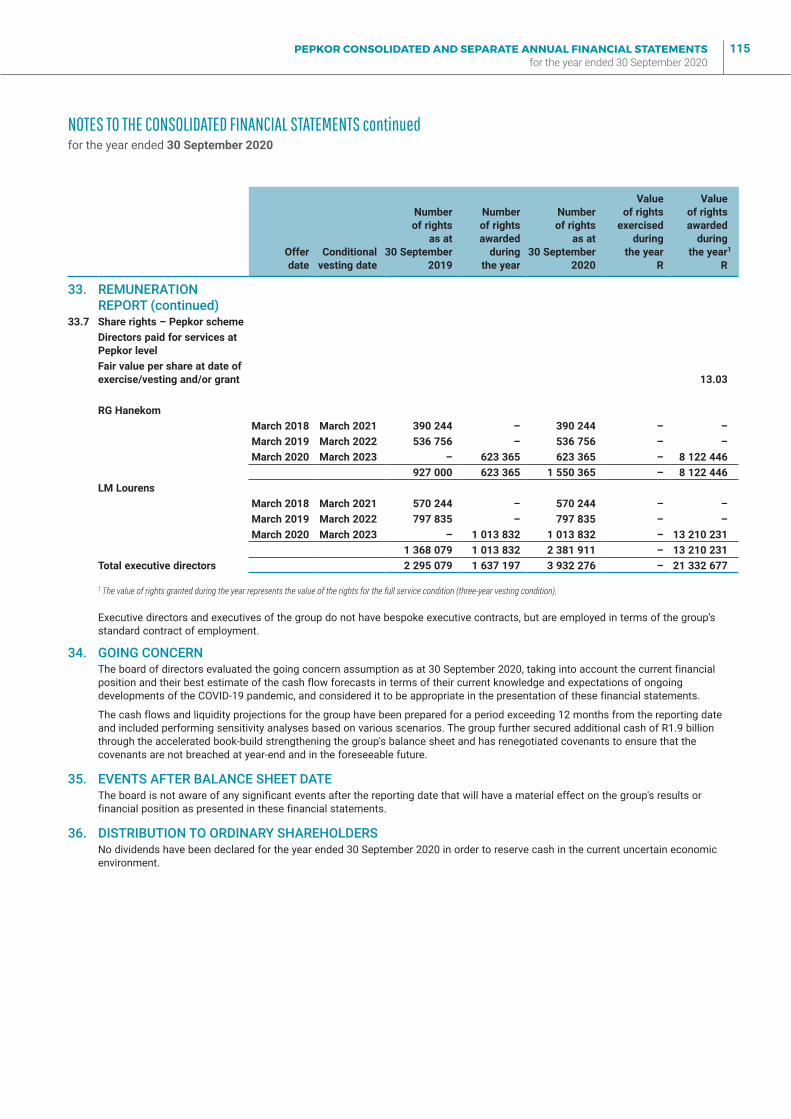
PEPKOR CONSOLIDATED AND SEPARATE ANNUAL FINANCIAL STATEMENTS for the year ended 30 September 2020
115
Offerdate
Conditionalvesting date
Number of rights
as at 30 September
2019
Number of rightsawarded
during the year
Number of rights
as at30 September
2020
Value of rights
exercisedduring
the year R
Value of rightsawarded
duringthe year1
R
33. REMUNERATION REPORT (continued)
33.7 Share rights – Pepkor schemeDirectors paid for services at Pepkor levelFair value per share at date of exercise/vesting and/or grant 13.03
RG HanekomMarch 2018 March 2021 390 244 – 390 244 – –March 2019 March 2022 536 756 – 536 756 – –March 2020 March 2023 – 623 365 623 365 – 8 122 446
927 000 623 365 1 550 365 – 8 122 446 LM Lourens
March 2018 March 2021 570 244 – 570 244 – –March 2019 March 2022 797 835 – 797 835 – –March 2020 March 2023 – 1 013 832 1 013 832 – 13 210 231
1 368 079 1 013 832 2 381 911 – 13 210 231 Total executive directors 2 295 079 1 637 197 3 932 276 – 21 332 677
1 The value of rights granted during the year represents the value of the rights for the full service condition (three-year vesting condition).
Executive directors and executives of the group do not have bespoke executive contracts, but are employed in terms of the group’s standard contract of employment.
34. GOING CONCERNThe board of directors evaluated the going concern assumption as at 30 September 2020, taking into account the current financial position and their best estimate of the cash flow forecasts in terms of their current knowledge and expectations of ongoing developments of the COVID-19 pandemic, and considered it to be appropriate in the presentation of these financial statements.
The cash flows and liquidity projections for the group have been prepared for a period exceeding 12 months from the reporting date and included performing sensitivity analyses based on various scenarios. The group further secured additional cash of R1.9 billion through the accelerated book-build strengthening the group's balance sheet and has renegotiated covenants to ensure that the covenants are not breached at year-end and in the foreseeable future.
35. EVENTS AFTER BALANCE SHEET DATEThe board is not aware of any significant events after the reporting date that will have a material effect on the group's results or financial position as presented in these financial statements.
36. DISTRIBUTION TO ORDINARY SHAREHOLDERSNo dividends have been declared for the year ended 30 September 2020 in order to reserve cash in the current uncertain economic environment.
NOTES TO THE CONSOLIDATED FINANCIAL STATEMENTS continuedfor the year ended 30 September 2020
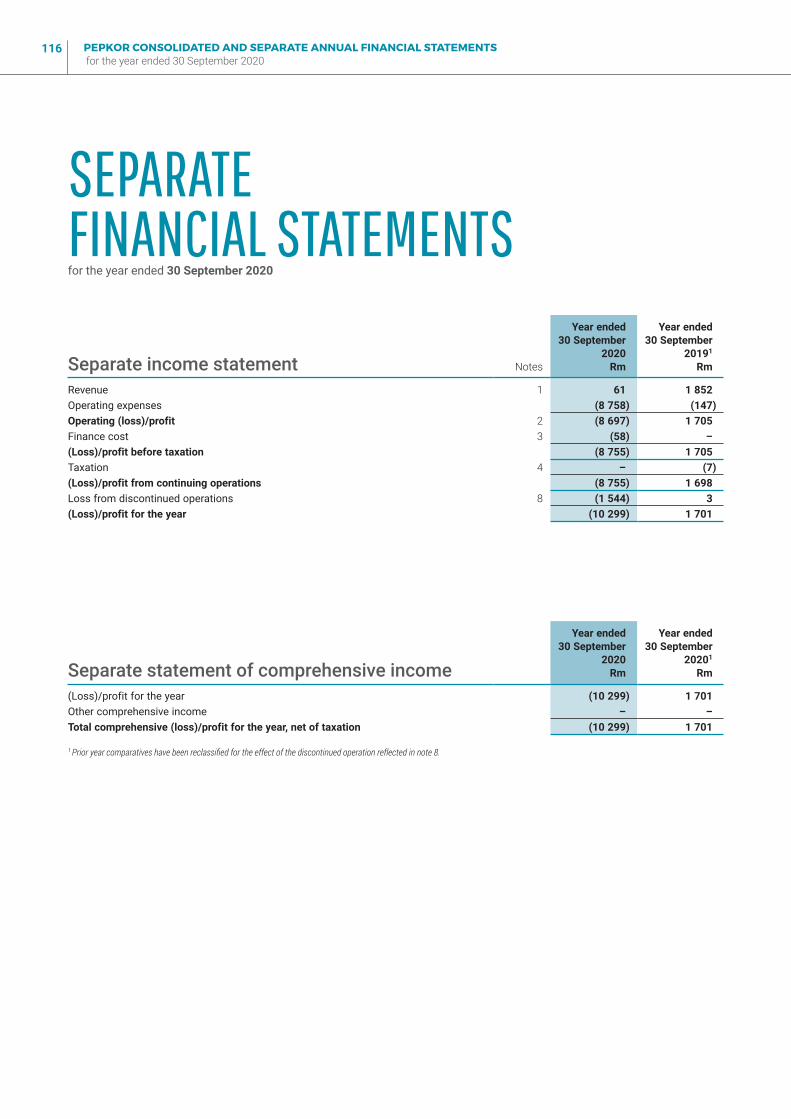
PEPKOR CONSOLIDATED AND SEPARATE ANNUAL FINANCIAL STATEMENTS for the year ended 30 September 2020
116
Separate income statement Notes
Year ended30 September
2020Rm
Year ended30 September
20191
Rm
Revenue 1 61 1 852 Operating expenses (8 758) (147)Operating (loss)/profit 2 (8 697) 1 705 Finance cost 3 (58) –(Loss)/profit before taxation (8 755) 1 705 Taxation 4 – (7)(Loss)/profit from continuing operations (8 755) 1 698 Loss from discontinued operations 8 (1 544) 3 (Loss)/profit for the year (10 299) 1 701
Separate statement of comprehensive income
Year ended30 September
2020Rm
Year ended30 September
20201
Rm
(Loss)/profit for the year (10 299) 1 701 Other comprehensive income – –Total comprehensive (loss)/profit for the year, net of taxation (10 299) 1 701
1 Prior year comparatives have been reclassified for the effect of the discontinued operation reflected in note 8.
SEPARATE FINANCIAL STATEMENTSfor the year ended 30 September 2020
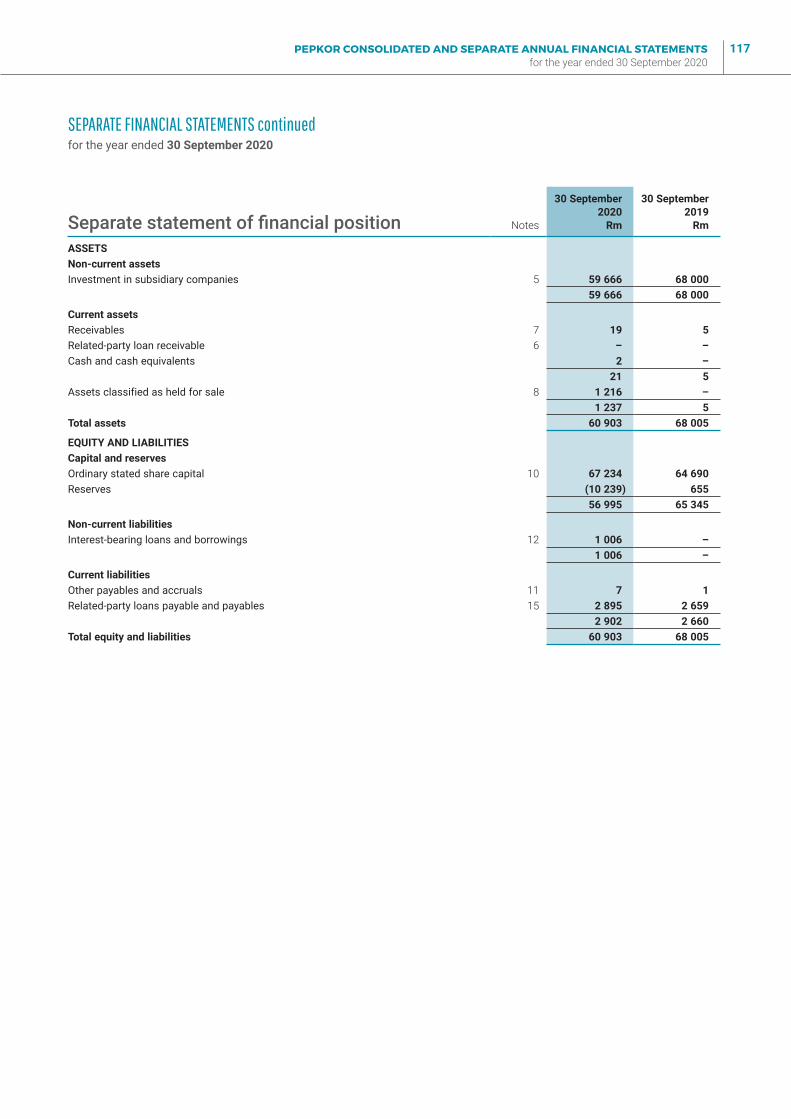
PEPKOR CONSOLIDATED AND SEPARATE ANNUAL FINANCIAL STATEMENTS for the year ended 30 September 2020
117
SEPARATE FINANCIAL STATEMENTS continuedfor the year ended 30 September 2020
Separate statement of financial position Notes
30 September2020
Rm
30 September2019
Rm
ASSETSNon-current assetsInvestment in subsidiary companies 5 59 666 68 000
59 666 68 000
Current assetsReceivables 7 19 5 Related-party loan receivable 6 – –Cash and cash equivalents 2 –
21 5 Assets classified as held for sale 8 1 216 –
1 237 5 Total assets 60 903 68 005
EQUITY AND LIABILITIESCapital and reservesOrdinary stated share capital 10 67 234 64 690 Reserves (10 239) 655
56 995 65 345
Non-current liabilitiesInterest-bearing loans and borrowings 12 1 006 –
1 006 –
Current liabilitiesOther payables and accruals 11 7 1 Related-party loans payable and payables 15 2 895 2 659
2 902 2 660 Total equity and liabilities 60 903 68 005
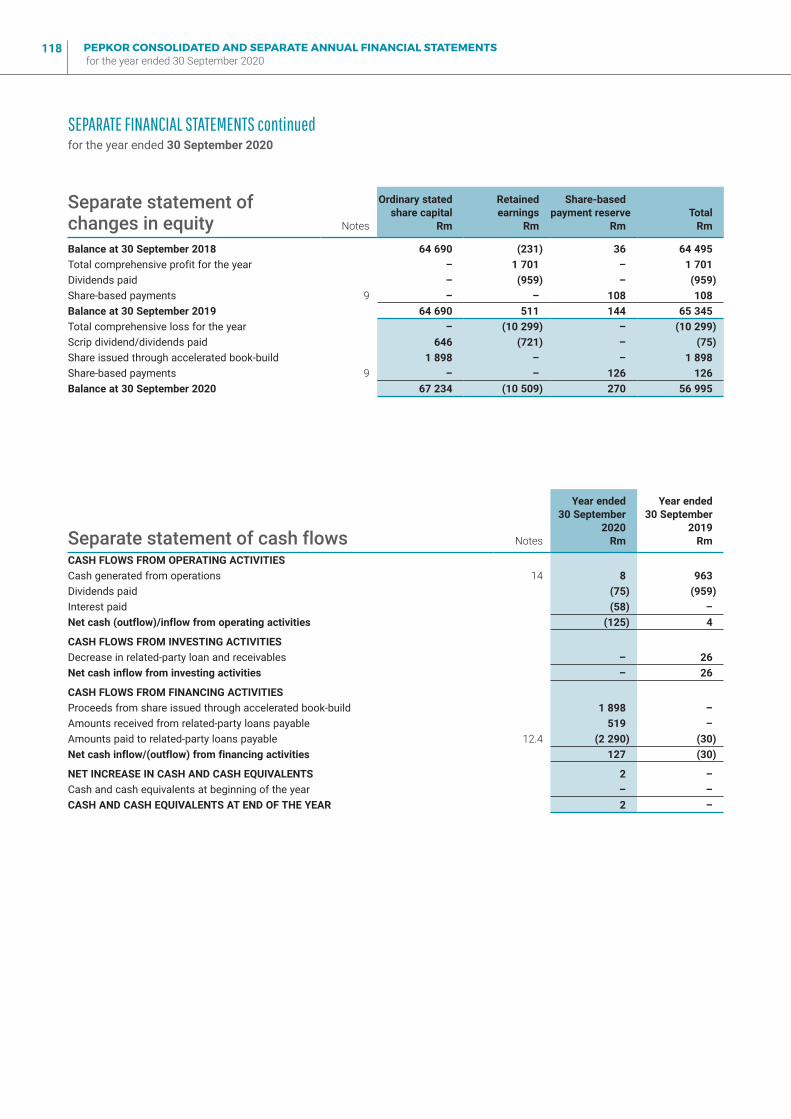
PEPKOR CONSOLIDATED AND SEPARATE ANNUAL FINANCIAL STATEMENTS for the year ended 30 September 2020
118
SEPARATE FINANCIAL STATEMENTS continuedfor the year ended 30 September 2020
Separate statement of changes in equity Notes
Ordinary stated share capital
Rm
Retainedearnings
Rm
Share-based payment reserve
RmTotal
Rm
Balance at 30 September 2018 64 690 (231) 36 64 495 Total comprehensive profit for the year – 1 701 – 1 701 Dividends paid – (959) – (959)Share-based payments 9 – – 108 108 Balance at 30 September 2019 64 690 511 144 65 345 Total comprehensive loss for the year – (10 299) – (10 299)Scrip dividend/dividends paid 646 (721) – (75)Share issued through accelerated book-build 1 898 – – 1 898 Share-based payments 9 – – 126 126 Balance at 30 September 2020 67 234 (10 509) 270 56 995
Separate statement of cash flows Notes
Year ended30 September
2020Rm
Year ended30 September
2019Rm
CASH FLOWS FROM OPERATING ACTIVITIESCash generated from operations 14 8 963 Dividends paid (75) (959)Interest paid (58) –Net cash (outflow)/inflow from operating activities (125) 4
CASH FLOWS FROM INVESTING ACTIVITIESDecrease in related-party loan and receivables – 26 Net cash inflow from investing activities – 26
CASH FLOWS FROM FINANCING ACTIVITIESProceeds from share issued through accelerated book-build 1 898 –Amounts received from related-party loans payable 519 –Amounts paid to related-party loans payable 12.4 (2 290) (30)Net cash inflow/(outflow) from financing activities 127 (30)
NET INCREASE IN CASH AND CASH EQUIVALENTS 2 –Cash and cash equivalents at beginning of the year – –CASH AND CASH EQUIVALENTS AT END OF THE YEAR 2 –
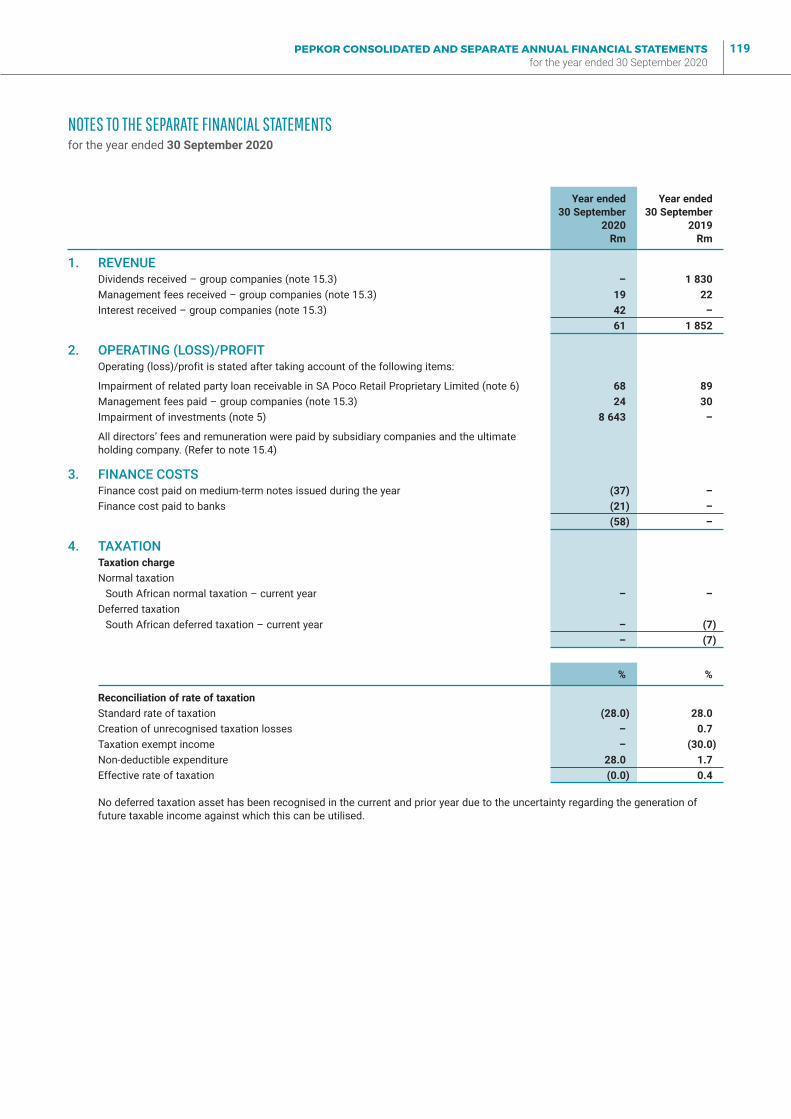
PEPKOR CONSOLIDATED AND SEPARATE ANNUAL FINANCIAL STATEMENTS for the year ended 30 September 2020
119
Year ended30 September
2020Rm
Year ended30 September
2019Rm
1. REVENUEDividends received – group companies (note 15.3) – 1 830 Management fees received – group companies (note 15.3) 19 22 Interest received – group companies (note 15.3) 42 –
61 1 852
2. OPERATING (LOSS)/PROFITOperating (loss)/profit is stated after taking account of the following items:
Impairment of related party loan receivable in SA Poco Retail Proprietary Limited (note 6) 68 89 Management fees paid – group companies (note 15.3) 24 30 Impairment of investments (note 5) 8 643 –
All directors’ fees and remuneration were paid by subsidiary companies and the ultimate holding company. (Refer to note 15.4)
3. FINANCE COSTSFinance cost paid on medium-term notes issued during the year (37) –Finance cost paid to banks (21) –
(58) –
4. TAXATIONTaxation chargeNormal taxation
South African normal taxation – current year – –Deferred taxation
South African deferred taxation – current year – (7)– (7)
% %
Reconciliation of rate of taxationStandard rate of taxation (28.0) 28.0 Creation of unrecognised taxation losses – 0.7 Taxation exempt income – (30.0)Non-deductible expenditure 28.0 1.7 Effective rate of taxation (0.0) 0.4
No deferred taxation asset has been recognised in the current and prior year due to the uncertainty regarding the generation of future taxable income against which this can be utilised.
NOTES TO THE SEPARATE FINANCIAL STATEMENTSfor the year ended 30 September 2020
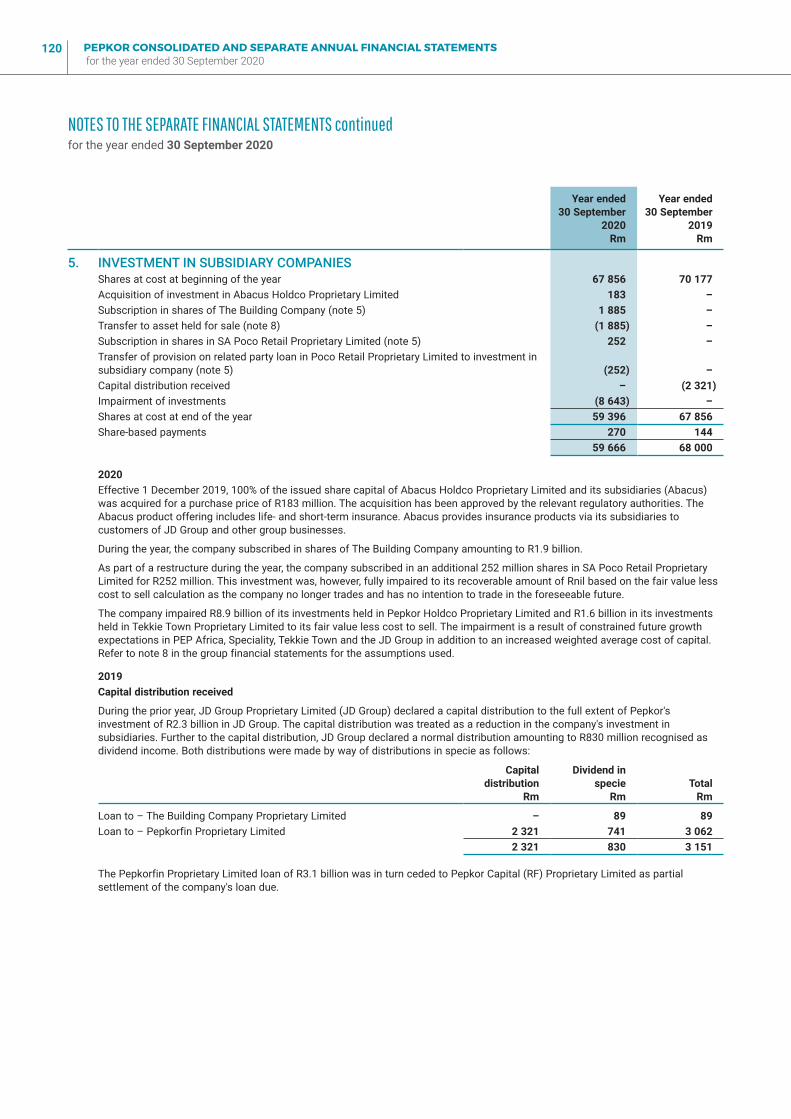
PEPKOR CONSOLIDATED AND SEPARATE ANNUAL FINANCIAL STATEMENTS for the year ended 30 September 2020
120
NOTES TO THE SEPARATE FINANCIAL STATEMENTS continuedfor the year ended 30 September 2020
Year ended30 September
2020Rm
Year ended30 September
2019Rm
5. INVESTMENT IN SUBSIDIARY COMPANIESShares at cost at beginning of the year 67 856 70 177 Acquisition of investment in Abacus Holdco Proprietary Limited 183 –Subscription in shares of The Building Company (note 5) 1 885 – Transfer to asset held for sale (note 8) (1 885) –Subscription in shares in SA Poco Retail Proprietary Limited (note 5) 252 –Transfer of provision on related party loan in Poco Retail Proprietary Limited to investment in subsidiary company (note 5) (252) –Capital distribution received – (2 321)Impairment of investments (8 643) –Shares at cost at end of the year 59 396 67 856 Share-based payments 270 144
59 666 68 000
2020Effective 1 December 2019, 100% of the issued share capital of Abacus Holdco Proprietary Limited and its subsidiaries (Abacus) was acquired for a purchase price of R183 million. The acquisition has been approved by the relevant regulatory authorities. The Abacus product offering includes life- and short-term insurance. Abacus provides insurance products via its subsidiaries to customers of JD Group and other group businesses.
During the year, the company subscribed in shares of The Building Company amounting to R1.9 billion.
As part of a restructure during the year, the company subscribed in an additional 252 million shares in SA Poco Retail Proprietary Limited for R252 million. This investment was, however, fully impaired to its recoverable amount of Rnil based on the fair value less cost to sell calculation as the company no longer trades and has no intention to trade in the foreseeable future.
The company impaired R8.9 billion of its investments held in Pepkor Holdco Proprietary Limited and R1.6 billion in its investments held in Tekkie Town Proprietary Limited to its fair value less cost to sell. The impairment is a result of constrained future growth expectations in PEP Africa, Speciality, Tekkie Town and the JD Group in addition to an increased weighted average cost of capital. Refer to note 8 in the group financial statements for the assumptions used.
2019Capital distribution received
During the prior year, JD Group Proprietary Limited (JD Group) declared a capital distribution to the full extent of Pepkor's investment of R2.3 billion in JD Group. The capital distribution was treated as a reduction in the company's investment in subsidiaries. Further to the capital distribution, JD Group declared a normal distribution amounting to R830 million recognised as dividend income. Both distributions were made by way of distributions in specie as follows:
Capitaldistribution
Rm
Dividend inspecie
Rm Total
Rm
Loan to – The Building Company Proprietary Limited – 89 89 Loan to – Pepkorfin Proprietary Limited 2 321 741 3 062
2 321 830 3 151
The Pepkorfin Proprietary Limited loan of R3.1 billion was in turn ceded to Pepkor Capital (RF) Proprietary Limited as partial settlement of the company's loan due.
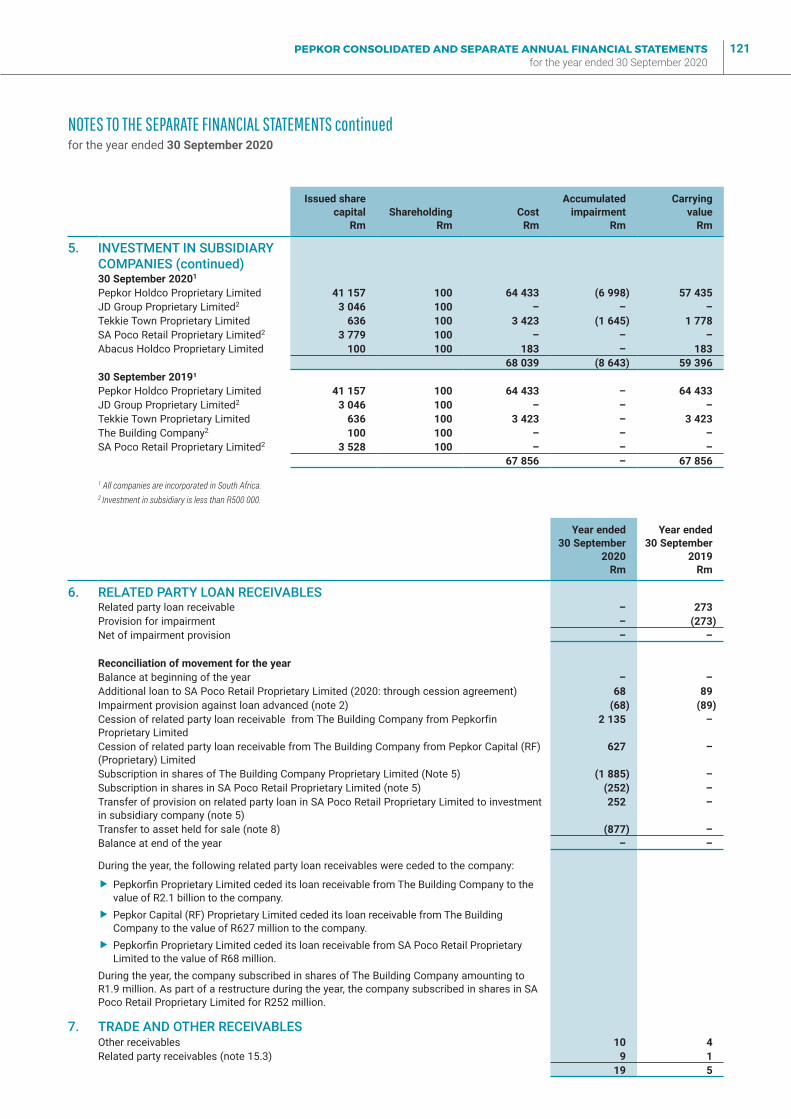
PEPKOR CONSOLIDATED AND SEPARATE ANNUAL FINANCIAL STATEMENTS for the year ended 30 September 2020
121
Issued sharecapital
Rm Shareholding
Rm Cost
Rm
Accumulatedimpairment
Rm
Carrying value
Rm
5. INVESTMENT IN SUBSIDIARY COMPANIES (continued)30 September 20201
Pepkor Holdco Proprietary Limited 41 157 100 64 433 (6 998) 57 435 JD Group Proprietary Limited2 3 046 100 – – –Tekkie Town Proprietary Limited 636 100 3 423 (1 645) 1 778 SA Poco Retail Proprietary Limited2 3 779 100 – – –Abacus Holdco Proprietary Limited 100 100 183 – 183
68 039 (8 643) 59 396 30 September 2019¹Pepkor Holdco Proprietary Limited 41 157 100 64 433 – 64 433 JD Group Proprietary Limited2 3 046 100 – – –Tekkie Town Proprietary Limited 636 100 3 423 – 3 423 The Building Company2 100 100 – – –SA Poco Retail Proprietary Limited2 3 528 100 – – –
67 856 – 67 856
1 All companies are incorporated in South Africa.2 Investment in subsidiary is less than R500 000.
Year ended30 September
2020Rm
Year ended30 September
2019Rm
6. RELATED PARTY LOAN RECEIVABLESRelated party loan receivable – 273 Provision for impairment – (273)Net of impairment provision – –
Reconciliation of movement for the yearBalance at beginning of the year – –Additional loan to SA Poco Retail Proprietary Limited (2020: through cession agreement) 68 89 Impairment provision against loan advanced (note 2) (68) (89)Cession of related party loan receivable from The Building Company from Pepkorfin Proprietary Limited
2 135 –
Cession of related party loan receivable from The Building Company from Pepkor Capital (RF) (Proprietary) Limited
627 –
Subscription in shares of The Building Company Proprietary Limited (Note 5) (1 885) –Subscription in shares in SA Poco Retail Proprietary Limited (note 5) (252) –Transfer of provision on related party loan in SA Poco Retail Proprietary Limited to investment in subsidiary company (note 5)
252 –
Transfer to asset held for sale (note 8) (877) –Balance at end of the year – –
During the year, the following related party loan receivables were ceded to the company:
� Pepkorfin Proprietary Limited ceded its loan receivable from The Building Company to the value of R2.1 billion to the company.
� Pepkor Capital (RF) Proprietary Limited ceded its loan receivable from The Building Company to the value of R627 million to the company.
� Pepkorfin Proprietary Limited ceded its loan receivable from SA Poco Retail Proprietary Limited to the value of R68 million.
During the year, the company subscribed in shares of The Building Company amounting to R1.9 million. As part of a restructure during the year, the company subscribed in shares in SA Poco Retail Proprietary Limited for R252 million.
7. TRADE AND OTHER RECEIVABLESOther receivables 10 4 Related party receivables (note 15.3) 9 1
19 5
NOTES TO THE SEPARATE FINANCIAL STATEMENTS continuedfor the year ended 30 September 2020
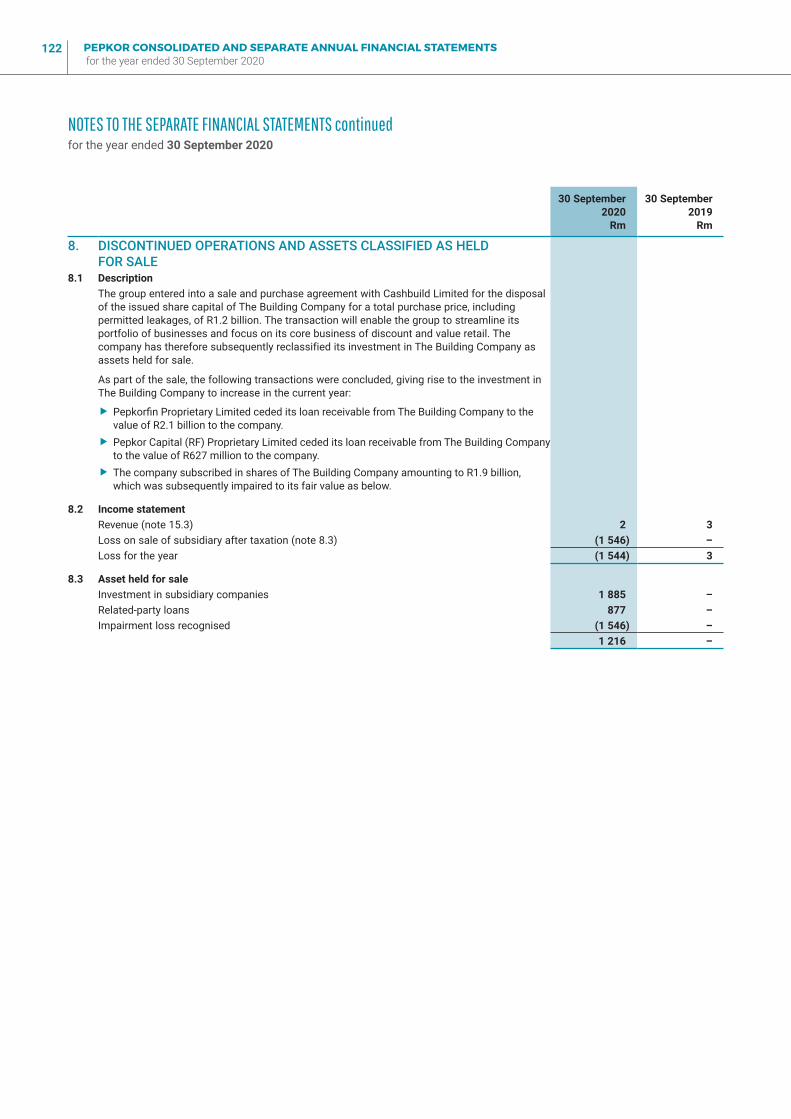
PEPKOR CONSOLIDATED AND SEPARATE ANNUAL FINANCIAL STATEMENTS for the year ended 30 September 2020
122
30 September 2020
Rm
30 September 2019
Rm
8. DISCONTINUED OPERATIONS AND ASSETS CLASSIFIED AS HELD FOR SALE
8.1 DescriptionThe group entered into a sale and purchase agreement with Cashbuild Limited for the disposal of the issued share capital of The Building Company for a total purchase price, including permitted leakages, of R1.2 billion. The transaction will enable the group to streamline its portfolio of businesses and focus on its core business of discount and value retail. The company has therefore subsequently reclassified its investment in The Building Company as assets held for sale.
As part of the sale, the following transactions were concluded, giving rise to the investment in The Building Company to increase in the current year:
� Pepkorfin Proprietary Limited ceded its loan receivable from The Building Company to the value of R2.1 billion to the company.
� Pepkor Capital (RF) Proprietary Limited ceded its loan receivable from The Building Company to the value of R627 million to the company.
� The company subscribed in shares of The Building Company amounting to R1.9 billion, which was subsequently impaired to its fair value as below.
8.2 Income statementRevenue (note 15.3) 2 3 Loss on sale of subsidiary after taxation (note 8.3) (1 546) –Loss for the year (1 544) 3
8.3 Asset held for saleInvestment in subsidiary companies 1 885 –Related-party loans 877 –Impairment loss recognised (1 546) –
1 216 –
NOTES TO THE SEPARATE FINANCIAL STATEMENTS continuedfor the year ended 30 September 2020
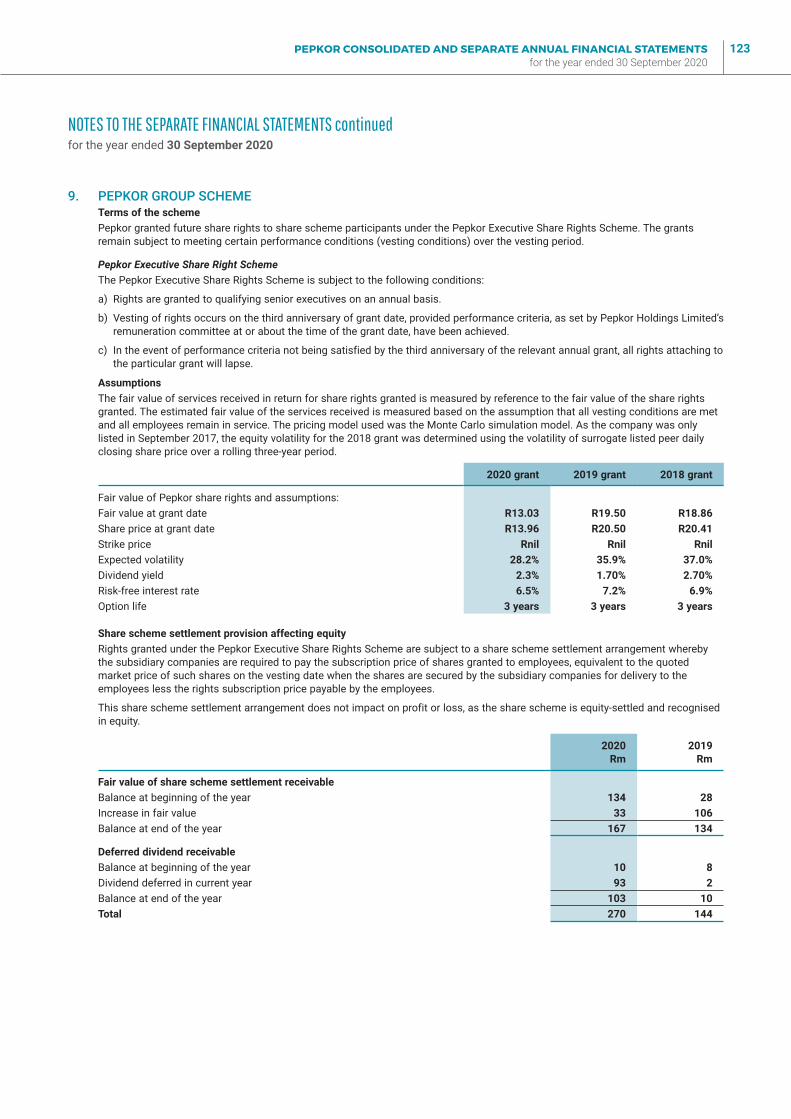
PEPKOR CONSOLIDATED AND SEPARATE ANNUAL FINANCIAL STATEMENTS for the year ended 30 September 2020
123
9. PEPKOR GROUP SCHEMETerms of the schemePepkor granted future share rights to share scheme participants under the Pepkor Executive Share Rights Scheme. The grants remain subject to meeting certain performance conditions (vesting conditions) over the vesting period.
Pepkor Executive Share Right SchemeThe Pepkor Executive Share Rights Scheme is subject to the following conditions:
a) Rights are granted to qualifying senior executives on an annual basis.
b) Vesting of rights occurs on the third anniversary of grant date, provided performance criteria, as set by Pepkor Holdings Limited’s remuneration committee at or about the time of the grant date, have been achieved.
c) In the event of performance criteria not being satisfied by the third anniversary of the relevant annual grant, all rights attaching to the particular grant will lapse.
AssumptionsThe fair value of services received in return for share rights granted is measured by reference to the fair value of the share rights granted. The estimated fair value of the services received is measured based on the assumption that all vesting conditions are met and all employees remain in service. The pricing model used was the Monte Carlo simulation model. As the company was only listed in September 2017, the equity volatility for the 2018 grant was determined using the volatility of surrogate listed peer daily closing share price over a rolling three-year period.
2020 grant 2019 grant 2018 grant
Fair value of Pepkor share rights and assumptions:Fair value at grant date R13.03 R19.50 R18.86 Share price at grant date R13.96 R20.50 R20.41 Strike price Rnil Rnil RnilExpected volatility 28.2% 35.9% 37.0%Dividend yield 2.3% 1.70% 2.70%Risk-free interest rate 6.5% 7.2% 6.9%Option life 3 years 3 years 3 years
Share scheme settlement provision affecting equityRights granted under the Pepkor Executive Share Rights Scheme are subject to a share scheme settlement arrangement whereby the subsidiary companies are required to pay the subscription price of shares granted to employees, equivalent to the quoted market price of such shares on the vesting date when the shares are secured by the subsidiary companies for delivery to the employees less the rights subscription price payable by the employees.
This share scheme settlement arrangement does not impact on profit or loss, as the share scheme is equity-settled and recognised in equity.
2020Rm
2019Rm
Fair value of share scheme settlement receivableBalance at beginning of the year 134 28 Increase in fair value 33 106 Balance at end of the year 167 134
Deferred dividend receivableBalance at beginning of the year 10 8 Dividend deferred in current year 93 2 Balance at end of the year 103 10 Total 270 144
NOTES TO THE SEPARATE FINANCIAL STATEMENTS continuedfor the year ended 30 September 2020
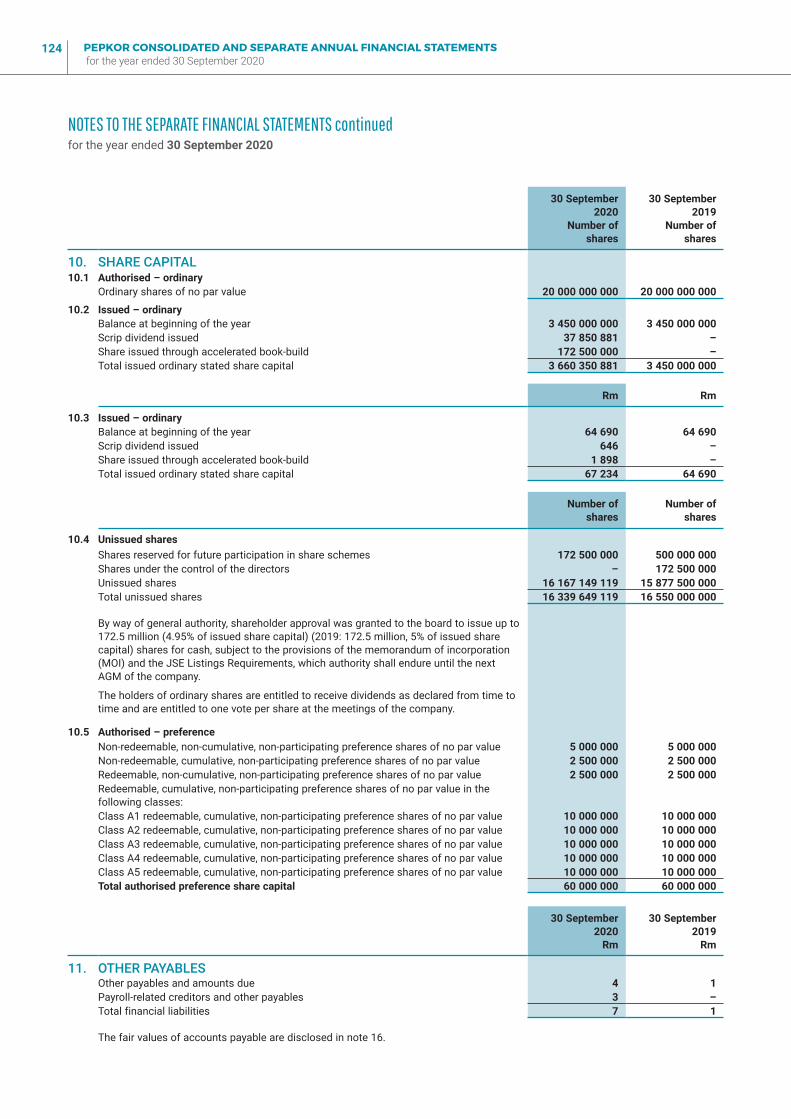
PEPKOR CONSOLIDATED AND SEPARATE ANNUAL FINANCIAL STATEMENTS for the year ended 30 September 2020
124
30 September2020
Number of shares
30 September2019
Number of shares
10. SHARE CAPITAL10.1 Authorised – ordinary
Ordinary shares of no par value 20 000 000 000 20 000 000 000
10.2 Issued – ordinaryBalance at beginning of the year 3 450 000 000 3 450 000 000 Scrip dividend issued 37 850 881 –Share issued through accelerated book-build 172 500 000 –Total issued ordinary stated share capital 3 660 350 881 3 450 000 000
Rm Rm
10.3 Issued – ordinaryBalance at beginning of the year 64 690 64 690 Scrip dividend issued 646 –Share issued through accelerated book-build 1 898 –Total issued ordinary stated share capital 67 234 64 690
Number of shares
Number of shares
10.4 Unissued sharesShares reserved for future participation in share schemes 172 500 000 500 000 000 Shares under the control of the directors – 172 500 000 Unissued shares 16 167 149 119 15 877 500 000 Total unissued shares 16 339 649 119 16 550 000 000
By way of general authority, shareholder approval was granted to the board to issue up to 172.5 million (4.95% of issued share capital) (2019: 172.5 million, 5% of issued share capital) shares for cash, subject to the provisions of the memorandum of incorporation (MOI) and the JSE Listings Requirements, which authority shall endure until the next AGM of the company.
The holders of ordinary shares are entitled to receive dividends as declared from time to time and are entitled to one vote per share at the meetings of the company.
10.5 Authorised – preferenceNon-redeemable, non-cumulative, non-participating preference shares of no par value 5 000 000 5 000 000 Non-redeemable, cumulative, non-participating preference shares of no par value 2 500 000 2 500 000 Redeemable, non-cumulative, non-participating preference shares of no par value 2 500 000 2 500 000 Redeemable, cumulative, non-participating preference shares of no par value in the following classes:Class A1 redeemable, cumulative, non-participating preference shares of no par value 10 000 000 10 000 000 Class A2 redeemable, cumulative, non-participating preference shares of no par value 10 000 000 10 000 000 Class A3 redeemable, cumulative, non-participating preference shares of no par value 10 000 000 10 000 000 Class A4 redeemable, cumulative, non-participating preference shares of no par value 10 000 000 10 000 000 Class A5 redeemable, cumulative, non-participating preference shares of no par value 10 000 000 10 000 000 Total authorised preference share capital 60 000 000 60 000 000
30 September2020
Rm
30 September2019
Rm
11. OTHER PAYABLESOther payables and amounts due 4 1 Payroll-related creditors and other payables 3 –Total financial liabilities 7 1
The fair values of accounts payable are disclosed in note 16.
NOTES TO THE SEPARATE FINANCIAL STATEMENTS continuedfor the year ended 30 September 2020
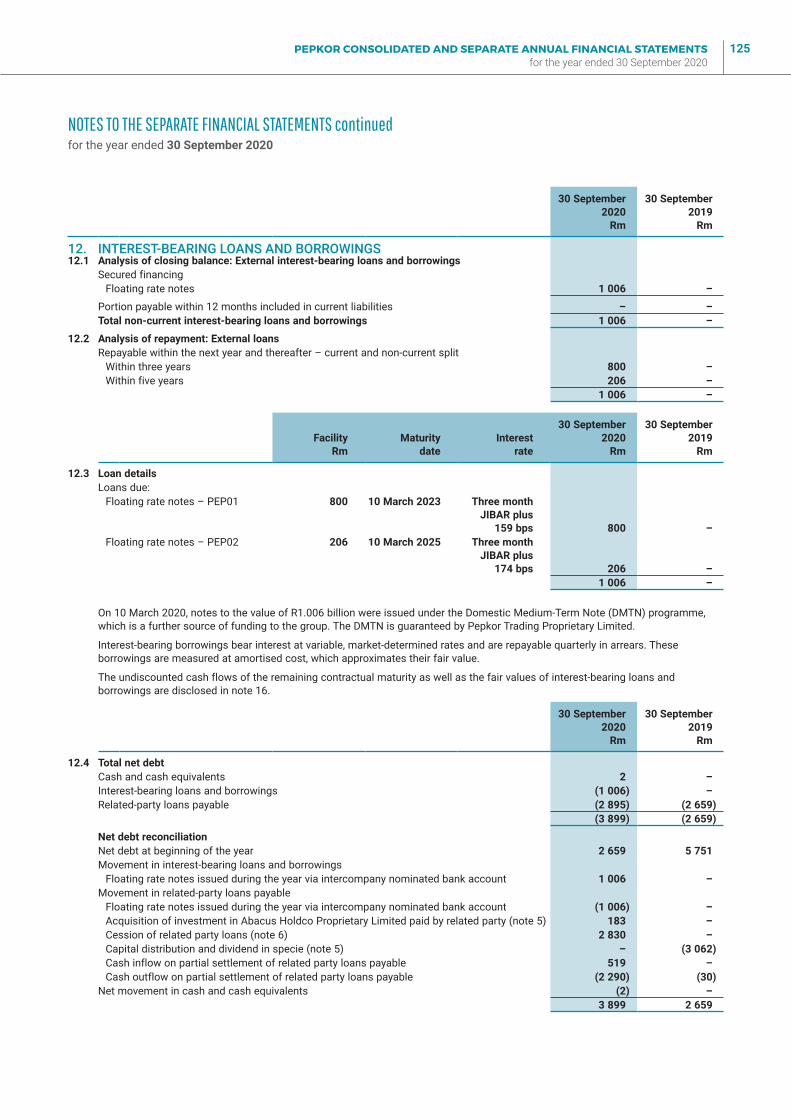
PEPKOR CONSOLIDATED AND SEPARATE ANNUAL FINANCIAL STATEMENTS for the year ended 30 September 2020
125
30 September2020
Rm
30 September2019
Rm
12. INTEREST-BEARING LOANS AND BORROWINGS12.1 Analysis of closing balance: External interest-bearing loans and borrowings
Secured financingFloating rate notes 1 006 –
Portion payable within 12 months included in current liabilities – –Total non-current interest-bearing loans and borrowings 1 006 –
12.2 Analysis of repayment: External loansRepayable within the next year and thereafter – current and non-current split
Within three years 800 –Within five years 206 –
1 006 –
FacilityRm
Maturitydate
Interestrate
30 September2020
Rm
30 September2019
Rm
12.3 Loan detailsLoans due:
Floating rate notes – PEP01 800 10 March 2023 Three monthJIBAR plus
159 bps 800 –Floating rate notes – PEP02 206 10 March 2025 Three month
JIBAR plus174 bps 206 –
1 006 –
On 10 March 2020, notes to the value of R1.006 billion were issued under the Domestic Medium-Term Note (DMTN) programme, which is a further source of funding to the group. The DMTN is guaranteed by Pepkor Trading Proprietary Limited.
Interest-bearing borrowings bear interest at variable, market-determined rates and are repayable quarterly in arrears. These borrowings are measured at amortised cost, which approximates their fair value.
The undiscounted cash flows of the remaining contractual maturity as well as the fair values of interest-bearing loans and borrowings are disclosed in note 16.
30 September2020
Rm
30 September2019
Rm
12.4 Total net debtCash and cash equivalents 2 –Interest-bearing loans and borrowings (1 006) –Related-party loans payable (2 895) (2 659)
(3 899) (2 659)
Net debt reconciliationNet debt at beginning of the year 2 659 5 751 Movement in interest-bearing loans and borrowings
Floating rate notes issued during the year via intercompany nominated bank account 1 006 –Movement in related-party loans payable
Floating rate notes issued during the year via intercompany nominated bank account (1 006) –Acquisition of investment in Abacus Holdco Proprietary Limited paid by related party (note 5) 183 –Cession of related party loans (note 6) 2 830 –Capital distribution and dividend in specie (note 5) – (3 062)Cash inflow on partial settlement of related party loans payable 519 –Cash outflow on partial settlement of related party loans payable (2 290) (30)
Net movement in cash and cash equivalents (2) –3 899 2 659
NOTES TO THE SEPARATE FINANCIAL STATEMENTS continuedfor the year ended 30 September 2020
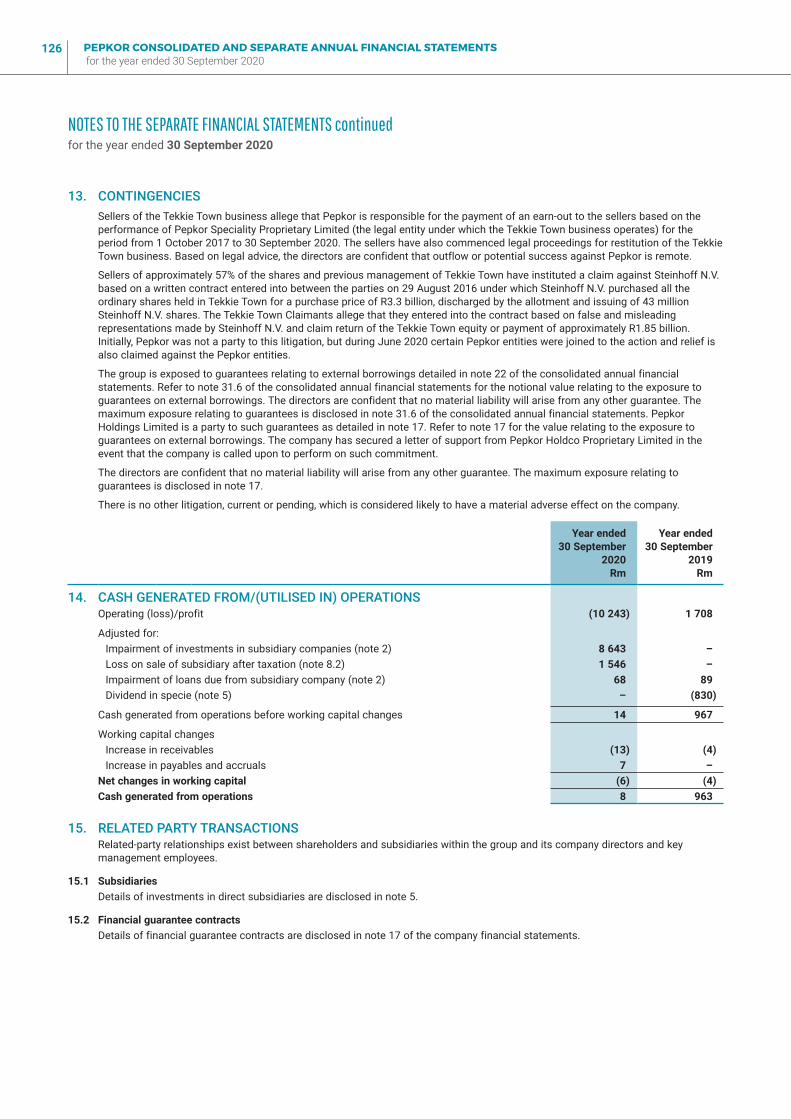
PEPKOR CONSOLIDATED AND SEPARATE ANNUAL FINANCIAL STATEMENTS for the year ended 30 September 2020
126
13. CONTINGENCIESSellers of the Tekkie Town business allege that Pepkor is responsible for the payment of an earn-out to the sellers based on the performance of Pepkor Speciality Proprietary Limited (the legal entity under which the Tekkie Town business operates) for the period from 1 October 2017 to 30 September 2020. The sellers have also commenced legal proceedings for restitution of the Tekkie Town business. Based on legal advice, the directors are confident that outflow or potential success against Pepkor is remote.
Sellers of approximately 57% of the shares and previous management of Tekkie Town have instituted a claim against Steinhoff N.V. based on a written contract entered into between the parties on 29 August 2016 under which Steinhoff N.V. purchased all the ordinary shares held in Tekkie Town for a purchase price of R3.3 billion, discharged by the allotment and issuing of 43 million Steinhoff N.V. shares. The Tekkie Town Claimants allege that they entered into the contract based on false and misleading representations made by Steinhoff N.V. and claim return of the Tekkie Town equity or payment of approximately R1.85 billion. Initially, Pepkor was not a party to this litigation, but during June 2020 certain Pepkor entities were joined to the action and relief is also claimed against the Pepkor entities.
The group is exposed to guarantees relating to external borrowings detailed in note 22 of the consolidated annual financial statements. Refer to note 31.6 of the consolidated annual financial statements for the notional value relating to the exposure to guarantees on external borrowings. The directors are confident that no material liability will arise from any other guarantee. The maximum exposure relating to guarantees is disclosed in note 31.6 of the consolidated annual financial statements. Pepkor Holdings Limited is a party to such guarantees as detailed in note 17. Refer to note 17 for the value relating to the exposure to guarantees on external borrowings. The company has secured a letter of support from Pepkor Holdco Proprietary Limited in the event that the company is called upon to perform on such commitment.
The directors are confident that no material liability will arise from any other guarantee. The maximum exposure relating to guarantees is disclosed in note 17.
There is no other litigation, current or pending, which is considered likely to have a material adverse effect on the company.
Year ended30 September
2020Rm
Year ended30 September
2019Rm
14. CASH GENERATED FROM/(UTILISED IN) OPERATIONSOperating (loss)/profit (10 243) 1 708
Adjusted for:Impairment of investments in subsidiary companies (note 2) 8 643 –Loss on sale of subsidiary after taxation (note 8.2) 1 546 –Impairment of loans due from subsidiary company (note 2) 68 89 Dividend in specie (note 5) – (830)
Cash generated from operations before working capital changes 14 967
Working capital changesIncrease in receivables (13) (4)Increase in payables and accruals 7 –
Net changes in working capital (6) (4)Cash generated from operations 8 963
15. RELATED PARTY TRANSACTIONSRelated-party relationships exist between shareholders and subsidiaries within the group and its company directors and key management employees.
15.1 SubsidiariesDetails of investments in direct subsidiaries are disclosed in note 5.
15.2 Financial guarantee contractsDetails of financial guarantee contracts are disclosed in note 17 of the company financial statements.
NOTES TO THE SEPARATE FINANCIAL STATEMENTS continuedfor the year ended 30 September 2020
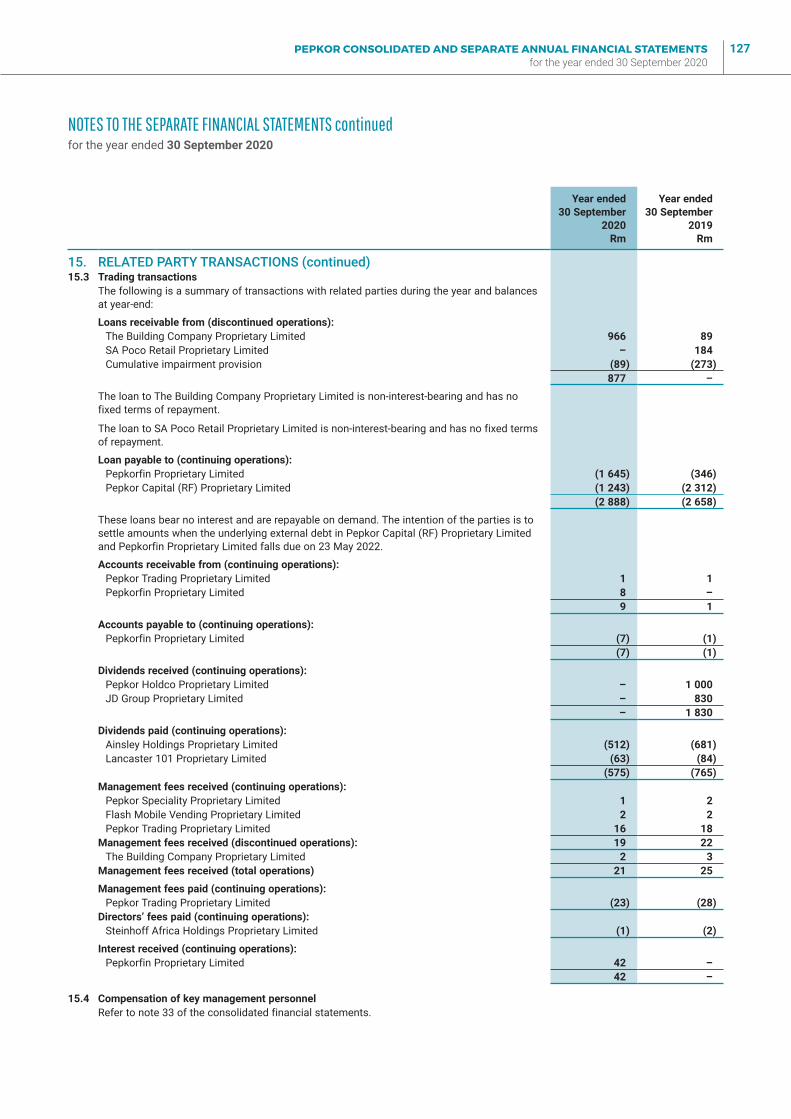
PEPKOR CONSOLIDATED AND SEPARATE ANNUAL FINANCIAL STATEMENTS for the year ended 30 September 2020
127
NOTES TO THE SEPARATE FINANCIAL STATEMENTS continuedfor the year ended 30 September 2020
Year ended30 September
2020Rm
Year ended30 September
2019Rm
15. RELATED PARTY TRANSACTIONS (continued)15.3 Trading transactions
The following is a summary of transactions with related parties during the year and balances at year-end:
Loans receivable from (discontinued operations):The Building Company Proprietary Limited 966 89 SA Poco Retail Proprietary Limited – 184 Cumulative impairment provision (89) (273)
877 –
The loan to The Building Company Proprietary Limited is non-interest-bearing and has no fixed terms of repayment.
The loan to SA Poco Retail Proprietary Limited is non-interest-bearing and has no fixed terms of repayment.
Loan payable to (continuing operations):Pepkorfin Proprietary Limited (1 645) (346)Pepkor Capital (RF) Proprietary Limited (1 243) (2 312)
(2 888) (2 658)
These loans bear no interest and are repayable on demand. The intention of the parties is to settle amounts when the underlying external debt in Pepkor Capital (RF) Proprietary Limited and Pepkorfin Proprietary Limited falls due on 23 May 2022.
Accounts receivable from (continuing operations):Pepkor Trading Proprietary Limited 1 1 Pepkorfin Proprietary Limited 8 –
9 1
Accounts payable to (continuing operations):Pepkorfin Proprietary Limited (7) (1)
(7) (1)
Dividends received (continuing operations):Pepkor Holdco Proprietary Limited – 1 000 JD Group Proprietary Limited – 830
– 1 830
Dividends paid (continuing operations):Ainsley Holdings Proprietary Limited (512) (681)Lancaster 101 Proprietary Limited (63) (84)
(575) (765)Management fees received (continuing operations):
Pepkor Speciality Proprietary Limited 1 2 Flash Mobile Vending Proprietary Limited 2 2 Pepkor Trading Proprietary Limited 16 18
Management fees received (discontinued operations): 19 22 The Building Company Proprietary Limited 2 3
Management fees received (total operations) 21 25
Management fees paid (continuing operations):Pepkor Trading Proprietary Limited (23) (28)
Directors’ fees paid (continuing operations):Steinhoff Africa Holdings Proprietary Limited (1) (2)
Interest received (continuing operations):Pepkorfin Proprietary Limited 42 –
42 –
15.4 Compensation of key management personnelRefer to note 33 of the consolidated financial statements.
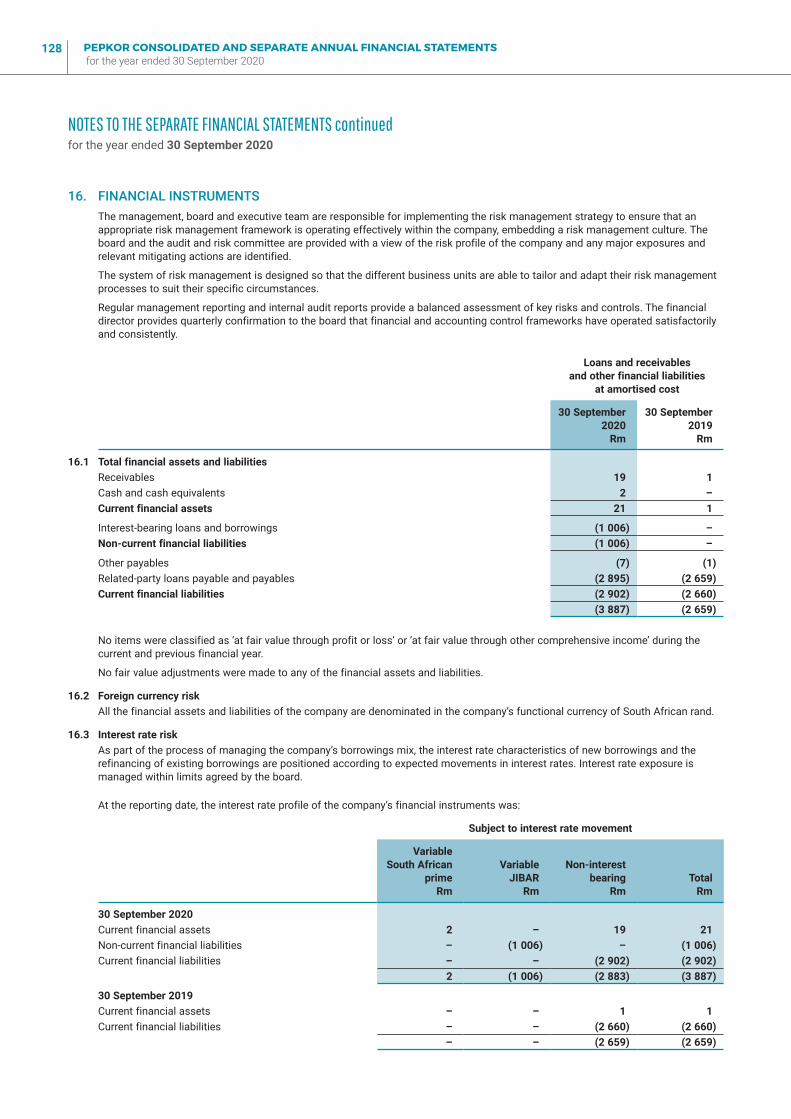
PEPKOR CONSOLIDATED AND SEPARATE ANNUAL FINANCIAL STATEMENTS for the year ended 30 September 2020
128
NOTES TO THE SEPARATE FINANCIAL STATEMENTS continuedfor the year ended 30 September 2020
16. FINANCIAL INSTRUMENTSThe management, board and executive team are responsible for implementing the risk management strategy to ensure that an appropriate risk management framework is operating effectively within the company, embedding a risk management culture. The board and the audit and risk committee are provided with a view of the risk profile of the company and any major exposures and relevant mitigating actions are identified.
The system of risk management is designed so that the different business units are able to tailor and adapt their risk management processes to suit their specific circumstances.
Regular management reporting and internal audit reports provide a balanced assessment of key risks and controls. The financial director provides quarterly confirmation to the board that financial and accounting control frameworks have operated satisfactorily and consistently.
Loans and receivables and other financial liabilities
at amortised cost
30 September2020
Rm
30 September2019
Rm
16.1 Total financial assets and liabilitiesReceivables 19 1 Cash and cash equivalents 2 –Current financial assets 21 1
Interest-bearing loans and borrowings (1 006) –Non-current financial liabilities (1 006) –
Other payables (7) (1)Related-party loans payable and payables (2 895) (2 659)Current financial liabilities (2 902) (2 660)
(3 887) (2 659)
No items were classified as ’at fair value through profit or loss’ or ’at fair value through other comprehensive income’ during the current and previous financial year.
No fair value adjustments were made to any of the financial assets and liabilities.
16.2 Foreign currency riskAll the financial assets and liabilities of the company are denominated in the company’s functional currency of South African rand.
16.3 Interest rate riskAs part of the process of managing the company’s borrowings mix, the interest rate characteristics of new borrowings and the refinancing of existing borrowings are positioned according to expected movements in interest rates. Interest rate exposure is managed within limits agreed by the board.
At the reporting date, the interest rate profile of the company’s financial instruments was:
Subject to interest rate movement
VariableSouth African
primeRm
Variable JIBAR
Rm
Non-interestbearing
RmTotal
Rm
30 September 2020Current financial assets 2 – 19 21 Non-current financial liabilities – (1 006) – (1 006)Current financial liabilities – – (2 902) (2 902)
2 (1 006) (2 883) (3 887)
30 September 2019Current financial assets – – 1 1 Current financial liabilities – – (2 660) (2 660)
– – (2 659) (2 659)
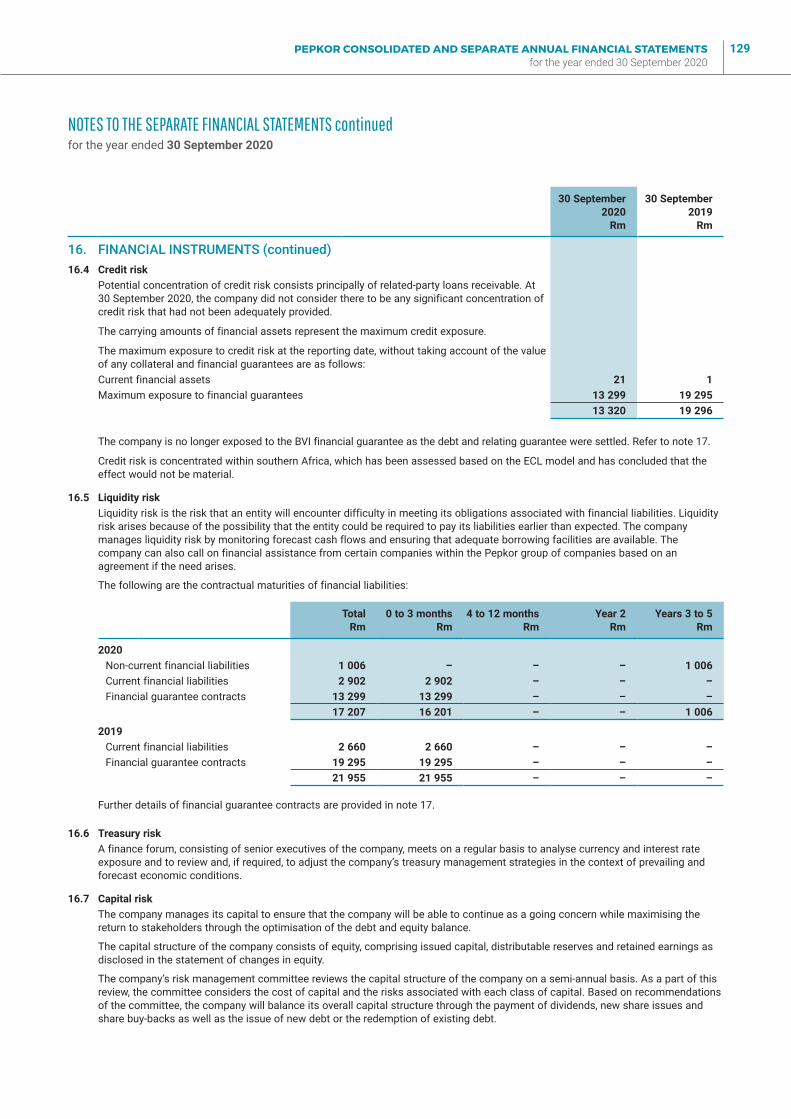
PEPKOR CONSOLIDATED AND SEPARATE ANNUAL FINANCIAL STATEMENTS for the year ended 30 September 2020
129
NOTES TO THE SEPARATE FINANCIAL STATEMENTS continuedfor the year ended 30 September 2020
30 September2020
Rm
30 September2019
Rm
16. FINANCIAL INSTRUMENTS (continued)16.4 Credit risk
Potential concentration of credit risk consists principally of related-party loans receivable. At 30 September 2020, the company did not consider there to be any significant concentration of credit risk that had not been adequately provided.
The carrying amounts of financial assets represent the maximum credit exposure.
The maximum exposure to credit risk at the reporting date, without taking account of the value of any collateral and financial guarantees are as follows:Current financial assets 21 1 Maximum exposure to financial guarantees 13 299 19 295
13 320 19 296
The company is no longer exposed to the BVI financial guarantee as the debt and relating guarantee were settled. Refer to note 17.
Credit risk is concentrated within southern Africa, which has been assessed based on the ECL model and has concluded that the effect would not be material.
16.5 Liquidity riskLiquidity risk is the risk that an entity will encounter difficulty in meeting its obligations associated with financial liabilities. Liquidity risk arises because of the possibility that the entity could be required to pay its liabilities earlier than expected. The company manages liquidity risk by monitoring forecast cash flows and ensuring that adequate borrowing facilities are available. The company can also call on financial assistance from certain companies within the Pepkor group of companies based on an agreement if the need arises.
The following are the contractual maturities of financial liabilities:
TotalRm
0 to 3 monthsRm
4 to 12 monthsRm
Year 2Rm
Years 3 to 5Rm
2020Non-current financial liabilities 1 006 – – – 1 006 Current financial liabilities 2 902 2 902 – – –Financial guarantee contracts 13 299 13 299 – – –
17 207 16 201 – – 1 006
2019Current financial liabilities 2 660 2 660 – – –Financial guarantee contracts 19 295 19 295 – – –
21 955 21 955 – – –
Further details of financial guarantee contracts are provided in note 17.
16.6 Treasury riskA finance forum, consisting of senior executives of the company, meets on a regular basis to analyse currency and interest rate exposure and to review and, if required, to adjust the company’s treasury management strategies in the context of prevailing and forecast economic conditions.
16.7 Capital riskThe company manages its capital to ensure that the company will be able to continue as a going concern while maximising the return to stakeholders through the optimisation of the debt and equity balance.
The capital structure of the company consists of equity, comprising issued capital, distributable reserves and retained earnings as disclosed in the statement of changes in equity.
The company’s risk management committee reviews the capital structure of the company on a semi-annual basis. As a part of this review, the committee considers the cost of capital and the risks associated with each class of capital. Based on recommendations of the committee, the company will balance its overall capital structure through the payment of dividends, new share issues and share buy-backs as well as the issue of new debt or the redemption of existing debt.
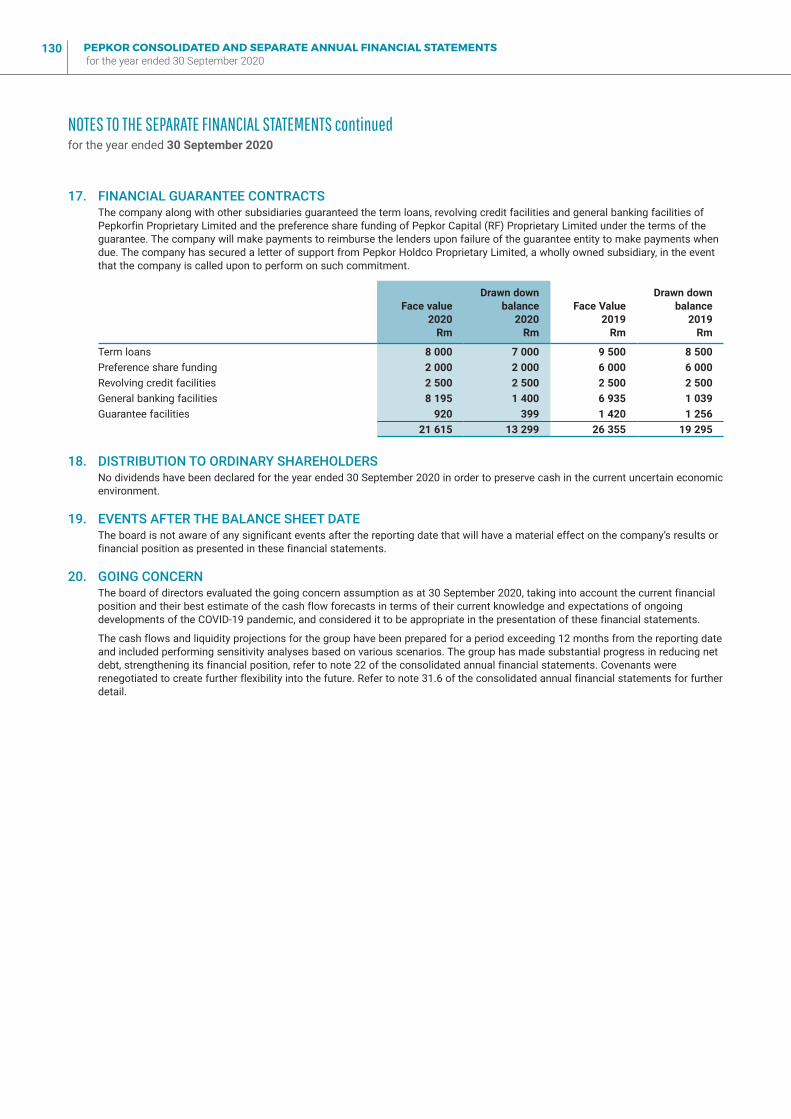
PEPKOR CONSOLIDATED AND SEPARATE ANNUAL FINANCIAL STATEMENTS for the year ended 30 September 2020
130
17. FINANCIAL GUARANTEE CONTRACTSThe company along with other subsidiaries guaranteed the term loans, revolving credit facilities and general banking facilities of Pepkorfin Proprietary Limited and the preference share funding of Pepkor Capital (RF) Proprietary Limited under the terms of the guarantee. The company will make payments to reimburse the lenders upon failure of the guarantee entity to make payments when due. The company has secured a letter of support from Pepkor Holdco Proprietary Limited, a wholly owned subsidiary, in the event that the company is called upon to perform on such commitment.
Face value2020
Rm
Drawn downbalance
2020Rm
Face Value2019
Rm
Drawn downbalance
2019Rm
Term loans 8 000 7 000 9 500 8 500 Preference share funding 2 000 2 000 6 000 6 000 Revolving credit facilities 2 500 2 500 2 500 2 500 General banking facilities 8 195 1 400 6 935 1 039 Guarantee facilities 920 399 1 420 1 256
21 615 13 299 26 355 19 295
18. DISTRIBUTION TO ORDINARY SHAREHOLDERSNo dividends have been declared for the year ended 30 September 2020 in order to preserve cash in the current uncertain economic environment.
19. EVENTS AFTER THE BALANCE SHEET DATEThe board is not aware of any significant events after the reporting date that will have a material effect on the company’s results or financial position as presented in these financial statements.
20. GOING CONCERNThe board of directors evaluated the going concern assumption as at 30 September 2020, taking into account the current financial position and their best estimate of the cash flow forecasts in terms of their current knowledge and expectations of ongoing developments of the COVID-19 pandemic, and considered it to be appropriate in the presentation of these financial statements.
The cash flows and liquidity projections for the group have been prepared for a period exceeding 12 months from the reporting date and included performing sensitivity analyses based on various scenarios. The group has made substantial progress in reducing net debt, strengthening its financial position, refer to note 22 of the consolidated annual financial statements. Covenants were renegotiated to create further flexibility into the future. Refer to note 31.6 of the consolidated annual financial statements for further detail.
NOTES TO THE SEPARATE FINANCIAL STATEMENTS continuedfor the year ended 30 September 2020
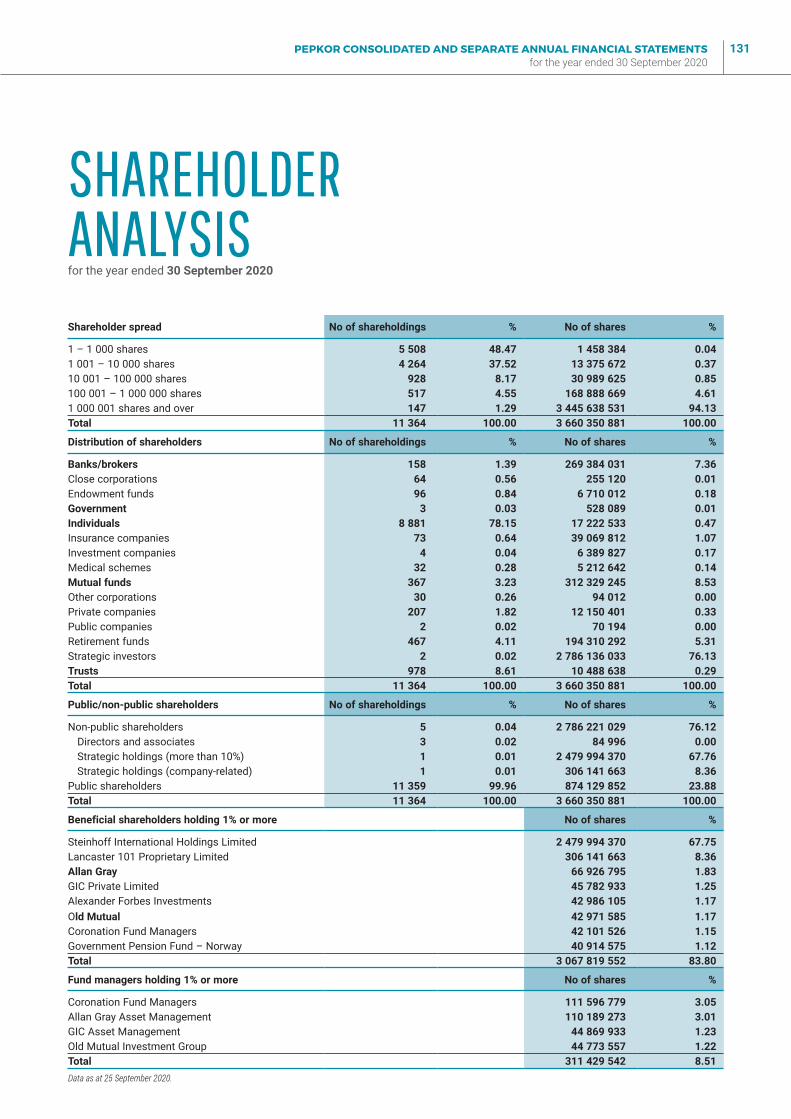
PEPKOR CONSOLIDATED AND SEPARATE ANNUAL FINANCIAL STATEMENTS for the year ended 30 September 2020
131
SHAREHOLDER ANALYSISfor the year ended 30 September 2020
Shareholder spread No of shareholdings % No of shares %
1 – 1 000 shares 5 508 48.47 1 458 384 0.041 001 – 10 000 shares 4 264 37.52 13 375 672 0.3710 001 – 100 000 shares 928 8.17 30 989 625 0.85100 001 – 1 000 000 shares 517 4.55 168 888 669 4.611 000 001 shares and over 147 1.29 3 445 638 531 94.13Total 11 364 100.00 3 660 350 881 100.00
Distribution of shareholders No of shareholdings % No of shares %
Banks/brokers 158 1.39 269 384 031 7.36Close corporations 64 0.56 255 120 0.01Endowment funds 96 0.84 6 710 012 0.18Government 3 0.03 528 089 0.01Individuals 8 881 78.15 17 222 533 0.47Insurance companies 73 0.64 39 069 812 1.07Investment companies 4 0.04 6 389 827 0.17Medical schemes 32 0.28 5 212 642 0.14Mutual funds 367 3.23 312 329 245 8.53Other corporations 30 0.26 94 012 0.00Private companies 207 1.82 12 150 401 0.33Public companies 2 0.02 70 194 0.00Retirement funds 467 4.11 194 310 292 5.31Strategic investors 2 0.02 2 786 136 033 76.13Trusts 978 8.61 10 488 638 0.29Total 11 364 100.00 3 660 350 881 100.00
Public/non-public shareholders No of shareholdings % No of shares %
Non-public shareholders 5 0.04 2 786 221 029 76.12Directors and associates 3 0.02 84 996 0.00Strategic holdings (more than 10%) 1 0.01 2 479 994 370 67.76Strategic holdings (company-related) 1 0.01 306 141 663 8.36
Public shareholders 11 359 99.96 874 129 852 23.88Total 11 364 100.00 3 660 350 881 100.00
Beneficial shareholders holding 1% or more No of shares %
Steinhoff International Holdings Limited 2 479 994 370 67.75Lancaster 101 Proprietary Limited 306 141 663 8.36Allan Gray 66 926 795 1.83GIC Private Limited 45 782 933 1.25Alexander Forbes Investments 42 986 105 1.17Old Mutual 42 971 585 1.17Coronation Fund Managers 42 101 526 1.15Government Pension Fund – Norway 40 914 575 1.12Total 3 067 819 552 83.80
Fund managers holding 1% or more No of shares %
Coronation Fund Managers 111 596 779 3.05Allan Gray Asset Management 110 189 273 3.01GIC Asset Management 44 869 933 1.23Old Mutual Investment Group 44 773 557 1.22Total 311 429 542 8.51Data as at 25 September 2020.
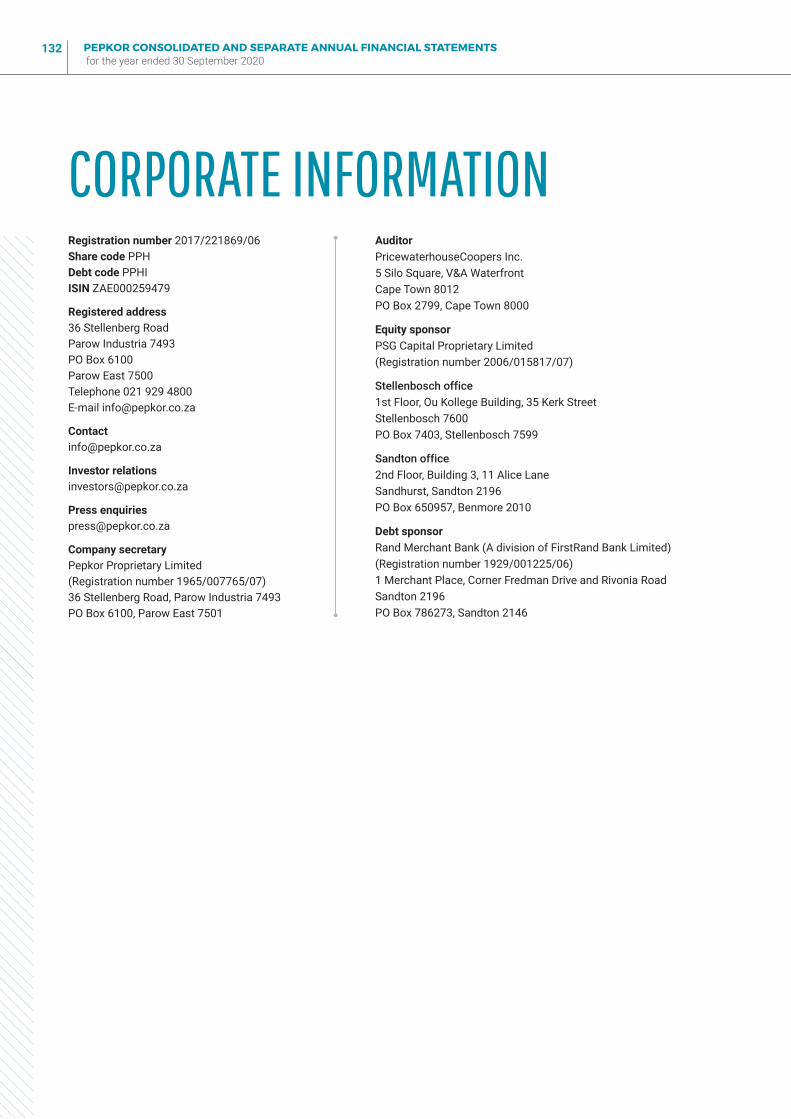
PEPKOR CONSOLIDATED AND SEPARATE ANNUAL FINANCIAL STATEMENTS for the year ended 30 September 2020
132
Registration number 2017/221869/06Share code PPHDebt code PPHIISIN ZAE000259479
Registered address36 Stellenberg RoadParow Industria 7493PO Box 6100Parow East 7500Telephone 021 929 4800 E-mail [email protected]
Investor [email protected]
Press [email protected]
Company secretaryPepkor Proprietary Limited(Registration number 1965/007765/07)36 Stellenberg Road, Parow Industria 7493PO Box 6100, Parow East 7501
AuditorPricewaterhouseCoopers Inc.5 Silo Square, V&A WaterfrontCape Town 8012PO Box 2799, Cape Town 8000
Equity sponsorPSG Capital Proprietary Limited(Registration number 2006/015817/07)
Stellenbosch office1st Floor, Ou Kollege Building, 35 Kerk StreetStellenbosch 7600PO Box 7403, Stellenbosch 7599
Sandton office2nd Floor, Building 3, 11 Alice LaneSandhurst, Sandton 2196PO Box 650957, Benmore 2010
Debt sponsorRand Merchant Bank (A division of FirstRand Bank Limited)(Registration number 1929/001225/06)1 Merchant Place, Corner Fredman Drive and Rivonia RoadSandton 2196PO Box 786273, Sandton 2146
CORPORATE INFORMATION

www.pepkor.co.za