2021 panalgo state of healthcare analytics benchmarking
TRANSCRIPT
DATA ANALYTICS AND MACHINE LEARNING IN LIFE SCIENCES
2021 Panalgo State of Healthcare Analytics Benchmarking Report
2 | Panalgo.com
03050608
09111415
TAB
LE O
FC
ON
TEN
TSEXECUTIVE SUMMARY
CONCLUSION
INTRODUCTION
SECTION 1:State of the Industry: Who’s Conducting Healthcare Analyses?
SECTION 2:Which Real-World Data Sources Are Most Important?
SECTION 3:Centralized Resources Support Enterprise-Wide RWD Use
SECTION 4:Usage & Benefits of Analytics by Functional Area
SECTION 5:Overcoming Barriers: Where is the Industry Headed?
3 | Panalgo.com
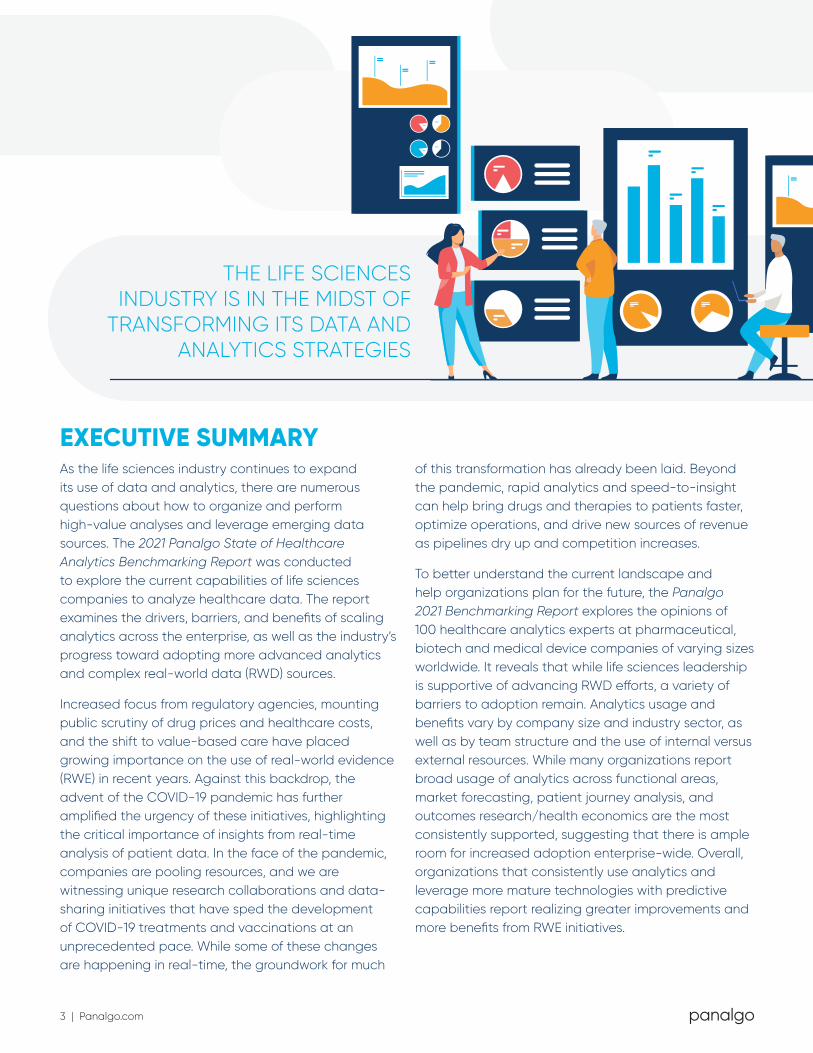
EXECUTIVE SUMMARYAs the life sciences industry continues to expand its use of data and analytics, there are numerous questions about how to organize and perform high-value analyses and leverage emerging data sources. The 2021 Panalgo State of Healthcare Analytics Benchmarking Report was conducted to explore the current capabilities of life sciences companies to analyze healthcare data. The report examines the drivers, barriers, and benefits of scaling analytics across the enterprise, as well as the industry’s progress toward adopting more advanced analytics and complex real-world data (RWD) sources.
Increased focus from regulatory agencies, mounting public scrutiny of drug prices and healthcare costs, and the shift to value-based care have placed growing importance on the use of real-world evidence (RWE) in recent years. Against this backdrop, the advent of the COVID-19 pandemic has further amplified the urgency of these initiatives, highlighting the critical importance of insights from real-time analysis of patient data. In the face of the pandemic, companies are pooling resources, and we are witnessing unique research collaborations and data-sharing initiatives that have sped the development of COVID-19 treatments and vaccinations at an unprecedented pace. While some of these changes are happening in real-time, the groundwork for much
of this transformation has already been laid. Beyond the pandemic, rapid analytics and speed-to-insight can help bring drugs and therapies to patients faster, optimize operations, and drive new sources of revenue as pipelines dry up and competition increases.
To better understand the current landscape and help organizations plan for the future, the Panalgo 2021 Benchmarking Report explores the opinions of 100 healthcare analytics experts at pharmaceutical, biotech and medical device companies of varying sizes worldwide. It reveals that while life sciences leadership is supportive of advancing RWD efforts, a variety of barriers to adoption remain. Analytics usage and benefits vary by company size and industry sector, as well as by team structure and the use of internal versus external resources. While many organizations report broad usage of analytics across functional areas, market forecasting, patient journey analysis, and outcomes research/health economics are the most consistently supported, suggesting that there is ample room for increased adoption enterprise-wide. Overall, organizations that consistently use analytics and leverage more mature technologies with predictive capabilities report realizing greater improvements and more benefits from RWE initiatives.
THE LIFE SCIENCES INDUSTRY IS IN THE MIDST OF
TRANSFORMING ITS DATA AND ANALYTICS STRATEGIES
4 | Panalgo.com
As life sciences companies look to implement a comprehensive analytics strategy and optimize RWD use, here are three steps an organization should consider taking based on the opinions and experiences of top pharmaceutical, biotech, and medical device companies:
1. Centralize analytics. Build out RWD teams with a variety of backgrounds and areas of expertise (e.g., epidemiologists, data scientists, IT personnel, health economists) and set up cross-functional partnerships both internally and externally. Organizations with centralized analytics teams that support multiple functional areas are better able to drive standardization and efficiencies.
2. Improve access to RWD. Broaden the use of RWD by creating a centralized data mart to democratize data access across the enterprise and drive faster analyses. Explore emerging, non-traditional data sources such as integrated claims-EHR data, genomic data, and data from wearables to uncover previously unavailable insights.
The Panalgo 2021 Benchmarking Survey was administered to individuals directly involved in healthcare analytics who work at a pharmaceutical, biotech, or medical device company. The survey consisted of 15 questions, in addition to sub-questions with response matrices. The survey was commissioned by Panalgo and conducted by FiercePharma. Experts in healthcare analytics and real-world data created the questionnaire to ensure maximum usefulness. Survey administration ended once 100 respondents were obtained.
According to the U.S. Food and Drug Administration (FDA), the definition of real-world data is as follows1:
Real-world data are the data relating to patient health status and/or the delivery of health care routinely collected from a variety of sources. RWD can come from a number of sources, for example:
• Electronic health records (EHRs)• Claims and billing activities• Product and disease registries• Patient-generated data including, in home-use
settings• Data gathered from other sources that can inform
on health status, such as mobile devices
Survey Respondents and Methodology
What is Real-World Data (RWD)?
3. Invest in analytics platforms. Leverage a common analytics platform to increase efficiency and collaboration. A central library of shared algorithms, dictionaries, and reusable cohorts, for example, drives richer and more timely insights across the enterprise. Organizations that stay abreast of the latest new technologies and approaches, such as machine learning, will be best prepared to uncover novel insights.
As RWE initiatives continue to transform traditional operating paradigms and facilitate new industry collaborations, organizations that invest in data and analytics will be best prepared to succeed in the ever-competitive healthcare landscape.
4 | Panalgo.com
5 | Panalgo.com
Key takeaways from the survey reveal:
Analytics Usage. Analytics is used broadly across organizations, but more often in support of commercial and market access activities than clinical initiatives.
Real-World Data Use. Life sciences organizations are generally most interested in EHR data. Biotech and small companies have a greater interest in digital health sources than pharma and large companies.
Benefits of Analytics. Uncovering novel insights and productivity improvements are the most frequently cited benefits of using an analytics platform. Health economics, clinical trial protocol design and market forecasting activities are reported to benefit the most from analytics.
Barriers to Adoption. Lack of experienced analysts and inadequate access to data are reported to be hindering the use of analytics. Executive support for investing in analytics and tools was reported to be high, with less than one in five respondents citing this as a barrier.
Advanced Analytics & Machine Learning. While it has not yet been widely adopted, the industry reports high confidence that machine learning will significantly improve critical activities, particularly health economics, market forecasting, and disease identification.
This report explores these findings in greater detail and offers insights into the future trajectory of RWD and analytics use in life sciences organizations.
INTRODUCTIONThe last few years have witnessed the ongoing expansion of real-world healthcare data sources, along with increased acceptance of the use of such data by regulatory agencies worldwide, including the U.S. Food and Drug Administration (FDA), the European Medicines Agency (EMA), and various health technology assessment agencies. Increasingly, rich RWD sources are helping to augment traditional randomized controlled trials (RCT) and are being leveraged with modern analytic tools to rapidly provide previously unavailable insights. These new sources of information and analytics capabilities offer the promise of addressing unmet medical needs, driving deeper engagement with patients, reducing healthcare costs, and improving the overall quality of care.
However, we are entering a new frontier in healthcare, and integrating RWD with data analysis techniques is not always straightforward. Questions regarding data privacy, quality and interoperability remain, and most organizations are still exploring how to best leverage these new data sources and analytics capabilities.
Despite the complexities, the pace of research in today’s hyper-competitive environment and the ongoing shift to value-based contracting has escalated the need for expedited answers. Leveraging RWD to find these answers and make better-informed decisions begins with building out internal capabilities. While some life sciences companies have already implemented machine learning and RWE initiatives, the Panalgo 2021 Benchmarking Survey reveals that the level of sophistication varies and there is room for significant improvement.
Innovative organizations that are reaping the most benefits typically have significant support from senior leadership. They also have an established team of centralized analysts with a variety of backgrounds (e.g., data science, epidemiology, health economics) who service the needs of multiple functional areas and have easy access to data and common analytics platforms. These companies are poised to benefit the most from this changing environment.
Respondents reported performing a variety of different functions when it comes to managing healthcare analytics in the enterprise. The level of involvement
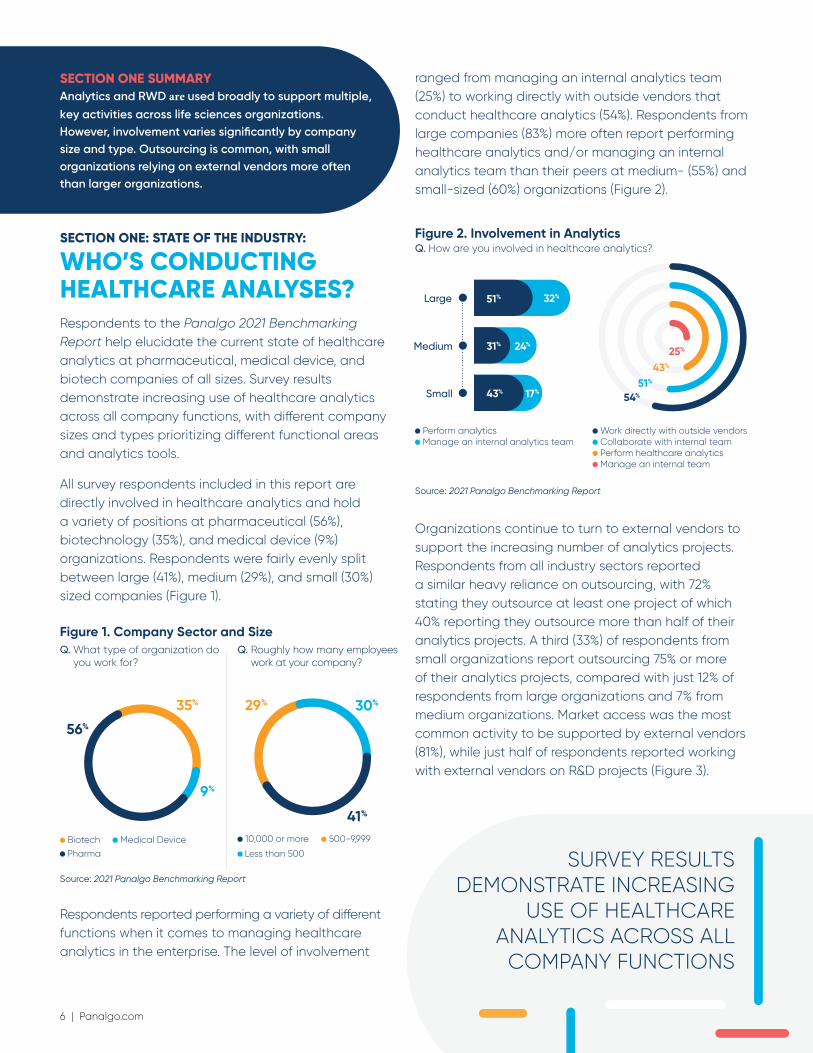
ranged from managing an internal analytics team (25%) to working directly with outside vendors that conduct healthcare analytics (54%). Respondents from large companies (83%) more often report performing healthcare analytics and/or managing an internal analytics team than their peers at medium- (55%) and small-sized (60%) organizations (Figure 2).
Organizations continue to turn to external vendors to support the increasing number of analytics projects. Respondents from all industry sectors reported a similar heavy reliance on outsourcing, with 72% stating they outsource at least one project of which 40% reporting they outsource more than half of their analytics projects. A third (33%) of respondents from small organizations report outsourcing 75% or more of their analytics projects, compared with just 12% of respondents from large organizations and 7% from medium organizations. Market access was the most common activity to be supported by external vendors (81%), while just half of respondents reported working with external vendors on R&D projects (Figure 3).
Figure 2. Involvement in AnalyticsQ. How are you involved in healthcare analytics?
Large
Medium
Small
51% 32%
31% 24%
43% 17%
Perform analytics Manage an internal analytics team
Work directly with outside vendors Collaborate with internal team Perform healthcare analytics Manage an internal team
54%
51%
43%
25%
SURVEY RESULTS DEMONSTRATE INCREASING
USE OF HEALTHCARE ANALYTICS ACROSS ALL
COMPANY FUNCTIONS
Source: 2021 Panalgo Benchmarking Report
Source: 2021 Panalgo Benchmarking Report
Biotech Medical Device Pharma
10,000 or more 500-9,999
Less than 500
9%
35%
56%
41%
30%29%
Q. What type of organization doyou work for?
Q. Roughly how many employeeswork at your company?
SECTION ONE SUMMARYAnalytics and RWD are used broadly to support multiple, key activities across life sciences organizations. However, involvement varies significantly by company size and type. Outsourcing is common, with small organizations relying on external vendors more often than larger organizations.
SECTION ONE: STATE OF THE INDUSTRY:
WHO’S CONDUCTING HEALTHCARE ANALYSES?Respondents to the Panalgo 2021 Benchmarking Report help elucidate the current state of healthcare analytics at pharmaceutical, medical device, and biotech companies of all sizes. Survey results demonstrate increasing use of healthcare analytics across all company functions, with different company sizes and types prioritizing different functional areas and analytics tools.
All survey respondents included in this report are directly involved in healthcare analytics and hold a variety of positions at pharmaceutical (56%), biotechnology (35%), and medical device (9%) organizations. Respondents were fairly evenly split between large (41%), medium (29%), and small (30%) sized companies (Figure 1).
Figure 1. Company Sector and Size
6 | Panalgo.com
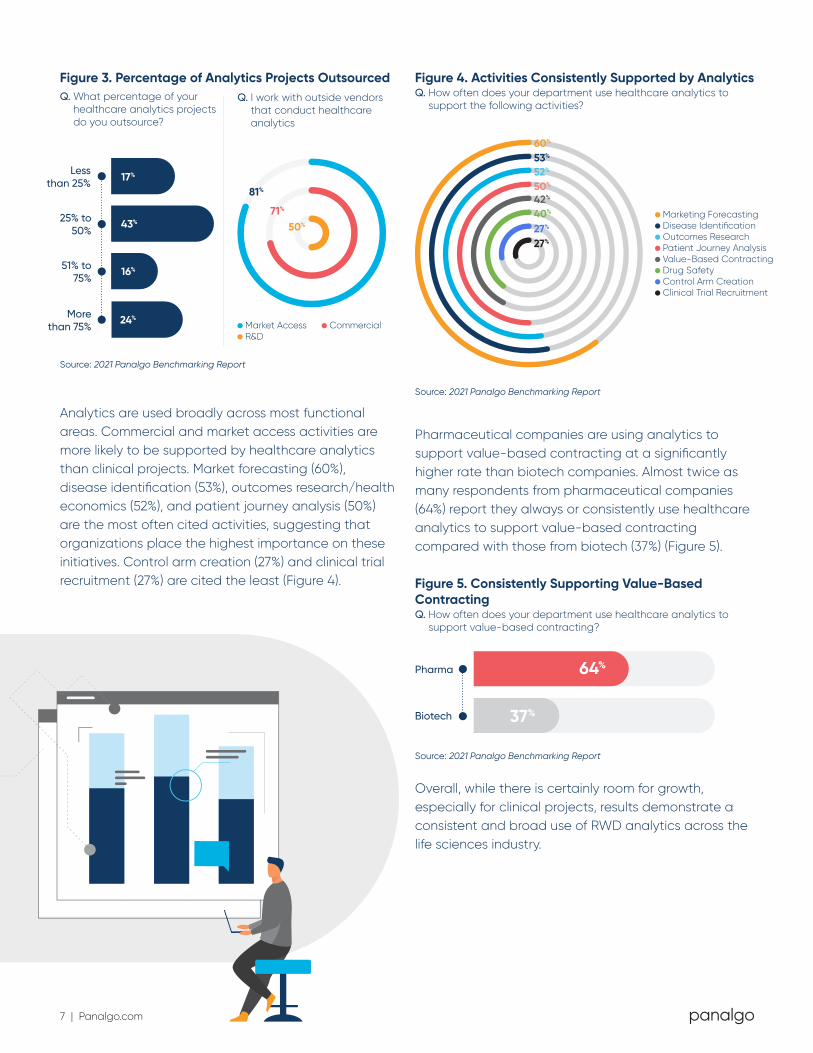
Analytics are used broadly across most functional areas. Commercial and market access activities are more likely to be supported by healthcare analytics than clinical projects. Market forecasting (60%), disease identification (53%), outcomes research/health economics (52%), and patient journey analysis (50%) are the most often cited activities, suggesting that organizations place the highest importance on these initiatives. Control arm creation (27%) and clinical trial recruitment (27%) are cited the least (Figure 4).
64%
37%
Pharma
Biotech
Q. What percentage of your healthcare analytics projects do you outsource?
Figure 4. Activities Consistently Supported by Analytics Q. How often does your department use healthcare analytics to
support the following activities?
Figure 5. Consistently Supporting Value-Based ContractingQ. How often does your department use healthcare analytics to
support value-based contracting?
Less than 25%
25% to 50%
51% to 75%
More than 75%
16%
43%
17%
24% Market Access Commercial R&D
Q. I work with outside vendors that conduct healthcare analytics
81%
71%
50%
60%
53%
52%
50%
42%
27%
27%
40% Marketing Forecasting Disease Identification Outcomes Research Patient Journey Analysis Value-Based Contracting Drug Safety Control Arm Creation Clinical Trial Recruitment
Source: 2021 Panalgo Benchmarking Report
Source: 2021 Panalgo Benchmarking Report
Source: 2021 Panalgo Benchmarking Report
Pharmaceutical companies are using analytics to support value-based contracting at a significantly higher rate than biotech companies. Almost twice as many respondents from pharmaceutical companies (64%) report they always or consistently use healthcare analytics to support value-based contracting compared with those from biotech (37%) (Figure 5).
Overall, while there is certainly room for growth, especially for clinical projects, results demonstrate a consistent and broad use of RWD analytics across the life sciences industry.
Figure 2. Involvement in AnalyticsSource: 2021 Panalgo Benchmarking Report
Figure 3. Percentage of Analytics Projects Outsourced
7 | Panalgo.com
8 | Panalgo.com
37%46%
SECTION TWO:
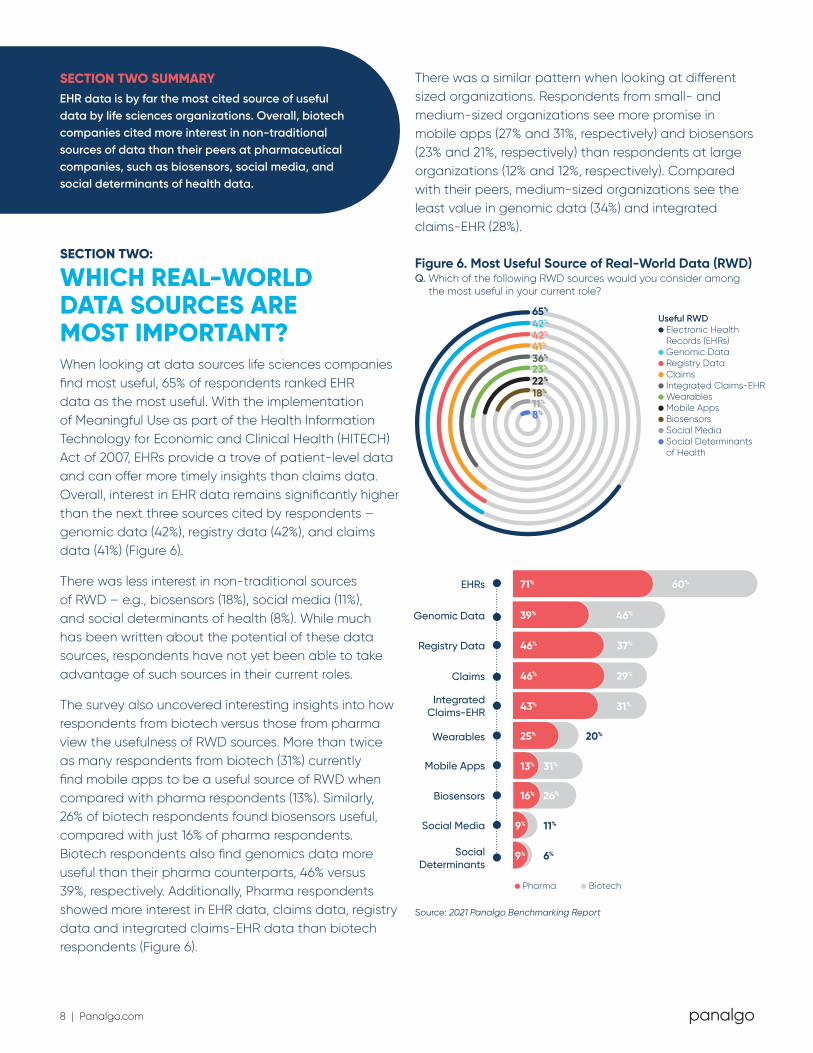
WHICH REAL-WORLD DATA SOURCES ARE MOST IMPORTANT? When looking at data sources life sciences companies find most useful, 65% of respondents ranked EHR data as the most useful. With the implementation of Meaningful Use as part of the Health Information Technology for Economic and Clinical Health (HITECH) Act of 2007, EHRs provide a trove of patient-level data and can offer more timely insights than claims data. Overall, interest in EHR data remains significantly higher than the next three sources cited by respondents – genomic data (42%), registry data (42%), and claims data (41%) (Figure 6).
There was less interest in non-traditional sources of RWD – e.g., biosensors (18%), social media (11%), and social determinants of health (8%). While much has been written about the potential of these data sources, respondents have not yet been able to take advantage of such sources in their current roles.
The survey also uncovered interesting insights into how respondents from biotech versus those from pharma view the usefulness of RWD sources. More than twice as many respondents from biotech (31%) currently find mobile apps to be a useful source of RWD when compared with pharma respondents (13%). Similarly, 26% of biotech respondents found biosensors useful, compared with just 16% of pharma respondents. Biotech respondents also find genomics data more useful than their pharma counterparts, 46% versus 39%, respectively. Additionally, Pharma respondents showed more interest in EHR data, claims data, registry data and integrated claims-EHR data than biotech respondents (Figure 6).
SECTION TWO SUMMARYEHR data is by far the most cited source of useful data by life sciences organizations. Overall, biotech companies cited more interest in non-traditional sources of data than their peers at pharmaceutical companies, such as biosensors, social media, and social determinants of health data.
There was a similar pattern when looking at different sized organizations. Respondents from small- and medium-sized organizations see more promise in mobile apps (27% and 31%, respectively) and biosensors (23% and 21%, respectively) than respondents at large organizations (12% and 12%, respectively). Compared with their peers, medium-sized organizations see the least value in genomic data (34%) and integrated claims-EHR (28%).
Pharma Biotech
71% 60%
46%39%
46%
43%
25% 20%
31%
26%
11%
6%
9%
9%
13%
16%
31%
29%
EHRs
Genomic Data
Registry Data
Claims
Integrated Claims-EHR
Wearables
Mobile Apps
Biosensors
Social Media
Social Determinants
Figure 6. Most Useful Source of Real-World Data (RWD)Q. Which of the following RWD sources would you consider among
the most useful in your current role?
Useful RWD Electronic Health Records (EHRs) Genomic Data Registry Data Claims Integrated Claims-EHR Wearables Mobile Apps Biosensors Social Media Social Determinants of Health
65%
42%
42%
41%
36%
23%
11%18%22%
8%
Source: 2021 Panalgo Benchmarking Report
9 | Panalgo.com
SECTION THREE:
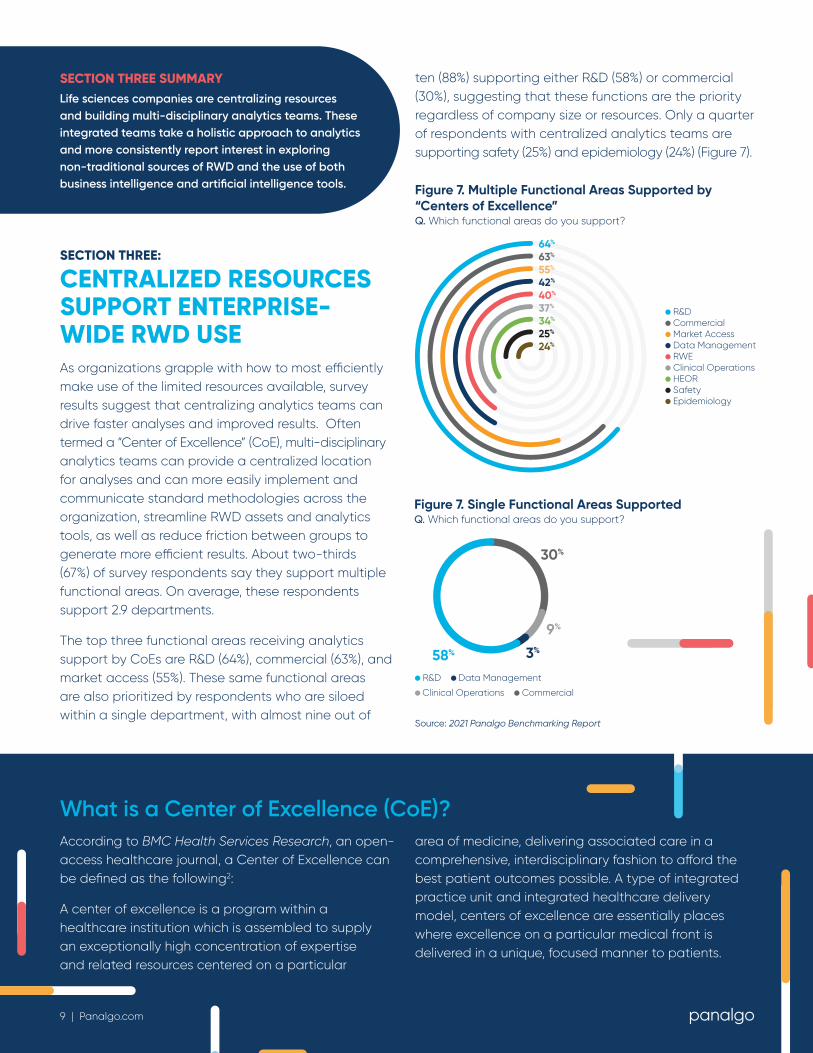
CENTRALIZED RESOURCES SUPPORT ENTERPRISE- WIDE RWD USEAs organizations grapple with how to most efficiently make use of the limited resources available, survey results suggest that centralizing analytics teams can drive faster analyses and improved results. Often termed a “Center of Excellence” (CoE), multi-disciplinary analytics teams can provide a centralized location for analyses and can more easily implement and communicate standard methodologies across the organization, streamline RWD assets and analytics tools, as well as reduce friction between groups to generate more efficient results. About two-thirds (67%) of survey respondents say they support multiple functional areas. On average, these respondents support 2.9 departments.
The top three functional areas receiving analytics support by CoEs are R&D (64%), commercial (63%), and market access (55%). These same functional areas are also prioritized by respondents who are siloed within a single department, with almost nine out of
According to BMC Health Services Research, an open-access healthcare journal, a Center of Excellence can be defined as the following2:
A center of excellence is a program within a healthcare institution which is assembled to supply an exceptionally high concentration of expertise and related resources centered on a particular
area of medicine, delivering associated care in a comprehensive, interdisciplinary fashion to afford the best patient outcomes possible. A type of integrated practice unit and integrated healthcare delivery model, centers of excellence are essentially places where excellence on a particular medical front is delivered in a unique, focused manner to patients.
What is a Center of Excellence (CoE)?
ten (88%) supporting either R&D (58%) or commercial (30%), suggesting that these functions are the priority regardless of company size or resources. Only a quarter of respondents with centralized analytics teams are supporting safety (25%) and epidemiology (24%) (Figure 7).
SECTION THREE SUMMARYLife sciences companies are centralizing resources and building multi-disciplinary analytics teams. These integrated teams take a holistic approach to analytics and more consistently report interest in exploring non-traditional sources of RWD and the use of both business intelligence and artificial intelligence tools.
R&D Data Management
Clinical Operations Commercial
58%
9%
3%
30%
Figure 7. Single Functional Areas SupportedQ. Which functional areas do you support?
Figure 7. Multiple Functional Areas Supported by “Centers of Excellence”Q. Which functional areas do you support?
64%
63%
55%
42%
40%
37%
24%25%34%
R&D Commercial Market Access Data Management RWE Clinical Operations HEOR Safety Epidemiology
Source: 2021 Panalgo Benchmarking Report
9 | Panalgo.com
10 | Panalgo.com
Respondents report differences in how centralized analytics teams view the usefulness of claims data and integrated claims-EHR data when compared to teams that support single functional areas. Respondents who support multiple departments are nearly twice as likely as those who support single departments to view claims data as useful (49% versus 24%, respectively) and similarly, to view integrated claims-EHR data as useful (45% versus 18%, respectively). Fifty-eight percent of respondents who support a single functional area work in R&D, which often relies more on EHR data (Figure 8).
Figure 8. Most Useful Source of Real-World Data (RWD)Q. Which of the following RWD sources would be most useful to your
current role?
Claims
Integrated Claims-EHR
24% 49%
18% 45%
Single Departments Multiple Departments
Figure 9. Types of Analytics Tools UsedQ. What types of analytics tools do you use to examine
healthcare data?
Business Intelligence
Artificial Intelligence
55% 66%
9% 27%
Single Departments Multiple Departments
Multidisciplinary teams also report a difference in the use of business intelligence and artificial intelligence (AI) tools compared to teams that support a single department. Three times as many respondents that support multiple teams (27%) use an AI tool versus
Bringing many functional areas, such as R&D, commercial, health economics outcomes research (HEOR), market access, and epidemiology under the support of a centralized RWD analytics function can improve efficiencies and reduce the number of resources needed to conduct analyses and studies. Along with streamlined collaboration, productivity improvements via standardized methodologies, efficient allocation of analysts, and reduction in technology and database redundancies would contribute to a more effective centralized RWD analytics function.
respondents who support a single department (9%) (Figure 9).
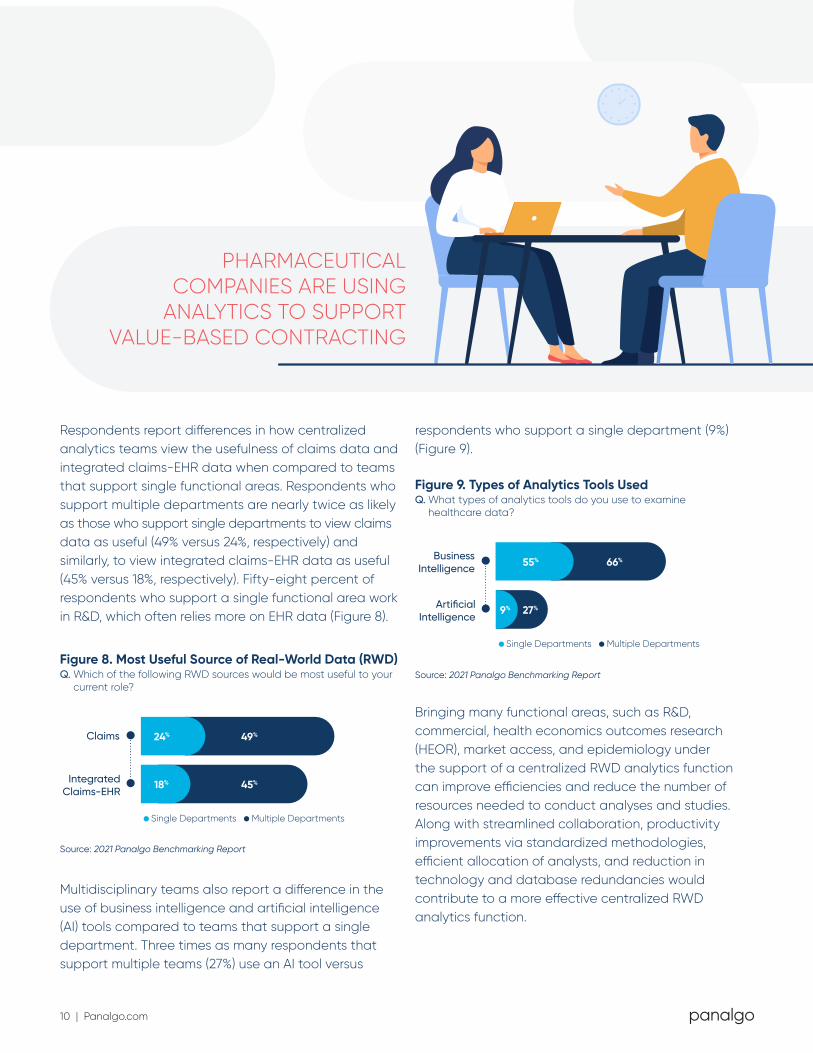
PHARMACEUTICAL COMPANIES ARE USING
ANALYTICS TO SUPPORT VALUE-BASED CONTRACTING
Source: 2021 Panalgo Benchmarking Report
Source: 2021 Panalgo Benchmarking Report
11 | Panalgo.com
SECTION FOUR:
USAGE & BENEFITS OF ANALYTICS BY FUNCTIONAL AREALife sciences organizations of all sizes report wide use of analytics across the enterprise and tend to be generally aligned on which departments and activities should use analytics the most. The types of analytics tools used varied across a range of technologies, including statistical programming languages, open-source platforms, proprietary healthcare analytics platforms, business intelligence tools, and AI tools.
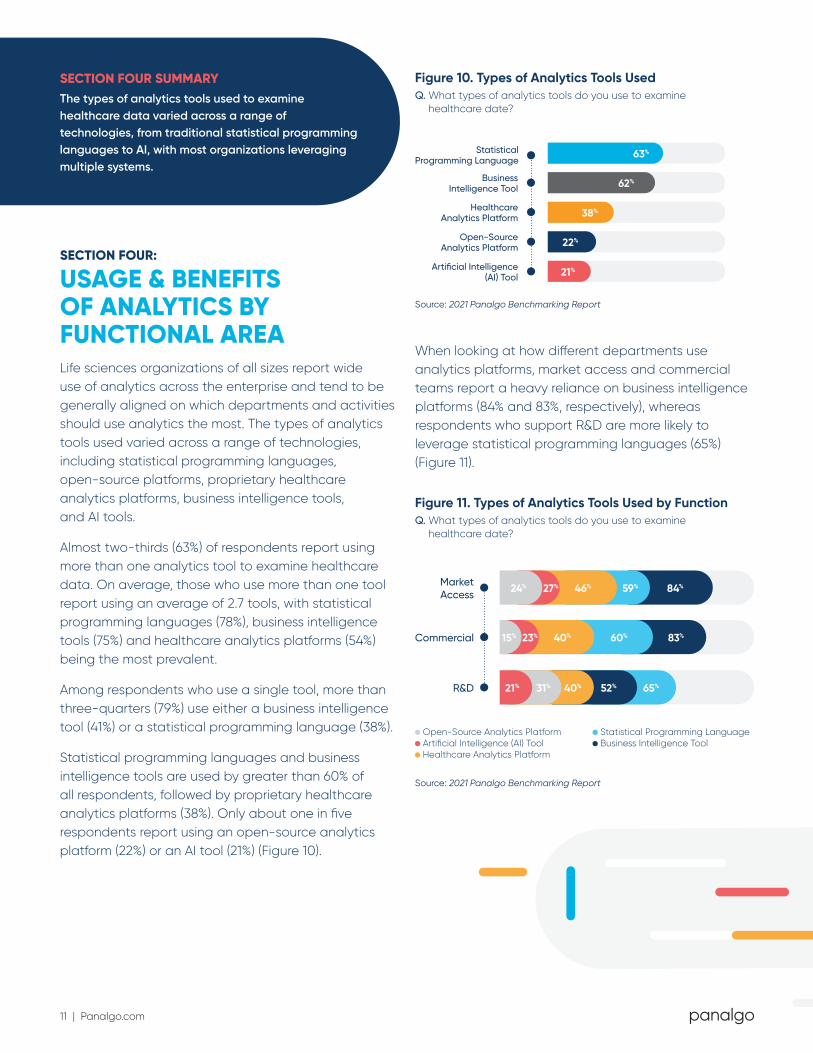
Almost two-thirds (63%) of respondents report using more than one analytics tool to examine healthcare data. On average, those who use more than one tool report using an average of 2.7 tools, with statistical programming languages (78%), business intelligence tools (75%) and healthcare analytics platforms (54%) being the most prevalent.
Among respondents who use a single tool, more than three-quarters (79%) use either a business intelligence tool (41%) or a statistical programming language (38%).
Statistical programming languages and business intelligence tools are used by greater than 60% of all respondents, followed by proprietary healthcare analytics platforms (38%). Only about one in five respondents report using an open-source analytics platform (22%) or an AI tool (21%) (Figure 10).
When looking at how different departments use analytics platforms, market access and commercial teams report a heavy reliance on business intelligence platforms (84% and 83%, respectively), whereas respondents who support R&D are more likely to leverage statistical programming languages (65%) (Figure 11).
SECTION FOUR SUMMARYThe types of analytics tools used to examine healthcare data varied across a range of technologies, from traditional statistical programming languages to AI, with most organizations leveraging multiple systems.
Open-Source Analytics Platform Artificial Intelligence (AI) Tool Healthcare Analytics Platform
Figure 11. Types of Analytics Tools Used by FunctionQ. What types of analytics tools do you use to examine
healthcare date?
Market Access
Commercial
R&D 65%52%40%31%21%
15% 23% 40% 60% 83%
24% 27% 46% 59% 84%
Source: 2021 Panalgo Benchmarking Report
Statistical Programming Language
Business Intelligence Tool
Healthcare Analytics Platform
Open-Source Analytics Platform
Artificial Intelligence (AI) Tool
63%
62%
38%
22%
21%
Figure 10. Types of Analytics Tools UsedQ. What types of analytics tools do you use to examine
healthcare date?
Source: 2021 Panalgo Benchmarking Report
Statistical Programming Language Business Intelligence Tool
12 | Panalgo.com
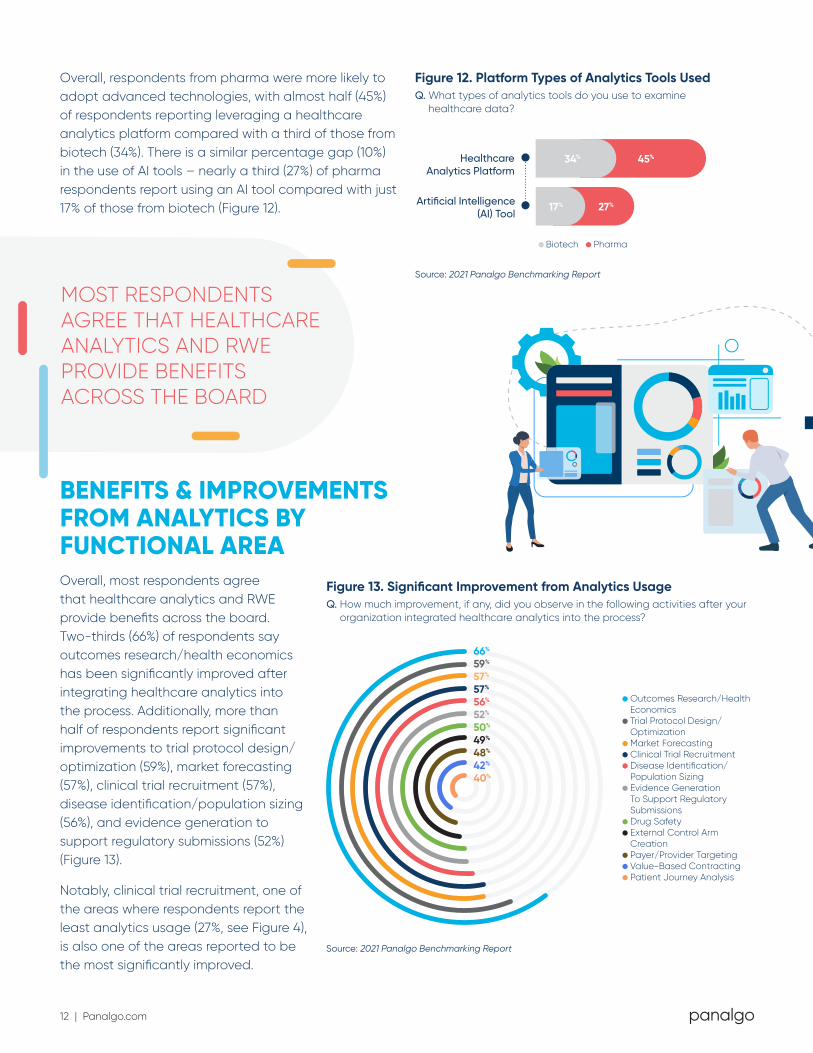
Overall, respondents from pharma were more likely to adopt advanced technologies, with almost half (45%) of respondents reporting leveraging a healthcare analytics platform compared with a third of those from biotech (34%). There is a similar percentage gap (10%) in the use of AI tools – nearly a third (27%) of pharma respondents report using an AI tool compared with just 17% of those from biotech (Figure 12).
MOST RESPONDENTS AGREE THAT HEALTHCARE ANALYTICS AND RWE PROVIDE BENEFITS ACROSS THE BOARD
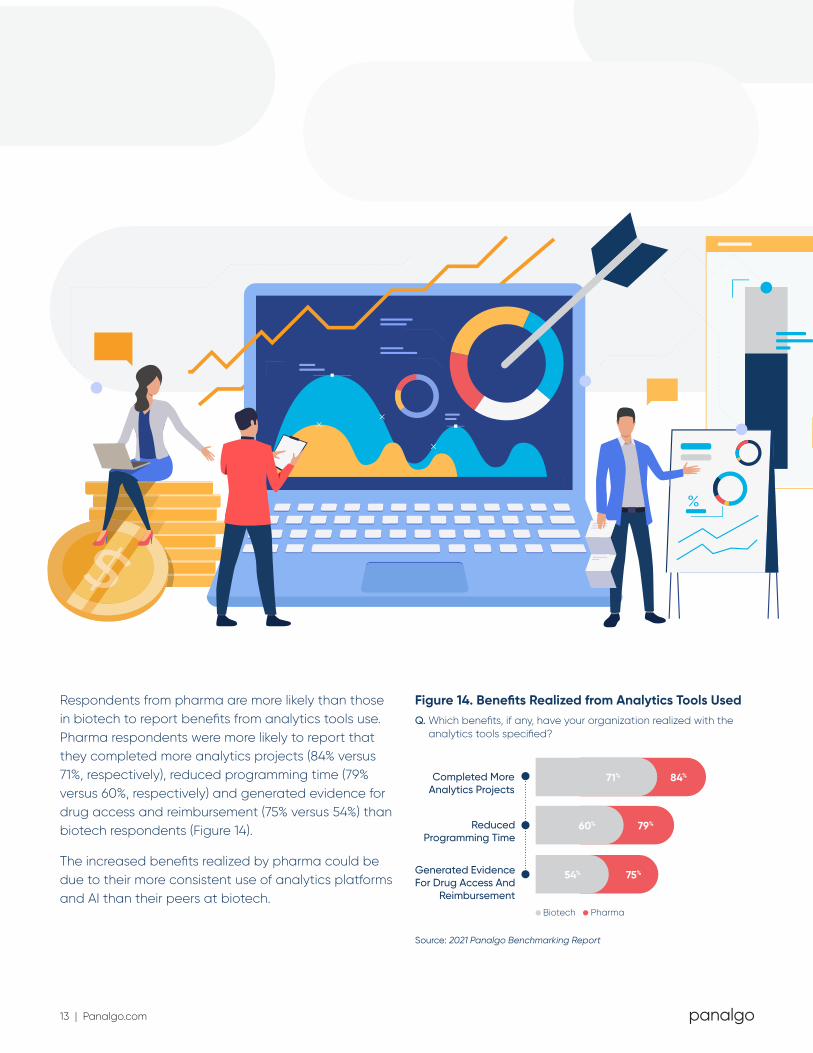
Overall, most respondents agree that healthcare analytics and RWE provide benefits across the board. Two-thirds (66%) of respondents say outcomes research/health economics has been significantly improved after integrating healthcare analytics into the process. Additionally, more than half of respondents report significant improvements to trial protocol design/optimization (59%), market forecasting (57%), clinical trial recruitment (57%), disease identification/population sizing (56%), and evidence generation to support regulatory submissions (52%) (Figure 13).
Notably, clinical trial recruitment, one of the areas where respondents report the least analytics usage (27%, see Figure 4), is also one of the areas reported to be the most significantly improved.
Outcomes Research/Health Economics Trial Protocol Design/Optimization Market Forecasting Clinical Trial Recruitment Disease Identification/Population Sizing Evidence Generation To Support Regulatory Submissions Drug Safety External Control Arm Creation Payer/Provider Targeting Value-Based Contracting Patient Journey Analysis
Figure 13. Significant Improvement from Analytics UsageQ. How much improvement, if any, did you observe in the following activities after your
organization integrated healthcare analytics into the process?
66%
59%
57%
57%
56%
52%
48%
42%
40%
49%50%
BENEFITS & IMPROVEMENTS FROM ANALYTICS BY FUNCTIONAL AREA
Healthcare Analytics Platform
Artificial Intelligence (AI) Tool
34% 45%
17% 27%
Biotech Pharma
Figure 12. Platform Types of Analytics Tools Used Q. What types of analytics tools do you use to examine
healthcare data?
Source: 2021 Panalgo Benchmarking Report
Source: 2021 Panalgo Benchmarking Report
13 | Panalgo.com
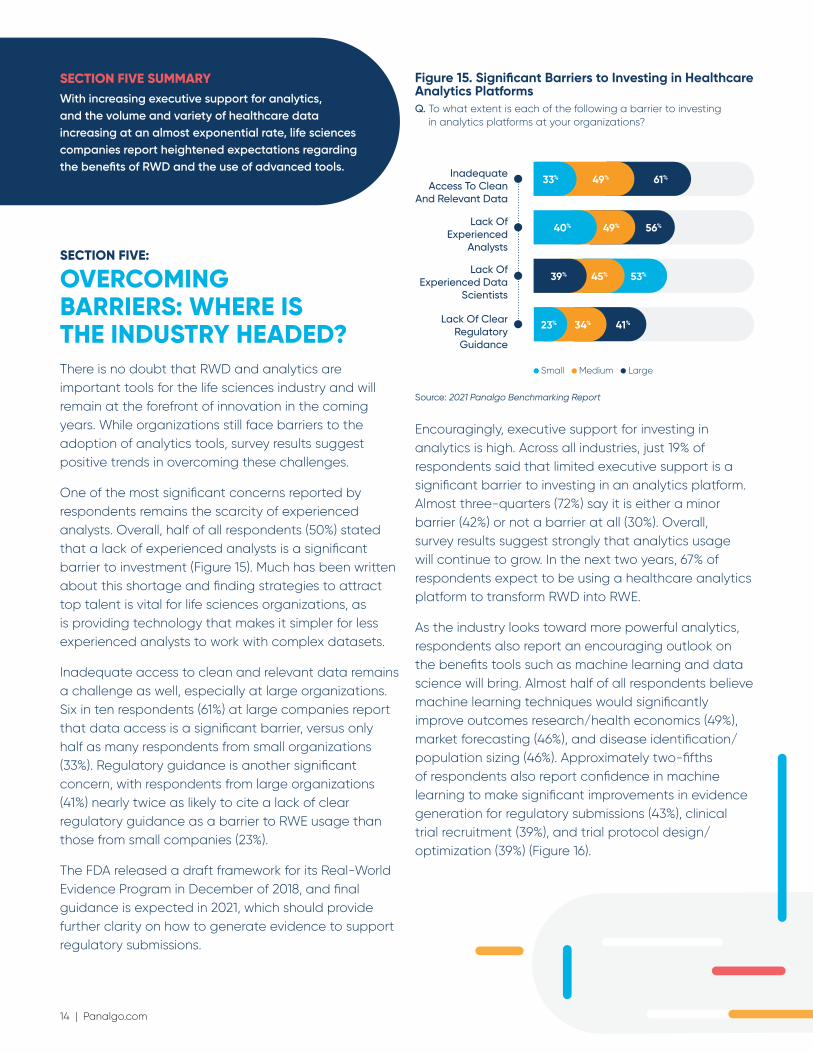
Respondents from pharma are more likely than those in biotech to report benefits from analytics tools use. Pharma respondents were more likely to report that they completed more analytics projects (84% versus 71%, respectively), reduced programming time (79% versus 60%, respectively) and generated evidence for drug access and reimbursement (75% versus 54%) than biotech respondents (Figure 14).
The increased benefits realized by pharma could be due to their more consistent use of analytics platforms and AI than their peers at biotech.
Figure 14. Benefits Realized from Analytics Tools UsedQ. Which benefits, if any, have your organization realized with the
analytics tools specified?
Completed More Analytics Projects
Reduced Programming Time
Generated Evidence For Drug Access And
Reimbursement
71% 84%
60% 79%
54% 75%
Biotech Pharma
Source: 2021 Panalgo Benchmarking Report
14 | Panalgo.com
SECTION FIVE:
OVERCOMING BARRIERS: WHERE IS THE INDUSTRY HEADED?There is no doubt that RWD and analytics are important tools for the life sciences industry and will remain at the forefront of innovation in the coming years. While organizations still face barriers to the adoption of analytics tools, survey results suggest positive trends in overcoming these challenges.
One of the most significant concerns reported by respondents remains the scarcity of experienced analysts. Overall, half of all respondents (50%) stated that a lack of experienced analysts is a significant barrier to investment (Figure 15). Much has been written about this shortage and finding strategies to attract top talent is vital for life sciences organizations, as is providing technology that makes it simpler for less experienced analysts to work with complex datasets.
Inadequate access to clean and relevant data remains a challenge as well, especially at large organizations. Six in ten respondents (61%) at large companies report that data access is a significant barrier, versus only half as many respondents from small organizations (33%). Regulatory guidance is another significant concern, with respondents from large organizations (41%) nearly twice as likely to cite a lack of clear regulatory guidance as a barrier to RWE usage than those from small companies (23%).
The FDA released a draft framework for its Real-World Evidence Program in December of 2018, and final guidance is expected in 2021, which should provide further clarity on how to generate evidence to support regulatory submissions.
SECTION FIVE SUMMARYWith increasing executive support for analytics, and the volume and variety of healthcare data increasing at an almost exponential rate, life sciences companies report heightened expectations regarding the benefits of RWD and the use of advanced tools.
Encouragingly, executive support for investing in analytics is high. Across all industries, just 19% of respondents said that limited executive support is a significant barrier to investing in an analytics platform. Almost three-quarters (72%) say it is either a minor barrier (42%) or not a barrier at all (30%). Overall, survey results suggest strongly that analytics usage will continue to grow. In the next two years, 67% of respondents expect to be using a healthcare analytics platform to transform RWD into RWE.
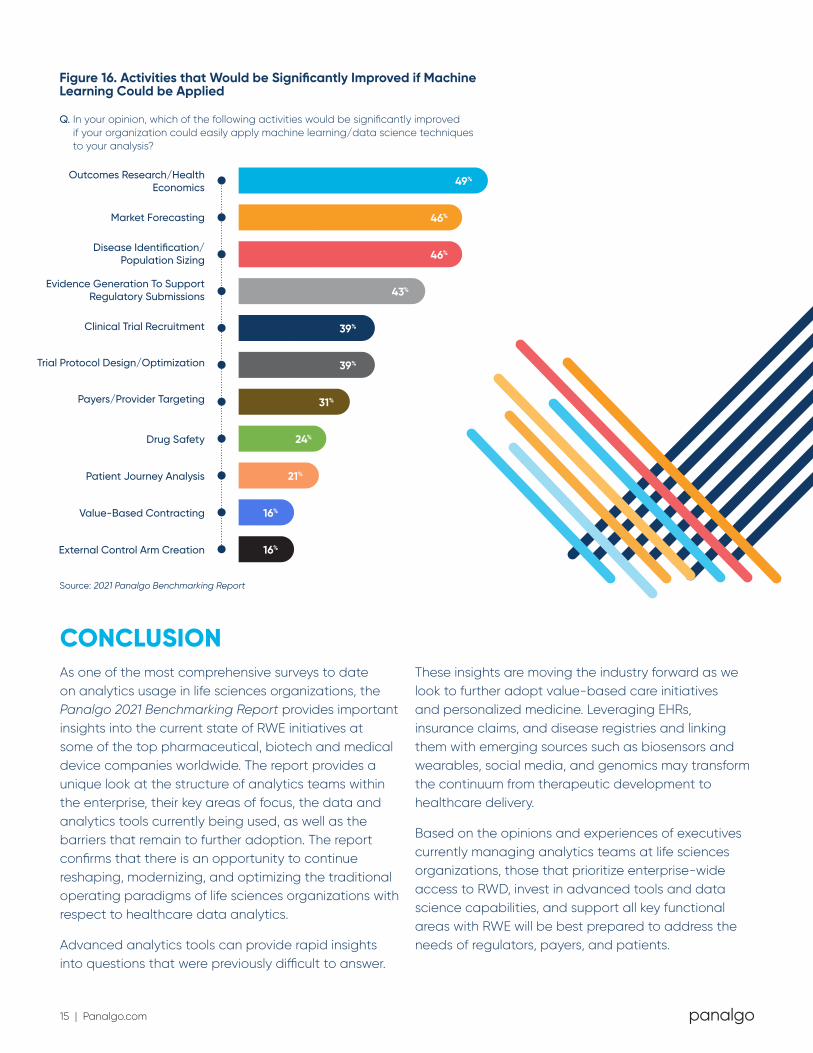
As the industry looks toward more powerful analytics, respondents also report an encouraging outlook on the benefits tools such as machine learning and data science will bring. Almost half of all respondents believe machine learning techniques would significantly improve outcomes research/health economics (49%), market forecasting (46%), and disease identification/population sizing (46%). Approximately two-fifths of respondents also report confidence in machine learning to make significant improvements in evidence generation for regulatory submissions (43%), clinical trial recruitment (39%), and trial protocol design/optimization (39%) (Figure 16).
Inadequate Access To Clean
And Relevant Data
Lack Of Experienced
Analysts
Lack Of Experienced Data
Scientists
Lack Of Clear Regulatory Guidance
33% 49% 61%
40% 49% 56%
39% 45% 53%
23% 34% 41%
Small Medium Large
Figure 15. Significant Barriers to Investing in Healthcare Analytics PlatformsQ. To what extent is each of the following a barrier to investing
in analytics platforms at your organizations?
Source: 2021 Panalgo Benchmarking Report
15 | Panalgo.com
Outcomes Research/Health Economics
Market Forecasting
Disease Identification/Population Sizing
Trial Protocol Design/Optimization
Payers/Provider Targeting
Drug Safety
Patient Journey Analysis
Value-Based Contracting
External Control Arm Creation
49%
46%
46%
43%
39%
39%
31%
24%
21%
16%
16%
Clinical Trial Recruitment
Evidence Generation To Support Regulatory Submissions
Figure 16. Activities that Would be Significantly Improved if Machine Learning Could be Applied
Q. In your opinion, which of the following activities would be significantly improved if your organization could easily apply machine learning/data science techniques to your analysis?
As one of the most comprehensive surveys to date on analytics usage in life sciences organizations, the Panalgo 2021 Benchmarking Report provides important insights into the current state of RWE initiatives at some of the top pharmaceutical, biotech and medical device companies worldwide. The report provides a unique look at the structure of analytics teams within the enterprise, their key areas of focus, the data and analytics tools currently being used, as well as the barriers that remain to further adoption. The report confirms that there is an opportunity to continue reshaping, modernizing, and optimizing the traditional operating paradigms of life sciences organizations with respect to healthcare data analytics.
Advanced analytics tools can provide rapid insights into questions that were previously difficult to answer.
These insights are moving the industry forward as we look to further adopt value-based care initiatives and personalized medicine. Leveraging EHRs, insurance claims, and disease registries and linking them with emerging sources such as biosensors and wearables, social media, and genomics may transform the continuum from therapeutic development to healthcare delivery.
Based on the opinions and experiences of executives currently managing analytics teams at life sciences organizations, those that prioritize enterprise-wide access to RWD, invest in advanced tools and data science capabilities, and support all key functional areas with RWE will be best prepared to address the needs of regulators, payers, and patients.
CONCLUSION
Source: 2021 Panalgo Benchmarking Report
16 | Panalgo.com
Panalgo, formerly BHE, provides software that streamlines healthcare data analytics by removing complex programming from the equation. Our Instant Health Data (IHD) software empowers teams to generate and share trustworthy results faster, enabling more impactful decisions.
ABOUT PANALGO
To learn more, visit us at PANALGO.COM To request a demo of our IHD software, please contact us at [email protected]
CITATION
1. U.S. Food and Drug Administration. 2020. Real-World Evidence. [online] Available at: <https://www.fda.gov/science-research/science-and-research-special-topics/real-world-evidence> [Accessed 17 November 2020].
2. Elrod, J. and Fortenberry, J., 2020. Centers Of Excellence In Healthcare Institutions: What They Are And How To Assemble Them. [online] Available
at: <https://www.ncbi.nlm.nih.gov/pmc/articles/PMC5516836/> [Accessed 17 November 2020].
3. Davis, B., Morgan, J. and Shah, S., 2020. The Future Of Real-World Evidence. [online] Deloitte. Available at: <https://www2.deloitte.com/us/en/insights/industry/life-sciences/2018-real-world-evidence-benchmarking.html> [Accessed 17 November 2020].