2021 uli cleveland emerging trends
TRANSCRIPT
2021 Emerging Trends in Real EstateNortheast Ohio

SponsorsULI Cleveland Leadership2021 Focus Group ParticipantsEmerging Trends Overview
ULI Cleveland Survey ProcessNational Emerging Trends Summary
Regional Economic SummaryProperty Sector Analyses
OfficeIndustrialRetailMultifamily
Emerging Trends in Real Estate2021
Content
i
iiiiiiv123589111315

Written ByJack Newton, Project Manager, GBX Group LLC
Emerging Trends CommitteeKirby Date, AICP, Principal, KM Date Community Planning, LLC
Michael Smith, Principal, Green Harvest CapitalRank Dawson, CFA, VP Investment Strategy, Boyd Watterson Asset Management
Prepared For ULI Cleveland
ii

Steve RossCBREVice PresidentDistrict Council Chair
Christina FronczekAssurance Senior ManagerRSM US LLPTreasurer
Cathryn GreenwaldThompson HinePartnerChair of Mission Advancement
Mackenzie MakepeaceRMS Investment CorpDirector of Real Estate DevelopmentGovernance Committee, Immediate Past District Council Chair
Erin RyanRycon Construction, Inc.Business Development ManagerProgram Committee Co-Chair
Jack NewtonGBX GroupProject ManagerPrograms Committee Co-Chair
Zoe AdamsThe NRP Group, LLCSenior Marketing ManagerWomen’s Leadership Initiative Co-Chair
Jennifer Beer (Heimlich)Walter & Haverfield LLPAssociate AttorneyWomen’s Leadership Initiative Co-Chair
Anthony WhitfieldFairfax Renaissance Development CorporationEconomic Development DirectorOutreach Committee Co-Chair
Rob WeeksR-Weeks ConsultingOutreach Committee Co-Chair
Eileen McConvilleWeston Inc.Sponsorship Committee
Paul BeeganBeegan Architectural Design, LLCRegional Product Council Chair
Kirstyn WildeyMcDonald HopkinsBusiness and Real Estate AttorneyMembership Committee Co-Chair
Dave MaderChicago TitleCommercial Sales ExecutiveMembership Committee Co-Chair
Liesel SchmaderAllegro RealtyAssociateYoung Leader Co-Chair
Ali KarolczakRedwood LivingDirector of ProjectsYoung Leader Co-Chair
Linda StriefskyThompson HineRetired PartnerGovernance Committee
Greg WardHuntington BankSenior Vice President –Institutional Commercial Real EstateGovernance Committee
Melanie KortykaULI ClevelandDistrict Council Manager
ULI Cleveland Leadership
iii

Aaron Pechota, The NRP Group LLCAdam Branscomb, Fairmount PropertiesAli Wismer, Redwood LivingAmy Whitacre, First American TitleArthur Schmidt IV, OHM AdvisorsBryan Stone, Axiom DevelopmentCameron Orlean, The Orlean CompanyDaniel Walsh, Citymark CapitalDavid Browning, CBREErin Blaskovic, Cleveland ConstructionIsaac Robb, Western Reserve Land ConservancyJim Doyle, Bellwether EnterpriseJim Rokakis, Thriving Communities InstituteJoe Marinucci, Downtown Cleveland AllianceJohn Kelley, Newmark Knight FrankKen Kalynchuk, PMCKevin Nowak, CHNLee Chilcote, Chilcote Law Firm LLP
Linda Striefsky, Thompson HIne LLPPaul Nadin, RSMRandy Ruttenberg, Fairmount PropertiesRank Dawson,Boyd Watterson Asset ManagementSteve Ross, CBRETania Menesse, City of ClevelandTaylor Hawkins,Bellwether EnterpriseTracey Nichols, PMC
2021 Focus Group Participants
iv

Emerging Trends Overview
1
2
36.8%
22.8%
21.1%
7.0%
5.3%5.3%
1.8%
Director/ManagerVice PresidentOwnerPresident/CEOAssociateOtherEVP/CFO/COO
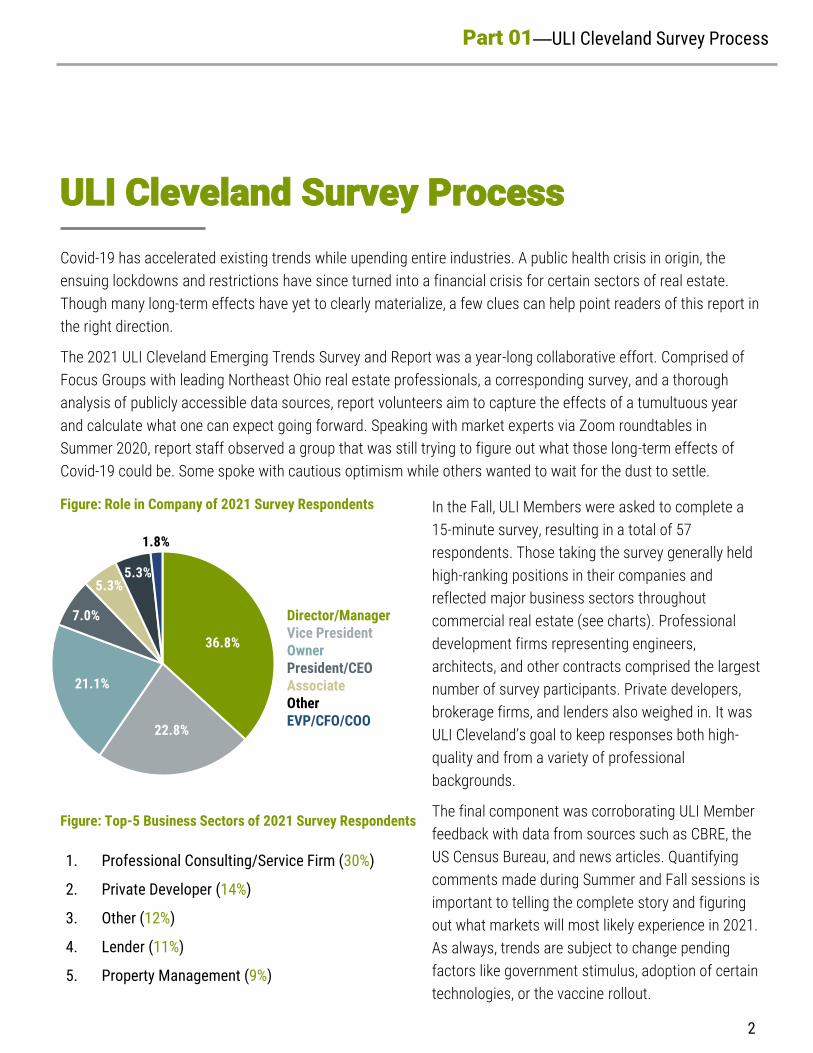
1. Professional Consulting/Service Firm (30%)
2. Private Developer (14%)
3. Other (12%)
4. Lender (11%)
5. Property Management (9%)
Figure: Top-5 Business Sectors of 2021 Survey Respondents
Figure: Role in Company of 2021 Survey Respondents
Part 01—ULI Cleveland Survey Process
In the Fall, ULI Members were asked to complete a
15-minute survey, resulting in a total of 57
respondents. Those taking the survey generally held
high-ranking positions in their companies and
reflected major business sectors throughout
commercial real estate (see charts). Professional
development firms representing engineers,
architects, and other contracts comprised the largest
number of survey participants. Private developers,
brokerage firms, and lenders also weighed in. It was
ULI Cleveland’s goal to keep responses both high-
quality and from a variety of professional
backgrounds.
The final component was corroborating ULI Member
feedback with data from sources such as CBRE, the
US Census Bureau, and news articles. Quantifying
comments made during Summer and Fall sessions is
important to telling the complete story and figuring
out what markets will most likely experience in 2021.
As always, trends are subject to change pending
factors like government stimulus, adoption of certain
technologies, or the vaccine rollout.
Covid-19 has accelerated existing trends while upending entire industries. A public health crisis in origin, the
ensuing lockdowns and restrictions have since turned into a financial crisis for certain sectors of real estate.
Though many long-term effects have yet to clearly materialize, a few clues can help point readers of this report in
the right direction.
The 2021 ULI Cleveland Emerging Trends Survey and Report was a year-long collaborative effort. Comprised of
Focus Groups with leading Northeast Ohio real estate professionals, a corresponding survey, and a thorough
analysis of publicly accessible data sources, report volunteers aim to capture the effects of a tumultuous year
and calculate what one can expect going forward. Speaking with market experts via Zoom roundtables in
Summer 2020, report staff observed a group that was still trying to figure out what those long-term effects of
Covid-19 could be. Some spoke with cautious optimism while others wanted to wait for the dust to settle.
ULI Cleveland Survey Process

2021 Emerging Trends in Real EstateUnited States and Canada
Covid-19 Accelerates Change in Real Estate Industry:Focus on Social Justice and Wellness Reign Supreme as Economic Uncertainty Remains
Part 02—National Emerging Trends Summary
The 2021 ULI National report highlights how Covid-19 heightened the desirability of lower density areas for both residential and commercial real estate, with interest concentrated in the Sunbelt markets. Cost-conscious companies will gravitate toward cities that are business-friendly and low cost with large, growing workforces. Raleigh/Durham, N.C., for example, is nicknamed the “Bay Area of the East Coast,” due to a surge in technology jobs and the area’s reputation as an education mecca. Homebuyers will look to suburban locations with low taxes, affordable housing, auto-oriented transportation, and good job prospects. While growth in the suburbs has been a consistent trend since this report first predicted five years ago, greater family formation among millennials and flexible work from home policies are boosting this shift.
Social unrest and protests in cities across the country have also played a role in the reevaluation of presence in urban cores. 70% of [National Emerging Trends in Real Estate 2021 Report] respondents agree that the real estate industry can address and help end systemic racism—from promoting diversity, equity and inclusion within the sector to looking for ways to develop underserved communities. On a rating scale of social issues in real estate, income and racial inequality moved from little to moderate importance last year, to moderate to great importance.
“Times of great change always present significant opportunities,” said W. Ed Walter, Global CEO of ULI. “In the near term, our suburbs will benefit from new growth spurred by shifting demographics and
changes to living and working patterns resulting from the Covid-19 crisis.
Our cities will have the opportunity to respond by reimagining their public realm, building more resiliency, and reinventing assets, such as retail, that were already struggling before the pandemic. As an industry we have the opportunity to strengthen by truly embracing diversity and tackling the challenges faced by our communities.”
“Now, more than ever, the real estate industry has the chance to take the lead in using planning and development skills and investment capital to reshape our work and lifestyle environments. These tools can be used to address societal issues of safety, green space and racial equity,” says Byron Carlock, PwC Partner and U.S. Real Estate Practice Leader. “The gauntlet of responsibility is ours to embrace, and industry leaders see the opportunities and are responding with investment and leadership.”
Trends Highlighted in the National Report include:
The Economy (and Real Estate Sector) Hang On:Though real estate capital markets have settled, most anticipate overall real estate prices to fall 5-10% as income is curtailed for several years. Industrial properties, data centers and single-family homes are expected to rise in value, while retail and hospitality will see the largest decline. The long-term outlook in the real estate sector hinges on the country’s ability to reign in Covid-19.
3
Part 02—National Emerging Trends Summary
Exodus to the ‘Burbs:Covid-19 is accelerating suburban growth, especially in the Sunbelt markets. Appearing first in the 2020 report and now ranked second for 2021, Austin, TX has continued to see a surge in the suburban office and homebuilding sectors. With a greater emphasis on health and safety, the need for lower density environments and more space has only grown. Remote work and higher taxes in large cities due to declining tourism and business tax revenue are contributing to the shift away from an urban core.
Work from Home Changes Office Outlook:The rapid shift to widespread remote work is considered the ultimate test of digital transformation in the workplace. Companies that invested in digital capabilities saw great success with work from home policies, and 94% of real estate professionals agree that companies will allow employees to work remotely at least part of the time in the future. As a result, some businesses will shrink their footprints as a cost savings measure. However, more than 60% of professionals agree that office tenants will look to expand spaces for new ways of collaboration and interaction while complying with social distancing measures.
The Essentials: Safety and Wellness:82% of professionals agree that health and wellbeing will become a more important factor across all sectors of real estate. The industry will need to meet higher standards of cleanliness and safety to make tenants and customers feel safe and attract them back—particularly at hotels, office buildings, retail and restaurants. The new focus on personal safety will lead to new services and advanced technology that provide cleaner buildings, improved HVAC infrastructure, sensors, touchless entry and contact tracing apps.
Social Justice and Racial Equity Now:The industry must do more to address social and racial inequity in the US. Nearly half (48%) of respondents disagree that real estate understands how past policies and practices have contributed to systemic racism. 70% agree that the real estate industry can address and
help racial inequality. Existing job training and recruiting programs for minorities and underserved communities need to be supported and expanded. Real estate professionals are also evaluating efforts to invest and develop minority and low-income neighborhoods with an emphasis on housing and schools.
Stores Still Matter:The next few years promise to be “retail’s great transition period,” as demand for large retailers and department stores dwindles in favor of discount stores, fast fashion and online retail. More than 80% of participants agreed that Covid-19 accelerated the shift in retail that likely would have occurred over the next few years. Expect to see a much smaller physical retail presence and vast amounts of vacant space with lower rents. Top brands will take advantage of lower prices to upgrade their locations, while malls will leverage empty space to improve their tenant roster or convert to distribution centers for online retailers.
Affordable Housing Remains a Major Issue:Covid-19 has only accelerated the housing disparities in the US as many low-income workers experience unemployment and possible eviction. With state and local governments facing large revenue declines, experts agree that the federal government has the wherewithal to provide programs and resources to this problem, including expansion of the Low-Income Housing Tax Credit and Housing Choice vouchers.
The Great Fiscal Challenge:Real estate taxes, generally the largest source of local government revenue, are likely to decline as hotels and shopping centers (and potentially offices) lose tenants and value. Long term revenue declines will affect all government services but could be particularly impactful on infrastructure investments, a critical need (not just for real estate) that this report highlighted for many years. An analysis by the National League of Cities predicts that 65% of cities will delay or cancel infrastructure projects due to Covid-19.
4

Regional Economy
5

Regional Economy
Part 03—Regional Economy
As with many sectors of the global economy, the
Coronavirus pandemic exploited and sped up
preexisting economic trends in Northeast Ohio.
According to Cleveland State University (CSU), the job
market was softening before government-mandated
lockdowns were in place, setting the stage for an
oversized impact on the region’s employment figures.
Of the top 40 Metros in the United States, Cleveland’s
job losses were fourth worst, performing better than
only Boston, Las Vegas, and New York City, the latter of
which was battered by the virus’ first wave. The
area’s prominent health care sector was disrupted
by the suspension of elective surgeries while sectors
like Business and Professional Services saw over
10% of jobs eliminated (see lower left chart).
Of Ohio’s three major metropolitan areas, Cleveland
experienced the largest increase in unemployment
as a result of the pandemic (see lower right chart).
Topping out at 22.4% in April 2020, the vulnerable
job market saw a worrying spike compared to
Leisure and Hospitality
Professional and Business Services
Education and Health Services
Trade, Transportation, and Utilities
Manufacturing
Financial Activities
Other Services
Government
Information
Mining, Logging, and Construction
-30,000 -20,000 -10,000 0 10,000
Figure: Change in No. of Jobs, Nov ‘19 thru Nov ‘20
Source: OH Bureau of Labor Market Information, Q1 2021
0
5
10
15
20
25
Oct
-19
No
v-19
Dec
-19
Jan-
20
Feb-
20
Mar
-20
Apr
-20
May
-20
Jun-
20
Jul-2
0
Aug
-20
Sep
-20
Oct
-20
No
v-20
Dec
-20
Figure: Unemployment Rate by MSA, Oct ’19 thru Dec ‘20
Source: OH Bureau of Labor Market Information, Q1 2021
“State and Federal programs will hopefully help Ohio be more
competitive with manufacturing coming back from overseas.”
Unemployment Rate (%)No. of Jobs
CLEVELAND COLUMBUS
CINCINNATI
6

Market Data & Analysis
Columbus (13.7%) and Cincinnati (14.1%). Jobs have
since returned to Northeast Ohio, dropping the
unemployment rate to 5.8%.
Incomes are up across the Cleveland Metropolitan
Area (see chart to right). Between Q2 2019 and Q2
2020, weekly wages in Cuyahoga County were up 8% to
$1,168, the largest growth rate in the MSA. Medina
County posted the second highest rate (7.8%) as
incomes there increased by $256 dollars per month.
Prior to the pandemic’s effects, Cuyahoga County
boasted the largest GDP in Ohio by total dollars. The
five counties making up Cleveland-Elyria MSA had a
total output of $118 million, with three of the counties
(Cuyahoga, Lake, and Lorain) ranking in Ohio’s top-15.
This provides a cautious optimism for recovery.
Virtual work is providing flexibility unlike ever before,
creating a new economic geography. Many in coastal
cities have returned to smaller metros in the Midwest
and Southeast to take advantage of lower costs of
living and proximity to family. Northeast Ohio is likely
to see a positive impact from this trend, albeit small-
scale.
ULI’s 2021 Emerging Trends in Real Estate United
States and Canada report rates Cleveland favorably for
development prospects. The cost of doing business in
Northeast Ohio is roughly 10% less expensive than the
country’s average. However, this contrasts local
stories of material sourcing issues and higher labor
costs. Construction costs are slightly down across the
Figure: GDP by County, 2016 thru 2019
country—0.3% in Cleveland–which should help
proformas. To build out an Office space in the region
costs roughly $120 per sq. ft., half of that in New York
City.
The City of Cleveland, like many other major cities
throughout the country, relies heavily on income taxes
as a source of revenue. Roughly 65% of the money
coming into the City are from workers salaries whose
jobs are physically in Cleveland. While there existed
enough reserves to shore up the 2020 budget
shortfalls caused by the pandemic, future
conversations about remote work and sharing of
income taxes will undoubtedly be had.
Source: Bureau of Economic Analysis, Q1 2021
County Thousands of chained (2012) dollars Rank in state Percent change Rank in state
2016 2017 2018 2019 2019 2017 2018 2019 2019
Cuyahoga 83,020,201 84,385,012 86,762,595 87,921,020 1 1.6 2.8 1.3 43
Lake 9,894,855 9,811,846 10,077,505 10,266,470 11 -0.8 2.7 1.9 33
Lorain 9,264,642 9,195,992 9,339,435 9,390,379 12 -0.7 1.6 0.5 55
Medina 6,417,786 6,571,017 6,736,604 6,802,952 18 2.4 2.5 1.0 48
Geauga 3,634,004 3,654,111 3,742,179 3,797,778 32 0.6 2.4 1.5 41
0
1
2
3
4
5
6
7
8
9
0
200
400
600
800
1,000
1,200
1,400
CuyahogaCo.
Lake Co. Medina Co. Lorain Co. Geauga Co.
Figure: Weekly Wage Growth, Q2 2019 to Q2 2020
Dollars ($) Percent (%)
Source: Bureau of Labor Statistics, Q1 2021
Q2 2019 Q2 2020GROWTH RATE
7

Property Sector Analyses
8

Office
“Companies are going to take a really hard look at how much space they actually need."
Part 04—Office Market
With trends like remote work and public health
affecting the region’s office sector, many Northeast
Ohio real estate professionals are delaying big
decisions. "All of us in our professions want certainty
and plan on certainty,” said one ULI Cleveland Focus
Group member, “and I think we’re going to need to
remain flexible.” Tenants are delaying investments until
the picture becomes clearer, especially surrounding
how best to integrate employees back into the office.
In response to this, decision makers will seek to
maximize existing space or even shrink their square
footage. Creatively—and safely–distributing workers
throughout the office will build on flexible office space
trends. They will have to think more carefully about how
employees move throughout the office or how to best
regulate air quality. Public health will become a more
frequent factor in how to use space efficiently.
Survey respondents agree that Cleveland’s office
market cycle is in the stages of either early or advanced
decline. Companies invested in their virtual
infrastructure and have discovered that employees do
not always need to be in the office. "There's certainly
been a quantum leap in the acceptability of people
working remotely,“ said a Focus Group participant.
Because of this, expect a slow-down in office
construction in the near-term. This trend is being seen
around the country, but rather acutely in Cleveland.
Cleveland has a 27,000-job deficit in traditional
office-using jobs like Financial Services, Information,
and Professional & Business Services compared to
November 2019. So as expected, available equity
capital will most likely pull back in response to local
and national real estate trends. Almost 80% of
survey respondents expect there to be some level of
decline in available equity for office product. Like
national markets, much of this comes from
hesitancy as fundamentals return to normal.
One subsector that bucks this trend is Medical
Office, in which respondents have much more
confidence. Over 60% believe Medical Office is either
in growth or peak market cycle stages. The
Cleveland Clinic is one of the top hospitals in the
world, and National Focus Group participants in that
market noted that “health care tech is growing in
Cleveland.” The region performed well in CBRE’s
2019 U.S. Life Science Clusters: Markets Positioned
for the Century of Biology. Notably, Cleveland logged
more biologists, biochemists, biophysicists, and
chemists than any other Ohio market. With the
pandemic and corresponding vaccine highlighting
the importance of biology in a global world, expect
this type of office space to continue to outperform
the broader market.
9

Market Data & Analysis
Subleases placed roughly 200,000 sq. ft. back on the
market in Q3 2020. Since real estate tends to be a
lagging indicator for the larger economy, this reflects
Cleveland’s significant office-using job losses in Q2
2020. The suburban market accounted for 83% of the
square-footage given back, most of which occurred in
the Southwest submarket. Companies will continue to
evaluate the amount of space they actually need to
remain productive going forward.
Large tenants stayed committed to downtown
Cleveland long-term (see figure below) despite the
pandemic’s negative impact on neighborhood
amenities. CBRE reports that over the last three
quarters, the Central Business District has either led
leasing activity or finished as a close second place. A
prime example is Sherwin-Williams moving forward
with the construction of a 1 million sq. ft. headquarters
between Public Square and the Warehouse District.
Renewals remain consistent, though lease terms may
be shorter to allow flexibility.
Asking lease rates performed stably despite the rise in
sublease activity. Hovering between $19.50 and $20
Figure: Q3 2020 Leasing Activity and Asking Rate by
Submarket
per-square-foot since Q4 2018, space in the downtown
Cleveland is the most expensive of all submarkets.
Driven primarily by the “flight to quality” trend, CBD
Class A office rents have steadily increased during that
same period. At 21% vacant, Class B office space may
continue to struggle with future corporate downsizing.
Sherwin-Williams currently occupies over 500,000 sq.
ft. in various downtown office buildings prior to the
construction of its new headquarters.
However, the continued removal of Class B and C
office space via conversion will help bolster CBD
metrics. In August 2020, the Tower at Erieview
received $5 million in historic tax credits that will help
convert 20 of the building’s 40 floors into a hotel,
removing a 380,000 sq. ft. of Class B space from the
market. The newly designated Erieview Historic District
contains several other Class B office buildings that
currently sit vacant or are underoccupied.
Though the suburbs experienced a tough quarter, long-
term metrics remain healthy. Vacancy in the popular
East submarket, home of the Chagrin and Lander
Corridors, sits at just 10.5%— roughly half the rate of
the CBD. Lease rates in the East submarket are above
$21 per sq. ft., putting it on par with Class A asking
rates in downtown Cleveland. Rent growth remained
modest overall, but subleasing trends could impact
asking rates.
Construction and deliveries in Cleveland’s office
market slowed, perhaps contributing to lease rate
stability. Notable projects under development include
the Avian at Thunderbird, a 20,000 sq. ft. warehouse-
turned-office project on Scranton Peninsula, as well as
Swagelok’s new $30 million, 130,000 sq. ft.
headquarters in Solon. The latter project expects to
add 400 new jobs and $87 million over the next 10
years. Like markets around the country, Cleveland’s
office developers will most likely wait to assess long-
term, pandemic-related trends.
0
5
10
15
20
25
0
20
40
60
80
100
120
140
160
180
Sq. Ft. (000’s) Lease Rate ($/SF)
LEASING ACTIVITY
Source: CBRE Research, Q1 2021
ASKING LEASE RATE
10

Industrial
Part 05—Industrial Market
The replacement of vacant malls with Amazon
fulfillment centers was poetic. It also dictated the
impact that ecommerce will have on the sector’s short-
and long-term impact. Overall growth of online sales
most likely saw its peak in 2020, according to CBRE’s
U.S. Outlook 2021, but demand will continue to
strengthen. “The ability to have money to do spec is
good,” noted a Focus group participant, “and the State
is putting up cash to do that [through the Ohio Site
Inventory Program].” OSIP offers grants and low-
interest loans to support speculative real estate
projects. Supply chain disruptions have demonstrated
the value of onshoring as much manufacturing and
storage as possible. Companies should begin to
reinvest in the sector and strong public support will
help the region remain competitive.
Warehouses will also benefit from supply chain
uncertainty. Stockpiling extra materials picked up
during the US-China tariff-related trade disputes and
this trend will continue as supply chain redundancy is
established. Survey respondents overwhelmingly agree
that Northeast Ohio’s industrial sector is poised to grow
throughout 2021. They expect capital to find its way to
local projects, citing Covid-19 as a having a direct
impact on this trend.
Cleveland’s submarkets all offer ‘Fair’ to ‘Excellent’
prospects, according to survey respondents. Leading
the way is the Southeastern Cuyahoga County near the
cities of Solon, Twinsburg, and Macedonia. CBRE’s Q3
2020 Industrial MarketView reflects this as well, citing
the Southeast submarket’s strong performance during
the pandemic.
Construction in the region remains modest. CBRE
reports that roughly 800,000 sq. ft. are being developed
across the region, with 80% being bulk warehouse
space (see chart below). Activity near the North Randall
Amazon fulfillment center shows the strength of both
freeway proximity and the “Amazon Effect.”
“Manufacturing consolidation is being seen now, however, there is a strong push for warehouse and distribution.”
0
1
2
3
4
5
6
0
100
200
300
400
500
600
700
Warehouse/Distribution Manufacturing
Figure: Asking Lease Rates & New Construction
CURRENT ASKING LEASE RATEUNDER CONSTRUCTION
Source: CBRE Industrial MarketView, Q3 2020
Asking Lease Rate ($/sf)UC Sq. Ft. (000’s)
11
Market Data & Analysis
Cleveland’s Industrial market is a tale of two property
subtypes: Manufacturing and Warehouse/Distribution,
the latter of which had a much stronger performance in
2020. In response to increased ecommerce,
Warehouse/Distribution properties absorbed nearly
375,000 sq ft. in Q3 2020 according to CBRE’s
Industrial MarketView. Meanwhile, Manufacturing
properties placed 150,000 sq. ft. back on the market,
bringing the total through September to 431,267 sq. ft.
of negative net absorption.
Four of the top-5 transactions noted by CBRE were
new leases, and all top transactions were in
distribution facilities. The Southeast submarket, which
contains the important I-271 & I-480 junction, vastly
outperformed all other submarkets, accounting for the
only positive net absorption in the region. This explains
why the submarket boasts the largest inventory, low
vacancy, and favorable asking lease rates.
Lease rates for Cleveland’s industrial market remain
competitive nationally ($4.81), though slightly higher
than regional peers Columbus and Cincinnati.
Cleveland's warehouses tend to be older, with only 13
million sq. ft. (of 134 million) built after 1999. However,
lease rates for this property subtype ($6.23) are well
above the market average, which has led to a spate of
construction in the area.
At the end of Q3 2020, 624,000 sq. ft. of modern (i.e.
100,000 sq. ft. footprints and 24 ft. clear heights)
Warehouse/Distribution were under construction. This
will grow regional inventory by 4%, helping to ease the
high asking lease rates. One of the projects, the
300,000 sq. ft., $20 million Sapphire Corporate Center
in Middleburg Heights, is expected to deliver in January
2021. This property will take advantage of proximity to,
and direct visibility from I-71. 20801 Miles Rd. in North
Randall will also bring 300,000 sq. ft. of distribution
space to Northeast Ohio near the Amazon Fulfillment
center.
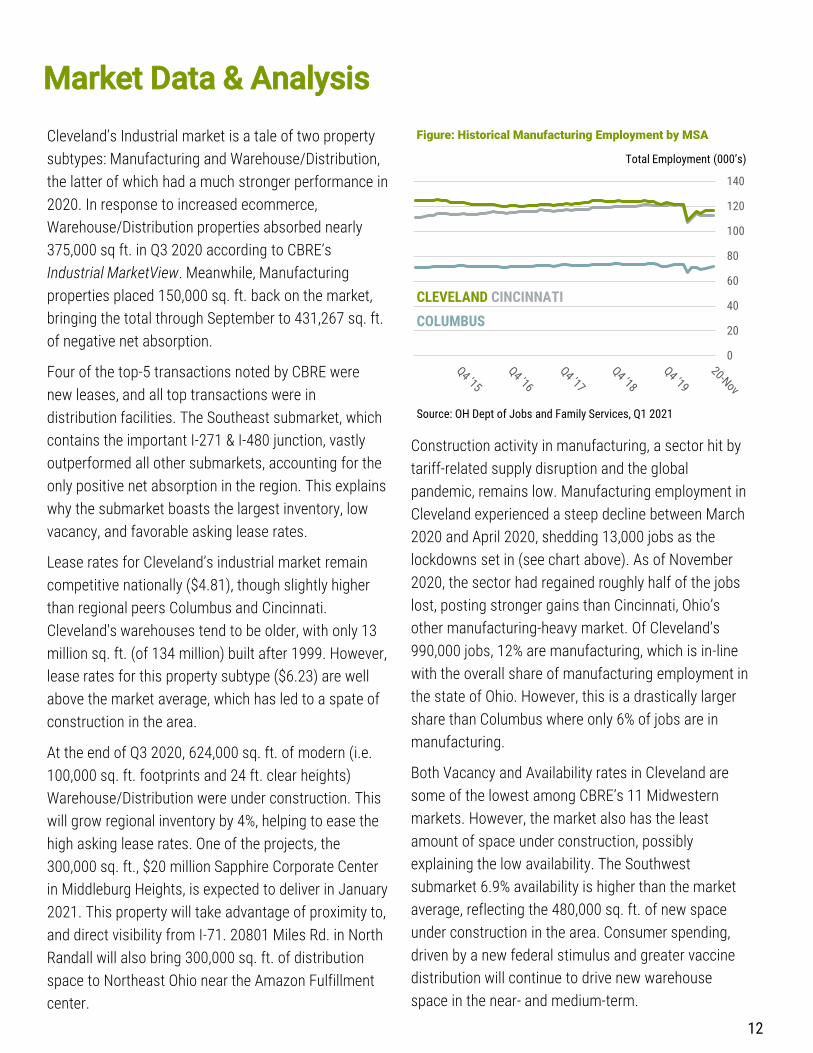
Construction activity in manufacturing, a sector hit by
tariff-related supply disruption and the global
pandemic, remains low. Manufacturing employment in
Cleveland experienced a steep decline between March
2020 and April 2020, shedding 13,000 jobs as the
lockdowns set in (see chart above). As of November
2020, the sector had regained roughly half of the jobs
lost, posting stronger gains than Cincinnati, Ohio’s
other manufacturing-heavy market. Of Cleveland’s
990,000 jobs, 12% are manufacturing, which is in-line
with the overall share of manufacturing employment in
the state of Ohio. However, this is a drastically larger
share than Columbus where only 6% of jobs are in
manufacturing.
Both Vacancy and Availability rates in Cleveland are
some of the lowest among CBRE’s 11 Midwestern
markets. However, the market also has the least
amount of space under construction, possibly
explaining the low availability. The Southwest
submarket 6.9% availability is higher than the market
average, reflecting the 480,000 sq. ft. of new space
under construction in the area. Consumer spending,
driven by a new federal stimulus and greater vaccine
distribution will continue to drive new warehouse
space in the near- and medium-term.
Figure: Historical Manufacturing Employment by MSA
Source: OH Dept of Jobs and Family Services, Q1 2021
Total Employment (000’s)
0
20
40
60
80
100
120
140
CLEVELAND CINCINNATI
COLUMBUS
12

Retail
“Cleveland already had a glut of retail and restaurant space, so recovery is going to be even harder.”
Part 06—Retail Market
Cleveland’s retail properties, like those around the
country, are in a state of transition. The pandemic has
accelerated trends of winners and losers in this
sector, with numerous retailers declaring bankruptcy.
One of the last remaining Northeast Ohio JC Penney
locations at the Shoppes at Parma will close soon,
adding to a growing list of closures seen in other
regional malls. Expect this to continue into 2021 as
structurally declining categories like department
stores and apparel chains feel the brunt of the
transition.
Lower rents could give way to more resilient—and
sometimes unique–retail concepts as second-
generation prime space will be available across the
region. This also includes further conversion of vacant
malls into industrial sites focusing on distribution. In
April 2020, Cleveland.com reported that the City View
Center could be rebranded into a business park like
several other sites in Northeast Ohio. Success of
projects like the Randall Park Mall’s conversion into an
Amazon fulfillment center bring optimism to a sector
that needs some forward momentum.
Brick-and-mortar locations are adjusting to an
environment with continually changing restrictions.
“Restaurants and other retailers are working hard to
break even,” stated a ULI Cleveland Focus Group
participant. During warmer months, patios served as
way to increase dining capacity; winter could prove a
significant test for the market.
Though growing, Cuyahoga County’s median household
income ($52,000) is just 79% of the national median.
While surrounding counties fair a bit better (see chart),
but those counties with higher median incomes also
have significantly less households making that amount
of money. With low growth and a recovering economy,
consumer spending in the region could be down.
However, revived Federal Stimulus dollars could provide
a cushion for the sector later in 2021.
Figure: Median HH Income & Total HH by County, 2019
Income ($/000’s) Households (000’s)
Source: United States Census Bureau, Q1 2021
TOTAL HOUSEHOLDS*
MEDIAN HH INCOME
*Note: Total US Households not included due to relevancy of comparison being made.
0
100
200
300
400
500
600
0
10
20
30
40
50
60
70
80
90
GeaugaCo.
MedinaCo.
Lake Co. Lorain Co.CuyahogaCo.
United States
13
Market Data & Analysis
Retail in Northeast Ohio was not immune to the
expediting of trends that already existed. According to
CBRE, the sector shed over 330,000 sq. ft. of
occupancy during the first half of 2020. Properties
across the region tell two different stories: one about
Power Centers—defined by CBRE as a property
collection of category-dominant anchors and only a
few small tenants ranging from 250,000 to 500,000 sq.
ft.— and big-box stores like Meijer and Menards, which
have opened multiple locations in the area over the
past several years.
Declining demand has been prevalent throughout the
country as major retailers such as JC Penney and J
Crew declare bankruptcy and actively reduce space. As
with most other real estate trends, Covid has merely
sped up existing changes. Brick and mortar locations
will remain relevant to omni-channel retail strategies,
the centers around Northeast Ohio could become a
situation of “haves” and “have nots.”
Creating unique mixes of retail has seen success. For
instance, Cuyahoga Community College renewed its
25,000 sq. ft. lease in a ground floor retail space at the
May, a newly opened adaptive reuse multifamily
project on Public Square. The Hospitality Management
Center of Excellence activates a storefront and
provides students an opportunity to learn in one of
downtown Cleveland’s entertainment districts.
Covid restrictions, such as capacity limitations, and
cold weather will continue to burden retailers into
2021. Those that were able to adapt to either a
curbside pickup or deliver model will be more
successful through the winter and early spring. With
the potential for more federal stimulus money, retailers
and food service could benefit from consumers with
extra spending money.
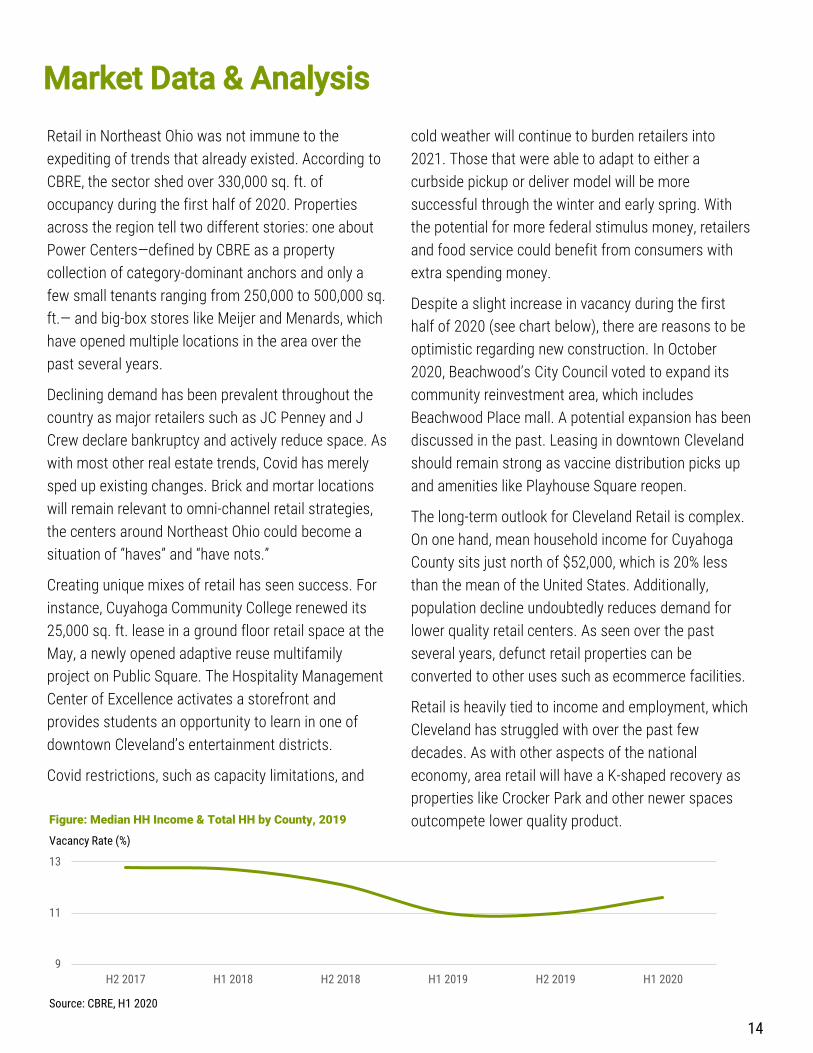
Despite a slight increase in vacancy during the first
half of 2020 (see chart below), there are reasons to be
optimistic regarding new construction. In October
2020, Beachwood’s City Council voted to expand its
community reinvestment area, which includes
Beachwood Place mall. A potential expansion has been
discussed in the past. Leasing in downtown Cleveland
should remain strong as vaccine distribution picks up
and amenities like Playhouse Square reopen.
The long-term outlook for Cleveland Retail is complex.
On one hand, mean household income for Cuyahoga
County sits just north of $52,000, which is 20% less
than the mean of the United States. Additionally,
population decline undoubtedly reduces demand for
lower quality retail centers. As seen over the past
several years, defunct retail properties can be
converted to other uses such as ecommerce facilities.
Retail is heavily tied to income and employment, which
Cleveland has struggled with over the past few
decades. As with other aspects of the national
economy, area retail will have a K-shaped recovery as
properties like Crocker Park and other newer spaces
outcompete lower quality product.
14
9
11
13
H2 2017 H1 2018 H2 2018 H1 2019 H2 2019 H1 2020
Figure: Median HH Income & Total HH by County, 2019
Vacancy Rate (%)
Source: CBRE, H1 2020

Multifamily
“Until we get the occupancies up in these new downtown multifamily
buildings…it will be really touch-and-go."
Part 07—Multifamily Market
Northeast Ohio’s multifamily performed well during the
pandemic compared to other property sectors.
Nationally, and outward migration to the suburbs
caused those submarkets to fare better than their
urban counterparts. Long-term, CBRE’s U.S. Outlook
2021 predicts that due to cost per sq. ft. and an
abundance of spacious units, downtown residents will
continue to be tempted to move. One ULI Cleveland
Young Leader and downtown resident noted that the
loss of neighborhood amenities has been challenging.
Because of this, they are eyeing a move to just outside
the city center.
However, there is reason for optimism in urban
multifamily. Announcements like those of Rocket
Mortgage, which is reportedly eyeing hundreds of new
jobs in the Central Business District, keeps the
submarket competitive in the long-term. Playhouse
Square and Cleveland’s sports teams will be back in full
force as the vaccine is widely distributed. Investments
from the region’s corporations should give confidence
to newly completed or underway projects.
The region’s relatively strong performance during 2020
is reflective of a larger Midwestern trend. As apartment
markets in coastal cities were heavily impacted by the
prevalence of remote work, more affordable areas of
the country maintained steady rent growth. Cleveland’s
more recent additions to the suburban submarkets
have performed well. All 103 apartments in Upstairs at
Van Aken are leased, prompting the developers to
weigh a new set of apartment towers. Dubbed “Phase
II,” the 17- and 16-story buildings could house up to 225
units. Targeted investments in submarkets outside of
the CBD could take advantage of the “urbanization” of
suburbs as seen with the Van Aken District.
Multifamily throughout the country is also being
impacted by the aging of Millennials and historically low
interest rates. After helping to fuel urban renaissances,
many in this generation are seeking more space to start
a family and access to quality schools. While
Generation Z is as urban-minded as Millennials, the
cohort is smaller. In 2019, Millennials and Generation Z
made up 22% and 20.3% of the US population,
respectively, a difference of nearly 6 million. Baby
Boomers will continue to consider urban living,
especially as in-home aging care becomes more
affordable.
“Our units are at a higher price point and our typical
clients are downsizing empty nesters,” noted a Young
Leader Focus Group attendee, “and we have not had
any issues with collection.” The participant also noted
that they acquired more sites during the summer,
representing the resiliency seen so far by multifamily.
15

Market Data & Analysis
Like markets around the country, Cleveland’s
multifamily sector has performed relatively well during
the pandemic. Government stimulus money, eviction
moratoriums, and remote work allowed apartment
dwellers to pay rent throughout the summer.
Downtown Cleveland remains the most active
submarket, accounting for a lion’s share of new
construction and deliveries. As of Q3 2020, over 20% of
units under construction were in the submarket (see
chart below). Projects like the Lumen, the Beacon, and
the May have placed hundreds of units on market,
offering more residential options than ever before. This
caused vacancy in the submarket to increase 6%
between Q2 2019 and Q2 2020 to 7.4%. However,
apartments built between 2015 and 2019 are 96%
occupied, according to the Downtown Cleveland
Alliance. Major corporate announcements (see Office
section) and an impending vaccine should reinforce
confidence in the neighborhood.
The old moniker of “retail follows rooftops” will bode
well for investors as downtown Cleveland’s population
grows. As of mid-2020, almost 19,000 people called
the neighborhood home, well within reach of the
20,000-target set by the Downtown Cleveland Alliance.
Over 1,200 units are under construction and more than
500 are in the planning pipeline. 2017 remains the
most active year for deliveries in the urban core.
Development remains steady in other submarkets as
well. The Ascent, which is bringing 261 apartments to
the Top of the Hill development in Cleveland Heights,
will offer modern amenities and quick access to the
Cleveland Clinic. Near West Side multifamily projects
like INTRO, Waterford Bluffs, and the Quarter Phase II
in Ohio City will continue to add density to the West
25th St and Detroit Ave corridors. Projects like these
explain the increase in neighborhood rents, which
surpassed $1,600/month in Summer 2020 according
78%
22%
0
500
1,000
1,500
2,000
2,500
3,000
3,500
to Yardi Matrix. Development as a share of inventory is
1.6%, far below 4.1% seen in Columbus and Cincinnati.
Rent growth in Cleveland remained steady overall,
reflecting a larger Midwestern trend identified by
CBRE’s Q3 2020 U.S. Multifamily Housing Figures
report. Rents in coastal markets plunged, resulting in
negative figures for both quarter-over-quarter as well
as year-over-year growth. In contrast, Cleveland’s rent
grew by 0.9% Q-o-Q and 1.5% Y-o-Y, beating out other
large Midwestern markets like Minneapolis and
Chicago.
Downtown multifamily rents increased faster than their
suburban counterparts during Q2 2020. Between
February and June, apartments in the urban core were
asking 4.9% more than the summer of 2019, possibly
reflecting the higher quality product being placed on
the market. In the suburbs, rents increased by 2.8%
year-over-year, which is consistent with neighborhoods
in other major Ohio metros. However, expect
concessions to stay consistent or increase due to the
competitive apartment market.
DOWNTOWN CLEVELAND ALL OTHER SUBMARKETS
Figure: Share of Multifamily Construction
Source: Yardi Matrix, Fall 2020
Total Units
16
