207 - nasa
TRANSCRIPT

207.364
Reprinted from
JOURNAL OF
,,c.'/5
NON-CRYSTALLINESOLIDS
Journal of Non-Crystalline Solids 195 (1996) 148-157
Effect of Pt doping on nucleation and crystallization in
Li20.2SiO 2 glass: experimental measurements and computer
modeling
K. Lakshmi Narayan a, K.F. Kelton "'*, C.S. Ray b
a Department oj'Phy_ics, Washington Univer,_ity. Box 1105, I Brooking._ Drive.St. l,oui._ MO 63130. USAb ,
Graduate Center fi_r Materials Research. Unit_,er._ity oj'Missouri-Rol/a, Ro/la. MO 65401, _ISA
Received 29 March 1995; revised 21 August 1995
ELSEVIER

JOURNAL OF NON-CRYSTALLINE SOLIDS
A journal on the chemical, electronic, optical, and mechanical properties of glasses, amorphous semiconductors and metals, sol-gel materi-
als, the liquid state of these solids, and the processes by which they are formed.
Founding Editor: Professor J.D. Mackenzie
Editor: R.A. Weeks
+1-615 322 2923Co-editor: D.L. Kinser
+1-615 322 3537
Vanderbilt University, 610 Olin Hall, Nashville, TN 37240, USA
Fax: +1-615 343 8645. E-mall: [email protected]
Regional Editors
Editorial Assistant: M. Beehan
+1-615 322 2058
G.H. Frischat, Institut for Nichtmetallische Werkstoffe, Technische Urtiversi_t Clausthal, D-36878 Clausthal-Zellerfeld, Germany
H. Fritzscbe, University of Chicago, James Franck Institute, 5640 Ellis Avenue, Chicago, IL 60637, USA
L.B. Glebov, S.I. Vavilov State Optical Institute, Research Institute for Optical Materials Science, 36-1 Babushkin Sir., St Petersburg193171, Russia
G.N. Greaves, Daresbury Laboratory, Daresbury, Warrington WA4 4AD, UK
H. Kawazoe, Tokyo Institute of Technology, Research Laboratory of Engineering Material, 4259 Nagatsuta, Midori-ku, Yokohama 227,Japan
J. Lucas, Laboratoire des Verres et Ctramiques, Universit_ de Rennes I, Ave. du G_ntral Leclerc, Campus de Beaulieu, 35042 Rennes cedex,France
M.J. Weber, Lawrence Livermore National Laboratory, PO Box 808, Livermore, CA 94550, USA
Advisory Editorial Board
Australia People's Rep. of China Taiwan
D.R. McKenzie, Sydney Gan Fuxi, Shanghai Jenn-Ming Wu, Hsinchn
Austria Russia United Kingdom
J. Hafner, Vienna V.I. Arbuzov, St Petersburg S.R. Elliott, Cambridge
India B.G. Varshal, Moscow A.C. Wright, Reading
S.C. Agarwal, Kanpur South Korea USA
Italy U.-C. Paek, Kwangju S.W. Freiman, Gaithersburg, MD
P. Mazzoldi, Padova Spain D.L. Griscom, Washington, DCA. Montenero, Parma M.T. Mora, Barcelona K. Kelton, St Louis, MO
G.W. Scherer, Wilmington, DE
Japan Sweden T.P. Seward I11, Coming, NY
H. Hosono, Yokohama L.M. Torell J.H. Simmons, Gainesville, FL
N. Soga, Kyoto M. Tomozawa, Troy, NY
K. Tanaka, lbaraki M.C. Weinberg, Tucson, AZ
(for complete addresses, see page 2 of the preliminary pages)
Aims and Scope
Review Articles, Research Papers, Comments and Letters on
chemical, electronic, optical, mechanical, structural and fracture
properties of non-crystalline materials including glasses, amor-
phous semiconductors, metals (alloys) and sol-gel materials which
form glasses, the liquid state of all materials from which non-crys-
talline solids can be formed, and the processes for the formation of
non-crystalline solids are accepted.
Abstracted/indexed in:
Biological Abstracts; Ceramic Abstracts; Current Contents: Engi-
neering. Technology and Applied Sciences; El Compendex Plus;
Engineered Materials Abstracts; Engineering Index; INSPEC;
Metals Abstracts; Physics Briefs.
Subscription Information 1996
Volumes 192-207 of Journal of Non-Crystalline Solids
(ISSN 0022-3093) are scheduled for publication. (Frequency:
monthly.) Prices are available from the publishers upon request.
Subscriptions are accepted on a prepaid basis only and are entered
on a calendar-year basis. Issues are sent by SAL (surface air lifted)
mail wherever this service is available. Airmail rates are available
upon request. Please address all enquiries regarding orders andsubscriptions to:
Elsevier Science B.V.
Order Fulfilment Department
PO Box 211, 1000 AE Amsterdam
The Netherlands
Tel: +31-20 485 3642, Fax: +31-20 485 3598.
Claims for issues not received should be made within six months
of our publication (mailing) date. If not, they cannot be honoured
free of charge.
US Mailing notice - Journal of Non-Crystalline Solids (ISSN 0022-3093) is published monthly, except semimonthly in February, March,
May, June, July and August, by Elsevier Science B.V., Molenwerf 1, P.O. Box 211, 1000 AE Amsterdam, The Netherlands. Annual subscrip-
tion price in the USA is US$ 4654 (valid in North, Central and South America only), including air speed delivery. Second class postage paidat Jamaica, NY 11431.
USA Postmasters: Send changes to Journal of Non-Crystalline Solids, Publications Expediting, Inc., 200 Meacham Avenue, Elmont, NY
11003. Airfreight and mailing in the USA by Publications Expediting.
Q The paper used in this publication meets the requirements of ANSI/NISO 239.48-1992 (Permanence of Paper).
North-Holland, an imprint of Elsevier Science

ELSEVIER JournalofNon-CrystallineSolids195 (1996) 148-157
JOURNAL OF
Effect of Pt doping on nucleation and crystallization in
Li20.2SiO 2 glass: experimental measurements and computer
modeling
K. Lakshmi Narayan a, K.F. Kelton a,*, C.S. Ray h
a Department of Physics, Washington Univer_sity, Box 1105, I Brookings Drive,St. Louis MO 63130, USA
b Graduate Center/or Materials Research, University ofMissouri-Rolht, Rolla. MO 65401, USA
Received 29 March 1995; revised 21 August 1995
Abstract
Heterogeneous nucleation and its effects on the crystallization of lithium disilicate glass containing small amounts of Pt
are investigated. Measurements of the nucleation frequencies and induction times with and without Pt are shown to be
consistent with predictions based on the classical nucleation theory. A realistic computer model for the transformation is
presented. Computed differential thermal analysis data (such as crystallization rates as a function of time and temperature)
are shown to be in good agreement with experimental results. This modeling provides a new, more quantitative method for
analyzing calorimetric data.
1. Introduction
For many reasons, lithium disilicate glass pro-vides a model system for studying nucleation and
crystallization in glasses. Good experimental data
exist for steady-state and time-dependent nucleationrates and growth velocities [1-3]. Further, the free
energy differences between the glass and the crystalare available as a function of temperature [4]. These
data have been used extensively to test the classicaltheory for homogeneous nucleation [5,6] and its ex-
tensions to describe polymorphic growth [7]. Further,those kinetic models have been used to simulate
crystallization in this glass under isothermal and
• Corresponding author. Tel: + 1-314 935 6228. Telefax: + 1-
314 935 6219. E-mail: [email protected].
non-isothermal conditions [8,9]. Possible extensions
to treat crystallization that is nucleated heteroge-neously on glass impurities have also been consid-ered [10,11].
It is well known that the addition of noble metals
in controlled quantities increases the tendency forglasses to nucleate. Rindone [12], for example,
demonstrated the effectiveness of platinum particles
in precipitating lithium disilicate crystals from lithiumdisilicate glass. Cronin and Pye [13] have investi-
gated the effect of Pt particle size on the crystalliza-tion of lithium disilicate glass. Heterogeneous or
catalyzed nucleation, however, has received less the-
oretical attention than has homogeneous nucleation.
This is primarily due to insufficient information about
the number, size and catalytic efficiency of the het-
erogeneous particles. By conducting quantitative in-vestigations on metallic and silicate glasses, Kelton
0022-3093/96/$15.00 (e) 1996 Elsevier Science B.V. All rights reserved
SSDI 0022-3093(95)00526-9

K.L. Narayan et al. /Journal of Non-Crystalline Solid._ 195 (1996) I48-157 149
and Greet [6,14] demonstrated previously that de-
tailed studies of the transient nucleation rates provide
more information about the nucleation process than
is available from the study of steady-state rates
alone. Surprisingly, only a few measurements of the
time-dependent heterogeneous nucleation rates in sil-
icate glasses exist [15].
Here, we present measurements of heterogeneous
nucleation rates in lithium disilicate glass as a func-
tion of Pt concentration. Both time-dependent and
steady-state nucleation rates are measured at each Ptconcentration, and the nucleation induction times aredetermined. Similar measurements were also con-
ducted on an undoped glass to compare the quantita-
tive effects of homogeneous and heterogeneous nu-
cleation on the crystallization of the lithium disilicate
glass. The computer model developed for homoge-neous nucleation is extended to include the effect of
heterogeneities [10] and is used to analyze the exper-imental data.
A numerical model previously developed to pro-
vide a description of polymorphic crystallization for
glasses heated at a constant rate, such as is used indifferential scanning calorimetry (DSC) or differen-
tial thermal analysis (DTA) experiments, is extended
to include heterogeneous nucleation. Exothermic
crystallization peaks were measured and were mod-
eled as a function of dopant (Pt) concentration and
the heating rate. The applicability of the Kissingermethod [26] for extracting an overall activation en-
ergy for crystallization was also evaluated.
2. Theoretical background
Nucleation is normally modeled assuming the
classic theory of nucleation, in which clusters of
various sizes exist simultaneously, growing or
shrinking as governed by a series of bimolecular rate
equations, describing the addition and loss of asingle manomer per step. Assuming a sharp inter-face, the reversible work of formation of a cluster of
size n is the sum of a volume term (which is
negative for the phase transformation to proceed)
and a positive energetic penalty for the introductionof a surface:
Wn = n AG + ff rt2/3(r. (1)
Here AG is the free energy difference per molecule
between the crystal and the glass, c_ is a geometrical
factor and _r is the inteffacial energy between the
crystal and the glass. The barrier to nucleation is
decreased if the nucleating cluster wets the catalyz-
ing impurity. Within the spherical cap model for
heterogeneous nucleation, the inlerfacial energy is
decreased from its value for homogeneous nucle-
ation, (ro,
o-2 = f(&) o-_, (2)
where
f(&)= [(2+cosq$)(l-cos4b)q/4. (3)
Here 4' is tile contact angle between the growing
crystal nucleus and the heterogeneous impurity. Fol-
lowing a sufficiently long time, the cluster distribu-
tion will approach the steady-state distribution, which
is characterized by the temperature and the thermo-
dynamic and kinetic constants but is independent of
time and sample thermal history. Due to the quench-
ing process, however, nucleation in most glasses isnot initially at its steady-state value but approaches it
with time as the cluster distribution approaches its
constant value [8,9]. The rate of change in the cluster
density is given by
dN_,,-k +. iU._l., - [k + +k.]N..,
dt
+ k)7+iN,,+ ,,,, (4)
where k + and kg, are the rates at which moleculesjoin or leave clusters of n molecules, giving a time-
and cluster-size-dependent nucleation rate
l,,.,=U,.,k + - N,,+ i.,k_+ , . (5)
Following Turnbull and Fischer [16], the atomic
attachment and detachment frequencies, respectively,are
w,, - w,,+, )k,+ = O,y exp y_-_ , (6)
k2+i=O"+lYexp 2k_T "
where k u is the Boltzmann's constant. O, is thenumber of sites available for the attachment of a
monomer and y is an unbiased jump frequency that
150 K.L. Narayan et al./Journal _] NomCrystalline Solid._ 195 (1996k 148 157
can be expressed in terms of the diffusion coeffi-
cient, D, and the average jump distance, A,
7 = 6D/A 2. (7)
In silicate glasses, the nucleation rate is deter-
mined by first annealing the sample at a temperature
at which the nucleation rate is large and the growth
velocity is small, followed by an anneal at a higher
temperature at which the nucleation rate is negligi-
ble, but the growth velocity is substantial. During the
growth treatment, all clusters larger than the critical
size at that temperature, n_, will grow [3,15]. To
compare theory with experiment, the cluster size, n,
in Eq. (5) is, therefore, typically chosen equal to n G.
The measured quantity is the number of nuclei,N(T,t), produced as a function of time: its timederivative is the nucleation rate, l(t,T). Under
steady-state conditions, the slope of N vs. t is equal
to the steady-state nucleation rate, I _. Experiments
on quenched glasses typically give a nucleation rate
that is lower than I_; that value is approachedasymptotically with time. At long times,
N(T,t) = lS(,- 0), (8)
where 0. the effective time-lag, depends upon the
particular glass system and temperature, T, and I _ is
the steady-state nucleation rate.While often not discussed, heterogeneous nucle-
ation can also display transient behavior. This can be
easily seen with only minor modifications to the
development for homogeneous nucleation. The workof cluster formation is changed, as already discussed.The number of surface attachment sites is decreased,
O, --+ O,,[ f( 0)] 2/; (9)
which, according to Eq. (6), decreases the atomic
attachment and detachment frequency, as well.
3. Computer simulation of crystallization
The details of the numerical model for crystalliza-tion under non-isothermal conditions have been dis-
cussed elsewhere [8,9]. With the changes mentioned
in the previous section, the model can be directly
applied to describe crystallization by heterogeneousnucleation. As before, the non-isothermal scan isdivided into a series of isothermal anneals, the dura-
tion of which, At, is set by the coarseness of thetemperature step, AT, and the scan rate, Q:
At= AT/Q. (10)
Within each isothermal interval, the clusters are al-
lowed to evolve following the bimolecular rate kinet-
ics of the classical theory of nucleation, using the
kinetic and thermodynamic factors appropriate to the
temperature of that interval. To include the effect ofheterogeneous nucleation, the work of cluster forma-
tion and the rate constants are adjusted using Eqs. (2)
and (9), respectively. This is accomplished by further
dividing each isothermal interval into finer time steps,
St, and using a finite difference approach to solve
the coupled kinetic equations of nucleation, i.e., Eqs.
(4) and (5). The cluster density as a function of time
is computed by
N,,.,+8, = N,., + 8t( dN,,.Jdt), (11)
where dN,,., is determined from Eq. (4). The time-
dependent nucleation rate is, therefore, calculatedfrom Eq. (5), avoiding the introduction of ad hoc
assumptions regarding its behavior. At the end of
each isothermal interval, the clusters generated dur-
ing that isothermal anneal and those generated dur-
ing the previous isothermal intervals are grown usingthe appropriate cluster-size-dependent growth veloc-
ity [9,17]
16CD
- #. [ 2kuT AG,---r "
(12)
As was demonstrated previously [7], the tempera-
ture dependence of the macroscopic growth ratecalculated from Eq. (12) using thermodynamic and
kinetic parameters derived from nucleation data (ap-
propriate for the growth of small clusters) is in good
agreement with experimental results. The magnitudesof the calculated values, however, are too low. This
is likely due to a relatively temperature-independent
anisotropic growth mechanism that causes an in-crease in the number of attachment sites on the
larger clusters (see Ref. [7] for more detail). For the
computer calculations presented here, C was set to
4.77 to give good agreement with the observed
macroscopic crystal growth rates. Keeping track of
the number of dusters of a given size, G.,, and

K.L. Narayan et al./Journal of Non-Cry,_talline Solids 195 (1996) 148-157 l SI
Table 1
Parameters for the simulation of crystallization of lithium disili-
cate
Melting temperature, ?m: 1300 K
Molecular volume, VmoF 9.962× 10 >) m a
Entropy of fusion, ASf: 39.08 kJ mol I K t
Interfacial energy' for
homogeneous nucleation,_r: (0.094+7×10 5 T) Jm •
Jump distance, A: 4.6 ,_.
Diffusion coefficient: D=DoTexp(_)
Do: 3.63× l0 ta m 2 K t s
h: 7761 K
To: 460 K
Gibbs free energy AG = a o + aJ + a,T 2 + aJ "_
(J tool i):
ao: 48045 J mol i
al: 36.81 J mol t K t
a:: 5.607× 10 3 j tool i K 2
a3: -4.3179×10 6jmol ;K
assuming no overlap between the clusters, the total
extended volume transformed is calculated directlyas
4'rrx_- ENir).,. (13)
3V0 i
Cluster overlap is taken into account statisticallyusing the Johnson-Mehl-Avrami equation [28] torelate the actual volume fraction transformed to the
extended volume fraction transformed:
x = 1 - exp( - x_,). (14)
Assuming that the DSC signal scales with the rate ofvolume fraction transformed,
DSC signal a [ x(T,. + ST) - x(Ti)]/gt. (15)
The physical parameters used in the calculations
of nucleation and growth in lithium disilicate glassare given in Table 1.
4. Experimental procedure
Samples of lithium disilicate glass were prepared
with differing amounts of Pt to act as heterogeneoussites. These were annealed and the rate of nuclei
production was measured to determine time-depen-
dent nucleation rates. Experimental DSC scans were
made to determine the effect of these heterogeneitieson the overall transformation behavior. In this sec-
tion, experimental procedures are discussed.
4.1. Glass preparation
A well mixed, 50 g batch of lithium disilicate
composition was melted in a platinum crucible at1450 C for 2 h. and the melt was cast between two
steel plates. Chloroplatinic acid was used in the
batch to prepare glasses containing platinum. Before
casting, the melt was stirred periodically (25-30 rain
interval) with a silica rod to ensure homogeneity.
X-ray diffraction and examination by scanning elec-
tron microscopy (SEM) showed no evidence of un-
melted or crystalline particles in the as-quenchedglass. Glasses containing 0 (undoped), 1, 5, 10 and
50 ppm nominal concentration of Pt by weight wereprepared and used in the present investigation. To
avoid moisture contamination, all glasses were storedin a vacuum desiccator until used for measurements.
4.2. Nucleation rate measurements
Glasses containing 0 (undoped), 1 and 5 ppm Ptof dimensions --- 1 cm × 1 cm × 4 mm were used
for nucleation rate measurements. They were placed
in a tube furnace capable of maintaining the tempera-ture to ± 1 C. To determine the nucleation kinetics,
the glasses were nucleated over a temperature rangefrom 432 to 500°C, and then grown at 700°C for 3
rain, following James [15].
The annealed samples were ground and polished
to remove effects due to surface crystallization. They
were lightly etched for 15 s in a 3% HF, 4% HNO 3
solution prepared in deionized water. The sampleswere then analyzed in an optical microscope (Leitz-
Wetzlar, type Metallux-3) at magnifications up to
1000 times. Standard stereologic corrections were
applied to determine the crystal density per unitvolume [18]. Assuming that each crystal grows from
a single nucleus and that no nuclei larger than the
critical size at the growth temperature re-dissolve in
the second stage anneal, the number of visible clus-
ters present in a unit volume of the sample corre-
sponds to the number of nuclei per unit volume, N,.
152 K.L. Narayan et al./Journal ql'Non-Cry,walline Solids 195 (1996) 148-157
By measuring the number of nuclei, N_, present in a
non-nucleated as-quenched glass, the number of nu-
clei generated per unit volume during an annealingperiod was determined as N = NV - N, °.
Attempts to determine platinum concentration and
cluster sizes were made using SEM (Hitachi 40(X)GL)
and transmission electron microscopy (JEOL200OFX).
4.3. DTA studies
All of the calorimetric data were obtained in a
flowing argon atmosphere (40 cm3/min) using a
Perkin-Elmer DTA 1700 system. Samples weighing
between 15 and 20 mg were ground and heated in a
Pt crucible until crystallization was complete. Tominimize surface crystallization effects, particles ap-
proximately 1 mm in diameter were used. Scans
were made at 5, 10, 20, 40 and 80°C/min, respec-
tively, on all samples. High purity A1203 was usedas the reference material. Instrumental shifts in tem-
perature were corrected by measuring the meltingpoint of aluminum as a function of the scan rate.
These experimental DTA exotherms were then com-
pared with those simulated using identical sample
characteristics and heating rates in the computermodel.
5. Results and discussion
Direct measurements of the nucleation rates and
induction times were made to obtain estimates of the
contact angles and to check predictions of the theo-ries. Data from these nucleation measurements were
used to compute non-isothermal crystallization peaks
for the glass, which were compared with experimen-
tal results. These studies allowed an investigation of
the effect of the heterogeneities on the nucleation
and crystallization behavior and a check on thevalidity of the computer model.
5.1. Nucleation rate measurements
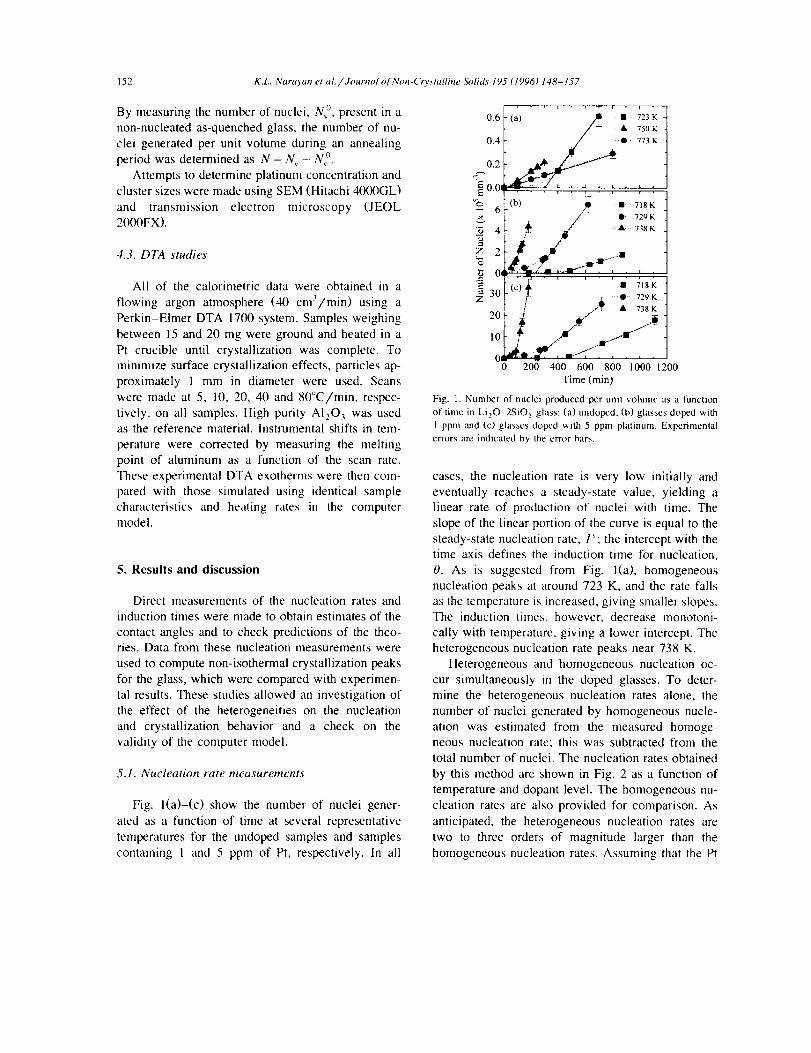
Fig. l(a)-(c) show the number of nuclei gener-
ated as a function of time at several representative
temperatures for the undoped samples and samples
containing 1 and 5 ppm of Pt, respectively. In all
06I0.4
0.2
_" 0.0o
-- 6
z 2
o:
3oz
20
10
, ' i • i , i • i /
(a) /I I" 723 K 1,b, 2
_ ./__ • 738K t0 200 400 600 800 1000 1200
Time (min)
Fig. 1. Number of nuclei produced per unit volume as a function
of time in LifO. 2SiO 2 glass: (a) undopcd, (b) glasses doped with
I ppm and (c) glasscs doped with 5 ppm platinum. Experimental
errors are indicated by the error bars.
cases, the nucleation rate is very low initially and
eventually reaches a steady-state value, yielding alinear rate of production of nuclei with time. The
slope of the linear portion of the curve is equal to the
steady-state nucleation rate, I_; the intercept with thetime axis defines the induction time for nucleation,
0. As is suggested from Fig. l(a), homogeneous
nucleation peaks at around 723 K, and the rate falls
as the temperature is increased, giving smaller slopes.The induction times, however, decrease monotoni-
cally with temperature, giving a lower intercept. Theheterogeneous nucleation rate peaks near 738 K.
Heterogeneous and homogeneous nucleation oc-
cur sinmltaneously in the doped glasses. To deter-mine the heterogeneous nucleation rates alone, the
number of nuclei generated by homogeneous nucle-
ation was estimated from the measured homoge-neous nucleation rate; this was subtracted from thetotal number of nuclei. The nucleation rates obtained
by this method are shown in Fig. 2 as a function oftemperature and dopant level. The homogeneous nu-
cleation rates are also provided for comparison. As
anticipated, the heterogeneous nucleation rates are
two to three orders of magnitude larger than the
homogeneous nucleation rates. Assuming that the PI

K.L. Narayan et al./Journal _[Non-Crystalline Solids 195 (1996) 148 157 153
nucleants are of similar sizes in all cases, the magni-tude of the nucleation rates should scale with the
density of dopants. Within measurement error, this
appears to be the case here; the peak nucleation rate
is approximately four to ten times larger for the 5
ppm doped sample than for the 1 ppm doped sample.The size of the nucleating agents is important. If
the heterogeneous particles are too small, their cat-
alytic efficiency as nucleating agents is decreased[19-21]. The assumption of a flat interface between
the particle and the nucleus also becomes question-able [23,24]. For particles of sufficient size, on the
other hand, there is the possibility of a single nucleus
supporting more than one nucleation event [24].
While the precise size of the nucleating impurity in
our case is unknown, SEM studies indicate an upperbound of 100 A for the particle size. Consequently,
the average impurity size was taken as 50 A.Since we do not observe a decrease of the nucle-
ation rate with time in Fig. 1, the particles are either
of sufficient size to act as effective nucleating agents
with no significant depletion of the heterogeneous
sites during the time of our measurements or, if the
heterogeneous particles are large enough to supportseveral nucleation events, surface saturation is not
important. Similar results were reported by Gonza-lez-Oliver and James [22] in Pt-doped Na20.2CaO
• 3SiO 2 glass. In the absence of any evidence to the
200
150
,_ 100
50 • ppm Pt
• ppm Pt
_a_g = 132 r,
0 7;0 720 740 7;0 780I
Temperature (K)
Fig. 3. The conlact angle calculated from the steady state nucle-
ation rates using Eq. (2), for glasses doped wilh 1 and 5 ppm Pt.
contrary, a single nucleation event per particle was
assumed for the modeling.
By fitting the measured steady-state nucleation
rates for the doped glasses to the classic theory ofnucleation, the effective interfacial energy, (r, for
the crystal and dopant interface can be obtained,which can be used to calculate the contact angle, qS,
using Eq. (2). Shown in Fig. 3 are the calculated
contact angles for the glasses containing 1 and 5
ppm Pt at different temperatures. The figure shows
that 4) is independent of both the temperature andthe dopant concentration. Using the size for the
catalyzing impurity, the heterogeneous nucleation
rates can be described by ,;b= 132 ° + 18°.
8-
7" m Pt
-_'-_'__615" ppm_ - _
4-
7;0 " 7½0 ' 7'¢0 7;0 780
Temperature (K)
Fig. 2. Steady-state nucleation rates per molc plotted against
temperature for undoped Li_O. 2SiO, (•), doped with I ppm Pt
(Q) and doped with 5 ppm pt (A). The solid lines are fits to the
classic theory of nucleation. Homogeneous nucleation rates from
Refs. [I](El) and [3] ((3) are provided for comparison.
5.2. Induction times for nucleation
Fig. 4 compares the induction times for homoge-neous nucleation, 0, with those from Refs. [1,3]. The
broken line shows the calculated values [7] using the
viscosity data in Ref. [25]. The good agreementbetween our data and those of others verifies the
reliability and reproducibility of our measurements.The measured values of 0 for homogeneous and
heterogeneous nucleation are compared in Fig. 5.
The calculated values for homogeneous nucleation
are again included for comparison (solid line). Inter-
estingly, the addition of platinum seems to have no
significant effect on the induction time for nucle-ation.
These similarities between the measured values of
0 for homogeneous and heterogeneous nucleation

154 K.L. Narayan et al. /Journal otNon-Crystalline Solids 195 (1996) 148-157
104.
._E_103 ._w102-
.o ork
10 _ o/Y • Refill• Ref[3]
-- Ref [7]
10 °1.28 1.32 1.36 1.40 l._t4
1000,'T( K )
Fig. 4. The induction times for homogeneous nucleation for
different temperatures. The solid line is the calculated induclion
time [71 using data from Ref. [24]. The experimental induction
times from Refs. [1] _md [3] are also included.
104.
_' 103 _m 0_mi2 102
._ Pt
"_ 101 .-0 "/ I • 1 ppm Pt_= •• 5 ppm Pt
• -- Ref [71100. •
1.28 1.32 " 1.36 1._,0 1._,4
1000/T(K)
Fig. 5. The induction time for heterogeneous nucleation for glasses
containing O ppm Pt, 1 ppm Pt and 5 ppm Pt. The solid line is the
calculated induction time from Ref. [7].
Table 2
(a) Homogeneous crystal nucleation rates, I, and crystallization induction times, 0, for lithium disilicate
T (°C) This work Ref. [1} Ref. [3]
/ _ (ram 3 s I) 0 (rain) 1 _ (ram 3 s-i) 0 (min) 1 _ (mm 3 s _) 0 (min)
430 0.368 3569
432 0.377 1617
440 1.147 790
442 0.920 744
445 3.761 474
445 1.310 46 I45('1 2.626 308
452 3.59O 322
465 2.863 60
471 1.610 23
476 1.868 21
477 1.316 26
483 1,060 16
489 0.639 12
5(X) 0.607 2
(b) Crystal nucleation rates. /, and crystallization induction times, 0, for lithium disilicate glass with PI dopants
T (°C) Li ,O - 2SiO_, (I ppm Pt by weight) Li ,O • 2SiO_ (5 ppm Pt by weight)
/_(mm 3s 1) 0(min) lS(mm _s I) 0(min)
432 0.6 1686 3.7 1713
445 6. I 408 43.5 443
452 23.6 289 68.4 311
454 25.9 214 78.4 203
465 52.7 56 503 7 I
468 43.5 32 174.8 24
477 33.7 7 93.4 6
5(X) 23.6 3 33.8 1

K.L. Narayan et al./Journal oJ Non-Crystalline Solid,_ 195 (1996) 148 157 155
1.2-
1.0-
0.8-
,..3
.E
.a 0.6->
0.4-
40 80 i;0Contact Angle (degrees)
Fig. 6. Computed induction time for heterogeneous nucleation as a
function of contact angle. The relative effective timcqag is de-
fined as the ratio of 0(&) to 0(180°). The datapoims are from a
numerical simulation; the solid line is a calculation based only on
the decreased cluster surface area with decreasing contact angle.
Taken from Ref. [I0].
function of platinum concentration for two DTAscan rates in Fig. 7. As demonstrated in Fig. 7(a), the
peak temperature decreases approximately linearlywith the logarithm of the Pt concentration, while the
peak intensity increases (Fig. 7(b)) and the width
decreases (Fig. 7(c)). These are expected effects. An
increase in the platinum leads to an increase in the
nuclei production, causing the phase transition to
occur more rapidly (higher intensity) at a lower
temperature than for the homogeneous case. Since
the transformation occurs more quickly, it leads to a
decreased peak width.The simulation discussed in Section 3 was used to
model the DTA data for lithium disilicate glass,
taking the measured value for the contact angle, 4',
and the known values for the free energy, interfacial
energy and the diffusion coefficient (Table 1). The
DTA peak parameters determined from the com-
puted peaks are indicated by the solid lines in Fig. 7.
are in agreement with earlier predictions. Based onthe numeric algorithm presented here, Greer et al.
[10] computed the time-lag as a function of contact
angle using parameters similar to those given inTable 1. The results of that calculation are shown in
Fig. 6; the filled circles indicate the results of com-
puter simulations, while the solid line is a calculationbased only on the decreased interfacial area with
decreasing contact angle. While a significant differ-ence between the induction times for homogeneous
and heterogeneous nucleation is predicted for small
contact angles, they are nearly equal for contact
angles near 130°, the value obtained for these experi-ments.
The measured values for 0 and the steady-state
nucleation rates are collected in Table 2: for compar-ison, data obtained by James [1] and Deubener et al.
[3] are also provided. The nucleation rates and the
induction times for glasses doped with 1 and 5 ppm
Pt (by weight) are also provided.
5.3. Differential thermal analysis
Variations in the transformation behavior can be
characterized by three parameters that describe the
DTA profile: the intensity, lp, and temperature, Tp,of the peak maximum and the peak width at half-
maximum, ATp. These parameters are shown as a
,i imoo (a)
ooILg800
7oo600_., ........ , , , , •
0.04- (b) • • •i
'g, o.oo
"P" a
-0.04 w....... i .....
• i ....... i .....
.._120
___ 80
4O
1300
1200
1100
1000
900
0.08
0.04
120
80
40
0
I 10
PI concentration (ppm)
Fig. 7. Plot of characteristic DTA peak parameters as a function of
the dopant concentration at scan rates of 5 K/rain (i) and gO
K/rain (Q). The left vertical axes correspond to the 5 K/ram
values; the right vertical axes correspond to the 80 K/rain values,
(a) Temperature of the peak rate of transformation; (b) normalizedpeak intensities; and (c) lull width at half-maximum. The solidlines are the calculated values based on the parameters extractedfrom the nucleation rate measurements.

t 56 K.L. Narayan et al./Journal q/Won-Crystalline Solids 195 (1996) 148 157
-13
-14[
_ _ (a)
5 ppm Pt _ "_
-15"
-16
0.95 1.00 1.05 1.10 1.1:
1(_)0,rl'p(K 1
400
350
--_ 300.0
250
:,7 200.
< 150
100.
• Experiment
• Calculated
(b)
Pt Concentration (ppm)
Fig. 8. Kissingcr analysis for samples with different dopant con-
centrations. (a) Typical Kissinger plots for glasses doped with 0, 5
and 5(/ ppm Pt. (b) Activation energies determined from the
Kissingcr plots of experimental (I) and computed (O) DTA
peaks. The lines are straight line fits to the points.
Differential scanning calorimetry and DTA data
are typically analyzed using the Kissinger method
[26]. The slope of In[Q/T_] vs. l/Tp, at which Q is
the heating rate and Tr, is the temperature of theDTA peak maximum, is argued to give the activation
energy of the transformation. Fig. 8 shows the exper-
imental DTA data analyzed in that way. A series ofstraight lines are obtained with slopes roughly inde-
pendent of the platinum concentration. The slopes of
these lines give activation energies between 250 and
275 kJ/tool, which are in reasonable agreement with
previously reported values for this glass [29-31].
The simulated DTA peaks obtained at different heat-
ing rates were also analyzed by the Kissinger method.As shown in Fig. 8(a), the activation energies calcu-
lated from the simulated data are slightly lower than
the values computed from the experimental data,
although the differences were within 20-40 kJ/mol.
The good agreement between the model calculations
and the experimental data shown in Figs. 7 and 8
demonstrates the validity of our modeling approach
and justifies the usefulness of such computer calcula-tions for analyzing DSC and DTA data.
The activation energies determined from theKissinger method are close to the value for macro-
scopic growth in lithium disilicate glass (282 kJ/mol)[27]. This supports previous suggestions that the
Kissinger analysis provides a reasonable estimate of
the activation energy for growth [32], but should not
be taken to describe the overall activation energy ofthe transformation. Consequently, caution should be
exercised when applying the Kissinger analysis to
first order phase transformations proceeding by nu-
cleation and growth. The numerical approach pre-
sented here provides a better basis for analysis.
6. Conclusions
Our results are in good agreement with predic-
tions based on the classic theory of nucleation and
with previous computer models of heterogeneous
nucleation. The induction times for homogeneousand heterogeneous nucleation are virtually identical,
which agrees with previous predictions that the in-
duction time for heterogeneous nucleation ap-
proaches that for homogeneous nucleation when thecontact angle is high (120-130°), the value extracted
from the measured heterogeneous nucleation rates. A
computer model of non-isothermal phase transforma-
tions in heterogeneously nucleating glasses is devel-oped and demonstrated to give good agreement with
experimental data, pointing to a more quantitative
approach to the analysis of such data.
Acknowledgements
The authors thank D.E, Day, A.L. Greer and M.
Weinberg for useful discussions. This work was
partially supported by NASA under contracts NAG8-873, NCC 8-49, and NAG 8-898.
K.L. Narayan et al. / Journal of Non-Crystalline Solid._ 19.5 (1996) 148-157 157
References
[I] P.F. James, Phys. Chem. Glasses 15 (1974)95.
[2] A.M. Kalinina, V.N. Filipovich and V.M. Fokin, J. Non-
Cryst. Solids 38&39 (1980) 723.
[3] J. Deubener, R. B_ckner and M. Stemilzke, J. Non-Cryst.
Solids 163 (1993) I.
[4] JANAF Thermochemical Tables, 2rid Ed., US Department of
Commerce, National Bureau of Standards, Washington, DC.
1971.
[5] K.F. Kelton, A.L. Greet and C.V. Thompson, J. Chem. Phys.
79 (1983) 6261.
[6] K.K. Ke[ton and A.L. Greer, Phys. Re','. B38 (1988) 10089.
[7] K.F. Kelton and M.C. Weinberg, J. Non-Crysl. Solids 180
(1994) 17.
[8] K.F. Kelton and A.L. Greet, J. Non-Cryst. Solids 79 (1986)
295.
[9] K.F. Keiton, J. Non-Cryst. Solids 163 (1993) 283.
[10] A.L. Greet, P.V. Evans, R.G. Hamerton, D.K. Shangguan
and K,F. Kelton, J. Cryst. Growth 99 (1990) 38.
[I 1] M.C. Weinberg, J. Non-Crysl. Solids 122 (1990) 139.
[12] G. Rindonc, J. Am. Ceram. Sc,c. 41 (1958) 41.
[13] D. Cronin and L. Pye, J. Non-Cryst. Solids 84 (1986) 196.
[14] A.L. Greet and K.F. Kelton, J. Am. Ceram. Soc. 74 (1991)
1015.
[15] P.F. James, in: Glasses and Glass-Ceramics, ed. M.H. Lewis
(Chapman and Hall, London, 1989) p. 59.
[16] D. Tumbull and J.C. Fischer, J. Chem. Phys. 17 (1949) 71.
[17] K.F. Kelton and A.L. Greet, in: Pro.v,:. 5th Int. Conf. on
Rapidly Quenched Metals, Wurzburg, ed. S. Steed and H.
Warlimont (North-Holland, Amsterdam, 1985) p. 223.
[18] E.E. Underwood, Quantitative Stereology (Addison-Wesley.
New York, 1970).
[19] R.D. Maurer, J. Chem. Phys. 31 (1959) 444.
[20] I. Gutzow and S. Toschev, in: Advances in Nucleation and
Crystallization in Glasses, ed. L.L. Hench and S.W. Freiman
(American Ceramic Society, Westerville, OH, 1971) p. 10.
[21] I. Gutzow, Contemp. Phys. 21 (1980) 121; 243.
]22] C.JR. Gonzales-Oliver and P.F. James, in: Advances in
Ceramics, Vol. 4, ed. J.H. Simmons, D.R. Uhlmann and
G.H. Beall (American Ceramic Society, Columbus, OH,
1982) p. 49.
[23] N,H. Fletcher, J. Chem. Phys. 31 (1959) 1136.
[24] C.JR. Gonzalez-Oliver and P.F. James, J. Microsc. 119
(1980) 73.
[25] K. Malusita and M. Tashiro, Jpn. J. Ceram. Assoc. 81 (1973)
500.
[26] H.E. Kissinger, J. Res. Nat. Bur. Stand. 57 ([956) 217.
[27] M.F. Barker, T. Wang and P.F. James, Phys. Chem. Glasses
29 ([988) 240.
[28] J.W. Christian, The Theory of Transformation in Metals and
Alloys, 2nd. Ed. (Pergamon, Oxford, 1975) oh. 10.
[29] C.S. Ray, and D.E. Day. J. Am. Ceram. Soc. 73 (1990) 439.
[3(/] A. Marotta, A. Buri, F. Branda and S. Saiello, in: Advances
in Ceramics, Vo[. 4, ed. J.H. Simmons, D.R. Uhlmann and
G.H. Beall (American Ceramic Society', Columbus, OH,
1982) p. 146.
[31) P. Hautojarvi, A. Vehane[, V. Kompa and E. Pahane, J.
Non Cryst. Solids 29 (1978) 365.
[32] H. Yinnon and D.R. UhImann. J. Non-Cry'st. Solids 54
(1983) 253.


Journal of Non-Crystalline Solids
Instructions to Authors
Submission of papers
Manuscripts (one original + two copies), should be sent to the edi-
tors or any one of the regional editors. The address of the editors is
as follows:
Profs. R.A. Weeks and D.L. Kinser
Editors, Journal of Non-Crystalline Solids
Vanderbilt University, 610 Olin Hall
Nashville, TN 37540, USA.
Fax: +1-615 343 8645.
E-mail: jncs @ vuse.vanderbilt.edu
Ori ,inal material: On submission, authors are asked to confirm
that the manuscript is not being simultaneously considered for
publication elsewhere and that all authors have approved the manu-
script and take full responsibility for its contents and so state in
their letter of transmittal.
Types of contributions
Original research papers, reviews, letters to the editor and com-
mentaries are welcome. They should contain an Abstract (of up to
200 words) and a Conclusions section which, particularly in the
case of theoretical papers, translates the results into terms readily
accessible to most readers.
Letters should be no longer than six double-spaced typed pages.
They will be given priority in both the refereeing and production
processes. The faster production schedule will preclude sending
proofs of letters to authors.
Manuscript preparation
All manuscripts should be written in good English. The paper
copies of the text should be prepared with double line spacing and
wide margins, on numbered sheets. See notes opposite on elec-
tronic version of manuscripts.
Structure. Please adhere to the following order of presentation:
Article title, Author(s), Affiliation(s), Abstract, PACS codes, Main
text (Introduction; Experimental procedures or constraints on the-
ory; Results; Discussion; Conclusion. Sections and sub-sections
must be clearly numbered according to the Journal style), Ack-
nowledgements, Appendices, References, Figure captions, Tables.
Corresponding author. The name, complete postal address, tele-
phone and fax numbers and the e-mail address of the correspond-
ing author should be given on the first page of the manuscript.
PACS codes/keywords. Please supply one or more relevant PACS-
1995 classification codes.
References. References to other work should be consecutively
numbered in the text using square brackets and listed by number in
the Reference list. Please refer to past issues of the Journal for
examples.
Symbols/Units: Authors should follow the Symbols and Units
Nomenclature Commission of the I.U.P.A.P. (Physica 146A (1987)
1-68).
Illustrations (figures)
Illustrations should also be submitted in triplicate: one master set
and two sets of copies. The line drawings in the master set should
be original laser printer or plotter output or drawn in black india
ink, with careful lettering; lettering should 2 mm in height after
reduction for printing. The photographs should be originals, with
somewhat more contrast than is required in the printed version.
The top edge should be indicated on the back. They should be
unmounted unless part of a composite figure. Any scale markers
should be inserted on the photograph itself, not drawn below it.
Colour plates. Figures may be published in colour, if this is judged
essential by the editor. The publisher and the author will each bear
part of the extra costs involved. Further information is available
from the publisher.
After acceptance
Notification. You will be notified by the Editor of the journal of
the acceptance of your article and invited to supply an electronic
version of the accepted text, if this is not already available.
Copyright transfer. In the course of the production process you
will be asked to transfer the copyright of the article to the pub-
lisher. This transfer will ensure the widest possible dissemination
of information.
IMPORTANT: When page proofs of the accepted manuscript are
made and sent to authors, this is in order to check that no unde-
tected errors have arisen in the typesetting (or file conversion)
process. Only printers' errors may be corrected; no changes in, or
additions to, the edited manuscript will be accepted. In the case of
extended changes, the authors will be required to pay part of the
extra costs involved.
Electronic manuscripts
The publisher welcomes the receipt of an electronic version of
your accepted manuscript. If there is not already a copy of this (on
diskette) with the journal editor at the time the manuscript is being
refereed, you will be asked to send a file with the text of the
accepted manuscript directly to the Publisher by e-mail or on
diskette (allowed formats 3.5" or 5.25" MS-DOS, or 3.5 _
Macintosh) to the address given below. Please note that no devia-
tions from the version accepted by the Editor of the journal are
permissible without the prior and explicit approval by the Editor.
Such changes should be clearly indicated on an accompanying
printout of the file.
Author benefits
No page charges. Publishing in Journal of Non-Crystalline Solids
is free.
Free offprints. The corresponding author will receive 50 offprints
free of charge. An offprint order form will be supplied by the pub-
lisher for ordering any additional paid offprints.
Discount. Contributors to Elsevier Science journals are entitled to
a 30% discount on all Elsevier Science books.
Further information (after acceptance)
Elsevier Science B.V.
Journal of Non-Crystalline Solids
Desk Editorial Department
P.O. Box 103, 1000 AC Amsterdam
The Netherlands.
Fax: +31 20 485 2775.
E-mail: g.anderton @elsevier.nl
North-Holland, an imprint of Elsevier Science
