20mm butt - cordis.europa.eu · measured with paut error in sizing of paut 6mm butt id position...
TRANSCRIPT

a) b)
c) d)
Figure 1: sound beam profile generating by the array PA3, 7MHz, 32 elements, focussed at 9mm in
depth
a) Full sector
b) along 45°
c) along 60°
d) along 70°
Table A PAUT results of 20mm butt weld testing.
20mm butt
ID Position from datum Length Heigth Position Position from datum Length Heigth
C1 60 18 5 Toe - 25 7 0
N1 84 8 1 Toe+ 17 2 0.5
C2 139 42 10 Toe- 54 3 0
C3 185 20 7 CL 35 10 2
C4 251 42 10 CL 49 3 0
C5 Transverse
C6 316 17 3 LOF - 16 7 0
N2 354 21 2 Toe+ 24 1 1
C7 368 17 2 LOrootF 28 3 0
N3 402 12 2 CL 22 3 0
C8 416 23 1.4 Lopen 26 7 0.1
C9 Pores
Measured with PAUT Error in sizing of PAUT

Table B PAUT results of 10mm butt weld testing.
Table C PAUT results of 6mm butt weld testing
10mm butt
ID Position from datum Length Heigth Position Position from datum Length Heigth
C1 50 24 2.8 Toe- 16 4 0.3
N1 81 7 1 Toe+ 11 2 0
C2 105 42 5 Toe- 15 2 0
C3 171 25 5 CL 16 0 2.5
C4 223 38 6 CL 18 2 1
C5 Transverse
N2 287 17 1.1 Toe + 12 2 0.9
C6 303 28 2 LOF 8 8 1.5
C7 354 22 2 LOrootF 14 2 0
N3 380 16 1.7 CL 12 6 0.2
C8 398 22 2 Lopen 13 3 0.5
C9 441 27 3 Pores 4 7 0
N4 470 3 / CL 10 2 /
N5 505 2 / Toe+ 7 1 /
Measured with PAUT Error in sizing of PAUT
6mm butt
ID Position from datum Length Heigth Position Position from datum Length Heigth
C1 82 34 4 Toe- 46 9 2.5
C2 144 42 7.5 Toe- 58 2 4.5
C3 182 18 3 CL 27 7 1.5
C4 238 26 4 CL 33 14 1
C5 Transverse
C6 327 26 1 LOF 32 6 2
N1 350 6 1 Toe+ 20 1 0
C7 372 20 2 LorootF 32 0 0
N2 392 12 1.5 Toe + 24 2 0
C8 425 26 1.5 Lopen 38 1 0
N3 440 4 1 Toe + 15 1 0
C9 447 14 4.3 Pores 10 6 1.3
N4 CL
N5 Toe+
Measured with PAUT Error in sizing of PAUT

Table D PAUT results of 20mm fillet weld testing
Table E PAUT results of 10mm fillet weld testing
20mm fillet
ID Position from datum Length Heigth Position Position from datum Length Heigth
C1 18 33 7 Toe- 22 8 2
C2 73 31 10 Toe+ 14 9 0
C3 150 24 5.8 Root 5 1 0.8
N1 150 22 3 Toe+ 5 2 0
N2 189 20 2 CL 21 5 0
C4 199 38 10 Root 6 2 0
N3 228 17 2 Cl 12 7 0.5
C5 Transverse
C6 284 23 4 LOF 16 3 1
C7 323 29 3 LorootF 17 9 1
C8 372 26 / Lopen 13 1 /
C9 425 29 / Pores 15 7 /
Error in sizing of PAUTMeasured with PAUT
10mm fillet
ID Position from datum Length Heigth Position Position from datum Length Heigth
C1 43 24 1.3 Toe- 3 1 1.2
C2 86 44 6.9 Toe+ 1 2 1.9
N1 157 16 2.4 Toe+ 2 1 0.4
C3 156 32 3.1 Root- 1 7 0.6
N2 193 15 1.4 CL 2 5 0.1
C4 203 47 6.4 Root- 2 7 1.4
N3 226 6 / CL 1 1 /
C5 Transverse
C6 304 16 2 LOF 9 4 1
C7 349 24 4 LorootF 14 6 2
N4 Toe+
N5 CL
C8 394 26 / Lopen 9 1 /
C9 450 12 4 Pores 15 10 1
Measured with PAUT Error in sizing of PAUT

Table F PAUT results of 6mm fillet weld testing.
Figure 2: ACFM probes arrangement
6mm fillet
Measured with PAUT
ID Position from datum Length Heigth Position Position from datum Length Heigth
C1 49 30 2 Toe- 9 5 0.5
C2 93 47 3.3 Toe- 2 17 0.3
C3 175 24 / Root - 20 1 /
N1 179 12 2 Toe+ 9 2 0.5
C4 223 38 3.8 Root - 23 2 0.8
N2 219 6 1 Toe+ 9 1 0
N3 252 4 1.1 Toe+ 7 1 0.1
C5 Transverse
C6 305 27 3 LOF 10 7 0
N4 Toe+
C7 354 22 4.6 LorootF 14 2 2.6
N5 CL
C8 398 27 / Lopen 13 2 /
C9 450 21 3.7 Pores 5 1 0.7
Error in sizing of PAUT

Figure 3: Difference in position between the ACFM and the MPI/DPI testing.
Figure 4: Difference in length sizing between the ACFM and the MPI/DPI testing.

Figure 5: Difference in depth sizing between the ACFM and the MPI/DPI testing.
Figure 6: User interface of offline profile analysis programme
Figure 7: Weld being scanned by the laser profile sensor

Figure 8: An example of butt weld tracking algorithm to find the error deviation from the current central weld seam position.
Figure 9: Visualisation software (GUI) for butt weld displayed on the visualisation inspection PC (ground station).

Figure 10: The magnets pulling force set-up.
Figure 11: Magnet pulling force.

Figure 12: Set-up for measurement of the friction between the belt and the magnet.

Figure 13: Motion recorded from encoder and acceleration part of the recorded data.
Figure 14: Acceleration part of the recorded data.

Table G: Static and kinetic friction coefficient between inner side of the belt and antifriction materials.
Maximum
acceleration
[m/sec^2]
Pushing mass
m1 [kg]
Pulling mass
m2 [kg]
Total mass
[kg]
Kinetic
friction
coefficient
Static
friction
coefficient
PTF
E
0,463 7,500 2,200 9,700 0,232
0,067
0,424 7,500 2,200 9,700 0,237
0,430 7,500 2,200 9,700 0,237
1,232 7,500 3,400 10,900 0,271
1,230 7,500 3,400 10,900 0,271
1,273 7,500 3,400 10,900 0,265
0,885 7,500 2,800 10,300 0,249
0,844 7,500 2,800 10,300 0,255
0,802 7,500 2,800 10,300 0,261
MC
Nyl
on
(M
C7
03H
L)
0,786 7,500 4,600 12,100 0,484
0,493
0,822 7,500 4,600 12,100 0,478
0,816 7,500 4,600 12,100 0,479
1,183 7,500 5,200 12,700 0,489
1,211 7,500 5,200 12,700 0,484
1,214 7,500 5,200 12,700 0,484
1,655 7,500 5,800 13,300 0,474
1,606 7,500 5,800 13,300 0,483
1,571 7,500 5,800 13,300 0,489
Po
lyac
etal
(1
0
mm
)
0,438 7,500 2,800 10,300 0,312
0,267 0,475 7,500 2,800 10,300 0,307
0,443 7,500 2,800 10,300 0,311

0,927 7,500 3,400 10,900 0,316
0,901 7,500 3,400 10,900 0,320
0,909 7,500 3,400 10,900 0,319
0,901 7,500 4,000 11,500 0,393
Ult
ra H
igh
Mo
lecu
larW
eigh
t P
oly
eth
ylen
e (3
mm
) 0,254 7,500 2,200 9,700 0,260
0,192
0,211 7,500 2,200 9,700 0,265
0,251 7,500 2,200 9,700 0,260
0,682 7,500 2,800 10,300 0,278
0,691 7,500 2,800 10,300 0,277
0,677 7,500 2,800 10,300 0,279
1,106 7,500 3,400 10,900 0,290
1,054 7,500 3,400 10,900 0,297
1,103 7,500 3,400 10,900 0,290

Table F: Kinetic friction coefficient between belt coating and painted plate.
Dry ECOMAR AF 70
RED BROWN
Dry WILKOR A/C
SILVER LIGHT
Wet ECOMAR AF
70 RED BROWN
Wet WILKOR A/C
SILVER LIGHT
G/G
STR
, ru
bb
er
0,973 0,886 1,058 0,759
0,944 - 0,873 0,864
0,951 1,008 0,923 0,676
0,973 0,956 0,759 0,617
0,974 1,090 0,777 0,615
0,958 1,096 0,731 0,599
Lin
atri
le, N
BR
0,566 0,701 0,898 0,658
0,580 0,713 0,863 0,713
0,550 0,719 0,808 0,603
0,546 0,725 0,795 0,662
0,627 0,743 0,835 0,655
0,636 0,750 0,805 0,638
Lin
atex
, Nat
ura
l ru
bb
er
1,738 1,953 0,658 0,521
1,756 1,764 0,665 0,644
1,719 1,875 0,681 0,661
1,702 1,810 0,617 0,568
1,738 1,752 0,741 0,630
1,878 1,734 0,591 0,777
EPD
M, R
ub
ber
1,006 0,702 0,802 0,705
1,008 0,936 0,832 0,684
1,001 0,888 0,671 0,717
0,991 0,862 0,704 0,711

1,021 0,889 0,552 0,653
1,041 0,855 0,552 0,661
Pim
ple
to
p, P
VC
0,860 0,477 0,602 0,418
0,860 - 0,658 0,401
0,933 0,686 0,599 0,358
0,911 0,683 0,467 0,352
0,957 0,699 0,550 0,323
0,983 0,705 0,484 0,354
PU
fo
il 6
0, p
oly
ure
than
e
1,011 1,062 0,901 -
1,009 1,007 - 0,798
0,935 1,198 0,724 0,750
0,916 1,010 0,733 0,652
0,898 0,984 0,707 0,674
0,836 0,939 0,774 0,570
PV
C
0,809 0,725 0,915 0,772
0,767 0,656 0,944 0,767
0,790 0,583 0,959 0,851
0,775 0,564 1,443 0,793
1,021 0,582 1,638 0,783
1,021 0,563 1,599 0,703
.

Figure 15: The main manipulator.

Figure 16: The demo plate uncoated and coated
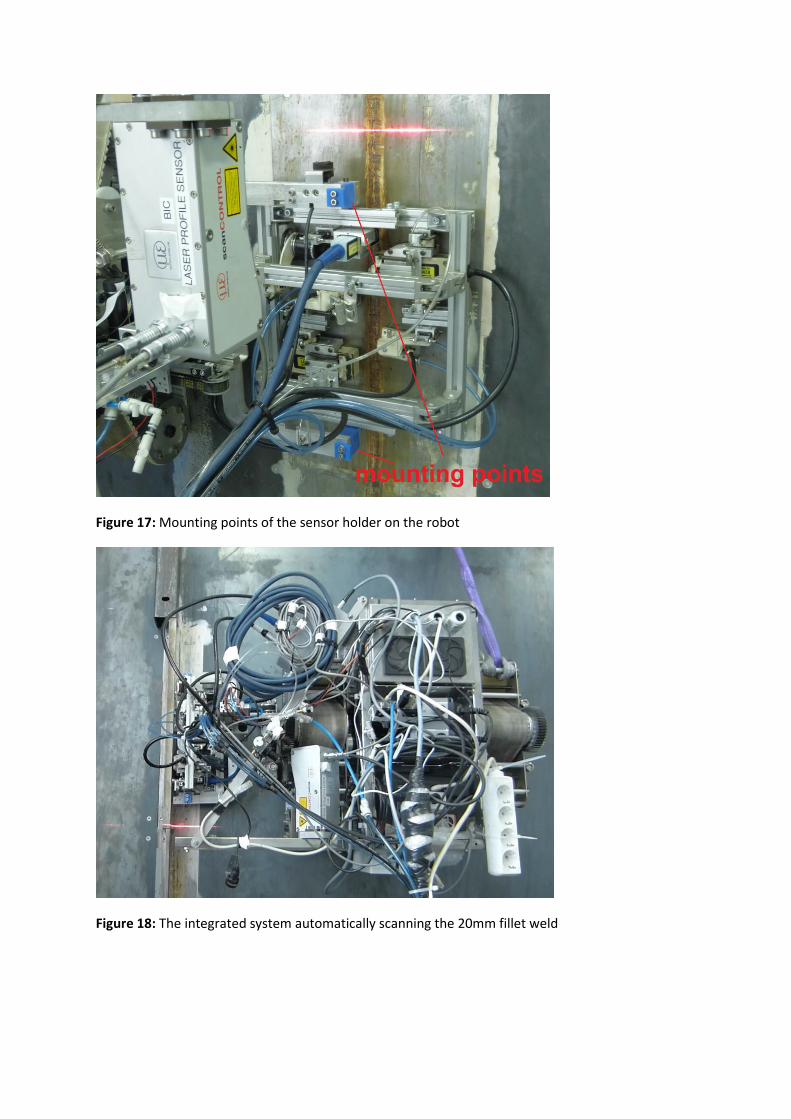
Figure 17: Mounting points of the sensor holder on the robot
Figure 18: The integrated system automatically scanning the 20mm fillet weld

Figure 19: Visualisation on the ground station (inspector PC). Top: surface plot build up for the weld
region. Bottom: time build up for the plates region. Right: current 2D profile.
Figure 20: Butt weld 10mm, 20mm/s speed (indication on weld side wall)

Figure 21: Butt weld 6mm, 20mm/s speed
Figure 22: Tests on the 13th of November

Figure 23: Preparation on the 14th of November
Figure 24: 4 meters high and going

Figure 25: Explanation of the button functions of the robot control GUI, focus on the sensor arm
control
Figure 26: Button functions of the joypad controlling the robot

Figure 27: Main program GUI on the mini PC and start data transmission of the laser system (actions
are boxed in red)
Figure 28: Extract from ACFM probe configuration file, changes needed circled in red