2/14/2018 georgia department of revenue · 2/14/2018 georgia department of revenue ... state of...
TRANSCRIPT
2/14/2018
GeorgiaDepartmentofRevenueProperty Tax Administration 2017 Annual Report

Lynnette T. Riley Commissioner
State of Georgia
Department of Revenue 1800 Century Boulevard
Suite 15300 Atlanta, Georgia 30345
(404) 417-2100
An Equal Opportunity Employer
February 14, 2018
The Honorable Nathan Deal, Governor Members of the Georgia Legislature 100 State Capitol Atlanta, Georgia 30334
Members of the General Assembly and Others:
This report has been developed by the Department of Revenue for the purpose of fulfilling the Commissioner’s responsibility to provide the General Assembly with the impact of Property Tax Administration and continued enactment of laws created by legislation and administered by the Georgia Department of Revenue.
The information contained in this report is provided pursuant to the requirements of O.C.G.A. §§ 48-5-349.5, 48-5-7.1, 48-5-7.4 and 48-5-7.7. It is hoped that this document will enhanceunderstanding of Property Tax Administration in Georgia.
The staff of the Local Government Services Division and I look forward to working with you and are available to provide more information or clarification of this report upon request.
Respectfully submitted,
Lynnette T. Riley State Revenue Commissioner


Table of Contents
Highlights of the Annual Report ............................................................................................................ 1
Reporting Requirements ........................................................................................................................ 5
Digest Review Procedures ..................................................................................................................... 6
Table 1: Review Year Counties Cited for Deficiencies ................................................................................. 7
Table 2: Non-Review Year Counties Assessed Additional State Tax .......................................................... 7
Figure 1: Average Level of Assessment ...................................................................................................... 8
Figure 2: Average Level of Uniformity. .......................................................................................................... 8
Figure 3: Average Level of Assessment Bias ................................................................................................ 8
Value and Revenue ................................................................................................................................. 9
Figure 4: Total Assessed Value ..................................................................................................................... 9
Figure 5: Average Millage Rate .................................................................................................................... 9
Table 3: 2017 Property Tax Mill Rates …………..……………………………………………………………10
Figure 6: Comparison of Total Revenue ..................................................................................................... 14
Figure 7: 2016 Percentage of Total Revenue by Tax Type ........................................................................ 14
Figure 8: 2016 County Tax Revenue by Property Class ............................................................................. 15
Figure 9: Five-Year Comparison of County Tax Revenue .......................................................................... 15
Figure 10: 2016 School Tax Revenue by Property Class. .......................................................................... 16
Figure 11: Five-Year Comparison of Total School Tax Revenue ................................................................ 16
Figure 12: 2016 State Tax Revenue by Property Class .............................................................................. 17
Figure 13: Five-Year Comparison of State Tax Revenue ........................................................................... 17
Performance Reviews of County Boards of Tax Assessors ............................................................. 18
List of Counties Where Performance Reviews Occurred ............................................................................ 19
Public Utilities ....................................................................................................................................... 20
Figure 14: Change in Public Utility Digest Value. ........................................................................................ 21
Figure 15: Trend of Average Proposed Public Utility Equalization Ratios. ................................................. 21
Figure 16: Number of Public Utility Companies by Year ............................................................................ 21
Table 4: 2016 Ratios Used to Propose 2017 Public Utility Assessments ................................................... 22
Preferential Agricultural Assessment ................................................................................................. 23
Table 5: Preferential Agricultural Assessment Fiscal Impact ..................................................................... 24
Table 6: Preferential Agricultural Assessment for 2016 ............................................................................. 25
Figure 17: Preferential Agricultural Total Tax Dollar. .................................................................................. 29
Figure 18: Preferential Agricultural Assessed Value Eliminated ................................................................. 29
Conservation Use Valuation ................................................................................................................ 30
Table 7: Conservation Use Fiscal Impact. .................................................................................................. 31
Table 8: Conservation Use Valuation Assessment ..................................................................................... 32
Figures 19: Conservation Use Revenue Shift ............................................................................................. 36
Figures 20: Conservation Use Assessed Value Eliminated ........................................................................ 36
Forest Land Conservation Use ............................................................................................................ 37
Table 9: Forest Land Conservation Use Fiscal Impact ............................................................................... 38
Table 10: Forest Land Conservation Use Valuation Assessment .............................................................. 39
Taxation of Standing Timber ............................................................................................................... 44
Figure 21: Statewide Timber Values ........................................................................................................... 44
Figure 22: County and School Revenue from Timber ................................................................................. 44
Table 11: 2015 Timber Revenue Reported on 2016 Tax Digests .............................................................. 45
Georgia’s Unclaimed Property Program ............................................................................................. 50
Unclaimed Property Deposit ........................................................................................................................ 50
Percentage of Paid Claims .......................................................................................................................... 50
1
Highlights of the Annual Report
Digest Review
The Revenue Commissioner continues to ensure uniformity and equalization between and within
counties using the same procedures enacted in 1992, and in the manner prescribed in Article 5A of
Chapter 5 of Title 48.
O.C.G.A. 48‐5‐8 was amended in 2010 so that over five years between 2011 and 2016 the state levy
phased‐out. Beginning in calendar year 2016, the state levy for ad valorem purpose is zero.
In addition, for tax year 2016, the statutory deadline for submitting the annual property tax digests
changed from August 1st to September 1st (See O.C.G.A. 48‐5‐205). For 2015, forty (40) counties
submitted their 2015 tax digest by the August 1st deadline. For 2016, eighty‐six (86) out of 159 counties
submitted their 2016 digest by the September 1st deadline. The Department continues to encourage
counties to achieve compliance with the law governing the digest submission due date.
Of the 53 counties falling in the 2016 digest review year and which underwent extensive review,
4 county ad valorem tax digests failed to meet state standards for approval. None of the 2016
review‐year digests were subject to the $5.00 per parcel penalty.
Of the other 106 non‐review counties examined in 2016, no county ad valorem tax digest failed
to have an acceptable overall average assessment ratio1 compared to one failure in 2015.
Assessed values increased from $373.1 billion in 2015 to $387.6 billion in 2016 or a 3.9% increase
from the values reported in 2015. The 2016 average millage rate of 28.56 increased from the
2015 average millage rate of 28.53.
Several graphs showing the trend of the level of assessment, uniformity, and assessment bias can
be found on Figures 1 ‐ 3 of this report.
1 AssessmentRatio - the fractional relationship that the assessed value of property bears to its fair market value.

2
Performance Review
In 2000, legislation was passed which provides that county governing authorities, by resolution, could
request that the Commissioner conduct a performance review of the county board of tax assessors. Upon
receipt of such a request, the Commissioner appoints a Performance Review Board consisting of 3
members: 1 member who is an employee of the Department of Revenue and 2 members who serve as
county chief appraisers. Once appointed, the Performance Review Board performs a thorough and
complete investigation of the board of tax assessors, including the technical competency of appraisal
techniques and compliance with state law and regulations, and issues a report of its findings to the
governing authority.
Since 2003 the Department has completed Performance Review of 33 county boards of tax assessors.
Additional information and a list of the counties where performance reviews have been performed can
be found in the section on Performance Reviews of County Boards of Tax Assessors.
Public Utilities
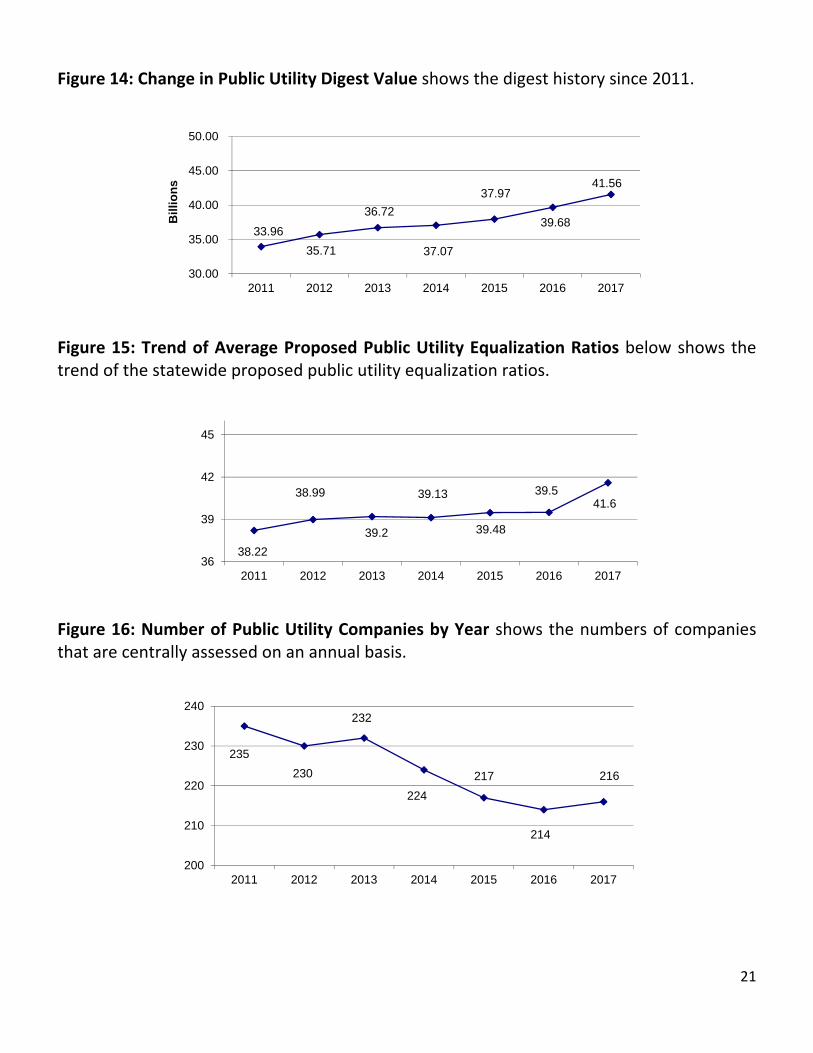
The statewide average equalization ratio2 for public utility property increased slightly from 39.5%
in 2016 to 41.6% for tax year 2017.
Equalization ratios for eleven (11) of the 159 counties were proposed at a ratio less than 40% for
tax year 2017.
Figure 14 reflects the growth in the Public Utility Digest since 2011.
A chart showing the trend of the state proposed average equalization ratio for public utility
property since 2011 can be found beginning on Figure 15 of this report.
Figure 16 shows the fluctuation in the number of companies centrally assessed annually due to
mergers, acquisitions, or companies ceasing to conduct business in Georgia.
2 EqualizationRatio- the level of assessment of centrally assessed property proposed by the State Board of Equalization and equal to the level of
assessment of all other property valued by the local county board of tax assessors. O.C.G.A. § 48-2-18.

3
Preferential Agricultural Assessment
Since the implementation of Preferential Agricultural Assessment3 in 1984, the program continued to
grow through tax year 2001. Since that time, the number of taxpayers participating in this special
assessment program has steadily declined; a result of the increase in fair market values at the local level
and the advantages of Conservation Use Valuation.
Tables 5 and 6 and Figures 17 and 18 depict the impact of Preferential Agricultural Assessment.
Conservation Use Valuation
Since the implementation of Conservation Use Valuation4 in 1992, the number of parcels in this program
has risen steadily. The number of parcels enrolled in the program for 2016 is 194,175 representing the
elimination of approximately $9.5 billion in value and total tax shift of approximately $263 million. These
values are expected to increase as county boards of tax assessors perform revaluations.
Tables 7 and 8, and Figures 19 and 20 depict the impact of Conservation Use Valuation.
Forest Land Protection Act of 2008
A new section has been added to this report as a result of 68% of the voters approving Amendment 1 in
the 2008 General Election. This amendment to the Constitution, known as the “Georgia Forest Land
Protection Act of 2008”, provides current use assessment for tracts of forest land consisting of more than
200 acres if the property owner enters a 15‐ year covenant.
One significant difference between this program and the Conservation Use Assessment is the provision
for the General Assembly to make an annual appropriation for forest land conservation use assistance
grants to counties to offset the revenue shift resulting from properties entered in this program. The grant
formula is designed to reimburse local governments for one‐half of revenue reduction on the first 3% of
digest value and 100% of the amount of revenue reduction that exceeds 3% of digest value.
Table 10 shows the number of properties enrolled in this program for 2016; the dollar amount of the
revenue shift; and the amounts of grants due to local governments.
3 PreferentialAgriculturalAssessment - Bona fide agricultural property assessed at 75 percent of the assessment of other property or at 30% of
fair market value. O.C.G.A. Section 48-5-7 and 48-5-7.1.
4 ConservationUseValuation - Bona fide agricultural property assessed at current use value rather than fair market value and developed by the
Department in accordance with O.C.G.A. Section 48-5-269.
4
Timber Taxation
Timber harvest values reported on the 2016 digests decreased from $685.2 million in 2014 to $670.7
million in 2015, a 2.1% value decrease. The revenue decreased 2.5% from $19.5 million to $19 million.
Timber harvest values and revenue trends can be found on Figures 21 and 22, and Table 11.
Unclaimed Property
The responsibility for the administration of this program is also handled by the Local Government Services
Division. The Disposition of Unclaimed Property Act protects the rights of owners of abandoned property
and relieves those holding the property of the continuing responsibility to account for the property. The
type of property that is subject to the Unclaimed Property Act consists of wages, company liquidation
proceeds, safe deposit boxes, money orders, uncashed checks, traveler checks, stocks and bonds.
Under the Act, when someone holds property (holder) that belongs to someone else (owner), but has lost
contact with the owner for a specified period (holding period), that holder must turn over (remit) the
property to the State. The State serves as the custodian for any property remitted under the Act allowing
the owners or their heirs an opportunity to claim their property in the future.
The information provided includes a five‐year history on deposits, locatable deposits, and paid claims.
Summary
The Department desires to provide the legislature with all information necessary for the proper evaluation of
legislative impacts and promulgation of property tax policies. It fully supports the initiatives of the General
Assembly in providing tax relief to the elderly, authorizing special assessment programs and exemptions for
certain categories of property, homeowner tax relief grants, and increased homestead exemptions that return
value to the citizens of Georgia.
5
Reporting Requirements The Commissioner’s responsibility for continuing to provide the General Assembly with the impact of
property tax administration and continued enactment of laws created by legislation and administered by
the Department of Revenue, Local Government Services Division, are as follows:
O.C.G.A. § 48‐5‐342 requires examination of the digest of each county to ensure that all property
valuations are reasonably uniform and equalized among the counties and within the counties.
O.C.G.A. § 48‐5‐349.5 requires a status report on this review process along with the Commissioner’s
observations regarding the progress of the counties in ad valorem tax administration.
O.C.G.A. § 48‐5‐7.1 requires submission of a report showing the fiscal impact of the law providing for
the preferential assessment of tangible real property devoted to agricultural use. Qualified farm
property is assessed at 75% of assessed value under this program and this report analyzes the effect
of this program on taxpayers and levying authorities.
O.C.G.A. § 48‐5‐7.4 requires a report showing the fiscal impact of the law providing for conservation
use assessment of certain agricultural properties attendant with this code section. Qualified farm
property is assessed at its current use value based upon a table of values established by the
Commissioner following specific legal procedures. This report analyzes the adverse fiscal impact, if
any, on other taxpayers and levying authorities.
O.C.G.A. § 48‐5‐7.7 requires a report showing the fiscal impact of the law providing for current use
assessment of properties enrolled in the Forest Land Protection Act of 2008 program attendant with
this code section. Qualified forest land property is assessed at its current use value based upon a
table of values established by the Commissioner following specific legal procedures. This report
analyzes the adverse fiscal impact, if any, on other taxpayers and levying authorities.


6
Digest Review Procedures
The Commissioner, through the Local Government Services Division, has been given the statutory duty in
Article 5A of Chapter 5 of Title 48 to review county tax digests and provide guidance to county boards of tax
assessors when adjusting property valuations to ensure uniformity and equalization5 of assessments for all
property owners.
As directed by the legislature, the Commissioner has adopted a digest review cycle in which each county’s
tax digest is reviewed extensively to determine the level of assessment, uniformity and equalization in each
property class.
O.C.G.A. 48‐5‐304 prohibits the Commissioner from approving any digest where the value in dispute exceeds certain stated thresholds or where evidence exists that the county substantially failed to comply with laws regarding valuation of property.
In any given year, one third of the county tax digests undergo extensive statistical testing. Counties which
do not meet the criteria as set forth in the statute and regulations, are allowed an opportunity during the
three‐year cycle to correct any deficiencies by the next review year. The other counties that are not being
extensively reviewed are examined for level of assessment to equalize the state levy and public utility assessments. The Commissioner approves a county’s digest as being reasonably uniform and equalized if it
meets certain standards.
For those digests submitted by counties in their digest review year, the Commissioner completes her review
on or before August 1 of the following tax year or within 30 days of the date the ratio study results are
provided by the State Auditor. Based upon this review, the Commissioner will approve a digest when it is
found to be reasonably uniform and equalized by having met the following state standards:
The average level of assessment for each class of property meets the mandated state standard of
36% to 44%;
The average measure of overall equalization, the coefficient of dispersion5, meets the state
standard of 15% or less for residential properties and 20% or less for all other property classes; and
The bias ratio, or statistical measure of price‐related differential6, meets the state standard of
95% to 110%.
5 The Coefficient of Dispersion - the statistical representation of equalization.
6 The Price-Related Differential - the statistical measure of assessment bias. This demonstrates whether lower or higher-priced properties are more
accurately assessed.

7
Annually one‐third of the counties are subject to measuring additional standards of statistical compliance.
When measuring this compliance, the Commissioner utilizes information provided by the State Auditor from
the sales ratio studies developed for each county. Each county’s ratio study measures the statistical
standards for level of assessment, uniformity and equalization.
The Commissioner conditionally approves the digest and assesses a penalty of $5 per taxable parcel of real
property if a county’s review year digest contains the same or similar deficiencies as the previous review year
digest.
The 2016 digest review process was completed as directed in O.C.G.A. 48‐5‐343. As noted on Table 1, the
review of the 53 counties that fell within the 2016 review year indicated that while four counties were
deficient, no county was subject to the $5 per parcel penalty for failure to correct prior digest deficiencies.
The review of the 106 non‐review year counties resulted no county being assessed state tax.
Table 1: Review Year Counties Cited for Deficiencies
COUNTY $5 PARCEL PENALTY
STATE LEVY
Barrow
Coffee
Fulton
Meriwether
Table 2: Non‐Review Year Counties Assessed Additional State Tax
COUNTY ADDITIONAL STATE TAX
None

8
Figure 1: Average Level of Assessment shows the average Median Ratio from 2010 to 2016.
Figure 2: Average Level of Uniformity shows the average level of uniformity, as measured by the Coefficient of Dispersion, and indicates the equality of assessments between individual properties. Case law indicates that this is the most important measure of fairness within a taxing jurisdiction.
Figure 3: Average Level of Assessment Bias shows the average level of assessment bias for the past five years as measured by the Price Related Differential.
38.27%
39.00%
39.21%
39.15%
39.48%
39.51%
39.42%
36.00%
38.00%
40.00%
42.00%
2010 2011 2012 2013 2014 2015 2016Acc
epta
ble
Ran
ge:
36%
to
44%
12.71%
13.57%
13.04%
12.52%
5.42%
12.04%
11.00%
3.00%
6.00%
9.00%
12.00%
15.00%
18.00%
2010 2011 2012 2013 2014 2015 2016
Acc
epta
ble
Ran
ge:
15%
or
less
101.93%
101.98%
100.92%
101.62%
101.23%
95.00%
100.00%
105.00%
110.00%
2012 2013 2014 2015 2016
Acc
epta
ble
Ran
ge:
95%
to
110
%


9
Value and Revenue Since the implementation of the current digest review procedures, counties have been performing either
total or partial revaluations or updates to property valuations to conform to the state standards for
acceptable digests. Property values increased from 2001 to 2008 between 6 and 9 percent annually.
Assessed values decreased from 2010 to 2013 and appear to have recovered to near 2008 levels by digest
year 2016.
Figure 4: Total Assessed Value shows the changes in property values since 2008.
Figure 5: Average Millage Rate shows the average millage rate since 2010.
396.6
397.9
376.7
359.4
348.4
348.1
358.7
373.1
387.6
200.0
300.0
400.0
500.0
2008 2009 2010 2011 2012 2013 2014 2015 2016
Bil
lio
ns
26.79
27.31
27.52
28.11
28.17
28.53
28.56
24
26
28
30
32
2010 2011 2012 2013 2014 2015 2016
10
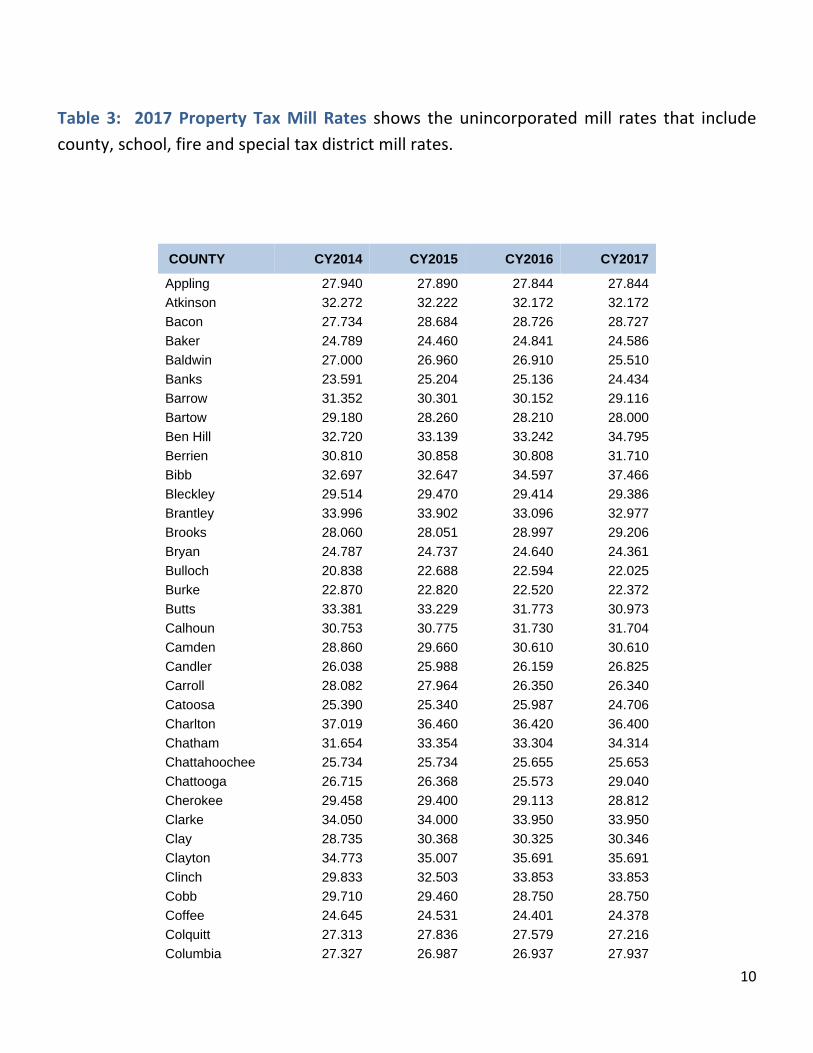
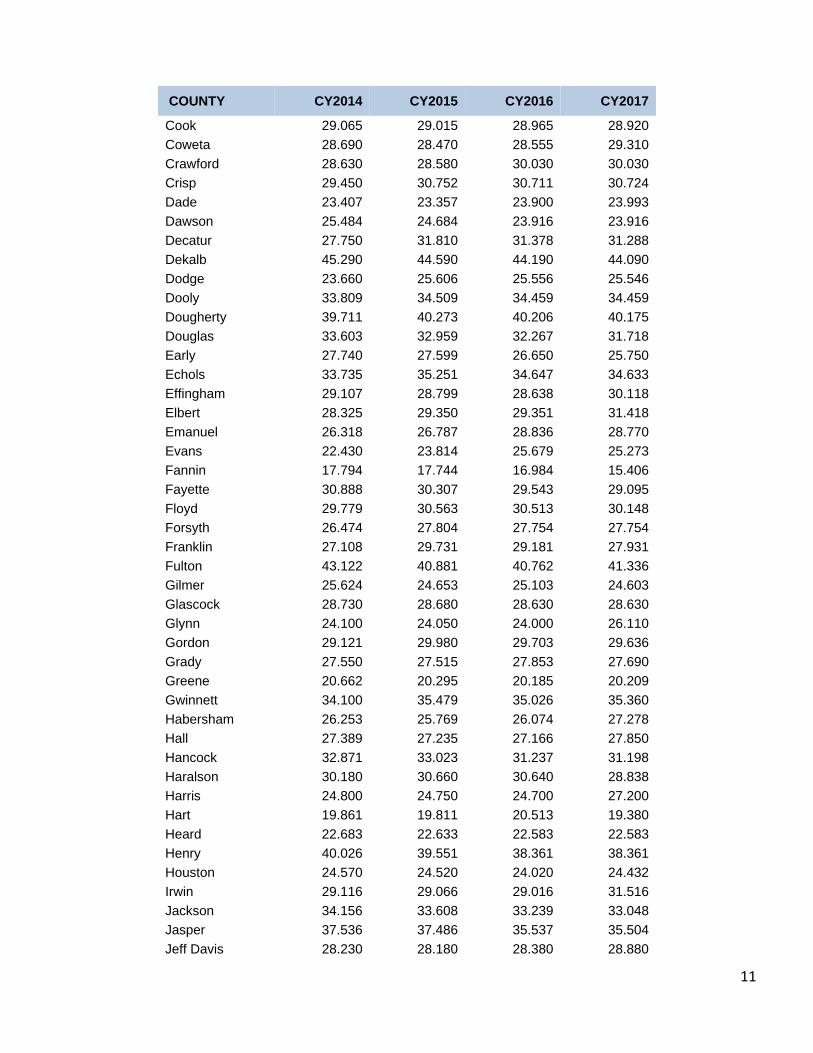
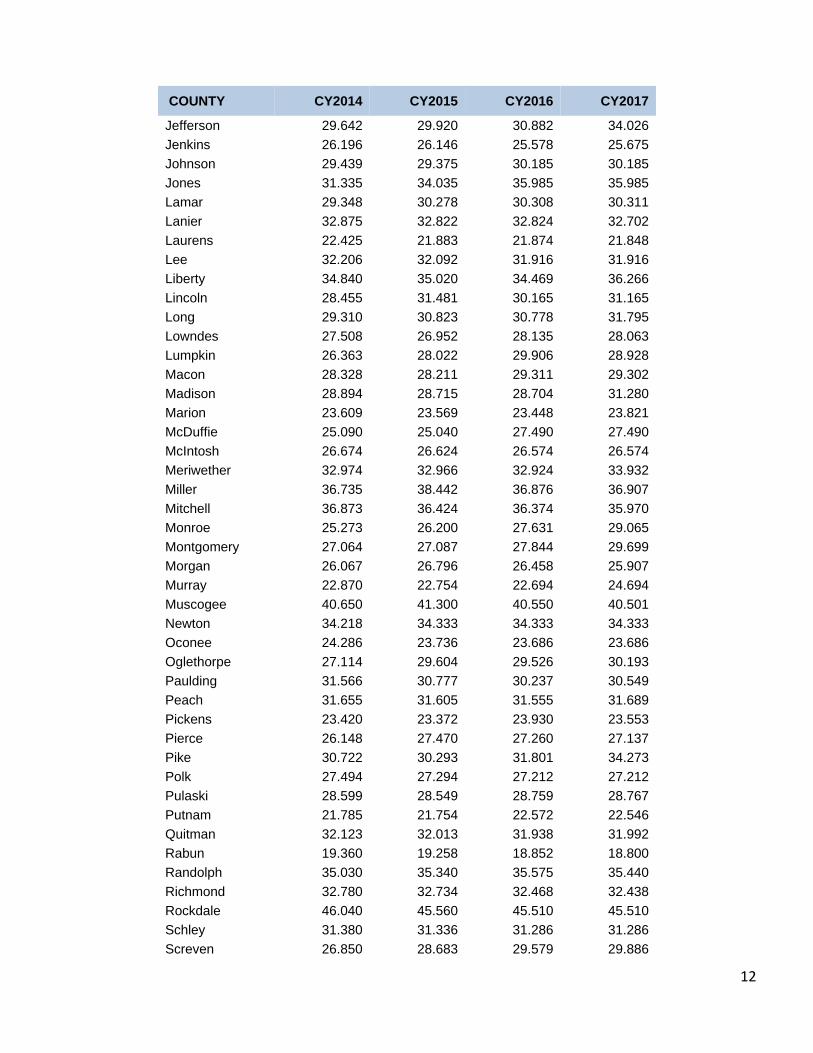
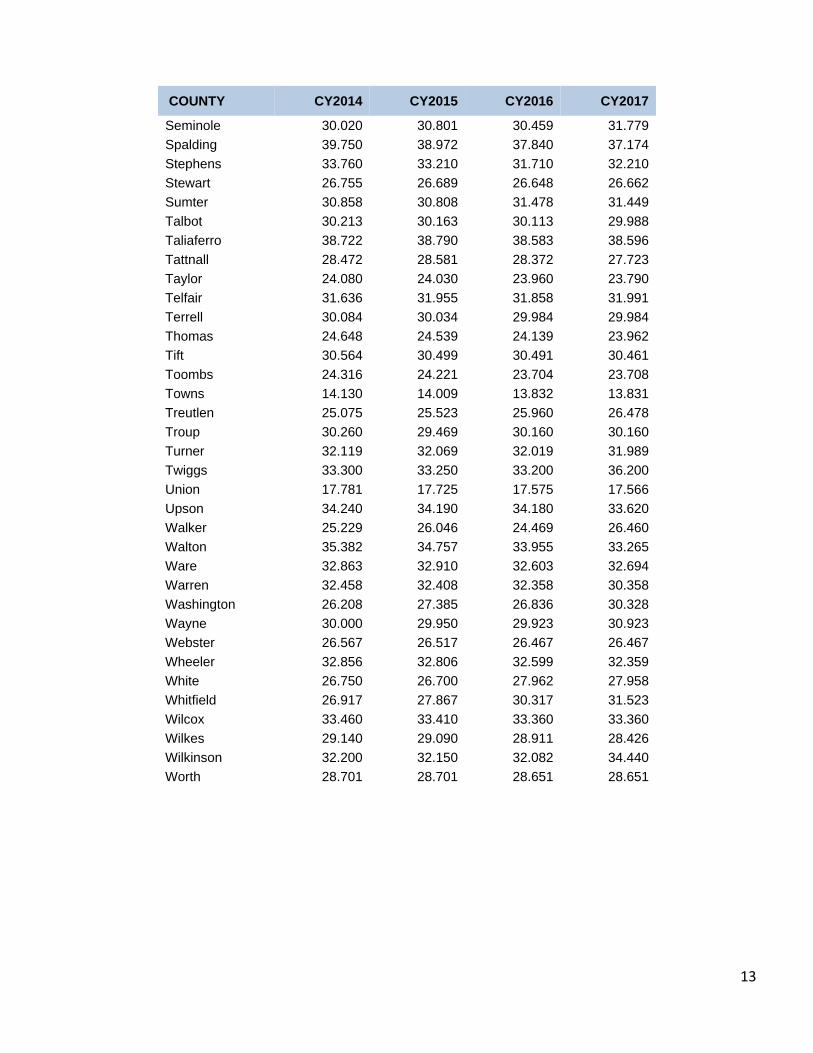
Table 3: 2017 Property Tax Mill Rates shows the unincorporated mill rates that include
county, school, fire and special tax district mill rates.
COUNTY CY2014 CY2015 CY2016 CY2017
Appling 27.940 27.890 27.844 27.844
Atkinson 32.272 32.222 32.172 32.172
Bacon 27.734 28.684 28.726 28.727
Baker 24.789 24.460 24.841 24.586
Baldwin 27.000 26.960 26.910 25.510
Banks 23.591 25.204 25.136 24.434
Barrow 31.352 30.301 30.152 29.116
Bartow 29.180 28.260 28.210 28.000
Ben Hill 32.720 33.139 33.242 34.795
Berrien 30.810 30.858 30.808 31.710
Bibb 32.697 32.647 34.597 37.466
Bleckley 29.514 29.470 29.414 29.386
Brantley 33.996 33.902 33.096 32.977
Brooks 28.060 28.051 28.997 29.206
Bryan 24.787 24.737 24.640 24.361
Bulloch 20.838 22.688 22.594 22.025
Burke 22.870 22.820 22.520 22.372
Butts 33.381 33.229 31.773 30.973
Calhoun 30.753 30.775 31.730 31.704
Camden 28.860 29.660 30.610 30.610
Candler 26.038 25.988 26.159 26.825
Carroll 28.082 27.964 26.350 26.340
Catoosa 25.390 25.340 25.987 24.706
Charlton 37.019 36.460 36.420 36.400
Chatham 31.654 33.354 33.304 34.314
Chattahoochee 25.734 25.734 25.655 25.653
Chattooga 26.715 26.368 25.573 29.040
Cherokee 29.458 29.400 29.113 28.812
Clarke 34.050 34.000 33.950 33.950
Clay 28.735 30.368 30.325 30.346
Clayton 34.773 35.007 35.691 35.691
Clinch 29.833 32.503 33.853 33.853
Cobb 29.710 29.460 28.750 28.750
Coffee 24.645 24.531 24.401 24.378
Colquitt 27.313 27.836 27.579 27.216
Columbia 27.327 26.987 26.937 27.937
11
COUNTY CY2014 CY2015 CY2016 CY2017
Cook 29.065 29.015 28.965 28.920
Coweta 28.690 28.470 28.555 29.310
Crawford 28.630 28.580 30.030 30.030
Crisp 29.450 30.752 30.711 30.724
Dade 23.407 23.357 23.900 23.993
Dawson 25.484 24.684 23.916 23.916
Decatur 27.750 31.810 31.378 31.288
Dekalb 45.290 44.590 44.190 44.090
Dodge 23.660 25.606 25.556 25.546
Dooly 33.809 34.509 34.459 34.459
Dougherty 39.711 40.273 40.206 40.175
Douglas 33.603 32.959 32.267 31.718
Early 27.740 27.599 26.650 25.750
Echols 33.735 35.251 34.647 34.633
Effingham 29.107 28.799 28.638 30.118
Elbert 28.325 29.350 29.351 31.418
Emanuel 26.318 26.787 28.836 28.770
Evans 22.430 23.814 25.679 25.273
Fannin 17.794 17.744 16.984 15.406
Fayette 30.888 30.307 29.543 29.095
Floyd 29.779 30.563 30.513 30.148
Forsyth 26.474 27.804 27.754 27.754
Franklin 27.108 29.731 29.181 27.931
Fulton 43.122 40.881 40.762 41.336
Gilmer 25.624 24.653 25.103 24.603
Glascock 28.730 28.680 28.630 28.630
Glynn 24.100 24.050 24.000 26.110
Gordon 29.121 29.980 29.703 29.636
Grady 27.550 27.515 27.853 27.690
Greene 20.662 20.295 20.185 20.209
Gwinnett 34.100 35.479 35.026 35.360
Habersham 26.253 25.769 26.074 27.278
Hall 27.389 27.235 27.166 27.850
Hancock 32.871 33.023 31.237 31.198
Haralson 30.180 30.660 30.640 28.838
Harris 24.800 24.750 24.700 27.200
Hart 19.861 19.811 20.513 19.380
Heard 22.683 22.633 22.583 22.583
Henry 40.026 39.551 38.361 38.361
Houston 24.570 24.520 24.020 24.432
Irwin 29.116 29.066 29.016 31.516
Jackson 34.156 33.608 33.239 33.048
Jasper 37.536 37.486 35.537 35.504
Jeff Davis 28.230 28.180 28.380 28.880
12
COUNTY CY2014 CY2015 CY2016 CY2017
Jefferson 29.642 29.920 30.882 34.026
Jenkins 26.196 26.146 25.578 25.675
Johnson 29.439 29.375 30.185 30.185
Jones 31.335 34.035 35.985 35.985
Lamar 29.348 30.278 30.308 30.311
Lanier 32.875 32.822 32.824 32.702
Laurens 22.425 21.883 21.874 21.848
Lee 32.206 32.092 31.916 31.916
Liberty 34.840 35.020 34.469 36.266
Lincoln 28.455 31.481 30.165 31.165
Long 29.310 30.823 30.778 31.795
Lowndes 27.508 26.952 28.135 28.063
Lumpkin 26.363 28.022 29.906 28.928
Macon 28.328 28.211 29.311 29.302
Madison 28.894 28.715 28.704 31.280
Marion 23.609 23.569 23.448 23.821
McDuffie 25.090 25.040 27.490 27.490
McIntosh 26.674 26.624 26.574 26.574
Meriwether 32.974 32.966 32.924 33.932
Miller 36.735 38.442 36.876 36.907
Mitchell 36.873 36.424 36.374 35.970
Monroe 25.273 26.200 27.631 29.065
Montgomery 27.064 27.087 27.844 29.699
Morgan 26.067 26.796 26.458 25.907
Murray 22.870 22.754 22.694 24.694
Muscogee 40.650 41.300 40.550 40.501
Newton 34.218 34.333 34.333 34.333
Oconee 24.286 23.736 23.686 23.686
Oglethorpe 27.114 29.604 29.526 30.193
Paulding 31.566 30.777 30.237 30.549
Peach 31.655 31.605 31.555 31.689
Pickens 23.420 23.372 23.930 23.553
Pierce 26.148 27.470 27.260 27.137
Pike 30.722 30.293 31.801 34.273
Polk 27.494 27.294 27.212 27.212
Pulaski 28.599 28.549 28.759 28.767
Putnam 21.785 21.754 22.572 22.546
Quitman 32.123 32.013 31.938 31.992
Rabun 19.360 19.258 18.852 18.800
Randolph 35.030 35.340 35.575 35.440
Richmond 32.780 32.734 32.468 32.438
Rockdale 46.040 45.560 45.510 45.510
Schley 31.380 31.336 31.286 31.286
Screven 26.850 28.683 29.579 29.886
13
COUNTY CY2014 CY2015 CY2016 CY2017
Seminole 30.020 30.801 30.459 31.779
Spalding 39.750 38.972 37.840 37.174
Stephens 33.760 33.210 31.710 32.210
Stewart 26.755 26.689 26.648 26.662
Sumter 30.858 30.808 31.478 31.449
Talbot 30.213 30.163 30.113 29.988
Taliaferro 38.722 38.790 38.583 38.596
Tattnall 28.472 28.581 28.372 27.723
Taylor 24.080 24.030 23.960 23.790
Telfair 31.636 31.955 31.858 31.991
Terrell 30.084 30.034 29.984 29.984
Thomas 24.648 24.539 24.139 23.962
Tift 30.564 30.499 30.491 30.461
Toombs 24.316 24.221 23.704 23.708
Towns 14.130 14.009 13.832 13.831
Treutlen 25.075 25.523 25.960 26.478
Troup 30.260 29.469 30.160 30.160
Turner 32.119 32.069 32.019 31.989
Twiggs 33.300 33.250 33.200 36.200
Union 17.781 17.725 17.575 17.566
Upson 34.240 34.190 34.180 33.620
Walker 25.229 26.046 24.469 26.460
Walton 35.382 34.757 33.955 33.265
Ware 32.863 32.910 32.603 32.694
Warren 32.458 32.408 32.358 30.358
Washington 26.208 27.385 26.836 30.328
Wayne 30.000 29.950 29.923 30.923
Webster 26.567 26.517 26.467 26.467
Wheeler 32.856 32.806 32.599 32.359
White 26.750 26.700 27.962 27.958
Whitfield 26.917 27.867 30.317 31.523
Wilcox 33.460 33.410 33.360 33.360
Wilkes 29.140 29.090 28.911 28.426
Wilkinson 32.200 32.150 32.082 34.440
Worth 28.701 28.701 28.651 28.651

14
Property tax continues to be the primary revenue source for local governments. Currently approximately
$11.2 billion in revenue is collected from property taxes in Georgia. Because Department involvement in the
collection of city taxes is limited, the information below does not include taxes levied and collected for
municipalities.
Figure 6: Comparison of Total Revenue shows the total revenues collected.
Figure 7: 2016 Percentage of Total Revenue by Tax Type shows the percentage of the total
ad valorem taxes levied for state, county and school purposes.
10.7
10.4
10.1
10.2
10.5
10.9
11.2
6.0
9.0
12.0
15.0
2010 2011 2012 2013 2014 2015 2016
Bil
lio
ns
County, 38.98%
School, 61.02%

15
Figure 8: 2016 County Tax Revenue by Property Class shows the amount of tax revenue generated from the various classes of property for county tax purposes.
Figure 9: Five‐Year Comparison of County Tax Revenue shows the amount of tax revenue
levied for 2016 for county tax purposes and a five‐year comparison.
Residential , $2,108.5
Agricultural, $118.6
Commercial, $1,173.7
Industrial, $228.4
Public Utility, $179.9
Motor Vehicle, $135.7 Mobile Homes,
$11.9 Timber, $8.9
Heavy Duty Equipment, $0.3
$3.5
$3.6
$3.8
$3.9
$4.0
$2.0
$3.0
$4.0
$5.0
$6.0
2012 2013 2014 2015 2016
Bil
lio
ns

16
Figure 10: 2016 School Tax Revenue by Property Class shows the amount of tax revenue.
Figure 11: Five‐Year Comparison of Total School Tax Revenue shows the amount of tax
revenue and a five‐year comparison for school tax purposes.
Residential , $3,377.7
Agricultural, $163.2
Commercial, $1,818.3
Industrial, $353.0
Public Utility, $265.7
Motor Vehicle, $212.0
Mobile Homes, $16.4
Timber, $11.1
Heavy Duty Equipment, $0.4
5.5
5.6
5.8
6.0
6.2
4.0
6.0
8.0
10.0
2012 2013 2014 2015 2016
Bil
lio
ns
17
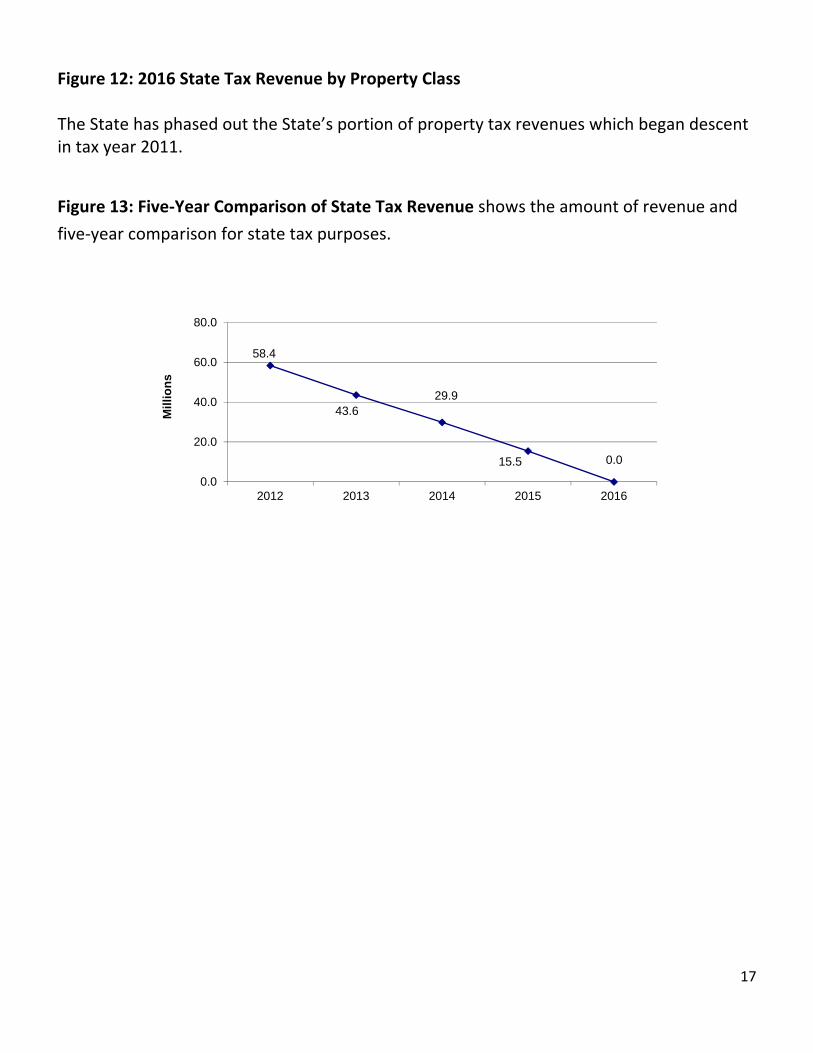
Figure 12: 2016 State Tax Revenue by Property Class The State has phased out the State’s portion of property tax revenues which began descent in tax year 2011.
Figure 13: Five‐Year Comparison of State Tax Revenue shows the amount of revenue and
five‐year comparison for state tax purposes.
58.4
43.629.9
15.5 0.0
0.0
20.0
40.0
60.0
80.0
2012 2013 2014 2015 2016
Mil
lio
ns


18
Performance Reviews of County Boards of Tax Assessors
In 2000 legislation was passed which provides that county governing authorities, by resolution, can request
that the Commissioner conduct a Performance Review of the county board of tax assessors. Upon receipt of
such a request, the Commissioner appoints a Performance Review Board consisting of 3 members: 1 member
who is an employee of the Department of Revenue and 2 members who serve as chief appraisers in counties
other than the county being reviewed. Once appointed, the Performance Review Board performs a thorough
and complete investigation of the board of tax assessors, including the technical competency of appraisal
techniques and compliance with state law and regulations, and issues a report of its findings to the governing
authority.
The governing authority may use the results of the Performance Review Report as grounds for removal of
any or all members of the board of tax assessors. Since 2000, Bibb, Chatham, Douglas, Fannin, Fulton and
Hart counties have pursued removal of members of the board of tax assessors based on the findings of the
Performance Review Board.
During the years the Department has been conducting Performance Reviews, it has become evident that
county governing authorities most often request Performance Reviews whenever the board of tax assessors
has concluded a revaluation of all property within the county, particularly if the tax assessors have not kept
taxpayers informed of the expected effect the revaluation will have upon property values.
The findings of the Performance Reviews have varied. Some have determined that counties are in compliance
with state law, where the board of tax assessors has been diligent in establishing fair market values in an
appropriate manner, are conscientious in following proper appraisal methodology, and work well with
taxpayers and other county tax officials. Others have found dysfunctional boards who have established
property values with no documentation to support their appraisals, without adherence to proper appeal
procedures, and lack good customer service to taxpayers.

19
List of Counties Where Performance Reviews Occurred
2017 Fulton
2016 Echols Hart Spalding
2015
2014 Candler Wayne
2013 Fannin
2012 Floyd Lincoln
2011
2010 Pierce
2009 Camden Jones Effingham
2008 Jefferson
2007 Brantley Crawford Telfair
2006 Bibb Fulton Habersham Lamar Morgan Whitfield
2005 Charlton Gilmer Ware Wheeler
2004 Dade Hart Liberty Madison
2003 Douglas Johnson Richmond
20
Public Utilities O.C.G.A. § 48‐2‐18 requires the Commissioner to annually propose assessments for public utility property
and to ensure that these properties are assessed at the same overall average assessment level as other
property in the county. Each utility company is required to annually return their properties indicating
location, description, type of property and valuation. The Commissioner’s staff inspects these returns to
ensure the accuracy of each utility company’s declarations and the State Board of Equalization must approve
the digest of public utility values and equalization ratios prior to notification to the counties and the public
utility companies. The State Board of Equalization at the time the 2016 digest was approved was comprised
of Revenue Commissioner Lynnette T. Riley, State Auditor Greg Griffin, and Steve Stancil, Director of the State
Properties Commission.
In determining each county’s proposed assessed public utility values for 2016 the Commissioner utilized the
equalization ratios developed by the State Auditor based on the results of the sales ratio study performed on
2015 tax digest. This method ensures that proposed public utility values are set at the same overall average
assessment level as other properties.
Once the State Board of Equalization approved these values, proposed equalization ratios and assessments
were issued to the counties and utility companies. Each county board of tax assessors then determined the
final assessment of utility properties by either accepting the State’s proposed equalization ratio or
substituting their own upon issuing assessment notices to the utility companies.
The Department continues to be engaged in litigation as a result of public utility companies appealing their
valuations. Discussions with public utility industry representatives continue in an attempt to reach a mutual
understanding of appraisal methodologies so as to reduce the number of appeals and provide a uniform
method of appraising property using the unit rule approach.
The Department appraised these properties utilizing recognized and publicly available financial reference
data to determine the reported net worth of public utility companies in an effort to eliminate bias concerning
the actual unit value of each company. These nationally recognized financial sources included Reuters,
Standard & Poor’s, Morningstar, and Value Line, making the process less subjective and more transparent.
21
Figure 14: Change in Public Utility Digest Value shows the digest history since 2011.
Figure 15: Trend of Average Proposed Public Utility Equalization Ratios below shows the trend of the statewide proposed public utility equalization ratios.
Figure 16: Number of Public Utility Companies by Year shows the numbers of companies that are centrally assessed on an annual basis.
33.96
35.71
36.72
37.07
37.97
39.68
41.56
30.00
35.00
40.00
45.00
50.00
2011 2012 2013 2014 2015 2016 2017
Bil
lio
ns
38.22
38.99
39.2
39.13
39.48
39.541.6
36
39
42
45
2011 2012 2013 2014 2015 2016 2017
235
230
232
224
217
214
216
200
210
220
230
240
2011 2012 2013 2014 2015 2016 2017

22
Table 4: 2016 Ratios Used to Propose 2017 Public Utility Assessments shows each county’s
proposed equalization ratio for assessment of the public utility properties.
Appling 38.91 Dade 40.16 Jefferson 39.26 Richmond 39.01
Atkinson 39.06 Dawson 39.99 Jenkins 40.45 Rockdale 39.09
Bacon 38.96 Decatur 40.10 Johnson 40.23 Schley 42.69
Baker 40.18 Dekalb 38.53 Jones 42.32 Screven 39.06
Baldwin 38.23 Dodge 39.13 Lamar 39.80 Seminole 40.55
Banks 40.02 Dooly 39.97 Lanier 42.85 Spalding 38.77
Barrow 35.50 Dougherty 40.35 Laurens 38.99 Stephens 41.58
Bartow 38.70 Douglas 39.89 Lee 38.75 Stewart 40.66
Ben Hill 40.23 Early 39.86 Liberty Sumter 40.84
Berrien 38.53 Echols 39.21 Lincoln 37.99 Talbot 36.18
Bibb 40.32 Effingham 40.13 Long 40.89 Taliaferro 39.92
Bleckley 38.91 Elbert 40.02 Lowndes 38.61 Tattnall 38.07
Brantley 38.08 Emanuel 39.83 Lumpkin 39.28 Taylor 40.59
Brooks 39.57 Evans 39.85 Macon 37.55 Telfair 40.21
Bryan 39.31 Fannin 38.80 Madison 38.11 Terrell 41.07
Bulloch 39.09 Fayette 38.81 Marion 41.08 Thomas 39.06
Burke 39.46 Floyd 39.06 McDuffie 40.40 Tift 39.17
Butts 39.60 Forsyth 38.08 McIntosh 39.46 Toombs 40.42
Calhoun 40.26 Franklin 38.27 Meriwether 39.80 Towns 38.96
Camden 38.18 Fulton 36.05 Miller 41.34 Treutlen 40.33
Candler 39.50 Gilmer 38.73 Mitchell 39.23 Troup 39.30
Carroll 39.42 Glascock 40.07 Monroe 39.57 Turner 39.78
Catoosa 38.12 Glynn 37.44 Montgomery 40.19 Twiggs 40.85
Charlton 39.46 Gordon 39.82 Morgan 40.44 Union 39.50
Chatham 38.13 Grady 37.31 Murray 38.18 Upson 36.17
Chattahoochee 39.23 Greene 40.82 Muscogee 39.24 Walker 38.42
Chattooga 36.69 Gwinnett 39.41 Newton 37.67 Walton 38.33
Cherokee 38.03 Habersham 38.39 Oconee 38.09 Ware 38.15
Clarke 39.39 Hall 38.16 Oglethorpe 38.82 Warren 38.96
Clay 38.85 Hancock 41.14 Paulding 39.52 Washington 42.37
Clayton 40.92 Haralson 38.07 Peach 39.26 Wayne 39.88
Clinch 39.10 Harris 39.58 Pickens 41.84 Webster 42.59
Cobb 38.01 Hart 36.63 Pierce 38.34 Wheeler 39.65
Coffee 38.70 Heard 39.14 Pike 39.92 White 40.60
Colquitt 38.49 Henry 39.82 Polk 39.69 Whitfield 38.92
Columbia 39.10 Houston 38.71 Pulaski 40.94 Wilcox 39.05
Cook 40.46 Irwin 39.16 Putnam 40.59 Wilkes 40.80
Coweta 38.15 Jackson 38.64 Quitman 39.34 Wilkinson 38.16
Crawford 39.77 Jasper 39.61 Rabun 40.34 Worth 40.74
Crisp 40.51 Jeff Davis 38.01 Randolph 40.44 Average 39.39

23
Preferential Agricultural Assessment
In the 1983 legislative session, O.C.G.A. § 48‐5‐7.1 was passed establishing preferential assessment of
tangible real property devoted to bona fide agricultural purposes. By statute, all real property is assessed at
40% of fair market value. However, the new legislation provided for a 30% level of assessment or 75% of the
value at which other taxable real property is assessed. The decrease in the level of assessment creates a tax
shift7 from those taxpayers taking advantage of this special assessment program to those taxpayers who
cannot qualify for special treatment, in the same manner as any exemption for one class of taxpayers shifts
the tax burden to another class of property owners.
In making application for preferential assessment, qualifying taxpayers must sign a covenant (contract)
agreeing to continuously maintain the property in agricultural pursuits for a period of 10 years. Transfers of
ownership are allowed provided the property is transferred to another qualifying entity that agrees to
continue the property in agricultural pursuits for the remainder of the covenant period. Otherwise, the
covenant has been breached and a penalty imposed. Penalties range from 5 times the tax savings if the
breach occurs during the first year of the covenant, to a minimum of 2 times the tax savings if the breach
occurs during the tenth year of the covenant.
7 TaxShift - Providing property tax relief to a particular class of taxpayers through valuation reductions or exemptions, resulting in a higher tax
burden for other classes of taxpayers. For example, taxpayers in the preferential tax assessment program are afforded an exemption equal to the difference between an assessment of 40% of fair market value and 30% of fair market value, while the property of residential, commercial, industrial, and other classes of taxpayers is assessed at 40% of fair market value only. As a consequence, the other classes of taxpayers are bearing more of the tax burden.
24
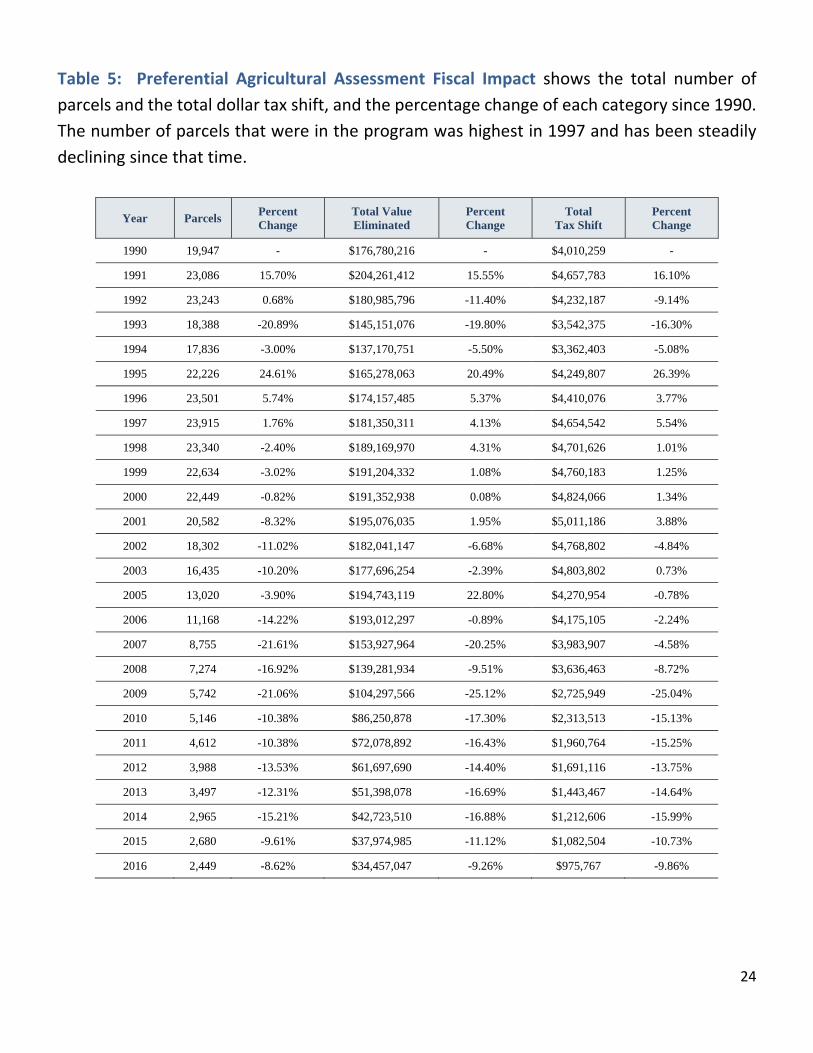
Table 5: Preferential Agricultural Assessment Fiscal Impact shows the total number of
parcels and the total dollar tax shift, and the percentage change of each category since 1990.
The number of parcels that were in the program was highest in 1997 and has been steadily
declining since that time.
Year Parcels Percent Change
Total Value Eliminated
Percent Change
Total Tax Shift
Percent Change
1990 19,947 - $176,780,216 - $4,010,259 -
1991 23,086 15.70% $204,261,412 15.55% $4,657,783 16.10%
1992 23,243 0.68% $180,985,796 -11.40% $4,232,187 -9.14%
1993 18,388 -20.89% $145,151,076 -19.80% $3,542,375 -16.30%
1994 17,836 -3.00% $137,170,751 -5.50% $3,362,403 -5.08%
1995 22,226 24.61% $165,278,063 20.49% $4,249,807 26.39%
1996 23,501 5.74% $174,157,485 5.37% $4,410,076 3.77%
1997 23,915 1.76% $181,350,311 4.13% $4,654,542 5.54%
1998 23,340 -2.40% $189,169,970 4.31% $4,701,626 1.01%
1999 22,634 -3.02% $191,204,332 1.08% $4,760,183 1.25%
2000 22,449 -0.82% $191,352,938 0.08% $4,824,066 1.34%
2001 20,582 -8.32% $195,076,035 1.95% $5,011,186 3.88%
2002 18,302 -11.02% $182,041,147 -6.68% $4,768,802 -4.84%
2003 16,435 -10.20% $177,696,254 -2.39% $4,803,802 0.73%
2005 13,020 -3.90% $194,743,119 22.80% $4,270,954 -0.78%
2006 11,168 -14.22% $193,012,297 -0.89% $4,175,105 -2.24%
2007 8,755 -21.61% $153,927,964 -20.25% $3,983,907 -4.58%
2008 7,274 -16.92% $139,281,934 -9.51% $3,636,463 -8.72%
2009 5,742 -21.06% $104,297,566 -25.12% $2,725,949 -25.04%
2010 5,146 -10.38% $86,250,878 -17.30% $2,313,513 -15.13%
2011 4,612 -10.38% $72,078,892 -16.43% $1,960,764 -15.25%
2012 3,988 -13.53% $61,697,690 -14.40% $1,691,116 -13.75%
2013 3,497 -12.31% $51,398,078 -16.69% $1,443,467 -14.64%
2014 2,965 -15.21% $42,723,510 -16.88% $1,212,606 -15.99%
2015 2,680 -9.61% $37,974,985 -11.12% $1,082,504 -10.73%
2016 2,449 -8.62% $34,457,047 -9.26% $975,767 -9.86%

25
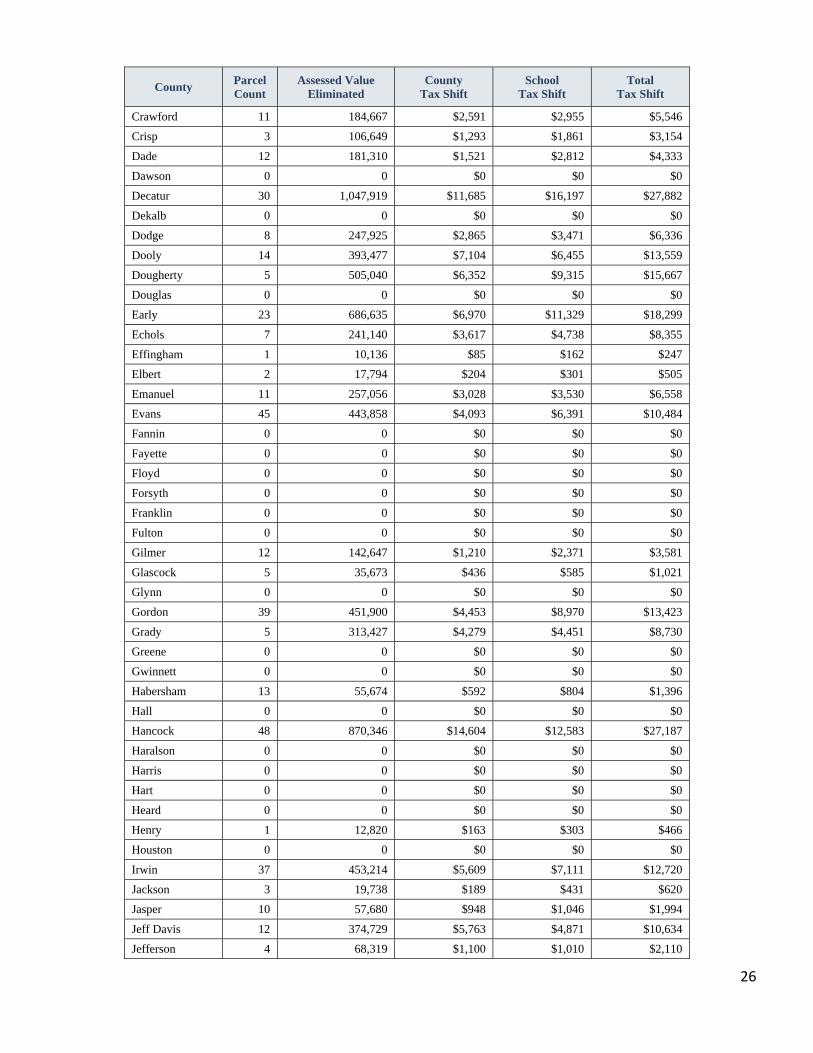
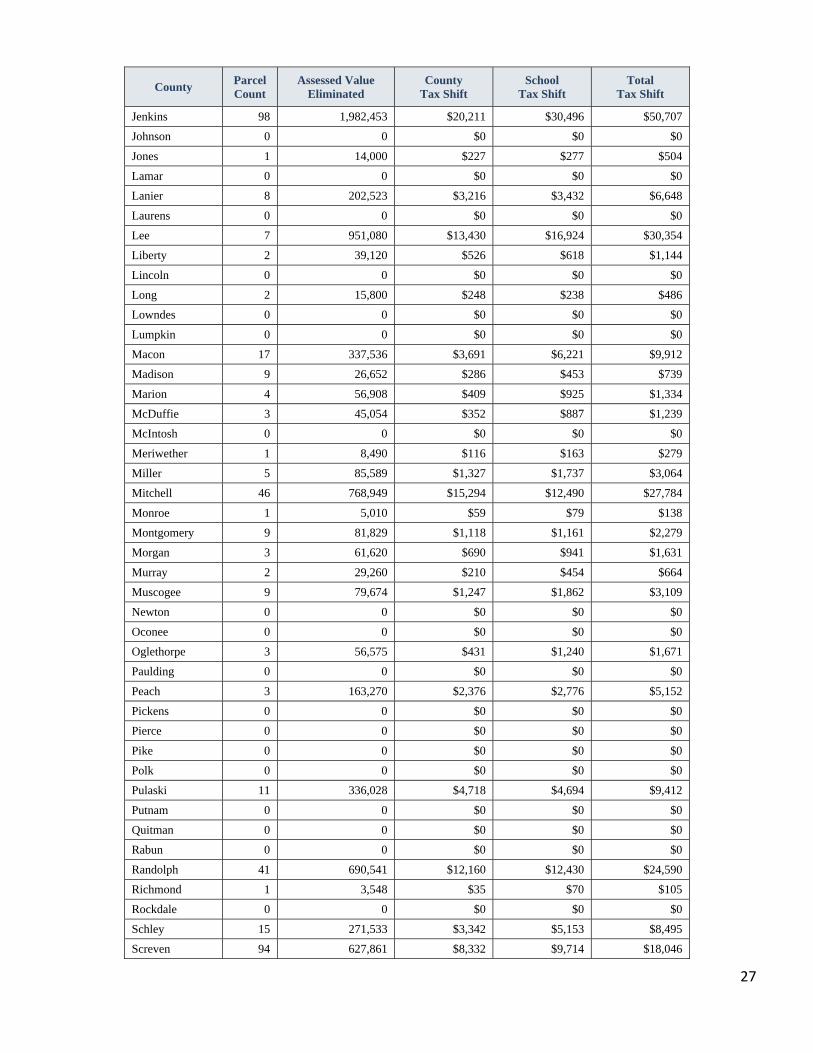
Table 6: Preferential Agricultural Assessment for 2016 illustrates a county‐by‐county
breakdown of the preferential agricultural assessment local impact.
County Parcel Count
Assessed Value Eliminated
County Tax Shift
School Tax Shift
Total Tax Shift
Appling 803 4,729,230 $60,397 $69,061 $129,458
Atkinson 49 1,063,096 $18,457 $15,746 $34,203
Bacon 66 843,197 $11,573 $12,648 $24,221
Baker 111 2,729,620 $27,315 $40,491 $67,806
Baldwin 0 0 $0 $0 $0
Banks 5 63,363 $606 $987 $1,593
Barrow 0 0 $0 $0 $0
Bartow 20 207,090 $1,881 $3,976 $5,857
Ben Hill 0 0 $0 $0 $0
Berrien 2 80,964 $1,353 $1,141 $2,494
Bibb 2 12,444 $182 $248 $430
Bleckley 0 0 $0 $0 $0
Brantley 0 0 $0 $0 $0
Brooks 18 933,688 $12,637 $14,071 $26,708
Bryan 5 77,840 $712 $1,206 $1,918
Bulloch 4 177,679 $2,193 $1,822 $4,015
Burke 22 456,249 $2,779 $6,264 $9,043
Butts 6 461,757 $5,868 $8,341 $14,209
Calhoun 23 497,174 $6,988 $8,789 $15,777
Camden 5 121,837 $1,698 $1,949 $3,647
Candler 2 31,188 $377 $408 $785
Carroll 16 324,649 $2,710 $5,844 $8,554
Catoosa 0 0 $0 $0 $0
Charlton 0 0 $0 $0 $0
Chatham 0 0 $0 $0 $0
Chattahoochee 2 29,094 $251 $495 $746
Chattooga 3 59,172 $698 $816 $1,514
Cherokee 0 0 $0 $0 $0
Clarke 0 0 $0 $0 $0
Clay 1 44,530 $763 $587 $1,350
Clayton 0 0 $0 $0 $0
Clinch 0 0 $0 $0 $0
Cobb 0 0 $0 $0 $0
Coffee 48 1,123,869 $8,758 $18,103 $26,861
Colquitt 3 44,242 $636 $455 $1,091
Columbia 0 0 $0 $0 $0
Cook 23 235,517 $2,803 $4,019 $6,822
Coweta 0 0 $0 $0 $0
26
County Parcel Count
Assessed Value Eliminated
County Tax Shift
School Tax Shift
Total Tax Shift
Crawford 11 184,667 $2,591 $2,955 $5,546
Crisp 3 106,649 $1,293 $1,861 $3,154
Dade 12 181,310 $1,521 $2,812 $4,333
Dawson 0 0 $0 $0 $0
Decatur 30 1,047,919 $11,685 $16,197 $27,882
Dekalb 0 0 $0 $0 $0
Dodge 8 247,925 $2,865 $3,471 $6,336
Dooly 14 393,477 $7,104 $6,455 $13,559
Dougherty 5 505,040 $6,352 $9,315 $15,667
Douglas 0 0 $0 $0 $0
Early 23 686,635 $6,970 $11,329 $18,299
Echols 7 241,140 $3,617 $4,738 $8,355
Effingham 1 10,136 $85 $162 $247
Elbert 2 17,794 $204 $301 $505
Emanuel 11 257,056 $3,028 $3,530 $6,558
Evans 45 443,858 $4,093 $6,391 $10,484
Fannin 0 0 $0 $0 $0
Fayette 0 0 $0 $0 $0
Floyd 0 0 $0 $0 $0
Forsyth 0 0 $0 $0 $0
Franklin 0 0 $0 $0 $0
Fulton 0 0 $0 $0 $0
Gilmer 12 142,647 $1,210 $2,371 $3,581
Glascock 5 35,673 $436 $585 $1,021
Glynn 0 0 $0 $0 $0
Gordon 39 451,900 $4,453 $8,970 $13,423
Grady 5 313,427 $4,279 $4,451 $8,730
Greene 0 0 $0 $0 $0
Gwinnett 0 0 $0 $0 $0
Habersham 13 55,674 $592 $804 $1,396
Hall 0 0 $0 $0 $0
Hancock 48 870,346 $14,604 $12,583 $27,187
Haralson 0 0 $0 $0 $0
Harris 0 0 $0 $0 $0
Hart 0 0 $0 $0 $0
Heard 0 0 $0 $0 $0
Henry 1 12,820 $163 $303 $466
Houston 0 0 $0 $0 $0
Irwin 37 453,214 $5,609 $7,111 $12,720
Jackson 3 19,738 $189 $431 $620
Jasper 10 57,680 $948 $1,046 $1,994
Jeff Davis 12 374,729 $5,763 $4,871 $10,634
Jefferson 4 68,319 $1,100 $1,010 $2,110
27
County Parcel Count
Assessed Value Eliminated
County Tax Shift
School Tax Shift
Total Tax Shift
Jenkins 98 1,982,453 $20,211 $30,496 $50,707
Johnson 0 0 $0 $0 $0
Jones 1 14,000 $227 $277 $504
Lamar 0 0 $0 $0 $0
Lanier 8 202,523 $3,216 $3,432 $6,648
Laurens 0 0 $0 $0 $0
Lee 7 951,080 $13,430 $16,924 $30,354
Liberty 2 39,120 $526 $618 $1,144
Lincoln 0 0 $0 $0 $0
Long 2 15,800 $248 $238 $486
Lowndes 0 0 $0 $0 $0
Lumpkin 0 0 $0 $0 $0
Macon 17 337,536 $3,691 $6,221 $9,912
Madison 9 26,652 $286 $453 $739
Marion 4 56,908 $409 $925 $1,334
McDuffie 3 45,054 $352 $887 $1,239
McIntosh 0 0 $0 $0 $0
Meriwether 1 8,490 $116 $163 $279
Miller 5 85,589 $1,327 $1,737 $3,064
Mitchell 46 768,949 $15,294 $12,490 $27,784
Monroe 1 5,010 $59 $79 $138
Montgomery 9 81,829 $1,118 $1,161 $2,279
Morgan 3 61,620 $690 $941 $1,631
Murray 2 29,260 $210 $454 $664
Muscogee 9 79,674 $1,247 $1,862 $3,109
Newton 0 0 $0 $0 $0
Oconee 0 0 $0 $0 $0
Oglethorpe 3 56,575 $431 $1,240 $1,671
Paulding 0 0 $0 $0 $0
Peach 3 163,270 $2,376 $2,776 $5,152
Pickens 0 0 $0 $0 $0
Pierce 0 0 $0 $0 $0
Pike 0 0 $0 $0 $0
Polk 0 0 $0 $0 $0
Pulaski 11 336,028 $4,718 $4,694 $9,412
Putnam 0 0 $0 $0 $0
Quitman 0 0 $0 $0 $0
Rabun 0 0 $0 $0 $0
Randolph 41 690,541 $12,160 $12,430 $24,590
Richmond 1 3,548 $35 $70 $105
Rockdale 0 0 $0 $0 $0
Schley 15 271,533 $3,342 $5,153 $8,495
Screven 94 627,861 $8,332 $9,714 $18,046

28
County Parcel Count
Assessed Value Eliminated
County Tax Shift
School Tax Shift
Total Tax Shift
Seminole 20 961,040 $13,208 $15,390 $28,598
Spalding 0 0 $0 $0 $0
Stephens 0 0 $0 $0 $0
Stewart 24 293,550 $3,409 $4,414 $7,823
Sumter 38 469,800 $6,213 $8,575 $14,788
Talbot 3 42,655 $683 $602 $1,285
Taliaferro 3 32,330 $666 $582 $1,248
Tattnall 37 374,891 $5,570 $5,066 $10,636
Taylor 5 76,835 $625 $1,216 $1,841
Telfair 24 155,455 $2,544 $2,408 $4,952
Terrell 30 501,694 $6,773 $8,270 $15,043
Thomas 4 241,547 $1,895 $3,508 $5,403
Tift 0 0 $0 $0 $0
Toombs 49 556,363 $4,868 $7,679 $12,547
Towns 0 0 $0 $0 $0
Treutlen 1 12,160 $158 $158 $316
Troup 0 0 $0 $0 $0
Turner 6 55,501 $889 $888 $1,777
Twiggs 0 0 $0 $0 $0
Union 0 0 $0 $0 $0
Upson 0 0 $0 $0 $0
Walker 8 211,945 $1,661 $3,525 $5,186
Walton 3 46,892 $556 $1,036 $1,592
Ware 125 481,894 $7,555 $8,157 $15,712
Warren 1 9,440 $122 $183 $305
Washington 6 73,613 $714 $1,262 $1,976
Wayne 15 248,590 $2,964 $4,475 $7,439
Webster 1 17,790 $160 $311 $471
Wheeler 0 0 $0 $0 $0
White 2 32,329 $323 $581 $904
Whitfield 0 0 $0 $0 $0
Wilcox 15 291,930 $5,328 $4,411 $9,739
Wilkes 22 308,231 $3,754 $5,163 $8,917
Wilkinson 1 14,168 $176 $278 $454
Worth 11 478,239 $6,007 $7,413 $13,420
Total 2,449 34,457,047 $433,261 $542,506 $975,767

29
Figure 17: Preferential Agricultural Total Tax Dollar below illustrates the amount of revenue shift and value removed as a result of the Preferential Agricultural Assessment program for the last 10 years.
Figure 18: Preferential Agricultural Assessed Value Eliminated below illustrates the amount of revenue shift and value removed as a result of the Preferential Agricultural Assessment program for the last 10 years.
$4.0
$3.6
$2.7
$2.3
$2.0
$1.7
$1.4
$1.2
$1.1
$1.0
$0.0
$1.0
$2.0
$3.0
$4.0
$5.0
2007 2008 2009 2010 2011 2012 2013 2014 2015 2016
Mil
lio
ns
$153.9
$139.3 $104.3
$86.3
$72.1
$61.7
$51.4
$42.7
$38.0 $34.5
$-
$50.0
$100.0
$150.0
$200.0
2007 2008 2009 2010 2011 2012 2013 2014 2015 2016
Mil
lio
ns

30
Conservation Use Valuation
In 1991 the Legislature embraced the “current use” valuation concept by providing for the assessment of
certain qualifying properties based on current use value rather than fair market value. The legislation also
provided for the Commissioner to annually develop a table of current use values to be used in all counties.
The table of current use values is based upon a specific formula which takes into account the amount of
income the land is capable of producing when growing certain crops and timber and factors found in market
data using only farmer‐to‐farmer land sales. The data is grouped into nine agricultural districts in Georgia.
Unlike the Preferential Agricultural Assessment Program in which assessments are based on 30% of fair
market value rather than 40%, the valuation of property in Conservation Use Covenants is most significant in
the urban areas of north Georgia and other parts of the State where strong residential and commercial
development is occurring. As a result, agricultural landowners’ tax savings are generally greatest in these
transitional areas.
The effect of this special assessment program is a tax shift8 from those taxpayers taking advantage of this
special assessment program to those taxpayers who cannot qualify for special treatment, just as any
exemption for one class of taxpayers shifts the tax burden to other classes of taxpayers. Several reports,
graphs, and charts are being included in this report to show the fiscal impact of Conservation Use Valuation.
8 TaxShift - Providing property tax relief to a particular class of taxpayers through valuation reductions or exemptions, resulting in a higher tax
burden for other classes of taxpayers. For example, agricultural property owners qualifying for Conservation Use Assessment are afforded an exemption equal to the difference between fair market value and current use value, while the property of residential, commercial, industrial, and other classes of taxpayers is assessed at fair market value only. As a consequence, the other classes of taxpayers are bearing more of the tax burden.

31
Table 7: Conservation Use Fiscal Impact below represents the 10 counties, ranked by total tax shift,
most affected by Conservation Use Assessment. The table lists, by county, the number of applications (parcel
count), and assessed value eliminated from the digest, amount of tax shift for each of the tax types, and the
total tax shift.
County Real
Parcel Assessed Value
Eliminated County
Tax Shift School
Tax Shift Total
Tax Shift
Hall 2,260 276,258,190 $1,579,092 $5,111,049 $6,690,141
Cherokee 1,926 240,152,240 1,364,065 4,670,961 6,035,026
Meriwether 2,561 165,526,120 $2,262,577 $3,187,205 $5,449,782
Worth 2,076 183,161,408 $2,300,507 $2,839,002 $5,139,509
Lumpkin 1,571 161,648,538 $1,970,106 $2,718,767 $4,688,873
Brooks 1,841 148,314,327 $2,008,758 $2,235,097 $4,243,855
Jackson 2,742 150,131,418 $1,459,037 $2,771,626 $4,230,663
Oconee 2,032 170,059,254 $1,142,626 $2,891,007 $4,033,633
Mitchell 1,878 102,503,868 $2,038,802 $1,686,674 $3,725,476
Gordon 2,400 124,872,988 $1,230,374 $2,459,473 $3,689,847

32
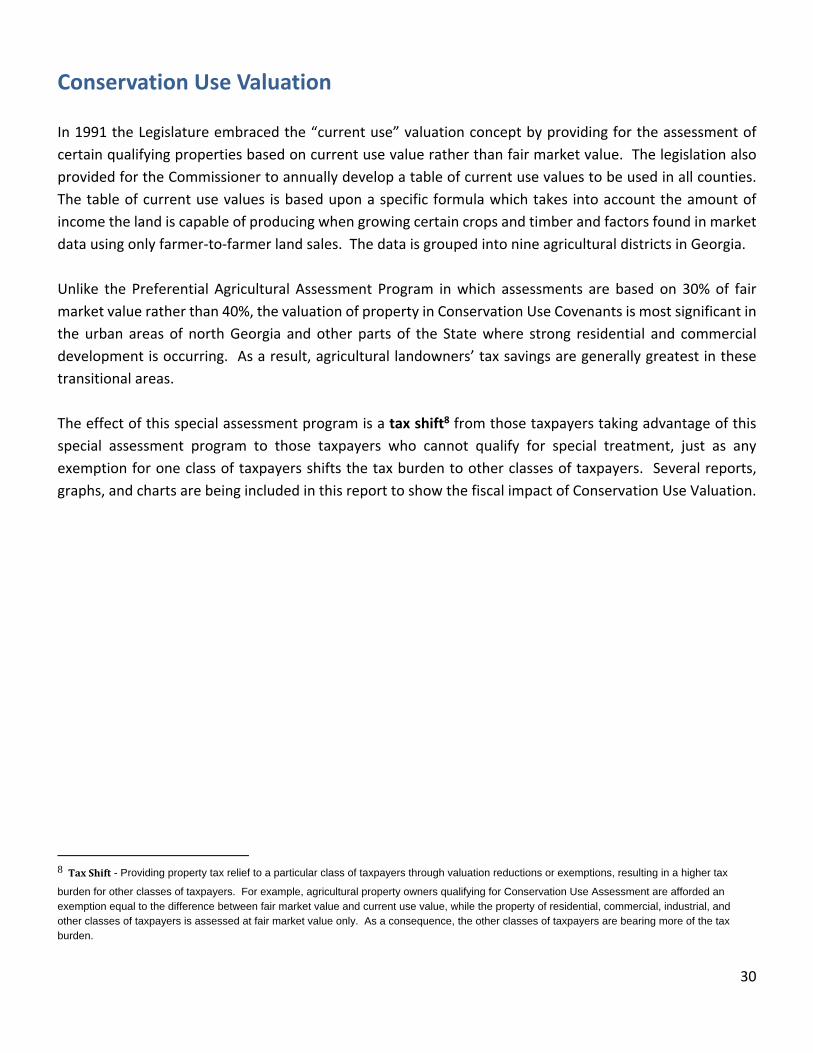
Table 8: Conservation Use Valuation Assessment for Tax Year 2016 lists each county and the
number of parcels receiving Conservation Use Assessment, the amount of value eliminated from the taxable
digest in each county, the tax dollar shift for State, County, School, and the total tax dollar shift.
County Real
Parcel Assessed Value
Eliminated County
Tax Shift School
Tax Shift Total
Tax Shift
Appling 110 1,935,090 $24,713 $28,258 $52,971
Atkinson 949 12,972,042 $225,208 $192,129 $417,337
Bacon 959 32,714,926 $449,045 $490,724 $939,769
Baker 294 14,154,601 $141,815 $209,969 $351,784
Baldwin 890 37,242,182 $366,835 $635,352 $1,002,187
Banks 1,856 68,995,646 $660,012 $1,074,262 $1,734,274
Barrow 1,385 88,709,766 $841,683 $1,641,131 $2,482,814
Bartow 1,237 66,959,121 $608,897 $1,257,153 $1,866,050
Ben Hill 649 24,625,371 $373,444 $445,153 $818,597
Berrien 1,876 63,803,405 $1,066,155 $899,500 $1,965,655
Bibb 516 20,316,342 $297,675 $405,209 $702,884
Bleckley 830 35,544,407 $535,448 $510,027 $1,045,475
Brantley 1,019 21,670,149 $322,025 $369,043 $691,068
Brooks 1,841 148,314,327 $2,008,758 $2,235,097 $4,243,855
Bryan 323 12,896,453 $117,383 $199,766 $317,149
Bulloch 2,795 75,750,831 $920,728 $776,749 $1,697,477
Burke 1,746 90,105,068 $549,115 $1,237,143 $1,786,258
Butts 1,183 73,041,303 $928,282 $1,319,418 $2,247,700
Calhoun 551 31,273,554 $440,249 $552,854 $993,103
Camden 951 29,397,244 $409,798 $470,356 $880,154
Candler 1,075 36,713,355 $443,022 $480,064 $923,086
Carroll 2,546 76,989,308 $642,309 $1,379,499 $2,021,808
Catoosa 589 33,807,219 $246,624 $631,925 $878,549
Charlton 798 14,617,477 $277,294 $255,075 $532,369
Chatham 172 13,908,560 $160,547 $231,313 $391,860
Chattahoochee 92 2,191,613 $18,922 $37,303 $56,225
Chattooga 1,399 39,010,717 $461,340 $534,414 $995,754
Cherokee 1,926 240,152,240 $1,364,065 $4,670,961 $6,035,026
Clarke 391 27,953,987 $389,958 $559,080 $949,038
Clay 506 15,759,919 $270,188 $207,731 $477,919
Clayton 212 14,756,663 $244,902 $281,778 $526,680
Clinch 430 15,876,443 $173,895 $292,127 $466,022
Cobb 557 60,573,772 $417,353 $1,111,171 $1,528,524
Coffee 2,425 131,767,908 $1,026,867 $2,122,517 $3,149,384
Colquitt 2,690 128,076,002 $1,843,288 $1,316,749 $3,160,037
Columbia 4,969 76,730,124 $503,043 $1,404,161 $1,907,204
Cook 1,239 63,426,674 $754,777 $1,082,376 $1,837,153

33
County Real
Parcel Assessed Value
Eliminated County
Tax Shift School
Tax Shift Total
Tax Shift
Coweta 2,117 125,783,527 $791,169 $2,338,316 $3,129,485
Crawford 984 22,417,387 $314,658 $358,678 $673,336
Crisp 971 41,163,076 $498,896 $718,296 $1,217,192
Dade 586 23,275,559 $195,559 $360,981 $556,540
Dawson 994 110,998,640 $903,307 $1,751,337 $2,654,644
Decatur 1,721 134,633,415 $1,506,335 $2,080,894 $3,587,229
Dekalb 14 446,500 $4,461 $10,439 $14,900
Dodge 1,787 39,097,512 $451,811 $547,365 $999,176
Dooly 1,561 85,029,654 $1,535,210 $1,394,826 $2,930,036
Dougherty 255 23,147,561 $291,127 $426,957 $718,084
Douglas 345 23,338,399 $262,954 $490,106 $753,060
Early 1,669 83,325,898 $845,758 $1,374,877 $2,220,635
Echols 327 10,147,637 $152,215 $199,371 $351,586
Effingham 2,084 78,227,347 $652,181 $1,250,934 $1,903,115
Elbert 1,651 51,209,692 $586,556 $865,290 $1,451,846
Emanuel 2,245 58,987,074 $694,809 $810,128 $1,504,937
Evans 361 11,579,073 $106,228 $166,727 $272,955
Fannin 1,789 107,701,940 $495,860 $1,333,350 $1,829,210
Fayette 593 34,989,573 $172,044 $738,280 $910,324
Floyd 2,403 67,302,386 $646,103 $1,244,994 $1,891,097
Forsyth 723 133,033,510 $806,316 $2,623,155 $3,429,471
Franklin 2,584 107,708,206 $1,166,984 $1,951,457 $3,118,441
Fulton 598 65,099,450 $696,564 $1,173,214 $1,869,778
Gilmer 2,129 116,231,055 $985,988 $1,931,760 $2,917,748
Glascock 584 13,892,384 $170,043 $227,696 $397,739
Glynn 209 19,001,179 $109,536 $311,964 $421,500
Gordon 2,400 124,872,988 $1,230,374 $2,459,473 $3,689,847
Grady 2,226 103,287,250 $1,410,181 $1,466,679 $2,876,860
Greene 1,324 73,729,372 $400,945 $985,614 $1,386,559
Gwinnett 788 112,688,160 $796,255 $2,443,920 $3,240,175
Habersham 1,870 130,026,100 $1,381,657 $1,878,877 $3,260,534
Hall 2,260 276,258,190 $1,579,092 $5,111,049 $6,690,141
Hancock 1,435 60,622,556 $1,017,246 $876,420 $1,893,666
Haralson 1,382 48,228,787 $599,002 $803,625 $1,402,627
Harris 1,858 136,572,036 $838,552 $2,534,777 $3,373,329
Hart 1,872 72,831,509 $458,839 $998,738 $1,457,577
Heard 1,432 35,209,093 $244,351 $550,776 $795,127
Henry 1,537 80,470,385 $1,017,357 $1,901,354 $2,918,711
Houston 831 70,720,981 $703,674 $943,418 $1,647,092
Irwin 1,628 67,996,140 $841,520 $1,066,859 $1,908,379
Jackson 2,742 150,131,418 $1,459,037 $2,771,626 $4,230,663
Jasper 1,622 93,216,441 $1,533,038 $1,690,946 $3,223,984
Jeff Davis 1,035 26,095,128 $401,343 $339,237 $740,580

34
County Real
Parcel Assessed Value
Eliminated County
Tax Shift School
Tax Shift Total
Tax Shift
Jefferson 1,751 72,090,153 $1,160,796 $1,065,492 $2,226,288
Jenkins 882 45,306,251 $461,897 $696,946 $1,158,843
Johnson 1,376 19,871,542 $305,008 $294,814 $599,822
Jones 1,274 85,058,619 $1,378,005 $1,683,140 $3,061,145
Lamar 1,050 53,402,416 $619,041 $999,480 $1,618,521
Lanier 662 29,756,554 $472,534 $504,195 $976,729
Laurens 2,609 62,605,457 $450,196 $918,919 $1,369,115
Lee 600 66,011,213 $932,144 $1,174,670 $2,106,814
Liberty 197 7,555,799 $101,566 $119,299 $220,865
Lincoln 980 28,230,078 $287,608 $563,952 $851,560
Long 577 23,262,678 $365,108 $350,871 $715,979
Lowndes 1,321 76,814,169 $676,731 $1,292,559 $1,969,290
Lumpkin 1,571 161,648,538 $1,970,106 $2,718,767 $4,688,873
Macon 1,337 53,267,151 $580,789 $981,767 $1,562,556
Madison 2,358 97,243,000 $1,043,785 $1,652,159 $2,695,944
Marion 932 38,428,113 $276,680 $624,687 $901,367
McDuffie 1,007 58,724,003 $458,453 $1,156,276 $1,614,729
McIntosh 206 7,864,823 $77,791 $123,344 $201,135
Meriwether 2,561 165,526,120 $2,262,577 $3,187,205 $5,449,782
Miller 867 41,331,610 $640,640 $838,742 $1,479,382
Mitchell 1,878 102,503,868 $2,038,802 $1,686,674 $3,725,476
Monroe 1,527 91,282,782 $1,079,967 $1,442,268 $2,522,235
Montgomery 1,101 21,079,174 $287,836 $298,772 $586,608
Morgan 1,700 108,072,274 $1,209,761 $1,649,615 $2,859,376
Murray 931 44,743,605 $321,928 $693,526 $1,015,454
Muscogee 122 12,269,754 $155,943 $286,744 $442,687
Newton 1,011 59,723,161 $775,804 $1,194,463 $1,970,267
Oconee 2,032 170,059,254 $1,142,626 $2,891,007 $4,033,633
Oglethorpe 1,944 48,667,676 $371,108 $1,066,406 $1,437,514
Paulding 1,569 105,900,857 $874,529 $1,999,302 $2,873,831
Peach 634 50,041,551 $728,355 $850,706 $1,579,061
Pickens 662 50,693,154 $403,011 $810,077 $1,213,088
Pierce 1,479 55,024,445 $581,751 $918,908 $1,500,659
Pike 1,673 73,483,611 $1,025,537 $1,311,315 $2,336,852
Polk 1,188 42,202,485 $466,802 $681,612 $1,148,414
Pulaski 644 13,831,718 $194,197 $193,215 $387,412
Putnam 727 52,639,801 $438,346 $751,960 $1,190,306
Quitman 287 10,277,034 $163,343 $164,885 $328,228
Rabun 733 62,463,446 $570,916 $606,645 $1,177,561
Randolph 1,144 49,385,239 $868,392 $888,934 $1,757,326
Richmond 214 9,869,351 $96,660 $194,959 $291,619
Rockdale 379 12,037,029 $243,028 $304,778 $547,806
Schley 561 26,598,865 $327,352 $504,820 $832,172
35
County Real
Parcel Assessed Value
Eliminated County
Tax Shift School
Tax Shift Total
Tax Shift
Screven 1,730 64,358,050 $854,096 $995,683 $1,849,779
Seminole 866 79,214,787 $1,088,649 $1,268,546 $2,357,195
Spalding 806 44,952,212 $703,952 $834,763 $1,538,715
Stephens 686 21,677,692 $290,698 $396,702 $687,400
Stewart 335 10,699,752 $124,256 $160,871 $285,127
Sumter 1,264 62,741,463 $829,755 $1,145,220 $1,974,975
Talbot 1,476 37,432,973 $599,077 $528,142 $1,127,219
Taliaferro 668 15,534,601 $320,381 $279,530 $599,911
Tattnall 1,784 50,451,570 $749,609 $681,803 $1,431,412
Taylor 1,358 34,513,321 $280,792 $546,346 $827,138
Telfair 1,274 31,671,500 $518,304 $490,687 $1,008,991
Terrell 1,059 41,785,511 $564,104 $688,792 $1,252,896
Thomas 1,369 160,755,664 $1,262,785 $2,333,248 $3,596,033
Tift 1,088 62,738,900 $764,348 $1,127,042 $1,891,390
Toombs 911 26,850,189 $234,885 $369,634 $604,519
Towns 527 23,176,471 $124,574 $184,415 $308,989
Treutlen 634 11,387,042 $147,576 $148,032 $295,608
Troup 1,500 91,867,197 $999,240 $1,731,697 $2,730,937
Turner 1,384 51,266,405 $821,237 $820,262 $1,641,499
Twiggs 1,083 35,160,862 $583,670 $583,670 $1,167,340
Union 1,328 110,292,138 $638,371 $1,300,013 $1,938,384
Upson 1,454 42,022,011 $410,555 $647,979 $1,058,534
Walker 1,310 49,246,516 $386,625 $818,753 $1,205,378
Walton 1,250 76,118,448 $900,929 $1,640,218 $2,541,147
Ware 921 28,746,534 $450,659 $486,564 $937,223
Warren 754 24,488,636 $317,324 $475,080 $792,404
Washington 1,560 43,870,210 $425,453 $751,848 $1,177,301
Wayne 1,795 76,090,221 $907,224 $1,369,624 $2,276,848
Webster 520 25,666,236 $230,996 $448,312 $679,308
Wheeler 1,066 27,789,203 $469,995 $436,735 $906,730
White 1,492 97,514,188 $973,192 $1,753,500 $2,726,692
Whitfield 800 33,984,264 $324,924 $628,711 $953,635
Wilcox 1,430 22,316,782 $407,281 $337,207 $744,488
Wilkes 1,788 62,783,449 $764,414 $1,051,623 $1,816,037
Wilkinson 1,069 37,442,866 $465,789 $735,453 $1,201,242
Worth 2,076 183,161,408 $2,300,507 $2,839,002 $5,139,509
Total 194,175 9,560,075,670 $102,604,467 $160,426,899 $263,031,366

36
Figures 19: Conservation Use Revenue Shift illustrates the amount of revenue shift and the amount
of value removed annually from digests affected by the Conservation Use Valuation program since 2007.
Figures 20: Conservation Use Assessed Value Eliminated below illustrates the amount of revenue
shift and the ever increasing amount of value removed annually from digests affected by the Conservation
Use Valuation program since 2007.
$228.6
$267.4
$292.1
$295.1
$283.2
$269.2
$261.3
$261.5
$265.5
$263.0
150.0
200.0
250.0
300.0
350.0
2007 2008 2009 2010 2011 2012 2013 2014 2015 2016
Mil
lio
ns
9.2
10.8
11.6
11.5
10.8
10.1
9.6
9.5
9.6
9.6
$6.0
$8.0
$10.0
$12.0
$14.0
2007 2008 2009 2010 2011 2012 2013 2014 2015 2016
Bil
lio
ns


37
Forest Land Conservation Use The Georgia Forest Land Protection Act of 2008 provides for current use valuation of property primarily used
for the good faith subsistence or commercial production of trees, timber, or other wood and wood fiber
products.
The assessment of qualifying properties is based on current use value rather than fair market value. The bill
also provided for the Commissioner to annually develop a table of current use values to be used in all
counties. It is based upon a legislated formula which takes into account the amount of income the land is
capable of producing when growing timber and factors found in market data using comparable sales with
and for the same existing use.
This 15‐year covenant agreement between the taxpayer and the local board of assessors is limited to forest
land tracts consisting of more than 200 contiguous acres when owned by an individual or individuals or by
any entity registered to do business in Georgia. For tax year 2016 a covenant breach is subject to a penalty
in an amount equal to two times the tax savings.
The effect of any special assessment program is a tax shift9 from those taxpayers taking advantage of this
special assessment program to those taxpayers who cannot qualify for special treatment, just as any
exemption for one class of taxpayers shifts the tax burden to other classes of taxpayers. To lessen the fiscal
impact on local taxing jurisdictions there is a grant component associated with this program. A grant is paid
to the taxing authorities to reimburse up to one‐half of the first 3% of revenue loss and 100% of the revenue
loss over 3% as a result of taxpayers enrolling property in this program. Several reports, graphs, and charts
show the fiscal impact of Forest Land Conservation Use Valuation.
9 TaxShift- Providing property tax relief to a particular class of taxpayers through valuation reductions or exemptions, resulting in a higher tax burden
for other classes of taxpayers. For example, agricultural property owners qualifying for Conservation Use Assessment are afforded an exemption equal to the difference between 7 market value and current use value, while the property of residential, commercial, industrial, and other classes of taxpayers is assessed at fair market value only. As a consequence, the other classes of taxpayers are bearing more of the tax burden.

38
Table 9: Forest Land Conservation Use Fiscal Impact below represents the 10 counties, ranked by
total net tax shift, most affected by Forest land Conservation Use Assessment. The table lists, by county, the
number of applications (parcel count), assessed value eliminated from the digest, amount of net tax shift for
each of the tax types, and the total tax shift.
County County
Tax Shift
FLPA Grant
County
Net County
Shift
School Tax Shift
FLPA Grant School
Net School
Tax Shift
Total Tax Shift
Total FLPA Grant
Net Tax Shift
WORTH $463,769 $78,186 $385,583 $572,326 $96,488 $475,838 $1,036,095 $174,674 $861,421
WARE $354,022 $0 $354,022 $382,227 $0 $382,227 $736,249 $0 $736,249
MERIWETHER $313,716 $144,140 $169,576 $441,919 $97,937 $343,982 $755,635 $242,077 $513,558
DOUGHERTY $331,985 $145,661 $186,324 $486,877 $213,621 $273,256 $818,862 $359,282 $459,580
LOWNDES $212,943 $78,215 $134,729 $397,408 $116,843 $280,565 $610,351 $195,058 $415,293
LEE $350,757 $189,175 $161,582 $442,017 $233,036 $208,981 $792,774 $422,211 $370,564
HANCOCK $293,041 $97,699 $195,342 $252,472 $85,123 $167,349 $545,513 $182,822 $362,691
WAYNE $654,791 $527,280 $127,510 $988,529 $819,167 $169,362 $1,643,320 $1,346,447 $296,873
TWIGGS $166,986 $19,866 $147,120 $166,986 $19,866 $147,120 $333,972 $39,731 $294,240
MCINTOSH $100,340 $4,666 $95,674 $159,097 $7,398 $151,699 $259,437 $12,064 $247,373
39
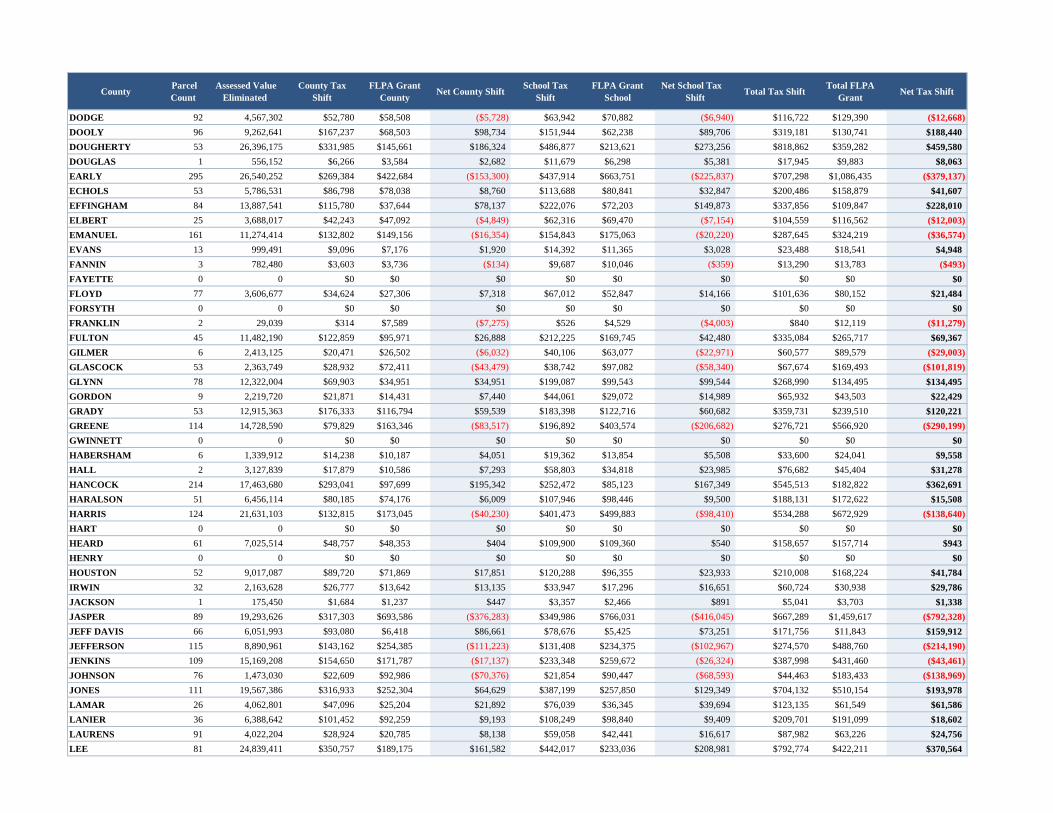
Table 10: Forest Land Conservation Use Valuation Assessment for Tax Year 2016 lists each
county and the number of parcels receiving Forest Land Conservation Use Assessment, the amount of value
eliminated from the taxable digest in each county, the gross tax dollar shift for State, County, and School, the
amount of the reimbursement grant paid to the County and School and the net tax shift for the taxing
jurisdictions after the application of the grant. This table does not include amounts paid to municipalities or
special taxing districts.

County Parcel Count
Assessed Value Eliminated
County Tax Shift
FLPA Grant County
Net County ShiftSchool Tax
ShiftFLPA Grant
SchoolNet School Tax
ShiftTotal Tax Shift
Total FLPA Grant
Net Tax Shift
APPLING 2 70,799 $904 $142 $763 $1,034 $162 $872 $1,938 $304 $1,635
ATKINSON 22 1,079,407 $18,740 $18,369 $370 $15,987 $15,671 $316 $34,727 $34,040 $686
BACON 44 2,081,905 $28,576 $2,927 $25,649 $31,229 $3,199 $28,031 $59,805 $6,125 $53,680
BAKER 54 23,867,661 $238,954 $239,411 ($457) $354,053 $353,723 $330 $593,007 $593,134 ($127)
BALDWIN 37 2,153,388 $21,211 $27,402 ($6,191) $36,737 $47,459 ($10,722) $57,948 $74,860 ($16,913)
BANKS 3 557,654 $5,335 $9,933 ($4,598) $8,683 $16,167 ($7,484) $14,018 $26,099 ($12,082)
BARROW 0 0 $0 $0 $0 $0 $0 $0 $0 $0 $0
BARTOW 4 622,034 $5,605 $0 $5,604 $11,943 $0 $11,943 $17,548 $0 $17,547
BEN HILL 84 7,084,362 $107,434 $38,690 $68,745 $128,064 $46,119 $81,945 $235,498 $84,808 $150,690
BERRIEN 55 9,408,183 $157,211 $83,003 $74,208 $132,637 $70,028 $62,609 $289,848 $153,031 $136,817
BIBB 20 1,744,528 $25,561 $2,343 $23,218 $34,795 $3,189 $31,606 $60,356 $5,532 $54,824
BLECKLEY 29 2,896,559 $43,637 $16,872 $26,765 $41,563 $16,070 $25,493 $85,200 $32,942 $52,257
BRANTLEY 97 8,830,818 $130,837 $158,886 ($28,049) $150,389 $139,831 $10,558 $281,226 $298,718 ($17,492)
BROOKS 138 46,495,072 $629,264 $913,943 ($284,678) $700,681 $1,018,521 ($317,840) $1,329,945 $1,932,464 ($602,519)
BRYAN 48 3,822,094 $34,735 $17,706 $17,029 $59,204 $37,324 $21,880 $93,939 $55,030 $38,909
BULLOCH 22 1,302,180 $16,069 $12,171 $3,898 $13,353 $9,670 $3,683 $29,422 $21,841 $7,581
BURKE 152 17,386,069 $105,916 $72,048 $33,868 $238,711 $162,379 $76,332 $344,627 $234,427 $110,200
BUTTS 27 7,023,571 $89,263 $44,631 $44,631 $126,874 $63,437 $63,437 $216,137 $108,068 $108,068
CALHOUN 76 17,190,474 $241,620 $360,187 ($118,567) $303,893 $454,546 ($150,653) $545,513 $814,733 ($269,220)
CAMDEN 93 9,394,194 $130,955 $73,333 $57,622 $150,307 $84,170 $66,137 $281,262 $157,502 $123,759
CANDLER 33 2,163,716 $26,144 $29,697 ($3,552) $28,293 $30,895 ($2,602) $54,437 $60,592 ($6,154)
CARROLL 9 1,374,675 $11,477 $3,245 $8,233 $24,746 $6,996 $17,750 $36,223 $10,240 $25,983
CATOOSA 0 0 $0 $0 $0 $0 $0 $0 $0 $0 $0
CHARLTON 48 6,683,209 $126,780 $219,323 ($92,542) $116,622 $201,749 ($85,127) $243,402 $421,071 ($177,669)
CHATHAM 20 4,615,240 $53,273 $57,375 ($4,102) $76,756 $82,665 ($5,909) $130,029 $140,040 ($10,011)
CHATTAHOOCHEE 10 792,806 $6,845 $3,900 $2,945 $13,494 $7,688 $5,806 $20,339 $11,588 $8,751
CHATTOOGA 29 3,197,489 $37,698 $40,052 ($2,353) $44,071 $93,644 ($49,573) $81,769 $133,696 ($51,926)
CHEROKEE 4 1,466,960 $8,332 $6,295 $2,037 $28,532 $21,557 $6,975 $36,864 $27,852 $9,012
CLARKE 0 0 $0 $0 $0 $0 $0 $0 $0 $0 $0
CLAY 42 2,007,202 $34,411 $56,316 ($21,904) $26,457 $45,354 ($18,897) $60,868 $101,670 ($40,802)
CLAYTON 0 0 $0 $0 $0 $0 $0 $0 $0 $0 $0
CLINCH 118 45,420,936 $497,496 $757,495 ($259,999) $835,745 $1,272,895 ($437,150) $1,333,241 $2,030,389 ($697,149)
COBB 0 0 $0 $0 $0 $0 $0 $0 $0 $0 $0
COFFEE 34 6,919,091 $53,920 $39,232 $14,689 $111,453 $81,091 $30,362 $165,373 $120,323 $45,050
COLQUITT 56 7,344,758 $105,522 $72,410 $33,112 $75,511 $51,816 $23,695 $181,033 $124,226 $56,807
COLUMBIA 493 15,795,611 $103,556 $62,005 $41,551 $289,060 $178,719 $110,341 $392,616 $240,724 $151,893
COOK 25 3,775,638 $44,930 $21,300 $23,630 $64,431 $28,756 $35,675 $109,361 $50,056 $59,305
COWETA 30 1,273,684 $8,008 $10,137 ($2,129) $23,678 $29,978 ($6,300) $31,686 $40,116 ($8,430)
CRAWFORD 119 4,359,753 $61,167 $101,483 ($40,316) $69,756 $115,218 ($45,462) $130,923 $216,701 ($85,778)
CRISP 55 3,420,326 $41,454 $18,268 $23,186 $59,685 $26,302 $33,383 $101,139 $44,570 $56,569
DADE 0 0 $0 $0 $0 $0 $0 $0 $0 $0 $0
DAWSON 3 1,167,669 $9,502 $10,598 ($1,095) $18,423 $20,547 ($2,124) $27,925 $31,145 ($3,219)
DECATUR 187 29,650,883 $331,631 $624,709 ($293,078) $458,284 $791,226 ($332,942) $789,915 $1,415,935 ($626,020)
DEKALB 0 0 $0 $0 $0 $0 $0 $0 $0 $0 $0
County Parcel Count
Assessed Value Eliminated
County Tax Shift
FLPA Grant County
Net County ShiftSchool Tax
ShiftFLPA Grant
SchoolNet School Tax
ShiftTotal Tax Shift
Total FLPA Grant
Net Tax Shift
DODGE 92 4,567,302 $52,780 $58,508 ($5,728) $63,942 $70,882 ($6,940) $116,722 $129,390 ($12,668)
DOOLY 96 9,262,641 $167,237 $68,503 $98,734 $151,944 $62,238 $89,706 $319,181 $130,741 $188,440
DOUGHERTY 53 26,396,175 $331,985 $145,661 $186,324 $486,877 $213,621 $273,256 $818,862 $359,282 $459,580
DOUGLAS 1 556,152 $6,266 $3,584 $2,682 $11,679 $6,298 $5,381 $17,945 $9,883 $8,063
EARLY 295 26,540,252 $269,384 $422,684 ($153,300) $437,914 $663,751 ($225,837) $707,298 $1,086,435 ($379,137)
ECHOLS 53 5,786,531 $86,798 $78,038 $8,760 $113,688 $80,841 $32,847 $200,486 $158,879 $41,607
EFFINGHAM 84 13,887,541 $115,780 $37,644 $78,137 $222,076 $72,203 $149,873 $337,856 $109,847 $228,010
ELBERT 25 3,688,017 $42,243 $47,092 ($4,849) $62,316 $69,470 ($7,154) $104,559 $116,562 ($12,003)
EMANUEL 161 11,274,414 $132,802 $149,156 ($16,354) $154,843 $175,063 ($20,220) $287,645 $324,219 ($36,574)
EVANS 13 999,491 $9,096 $7,176 $1,920 $14,392 $11,365 $3,028 $23,488 $18,541 $4,948
FANNIN 3 782,480 $3,603 $3,736 ($134) $9,687 $10,046 ($359) $13,290 $13,783 ($493)
FAYETTE 0 0 $0 $0 $0 $0 $0 $0 $0 $0 $0
FLOYD 77 3,606,677 $34,624 $27,306 $7,318 $67,012 $52,847 $14,166 $101,636 $80,152 $21,484
FORSYTH 0 0 $0 $0 $0 $0 $0 $0 $0 $0 $0
FRANKLIN 2 29,039 $314 $7,589 ($7,275) $526 $4,529 ($4,003) $840 $12,119 ($11,279)
FULTON 45 11,482,190 $122,859 $95,971 $26,888 $212,225 $169,745 $42,480 $335,084 $265,717 $69,367
GILMER 6 2,413,125 $20,471 $26,502 ($6,032) $40,106 $63,077 ($22,971) $60,577 $89,579 ($29,003)
GLASCOCK 53 2,363,749 $28,932 $72,411 ($43,479) $38,742 $97,082 ($58,340) $67,674 $169,493 ($101,819)
GLYNN 78 12,322,004 $69,903 $34,951 $34,951 $199,087 $99,543 $99,544 $268,990 $134,495 $134,495
GORDON 9 2,219,720 $21,871 $14,431 $7,440 $44,061 $29,072 $14,989 $65,932 $43,503 $22,429
GRADY 53 12,915,363 $176,333 $116,794 $59,539 $183,398 $122,716 $60,682 $359,731 $239,510 $120,221
GREENE 114 14,728,590 $79,829 $163,346 ($83,517) $196,892 $403,574 ($206,682) $276,721 $566,920 ($290,199)
GWINNETT 0 0 $0 $0 $0 $0 $0 $0 $0 $0 $0
HABERSHAM 6 1,339,912 $14,238 $10,187 $4,051 $19,362 $13,854 $5,508 $33,600 $24,041 $9,558
HALL 2 3,127,839 $17,879 $10,586 $7,293 $58,803 $34,818 $23,985 $76,682 $45,404 $31,278
HANCOCK 214 17,463,680 $293,041 $97,699 $195,342 $252,472 $85,123 $167,349 $545,513 $182,822 $362,691
HARALSON 51 6,456,114 $80,185 $74,176 $6,009 $107,946 $98,446 $9,500 $188,131 $172,622 $15,508
HARRIS 124 21,631,103 $132,815 $173,045 ($40,230) $401,473 $499,883 ($98,410) $534,288 $672,929 ($138,640)
HART 0 0 $0 $0 $0 $0 $0 $0 $0 $0 $0
HEARD 61 7,025,514 $48,757 $48,353 $404 $109,900 $109,360 $540 $158,657 $157,714 $943
HENRY 0 0 $0 $0 $0 $0 $0 $0 $0 $0 $0
HOUSTON 52 9,017,087 $89,720 $71,869 $17,851 $120,288 $96,355 $23,933 $210,008 $168,224 $41,784
IRWIN 32 2,163,628 $26,777 $13,642 $13,135 $33,947 $17,296 $16,651 $60,724 $30,938 $29,786
JACKSON 1 175,450 $1,684 $1,237 $447 $3,357 $2,466 $891 $5,041 $3,703 $1,338
JASPER 89 19,293,626 $317,303 $693,586 ($376,283) $349,986 $766,031 ($416,045) $667,289 $1,459,617 ($792,328)
JEFF DAVIS 66 6,051,993 $93,080 $6,418 $86,661 $78,676 $5,425 $73,251 $171,756 $11,843 $159,912
JEFFERSON 115 8,890,961 $143,162 $254,385 ($111,223) $131,408 $234,375 ($102,967) $274,570 $488,760 ($214,190)
JENKINS 109 15,169,208 $154,650 $171,787 ($17,137) $233,348 $259,672 ($26,324) $387,998 $431,460 ($43,461)
JOHNSON 76 1,473,030 $22,609 $92,986 ($70,376) $21,854 $90,447 ($68,593) $44,463 $183,433 ($138,969)
JONES 111 19,567,386 $316,933 $252,304 $64,629 $387,199 $257,850 $129,349 $704,132 $510,154 $193,978
LAMAR 26 4,062,801 $47,096 $25,204 $21,892 $76,039 $36,345 $39,694 $123,135 $61,549 $61,586
LANIER 36 6,388,642 $101,452 $92,259 $9,193 $108,249 $98,840 $9,409 $209,701 $191,099 $18,602
LAURENS 91 4,022,204 $28,924 $20,785 $8,138 $59,058 $42,441 $16,617 $87,982 $63,226 $24,756
LEE 81 24,839,411 $350,757 $189,175 $161,582 $442,017 $233,036 $208,981 $792,774 $422,211 $370,564

County Parcel Count
Assessed Value Eliminated
County Tax Shift
FLPA Grant County
Net County ShiftSchool Tax
ShiftFLPA Grant
SchoolNet School Tax
ShiftTotal Tax Shift
Total FLPA Grant
Net Tax Shift
LIBERTY 46 5,209,244 $70,065 $0 $70,065 $82,249 $0 $82,249 $152,314 $0 $152,314
LINCOLN 30 904,072 $9,211 $10,024 ($813) $18,061 $16,726 $1,335 $27,272 $26,750 $522
LONG 87 11,048,971 $173,413 $167,640 $5,774 $166,652 $144,305 $22,347 $340,065 $311,945 $28,120
LOWNDES 57 23,728,939 $212,943 $78,215 $134,729 $397,408 $116,843 $280,565 $610,351 $195,058 $415,293
LUMPKIN 3 2,055,050 $25,031 $41,134 ($16,104) $34,564 $56,801 ($22,237) $59,595 $97,935 ($38,340)
MACON 53 3,567,282 $38,812 $53,320 ($14,508) $65,749 $83,499 ($17,750) $104,561 $136,819 ($32,258)
MADISON 13 1,429,128 $15,326 $7,663 $7,663 $24,281 $12,140 $12,141 $39,607 $19,803 $19,804
MARION 200 23,289,835 $167,500 $211,473 ($43,973) $378,600 $428,564 ($49,964) $546,100 $640,038 ($93,937)
MCDUFFIE 60 5,668,170 $44,212 $34,047 $10,164 $111,606 $85,947 $25,659 $155,818 $119,995 $35,823
MCINTOSH 41 10,144,566 $100,340 $4,666 $95,674 $159,097 $7,398 $151,699 $259,437 $12,064 $247,373
MERIWETHER 118 22,950,863 $313,716 $144,140 $169,576 $441,919 $97,937 $343,982 $755,635 $242,077 $513,558
MILLER 35 4,626,920 $71,717 $27,882 $43,835 $93,894 $35,304 $58,590 $165,611 $63,186 $102,425
MITCHELL 39 3,507,263 $69,759 $35,537 $34,223 $57,814 $29,451 $28,363 $127,573 $64,988 $62,586
MONROE 121 13,851,897 $163,882 $478,149 ($314,267) $218,860 $638,821 ($419,961) $382,742 $1,116,970 ($734,229)
MONTGOMERY 43 2,584,778 $35,295 $28,084 $7,211 $36,675 $29,182 $7,493 $71,970 $57,266 $14,703
MORGAN 124 16,301,599 $182,480 $800,052 ($617,572) $248,828 $1,091,420 ($842,592) $431,308 $1,891,472 ($1,460,164)
MURRAY 7 1,832,019 $13,180 $9,216 $3,964 $28,396 $19,856 $8,540 $41,576 $29,071 $12,505
MUSCOGEE 1 26,605 $317 $149 $168 $622 $311 $311 $939 $460 $479
NEWTON 15 8,092,198 $105,117 $72,898 $32,219 $158,706 $112,238 $46,468 $263,823 $185,136 $78,687
OCONEE 2 330,990 $2,213 $1,851 $362 $5,627 $4,708 $919 $7,840 $6,559 $1,281
OGLETHORPE 116 5,272,512 $40,145 $74,398 ($34,253) $115,531 $185,873 ($70,342) $155,676 $260,271 ($104,595)
PAULDING 7 2,656,933 $21,941 $27,279 ($5,338) $50,160 $79,232 ($29,072) $72,101 $106,511 ($34,410)
PEACH 9 1,748,885 $25,455 $13,483 $11,972 $29,731 $15,748 $13,983 $55,186 $29,230 $25,956
PICKENS 10 4,485,849 $35,663 $24,521 $11,142 $71,684 $49,288 $22,396 $107,347 $73,809 $33,537
PIERCE 32 1,868,733 $19,734 $13,388 $6,346 $31,208 $21,173 $10,035 $50,942 $34,561 $16,381
PIKE 19 4,442,305 $61,997 $48,884 $13,113 $79,273 $56,559 $22,714 $141,270 $105,443 $35,827
POLK 28 2,393,756 $26,477 $0 $26,477 $38,662 $0 $38,662 $65,139 $0 $65,139
PULASKI 23 1,677,451 $23,551 $18,345 $5,207 $23,432 $18,252 $5,180 $46,983 $36,597 $10,386
PUTNAM 52 7,469,466 $62,151 $66,409 ($4,257) $106,701 $114,060 ($7,359) $168,852 $180,469 ($11,617)
QUITMAN 128 13,428,198 $213,428 $407,017 ($193,590) $215,442 $361,363 ($145,921) $428,870 $768,380 ($339,511)
RABUN 0 0 $0 $0 $0 $0 $0 $0 $0 $0 $0
RANDOLPH 152 13,184,614 $231,733 $320,026 ($88,293) $237,323 $353,756 ($116,433) $469,056 $673,781 ($204,726)
RICHMOND 15 1,922,270 $18,827 $16,941 $1,886 $37,973 $31,645 $6,328 $56,800 $48,586 $8,214
ROCKDALE 0 0 $0 $0 $0 $0 $0 $0 $0 $0 $0
SCHLEY 62 7,739,710 $95,253 $6,207 $89,046 $146,892 $8,412 $138,480 $242,145 $14,619 $227,526
SCREVEN 189 15,506,539 $205,787 $340,259 ($134,472) $239,902 $397,543 ($157,641) $445,689 $737,802 ($292,113)
SEMINOLE 32 12,116,930 $166,523 $152,914 $13,609 $194,041 $179,231 $14,810 $360,564 $332,145 $28,419
SPALDING 11 285,445 $4,470 $2,789 $1,681 $5,301 $3,308 $1,993 $9,771 $6,097 $3,674
STEPHENS 1 292,812 $3,927 $3,700 $226 $5,358 $5,050 $308 $9,285 $8,750 $534
STEWART 282 15,857,259 $184,150 $187,480 ($3,329) $238,414 $242,954 ($4,540) $422,564 $430,434 ($7,869)
SUMTER 107 11,035,074 $145,939 $104,006 $41,933 $201,423 $133,354 $68,069 $347,362 $237,360 $110,002
TALBOT 215 10,550,788 $168,855 $323,378 ($154,523) $148,861 $285,727 ($136,866) $317,716 $609,105 ($291,389)
TALIAFERRO 154 9,737,361 $200,578 $536,349 ($335,771) $175,214 $468,304 ($293,090) $375,792 $1,004,652 ($628,860)
TATTNALL 52 4,541,273 $67,474 $46,963 $20,511 $61,371 $42,715 $18,656 $128,845 $89,679 $39,167
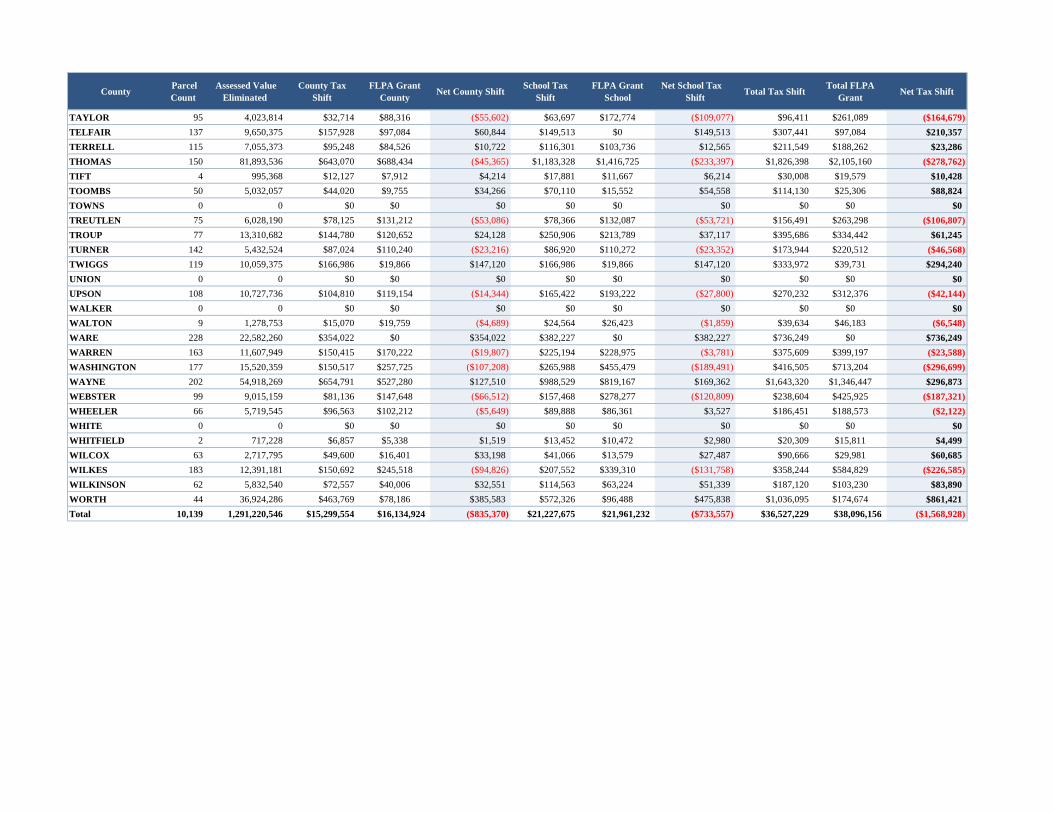
County Parcel Count
Assessed Value Eliminated
County Tax Shift
FLPA Grant County
Net County ShiftSchool Tax
ShiftFLPA Grant
SchoolNet School Tax
ShiftTotal Tax Shift
Total FLPA Grant
Net Tax Shift
TAYLOR 95 4,023,814 $32,714 $88,316 ($55,602) $63,697 $172,774 ($109,077) $96,411 $261,089 ($164,679)
TELFAIR 137 9,650,375 $157,928 $97,084 $60,844 $149,513 $0 $149,513 $307,441 $97,084 $210,357
TERRELL 115 7,055,373 $95,248 $84,526 $10,722 $116,301 $103,736 $12,565 $211,549 $188,262 $23,286
THOMAS 150 81,893,536 $643,070 $688,434 ($45,365) $1,183,328 $1,416,725 ($233,397) $1,826,398 $2,105,160 ($278,762)
TIFT 4 995,368 $12,127 $7,912 $4,214 $17,881 $11,667 $6,214 $30,008 $19,579 $10,428
TOOMBS 50 5,032,057 $44,020 $9,755 $34,266 $70,110 $15,552 $54,558 $114,130 $25,306 $88,824
TOWNS 0 0 $0 $0 $0 $0 $0 $0 $0 $0 $0
TREUTLEN 75 6,028,190 $78,125 $131,212 ($53,086) $78,366 $132,087 ($53,721) $156,491 $263,298 ($106,807)
TROUP 77 13,310,682 $144,780 $120,652 $24,128 $250,906 $213,789 $37,117 $395,686 $334,442 $61,245
TURNER 142 5,432,524 $87,024 $110,240 ($23,216) $86,920 $110,272 ($23,352) $173,944 $220,512 ($46,568)
TWIGGS 119 10,059,375 $166,986 $19,866 $147,120 $166,986 $19,866 $147,120 $333,972 $39,731 $294,240
UNION 0 0 $0 $0 $0 $0 $0 $0 $0 $0 $0
UPSON 108 10,727,736 $104,810 $119,154 ($14,344) $165,422 $193,222 ($27,800) $270,232 $312,376 ($42,144)
WALKER 0 0 $0 $0 $0 $0 $0 $0 $0 $0 $0
WALTON 9 1,278,753 $15,070 $19,759 ($4,689) $24,564 $26,423 ($1,859) $39,634 $46,183 ($6,548)
WARE 228 22,582,260 $354,022 $0 $354,022 $382,227 $0 $382,227 $736,249 $0 $736,249
WARREN 163 11,607,949 $150,415 $170,222 ($19,807) $225,194 $228,975 ($3,781) $375,609 $399,197 ($23,588)
WASHINGTON 177 15,520,359 $150,517 $257,725 ($107,208) $265,988 $455,479 ($189,491) $416,505 $713,204 ($296,699)
WAYNE 202 54,918,269 $654,791 $527,280 $127,510 $988,529 $819,167 $169,362 $1,643,320 $1,346,447 $296,873
WEBSTER 99 9,015,159 $81,136 $147,648 ($66,512) $157,468 $278,277 ($120,809) $238,604 $425,925 ($187,321)
WHEELER 66 5,719,545 $96,563 $102,212 ($5,649) $89,888 $86,361 $3,527 $186,451 $188,573 ($2,122)
WHITE 0 0 $0 $0 $0 $0 $0 $0 $0 $0 $0
WHITFIELD 2 717,228 $6,857 $5,338 $1,519 $13,452 $10,472 $2,980 $20,309 $15,811 $4,499
WILCOX 63 2,717,795 $49,600 $16,401 $33,198 $41,066 $13,579 $27,487 $90,666 $29,981 $60,685
WILKES 183 12,391,181 $150,692 $245,518 ($94,826) $207,552 $339,310 ($131,758) $358,244 $584,829 ($226,585)
WILKINSON 62 5,832,540 $72,557 $40,006 $32,551 $114,563 $63,224 $51,339 $187,120 $103,230 $83,890
WORTH 44 36,924,286 $463,769 $78,186 $385,583 $572,326 $96,488 $475,838 $1,036,095 $174,674 $861,421
Total 10,139 1,291,220,546 $15,299,554 $16,134,924 ($835,370) $21,227,675 $21,961,232 ($733,557) $36,527,229 $38,096,156 ($1,568,928)


44
Taxation of Standing Timber
For ad valorem tax purposes standing timber is taxed only once following its harvest or sale at 100 percent
of fair market value. It is subject to taxation even if the land underneath is exempt unless taxation has been
prohibited by federal law or treaty.
Standing timber is defined to include softwood and hardwood pulpwood, chip and saw logs, saw timber,
poles, posts, and fuel wood. Standing timber does not include orchard trees, ornamental or Christmas trees,
by‐products of harvesting (bark or stumps), and fuel wood harvested by the owner which is used exclusively
for heating the owner’s home. The taxation of standing timber is triggered at the time of the “sale” of
standing timber for harvesting separate and apart from the underlying land. Timber is not taxed if it is
included in a simultaneous sale of a tract of land and the timber thereon.
Figure 21: Statewide Timber Values shows the trend in value and revenue since 2010.
Figure 22: County and School Revenue from Timber shows the trend in value and revenue
since 2010.
383.6 499.6
440.6
503.0
589.7 685.2
670.8
350.0
450.0
550.0
650.0
750.0
850.0
2010 2011 2012 2013 2014 2015 2016
Mil
lio
ns
$10.2 $13.4
$12.0
$13.9
$16.5 $19.5
$19.0
$5.0
$10.0
$15.0
$20.0
$25.0
2010 2011 2012 2013 2014 2015 2016
Mil
lio
ns

45
Table 11: 2015 Timber Revenue Reported on 2016 Tax Digests shows the timber revenue for 2015 which was reported on the 2016 tax digest.
County Acres Assessed Value County
Revenue School
Revenue Total
Revenue
Appling 165 8,614,408 $110,015 $125,796 $235,811
Atkinson 61,428 9,921,200 $172,242 $146,943 $319,185
Bacon 11,586 6,336,079 $86,969 $95,041 $182,010
Baker 10,138 2,753,455 $27,554 $40,845 $68,399
Baldwin 7,071 1,502,645 $14,802 $25,635 $40,437
Banks 2,143 615,856 $5,891 $9,589 $15,480
Barrow 40 37,653 $353 $697 $1,050
Bartow 19,930 2,233,172 $20,150 $42,447 $62,597
Ben Hill 13,142 5,749,394 $87,190 $103,932 $191,122
Berrien 7,407 2,923,883 $48,858 $41,221 $90,079
Bibb 159 467,495 $6,850 $9,324 $16,174
Bleckley 4,883 2,384,965 $35,929 $34,222 $70,151
Brantley 14,295 11,434,698 $169,416 $188,673 $358,089
Brooks 10,618 5,336,829 $72,248 $80,426 $152,674
Bryan 809 6,156,260 $55,937 $95,360 $151,297
Bulloch 19,373 6,956,352 $85,841 $68,200 $154,041
Burke 20,451 9,835,161 $59,916 $135,037 $194,953
Butts 2,889 1,278,109 $16,243 $23,088 $39,331
Calhoun 10,294 1,286,286 $18,075 $22,739 $40,814
Camden 25,895 14,580,352 $203,251 $233,286 $436,537
Candler 25,568 4,608,334 $55,682 $60,259 $115,941
Carroll 51,166 1,865,249 $15,573 $33,576 $49,149
Catoosa 678 250,103 $1,825 $4,675 $6,500
Charlton 0 17,072,852 $323,872 $297,921 $621,793
Chatham 551 324,497 $3,746 $5,397 $9,143
Chattahoochee 1,159 422,419 $3,647 $7,190 $10,837
Chattooga 2,721 1,729,804 $20,394 $23,842 $44,236
Cherokee 37,739 547,150 $3,108 $10,642 $13,750
Clarke 0 0 $0 $0 $0
Clay 33 1,773,450 $30,404 $23,376 $53,780
Clayton 41 27,233 $452 $520 $972
Clinch 20,594 27,389,076 $299,993 $503,959 $803,952
Cobb 96 23,000 $153 $435 $588
Coffee 26,493 11,026,848 $85,932 $177,620 $263,552
Colquitt 15,909 6,074,094 $87,334 $62,448 $149,782
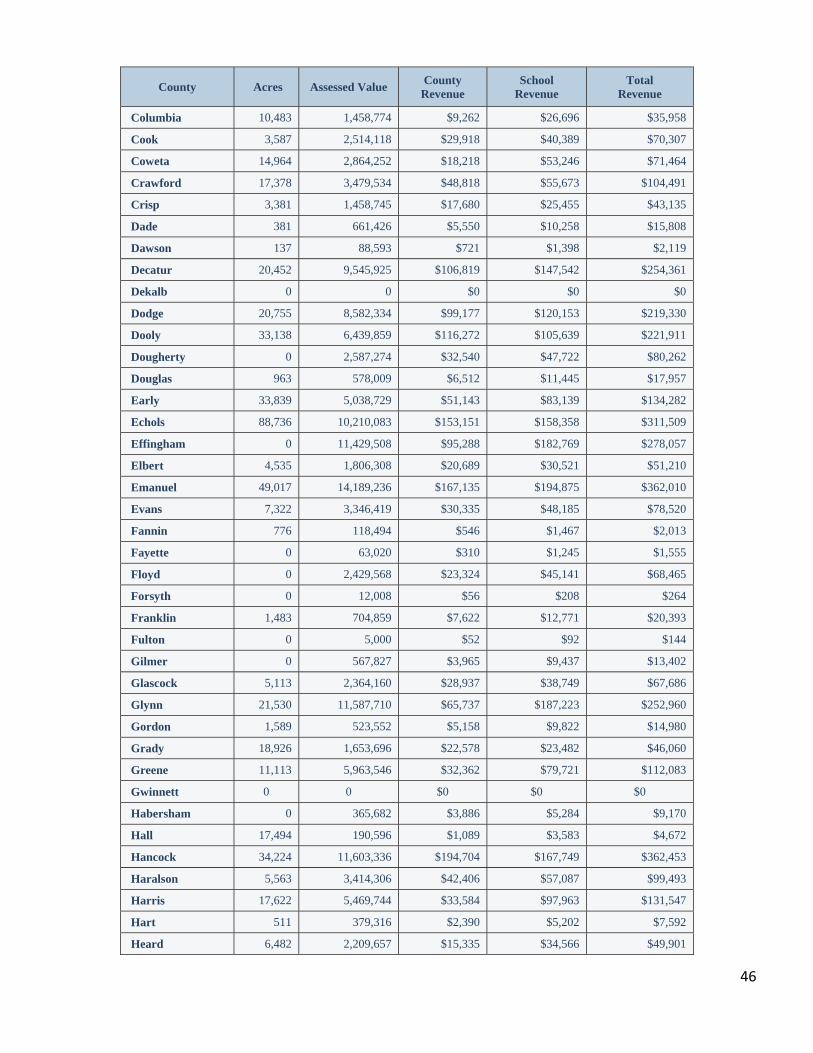
46
County Acres Assessed Value County
Revenue School
Revenue Total
Revenue
Columbia 10,483 1,458,774 $9,262 $26,696 $35,958
Cook 3,587 2,514,118 $29,918 $40,389 $70,307
Coweta 14,964 2,864,252 $18,218 $53,246 $71,464
Crawford 17,378 3,479,534 $48,818 $55,673 $104,491
Crisp 3,381 1,458,745 $17,680 $25,455 $43,135
Dade 381 661,426 $5,550 $10,258 $15,808
Dawson 137 88,593 $721 $1,398 $2,119
Decatur 20,452 9,545,925 $106,819 $147,542 $254,361
Dekalb 0 0 $0 $0 $0
Dodge 20,755 8,582,334 $99,177 $120,153 $219,330
Dooly 33,138 6,439,859 $116,272 $105,639 $221,911
Dougherty 0 2,587,274 $32,540 $47,722 $80,262
Douglas 963 578,009 $6,512 $11,445 $17,957
Early 33,839 5,038,729 $51,143 $83,139 $134,282
Echols 88,736 10,210,083 $153,151 $158,358 $311,509
Effingham 0 11,429,508 $95,288 $182,769 $278,057
Elbert 4,535 1,806,308 $20,689 $30,521 $51,210
Emanuel 49,017 14,189,236 $167,135 $194,875 $362,010
Evans 7,322 3,346,419 $30,335 $48,185 $78,520
Fannin 776 118,494 $546 $1,467 $2,013
Fayette 0 63,020 $310 $1,245 $1,555
Floyd 0 2,429,568 $23,324 $45,141 $68,465
Forsyth 0 12,008 $56 $208 $264
Franklin 1,483 704,859 $7,622 $12,771 $20,393
Fulton 0 5,000 $52 $92 $144
Gilmer 0 567,827 $3,965 $9,437 $13,402
Glascock 5,113 2,364,160 $28,937 $38,749 $67,686
Glynn 21,530 11,587,710 $65,737 $187,223 $252,960
Gordon 1,589 523,552 $5,158 $9,822 $14,980
Grady 18,926 1,653,696 $22,578 $23,482 $46,060
Greene 11,113 5,963,546 $32,362 $79,721 $112,083
Gwinnett 0 0 $0 $0 $0
Habersham 0 365,682 $3,886 $5,284 $9,170
Hall 17,494 190,596 $1,089 $3,583 $4,672
Hancock 34,224 11,603,336 $194,704 $167,749 $362,453
Haralson 5,563 3,414,306 $42,406 $57,087 $99,493
Harris 17,622 5,469,744 $33,584 $97,963 $131,547
Hart 511 379,316 $2,390 $5,202 $7,592
Heard 6,482 2,209,657 $15,335 $34,566 $49,901
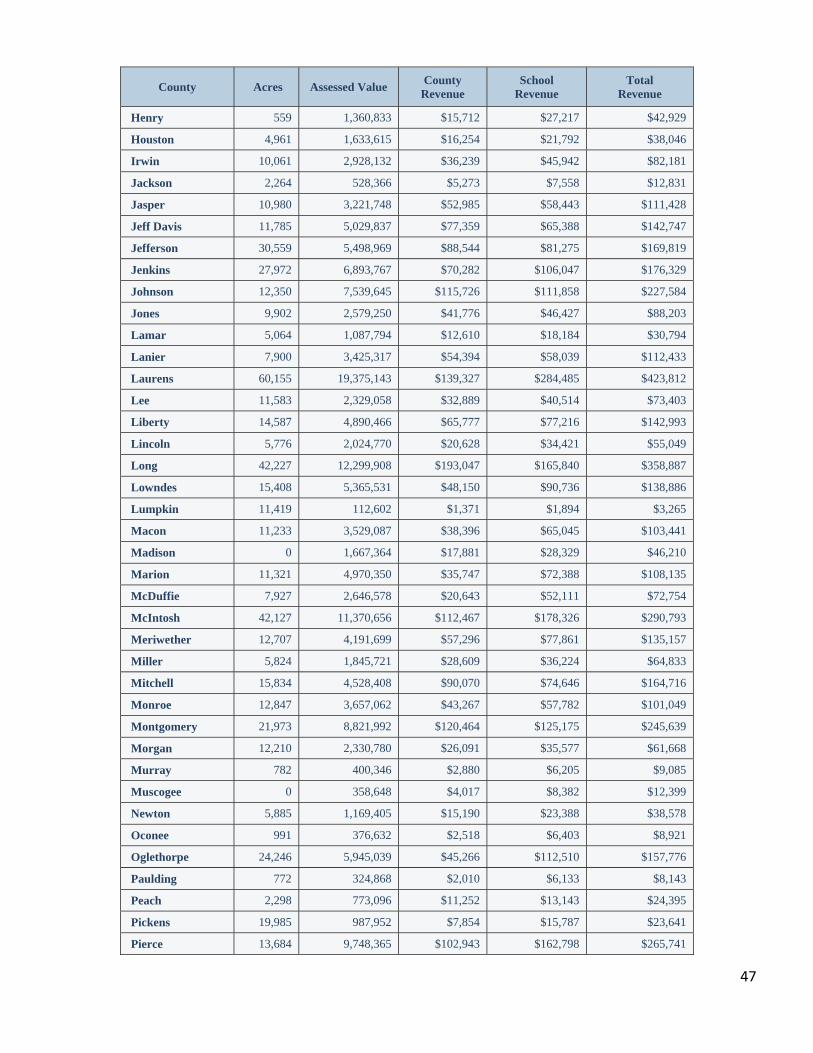
47
County Acres Assessed Value County
Revenue School
Revenue Total
Revenue
Henry 559 1,360,833 $15,712 $27,217 $42,929
Houston 4,961 1,633,615 $16,254 $21,792 $38,046
Irwin 10,061 2,928,132 $36,239 $45,942 $82,181
Jackson 2,264 528,366 $5,273 $7,558 $12,831
Jasper 10,980 3,221,748 $52,985 $58,443 $111,428
Jeff Davis 11,785 5,029,837 $77,359 $65,388 $142,747
Jefferson 30,559 5,498,969 $88,544 $81,275 $169,819
Jenkins 27,972 6,893,767 $70,282 $106,047 $176,329
Johnson 12,350 7,539,645 $115,726 $111,858 $227,584
Jones 9,902 2,579,250 $41,776 $46,427 $88,203
Lamar 5,064 1,087,794 $12,610 $18,184 $30,794
Lanier 7,900 3,425,317 $54,394 $58,039 $112,433
Laurens 60,155 19,375,143 $139,327 $284,485 $423,812
Lee 11,583 2,329,058 $32,889 $40,514 $73,403
Liberty 14,587 4,890,466 $65,777 $77,216 $142,993
Lincoln 5,776 2,024,770 $20,628 $34,421 $55,049
Long 42,227 12,299,908 $193,047 $165,840 $358,887
Lowndes 15,408 5,365,531 $48,150 $90,736 $138,886
Lumpkin 11,419 112,602 $1,371 $1,894 $3,265
Macon 11,233 3,529,087 $38,396 $65,045 $103,441
Madison 0 1,667,364 $17,881 $28,329 $46,210
Marion 11,321 4,970,350 $35,747 $72,388 $108,135
McDuffie 7,927 2,646,578 $20,643 $52,111 $72,754
McIntosh 42,127 11,370,656 $112,467 $178,326 $290,793
Meriwether 12,707 4,191,699 $57,296 $77,861 $135,157
Miller 5,824 1,845,721 $28,609 $36,224 $64,833
Mitchell 15,834 4,528,408 $90,070 $74,646 $164,716
Monroe 12,847 3,657,062 $43,267 $57,782 $101,049
Montgomery 21,973 8,821,992 $120,464 $125,175 $245,639
Morgan 12,210 2,330,780 $26,091 $35,577 $61,668
Murray 782 400,346 $2,880 $6,205 $9,085
Muscogee 0 358,648 $4,017 $8,382 $12,399
Newton 5,885 1,169,405 $15,190 $23,388 $38,578
Oconee 991 376,632 $2,518 $6,403 $8,921
Oglethorpe 24,246 5,945,039 $45,266 $112,510 $157,776
Paulding 772 324,868 $2,010 $6,133 $8,143
Peach 2,298 773,096 $11,252 $13,143 $24,395
Pickens 19,985 987,952 $7,854 $15,787 $23,641
Pierce 13,684 9,748,365 $102,943 $162,798 $265,741

48
County Acres Assessed Value County
Revenue School
Revenue Total
Revenue
Pike 3,593 2,227,243 $31,083 $35,963 $67,046
Polk 4,554 10,911,651 $120,694 $176,234 $296,928
Pulaski 8,734 1,582,242 $22,215 $22,102 $44,317
Putnam 3,749 1,690,662 $14,011 $24,151 $38,162
Quitman 10,176 4,038,966 $64,195 $56,739 $120,934
Rabun 175 27,701 $253 $269 $522
Randolph 13,990 6,346,964 $100,695 $114,245 $214,940
Richmond 1,990 995,100 $9,746 $19,657 $29,403
Rockdale 0 0 $0 $0 $0
Schley 7,406 2,534,127 $31,188 $42,267 $73,455
Screven 12,225 11,579,338 $153,669 $179,144 $332,813
Seminole 3,430 2,043,856 $28,089 $32,730 $60,819
Spalding 0 924,412 $14,476 $17,166 $31,642
Stephens 689 359,803 $4,825 $6,584 $11,409
Stewart 17,224 6,602,560 $76,676 $99,269 $175,945
Sumter 13,500 4,252,691 $56,242 $77,624 $133,866
Talbot 9,948 3,144,371 $50,323 $44,364 $94,687
Taliaferro 11,799 3,843,847 $79,141 $69,166 $148,307
Tattnall 25,196 8,357,002 $124,168 $112,937 $237,105
Taylor 11,687 2,584,105 $21,009 $40,906 $61,915
Telfair 20,448 11,095,324 $181,575 $171,900 $353,475
Terrell 6,825 2,209,958 $29,834 $36,429 $66,263
Thomas 29,837 4,542,654 $35,639 $65,959 $101,598
Tift 2,894 1,313,705 $16,005 $23,599 $39,604
Toombs 8,060 6,101,822 $53,379 $84,606 $137,985
Towns 0 0 $0 $0 $0
Treutlen 41,931 5,051,251 $65,464 $65,666 $131,130
Troup 10,653 2,758,084 $29,340 $51,990 $81,330
Turner 6,118 2,578,368 $41,303 $41,254 $82,557
Twiggs 16,663 6,752,338 $112,089 $112,089 $224,178
Union 241 86,561 $501 $1,020 $1,521
Upson 14,057 3,665,422 $35,811 $56,521 $92,332
Walker 754 422,554 $3,312 $7,027 $10,339
Walton 2,648 860,351 $10,175 $15,385 $25,560
Ware 64,791 11,757,348 $184,320 $199,005 $383,325
Warren 17,168 5,377,282 $69,679 $93,565 $163,244
Washington 57,871 10,080,463 $97,761 $172,759 $270,520
Wayne 28,746 21,830,753 $260,288 $392,954 $653,242
Webster 8,515 4,094,713 $36,852 $69,442 $106,294

49
County Acres Assessed Value County
Revenue School
Revenue Total
Revenue
Wheeler 9,849 4,765,446 $80,617 $74,894 $155,511
White 188 36,730 $367 $660 $1,027
Whitfield 687 407,219 $3,893 $7,638 $11,531
Wilcox 21,039 6,996,233 $127,681 $105,713 $233,394
Wilkes 160,441 6,571,216 $79,913 $110,068 $189,981
Wilkinson 12,282 5,153,079 $64,104 $101,217 $165,321
Worth 0 5,026,127 $63,128 $77,905 $141,033
Total 2,097,887 670,794,005 $8,282,046 $10,670,887 $18,952,933

50
Georgia’s Unclaimed Property Program
Georgia’s Unclaimed Property Program has a team of dedicated professionals who provide customer service
to holders and owners of abandoned property. The program annually receives unclaimed property from
corporations, banks, insurance companies, local governments and state agencies. The lost property
represents un‐cashed checks, money orders, stocks, bonds, accounts, or safe deposit boxes. The program
has an active outreach program to locate owners of lost property.
Unclaimed Property Receipts
For Fiscal Year 2017 the program received over $180 million dollars in unclaimed funds. Along with the funds, the holders are required to furnish reports which include lost owner information such as name, last known address, account number, or social security number. Once the reports have been processed, owner information is made available on the Department of Revenue’s website for an owner search.
Unclaimed Property Paid Claims
Each year Georgia’s Unclaimed Property Program returns property to its rightful owners. Through the claim
process, owners and abandoned property are reunited. Potential owners may request a claim form online or
contact a customer service representative by telephone. Claim forms can be mailed, emailed or faxed. Each
claim request is researched to determine if other property is available and to verify the rightful owner. In
Fiscal Year 2017, the program returned over $21 million dollars and 315,590 shares of stock to lost owners.
The program’s customer representatives are available Monday through Friday from 8:00 am to 4:30 pm at
1‐855‐329‐9863. The web address for the online search is located at www.dor.ga.gov.
$112
$154
$162
$160 $179 $180
$100
$140
$180
$220
2012 2013 2014 2015 2016 2017
Mil
lio
ns
$18
$16
$16 $22
$20
$21
$10
$15
$20
$25
2012 2013 2014 2015 2016 2017
Mil
lio
ns