georgia department of revenue · the mission of the department of revenue is to administer the tax...
TRANSCRIPT
2015
Annual Report
GEORGIA
DEPARTMENT OF REVENUE
Lynnette T. Riley
Commissioner


3
Foreword
MISSION STATEMENT
The mission of the Department of Revenue is to administer the tax laws of the State of Georgia fairly and efficiently in order to promote public confidence and compliance, while providing excellent customer service. VISION
The Georgia Department of Revenue is committed to being the fairest and most efficient tax administrator in the United States. In order to meet this commitment to our taxpayers, we will strive to:
Maintain a highly motivated and well-trained workforce Provide customer service that far exceeds taxpayer’s expectations Treat all taxpayers fairly Measure not only our costs, but also the costs we impose on taxpayers Maintain continuous improvement and rigorous accountability
CORE VALUES
Customer Service Operational Efficiency Employee Engagement
FOREWORD
The Georgia Department of Revenue is responsible for the collection of taxes and fees from individuals and businesses. The Department oversees the application of Georgia’s tax laws in a fair and equitable manner while providing a high level of customer service to ensure that every Georgia citizen pays their fair share of tax – and nothing more.
In fiscal year 2015, the Department collected $26.4 billion in gross tax revenues and distributed $4.8 billion in
sales tax revenues to counties and municipalities. Utilizing advanced technology, the Department processed nearly 4.5 million individual income tax returns and issued almost 3.2 million refunds.
In addition to the collection of revenue, the Department performs a wide range of tasks that includes the
regulation and enforcement of alcohol and tobacco statutes; managing the taxation of interstate trucking; reviewing county property tax digests; administration of the unclaimed property program; and developing tax forms, instructions, and procedures with the goal of enhancing compliance efforts while making the reporting and collection of taxes less onerous for Georgia taxpayers. ALCOHOL TAXES
The licensed sale of alcoholic beverages commenced in Georgia in the mid-1930s following the nationwide repeal of Prohibition. Georgia is a “local option” state for the licensing and sale of alcoholic beverages. Any city or county that wants to provide for the licensing and sale of distilled spirits can do so legally only after an affirmative vote of its citizens. Upon approval of the voters, the licensing, sale, and manufacture of distilled spirits is permitted provided the manufacturer, wholesaler, or retailer obtains an alcohol beverage license from the Department of Revenue and complies with all local licensing requirements.

4
Foreword
Georgia alcohol taxes are collected by the wholesaler at time of delivery to the retailer. The wholesaler remits all
taxes collected to the Revenue Department. Georgia taxes alcoholic beverages as follows: Distilled Spirits: Distilled spirits (less than 190 proof) manufactured within Georgia are taxed at 50 cents (excise tax) per liter. Distilled spirits manufactured outside Georgia are taxed at $1 per liter. Alcohol (over 190 proof) manufactured inside Georgia is taxed at 70 cents per liter. Alcohol manufactured outside Georgia is taxed at $1.40 per liter. Some localities collect a local tax, which can be up to 22 cents per liter. Beer: The State tax is $1.08 per standard case of 24 twelve-ounce containers (4 ½ cents per can) plus a uniform local beer tax of $1.20 per standard case (5 cents per can). Wine: Table wines (14 percent or less alcohol by volume) manufactured inside Georgia are taxed at 11 cents per liter. Table wines manufactured outside Georgia are taxed at 40 cents per liter. Dessert wines (more than 14 percent, but not more than 21 percent alcohol by volume) manufactured inside Georgia are taxed at 27 cents per liter. Dessert wines manufactured outside the state are taxed at 67 cents per liter. Wines that are fortified with distilled spirits, which results in an alcohol content of more than 21 percent alcohol by volume, are taxed as distilled spirits. Some localities collect a local tax, which can be up to 22 cents per liter.
CORPORATE INCOME TAX
Georgia’s current corporate income tax rate became effective in 1969 at a rate of 6 percent. The tax was initiated in Georgia in 1929 with a rate of assessment equal to one-third of the Federal rate. In 1931, the rate was changed to 4 percent. In subsequent years, the rate has changed as follows: 5 ½ percent in 1937; 7 ½ percent in 1949; 5 ½ percent in 1951; 4 percent in 1955 with federal taxes no longer deductible; and 5 percent in 1964.
INDIVIDUAL INCOME TAX
Georgia’s individual income tax is a graduated tax based upon an individual’s Federal adjusted gross income. Georgia’s maximum individual income tax rate is 6 percent. The state initiated an individual income tax in 1929, assessed at one-third of the federal rate. The basic allowance relieved all but a small percentage of Georgia families from paying Georgia income tax. In 1937, the system was revised to essentially the graduated scale used by Georgia joint filers today. Additional refinements including the creation of withholding tax, estimated tax, and new graduated schedules for certain types of filers have been incorporated over the years. MOTOR FUEL TAX
As of July 1, 2015, the prepaid state tax on motor fuels has been eliminated. The state excise tax rate is 26¢ per gallon for all motor fuel types (gasoline, LPG, and special fuels including CNG) except for diesel fuel, which is levied at 29¢ per gallon. Aviation gasoline is subject to a 1¢ per gallon excise tax so long as the fuel is sold to a licensed aviation distributor. The state excise tax is the only statewide motor fuel tax.
Local governments may impose a prepaid local tax on motor fuels for each relevant local sales tax in effect. The Department of Revenue calculates the average retail sales price used for determining the prepaid local tax; however, the average retail sales price used to calculate the prepaid local tax may not exceed $3.00 per gallon.
MOTOR VEHICLE TAGS AND TITLES
Georgia law first required motor vehicle registrations beginning with 1910. Certificates of title to motor vehicles
were first required for motor vehicles model year 1963. Motor vehicles are subject to annual registration fees ranging
from $12 to $750 depending on the weight of the vehicle.

5
Foreword
Motor vehicles titled prior to March 1, 2013 are subject to an annual ad valorem tax, the revenue for which is
received primarily by local governments. Vehicles purchased on or after March 1, 2013 are subject to a one-time state
and local title ad valorem tax (TAVT), based on the vehicle value, and due at the time of application for certificate of
title.
By statute, the rate of TAVT increased from 6.5 percent in 2013 to 6.75 percent in 2014 and to 7 percent in
2015. The rate will stay at 7 percent unless statutory revenue targets fall short, in which case the rate will be adjusted
upward according to a statutory formula. TAVT proceeds are divided between the state and local governments.
PROPERTY TAX
In the mid-1800s, Georgia passed an Act allowing for the taxation of property. The ad valorem tax has remained in effect, and constitutes the primary source of revenue for county governments, municipalities, and public school systems in Georgia. As of January 1, 2016, the state levy of annual ad valorem property tax has been eliminated.
SALES AND USE TAX
In April 1951, Georgia became the 30th state to implement a sales and use tax. The rate was initially 3 percent but was increased to 4 percent in April 1989 where it remains today.
The county sales and use tax rate varies between 1 and 4 percent depending on which of the following county
taxes are in place: Local Option Sales Tax (LOST), Educational Local Option Sales Tax (ELOST), Special Purpose Local
Option Sales Tax (SPLOST), Homestead Local Option Sales Tax (HOST), Transportation Special Purpose Local Option Sales
Tax (TSPLOST), or Metropolitan Atlanta Rapid Transit Authority (MARTA) Tax. In addition, the City of Atlanta imposes a 1
percent Municipal Option Sales Tax (MOST).
TOBACCO TAXES
State taxation of cigars and cigarettes began in 1923. The rate on cigarettes increased gradually to 12 cents per pack in 1971. Effective July 1, 2003, the excise tax on a pack of 20 cigarettes increased to the present rate of 37 cents. In July 2003, the state began imposing an excise tax on loose and smokeless tobacco. It is based upon 10 percent of the
wholesale cost price. Effective July 2003, the tax rate on “little cigars” (weighing not more than 3 pounds per thousand)
increased from 2 mills to 2.5 mills each. The tax on all other cigars increased from 13 percent to 23 percent of the
wholesale cost price.
6
Contents
Table of Contents
Organization
Directory 7
Organization of the Department of Revenue 8
Regional Offices 9
Tax Data 10
Revenue Collections 10
Net Revenue Collections by Category 10
Net Revenue Collections by Month 11
Refunds by Month 11
Revenue Collections 12
Corporate Income Tax 14
Corporation Income Tax Returns by Taxable Income Class 14
Corporate Tax Collections and Returns Processed 16
Individual Income Tax 16
Individual Income Tax Collections and Returns Processed 16
Growth Trend of Individual Income Tax 17
Georgia, Southeast and United States Per Capita Income 17
Trends in Individual Income and State Income Tax Receipts 18
Electronic Filing versus Paper Returns 18
Tax Returns Processed in Department of Revenue 18
Individual Income Tax by Income Class 19
Sales and Use Tax 19
Comparison of Sales Tax Collected and Distributed 19
Net Sales and Use Tax Collections by Month 20
Sales and Use Tax Revenues by Business Group 20
Local Government 21
Two Calendar Year Economic Indicators by County 21
Taxable Values and Rates, General Property and Public Utilities 23
Motor Vehicle 23
Active Registrations for Georgia Specialty Plates 23
Motor Vehicle Registrations 23
Alcohol and Tobacco 24
Tax and Fee Collections by Alcohol and Tobacco Division 24
Alcohol and Tobacco Division Statistics 24
Revenue from Selective Excise Taxes 25
Revenue from Business License Fees 25
Taxpayer Bill of Rights 26
7
Organization
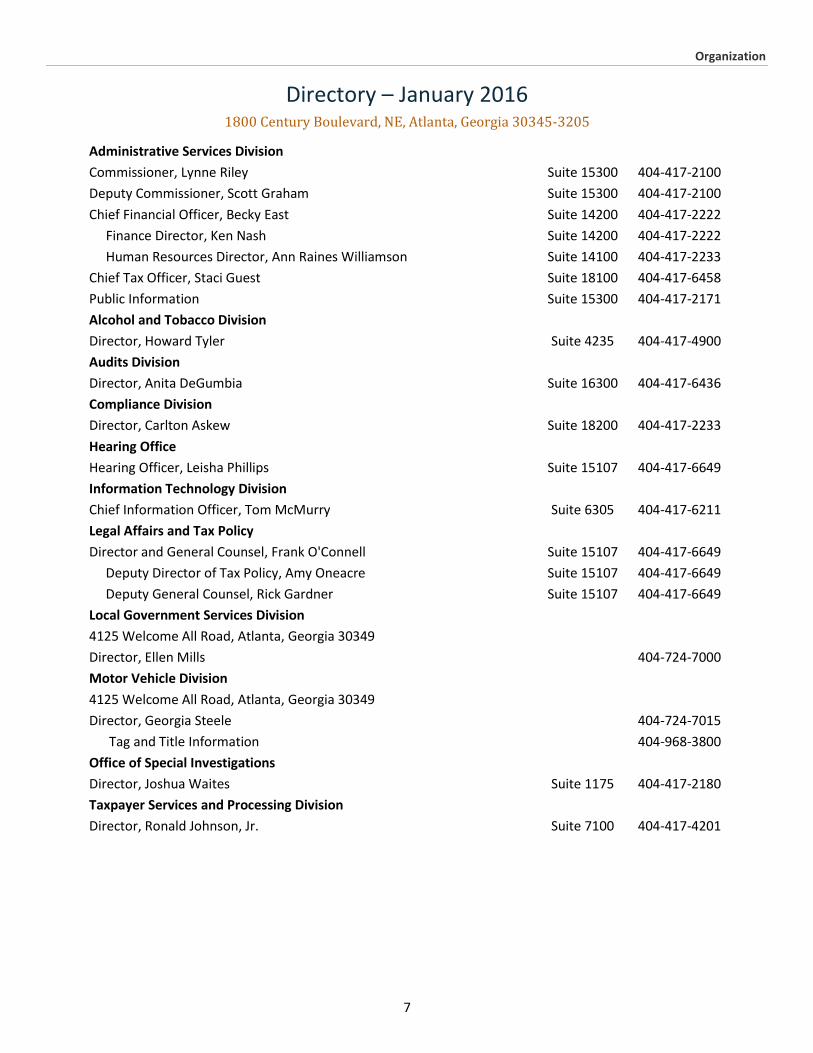
Directory – January 2016 1800 Century Boulevard, NE, Atlanta, Georgia 30345-3205
Administrative Services Division
Commissioner, Lynne Riley Suite 15300 404-417-2100
Deputy Commissioner, Scott Graham Suite 15300 404-417-2100
Chief Financial Officer, Becky East Suite 14200 404-417-2222
Finance Director, Ken Nash Suite 14200 404-417-2222
Human Resources Director, Ann Raines Williamson Suite 14100 404-417-2233
Chief Tax Officer, Staci Guest Suite 18100 404-417-6458
Public Information Suite 15300 404-417-2171
Alcohol and Tobacco Division
Director, Howard Tyler Suite 4235 404-417-4900
Audits Division
Director, Anita DeGumbia Suite 16300 404-417-6436
Compliance Division
Director, Carlton Askew Suite 18200 404-417-2233
Hearing Office
Hearing Officer, Leisha Phillips Suite 15107 404-417-6649
Information Technology Division
Chief Information Officer, Tom McMurry Suite 6305 404-417-6211
Legal Affairs and Tax Policy
Director and General Counsel, Frank O'Connell Suite 15107 404-417-6649
Deputy Director of Tax Policy, Amy Oneacre Suite 15107 404-417-6649
Deputy General Counsel, Rick Gardner Suite 15107 404-417-6649
Local Government Services Division
4125 Welcome All Road, Atlanta, Georgia 30349
Director, Ellen Mills 404-724-7000
Motor Vehicle Division
4125 Welcome All Road, Atlanta, Georgia 30349
Director, Georgia Steele 404-724-7015
Tag and Title Information 404-968-3800
Office of Special Investigations
Director, Joshua Waites Suite 1175 404-417-2180
Taxpayer Services and Processing Division
Director, Ronald Johnson, Jr. Suite 7100 404-417-4201

8
Organization
Organization of the Department of Revenue
In addition to the office of State Revenue Commissioner, the Department of Revenue is organized by division. The agency
is organized into ten divisions with the following functions:
ADMINISTRATIVE
This division provides administrative services for all other
divisions within the Department of Revenue. The
functional areas in the Administrative Division are
accounting, budget, fiscal analysis, human resources,
procurement, public information and training.
ALCOHOL AND TOBACCO
The division is composed of two units, the Law
Enforcement Section and the Licenses and Permits
Section. The Law Enforcement Section enforces all laws
and regulations pertaining to the manufacture,
possession, transportation, and sale of legal and illegal
alcoholic beverages and tobacco products. This Section
also enforces motor fuel and motor carriers laws. The
Licenses and Permits Section is charged with receiving,
processing and collecting excise tax reports on alcohol
and tobacco products. This section is also responsible for
alcohol and tobacco applications, registrations and keg
decals.
COMPLIANCE
This division is responsible for ensuring taxpayer
compliance with Georgia’s tax laws. The division
oversees the 11 regional offices within the state and is
comprised of two units. The Audit Division uses a staff of
professional tax specialists to perform nationwide tax
audits. The Compliance Division ensures compliance with
filing deadlines and registration, collects delinquent
accounts, monitors special event taxes, and oversees the
four private collection agencies.
INFORMATION TECHNOLOGY
This division manages the information technology
systems for all areas of tax administration and is charged
with the continual enhancement of current systems and
development of new applications.
LEGAL AFFAIRS AND TAX POLICY
This division provides in-house guidance for the
Department of Revenue, analyzes tax and regulatory
legislation, and issues written guidance to assist
taxpayers in complying with Georgia’s laws. The division
also serves as liaison with the Office of the Attorney
General and the Georgia Tax Tribunal.
LOCAL GOVERNMENT SERVICES
This division oversees administration of property tax
laws and regulations, distributes sales taxes to local
authorities and administers the Unclaimed Property Act.
MOTOR VEHICLE
The motor vehicle division issues license plates, Georgia
certificates of title, and records liens and security
interest information of registered vehicles. The division
also operates a call center to assist taxpayers.
PROCESSING
This division performs frontline processing of all tax
documents and paper check payments, including the
imaging of documents, data capture, reporting and
reconciliation.
SPECIAL INVESTIGATIONS
This division is responsible for investigating potential
criminal violations involving tax fraud, theft and motor
vehicle title and registration fraud.
TAXPAYER SERVICES
The Taxpayer Services Division serves three functions.
The Customer Contact Center responds to taxpayer
telephone, in-person and written inquiries. The Business
Operations Unit reviews and examines all business taxes.
The Electronic Services and Registration Unit manages
the Georgia Tax Center system and maintains a
registration system for all taxpayers.
9
Organization
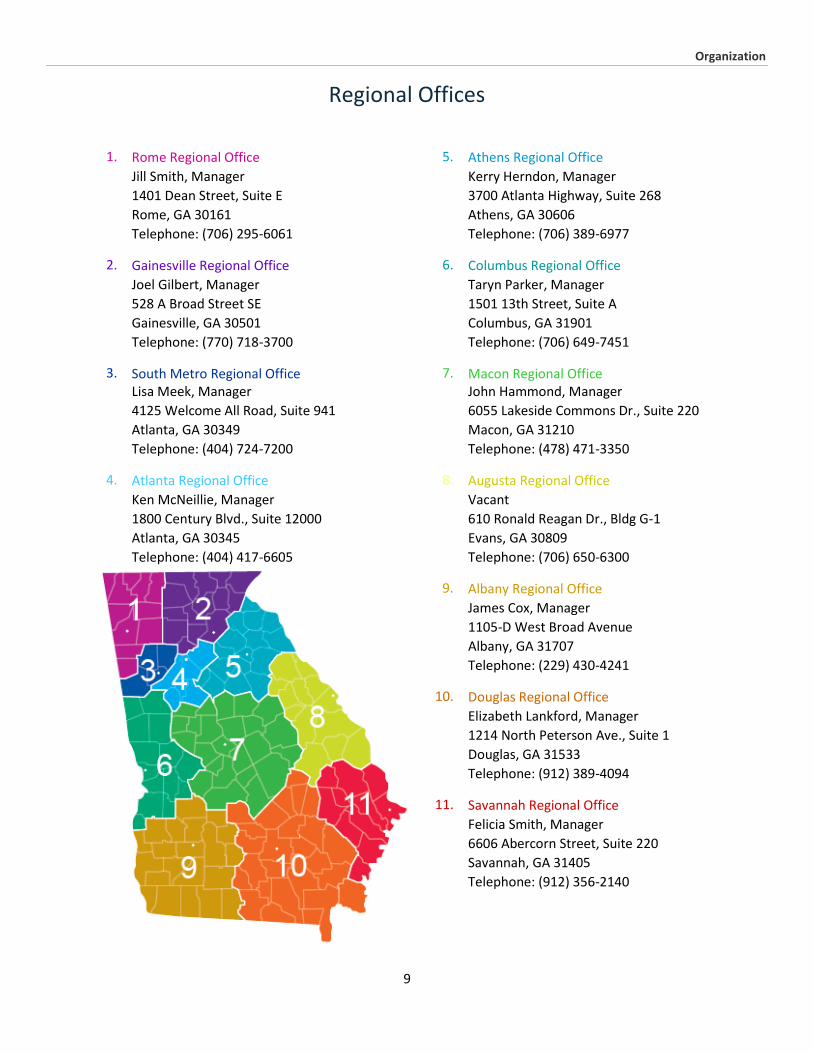
Regional Offices
1. Rome Regional Office 5. Athens Regional Office
Jill Smith, Manager Kerry Herndon, Manager
1401 Dean Street, Suite E 3700 Atlanta Highway, Suite 268
Rome, GA 30161 Athens, GA 30606
Telephone: (706) 295-6061 Telephone: (706) 389-6977 2. Gainesville Regional Office 6. Columbus Regional Office
Joel Gilbert, Manager Taryn Parker, Manager
528 A Broad Street SE 1501 13th Street, Suite A
Gainesville, GA 30501 Columbus, GA 31901
Telephone: (770) 718-3700 Telephone: (706) 649-7451 3. South Metro Regional Office 7. Macon Regional Office Lisa Meek, Manager John Hammond, Manager
4125 Welcome All Road, Suite 941 6055 Lakeside Commons Dr., Suite 220
Atlanta, GA 30349 Macon, GA 31210
Telephone: (404) 724-7200 Telephone: (478) 471-3350 4. Atlanta Regional Office 8. Augusta Regional Office
Ken McNeillie, Manager Vacant
1800 Century Blvd., Suite 12000 610 Ronald Reagan Dr., Bldg G-1
Atlanta, GA 30345 Evans, GA 30809
Telephone: (404) 417-6605 Telephone: (706) 650-6300 9. Albany Regional Office
James Cox, Manager
1105-D West Broad Avenue
Albany, GA 31707
Telephone: (229) 430-4241
10. Douglas Regional Office
Elizabeth Lankford, Manager
1214 North Peterson Ave., Suite 1
Douglas, GA 31533
Telephone: (912) 389-4094 11. Savannah Regional Office
Felicia Smith, Manager
6606 Abercorn Street, Suite 220
Savannah, GA 31405
Telephone: (912) 356-2140

10
Tax Data
Revenue Collections
Net collections by the Georgia Department of Revenue (DOR) for Fiscal Year 2015 totaled nearly $19,028,524,124. This
represents an increase of $1,145,240,507 or 6.4 percent over Fiscal Year 2014. Leading all categories in the percentage of
collection was the Personal Income Tax category. The category total of $9,677,987,511 accounted for over 50 percent of
net revenue collections and represented an increase of $711,862,258 or 7.9 percent.
Fiscal Year 2015 Net Revenue Collections
Revenue
(Thousands) Tax Type
Property Tax $ 26,799
Miscellaneous $ 295,280
Alcohol Beverages Tax $ 184,374
Tobacco Tax $ 215,055
Motor Vehicle - Tag, Title and Fees $ 1,166,107
Pre-Paid Motor Fuel Sales Tax $ 564,237
Motor Fuel Excise Tax $ 457,185
Corporate Tax $ 1,000,087
Sales and Use Tax $ 5,441,413
Income Tax - Individual $ 9,677,987
Net Tax Collections / Other Revenues $ 19,028,524
Source: Finance Department, Georgia Department of Revenue
Other Taxes1.7%
Alcohol and Tobacco Tax2.1%
Motor Vehicle Fees6.1%
Motor Fuel Tax5.4%
Corporate Tax5.3%
Sales and Use Tax28.6%
Income Tax -Individual
50.9%

11
Tax Data
Net Revenue Collections by Month (Thousands)
FY2011 FY2012 FY2013 FY2014 FY2015
Fiscal Year Collections
Total $ 15,310,413 $ 16,052,536 $ 17,003,992 $ 17,883,284 $ 19,082,524
Monthly Collections
July $ 1,147,262 $ 1,230,984 $ 1,321,912 $ 1,410,372 $ 1,488,362
August $ 1,185,849 $ 1,293,779 $ 1,318,415 $ 1,345,305 $ 1,392,354
September $ 1,449,813 $ 1,530,424 $ 1,589,941 $ 1,721,942 $ 1,808,258
October $ 1,233,074 $ 1,300,052 $ 1,384,502 $ 1,466,329 $ 1,553,424
November $ 1,268,524 $ 1,356,812 $ 1,347,711 $ 1,396,580 $ 1,457,007
December $ 1,555,061 $ 1,536,217 $ 1,686,823 $ 1,750,878 $ 1,908,880
January $ 1,555,438 $ 1,566,803 $ 1,729,442 $ 1,805,755 $ 1,859,640
February $ 715,277 $ 765,206 $ 796,107 $ 838,079 $ 943,666
March $ 1,105,278 $ 1,160,222 $ 1,172,846 $ 1,317,315 $ 1,435,764
April $ 1,375,573 $ 1,527,561 $ 1,728,750 $ 1,678,612 $ 1,930,617
May $ 1,215,773 $ 1,241,816 $ 1,348,139 $ 1,390,410 $ 1,433,691
June $ 1,503,491 $ 1,542,660 $ 1,579,404 $ 1,761,707 $ 1,816,861
Source: Finance Department, Georgia Department of Revenue
Fiscal Year 2015 Refunds by Month
Month Individual Corporate Sales Taxes
Refunds (Thousands)
Number of Refunds
Refunds (Thousands)
Number of Refunds
Refunds (Thousands)
Number of Refunds July $ 62,853 79,286 $ 5,944 206 $ 2,947 77
August $ 55,381 50,121 $ 15,737 547 $ 8,238 532
September $ 35,659 32,822 $ 16,356 763 $ 5,621 329
October $ 118,576 78,368 $ 31,594 2,676 $ 7,814 499
November $ 33,383 16,466 $ 27,553 841 $ 8,583 343
December $ 41,043 46,748 $ 13,612 313 $ 5,437 229
January $ 59,998 79,084 $ 15,177 226 $ 3,524 109
February $ 625,168 1,100,805 $ 19,196 520 $ 10,511 792
March $ 516,658 701,229 $ 14,669 541 $ 10,019 308
April $ 618,880 754,519 $ 7,289 800 $ 12,968 266
May $ 141,258 157,682 $ 9,230 484 $ 9,395 254
June $ 81,558 91,876 $ 6,474 519 $ 6,952 364
Grand Total $ 2,390,415 3,189,006 $ 182,831 8,436 $ 92,009 4,102
Source: Finance Department, Georgia Department of Revenue
12
Tax Data
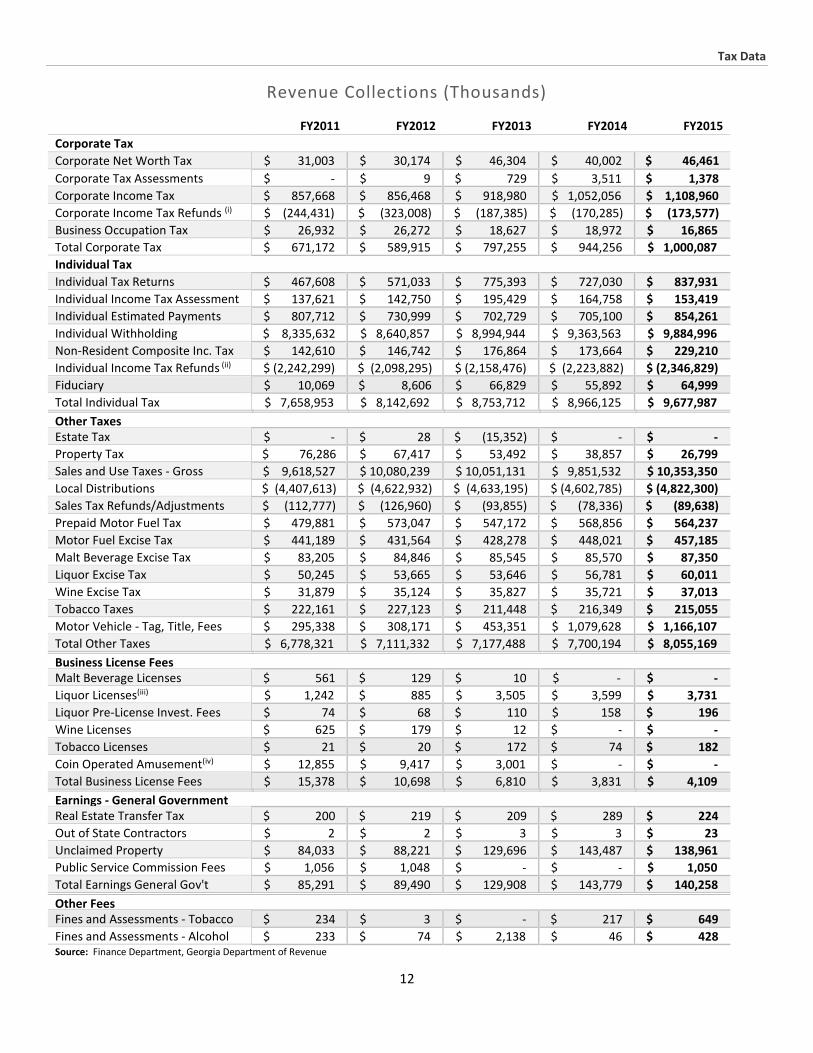
Revenue Collections (Thousands)
FY2011 FY2012 FY2013 FY2014 FY2015
Corporate Tax
Corporate Net Worth Tax $ 31,003 $ 30,174 $ 46,304 $ 40,002 $ 46,461
Corporate Tax Assessments $ - $ 9 $ 729 $ 3,511 $ 1,378
Corporate Income Tax $ 857,668 $ 856,468 $ 918,980 $ 1,052,056 $ 1,108,960
Corporate Income Tax Refunds (i) $ (244,431) $ (323,008) $ (187,385) $ (170,285) $ (173,577)
Business Occupation Tax $ 26,932 $ 26,272 $ 18,627 $ 18,972 $ 16,865
Total Corporate Tax $ 671,172 $ 589,915 $ 797,255 $ 944,256 $ 1,000,087
Individual Tax
Individual Tax Returns $ 467,608 $ 571,033 $ 775,393 $ 727,030 $ 837,931
Individual Income Tax Assessment $ 137,621 $ 142,750 $ 195,429 $ 164,758 $ 153,419
Individual Estimated Payments $ 807,712 $ 730,999 $ 702,729 $ 705,100 $ 854,261
Individual Withholding $ 8,335,632 $ 8,640,857 $ 8,994,944 $ 9,363,563 $ 9,884,996
Non-Resident Composite Inc. Tax $ 142,610 $ 146,742 $ 176,864 $ 173,664 $ 229,210
Individual Income Tax Refunds (ii) $ (2,242,299) $ (2,098,295) $ (2,158,476) $ (2,223,882) $ (2,346,829)
Fiduciary $ 10,069 $ 8,606 $ 66,829 $ 55,892 $ 64,999
Total Individual Tax $ 7,658,953 $ 8,142,692 $ 8,753,712 $ 8,966,125 $ 9,677,987
Other Taxes Estate Tax $ - $ 28 $ (15,352) $ - $ -
Property Tax $ 76,286 $ 67,417 $ 53,492 $ 38,857 $ 26,799
Sales and Use Taxes - Gross $ 9,618,527 $ 10,080,239 $ 10,051,131 $ 9,851,532 $ 10,353,350
Local Distributions $ (4,407,613) $ (4,622,932) $ (4,633,195) $ (4,602,785) $ (4,822,300)
Sales Tax Refunds/Adjustments $ (112,777) $ (126,960) $ (93,855) $ (78,336) $ (89,638)
Prepaid Motor Fuel Tax $ 479,881 $ 573,047 $ 547,172 $ 568,856 $ 564,237
Motor Fuel Excise Tax $ 441,189 $ 431,564 $ 428,278 $ 448,021 $ 457,185
Malt Beverage Excise Tax $ 83,205 $ 84,846 $ 85,545 $ 85,570 $ 87,350
Liquor Excise Tax $ 50,245 $ 53,665 $ 53,646 $ 56,781 $ 60,011
Wine Excise Tax $ 31,879 $ 35,124 $ 35,827 $ 35,721 $ 37,013
Tobacco Taxes $ 222,161 $ 227,123 $ 211,448 $ 216,349 $ 215,055
Motor Vehicle - Tag, Title, Fees $ 295,338 $ 308,171 $ 453,351 $ 1,079,628 $ 1,166,107
Total Other Taxes $ 6,778,321 $ 7,111,332 $ 7,177,488 $ 7,700,194 $ 8,055,169
Business License Fees Malt Beverage Licenses $ 561 $ 129 $ 10 $ - $ -
Liquor Licenses(iii) $ 1,242 $ 885 $ 3,505 $ 3,599 $ 3,731
Liquor Pre-License Invest. Fees $ 74 $ 68 $ 110 $ 158 $ 196
Wine Licenses $ 625 $ 179 $ 12 $ - $ -
Tobacco Licenses $ 21 $ 20 $ 172 $ 74 $ 182
Coin Operated Amusement(iv) $ 12,855 $ 9,417 $ 3,001 $ - $ -
Total Business License Fees $ 15,378 $ 10,698 $ 6,810 $ 3,831 $ 4,109
Earnings - General Government Real Estate Transfer Tax $ 200 $ 219 $ 209 $ 289 $ 224
Out of State Contractors $ 2 $ 2 $ 3 $ 3 $ 23
Unclaimed Property $ 84,033 $ 88,221 $ 129,696 $ 143,487 $ 138,961
Public Service Commission Fees $ 1,056 $ 1,048 $ - $ - $ 1,050
Total Earnings General Gov't $ 85,291 $ 89,490 $ 129,908 $ 143,779 $ 140,258
Other Fees Fines and Assessments - Tobacco $ 234 $ 3 $ - $ 217 $ 649
Fines and Assessments - Alcohol $ 233 $ 74 $ 2,138 $ 46 $ 428 Source: Finance Department, Georgia Department of Revenue

13
Tax Data
Revenue Collections (Continued)
FY2011 FY2012 FY2013 FY2014 FY2015
Forfeitures - Alcohol and Tobacco $ 636 $ - $ - $ - $ -
Motor Vehicle Licenses / Permits $ 2,099 $ 4,096 $ 221 $ 468 $ 327
Penalties and Interest - Property $ 538 $ 465 $ - $ - $ -
Penalties and Interest - FiFa $ 15,154 $ 5,153 $ (3,350) $ 6 $ 84
Penalties & Interest - Individual $ 73,378 $ 68,773 $ 77,081 $ 83,637 $ 76,258
Penalties & Interest - Sales & Use $ 47,832 $ 53,318 $ 45,086 $ 39,314 $ 39,462
Penalties & Interest - Corporate $ 7,883 $ 6,891 $ 10,465 $ 11,396 $ 22,285
Penalties and Interest - Motor Fuel $ 92 $ 683 $ 3,022 $ 1,685 $ 3,331
Penalties and Interest - Alcohol $ 53 $ 30 $ 32 $ 43 $ 75
Penalties and Interest - Cigarette $ 35 $ 74 $ 76 $ 252 $ 219
Delinquent Tax Collections Fees $ (11,974) $ (16,965) $ (21,909) $ (504) $ -
Unallocated Tax $ (33,647) $ (16,622) $ 29,109 $ (7,997) $ 7,769
Unallocated Fees $ 1,673 $ 2,436 $ 8 $ 1 $ -
Other $ (2,921) $ - $ (3,160) $ (3,465) $ 27
Total Other Fees $ 101,298 $ 108,409 $ 138,819 $ 125,099 $ 150,914
Total Taxes Corporate Tax $ 671,172 $ 589,915 $ 797,255 $ 944,256 $ 1,000,087
Individual Tax $ 7,658,953 $ 8,142,692 $ 8,753,712 $ 8,966,125 $ 9,677,987
Other Taxes $ 6,778,321 $ 7,111,332 $ 7,177,488 $ 7,700,194 $ 8,055,169
Total Taxes $ 15,108,446 $ 15,843,939 $ 16,728,455 $ 17,610,575 $ 18,733,243
Total Funds and Other Fees Business License Fees $ 15,378 $ 10,698 $ 6,810 $ 3,831 $ 4,109
Earnings - General Government $ 85,291 $ 89,490 $ 129,908 $ 143,779 $ 140,258
Other Fees $ 101,298 $ 108,409 $ 138,819 $ 125,099 $ 150,914
Total Funds and Other Fees $ 201,967 $ 208,597 $ 275,537 $ 272,709 $ 295,281
Total Revenue Collections Total Revenue Collections $ 15,310,413 $ 16,052,536 $ 17,003,992 $ 17,883,284 $ 19,028,524
Note: (i) Corporate income tax refunds include voided corporate refunds.
(ii) Individual income tax refunds include voided individual refunds.
(iii) Beginning in FY2012, malt beverage and liquor licenses are all recorded in the liquor licenses category.
(iv) Coin operated amusement machine funds are collected by Georgia Lottery as of FY2013. (iv) Unclaimed property and liquor pre-license investigation fees have been shifted to reflect more accurate representation. Thus category totals will vary from previous years reporting.
Source: Finance Department, Georgia Department of Revenue

14
Tax Data
Corporate Income Tax
Corporation Income Tax Returns by Taxable Income Class
Calendar Year 2014 Georgia Corporation Income Tax Returns by Taxable Income Class
Taxable Income Class
Number of Returns
Percent of Returns
Georgia Net Taxable Income (i)
Percent of Net Taxable Income
$0 or Less 200,736 93.05%
$1 - $5,000 4,505 2.09% $ 7,764,758 0.13%
$5,000 - $10,000 1,699 0.79% $ 12,409,550 0.21%
$10,000 - $25,000 2,591 1.20% $ 42,376,783 0.73%
$25,000 - $50,000 2,024 0.94% $ 72,530,903 1.25%
$50,000 - $100,000 1,491 0.69% $ 106,012,796 1.83%
$100,000 - $250,000 1,108 0.51% $ 176,555,819 3.05%
$250,000 - $500,000 562 0.26% $ 198,192,027 3.43%
$500,000 - $1,000,000 418 0.19% $ 296,836,078 5.13%
Over $1,000,000 602 0.28% $ 4,868,185,389 84.21%
Total 215,736 100.00% $ 5,780,864,103 100.00%
Calendar Year 2014 Out of State Corporation Income Tax Returns by Taxable Income Class
Taxable Income Class
Number of Returns
Percent of Returns
Georgia Net Taxable Income (i)
Percent of Net Taxable Income
$0 or Less 35,588 76.64%
$1 - $5,000 2,653 5.71% $ 4,333,347 0.04%
$5,000 - $10,000 808 1.74% $ 5,908,528 0.06%
$10,000 - $25,000 1,316 2.83% $ 22,018,672 0.22%
$25,000 - $50,000 971 2.09% $ 34,890,396 0.34%
$50,000 - $100,000 1,026 2.21% $ 75,056,725 0.73%
$100,000 - $250,000 1,303 2.81% $ 212,343,035 2.08%
$250,000 - $500,000 852 1.83% $ 300,821,965 2.95%
$500,000 - $1,000,000 666 1.43% $ 475,579,585 4.66%
Over $1,000,000 1,255 2.70% $ 9,081,302,266 88.93%
Total 46,438 100.00% $ 10,212,254,519 100.00%
Calendar Year 2014 Corporation Income Tax Returns by Taxable Income Class
Taxable Income Class
Number of Returns
Percent of Returns
Georgia Net Taxable Income (i)
Percent of Net Taxable Income
$0 or Less 236,324 90.14%
$1 - $5,000 7,158 2.73% $ 12,098,105 0.08%
$5,000 - $10,000 2,507 0.96% $ 18,318,078 0.11%
$10,000 - $25,000 3,907 1.49% $ 64,395,455 0.40%
$25,000 - $50,000 2,995 1.14% $ 107,421,299 0.67%
$50,000 - $100,000 2,517 0.96% $ 181,069,521 1.13%
$100,000 - $250,000 2,411 0.92% $ 388,898,854 2.43%
$250,000 - $500,000 1,414 0.54% $ 499,013,992 3.12%
$500,000 - $1,000,000 1,084 0.41% $ 772,415,663 4.83%
Over $1,000,000 1,857 0.71% $ 13,949,487,655 87.22%
Total 262,174 100.00% $ 15,993,118,622 100.00%
Note: (i) S-Corporations: report only includes income taxed at the S-Corporation level. Does not include income to the shareholders.

15
Tax Data
Corporation Income Tax Returns by Taxable Income Class
Calendar Year 2015 Georgia Corporation Income Tax Returns by Taxable Income Class
Taxable Income Class
Number of Returns
Percent of Returns
Georgia Net Taxable Income (i)
Percent of Net Taxable Income
$0 or Less 202,536 93.08%
$1 - $5,000 4,490 2.06% $ 7,713,918 0.14%
$5,000 - $10,000 1,701 0.78% $ 12,475,335 0.23%
$10,000 - $25,000 2,612 1.20% $ 42,785,420 0.79%
$25,000 - $50,000 2,056 0.94% $ 74,428,173 1.37%
$50,000 - $100,000 1,569 0.72% $ 110,470,387 2.04%
$100,000 - $250,000 1,109 0.51% $ 172,682,699 3.19%
$250,000 - $500,000 584 0.27% $ 206,492,036 3.81%
$500,000 - $1,000,000 380 0.17% $ 265,868,405 4.91%
Over $1,000,000 564 0.26% $ 4,522,281,254 83.51%
Total 217,601 100.00% $ 5,415,197,627 100.00%
Calendar Year 2015 Out of State Corporation Income Tax Returns by Taxable Income Class
Taxable Income Class
Number of Returns
Percent of Returns
Georgia Net Taxable Income (i)
Percent of Net Taxable Income
$0 or Less 36,721 76.57%
$1 - $5,000 2,744 5.72% $ 4,465,412 0.04%
$5,000 - $10,000 919 1.92% $ 6,753,286 0.07%
$10,000 - $25,000 1,352 2.82% $ 22,232,101 0.21%
$25,000 - $50,000 1,059 2.21% $ 38,228,172 0.37%
$50,000 - $100,000 1,059 2.21% $ 76,363,457 0.74%
$100,000 - $250,000 1,272 2.65% $ 207,242,922 2.00%
$250,000 - $500,000 877 1.83% $ 312,357,996 3.01%
$500,000 - $1,000,000 732 1.53% $ 529,830,973 5.10%
Over $1,000,000 1,224 2.55% $ 9,189,484,266 88.47%
Total 47,959 100.00% $ 10,386,958,585 100.00%
Calendar Year 2015 Corporation Income Tax Returns by Taxable Income Class
Taxable Income Class
Number of Returns
Percent of Returns
Georgia Net Taxable Income (i)
Percent of Net Taxable Income
$0 or Less 239,257 90.10%
$1 - $5,000 7,234 2.72% $ 12,179,330 0.08%
$5,000 - $10,000 2,620 0.99% $ 19,228,621 0.12%
$10,000 - $25,000 3,964 1.49% $ 65,017,521 0.41%
$25,000 - $50,000 3,115 1.17% $ 112,656,345 0.71%
$50,000 - $100,000 2,628 0.99% $ 186,833,844 1.18%
$100,000 - $250,000 2,381 0.90% $ 379,925,621 2.40%
$250,000 - $500,000 1,461 0.55% $ 518,850,032 3.28%
$500,000 - $1,000,000 1,112 0.42% $ 795,699,378 5.04%
Over $1,000,000 1,788 0.67% $ 13,711,765,520 86.77%
Total 265,560 100.00% $ 15,802,156,212 100.00%
Note: (i) S-Corporations: report only includes income taxed at the S-Corporation level. Does not include income to the shareholders. (ii) In order to provide the most recent data, two years of reporting data has been included in the current version of the statistical report.
Source: Information Technology Division, Georgia Department of Revenue

16
Tax Data
Corporate Tax Collections and Returns Processed
Note: CY2011 represents fiscal year processing figures. Figures represent returns processed in particular year and do not relate to tax periods. Source: Processing Center and Finance Department, Georgia Department of Revenue
Individual Income Tax
Individual Income Tax Collections and Returns Processed
Note: Returns processed includes amended returns. Figures represent returns processed in particular year and do not relate to tax periods. Source: Processing Center and Finance Department, Georgia Department of Revenue
CY2011 CY2012 CY2013 CY2014 CY2015
180
271 268 274 276
Corporate Tax Returns (Thousands)
CY2011 CY2012 CY2013 CY2014 CY2015
$626 $669
$889 $965
$1,010
Corporate Tax Net Collections (Millions)
CY2011 CY2012 CY2013 CY2014 CY2015
4,404 4,576
4,357 4,252 4,549
Number of Individual Returns Processed (Thousands)
CY2011 CY2012 CY2013 CY2014 CY2015
$7,952 $8,380 $8,879 $9,305
$10,006
Net Individual Income Tax Collections (Millions)
17
Tax Data
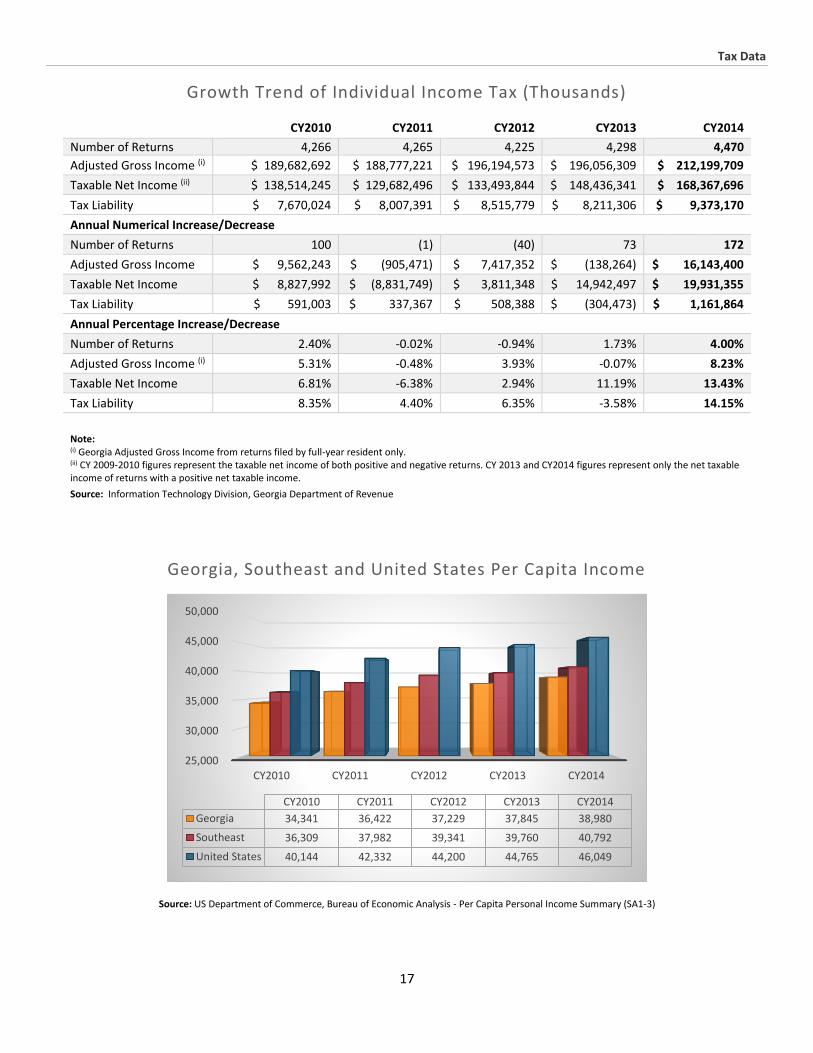
Growth Trend of Individual Income Tax (Thousands)
CY2010 CY2011 CY2012 CY2013 CY2014
Number of Returns 4,266 4,265 4,225 4,298 4,470
Adjusted Gross Income (i) $ 189,682,692 $ 188,777,221 $ 196,194,573 $ 196,056,309 $ 212,199,709
Taxable Net Income (ii) $ 138,514,245 $ 129,682,496 $ 133,493,844 $ 148,436,341 $ 168,367,696
Tax Liability $ 7,670,024 $ 8,007,391 $ 8,515,779 $ 8,211,306 $ 9,373,170
Annual Numerical Increase/Decrease
Number of Returns 100 (1) (40) 73 172
Adjusted Gross Income $ 9,562,243 $ (905,471) $ 7,417,352 $ (138,264) $ 16,143,400
Taxable Net Income $ 8,827,992 $ (8,831,749) $ 3,811,348 $ 14,942,497 $ 19,931,355
Tax Liability $ 591,003 $ 337,367 $ 508,388 $ (304,473) $ 1,161,864
Annual Percentage Increase/Decrease
Number of Returns 2.40% -0.02% -0.94% 1.73% 4.00%
Adjusted Gross Income (i) 5.31% -0.48% 3.93% -0.07% 8.23%
Taxable Net Income 6.81% -6.38% 2.94% 11.19% 13.43%
Tax Liability 8.35% 4.40% 6.35% -3.58% 14.15%
Note: (i) Georgia Adjusted Gross Income from returns filed by full-year resident only. (ii) CY 2009-2010 figures represent the taxable net income of both positive and negative returns. CY 2013 and CY2014 figures represent only the net taxable income of returns with a positive net taxable income.
Source: Information Technology Division, Georgia Department of Revenue
Georgia, Southeast and United States Per Capita Income
Source: US Department of Commerce, Bureau of Economic Analysis - Per Capita Personal Income Summary (SA1-3)
25,000
30,000
35,000
40,000
45,000
50,000
CY2010 CY2011 CY2012 CY2013 CY2014
CY2010 CY2011 CY2012 CY2013 CY2014
Georgia 34,341 36,422 37,229 37,845 38,980
Southeast 36,309 37,982 39,341 39,760 40,792
United States 40,144 42,332 44,200 44,765 46,049

18
Tax Data
Trends in Individual Income and State Income Tax Receipts
CY2011 CY2012 CY2013 CY2014 CY2015
Total Individual Personal Income (i)
Amount (Millions) $ 356,836 $ 371,488 $ 378,156 $ 393,594 $ 411,361
Change from Prior Year (%) 6.95% 4.11% 1.79% 4.08% 4.51%
Individual Income Tax Receipts
Net Amount (Millions) $ 7,952 $ 8,380 $ 8,879 $ 9,305 $ 10,006
Change from Prior Year (%) 8.59% 5.38% 5.95% 4.80% 7.53%
Income Elasticity Ratio (ii)
Income Elasticity Ratio 1.24 1.31 3.32 1.18 1.67 Note: (i) Individual Income amounts are calculated each quarter, then averaged together to produce a seasonally adjusted yearly average; all years shown are four-quarter averages, whereas CY2015 is an average of the first 3 quarters of 2015.
(ii) Ratio of the percentage change in tax receipts to the percentage change in personal income. Measures the sensitivity of individual income tax revenue to changes in total individual personal income. A ratio of 1.0 would indicate an identical rate of change for income and tax yield
Source: Finance Department, Georgia Department of Revenue and United States Department of Commerce, Bureau of Economic Analysis (BEA)
Calendar Year 2015 Electronic Filing versus Paper Returns (Thousands)
Filing Type Individual
Income Tax Withholding
Tax Corporate
Tax Sales and Use Tax
Total Returns
E-filing 3,840 1,062 206 1,191 6,299
Paper returns 709 142 70 56 977
Total 4,549 1,204 276 1,247 7,276
Note: Individual Income Tax includes amended returns. Figures represent returns processed in particular year and do not relate to tax periods. Source: Information Technology Division, Georgia Department of Revenue
Tax Returns Processed (Thousands)
CY2011 CY2012 CY2013 CY2014 CY2015
Individual Income Tax 4,348 4,442 4,288 4,184 4,484
Individual Amended Tax 56 134 69 68 65
Withholding Tax 1,038 1,109 1,090 1,114 1,204
Corporate Tax 180 280 309 274 276
Sales and Use Tax 1,591 1,325 1,289 1,305 1,247
Total of all Tax Types 7,213 7,290 7,045 6,945 7,276
Source: Information Technology Division, Georgia Department of Revenue

19
Tax Data
Calendar Year 2014 Individual Income Tax by Income Class
Georgia AGI
Number of
Returns
Percent of Total Returns
Net Taxable Income
Percent of
Net Taxable Income
Average Net
Taxable Income
Total Tax
Returns with no
Net Taxable Income
Average Tax
Liability
Over Million 8,199 0.2% $19,554,967,465 11.6% $2,385,043 $1,171,240,844 9 $142,852
Over 500,000 18,049 0.4% $10,430,879,971 6.2% $577,920 $621,296,758 18 $34,423
Over 100,000 472,319 10.6% $62,807,697,298 37.3% $132,977 $3,650,226,024 530 $7,728
Over 50,000 709,792 15.9% $35,627,211,793 21.2% $50,194 $1,970,806,626 3,075 $2,777
Over 30,000 658,205 14.7% $16,606,268,536 9.9% $25,230 $852,046,016 11,903 $1,294
Over 25,000 242,719 5.4% $3,917,160,318 2.3% $16,139 $183,766,917 8,654 $757
Over 20,000 278,862 6.2% $3,386,351,640 2.0% $12,143 $147,266,904 14,741 $528
Over 15,000 324,582 7.3% $2,594,500,780 1.5% $7,993 $98,862,424 27,818 $305
Over 14,000 75,689 1.7% $406,916,037 0.2% $5,376 $13,607,789 7,817 $180
Over 13,000 82,117 1.8% $372,774,234 0.2% $4,540 $11,757,335 14,405 $143
Over 12,000 69,721 1.6% $309,344,580 0.2% $4,437 $9,487,337 11,490 $136
Over 11,000 69,272 1.5% $271,019,069 0.2% $3,912 $7,768,309 11,275 $112
Over 10,000 73,550 1.6% $236,860,238 0.1% $3,220 $6,104,776 18,233 $83
Over 9,000 89,751 2.0% $220,518,561 0.1% $2,457 $4,909,649 18,768 $55
Over 8,000 64,236 1.4% $139,095,653 0.1% $2,165 $2,900,409 14,740 $45
Over 7,000 61,936 1.4% $98,750,072 0.1% $1,594 $1,768,415 21,512 $29
Over 6,000 62,227 1.4% $62,527,158 0.0% $1,005 $917,234 19,444 $15
Over 5,000 60,449 1.4% $21,087,399 0.0% $349 $206,388 18,928 $3
Over 4,000 58,845 1.3% $108,923 0.0% $2 $1,659 58,722 $-
Over 3,000 57,861 1.3% $48,174 0.0% $1 $530 57,784 $-
Over 2,000 56,986 1.3% $1,226 0.0% $- $131 56,973 $-
Over 1,000 53,736 1.2% $- 0.0% $- $26 53,736 $-
Under 1,000 388,051 8.7% $- 0.0% $- $432 388,051 $-
NonRes/Partial 433,551 9.7% $11,303,606,868 6.7% $26,072 $618,226,939 102,484 $1,426
Totals 4,470,70
5
100.0% $168,367,695,993 100.0% $37,660 $9,373,169,871 941,110 $2,097
Note: Figures in this table represent return received in CY 2015. However, the majority of tax liability reflected in for Calendar Year 2015.
Source: Information Technology Division, Georgia Department of Revenue
Sales and Use Tax
Comparison of Sales Tax Collected and Distributed (Millions)
FY2011 FY2012 FY2013 FY2014 FY2015
Net State Collection $ 5,098 $ 5,330 $ 5,324 $ 5,170 $ 5,441
Change from Prior Year (%) 6.68% 4.55% -0.11% -2.89% 5.24%
Local Distributions $ 4,408 $ 4,623 $ 4,633 $ 4,603 $ 4,822
Change from Prior Year (%) 1.17% 4.88% 0.22% -0.65% 4.76%
Total Sales Tax $ 9,506 $ 9,953 $ 9,957 $ 9,773 $ 10,263
Change from Prior Year (%) 4.05% 4.70% 0.04% -1.85% 5.01% Note: The passage of HB 266 (Title Ad Valorem Tax) led to the shifting of tax revenue and explains the reduced sales tax collections in FY2013 and FY2014.
Source: Finance Department, Georgia Department of Revenue

20
Tax Data
Net Sales and Use Tax Collections by Month (Thousands)
FY2011 FY2012 FY2013 FY2014 FY2015
July $ 451,419 $ 446,480 $ 460,311 $ 430,087 $ 455,541
August $ 419,042 $ 433,382 $ 446,798 $ 407,914 $ 442,131
September $ 412,019 $ 441,071 $ 459,625 $ 421,407 $ 445,601
October $ 427,288 $ 437,184 $ 439,250 $ 417,435 $ 450,873
November $ 393,109 $ 451,249 $ 435,061 $ 423,373 $ 437,839
December $ 374,128 $ 402,060 $ 440,766 $ 414,384 $ 431,043
January $ 502,244 $ 518,348 $ 518,821 $ 498,712 $ 544,341
February $ 374,721 $ 412,184 $ 446,312 $ 392,862 $ 409,300
March $ 413,137 $ 428,282 $ 427,402 $ 416,956 $ 416,010
April $ 460,253 $ 482,423 $ 416,813 $ 469,713 $ 504,343
May $ 431,970 $ 448,739 $ 418,386 $ 428,801 $ 442,982
June $ 438,807 $ 428,945 $ 414,536 $ 448,767 $ 461,408
Total $ 5,098,137 $ 5,330,347 $ 5,324,081 $ 5,170,411 $ 5,441,412
Source: Finance Department, Georgia Department of Revenue
Sales and Use Tax Revenues by Business Group (Thousands)
FY2011 FY2012 FY2013 FY2014 FY2015
Accommodations $ 201,754 $ 208,044 $ 221,696 $ 239,002 $ 269,134
Car & Automotive $ 924,001 $ 1,020,368 $ 877,563 $ 283,772 $ 300,091
Construction $ 49,459 $ 60,352 $ 62,041 $ 69,314 $ 79,158
Food & Grocery $ 1,472,134 $ 1,562,526 $ 1,643,849 $ 1,746,942 $ 1,890,152
General Merchandise $ 1,359,914 $ 1,396,157 $ 1,433,731 $ 1,485,867 $ 1,558,718
Home Furnishings $ 685,867 $ 699,906 $ 710,159 $ 767,792 $ 819,792
Manufacturing $ 514,814 $ 538,874 $ 534,055 $ 555,161 $ 605,656
Miscellaneous Services $ 923,651 $ 932,264 $ 990,159 $ 1,052,854 $ 1,116,512
Other Retail $ 1,118,443 $ 1,169,833 $ 1,158,049 $ 1,239,132 $ 1,308,779
Other Services $ 518,969 $ 560,363 $ 511,939 $ 461,314 $ 245,015
Utilities $ 1,039,326 $ 1,006,630 $ 974,826 $ 980,271 $ 991,603
Wholesale $ 810,195 $ 924,923 $ 933,064 $ 970,112 $ 998,342
Total $ 9,618,527 $ 10,080,240 $ 10,051,131 $ 9,567,761 $ 10,182,952
Note: The passage of HB 266 to implement a Title ad Valorem Tax (TAVT) on the purchase of new and used automobiles has led to the shifting of tax revenue out of Sales Tax and explains the large decrease in the Car & Automotive category from FY2013 to FY2014.
Source: Information Technology Division and Finance Department, Georgia Department of Revenue

21
Tax Data
Local Government
Two Calendar Year Economic Indicators by County
County
2014 County Local Sales Tax Distribution
2014 Net Property and Utility Digest
County
2014 County Local Sales Tax Distribution
2014 Net Property and Utility Digest
Thousands Rank Thousands Rank Thousands Rank Thousands Rank
Appling $15,141 54 $754,902 67 Dade $6,629 93 $387,785 99
Atkinson $1,973 135 $135,217 147 Dawson $20,064 45 $1,011,434 55
Bacon $3,760 116 $228,723 129 Decatur $12,268 65 $748,568 68
Baker $427 157 $126,081 148 DeKalb $334,264 2 $20,043,106 4
Baldwin $19,184 47 $945,852 57 Dodge $7,239 90 $367,594 104
Banks $9,421 84 $474,273 90 Dooly $5,028 102 $269,100 120
Barrow $28,537 36 $1,429,650 37 Dougherty $47,142 22 $1,798,846 31
Bartow $61,690 20 $2,695,232 23 Douglas $73,397 14 $3,195,351 19
Ben Hill $6,443 95 $334,515 109 Early $4,194 110 $371,745 102
Berrien $4,020 113 $303,947 115 Echols $325 158 $107,461 151
Bibb $90,184 11 $3,819,930 15 Effingham $23,835 39 $1,451,163 36
Bleckley $4,085 112 $235,396 125 Elbert $5,549 97 $449,504 92
Brantley $3,327 118 $297,348 116 Emanuel $9,559 82 $420,862 95
Brooks $2,855 122 $370,132 103 Evans $4,518 107 $224,897 130
Bryan $16,970 50 $1,161,903 52 Fannin $13,387 59 $1,206,753 46
Bulloch $31,515 31 $1,659,481 34 Fayette $42,360 26 $3,716,579 17
Burke $17,166 49 $2,534,955 26 Floyd $42,886 24 $2,779,482 22
Butts $12,074 66 $512,448 85 Forsyth $103,466 9 $8,023,859 6
Calhoun $1,201 150 $109,706 150 Franklin $10,065 75 $494,551 88
Camden $21,837 41 $1,268,057 44 Fulton $768,734 1 $48,254,428 1
Candler $4,785 104 $214,679 132 Gilmer $11,464 68 $960,951 56
Carroll $48,514 21 $2,256,750 27 Glascock $592 155 $78,972 155
Catoosa $28,993 35 $1,385,981 39 Glynn $40,162 27 $3,942,978 14
Charlton $3,229 119 $272,225 118 Gordon $25,639 38 $1,288,030 43
Chatham $202,292 5 $11,162,055 5 Grady $7,355 88 $464,841 91
Chattahoochee $2,780 123 $60,334 158 Greene $10,042 77 $1,177,693 51
Chattooga $7,479 87 $363,892 106 Gwinnett $294,083 3 $25,050,960 3
Cherokee $67,578 15 $6,928,373 7 Habersham $12,392 64 $928,220 58
Clarke $67,071 16 $3,058,315 20 Hall $87,835 12 $5,554,557 8
Clay $828 153 $95,876 154 Hancock $1,697 139 $341,572 108
Clayton $149,832 6 $5,508,743 9 Haralson $10,596 71 $638,592 77
Clinch $1,723 137 $228,934 128 Harris $9,568 81 $1,187,431 49
Cobb $276,533 4 $25,898,179 2 Hart $8,792 85 $776,536 64
Coffee $16,805 51 $760,765 66 Heard $13,248 60 $399,815 96
Colquitt $16,446 52 $823,928 62 Henry $94,571 10 $5,020,354 10
Columbia $76,041 13 $4,466,727 12 Houston $66,652 17 $3,526,666 18
Cook $5,383 98 $306,574 114 Irwin $1,802 136 $207,681 133
Coweta $62,682 19 $3,734,322 16 Jackson $29,403 34 $1,767,738 32
Crawford $1,702 138 $269,657 119 Jasper $2,596 128 $312,412 113
Crisp $14,885 55 $509,601 86 Jeff Davis $7,286 89 $256,967 121
Source: Local Government Services and Information Technology Division, Georgia Department of Revenue

22
Tax Data
Two Economic Indicators by County (Continued)
County
2014 County Local Sales Tax Distribution
2014 Net Property and Utility Digest
County
2014 County Local Sales Tax Distribution
2014 Net Property and Utility Digest
Thousands Rank Thousands Rank Thousands Rank Thousands Rank
Jefferson $6,762 92 $376,899 101 Richmond $148,427 7 $4,328,038 13
Jenkins $2,765 125 $194,329 135 Rockdale $42,608 25 $1,901,943 30
Johnson $2,105 131 $148,793 144 Schley $1,283 149 $102,290 153
Jones $6,012 96 $653,095 74 Screven $3,498 117 $366,916 105
Lamar $4,754 105 $427,222 94 Seminole $2,035 133 $233,831 126
Lanier $1,606 143 $163,621 141 Spalding $22,330 40 $1,199,072 47
Laurens $30,613 32 $1,090,959 53 Stephens $10,045 76 $552,827 80
Lee $9,980 78 $841,027 60 Stewart $1,196 151 $139,770 146
Liberty $20,947 43 $1,179,066 50 Sumter $14,884 56 $675,617 71
Lincoln $2,475 130 $244,342 123 Talbot $1,693 140 $189,381 137
Long $1,475 148 $277,190 117 Taliaferro $292 159 $55,390 159
Lowndes $64,282 18 $2,632,439 25 Tattnall $6,767 91 $384,103 100
Lumpkin $9,536 83 $804,524 63 Taylor $2,976 120 $205,053 134
Macon $4,259 109 $328,889 111 Telfair $4,495 108 $252,251 122
Madison $5,356 99 $552,019 81 Terrell $2,543 129 $237,819 124
Marion $1,613 142 $194,057 136 Thomas $21,221 42 $1,336,818 41
McDuffie $12,798 61 $530,902 84 Tift $26,206 37 $892,951 59
McIntosh $3,904 114 $439,775 93 Toombs $18,588 48 $616,250 78
Meriwether $4,830 103 $505,455 87 Towns $5,193 101 $661,645 73
Miller $1,554 144 $161,461 142 Treutlen $1,526 146 $106,035 152
Mitchell $6,512 94 $534,007 83 Troup $33,055 29 $1,728,586 33
Monroe $12,522 62 $1,361,812 40 Turner $2,649 127 $185,028 138
Montgomery $1,986 134 $173,549 139 Twiggs $1,050 152 $232,478 127
Morgan $10,483 73 $642,892 76 Union $11,216 69 $1,047,960 54
Murray $11,850 67 $738,524 69 Upson $9,856 80 $543,348 82
Muscogee $123,793 8 $4,941,184 11 Walker $15,283 53 $1,190,775 48
Newton $33,044 30 $1,910,852 29 Walton $29,720 33 $1,944,154 28
Oconee $19,410 46 $1,401,074 38 Ware $20,175 44 $649,437 75
Oglethorpe $2,055 132 $349,641 107 Warren $1,619 141 $159,348 143
Paulding $44,863 23 $2,895,648 21 Washington $10,477 74 $664,081 72
Peach $10,585 72 $596,302 79 Wayne $14,595 57 $689,247 70
Pickens $12,517 63 $1,230,665 45 Webster $651 154 $75,258 156
Pierce $5,222 100 $396,661 97 Wheeler $1,499 147 $123,190 149
Pike $2,953 121 $392,787 98 White $10,756 70 $770,068 65
Polk $14,066 58 $826,125 61 Whitfield $35,203 28 $2,657,372 24
Pulaski $2,707 126 $223,690 131 Wilcox $1,529 145 $143,688 145
Putnam $8,398 86 $1,329,917 42 Wilkes $3,886 115 $317,373 112
Quitman $584 156 $67,689 157 Wilkinson $4,086 111 $334,515 109
Rabun $9,872 79 $1,494,716 35 Worth $4,665 106 $476,190 89
Randolph $2,769 124 $166,745 140 Total $4,761,668 $298,700,332
Source: Local Government Services and Information Technology Division, Georgia Department of Revenue

23
Tax Data
Taxable Values and Rates, General Property and Public Utilities
FY2011 FY2012 FY2013 FY2014 FY2015
Net Taxable Values
State Rate (per $1,000 value) 0.25 0.25 0.20 0.15 0.10
Grand Total $ 328,433,850 $ 303,278,456 $ 291,638,396 $ 290,202,340 $ 298,346,499
Public Utilities $ 12,247,352 $ 12,745,600 $ 13,296,436 $ 13,940,371 $ 14,438,856
General Property (Net of Exemptions)
Total $ 316,186,498 $ 290,532,856 $ 278,341,960 $ 276,261,969 $ 283,907,643
Real Property $ 265,713,437 $ 248,310,208 $ 235,100,476 $ 230,679,340 $ 241,153,851
Personal Property $ 50,473,061 $ 42,222,648 $ 43,241,484 $ 45,582,625 $ 42,753,792 Source: Local Government Services Division, Georgia Department of Revenue
Motor Vehicle
Active Registrations for Georgia Specialty Plates
Top Ten Specialty Plates FY2011 FY2012 FY2013 FY2014 FY2015
Wildlife (O.C.G.A. § 40-2-86) 156,660 109,178 82,176 68,206 61,646
Bobwhite Quail (§ 40-2-86) 96,420 67,334 52,920 44,990 42,500
Educators (§ 40-2-86) 39,792 32,832 27,689 24,730 22,731
Hobby Antique (§ 40-2-86) 40,182 28,117 23,409 21,339 19,790
Breast Cancer Awareness (§ 40-2-86) 31,302 25,541 20,958 18,133 16,025
Hummingbird (§ 40-2-86) 35,368 25,631 19,629 16,791 15,632
Wildflower (§ 40-2-86) 36,651 26,757 20,314 16,867 14,597
Golden Labrador Retriever (§ 40-2-86) 23,834 18,588 15,354 13,498 12,036
Certified Firefighter (§ 40-3-86.1) 10,460 9,814 10,268 10,640 11,045
Dog & Cat Sterilization (§ 40-2-86) 24,490 18,452 20,314 12,439 10,861 Source: Motor Vehicle Division, Georgia Department of Revenue
Motor Vehicle Registrations
Number of Motor Vehicle Insurance Notifications, Registrations, Tags and Titles Issued FY2011 FY2012 FY2013 FY2014 FY2015
Registrations Issued 8,581,400 8,686,939 8,785,922 8,933,714 9,136,983
Tags Issued 1,943,324 1,843,323 1,563,322 1,884,228 1,968,145
Titles Issued 2,485,374 2,553,854 2,390,995 2,217,497 2,710,000
Insurance Notifications 1,114,935 1,069,300 1,087,851 1,113,877 1,245,411
Number of Motor Vehicle Registrations Issued by Major Category FY2011 FY2012 FY2013 FY2014 FY2015
Passenger Cars 5,441,975 5,531,795 5,619,161 5,734,501 5,885,471
Motorcycles 199,253 201,206 199,287 199,445 199,796
Trucks 1,860,938 1,854,488 1,851,983 1,858,415 1,880,170
Trailers 1,038,902 1,058,038 1,074,232 1,100,063 1,129,465
Bus 40,148 41,227 41,064 41,079 41,858
Other 184 185 195 211 223
Total 8,581,400 8,686,939 8,785,922 8,933,714 9,136,983
Source: Motor Vehicle Division, Georgia Department of Revenue

24
Tax Data
Alcohol and Tobacco
Tax and Fee Collections by Alcohol and Tobacco Division (Thousands)
FY2011 FY2012 FY2013 FY2014 FY2015
Delinquent Tax Collections $ 7,423 $ 9,091 $ 5,221 $ 1,590 $ 1,062
Fee Collections $ 371 $ 565 $ 265 $ 243 $ 217
Executive Orders / Administrative Penalties / Fines
$ 839 $ 1,075 $ 394 $ 366 $ 385
Total Collections and Fines Paid
$ 8,633 $ 10,731 $ 5,880 $ 2,199 $ 1,644
Source: Alcohol and Tobacco Division, Georgia Department of Revenue
Alcohol and Tobacco Division Statistics
FY2011 FY2012 FY2013 FY2014 FY2015
Number of Alcohol Agents 42 41 40 32 28
Alcohol Inspections 4,749 7,556 5,398 5,617 4,481
Alcohol Investigations 1,336 1,350 1,219 1,122 1,118
Alcohol Citations 1,979 7,556 962 707 719
Underage Alcohol Investigations
4,331 5,343 3,816 3,673 3,686
Underage Alcohol Citations 753 617 300 254 329
Liquor License Investigations
1,336 1,350 1,219 1,122 1,118
Still Seizures 7 2 - 2 2
Tobacco Inspections 3,939 6,187 3,954 4,454 3,796
Tobacco Investigations 15 7 37 41 11
Tobacco Citations 138 206 114 329 279
Underage Tobacco Investigations
2,284 2,065 1,339 2,688 4,077
Executive Orders 2,053 2,437 1,039 1,111 837
Game Inspections 4,271 3,201 2,191 3,293 -
Felony Arrests 29 26 16 2 4
Misdemeanor Arrests 228 162 125 130 343
Dyed Fuel Inspections 6,760 6,958 7,111 6,838 8,755
Dyed Fuel Violations 167 155 50 113 188
Source: Alcohol and Tobacco Division, Georgia Department of Revenue

25
Tax Data
Revenue from Selective Excise Taxes (Thousands)
FY2011 FY2012 FY2013 FY2014 FY2015
Beer $ 83,356 $ 84,846 $ 85,854 $ 85,798 $ 86,673
Tobacco $ 222,534 $ 227,147 $ 211,524 $ 218,488 $ 215,033
Liquor $ 50,353 $ 53,733 $ 55,572 $ 57,153 $ 60,082
Motor Fuel $ 441,189 $ 431,564 $ 428,278 $ 447,529 $ 457,234
Wine $ 32,020 $ 35,124 $ 35,840 $ 35,767 $ 39,924
Selective Excise Total $ 829,452 $ 832,414 $ 817,068 $ 844,735 $ 858,946
Source: Alcohol and Tobacco and Information Technology Divisions, Georgia State Department of Revenue
Revenue from Business License Fees (Thousands)
FY2011 FY2012 FY2013 FY2014 FY2015
Beer Dealers $ 561 $ 159 $ - $ 142 $ 187
Cigar and Cigarette Dealers $ 21 $ 20 $ 172 $ 168 $ 235
Liquor Dealers $ 1,241 $ 947 $ 3,505 $ 1,485 $ 1,648
Wine Dealers $ 625 $ 269 $ - $ 337 $ 259
Business Licenses Total $ 2,448 $ 1,395 $ 3,677 $ 2,132 $ 2,329
Source: Alcohol and Tobacco, Taxpayer Services and Information Technology Divisions, Georgia Department of Revenue

26
Taxpayer Bill of Rights
Taxpayer Bill of Rights
The mission of the Department of Revenue (DOR) is to administer the tax laws of the State of Georgia fairly and efficiently
in order to promote public confidence and compliance while providing excellent customer service. As a Georgia taxpayer,
you have the right to expect DOR to honor its mission and to uphold your rights every time you contact or are contacted
by DOR. This includes fair and courteous treatment in all dealings with DOR, prompt and accurate responses to all
questions and requests for tax assistance, and a fair and timely hearing on a dispute of any tax liability, as provided by law.
The following is a summary of your rights and DOR’s responsibilities to you as a Georgia taxpayer.
Privacy. You have the right to privacy with regard to
information you provide pertaining to returns, reports,
or the affairs of your business, except under certain
circumstances. See O.C.G.A. §§ 48-2-15 and 48-7-60.
Assistance. You have the right to prompt and accurate
responses from DOR to questions and requests for tax
assistance.
Explanation. You have the right to a clear explanation of:
· The basis of any audit activities performed by a DOR
agent;
· The basis of an assessment of additional taxes, interest
and penalties, or the denial or decrease of any refund or
credit claim;
· The basis of any DOR enforcement or collection
activities;
· The procedure for protesting a Proposed Assessment
or Refund Denial; and
· The procedure for appealing an Official Assessment
and Demand for Payment, Refund Denial, or State Tax
Execution.
Dispute. You have the right to dispute an adverse
decision of DOR as further detailed below.
Representation. You have the right to representation by
your authorized agent, whether an attorney, accountant,
or other person with a properly completed Power of
Attorney, in any hearing or conference with DOR. A
Power of Attorney form can be downloaded from
https://dor.georgia.gov/documents/forms.
DOR has the obligation to:
· Perform audits and conduct conferences with you at
reasonable times and places;
· Furnish copies of the agent’s audit documents that
explain the basis for an assessment;
· Resolve tax controversies fairly and equitably at the
administrative level whenever possible; and
· Estimate your tax liability and issue an assessment
based on the best information available if you fail to
maintain records suitable to determine the amount of
tax due or to support the accuracy of the return.
RIGHTS OF A TAXPAYER
OBLIGATIONS OF THE GEORGIA DEPARTMENT OF REVENUE

27
Taxpayer Bill of Rights
· You may file a claim for an income tax refund within
three years after the date the taxes were paid or the due
date for filing the applicable income tax return, including
any extensions which have been granted, whichever is
later.
· You may file a claim for a refund of taxes other than
income tax within three years after the date the taxes
were paid.
· The claim must be in writing, include a summary
statement of the grounds upon which you rely, and
identify the transactions that form the basis of the
refund being claimed. Forms to file a refund claim are
available on the DOR website at
https://dor.georgia.gov/documents/forms.
· To dispute a Proposed Assessment or Refund Denial,
you may protest with the Department within 30 days of
the issued date printed on the notice. To protest online,
log on to the Georgia Tax Center website at
https://gtc.dor.ga.gov. To protest by mail, complete a
Protest of Proposed Assessment or Refund Denial form
by downloading the form from the DOR website at
https://dor.georgia.gov/documents/forms and following
the instructions. DOR will notify you that the protest has
been either granted or denied.
· If DOR grants your protest of a Proposed Assessment,
the assessment will be withdrawn. If DOR grants your
protest of a Refund Denial, the refund will be issued.
· If DOR denies your protest of a Proposed Assessment,
DOR will issue an Official Assessment and Demand for
Payment and notify you of the assessment amount,
subject to the right to appeal. If DOR denies your protest
of a Refund Denial, you also have the right to appeal.
Georgia Tax Tribunal (GTT)
· GTT hears and decides certain state tax disputes and is
completely separate from and totally independent of
DOR. Decisions of GTT (except small claims cases) may be
appealed to the Superior Court of Fulton County.
· GTT’s Small Claims Division handles appeals where the
amount of tax and penalties in controversy is less than
either $15,000 for income tax cases or $50,000 for other
tax types. Decisions in small claims cases are final and
cannot be appealed.
· To file an appeal with GTT, complete a Georgia Tax
Tribunal Petition by downloading the form from
www.gataxtribunal.ga.gov and following the
instructions.
Superior Court
· An appeal in superior court must satisfy certain legal
procedural requirements and must be accompanied by
either a surety bond in an amount equal to the amount
in dispute or evidence of your owning equity in real
estate in Georgia in an amount equal to or in excess of
the amount in dispute. It is highly recommended that you
retain legal counsel for an appeal in superior court.
· To Dispute an Official Assessment: You must appeal the
Official Assessment either to GTT or in the appropriate
superior court within 30 days of the issued date of the
Official Assessment and Demand for Payment notice.
· To Dispute the Denial of a Claim for Refund: If DOR
denies your claim for refund, you can appeal the denial
either to GTT or in the appropriate superior court within
the later of (i) two years from the date the refund claim
was denied, or (ii) if you elected to protest the refund
denial before appealing, 30 days after the issued date of
DOR’s notice of its decision.
REQUESTING A TAX REFUND
DISPUTING A NOTICE OF PROPOSED ASSESSMENT OR REFUND DENIAL

28
Taxpayer Bill of Rights
· To Dispute the Issuance of a State Tax Execution:
Failure to either pay or appeal an Official Assessment
within 30 days may result in the issuance of a State Tax
Execution. You can appeal the issuance of a State Tax
Execution to GTT or in the appropriate superior court.
· If you fail to either pay or appeal an official assessment
within 30 days, DOR may issue a state tax execution and
impose a collection fee equaling 20% of the total tax,
interest, and penalties due. The tax execution may be
recorded in the public records of any county in the state
where you live or own real property and will constitute a
lien covering all property in which you have any interest.
· After the issuance of the tax execution, DOR can utilize
all lawful means to collect the amount due, including
garnishment, levy, and sale of your property or rights to
property. Any additional costs that arise from such
collection actions will be added to the amount due
indicated on the state tax execution.
· An appeal to GTT or in superior court stays any
enforcement or collection actions by DOR (except for
actions taken due to the issuance of a jeopardy
assessment), although the stay may be lifted for good
cause by the GTT or superior court judge.
· DOR is authorized to issue a jeopardy assessment
against you for the immediate collection of any tax if
there is evidence that you intend to leave Georgia,
remove your property, conceal yourself or your property,
discontinue your business without making adequate
provision for the payment of state taxes, or you do
anything which would tend to prejudice or jeopardize
DOR’s ability to assess or collect state taxes that you
owe. A jeopardy assessment may be appealed in the
same manner as an official assessment; however,
collection activities will continue unless you file a bond
with DOR that adequately secures payment of the tax.
· The Taxpayer Advocacy Office was created to ensure
that your rights as a taxpayer are protected and that you
receive timely and courteous service from DOR. If you
feel that you have been treated unfairly or have received
no response to requests for service, the Taxpayer
Advocacy Office may intervene on your behalf to
facilitate a timely and equitable resolution, provided that
you have not already appealed to GTT or in superior
court.
· Please direct any suggestions or complaints concerning
a particular tax-related issue to Georgia Department of
Revenue, Taxpayer Advocacy Office, P.O. Box 49708,
Atlanta, Georgia 30359-2708 or to [email protected].
COLLECTION PROCEDURES
TAXPAYER ADVOCACY OFFICE
The information in this document summarizes your rights as a Georgia taxpayer and the responsibilities of the Department of Revenue. The Georgia Taxpayer
Bill of Rights may be found in the Georgia Public Revenue Code as codified in the Official Code of Georgia (O.C.G.A.) at Title 48, Chapter 1, Section 9.