22 april 2020 results review 1qcy20 acc
TRANSCRIPT
22 April 2020 Results Review 1QCY20
ACC
HSIE Research is also available on Bloomberg ERH HDF <GO> & Thomson Reuters
Healthy margins despite weak volumes
During 1QCY20, while ACC’s cement volume/consol revenue fell 12/11% YoY
on Covid-19 lockdown, lower op costs more than offset this impact. Thus,
consol EBITDA/APAT rose 10/31% YoY. We expect the Covid-19 impact to
pull down CY20E volumes by 18% YoY. However, we expect falling energy
costs to moderate the earnings impact. We maintain BUY on the stock with a
TP of Rs 1,440 (10x consolidated Mar’22E EBITDA)
Sharp vol decline pulled down revenues: ACC reported consol rev decline
of 11% YoY to Rs 35.02bn. However, EBITDA/PAT grew 10/ 31% YoY resp to
Rs 5.87/3.23bn resp. ACC’s EBITDA/APAT came in 7/9% higher vs our est.
Cement Sales vol declined 12% YoY to 6.6mn MT, mainly led by Covid-19
shutdowns. NSR remained flat YoY (+1% QoQ) at Rs 4,807/MT. Even RMC
revenues (11% of total revenues) fell 1% YoY in 1Q.
Lower opex buoyed margin to multi-year high level of Rs 831/MT: Amid
flattish NSR, ACC’s unitary opex fell 5/5% YoY/QoQ to Rs 3,975/MT. This is
led by lower fuel costs, increase in premium cement sales and cost controls.
However, owing to lower sales YoY/QoQ, negative op-lev drove fixed costs
higher by 5/7% YoY and moderated the benefits. Opex reduction bolstered
unitary EBITDA by 27/38% YoY/QoQ to Rs 831/MT (ACC’s 8-yr high
performance for a Mar-qtr)! ACC adopted new financial lease accounting
w.e.f. Jan 2020. This led to lower other expenses by Rs 88.5mn (Rs 13/MT)
and Depreciation/Interest expense higher by Rs 72/26.4mn respectively.
EBITDA/APAT up 10/30% YoY on strong margin and lower tax rate:
Despite volume decline, strong margin buoyed consol EBITDA/APAT by
10/31% YoY. Eff tax rate of 32% in 1QCY20 vs 42/32% YoY/QoQ further
boosted PAT growth.
Valuation and view. We expect the Covid-19 lockdown to adversely impact
cement demand in CY20, pulling down ACC’s CY20 vol by 18% YoY. We
estimate ACC’s volume in 2QCY20 to fall 50% YoY, owing to extended
lockdown impact during the qtr. Thereafter, we expect demand pick up and
ACC’s capacity expansions (6mn MT additions expected by early CY22E) to
drive 14% volume CAGR during CY20-22E. Falling energy costs should
moderate the impact of weak demand in CY20. Thus, we model in unitary
EBITDA to sustain around ~Rs 750 during CY20-22E. We maintain BUY on
the stock, valuing it at 10x its Mar’22E EBITDA. Our TP implies replacement
EV/MT of Rs 6.9bn (similar to its 10-yr historical mean).
Financial Summary
YE Dec (Rs mn) 1Q
CY20
1Q
CY19 YoY (%)
4Q
CY19 QoQ (%) CY19 CY20E CY21E CY22E
Net Sales 35,017 39,191 (10.7) 40,603 (13.8) 156,576 128,116 147,294 172,779
EBITDA 5,865 5,317 10.3 5,410 8.4 24,105 18,051 22,228 24,890
APAT 3,230 2,473 30.6 2,733 18.2 12,767 9,849 12,960 14,174
AEPS (Rs) 17.2 13.2 30.6 14.5 18.2 68.0 52.4 69.0 75.5
EV /EBITDA (x)
10.0 9.5 7.8 6.7
EV/MT (Rs bn)
7.57 5.40 5.46 4.44
P/E (x)
26.3 22.5 21.7 16.5
RoE (%)
11.0 11.6 8.4 10.6
Source: Company, HSIE Research
BUY
CMP (as on 21 Apr 2020) Rs 1,137
Target Price Rs 1,440
NIFTY 8,981
KEY
CHANGES OLD NEW
Rating Buy Buy
Price Target Rs 1,140 Rs 1,440
EPS % CY20 CY21E
- -
KEY STOCK DATA
Bloomberg code ACC IN
No. of Shares (mn) 188
MCap (Rs bn) / ($ mn) 214/2,774
6m avg traded value (Rs mn) 1,205
52 Week high / low Rs 1,769/895
STOCK PERFORMANCE (%)
3M 6M 12M
Absolute (%) (24.0) (26.8) (33.1)
Relative (%) 1.8 (4.8) (11.4)
SHAREHOLDING PATTERN (%)
Dec-19 Mar-20
Promoters 54.53 54.53
FIs & Local MFs 21.22 21.03
FPIs 8.60 7.79
Public & Others 15.65 16.65
Pledged Shares 0.00 0.00
Source : BSE
Rajesh Ravi
+91-22-6171-7352
Saurabh Dugar
+91-22-6171-7353
Page | 2
ACC: Results Review 1QCY20
Quarterly consolidated Financial Snapshot
Particulars (Rs mn) 1QCY20 1QCY19 YoY (%) 4QCY19 QoQ (%)
Net Sales 35,017 39,191 (10.7) 40,603 (13.8)
Raw Materials 9,202 12,723 (27.7) 14,572 (36.9)
Power and Fuel 7,344 7,921 (7.3) 7,409 (0.9)
Employee 2,090 2,001 4.5 2,330 (10.3)
Transport 9,415 10,569 (10.9) 9,844 (4.4)
Other Exp 5,549 6,269 (11.5) 6,096 (9.0)
EBITDA 5,865 5,317 10.3 5,410 8.4
EBITDA margin (%) 16.7 13.6 318 13.3 343
Depreciation 1,580 1,476 7.0 1,608 (1.8)
EBIT 4,285 3,841 11.6 3,802 12.7
Other Income (Including EO Items) 559 1,566 (64.3) 575 (2.8)
Interest Cost 106 201 (47.2) 293 (63.8)
PBT - Reported 4,739 5,207 (9.0) 4,084 16.0
Tax 1,531 1,771 (13.6) 1,400 9.3
Tax rate (%) 32.3 34.0 (171) 34.3 (198)
(Min Int)/ Share of associates profit 22 32 49
RPAT 3,230 3,468 (6.9) 2,733 18.2
EO (Loss) / Profit (Net Of Tax) - 995 -
APAT 3,230 2,473 30.6 2,733 18.2
Adj PAT margin (%) 9.2 6.3 291 6.7 249
Source: Company, HSIE Research
Quarterly Performance Analysis: Cement
Particulars (% of Revenue) 1QCY20 1QCY19 YoY (%) 4QCY19 QoQ (%)
Sales vol (mn MT) 6.6 7.5 (11.9) 7.8 (15.5)
Rs/MT trend
NSR 4,807 4,815 (0.2) 4,774 0.7
Raw materials 256 570 (55.0) 862 (70.3)
Power & fuel 1,119 1,063 5.3 955 17.3
Employee 319 269 18.6 300 6.1
Freight (inward +outward) 1,435 1,419 1.2 1,269 13.1
Other Exp 846 841 0.5 786 7.7
Opex 3,975 4,162 (4.5) 4,171 (4.7)
EBITDA 831 653 27.3 603 37.8
Source: Company, HSIE Research
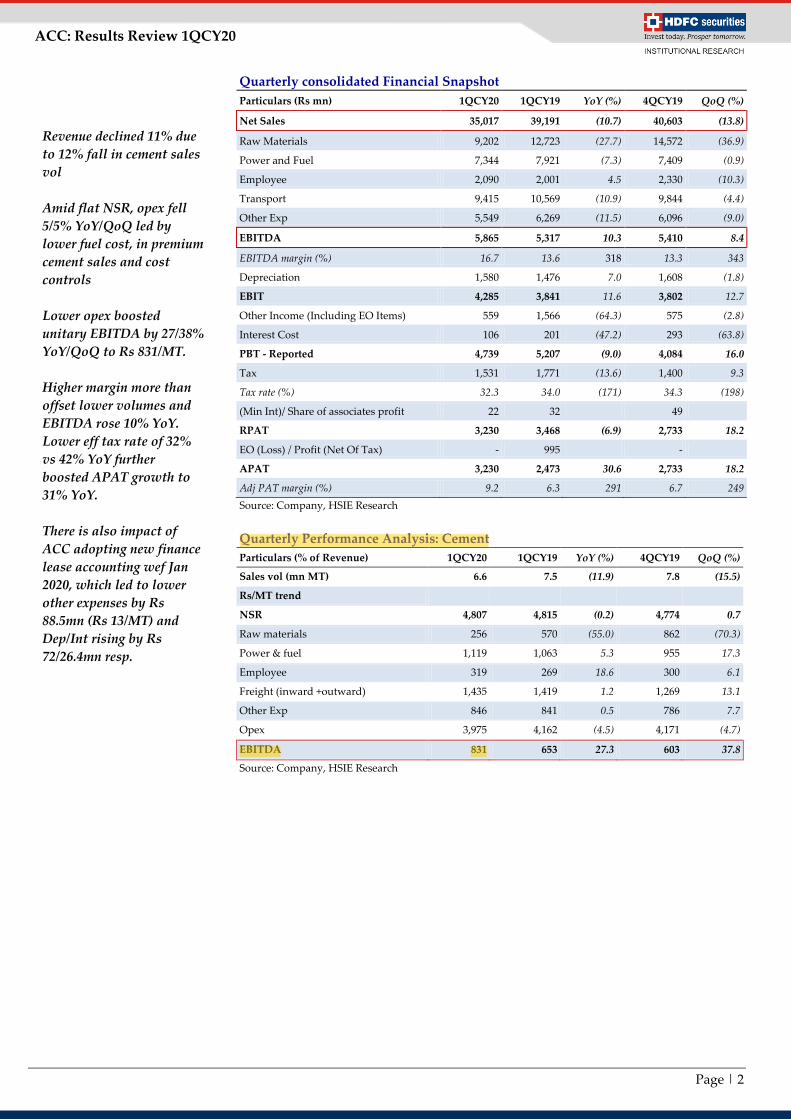
Revenue declined 11% due
to 12% fall in cement sales
vol
Amid flat NSR, opex fell
5/5% YoY/QoQ led by
lower fuel cost, in premium
cement sales and cost
controls
Lower opex boosted
unitary EBITDA by 27/38%
YoY/QoQ to Rs 831/MT.
Higher margin more than
offset lower volumes and
EBITDA rose 10% YoY.
Lower eff tax rate of 32%
vs 42% YoY further
boosted APAT growth to
31% YoY.
There is also impact of
ACC adopting new finance
lease accounting wef Jan
2020, which led to lower
other expenses by Rs
88.5mn (Rs 13/MT) and
Dep/Int rising by Rs
72/26.4mn resp.
Page | 3
ACC: Results Review 1QCY20
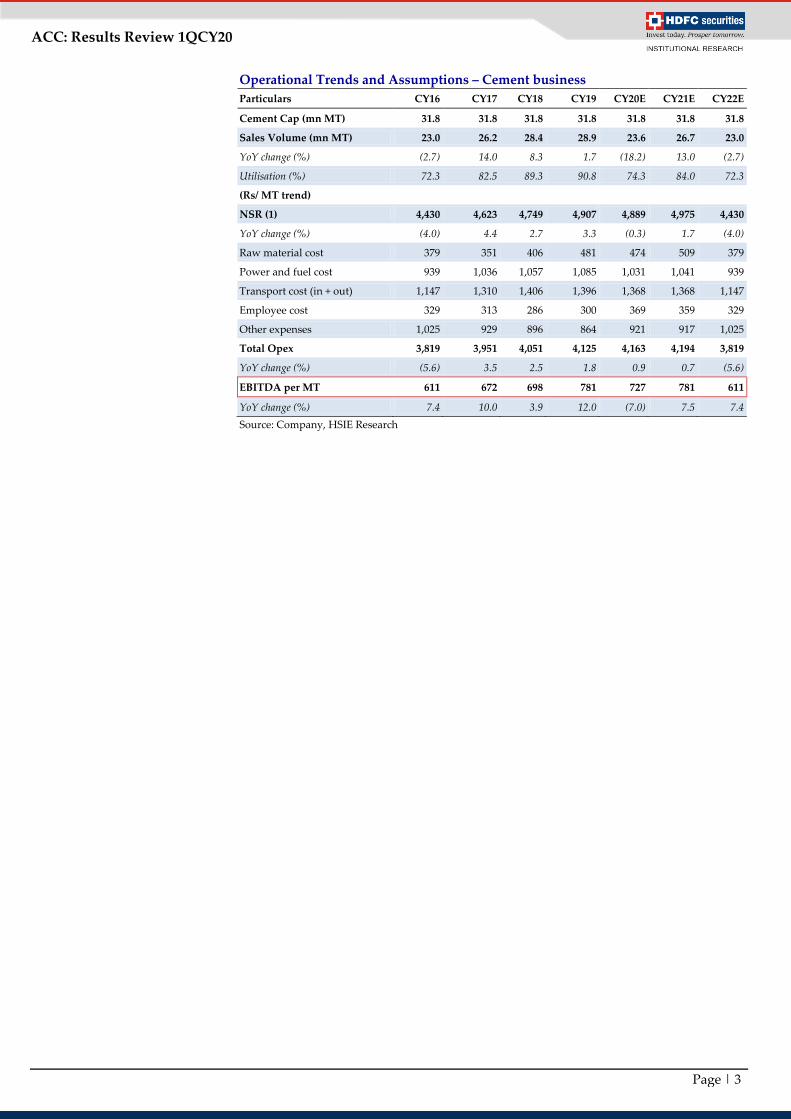
Operational Trends and Assumptions – Cement business
Particulars CY16 CY17 CY18 CY19 CY20E CY21E CY22E
Cement Cap (mn MT) 31.8 31.8 31.8 31.8 31.8 31.8 31.8
Sales Volume (mn MT) 23.0 26.2 28.4 28.9 23.6 26.7 23.0
YoY change (%) (2.7) 14.0 8.3 1.7 (18.2) 13.0 (2.7)
Utilisation (%) 72.3 82.5 89.3 90.8 74.3 84.0 72.3
(Rs/ MT trend)
NSR (1) 4,430 4,623 4,749 4,907 4,889 4,975 4,430
YoY change (%) (4.0) 4.4 2.7 3.3 (0.3) 1.7 (4.0)
Raw material cost 379 351 406 481 474 509 379
Power and fuel cost 939 1,036 1,057 1,085 1,031 1,041 939
Transport cost (in + out) 1,147 1,310 1,406 1,396 1,368 1,368 1,147
Employee cost 329 313 286 300 369 359 329
Other expenses 1,025 929 896 864 921 917 1,025
Total Opex 3,819 3,951 4,051 4,125 4,163 4,194 3,819
YoY change (%) (5.6) 3.5 2.5 1.8 0.9 0.7 (5.6)
EBITDA per MT 611 672 698 781 727 781 611
YoY change (%) 7.4 10.0 3.9 12.0 (7.0) 7.5 7.4
Source: Company, HSIE Research
Page | 4
ACC: Results Review 1QCY20
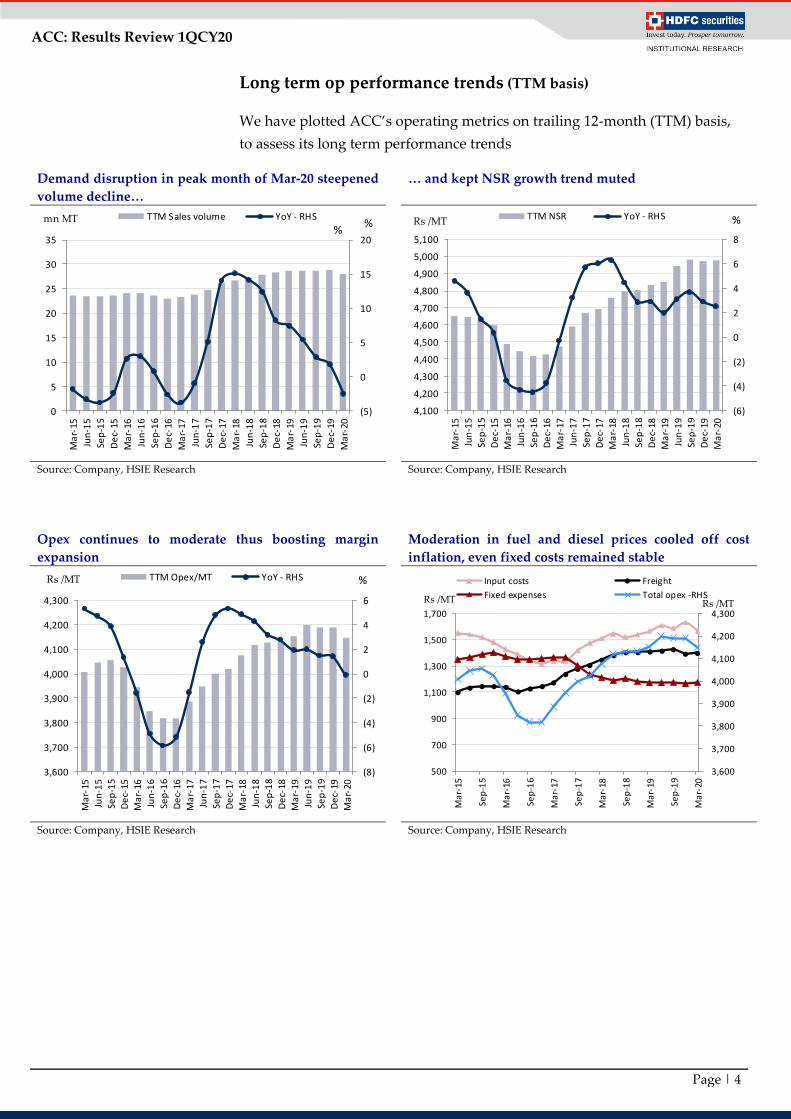
Long term op performance trends (TTM basis)
We have plotted ACC’s operating metrics on trailing 12-month (TTM) basis,
to assess its long term performance trends
Demand disruption in peak month of Mar-20 steepened
volume decline…
… and kept NSR growth trend muted
Source: Company, HSIE Research
Source: Company, HSIE Research
Opex continues to moderate thus boosting margin
expansion
Moderation in fuel and diesel prices cooled off cost
inflation, even fixed costs remained stable
Source: Company, HSIE Research Source: Company, HSIE Research
(5)
0
5
10
15
20
0
5
10
15
20
25
30
35
Ma
r-15
Jun
-15
Sep
-15
De
c-15
Ma
r-16
Jun
-16
Sep
-16
De
c-16
Ma
r-17
Jun
-17
Sep
-17
De
c-17
Ma
r-18
Jun
-18
Sep
-18
De
c-18
Ma
r-19
Jun
-19
Sep
-19
De
c-19
Ma
r-20
TTM Sales volume YoY - RHSmn MT%
%
(6)
(4)
(2)
0
2
4
6
8
4,100
4,200
4,300
4,400
4,500
4,600
4,700
4,800
4,900
5,000
5,100
Ma
r-15
Jun
-15
Sep
-15
De
c-15
Ma
r-16
Jun
-16
Sep
-16
De
c-16
Ma
r-17
Jun
-17
Sep
-17
De
c-17
Ma
r-18
Jun
-18
Sep
-18
De
c-18
Ma
r-19
Jun
-19
Sep
-19
De
c-19
Ma
r-20
TTM NSR YoY - RHS %Rs /MT
(8)
(6)
(4)
(2)
0
2
4
6
3,600
3,700
3,800
3,900
4,000
4,100
4,200
4,300
Ma
r-15
Jun
-15
Sep
-15
De
c-15
Ma
r-16
Jun
-16
Sep
-16
De
c-16
Ma
r-17
Jun
-17
Sep
-17
De
c-17
Ma
r-18
Jun
-18
Sep
-18
De
c-18
Ma
r-19
Jun
-19
Sep
-19
De
c-19
Ma
r-20
TTM Opex/MT YoY - RHS %Rs /MT
3,600
3,700
3,800
3,900
4,000
4,100
4,200
4,300
500
700
900
1,100
1,300
1,500
1,700
Ma
r-15
Sep
-15
Ma
r-16
Sep
-16
Ma
r-17
Sep
-17
Ma
r-18
Sep
-18
Ma
r-19
Sep
-19
Ma
r-20
Input costs Freight
Fixed expenses Total opex -RHSRs /MT Rs /MT
Page | 5
ACC: Results Review 1QCY20
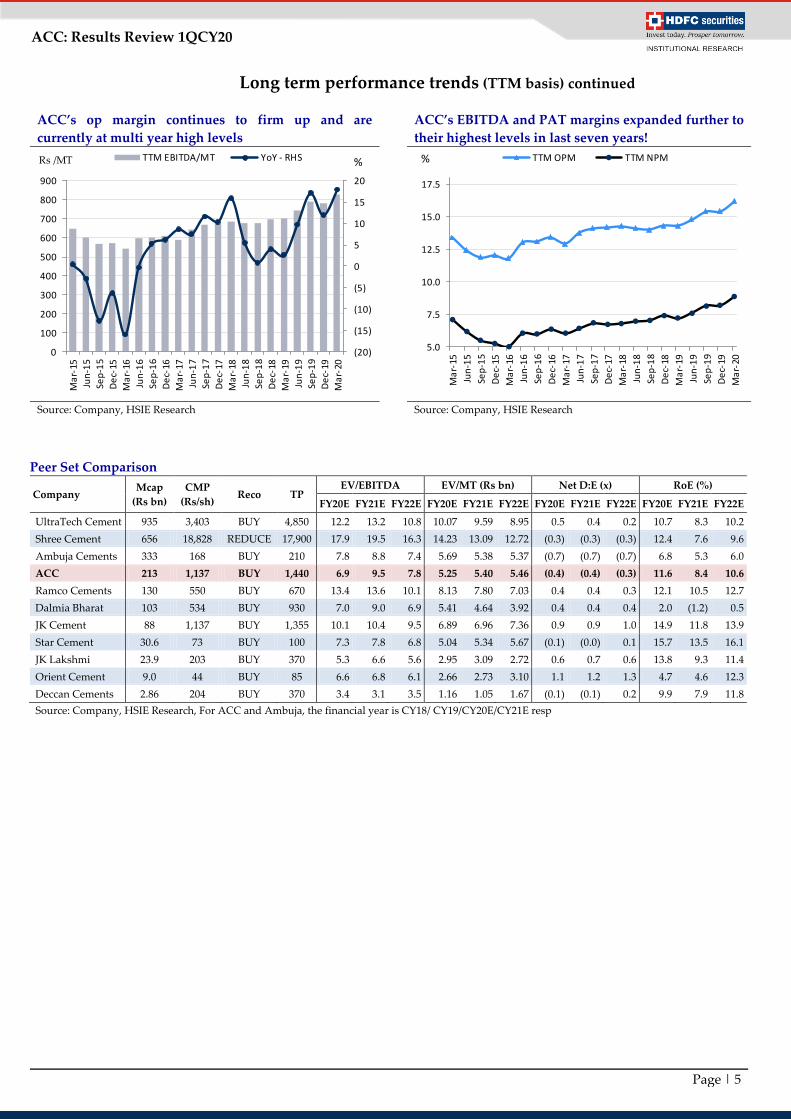
Long term performance trends (TTM basis) continued
ACC’s op margin continues to firm up and are
currently at multi year high levels
ACC’s EBITDA and PAT margins expanded further to
their highest levels in last seven years!
Source: Company, HSIE Research Source: Company, HSIE Research
Peer Set Comparison
Company Mcap
(Rs bn)
CMP
(Rs/sh) Reco TP
EV/EBITDA EV/MT (Rs bn) Net D:E (x) RoE (%)
FY20E FY21E FY22E FY20E FY21E FY22E FY20E FY21E FY22E FY20E FY21E FY22E
UltraTech Cement 935 3,403 BUY 4,850 12.2 13.2 10.8 10.07 9.59 8.95 0.5 0.4 0.2 10.7 8.3 10.2
Shree Cement 656 18,828 REDUCE 17,900 17.9 19.5 16.3 14.23 13.09 12.72 (0.3) (0.3) (0.3) 12.4 7.6 9.6
Ambuja Cements 333 168 BUY 210 7.8 8.8 7.4 5.69 5.38 5.37 (0.7) (0.7) (0.7) 6.8 5.3 6.0
ACC 213 1,137 BUY 1,440 6.9 9.5 7.8 5.25 5.40 5.46 (0.4) (0.4) (0.3) 11.6 8.4 10.6
Ramco Cements 130 550 BUY 670 13.4 13.6 10.1 8.13 7.80 7.03 0.4 0.4 0.3 12.1 10.5 12.7
Dalmia Bharat 103 534 BUY 930 7.0 9.0 6.9 5.41 4.64 3.92 0.4 0.4 0.4 2.0 (1.2) 0.5
JK Cement 88 1,137 BUY 1,355 10.1 10.4 9.5 6.89 6.96 7.36 0.9 0.9 1.0 14.9 11.8 13.9
Star Cement 30.6 73 BUY 100 7.3 7.8 6.8 5.04 5.34 5.67 (0.1) (0.0) 0.1 15.7 13.5 16.1
JK Lakshmi 23.9 203 BUY 370 5.3 6.6 5.6 2.95 3.09 2.72 0.6 0.7 0.6 13.8 9.3 11.4
Orient Cement 9.0 44 BUY 85 6.6 6.8 6.1 2.66 2.73 3.10 1.1 1.2 1.3 4.7 4.6 12.3
Deccan Cements 2.86 204 BUY 370 3.4 3.1 3.5 1.16 1.05 1.67 (0.1) (0.1) 0.2 9.9 7.9 11.8
Source: Company, HSIE Research, For ACC and Ambuja, the financial year is CY18/ CY19/CY20E/CY21E resp
(20)
(15)
(10)
(5)
0
5
10
15
20
0
100
200
300
400
500
600
700
800
900
Ma
r-15
Jun
-15
Sep
-15
De
c-15
Ma
r-16
Jun
-16
Sep
-16
De
c-16
Ma
r-17
Jun
-17
Sep
-17
De
c-17
Ma
r-18
Jun
-18
Sep
-18
De
c-18
Ma
r-19
Jun
-19
Sep
-19
De
c-19
Ma
r-20
TTM EBITDA/MT YoY - RHS %Rs /MT
5.0
7.5
10.0
12.5
15.0
17.5
Ma
r-15
Jun
-15
Sep
-15
De
c-15
Ma
r-16
Jun
-16
Sep
-16
De
c-16
Ma
r-17
Jun
-17
Sep
-17
De
c-17
Ma
r-18
Jun
-18
Sep
-18
De
c-18
Ma
r-19
Jun
-19
Sep
-19
De
c-19
Ma
r-20
TTM OPM TTM NPM%

Page | 6
ACC: Results Review 1QCY20
Financials Consolidated Income Statement YE Dec (Rs mn) CY17 CY18 CY19 CY20E CY21E CY22E
Revenues 132,851 148,016 156,576 128,116 147,294 172,779
Growth % 20.8 11.4 5.8 (18.2) 15.0 17.3
Raw Material 19,659 23,325 27,189 22,926 26,713 31,670
Power & Fuel 27,169 30,008 31,340 24,347 27,787 32,914
Freight Expense 34,338 39,928 40,321 32,313 36,514 43,671
Employee cost 8,214 8,132 8,661 8,708 9,579 11,016
Other Expenses 24,689 25,438 24,960 21,770 24,474 28,618
EBITDA 18,783 21,185 24,105 18,051 22,228 24,890
EBIDTA Margin (%) 14.1 14.3 15.4 14.1 15.1 14.4
EBITDA Growth % 27.1 12.8 13.8 (25.1) 23.1 12.0
Depreciation 6,436 6,032 6,064 6,464 6,732 8,038
EBIT 12,347 15,153 18,040 11,587 15,496 16,852
Other Income (Including EO Items) 1,631 5,729 3,184 2,190 2,408 2,649
Interest 985 878 855 855 855 855
PBT 12,992 20,004 20,370 12,922 17,050 18,646
Tax 3,856 4,901 6,750 3,231 4,262 4,662
Minority Int (109) (103) (142) (157) (173) (190)
RPAT 9,246 15,206 13,761 9,849 12,960 14,174
EO (Loss) / Profit (Net Of Tax) 342 4,303 995 - - -
APAT 8,904 10,904 12,767 9,849 12,960 14,174
APAT Growth (%) 27.7 22.5 17.1 (22.9) 31.6 9.4
Source: Company, HSIE Research
Consolidated Balance Sheet
YE Dec (Rs mn) CY17 CY18 CY19 CY20E CY21E CY22E
SOURCES OF FUNDS
Share Capital 1,880 1,880 1,880 1,880 1,880 1,880
Reserves And Surplus 91,679 103,440 113,558 116,816 123,185 130,768
Total Equity 93,559 105,319 115,438 118,695 125,065 132,648
Minority Interest 29 30 32 32 32 32
Long-term Debt - - - - - -
Short-term Debt - - - - - -
Total Debt - - - - - -
Deferred Tax Liability 5,516 6,745 6,557 6,557 6,557 6,557
Long-term Liab+ Provisions 1,428 1,403 2,351 2,351 2,351 2,351
TOTAL SOURCES OF FUNDS 100,531 113,498 124,378 127,635 134,004 141,588
APPLICATION OF FUNDS
Net Block 72,645 70,726 70,112 67,648 64,916 91,878
Capital WIP 2,693 3,978 4,457 16,457 28,457 3,457
Goodwill 156 156 156 156 156 156
Other Non-current Assets 15,597 17,930 20,233 18,291 18,922 19,868
Total Non-current Investments 949 1,041 1,162 1,162 1,162 1,162
Total Non-current Assets 92,039 93,831 96,119 103,713 113,612 116,520
Inventories 14,048 16,794 11,419 14,040 16,142 18,935
Debtors 6,660 8,674 6,267 7,371 8,474 9,467
Cash and Cash Equivalents 27,286 30,970 46,477 41,635 39,779 46,182
Other Current Assets 8,425 10,292 11,078 11,629 11,786 12,375
Total Current Assets 56,418 66,729 75,241 74,675 76,181 86,960
Creditors 18,137 19,263 14,750 14,040 16,142 18,935
Other Current Liabilities & Provns 29,789 27,799 32,233 36,713 39,647 42,958
Total Current Liabilities 47,927 47,062 46,982 50,753 55,789 61,892
Net Current Assets 8,492 19,667 28,259 23,922 20,392 25,067
TOTAL APPLICATION OF FUNDS 100,531 113,498 124,378 127,635 134,004 141,588
Source: Company, HSIE Research
Page | 7
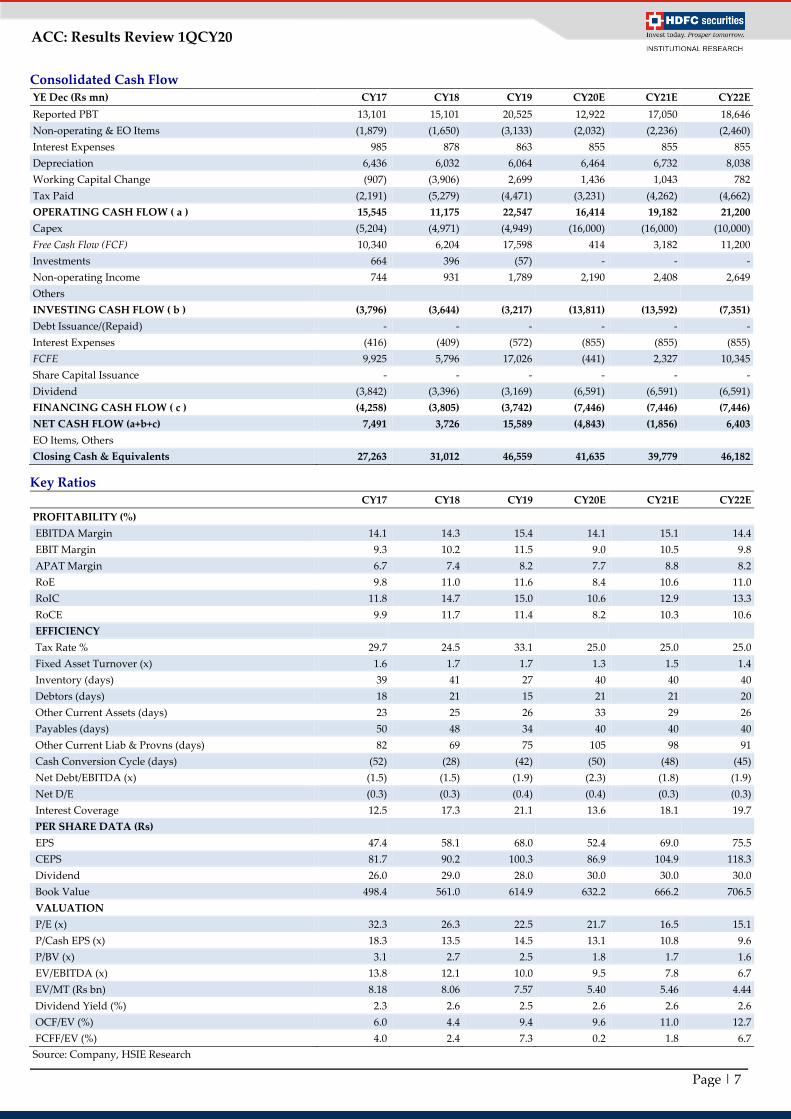
ACC: Results Review 1QCY20
Consolidated Cash Flow YE Dec (Rs mn) CY17 CY18 CY19 CY20E CY21E CY22E
Reported PBT 13,101 15,101 20,525 12,922 17,050 18,646
Non-operating & EO Items (1,879) (1,650) (3,133) (2,032) (2,236) (2,460)
Interest Expenses 985 878 863 855 855 855
Depreciation 6,436 6,032 6,064 6,464 6,732 8,038
Working Capital Change (907) (3,906) 2,699 1,436 1,043 782
Tax Paid (2,191) (5,279) (4,471) (3,231) (4,262) (4,662)
OPERATING CASH FLOW ( a ) 15,545 11,175 22,547 16,414 19,182 21,200
Capex (5,204) (4,971) (4,949) (16,000) (16,000) (10,000)
Free Cash Flow (FCF) 10,340 6,204 17,598 414 3,182 11,200
Investments 664 396 (57) - - -
Non-operating Income 744 931 1,789 2,190 2,408 2,649
Others
INVESTING CASH FLOW ( b ) (3,796) (3,644) (3,217) (13,811) (13,592) (7,351)
Debt Issuance/(Repaid) - - - - - -
Interest Expenses (416) (409) (572) (855) (855) (855)
FCFE 9,925 5,796 17,026 (441) 2,327 10,345
Share Capital Issuance - - - - - -
Dividend (3,842) (3,396) (3,169) (6,591) (6,591) (6,591)
FINANCING CASH FLOW ( c ) (4,258) (3,805) (3,742) (7,446) (7,446) (7,446)
NET CASH FLOW (a+b+c) 7,491 3,726 15,589 (4,843) (1,856) 6,403
EO Items, Others
Closing Cash & Equivalents 27,263 31,012 46,559 41,635 39,779 46,182
Key Ratios
CY17 CY18 CY19 CY20E CY21E CY22E
PROFITABILITY (%)
EBITDA Margin 14.1 14.3 15.4 14.1 15.1 14.4
EBIT Margin 9.3 10.2 11.5 9.0 10.5 9.8
APAT Margin 6.7 7.4 8.2 7.7 8.8 8.2
RoE 9.8 11.0 11.6 8.4 10.6 11.0
RoIC 11.8 14.7 15.0 10.6 12.9 13.3
RoCE 9.9 11.7 11.4 8.2 10.3 10.6
EFFICIENCY
Tax Rate % 29.7 24.5 33.1 25.0 25.0 25.0
Fixed Asset Turnover (x) 1.6 1.7 1.7 1.3 1.5 1.4
Inventory (days) 39 41 27 40 40 40
Debtors (days) 18 21 15 21 21 20
Other Current Assets (days) 23 25 26 33 29 26
Payables (days) 50 48 34 40 40 40
Other Current Liab & Provns (days) 82 69 75 105 98 91
Cash Conversion Cycle (days) (52) (28) (42) (50) (48) (45)
Net Debt/EBITDA (x) (1.5) (1.5) (1.9) (2.3) (1.8) (1.9)
Net D/E (0.3) (0.3) (0.4) (0.4) (0.3) (0.3)
Interest Coverage 12.5 17.3 21.1 13.6 18.1 19.7
PER SHARE DATA (Rs)
EPS 47.4 58.1 68.0 52.4 69.0 75.5
CEPS 81.7 90.2 100.3 86.9 104.9 118.3
Dividend 26.0 29.0 28.0 30.0 30.0 30.0
Book Value 498.4 561.0 614.9 632.2 666.2 706.5
VALUATION
P/E (x) 32.3 26.3 22.5 21.7 16.5 15.1
P/Cash EPS (x) 18.3 13.5 14.5 13.1 10.8 9.6
P/BV (x) 3.1 2.7 2.5 1.8 1.7 1.6
EV/EBITDA (x) 13.8 12.1 10.0 9.5 7.8 6.7
EV/MT (Rs bn) 8.18 8.06 7.57 5.40 5.46 4.44
Dividend Yield (%) 2.3 2.6 2.5 2.6 2.6 2.6
OCF/EV (%) 6.0 4.4 9.4 9.6 11.0 12.7
FCFF/EV (%) 4.0 2.4 7.3 0.2 1.8 6.7
Source: Company, HSIE Research
Page | 8
ACC: Results Review 1QCY20
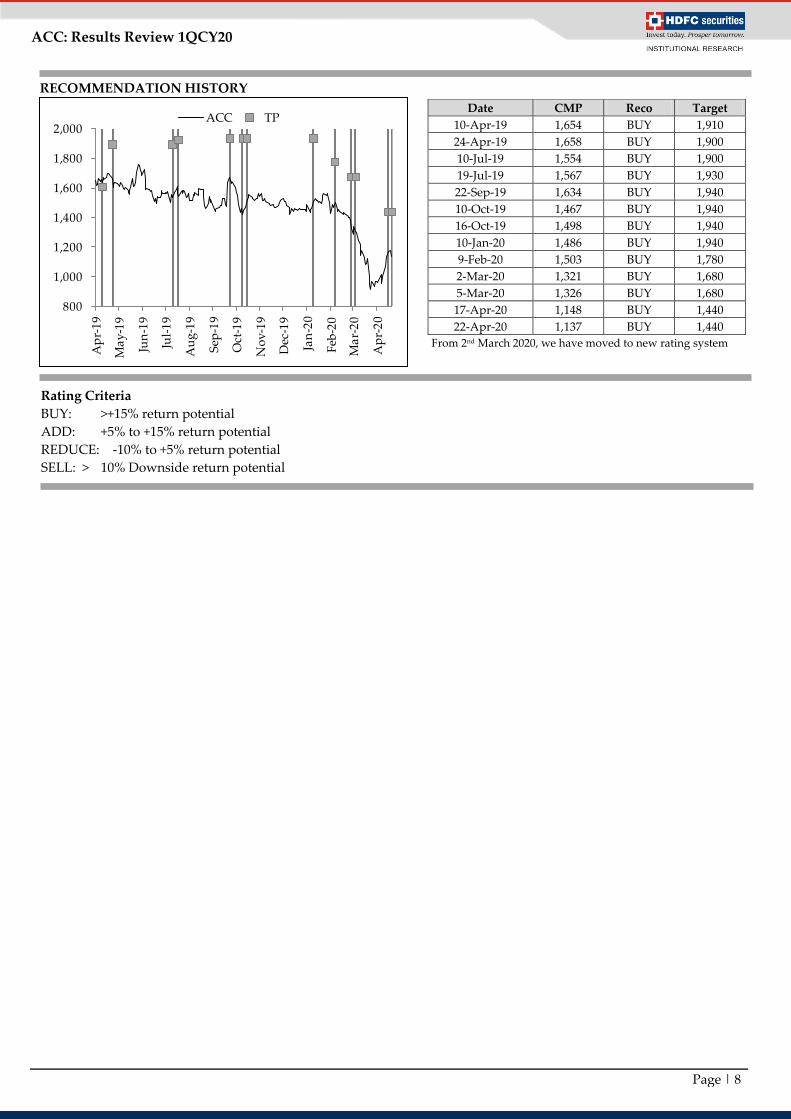
Rating Criteria
BUY: >+15% return potential
ADD: +5% to +15% return potential
REDUCE: -10% to +5% return potential
SELL: > 10% Downside return potential
Date CMP Reco Target
10-Apr-19 1,654 BUY 1,910
24-Apr-19 1,658 BUY 1,900
10-Jul-19 1,554 BUY 1,900
19-Jul-19 1,567 BUY 1,930
22-Sep-19 1,634 BUY 1,940
10-Oct-19 1,467 BUY 1,940
16-Oct-19 1,498 BUY 1,940
10-Jan-20 1,486 BUY 1,940
9-Feb-20 1,503 BUY 1,780
2-Mar-20 1,321 BUY 1,680
5-Mar-20 1,326 BUY 1,680
17-Apr-20 1,148 BUY 1,440
22-Apr-20 1,137 BUY 1,440
From 2nd March 2020, we have moved to new rating system
RECOMMENDATION HISTORY
800
1,000
1,200
1,400
1,600
1,800
2,000
Ap
r-1
9
Ma
y-1
9
Jun
-19
Jul-
19
Au
g-1
9
Sep
-19
Oct
-19
No
v-1
9
Dec
-19
Jan
-20
Feb
-20
Ma
r-2
0
Ap
r-2
0
ACC TP
Page | 9
ACC: Results Review 1QCY20
Disclosure:
We, Rajesh Ravi, MBA & Saurabh Dugar, MBA, authors and the names subscribed to this report, hereby certify that all of the views expressed in this research
report accurately reflect our views about the subject issuer(s) or securities. HSL has no material adverse disciplinary history as on the date of publication of this
report. We also certify that no part of our compensation was, is, or will be directly or indirectly related to the specific recommendation(s) or view(s) in this
report.
Research Analyst or his/her relative or HDFC Securities Ltd. does not have any financial interest in the subject company. Also Research Analyst or his relative
or HDFC Securities Ltd. or its Associate may have beneficial ownership of 1% or more in the subject company at the end of the month immediately preceding
the date of publication of the Research Report. Further Research Analyst or his relative or HDFC Securities Ltd. or its associate does not have any material
conflict of interest.
Any holding in stock –No
HDFC Securities Limited (HSL) is a SEBI Registered Research Analyst having registration no. INH000002475.
Disclaimer:
This report has been prepared by HDFC Securities Ltd and is solely for information of the recipient only. The report must not be used as a singular basis of any
investment decision. The views herein are of a general nature and do not consider the risk appetite or the particular circumstances of an individual investor;
readers are requested to take professional advice before investing. Nothing in this document should be construed as investment advice. Each recipient of this
document should make such investigations as they deem necessary to arrive at an independent evaluation of an investment in securities of the companies
referred to in this document (including merits and risks) and should consult their own advisors to determine merits and risks of such investment. The
information and opinions contained herein have been compiled or arrived at, based upon information obtained in good faith from sources believed to be
reliable. Such information has not been independently verified and no guaranty, representation of warranty, express or implied, is made as to its accuracy,
completeness or correctness. All such information and opinions are subject to change without notice. Descriptions of any company or companies or their
securities mentioned herein are not intended to be complete. HSL is not obliged to update this report for such changes. HSL has the right to make changes and
modifications at any time.
This report is not directed to, or intended for display, downloading, printing, reproducing or for distribution to or use by, any person or entity who is a citizen
or resident or located in any locality, state, country or other jurisdiction where such distribution, publication, reproduction, availability or use would be
contrary to law or regulation or what would subject HSL or its affiliates to any registration or licensing requirement within such jurisdiction.
If this report is inadvertently sent or has reached any person in such country, especially, United States of America, the same should be ignored and brought to
the attention of the sender. This document may not be reproduced, distributed or published in whole or in part, directly or indirectly, for any purposes or in
any manner.
Foreign currencies denominated securities, wherever mentioned, are subject to exchange rate fluctuations, which could have an adverse effect on their value or
price, or the income derived from them. In addition, investors in securities such as ADRs, the values of which are influenced by foreign currencies effectively
assume currency risk. It should not be considered to be taken as an offer to sell or a solicitation to buy any security.
This document is not, and should not, be construed as an offer or solicitation of an offer, to buy or sell any securities or other financial instruments. This report
should not be construed as an invitation or solicitation to do business with HSL. HSL may from time to time solicit from, or perform broking, or other services
for, any company mentioned in this mail and/or its attachments.
HSL and its affiliated company(ies), their directors and employees may; (a) from time to time, have a long or short position in, and buy or sell the securities of
the company(ies) mentioned herein or (b) be engaged in any other transaction involving such securities and earn brokerage or other compensation or act as a
market maker in the financial instruments of the company(ies) discussed herein or act as an advisor or lender/borrower to such company(ies) or may have any
other potential conflict of interests with respect to any recommendation and other related information and opinions.
HSL, its directors, analysts or employees do not take any responsibility, financial or otherwise, of the losses or the damages sustained due to the investments
made or any action taken on basis of this report, including but not restricted to, fluctuation in the prices of shares and bonds, changes in the currency rates,
diminution in the NAVs, reduction in the dividend or income, etc.
HSL and other group companies, its directors, associates, employees may have various positions in any of the stocks, securities and financial instruments dealt
in the report, or may make sell or purchase or other deals in these securities from time to time or may deal in other securities of the companies / organizations
described in this report.
HSL or its associates might have managed or co-managed public offering of securities for the subject company or might have been mandated by the subject
company for any other assignment in the past twelve months.
HSL or its associates might have received any compensation from the companies mentioned in the report during the period preceding twelve months from t
date of this report for services in respect of managing or co-managing public offerings, corporate finance, investment banking or merchant banking, brokerage
services or other advisory service in a merger or specific transaction in the normal course of business.
HSL or its analysts did not receive any compensation or other benefits from the companies mentioned in the report or third party in connection with
preparation of the research report. Accordingly, neither HSL nor Research Analysts have any material conflict of interest at the time of publication of this
report. Compensation of our Research Analysts is not based on any specific merchant banking, investment banking or brokerage service transactions. HSL may
have issued other reports that are inconsistent with and reach different conclusion from the information presented in this report.
Research entity has not been engaged in market making activity for the subject company. Research analyst has not served as an officer, director or employee of
the subject company. We have not received any compensation/benefits from the subject company or third party in connection with the Research Report.
HDFC securities Limited, I Think Techno Campus, Building - B, "Alpha", Office Floor 8, Near Kanjurmarg Station, Opp. Crompton Greaves, Kanjurmarg
(East), Mumbai 400 042 Phone: (022) 3075 3400 Fax: (022) 2496 5066 Compliance Officer: Binkle R. Oza Email: [email protected] Phone: (022)
3045 3600
HDFC Securities Limited, SEBI Reg. No.: NSE, BSE, MSEI, MCX: INZ000186937; AMFI Reg. No. ARN: 13549; PFRDA Reg. No. POP: 11092018; IRDA
Corporate Agent License No.: CA0062; SEBI Research Analyst Reg. No.: INH000002475; SEBI Investment Adviser Reg. No.: INA000011538; CIN -
U67120MH2000PLC152193
HDFC securities
Institutional Equities
Unit No. 1602, 16th Floor, Tower A, Peninsula Business Park,
Senapati Bapat Marg, Lower Parel, Mumbai - 400 013
Board: +91-22-6171-7330 www.hdfcsec.com