22/03/2017 - gov.uk · email: [email protected] or alex watt sbsp physicist scottish...
TRANSCRIPT

EVALUATION OF THE FUJI PROFECT COMPUTERISED RADIOGRAPHY SYSTEM
NHSBSP Equipment Report 0605September 2006
Archive
d on 2
2/03/2
017

EnquiriesEnquiries about this report should be addressed to:
Ann Mumby Superintendent Radiographer/Training Coordinator Breast Screening Centre Stock Exchange Court Nelson Mandela Place Glasgow G2 1QT
Tel: 0141 572 5825 Fax: 0141 572 5801 Email: [email protected]
OR
Alex Watt SBSP Physicist Scottish Healthcare Supplies NHS Services Scotland 1 South Gyle Crescent Edinburgh EH12 9EB
Tel: 0131 275 6877 Fax: 0131 314 0723 Email: [email protected]
Published by
NHS Cancer Screening Programmes Fulwood House Old Fulwood Road Sheffield S10 3TH
Tel: 0114 271 1060 Fax: 0114 271 1089 Email: [email protected] Website: www.cancerscreening.nhs.uk
© NHS Cancer Screening Programmes 2006
The contents of this document may be copied for use by staff working in the public sector but may not be copied for any other purpose without prior permission from the NHS Cancer Screening Programmes.
The report is available in PDF format on the NHS Cancer Screening Programmes’ website
Typeset by Prepress Projects Ltd, Perth (www.prepress-projects.co.uk) Printed by Charlesworth
Archive
d on 2
2/03/2
017

NHSBSP September 2006 iii
Evaluation of the Fuji Profect Computerised Radiography System
CONTENTS
Page No
1. INTRODUCTION 1
2. SCOPE OF THE PROJECT 1
3. IMAGE QUALITY 2
3.1 Technical parameters 23.2 Commissioning and acceptance tests 23.3 Monitor tests 33.4 Image quality assessment 43.5 Dose assessment 7
4. COMPARISON OF 3 MP AND 5 MP REPORTING WORKSTATION MONITORS 8
4.1 Measurements 94.2 Results 104.3 SMPTE test pattern 114.4 Conclusions 124.5 Recommendations 12
5. CR SOFTCOPY REPORTING AT ASSESSMENT 12
6. USABILITY OF THE SYSTEM 12
6.1 Training 126.2 Ergonomic issues 136.3 Archiving 136.4 Recommendations 13
7. IMAGE EVALUATION 13
8. CONCLUSIONS 17
REFERENCES 17
APPENDIX 1: COMPARISON OF PATIENT DOSES FOR FUJI CR WITH FUJI AD ADVANCED FILM-SCREEN 18
APPENDIX 2: RADIOLOGICAL CLASSIFICATION 19Arch
ived o
n 22/0
3/201
7

Evaluation of the Fuji Profect Computerised Radiography System
NHSBSP September 2006 iv
ACKNOWLEDGEMENTS
This report was compiled by Dr Hilary M. Dobson and Ms Ann Mumby of the West of Scotland Breast Screen-ing Service and Mrs Katherine Schofield and Mr Alex Watt of Scottish Healthcare Supplies.
Archive
d on 2
2/03/2
017

NHSBSP September 2006 �
Evaluation of the Fuji Profect Computerised Radiography System
�. INTRODUCTION
Following the recommendations of the Forrest Report (1986), the NHS Breast Screening Programme (NHSBSP) was established in 1988. In the following six years, 95 breast screening services were established as well as a robust quality assurance structure.
The NHSBSP reports annually on the performance of each service against national standards. These standards are based on film-screen mammography. With the introduction of digital imaging in general radiography and more recently in symptomatic mammography, it is clear that analogue systems for mammography will be superseded by digital systems. The theoretical advantages of digital imaging are evident with regard to service redesign, outreach assessment, potential for dose reduction, image manipulation, archiving and links with other services. Computerised radiography (CR) technology can adapt to all current mammography systems and, indeed, CR imaging has long been established in general radiology.
Full CR may provide an affordable and immediate option for both small and large breast screening services in this transition.
2. SCOPE OF THE PROJECT
The West of Scotland Breast Screening Service evaluated the Fuji Profect computerised radiography system on behalf of the NHSBSP. The evaluation involved the use of the system at the assessment clinic on women recalled for further evaluation following their screening episode. The images obtained were then compared with the images obtained using film-screen mammography at the initial screening appointment.
The project aimed to evaluate the following:
1. image quality 2. CR softcopy reporting for assessment 3. the usability of the system for radiographers and radiologists.
Archive
d on 2
2/03/2
017

Evaluation of the Fuji Profect Computerised Radiography System
NHSBSP September 2006 2
3. IMAGE QUALITY
3.� Technical parameters
The Fuji FCR Profect CS computerised radiography system was installed at the West of Scotland Breast Screen-ing Centre, Glasgow, in April 2004. The unit was provided with HR-BD dual sided mammography cassettes in both 18 × 24 cm and 24 × 30 cm sizes, and images were produced with a pixel pitch of 50 µm.
The hardcopy device supplied was a Fuji Drypix 7000 laser printer.
The unit was initially supplied with Dome C3 3 mega pixel (MP) reporting workstation monitors, and the processing was initially optimised to the settings shown in Table 1 (Original settings). In October 2004, the monitors were upgraded to Totoku ME515L 5 MP reporting workstation monitors. At this point, further opti-misation of the processing parameters took place, increasing the image contrast and edge enhancement. These are also shown in Table 1 as Optimised settings.
Table � Processing settings used
Contrast DensityRotation centre
Characteristic curve Enhancement
Dynamic range
Edge enhancement
(GA) (GS) (GC) (GT) (MRE) (MDE) (PRE)Original settings
2.3 0.3 0.6 H 0.7 0.7 1.0
Optimised settings
2.7 0.3 0.6 H 0.7 0.7 2.0
A range of tests were carried out on the system, including commissioning checks, image quality and dose evaluations. These are detailed in the following sections.
3.2 Commissioning and acceptance tests
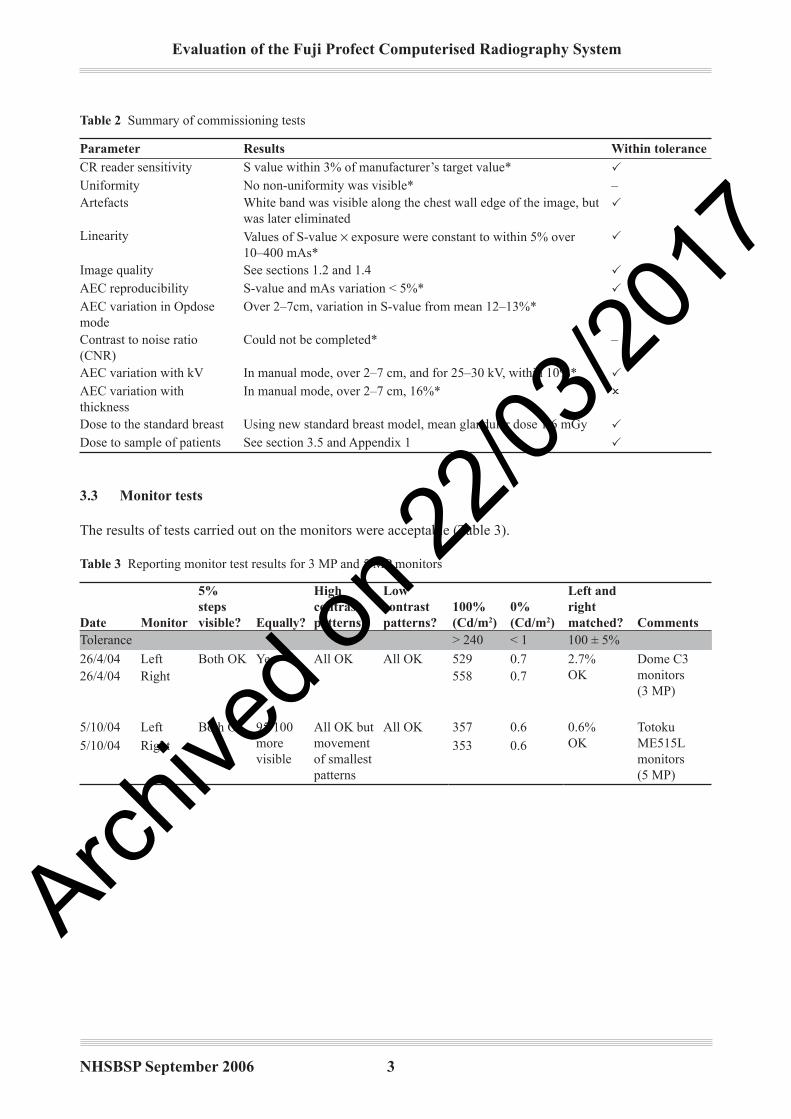
Many of the tests described in the NHSBSP Equipment Report Commissioning and Routine Testing of Full Field Digital Mammography Systems1 were carried out. A brief summary of the results is given in Table 2.
No pixel statistics (eg mean pixel value or signal to noise ratio in a region of interest) could be obtained from Fuji’s own workstations. Therefore, the tests indicated with an asterisk in Table 2 could not be fully com-pleted. It was also difficult to download images to take back to the physicists’ own workstations, where pixel statistics could have been obtained.
Results for the tests were generally within tolerance, with the exception of automatic exposure control (AEC) variation with thickness. This was not adjusted because the x-ray unit is still used predominantly with film-screen but could be adjusted to be within tolerance for a dedicated CR unit.Arch
ived o
n 22/0
3/201
7
NHSBSP September 2006 3
Evaluation of the Fuji Profect Computerised Radiography System
Table 2 Summary of commissioning tests
Parameter Results Within toleranceCR reader sensitivity S value within 3% of manufacturer’s target value* PUniformity No non-uniformity was visible* –Artefacts White band was visible along the chest wall edge of the image, but
was later eliminatedP
Linearity Values of S-value × exposure were constant to within 5% over 10–400 mAs*
P
Image quality See sections 1.2 and 1.4 PAEC reproducibility S-value and mAs variation < 5%* PAEC variation in Opdose mode
Over 2–7cm, variation in S-value from mean 12–13%* –
Contrast to noise ratio (CNR)
Could not be completed* –
AEC variation with kV In manual mode, over 2–7 cm, and for 25–30 kV, within 10%* PAEC variation with thickness
In manual mode, over 2–7 cm, 16%* O
Dose to the standard breast Using new standard breast model, mean glandular dose 1.6 mGy PDose to sample of patients See section 3.5 and Appendix 1 P
3.3 Monitor tests
The results of tests carried out on the monitors were acceptable (Table 3).
Table 3 Reporting monitor test results for 3 MP and 5 MP monitors
Date Monitor
5% steps visible? Equally?
High contrast patterns?
Low contrast patterns?
�00% (Cd/m2)
0% (Cd/m2)
Left and right matched? Comments
Tolerance > 240 < 1 100 ± 5%
26/4/04 Left Both OK Yes All OK All OK 529 0.7 2.7%OK
Dome C3 monitors (3 MP)
26/4/04 Right 558 0.7
5/10/04 Left Both OK 95/100 more visible
All OK but movement of smallest patterns
All OK 357 0.6 0.6%OK
Totoku ME515L monitors (5 MP)
5/10/04 Right 353 0.6
Archive
d on 2
2/03/2
017

Evaluation of the Fuji Profect Computerised Radiography System
NHSBSP September 2006 �
3.� Image quality assessment
The TOR(MAX) and TOR(MAM) test objects were used primarily to assess image quality for hardcopy and softcopy images. The following settings were used.
TOR(MAX)• Siemens Mammomat 3000 x-ray unit at 28 kV, Mo/Mo with AEC position 1–1.5• TOR(MAX) test object on 4 cm Perspex• normal density settings (ie + 1 for film and 0 for CR)• for film images: Fuji AD-M film and fine screen (latest AD-M version)• for CR images: Auto EDR mode (as for clinical films), L = 2.2.
TOR(MAM)• Siemens Mammomat 3000 x-ray unit at 28 kV, Mo/Mo, AEC position 1• TOR(MAM) test object on 3 cm Perspex• normal density settings (ie + 1 for film and 0 for CR)• for film images: Fuji AD-M film and screen (latest AD-M version); note that this film density is higher
than would routinely be used• for CR images: Auto EDR mode used (as for clinical films), L = 2.2–2.3.
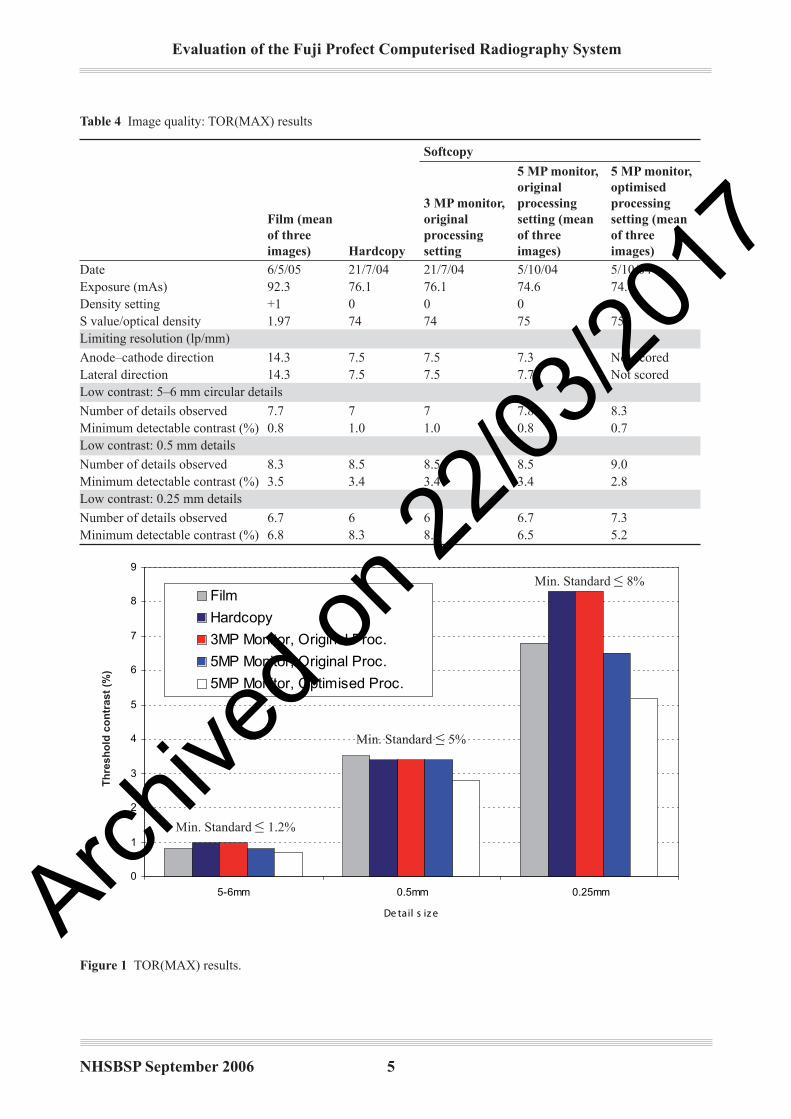
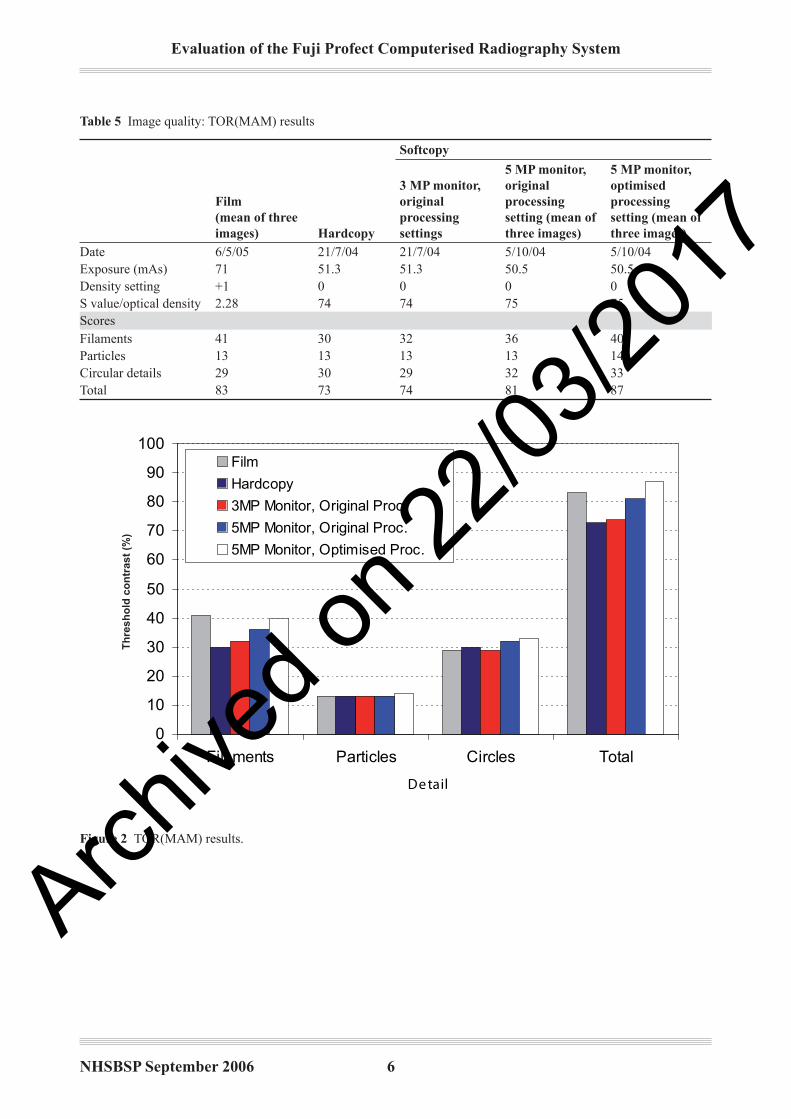
The results are shown in Tables 4 and 5, with recent film-screen results for comparison. The resolution results are similar to those quoted in MHRA Report 040942 (8.9 lp/mm). The minimum detectable contrast is within NHSBSP minimum limits for film-screen for the larger 5–6 mm and 0.5 mm details. For the 0.25 mm details, the film and 5 MP monitor results are within this minimum standard (8%), but the hardcopy and 3 MP moni-tor results fall outside this limit (Figure 1). For both test objects, the film scores are superior to the hardcopy and 3 MP scores. The 5 MP monitor results show noticeable improvements, particularly with the optimised processing settings (Figure 2). The impact of these changes on clinical images was observed in order to decide whether further optimisation of processing parameters could be achieved.
A report on a comparative study of the 3 MP and 5 MP reporting workstation monitors with the Fuji FCR Profect CS computerised radiography system is given in Chapter 4.
Archive
d on 2
2/03/2
017
NHSBSP September 2006 5
Evaluation of the Fuji Profect Computerised Radiography System
Table � Image quality: TOR(MAX) results
Film (mean of three images) Hardcopy
Softcopy
3 MP monitor, original processing setting
5 MP monitor, original processing setting (mean of three images)
5 MP monitor, optimised processing setting (mean of three images)
Date 6/5/05 21/7/04 21/7/04 5/10/04 5/10/04Exposure (mAs) 92.3 76.1 76.1 74.6 74.6Density setting +1 0 0 0 0S value/optical density 1.97 74 74 75 75Limiting resolution (lp/mm)
Anode–cathode direction 14.3 7.5 7.5 7.3 Not scoredLateral direction 14.3 7.5 7.5 7.7 Not scoredLow contrast: 5–6 mm circular details
Number of details observed 7.7 7 7 7.8 8.3Minimum detectable contrast (%) 0.8 1.0 1.0 0.8 0.7Low contrast: 0.5 mm details
Number of details observed 8.3 8.5 8.5 8.5 9.0Minimum detectable contrast (%) 3.5 3.4 3.4 3.4 2.8Low contrast: 0.25 mm details
Number of details observed 6.7 6 6 6.7 7.3Minimum detectable contrast (%) 6.8 8.3 8.3 6.5 5.2
0
1
2
3
4
5
6
7
8
9
5-6mm 0.5mm 0.25mm
De tail s iz e
Threshold contrast (%)
Film
Hardcopy
3MP Monitor, Original Proc.
5MP Monitor, Original Proc.
5MP Monitor, Optimised Proc.
Th
resh
old
co
ntr
ast
(%)
Figure � TOR(MAX) results.
Min. Standard ≤ 8%
Min. Standard ≤ 1.2%
Min. Standard ≤ 5%
Archive
d on 2
2/03/2
017
Evaluation of the Fuji Profect Computerised Radiography System
NHSBSP September 2006 6
Table 5 Image quality: TOR(MAM) results
Film(mean of three images) Hardcopy
Softcopy
3 MP monitor, original processing settings
5 MP monitor, original processing setting (mean of three images)
5 MP monitor, optimised processing setting (mean of three images)
Date 6/5/05 21/7/04 21/7/04 5/10/04 5/10/04Exposure (mAs) 71 51.3 51.3 50.5 50.5Density setting +1 0 0 0 0S value/optical density 2.28 74 74 75 75ScoresFilaments 41 30 32 36 40Particles 13 13 13 13 14Circular details 29 30 29 32 33Total 83 73 74 81 87
0
10
20
30
40
50
60
70
80
90
100
Filaments Particles Circles Total
De tail
Score
Film
Hardcopy
3MP Monitor, Original Proc.
5MP Monitor, Original Proc.
5MP Monitor, Optimised Proc.
Th
resh
old
co
ntr
ast
(%)
Figure 2 TOR(MAM) results.
Archive
d on 2
2/03/2
017

NHSBSP September 2006 �
Evaluation of the Fuji Profect Computerised Radiography System
The CDMAM test object was used to assess the contrast detection threshold in more detail. Eight images were acquired under AEC control with the x-ray set operating at 28 kV with a molybdenum anode and filter. The images were scored visually using one of the 5 MP monitors. Images were also read automatically using the CDCOM software, and both sets of results were analysed following the procedure described by Young et al.3
Both visual assessment and automatic reading showed that the system met the ‘acceptable’ standard for all detail sizes from 0.1 mm to 1.0 mm. The results are shown in Figure 3.
0.1
1
10
100
0.01 0.1 1 10
De tail diame te r (mm)
Threshold nominal contrast (%)
HumanHuman (fitted)Predicted from autoPredicted (fitted)AcceptableAchievable
Th
resh
old
no
min
al c
on
tras
t (%
)
Figure 3 CDMAM results.
Archive
d on 2
2/03/2
017

Evaluation of the Fuji Profect Computerised Radiography System
NHSBSP September 2006 �
3.5 Dose assessment
The dose was initially assessed using the standard breast model (4.5 cm Perspex to simulate a 5.3 cm breast). As expected, the film dose was higher than the CR dose because a higher density setting was used (+ 1 com-pared with 0). The results are shown below in Table 6, together with a summary of two patient dose surveys (Jan–Mar 2005 for film and Apr–Jun 2004 for CR). The average oblique view mean glandular doses for breasts with thickness between 50 mm and 60 mm are within the national diagnostic reference level4 of 3.5 mGy for both film and CR.
Further details of the dose survey data are in Appendix 1.
Table 6 Summary of dose assessment
Standard breast Craniocaudal view Oblique view
Film CR Film CR Film CR
Mean dose (mGy) 1.72 1.61 1.55 1.60 1.88 2.24Mean thickness (mm) 53 53 52 50 51 55Mean S value – 136 – 66 – 62 Number of images – – 31 245 97 22
Mean dose for 50–60 mm – – – – 2.02 2.11Mean thickness for 50–60 mm – – – – 55 55
�. COMPARISON OF 3 MP AND 5 MP REPORTING WORKSTATION MONITORS
The Fuji FCR Profect CS computerised radiography system was installed at the West of Scotland Breast Screening Centre, Glasgow, in April 2004. At this time, Dome C3 monitors were supplied as reporting moni-tors, having 3 MP resolution. Commissioning and on-going tests included assessment of the image quality, using the TOR(MAX) and TOR(MAM) test objects.
On arrival of the new Totoku ME515L 5 MP reporting workstation monitors in October 2004, repeat image quality tests were carried out. These ensured that the image quality was still within NHSBSP recommended limits for CR systems, but also sought to detect any differences between the two types of monitor.
At the same time, adjustments were made to the pattern enhancement for mammography (PEM) coefficient and GA (contrast) settings. These parameters were set up at installation as:
GA = 2.3 PEM coefficient = 1
Experience with the system and feedback from other UK users led the Glasgow users to make adjustments in order to increase the contrast and enhancement coefficient values to:
GA = 2.7 PEM coefficient = 2
Before this GA adjustment, users were already manually increasing the GA value from 2.3 to 2.5.
The PEM coefficient increase would be expected to enhance the visibility of microcalcifications. The effect of these adjustments was also assessed.
Archive
d on 2
2/03/2
017
NHSBSP September 2006 �
Evaluation of the Fuji Profect Computerised Radiography System
�.� Measurements
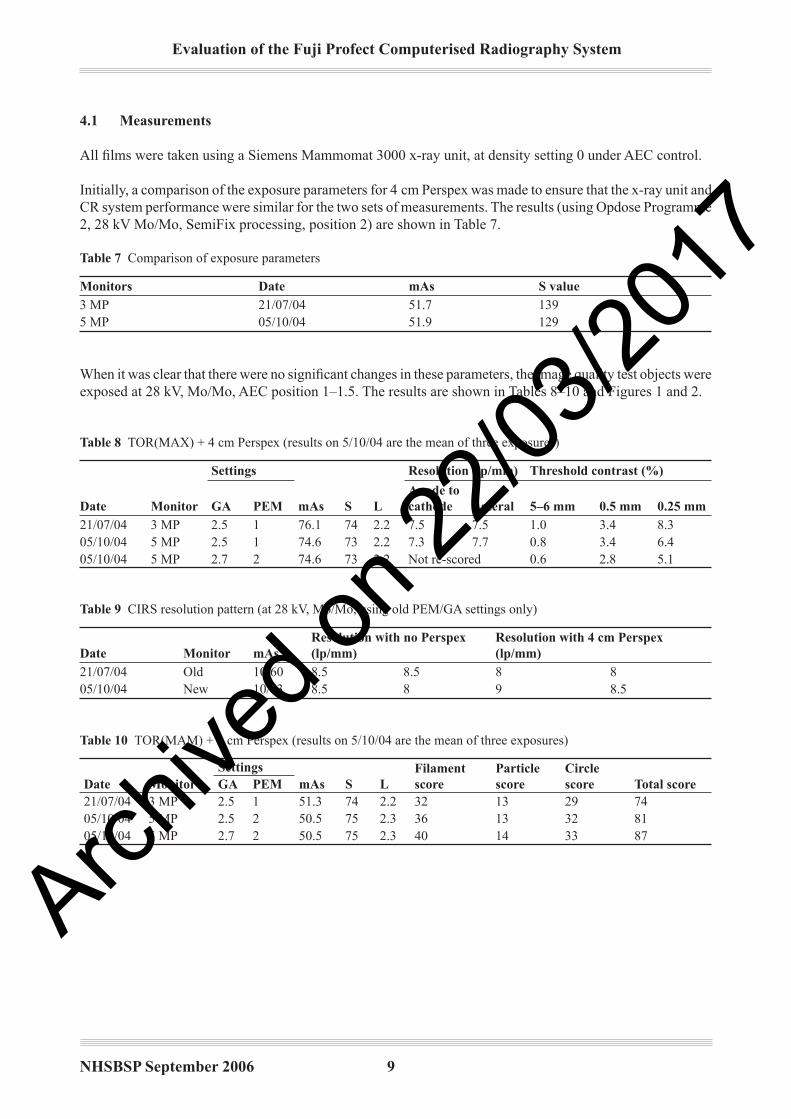
All films were taken using a Siemens Mammomat 3000 x-ray unit, at density setting 0 under AEC control.
Initially, a comparison of the exposure parameters for 4 cm Perspex was made to ensure that the x-ray unit and CR system performance were similar for the two sets of measurements. The results (using Opdose Programme 2, 28 kV Mo/Mo, SemiFix processing, position 2) are shown in Table 7.
Table � Comparison of exposure parameters
Monitors Date mAs S value3 MP 21/07/04 51.7 1395 MP 05/10/04 51.9 129
When it was clear that there were no significant changes in these parameters, the image quality test objects were exposed at 28 kV, Mo/Mo, AEC position 1–1.5. The results are shown in Tables 8–10 and Figures 1 and 2.
Table � TOR(MAX) + 4 cm Perspex (results on 5/10/04 are the mean of three exposures)
Date Monitor
Settings
mAs S L
Resolution (lp/mm) Threshold contrast (%)
GA PEMAnode to cathode Lateral 5–6 mm 0.5 mm 0.25 mm
21/07/04 3 MP 2.5 1 76.1 74 2.2 7.5 7.5 1.0 3.4 8.305/10/04 5 MP 2.5 1 74.6 73 2.2 7.3 7.7 0.8 3.4 6.405/10/04 5 MP 2.7 2 74.6 73 2.2 Not re-scored 0.6 2.8 5.1
Table � CIRS resolution pattern (at 28 kV, Mo/Mo, using old PEM/GA settings only)
Date Monitor mAsResolution with no Perspex (lp/mm)
Resolution with � cm Perspex (lp/mm)
21/07/04 Old 10/60 8.5 8.5 8 805/10/04 New 10/63 8.5 8 9 8.5
Table �0 TOR(MAM) + 3 cm Perspex (results on 5/10/04 are the mean of three exposures)
Date MonitorSettings
mAs S LFilament score
Particle score
Circle score Total scoreGA PEM
21/07/04 3 MP 2.5 1 51.3 74 2.2 32 13 29 7405/10/04 5 MP 2.5 2 50.5 75 2.3 36 13 32 8105/10/04 5 MP 2.7 2 50.5 75 2.3 40 14 33 87
Archive
d on 2
2/03/2
017
Evaluation of the Fuji Profect Computerised Radiography System
NHSBSP September 2006 �0
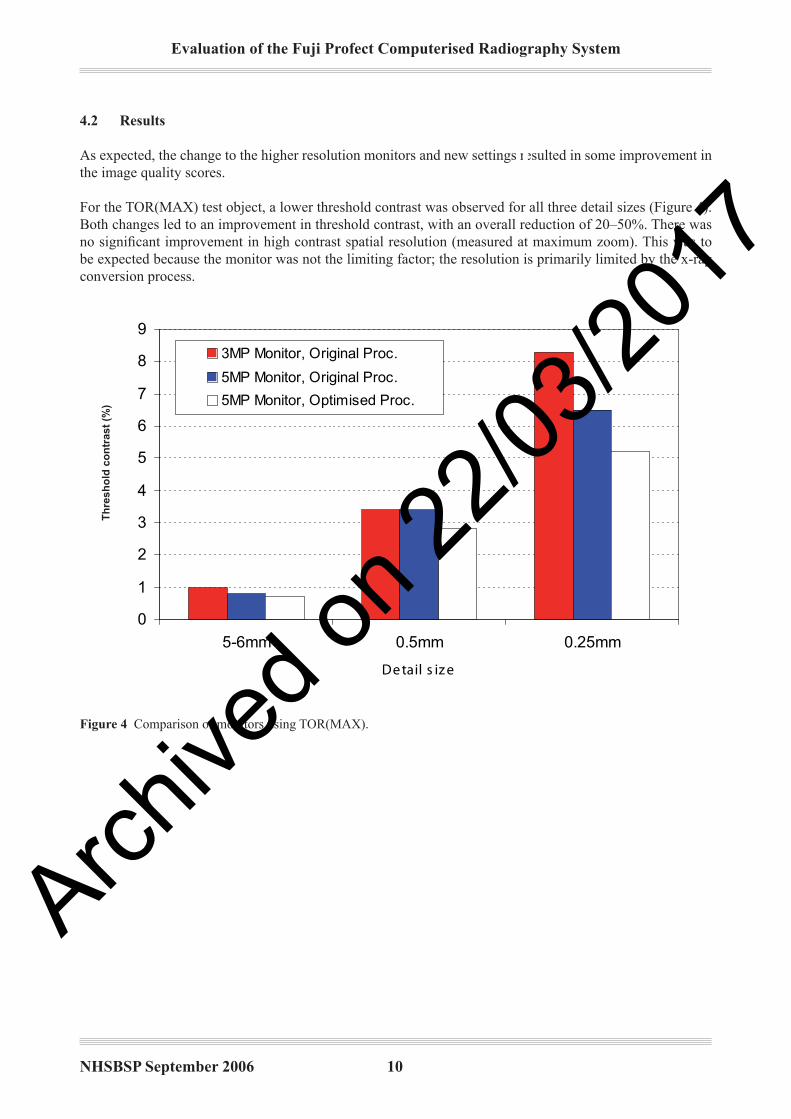
�.2 Results
As expected, the change to the higher resolution monitors and new settings resulted in some improvement in the image quality scores.
For the TOR(MAX) test object, a lower threshold contrast was observed for all three detail sizes (Figure 4). Both changes led to an improvement in threshold contrast, with an overall reduction of 20–50%. There was no significant improvement in high contrast spatial resolution (measured at maximum zoom). This was to be expected because the monitor was not the limiting factor; the resolution is primarily limited by the x-ray conversion process.
Th
resh
old
co
ntr
ast
(%)
0
1
2
3
4
5
6
7
8
9
5-6mm 0.5mm 0.25mm
De tail s iz e
Threshold contrast (%)
3MP Monitor, Original Proc.
5MP Monitor, Original Proc.
5MP Monitor, Optimised Proc.
Figure � Comparison of monitors using TOR(MAX).
Archive
d on 2
2/03/2
017
NHSBSP September 2006 ��
Evaluation of the Fuji Profect Computerised Radiography System
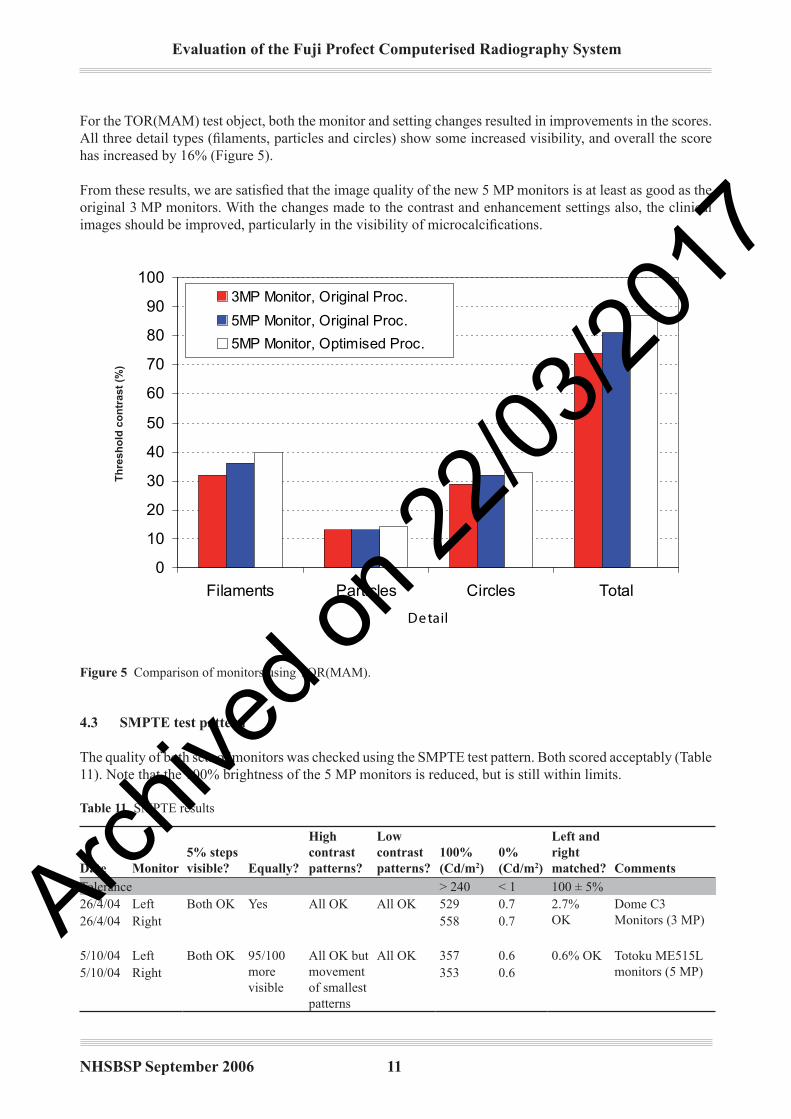
For the TOR(MAM) test object, both the monitor and setting changes resulted in improvements in the scores. All three detail types (filaments, particles and circles) show some increased visibility, and overall the score has increased by 16% (Figure 5).
From these results, we are satisfied that the image quality of the new 5 MP monitors is at least as good as the original 3 MP monitors. With the changes made to the contrast and enhancement settings also, the clinical images should be improved, particularly in the visibility of microcalcifications.
Th
resh
old
co
ntr
ast
(%)
0
10
20
30
40
50
60
70
80
90
100
Filaments Particles Circles Total
De tail
Score
3MP Monitor, Original Proc.
5MP Monitor, Original Proc.
5MP Monitor, Optimised Proc.
Figure 5 Comparison of monitors using TOR(MAM).
�.3 SMPTE test pattern
The quality of both sets of monitors was checked using the SMPTE test pattern. Both scored acceptably (Table 11). Note that the 100% brightness of the 5 MP monitors is reduced, but is still within limits.
Table �� SMPTE results
Date Monitor5% steps visible? Equally?
High contrast patterns?
Low contrast patterns?
�00% (Cd/m2)
0% (Cd/m2)
Left and right matched? Comments
Tolerance > 240 < 1 100 ± 5%26/4/04 Left Both OK Yes All OK All OK 529 0.7 2.7%
OKDome C3 Monitors (3 MP)26/4/04 Right 558 0.7
5/10/04 Left Both OK 95/100 more visible
All OK but movement of smallest patterns
All OK 357 0.6 0.6% OK Totoku ME515L monitors (5 MP)5/10/04 Right 353 0.6
Archive
d on 2
2/03/2
017

Evaluation of the Fuji Profect Computerised Radiography System
NHSBSP September 2006 �2
�.� Conclusions
• For both monitor sets, image quality was within NHSBSP recommended limits for CR systems.• Improvements in the detection of low contrast details were observed because of the new 5 MP monitors
and because of the adjustments in processing parameters (GA and PEM coefficient). Both changes resulted in similar levels of improvement. Overall, the TOR(MAM) score increased by 16% and the threshold contrast decreased by 20–50%.
• These changes should now be assessed clinically.• Further image quality improvement may be possible by continued optimisation of the processing
parameters.
�.5 Recommendations
Phantom images demonstrate the necessity of using 5 MP monitors for softcopy reporting. A variation in image quality was also demonstrated with differing processing settings. It is therefore essential that the image processing parameters are optimised.
5. CR SOFTCOPY REPORTING AT ASSESSMENT
During the evaluation period, there were intermittent problems with delays in sending images directly to the reporting monitors. This was an issue because the system was being evaluated in the assessment clinic and, therefore, radiologists were waiting for the images to arrive on the workstation. However, this problem seems to have been rectified by the installation of a gigabyte switch which has improved the speed of transfer of the images from the quality assurance (QA) workstation to the reporting monitor.
During the assessment clinics, the previous films were mounted on a Planilux viewer, which was adjacent to the reporting monitors. Initially, this created a problem with ambient light, but this was resolved by shielding the monitors from the light from the viewers or by switching off the viewers when the monitors were being used.
6. USABILITY OF THE SYSTEM
6.� Training
Two trainers attended the Fuji training course and then disseminated the training to other members of staff. This training is essential to ensure the efficient use of the system as quickly as possible. Some difficulties with training were experienced initially because a number of radiographers work part time in the screening programme. However, once staff were experienced, there were no serious issues with the use of the equip-ment. The training was very well delivered by Fuji, although possibly there could have been more in depth training for film readers.Arch
ived o
n 22/0
3/201
7

NHSBSP September 2006 �3
Evaluation of the Fuji Profect Computerised Radiography System
6.2 Ergonomic issues
Using the Fuji CR system involves the use of cassettes that are inserted into a bucky then into the reader for scanning. However, these plates are lighter than conventional film cassettes and, with the turbo release systems on the mammography units, the risk of repetitive strain injury should be less than with conventional film systems. The cassettes can be easily pushed into the reader with two hands.
Further ergonomic problems arose with the use of a computer with a keyboard and mouse. A risk assessment should be carried out when the QA workstations and reporting monitors are installed to ensure that adequate consideration is given to the position of the monitors and also to the position of the radiographers and radiolo-gists when viewing the monitors.
6.3 Archiving
Cases were archived to DVD. The use of a DVD has caused many problems and it is not recommended as a permanent archiving process. The problems have included loss of images, difficulty in archiving images in the correct format and the usability of formatting and changing DVDs when they are full.
6.� Recommendations
• The training course delivered by Fuji to a number of key trainers is essential in order to ensure the smooth introduction of the CR system. Consideration should be given to delivering an intensive training programme involving all radiographers using the system.
• A risk assessment should be carried out prior to the siting of the QA workstations and reporting monitors to ensure that viewing conditions are optimum and that the risk of repetitive strain injuries using a mouse is minimised.
• The use of DVDs is not recommended as a permanent archiving system. A picture archiving and communication system (PACS) should be integrated with the CR system.
�. IMAGE EVALUATION
A total of 132 images were evaluated (75 before the installation of 5 MP monitors and 57 after the installa-tion of 5 MP monitors) out of a total of 300 cases. The evaluation compared the softcopy images with the conventional film-screen images obtained at the screening appointment. Hardcopy images were not assessed at this stage. The criteria used were:
• breast background pattern• radiological classification of the lesion (see Appendix 2)• the comparative score of the zoom image vs magnification image.
The results are shown in Figures 6–10. Results are presented for the 5 MP monitors only because the image quality was better than with the 3 MP monitors.Arch
ived o
n 22/0
3/201
7

Evaluation of the Fuji Profect Computerised Radiography System
NHSBSP September 2006 ��
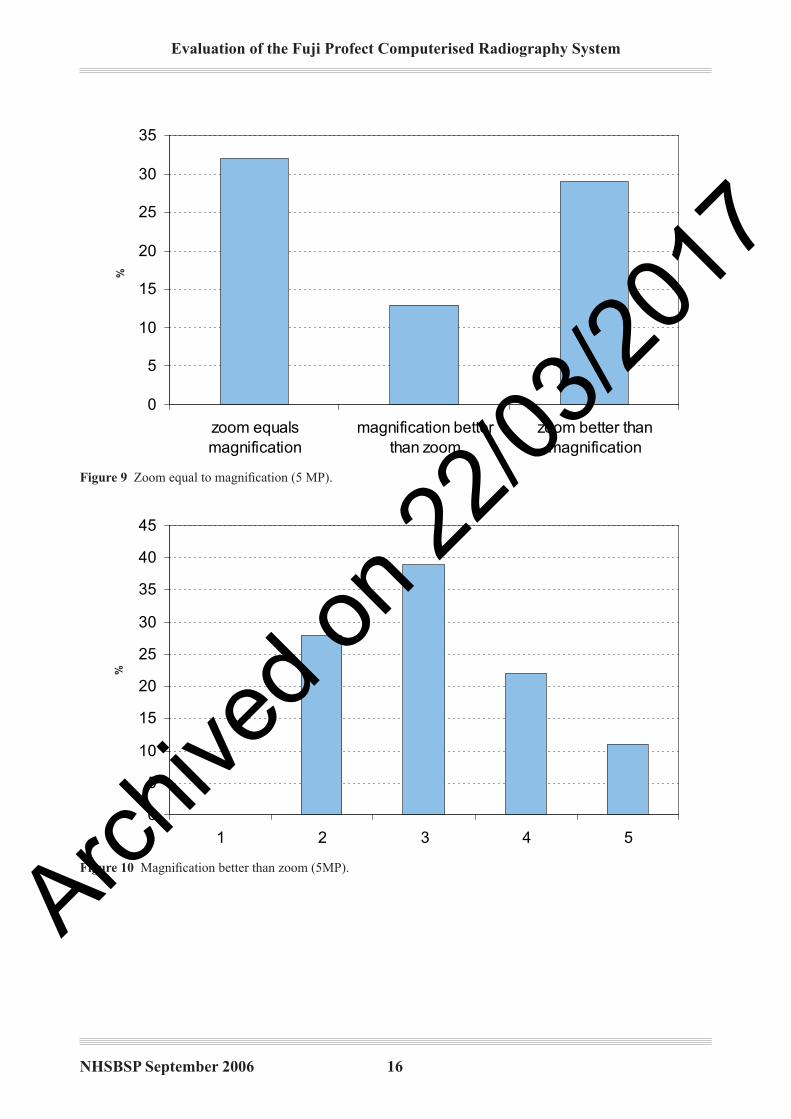
Figure 6 demonstrates that, in 57% of the 57 cases evaluated, the information obtained from using the zoom facility equated to the conventional magnification image using film-screen; 32% of the 57 cases demonstrated that the magnification view provided more information than the zoom; and 11% of the 57 cases demonstrated that the zoom view provided more information than the magnification view. The type of background breast tissue was also assessed in relation to the comparison of zoom and magnification. Figure 7 shows the distri-bution of cases in which zoom equalled the magnification. It can be seen that 37% of the cases were in fatty tissue compared with 33% in mixed and 30% in dense tissue. Figure 8 shows that, where magnification was better than zoom, the distribution was slightly different in that 11% of cases were in fatty tissue but 50% were in mixed and 39% were in dense tissue. Figure 9 demonstrates that 64% of the cases in which zoom equalled magnification were well defined opacities, 15% were microcalcifications and 15% were ill-defined opacities. Figure 10 shows that, where the magnification view has provided more information, 39% of the cases were well defined opacities, 28% were microcalcifications and 22% were microcalcifications with a well defined opacity.
In summary, the zoom facility equates to the conventional magnification view in slightly more than half of the cases assessed. The lesions predominantly demonstrated more clearly were well defined opacities.
%
57 c a s es with 5MP m onitors
0
5
10
15
20
25
30
35
zoom equalsmagnification
magnification betterthan zoom
zoom better thanmagnification
%
Figure 6 Fifty-seven cases with 5 MP monitors.
Archive
d on 2
2/03/2
017

NHSBSP September 2006 �5
Evaluation of the Fuji Profect Computerised Radiography System
%
Zoom = Ma gnific a tion
0
5
10
15
20
25
30
35
40
fatty mixed dense
%
Figure � Zoom equal to magnification.
%
Ma gnific a tion better tha n Zoom
0
10
20
30
40
50
60
fatty mixed dense
%
Figure � Magnification better than zoom.
Archive
d on 2
2/03/2
017
Evaluation of the Fuji Profect Computerised Radiography System
NHSBSP September 2006 �6
%
57 c a s es with 5MP m onitors
0
5
10
15
20
25
30
35
zoom equalsmagnification
magnification betterthan zoom
zoom better thanmagnification
%
Figure � Zoom equal to magnification (5 MP).
%
Ma gnific a tion better tha n Zoom 5MP
0
5
10
15
20
25
30
35
40
45
1 2 3 4 5
%
Figure �0 Magnification better than zoom (5MP).
Archive
d on 2
2/03/2
017

NHSBSP September 2006 ��
Evaluation of the Fuji Profect Computerised Radiography System
�. CONCLUSIONS
The evaluation of the Fuji Profect computerised radiography system has demonstrated that it meets the image quality standards in the NHSBSP1 and EUREF5 protocols.
There are demonstrable benefits in the breast screening assessment process for women.
There was a noticeable improvement in the image quality when the 3 MP reporting monitor was replaced by a 5 MP monitor.
The image quality of the Fuji Profect CR system meets NHSBSP standards. However, processing parameters affect image quality and these settings must be optimised.
Softcopy reporting generally worked satisfactorily in the assessment clinic. The siting of the monitor is impor-tant, particularly when using a viewing box for comparison with film-screen images.
The CR system integrated well with a Siemens 3000 and a GE DMR unit. No additional calibration of the AEC was required. It may also be possible to reduce the dose, but this was not fully evaluated. The dose remained the same as using film-screen combinations.
REFERENCES
1. Commissioning and Routine Testing of Full Field Digital Mammography Systems. NHS Cancer Screening Programmes, 2004 (NHSBSP Equipment Report 0604).
2. Computed Radiography (CR) Systems for Mammography. Fuji FCR 5000 mA and FCR Profect CS. A Technical Report. MHRA, 2004 (MHRA Report 04094).
3. Young KC, Cook JJH, Oduko JM, Bosmans H. Comparison of software and human observers in reading images of the CDMAM test object to assess digital mammography systems. In: Proceedings of SPIE, 2006, 6142: 614206.
4. Guidance on the Establishment and Use of Diagnostic Reference Levels for Medical X-ray Examinations. Institute of Physics and Engineering in Medicine, 2004 (IPEM Report 88).
5. Van Engen R, Young KC, Bosmans H, Thijssen M. The European protocol for the quality control of the physical and technical aspects of mammography screening. Part B. Digital mammography. In: European Guidelines for Breast Cancer Screening, 4th edn. European Commission, 2006 (in press and available in draft on line at www.euref.org).
Archive
d on 2
2/03/2
017
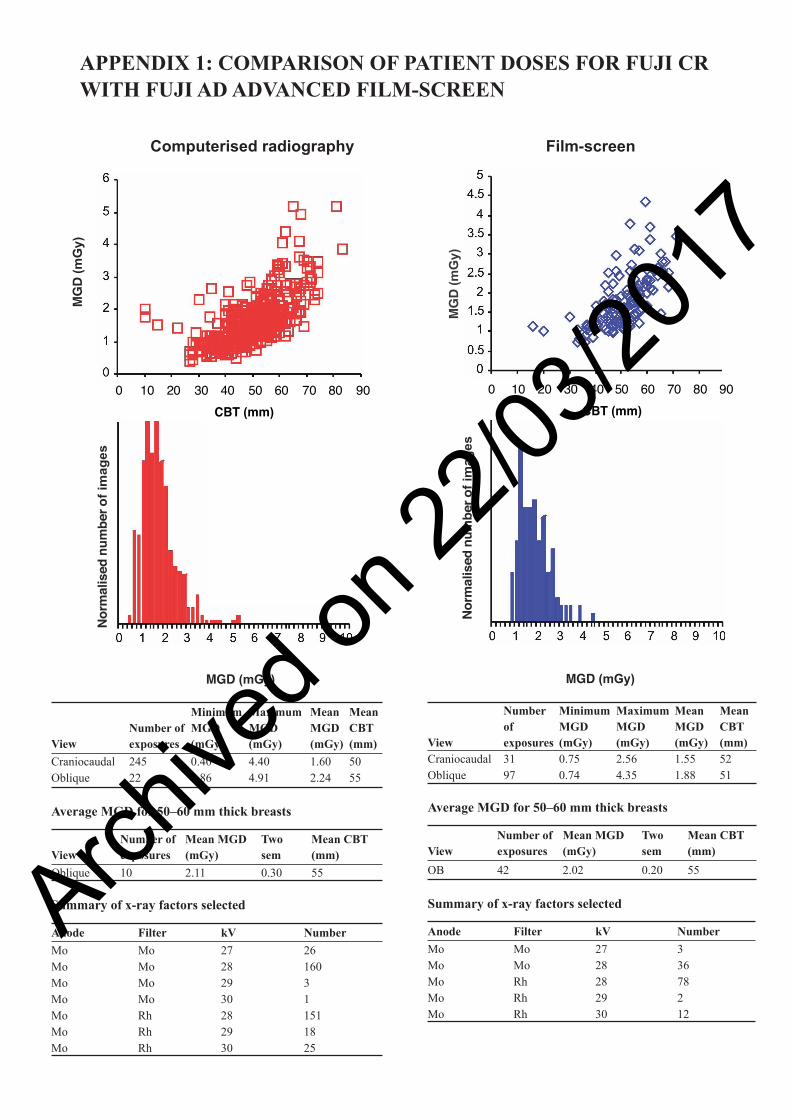
APPENDIX �: COMPARISON OF PATIENT DOSES FOR FUJI CR WITH FUJI AD ADVANCED FILM-SCREEN
Computerised radiography Film-screen
ViewNumber of exposures
Minimum MGD (mGy)
Maximum MGD (mGy)
Mean MGD (mGy)
Mean CBT (mm)
Craniocaudal 245 0.40 4.40 1.60 50Oblique 22 0.86 4.91 2.24 55
Average MGD for 50–60 mm thick breasts
ViewNumber of exposures
Mean MGD (mGy)
Two sem
Mean CBT (mm)
Oblique 10 2.11 0.30 55
Summary of x-ray factors selected
Anode Filter kV Number
Mo Mo 27 26Mo Mo 28 160Mo Mo 29 3Mo Mo 30 1Mo Rh 28 151Mo Rh 29 18Mo Rh 30 25
View
Number of exposures
Minimum MGD (mGy)
Maximum MGD (mGy)
Mean MGD (mGy)
Mean CBT (mm)
Craniocaudal 31 0.75 2.56 1.55 52Oblique 97 0.74 4.35 1.88 51
Average MGD for 50–60 mm thick breasts
ViewNumber of exposures
Mean MGD (mGy)
Two sem
Mean CBT (mm)
OB 42 2.02 0.20 55
Summary of x-ray factors selected
Anode Filter kV Number
Mo Mo 27 3Mo Mo 28 36Mo Rh 28 78Mo Rh 29 2Mo Rh 30 12
0 10 20 30 40 50 60 70 80 90CBT (mm)
0 10 20 30 40 50 60 70 80 90 CBT (mm)
MGD (mGy) MGD (mGy)
Nor
mal
ised
num
bero
f im
ages
MG
D (m
Gy)
Nor
mal
ised
num
bero
fim
ages
MG
D (m
Gy)
Archive
d on 2
2/03/2
017

NHSBSP September 2006 ��
Evaluation of the Fuji Profect Computerised Radiography System
APPENDIX 2: RADIOLOGICAL CLASSIFICATION
1. Normal 2. Microcalcification a. casting b. non-casting 3. Well defined opacity 4. Mainly well defined opacity with calcification 5. Mainly ill-defined opacity 6. Mainly ill-defined opacity with calcification 7. Parenchymal distortion, no centre 8. Parenchymal distortion, no centre and microcalcification 9. Asymmetry 10. Asymmetry and microcalcification 11. Parenchymal distortion, with centre 12. Parenchymal distortion, with centre and calcification
Archive
d on 2
2/03/2
017

Evaluation of the Fuji Profect Computerised Radiography System
NHSBSP September 2006 20
Archive
d on 2
2/03/2
017