22/263/04 radiation protection - · pdf file22/263/04 i radiation protection human alimentary...
TRANSCRIPT
22/263/04
i
RADIATION PROTECTION
HUMAN ALIMENTARY TRACT MODEL FOR RADIOLOGICAL PROTECTION
A draft document by a Task Group of Committee 2 of The International
Commission on Radiological Protection
(29 June - 16 August 2004)
DRAFT DOCUMENT
Information contained in this document is preliminary and only for internal use by ICRP. This document should not be cited in
any published material until final approval by the Commission of ICRP
Human Alimentary Tract Model – Preface -29 Jun-:5 August 2004
ii
CONTENTS Page Preface Glossary 1.Introduction 1 1.1. The purpose of this report 1 1.2. Model used in ICRP Publication 30 2 1.3. The need for a new model 3 1.4. Model development 5 1.5. Structure of the report 6 2. Anatomy and physiology of the alimentary system 11 2.1. Introduction 11 2.2. General issues 11 2.3. Alimentation 13 2.4. Vascular supply and drainage 14 2.5. Microanatomy of the alimentary tract 15 2.6. Epithelia of the alimentary tract 18 3. Absorption, retention and secretion of radionuclides in the human alimentary tract
23
3.1. Introduction 23 3.2. Radionuclide absorption 24 3.3. Radionuclide retention 29 3.4. Radionuclide secretion 35 3.5. Examples used in this report 37 4. Radiation effects 53 4.1. Introduction 53 4.2. Target cells 54 4.3. Radiation-induced cancers in humans 56 4.4. Tissue damage 60 5. Description of the human alimentary tract model 67 5.1. Introduction 67 5.2. Main differences from the ICRP publication 30 model 69 5.3. Details of the model structure 70 5.4. Radionuclide - specific examples of the use of the model 76 6. Transit times through the alimentary tract 79 6.1. Introduction 79 6.2. Mouth 80 6.3. Oesophagus 82 6.4. Stomach 84 6.5. Small intestine 87 6.6. Colon and rectum 89
6.7. Uncertainty and variability 92 7. Morphometry and Dosimetry 103
Human Alimentary Tract Model – Preface -29 Jun-:5 August 2004
iii
7.1. Introduction 103 7.2. Morphometry 103 7.3. Dosimetry 115
8. Use of the model 127
8.1. Introduction 127 8.2. Examples of doses using the HATM 127 8.3. Uncertainties 135 8.4. Key features of the HATM 142
Human Alimentary Tract Model – Preface -29 Jun-:5 August 2004
iv
PREFACE
A Task Group was appointed by Committee 2 to review the dosimetric model of the
gastrointestinal tract used in ICRP Publication 30 (1979) and recommend revisions. The
revised model described in this publication is applicable to children as well as adults. The
new model will be used in future ICRP publications giving dose coefficients for radionuclide
intakes following either occupational or environmental exposures. It will also be used in
publications concerned with the interpretation of bioassay measurements.
The members of the Task Group were:
H. Métivier, (Chairman) D. Melo
J.F. Bertholon D. Nosske
J.D. Harrison A.W. Phipps
J.H. Hendry F. Paquet
R. Leggett M. Simko
Ex-officio members providing advice and ensuring consistency with the work of other
Committee 2 Task Groups were:
B.B. Boecker, Reference Man TG Chairman
J.W. Stather Internal Dosimetry TG Chairman
K.F. Eckerman Dose calculations TG Chairman
Corresponding members providing advice and reviewing reports drafts were:
M. R. Bailey C.S. Potten
Chen Xing-an M.G. Stabin
N. Griffiths J.B. Stubbs

Human Alimentary Tract Model – Preface -29 Jun-:5 August 2004
v
During this period of preparation of this report, the membership of Committee 2 was:
1997-2000
A. Kaul (Chairman)
B.B. Boecker J.L. Lipzstein
A. Bouville H. Métivier
Chen Xing-an H. Paretzke
G. Dietze A. R.Reddy
K.F. Eckerman M. Roy
F.A. Fry J.W. Stather, Vice-Chairman
J. Inaba D.M. Taylor, Secretary
I.A. Likhtarev T. Wohni
2001-2005
C. Streffer (Chairman)
M. Balonov J.L. Lipzstein
B.B. Boecker H.G. Menzel
A. Bouville H. Métivier
G. Dietze H. Paretzke
K.F. Eckerman A.S. Pradhan
F.A. Fry J.W. Stather, Vice-Chairman
J. Inaba D.M. Taylor, Secretary
I.A. Likhtarev Y. Zhou
Human Alimentary Tract Model – Preface -29 Jun-:5 August 2004
vi
GLOSSARY OF TERMS
This glossary is presented in two parts: the first relates to terms used in radiological protection and
radionuclide dosimetry; the second relates to anatomical and physiological terms.
Dosimetry and Biokinetics
Absorbed dose the physical dose quantity given by
D= dε/dm
where dε is the mean energy imparted by ionising radiation to the matter in a volume element
and dm is the mass of the matter in the volume element. The SI unit for absorbed dose is
joule per kilogram (J kg-1) and its name is gray (Gy).
Absorbed Fraction (AF(T ← S)R)
the fraction of energy emitted as a specific radiation type R in a specified source region S,
which is absorbed in a specified target tissue T.
Alimentary tract transfer factor fA
the alimentary tract transfer factor, fA, is defined as the fraction of activity entering the
alimentary tract that is absorbed from the gut in the absence of both radioactive decay losses
and endogenous input to the tract.
Committed Effective Dose (E(τ)
the sum of the products of the committed equivalent doses in organs or tissues and the
appropriate organ or tissue weighting factors (WT), where �is the integration time in years
following the intake. The integration time is 50 y for adults and from intake to age 70 y for
children.
Committed Equivalent Dose (HT(�)) the time integral of the equivalent dose rate in a particular tissue or organ that will be received
by an individual following intake of radioactive material into the body, where � is the
integration time in years following the intake. The integration time is 50 y for adults and from
intake to age 70 y for children.
Dose Coefficient
committed equivalent dose in organ or tissue T per unit intake hT(�) or committed effective
Human Alimentary Tract Model – Preface -29 Jun-:5 August 2004
vii
dose per unit intake e(�), where � is the time period in years over which dose is calculated
(i.e.) 50 y for adults and (70-t0)Y for children. Note that elsewhere the term "dose pert unit
intake(SvBq-1) is used fir dose coefficient.
Effective Dose (E)
the sum of the weighted equivalent doses in all tissues and organs of the body, given by the
expression:
E = Σ wTH T
T
where HT is the equivalent dose in tissue or organ, T, and wT is the weighting factor for tissue
T.
Equivalent Dose (HT)
the equivalent dose, H T,R, in tissue or organ T due to radiation R, is given by:
H T,R = wR D T,R
Where D T,R is the average absorbed dose from radiation R in tissue T and wR is the radiation
weighting factor which is based on the quality of the radiation emitted by the source. Since
WR is dimensionless, the unit is the same as for absorbed dose, J kg-1, and its name is
Sievert (Sv). The total equivalent dose HT, is the sum of H T,R over all radiation types
H T = ΣH T,R
R
will be replaced by radiation weighing dose
Gray (Gy) the special name for the SI unit of absorbed dose: 1 Gy = 1 J kg -1
HATM
the ICRP human alimentary tract model
HRTM
the ICRP human respiratory tract model (ICRP, 1994)
Organ Dose
the tissue or organ average absorbed dose D T is given by
DT = εT / mT
where εT is the total energy imparted in a tissue or organ T and mT is the mass of the tissue or
organ.
Radiation weighting factor (wR)
the radiation weighting factor is a dimensionless factor to derive the equivalent dose from the
Human Alimentary Tract Model – Preface -29 Jun-:5 August 2004
viii
absorbed dose averaged over a tissue or organ and is based on the quality of radiation and its
relative biological effectiveness (ICRP, 1991)
SAF specific Absorbed Fraction : Absorbed fraction in a tissue divided by the mass of the tissue
Source region (S) region within the body containing the radionuclide. The region may be an organ, a tissue, the
contents of the gastrointestinal tract or urinary bladder, or the surfaces of tissues as in the
skeleton an the respiratory tract.
Specific Effective Energy (SEE(T ←S)R)
the energy, suitably modified by the radiation weighting factor, imparted per unit mass of a
target tissue , T , as a consequence of the emission of a specified radiation, R, from
transformations occurring in the source region S expressed as Sv(Bq s) -1.
Sievert (Sv) the special name for the SI unit of equivalent dose and effective dose: 1 Sv = 1 J kg -1
Target Tissue
tissue or organ in which radiation is absorbed
Transfer compartment the compartment introduced for mathematical convenience into most of the biokinetic models
used in this report to account for the translocation of the radioactive material through the body
fluids from where they are deposited in tissues.
transfer coefficients Fractional transfer of compartmental content per unit time.
Transit times
the transit time of an atom in a region of the tract is the length of time that it resides in that
region. The transit time of a substance in a region is the mean of the distribution of transit
times of its atoms.
Tissue weighting factor (wT)
the factor by which the equivalent dose in a tissue or organ is weighted to represent the
relative contributions of that tissue or organ to the total detriment resulting from uniform
irradiation of the body
Human Alimentary Tract Model – Preface -29 Jun-:5 August 2004
ix
Uptake activity that enters to the body fluids from the respiratory tract, alimentary tract or through the
skin.
Physiology Acinus:
groups of pancreatic cells which are single layers of pyramidal cells containing zymogen
granules. The term acinus refers to the shape which resembles a berry.
Alimentary tract: the tube from mouth to anus in which food is digested.
Alimentation the intake, digestion and absorption of nutrients.
Amino acids:
biological acids which contain an amine group (NH2) and are the basic unit of proteins. In the
process of digestion, proteins, which are large polypeptides, are broken down to smaller
peptides, and ultimately to their constituent amino acids.
Appendix (Vermiform appendix) :
a small blind-ended projection from the caecal region of the large intestine. It is highly
vascularised and is characterised by the preponderance of lymphoid tissue and small
numbers of crypts in its epithelial lining.
Bile :
bile is produced and secreted by the liver, stored in the gall bladder, and then released into the
duodenum. Bile is a complex mixture of organic (bile acids, phospholipids, cholesterol,
bilirubin, immunoglobulin A) and inorganic solutes (Na, K+ Cl, Ca2+). It helps digestion by
emulsifying lipids and also contains excretory materials.
Bolus :
“rounded mass” of food in the oesophagus or intestinal contents which stimulates sensory
stretch receptors to initiate the peristaltic reflex of the oesophageal or intestinal wall
responsible for the movement of alimentary tract contents.
Human Alimentary Tract Model – Preface -29 Jun-:5 August 2004
x
Brunner’s glands : situated in the duodenum in the sub-mucosa below the villi. These glands secrete mucus and
bicarbonate in response to the passage of chyme from the stomach; the bicarbonate
neutralises acid from the stomach.
Cardiac Sphincter : close to the heart or cardia. Muscular sphincter controlling the opening between the stomach
and the esophagus (gastroesophageal).
Caecum :
large cul-de-sac at the beginning of the large intestine, continuous with the ascending colon
Colon :
the colon (adj colonic) is the largest part of the large intestine and can be regarded as
comprising four regions: ascending, transverse, descending and sigmoid. It is the final site of
fluid and electrolyte absorption in addition to absorption of short chain fatty acids. The
presence of bacteria in the colonic lumen is important for the digestion of dietary fibre.
Chylomicron :
intracellular chylomicrons are formed in intestinal epithelial cells to facilitate the passage of
fatty acids which are enveloped by a hydrophobic coating made up of protein, phospholipid
and cholesterol. Chylomicrons which are particularly small (hence micro) are absorbed via the
lacteals and then pass into the general circulation via the lymphatic system.
Chyme :
the product of digestion in the stomach – a smooth fluid which passes to the small intestine
where further digestion occurs.
Crypts: crypts of Lieberkühn are invaginations of the epitheliium lining the small and large intestines,
containing a number of different cell types including undifferentiated stem cells which are near
the crypt base. In the small intestine, the crypts lie below the villi (around 5-7 crypts per
villus). There are no villi in the large intestine.
Deglutition :
process of swallowing which is under both voluntary and involuntary control.
Digestion :
process of breakdown, absorption and utilisation of ingested material which is initiated in the
mouth by mastication and salivary secretions and continues along the length of the
Human Alimentary Tract Model – Preface -29 Jun-:5 August 2004
xi
gastrointestinal tract. Involves the breakdown of large insoluble food molecules into soluble
constituents that can be absorbed through the intestinal epithelium.
Duodenum :
the duodenum is the initial part of the small intestine which begins at the pylorus and is around
25 cm long. It is devoid of mesentery and contains Brunner’s glands as well as ducts which
allow entry of pancreatic and hepatic secretions.
Enteroendocrine cells: small minority of cells found on the epithelium of the stomach, small and large intestine in both
villi and crypts. They contain secretory vesicles which contain bioactive amines (5-
hydroytryptamine – enterochromaffin cells) or peptides (D cells – somatostatin, N cells –
neurotensin etc). Endocrine cells may produce more than one peptide or amine.
Exocrine gland :
formed by epithelial cells which form an infolding of an epithelial layer to form a tube. They
may be either simple or compound. The glands secrete in an outward direction into the “milieu
exterieur” such as in the pancreas (enzymes), liver (bile) and intestine (mucus).
Faeces : eliminated waste products of digestion. Faeces contain material from sloughed intestinal cells,
microorganisms and excretory materials, as well as undigested food materials.
GALT : Gut Associated Lymphoid Tissue which includes Peyer’ patches, intra-epithelial lymphocytes,
and isolated lymphoid follicles (ILF).
Goblet cells :
differentiated intestinal epithelial cells which may be capable of division, located in crypts and
on villi. These cells synthesise and secrete mucins which are of primary importance in
maintaining the barrier between the intestinal mucosa and the luminal environment. They
increase in frequency from the jejunum to the ileum. The colon has a high density of goblet
cells.
Hormone :
some functions of the alimentary tract are regulated by mediators acting as hormones
(endocrines). These hormones are polypeptides, produced by endocrine cells scattered
throughout the intestinal epithelium. They include gastrin, secretin, cholecystokinin and
gastric inhibitory protein, and their actions include control of secretions, epithelial cell division
rates, and intestinal motility.
Human Alimentary Tract Model – Preface -29 Jun-:5 August 2004
xii
Ileum :
the third and final region of the small intestine. It is continuous with, and difficult to delineate
from, the jejunum, although villi are shorter and less numerous and Peyers patches are larger
and more numerous.
Jejunum :
the second region of the small intestine, following from the duodenum and continuous with the
ileum. The villi are larger and more numerous than in the ileum and there are circular folds
(valves of Kerring) which are large. These folds retard the digesta and provide an increased
area for absorption. This section of the small intestine has the largest absorptive surface area
in addition to a thick muscular wall.
Large intestine: the large intestine is around 1m long in the adult. It begins at the ileocaecal valve and consists
of the caecum and appendix; the ascending, transverse, descending and sigmoid colon, and
the rectum.
Liver : the liver is the largest organ in the abdominal cavity. It performs a multitude of metabolic
functions in connection with homeostasis, alimentation and defense. It serves both as an
exocrine gland, secreting bile through a system of ducts into the gall bladder and hence into
the duodenum, and as an endocrine gland, synthesizing a variety of substances that are
released directly to blood. It receives blood flowing from the intestinal tract via the hepatic
portal vein as well as blood from the general circulation via the hepatic artery.
M Cells : or microfold cells, are specialised epithelial cells occurring in the domed luminal surface of
Peyer’s patches, which are aggregates of lymphoid tissue, forming part of the Gut Associated
Lymphoid Tissue (GALT). These cells have very few microvilli and are able to transport
macromolecules and other luminal contents non-selectively in bulk. They act as antigen
sampling cells, transporting these molecules to underlying leucocytes.
Micelle :
molecular aggregates (e.g. bile acid – long chain fatty acid) which have a hydrophobic surface
with a lipophilic core. Absorption of fats are facilitated by the formation of micelles.
Mucus :
a protective viscoelastic, lubricant layer which covers the entire gastrointestinal tract which
protects the underlying epithelial surface. Mucus composition varies in the different regions of
Human Alimentary Tract Model – Preface -29 Jun-:5 August 2004
xiii
the gastrointestinal tract (gastric versus colonic, for example), depending on the mucin
content.
Mucins:
mucins are synthesised and stored in goblet cells and are secreted throughout the
gastrointestinal tract. They are high molecular weight glycoproteins comprising core peptides
and oligosaccharides.
Neutral Fat : fats are organic salts or esters, composed of three fatty acids combined with a glycerol
molecule to form a triglyceride.
Oesophagus ;
tubular part of the alimentary tract that connects the mouth and stomach. British texts write
oesophagus while American ones write esophagus. Sphincters exist at both ends, the upper
oesophageal sphincter which prevents entry of air into the oesophagus and the lower
sphincter which prevents reflux of gastric contents.
Pancreas :
a gland containing two types of secreting cells: the endocrine cells which secrete hormones
into the blood; and the exocrine cells which secrete digestive enzymes and juices into the
pancreatic duct which joins with the bile duct from the liver to empty into the duodenum.
Paneth cells :
these cells are found at the base of crypts (not in all species) in the small intestine, and
possess an apical membrane with multiple short microvilli. These cells contain membrane-
bound granules which contain high activities of lysozyme which has bacteriolytic activity.
Defensin-like peptides – termed cryptidins are also secreted by these cells. In species where
Paneth cells are present (man, rodents, ruminants) they increase in number from the
duodenum to the ileum.
Peristalsis :
the process of sequential contraction and relaxation of circular muscles in the oesophagus and
other regions of the alimentary tract that propel material aborally. During digestion in the small
intestine, most contractions are segmenting to achieve mixing rather than the coordinated
contractions required for peristalsis but bursts of peristalsis occur periodically.
Pharynx :
the pharynx, situated behind the nasal cavities, mouth and larynx, is a connecting tube. The
upper region above the soft palate, the nasopharynx, connects to the nasal passages. The
Human Alimentary Tract Model – Preface -29 Jun-:5 August 2004
xiv
mid region, the oropharynx, connects to the mouth. The laryngeal region connects to the
larynx and also continues behind the larynx to the oesophagus.
Portal vein :
the portal vein conveys blood from the stomach, small intestine, colon, pancreas and spleen,
to the liver. This allows the liver first-pass control of the entry of nutrient molecules into the
general circulation.
Pylorus :
aboral end of the stomach close to the duodenum which comprises the pyloric antrum
(storage), pyloric canal, and the pyloric sphincter which regulates release of chyme into the
duodenum.
Rectum
continuous with the sigmoid colon. It stores faeces prior to defecation. The rectal mucosa has
both longitudinal and horizontal folds.
Rugae
large folds in the stomach lining caused by folding of the submucosal connective tissue,
present when the stomach is contracted but obliterated when the wall is stretched as a result
of gastric distension.
Salivary Glands
these are exocrine glands which secrete saliva containing both organic (mucus, amylase) and
inorganic (Na+, Cl-, K+ and HCO3-) constituents. They are the parotid (near the ear), sublingual
(under tongue) and submandibular (under the mandible) glands.
Segmentation movements :
most of the contractions of the small intestine are of this type and serve to constantly mix the
chyme and bring it into contact with the intestinal epithelial wall for digestion and absorption.
Small intestine: comprises the duodenum, jejunum and ileum.
Sphincter : a ring of muscle occurring at various points along the alimentary tract, that can occlude the
tube and control the movement of the contents.
Human Alimentary Tract Model – Preface -29 Jun-:5 August 2004
xv
Stomach :
enlarged section of the alimentary tract which receives and temporarily stores food. Acid and
enzymes are secreted into the lumen for digestion of ingested material which is then broken to
form chyme. The stomach is divided into three sections: the fundus, corpus and antrum.
Stem cells :
undifferentiated cells, located at the base of intestinal crypts and in the basal layer of stratified
epithelium. These cells maintain proliferative activity and differentiation occurs during
subsequent cell divisions. (They are referred to as pluripotent stem cells because of their
ability to give rise to different cell types).
Sugars :
sugars are carbohydrates. Simple sugars such as glucose, fructose and lactose are
monosaccharides; they are the soluble products of digestion. Disaccharides are also soluble
sugars (sucrose, for example). The main carboydrate constituents of food are the insoluble
storage polysaccharides, starch (plants) and glycogen (animals).
Tongue :
muscular structure in the mouth which plays an important part in chewing, swallowing, tasting
and speaking. Its surface is dotted with papillae which give the tongue its rough surface. Also
on the surfaces of the tongue are a number of taste buds or receptors.
Tonsils :
these structures found in the oral cavity – pharynx and are part of the Gut Associated
Lymphoid Tissue (GALT). They are lymphoid structures, containing T and B cells.
Trypsin and chymotrypsin :
digestive enzymes, secreted by the pancreas, that hydolyse peptide bonds of polypeptides
and proteins.
Villi : villi are projections of the small intestinal mucosa into the lumen. They are covered by
epithelial cells which possess many microvilli on the luminal membrane which again increases
the absorptive surface area. Villi are broad in the duodenum, tall leaf-like structures in the
jejunum and short finger-like processes in the ileum. Within each villus is a capillary arteriole
and a venule which surround the central lacteal (lymphatic vessel). In addition each villus is
supplied by nerve fibres and smooth muscle fibres which allow the villus to move back and
forth in the chyme to facilitate absorption.
Human Alimentary Tract Model – Introduction - 29 June-6 August 2004
1
1. INTRODUCTION
1.1. The purpose of this report
(1) This report provides a new model for the human alimentary tract that replaces the model 5 for the gastrointestinal tract adopted by ICRP in Publication 30 (ICRP, 1979). The
Publication 30 model was developed specifically to calculate doses to workers, either from
the direct ingestion of radionuclides or following their inhalation as particles with subsequent
escalation from the lungs to the alimentary tract. The model took account of transit of
ingested materials through four regions of the alimentary tract: the stomach, small intestine, 10 upper large intestine and lower large intestine. The absorption of radionuclides to blood was
specified by values of fractional uptake (f1) from the small intestine.
(2) This replacement was motivated by a number of developments:
• More extensive and reliable data on gut transit of materials have become available 15 using new techniques such as non-invasive scintigraphic procedures.
• Information has become available on the location of sensitive cells and retention of
radionuclides in different regions of the alimentary tract.
• The 1990 recommendations of ICRP introduced specific risk estimates and tissue
weighting factors, wT, for radiation-induced cancer of the oesophagus, stomach and 20 colon (ICRP, 1991), requiring dose estimates for each of these regions. The
Publication 30 model did not include the oesophagus and treated the colon as two
regions – upper and lower large intestine.
(3) The Publication 30 model, although intended for the calculation of doses for the 25 occupational exposure of adults, has been applied to calculate dose coefficients for
members of the public, including children. Thus, in Publications 56, 67, 69, 71 and 72
(ICRP, 1989, 1993, 1995a,b, 1996), dose coefficients for infants and children were
calculated by scaling the Publication 30 model to take account of the smaller mass of the gut
in children. Increased intestinal absorption of radionuclides by infants was also taken into 30 account but age-dependent differences in transit times were not included.
(4) The new human alimentary tract model (HATM) is applicable to children and adults under
all circumstances of exposure. It considers the movement of radionuclides throughout the
alimentary tract from ingestion to elimination. It takes account of sites of radionuclide 35 absorption and retention in the alimentary tract and routes of excretion of absorbed
Human Alimentary Tract Model – Introduction - 29 June-6 August 2004
2
radionuclides into the alimentary tract. Doses are calculated for sensitive cells in each region:
mouth, oesophagus, stomach, small intestine and colon.
1.2. Model used in ICRP Publication 30
5 (5) In 1966, Eve reviewed data on the transit of materials through the alimentary tract and
other parameters necessary to calculate doses (Eve, 1966). Transit times were based
largely on information from clinical studies using barium meals. Reference was also made
to studies using materials labelled with iron-59 or lanthanum-140. These data provided the
basis for the dosimetric model of the alimentary tract developed by Dolphin and Eve (Dolphin 10 and Eve, 1966) and applied in ICRP Publication 30 (1979). It is a catenary model with four
compartments: the stomach, small intestine, upper large intestine and lower large intestine.
The absorption of materials to blood is taken to occur in the small intestine. The transfer
rate coefficients for movement of intestinal contents are equal to the reciprocal of the mean
residence times, taken to be 1 hour for the stomach, 4 hours for the small intestine, 13 hours 15 for the upper large intestine and 24 hours for the lower large intestine. These values were
based on observed ranges of 25 - 120 minutes, 1 - 7 hours, 6 - 22 hours and 15 - 72 hours,
respectively.
(6) In the Publication 30 model, doses are calculated separately for the mucosal layer of 20 each of the four regions considered. For penetrating radiations, the average dose to the wall
of each region is used as a measure of the dose to the mucosal layer. For non-penetrating
radiations, the specific absorbed fraction for the mucosal layer is taken to be equal to 0.5v/M
where M is the mass of the contents of that section of the tract and v is a factor between 0
and 1 representing the proportion of energy reaching sensitive cells. The factor of 0.5 is 25 introduced because the dose at the surface of the contents will be approximately half that
within the contents for non-penetrating radiations. For electrons, v is taken to be 1. For α
particles, a value of 0.01 is used on the basis of an acute toxicity study in rats in which the
LD50 for ingested yttrium-91 was estimated as about 12 Gy, while an absorbed dose to the
mucosal surface of more than 100 times greater from 239Pu had no effect (Sullivan et al., 30 1960).
(7) The absorption of radionuclides to blood was specified by values of fractional absorption
from the small intestine, termed f1 values. Values for workers were initially recommended in
Publication 30 (1979, 1980, 1981 and 1988). For some radionuclides, more than one f1 35 value was given, to apply to different chemical forms of the element that might be
Human Alimentary Tract Model – Introduction - 29 June-6 August 2004
3
encountered (eg. plutonium nitrate and oxide). For members of the public f1 values were
recommended for radionuclides in diet in Publications 56, 67, 69, and 71 (1989, 1993,
1995a,b), for the standard age-groups considered in these publications: infants (3 months),
1, 5, 10 and 15 year-old children, and adults (generally 20 y). The f1 values given for infants
were greater than at older ages (unless f1 = 1 in adults, eg. caesium), in recognition of 5 human and animal data showing greater absorption of radionuclides (and stable elements)
in the immediate postnatal period. Greater intestinal permeability in the immediate postnatal
period is considered to be a general phenomenon (NEA, 1988, ICRP, 1989). A number of
factors, including the milk diet, may contribute to this increased availability of elements for
absorption but the pinocytotic activity associated with the uptake of intact gamma globulins 10 from milk (Brambell, 1970; Clarke and Hardy, 1971) is thought to have an important role
(Fritsch et al., 1988; Harrison et al., 1987). Animal and human data show that absorption is
greatest immediately after birth and decreases progressively over the suckling period.
(8) Most recently, consideration has been given in Publication 88 to changes in absorption 15 and f1 values during pregnancy (ICRP, 2001); for physiologically essential elements, such as
calcium and iron, uptake of the ingested element can increase during pregnancy. This also
applies to chemically similar elements – for example, to strontium because of its similarity to
calcium. Infant f1 values have been applied, in Publication XX, to radionuclide ingestion in
breast milk after intakes by the mother either during lactation or during or before pregnancy. 20 It was assumed that the infant f1 values applied throughout the suckling period, taken to be
for the first 6 months of life.
1.3. The need for a new model
25 (9) The 1990 recommendations of the ICRP gave revised estimates of radiation risks, based
largely on reassessments of the incidence of cancer in the survivors of the atomic bombs at
Hiroshima and Nagasaki (ICRP 1991). Specific risk estimates for cancer of the oesophagus,
stomach and colon were included and the overall estimate of fatal cancer risk was estimated
as 0.04 Sv-1 for workers and 0.05 Sv-1 for the general public in the 1990 recommendations 30 (ICRP, 1977, 1991). For uniform whole-body exposures to low LET radiations, cancers of
the alimentary tract were estimated to account for 45% of the total risk of radiation-induced
fatal cancer in Publication 60 (ICRP, 1991). The HATM includes the oesophagus, stomach
and colon as specified target tissues.
35 (10) Since the development of the ICRP Publication 30 (1979) model, a considerable body
Human Alimentary Tract Model – Introduction - 29 June-6 August 2004
4
of data has become available on the transit of materials through the different regions of the
gut (see chapter 6). These data were obtained using non-invasive techniques and include
studies of differences between solid and liquid phases, age- and gender- related differences
and the effect of disease conditions. These data have been used to determine default
transit rates for the defined regions of the alimentary tract for the age-groups given in ICRP 5 Publication 56 (1989): that is, 3 month-old infants, 1, 5, 10 and 15 year-old children, and
adults.
(11) The ICRP Publication 30 (1979) model assumes absorption to blood takes place solely
in the small intestine and takes account neither of retention of radionuclides in different 10 regions of the gut nor of transit of retained radionuclides through intestinal tissue. For some
radionuclides, retention in the small intestine of adults has been shown and may contribute
substantially to local doses (Roth et al., 1998). The increased absorption of radionuclides
observed in the immediate postnatal period is associated with high levels of intestinal
retention in some mammalian species (Inaba et al., 1984; Sullivan et al., 1987; Fritsch et al., 15 1988). Retention of radionuclides in the mouth has also been reported (Bhattacharyya et al.,
1985; Renaud-Salis et al., 1990; Métivier, 1998). The HATM allows the calculation of doses
from retained radionuclides in the limited number of cases for which data are available.
While the absorption of most radionuclides to blood will be confined to the small intestine,
absorption may also occur in other regions in some cases. For example, iodine absorption 20 occurs in the stomach as well as the proximal small intestine (Berkovski, 1999). The new
model makes allowance for the possibility of absorption in the mouth, stomach and large
intestine as well as the small intestine. However, it should be noted that specific information
on regional absorption is currently limited and absorption of most elements is assumed to
occur solely from the small intestine. 25
(12) An important development in the new model is the calculation of doses to sensitive
cells in the different regions of the alimentary tract. Doses to the oral cavity are considered
as doses to skin. The location of sensitive epithelial stem cells in other regions is considered
separately; that is for the oesophagus, stomach, small intestine and colon. Doses from 30 radionuclides in the gut lumen, retained radionuclides and radionuclides in transit to blood
are considered.
1.4. Model development
35 (13) Approaches to the improvement of the Publication 30 model have been considered in a
Human Alimentary Tract Model – Introduction - 29 June-6 August 2004
5
number of publications (Stubbs, 1992; Simko and Nosske, 1996; Poston et al. 1996a,b;
Métivier, 1998), including the use of age and gender related transit data, consideration of
radionuclide retention in the wall, and the calculation of absorbed energy in target layers within
the wall. Stubbs (1992) reviewed transit data for adults, according to age and gender, and
developed a model for describing movements through the stomach, small intestine and large 5 intestine. A combination of linear and exponential terms was used to best describe movement
through the regions. Thus, for example, liquid emptying from the stomach is well represented
as an exponential loss, while movement to the small intestine after consumption of solids is
better described as a linear process. Simko and Nosske (1996) highlighted the possible
importance of retention of radionuclides in the wall of the small intestine during absorption. 10 They also suggested that, in addition to direct absorption to blood, absorption to the lymphatic
system should be taken into account. Poston et al. (1996a, b) developed a revised model for
the calculation of photon and electron absorbed fractions at different depths into the wall of the
stomach, small intestine and large intestine. For photons, the inclusion of track structure for
electrons did not provide improved dose estimates when compared with the simpler approach 15 used for Publication 30. For electrons, however, comparisons showed that the Publication 30
approach might result in substantial overestimates of absorbed fractions.
(14) The approaches adopted in this report build on those considered above. A more
comprehensive review of transit data has been undertaken in order to provide transit values for 20 all regions of the alimentary tract, considering different age groups. As in the model proposed
by Stubbs (1992), separate values are given for the movement of solids and liquids from
stomach to small intestine; separate values are also given for solid and liquid transit to the
stomach. However, although the validity of the kinetic models of Stubbs (1992) was
recognised, it was considered sufficient for the purposes of this report to represent all 25 movement between regions as first-order processes (see chapter 6).
(15) As suggested by Simko and Nosske (1996), the possibility of retention of radionuclides in
the wall of the small intestine is allowed for in the model, as is possible retention and
absorption in other regions. However, the lymphatic system is not included in the model. No 30 published evidence has been found of significant accumulation of radionuclides in mesenteric
lymph nodes, as would be expected if proposed mechanisms of particulate uptake involve
lymphatic drainage. Thus, movement of particles to regional lymph nodes is known to occur
following inhalation and deposition in the lungs (ICRP, 1994) and after wound contamination
(NCRP, 2004) but does not appear to be an important contributor to the uptake of materials 35 from the alimentary tract. The lymphatic transport of lipid-bound radionuclides may occur,
Human Alimentary Tract Model – Introduction - 29 June-6 August 2004
6
resulting in their entry into blood via the thoracic duct. However, it was considered sufficient for
the purposes of this report to assume that all absorption results in radionuclide entry into blood.
(16) The calculation of doses to target regions within the wall of the different alimentary tract
regions, following the approach of Poston et al. (1996a, b), is considered to be of central 5 importance in this new model. In each case, the targets for cancer induction are taken to be
the stem cells of the epithelial lining. These are the basal cells of the stratified squamous
epithelium of the mouth and oesophagus, a small number of cells in the base of each crypt in
the small and large intestines, and cells at an intermediate position in the gastric pits of the
stomach (see chapters 2 and 4). 10
1.5. Structure of the report
(17) Chapter 2 provides an outline of information on the anatomy and physiology, sufficient
for the purposes of understanding the approaches adopted in subsequent chapters. Chapter 3 15 introduces the subject of radionuclide behaviour in the alimentary tract in terms of their
absorption, principally form the small intestine, possible retention in the alimentary tract, and
secretion of systemic activity into the tract as a route of excretion. The possibility of absorption
in regions other than the small intestine is discussed. Age-related changes in absorption are
addressed, particularly the increased absorption observed in newborn animals. Retention in 20 different regions is also considered, again referring to high levels of retention in neonates.
Chapter 3 ends with examples of the behaviour of specific radionuclides, used later in the
report to give examples of doses and to examine the effects of the assumptions made.
Comprehensive information on radionuclide behaviour and associated model parameter values
will be given in forthcoming publications on dose coefficients for workers and members of the 25 public.
(18) Chapter 4 gives a brief summary of information on radiation effects, for cancer
induction and deterministic effects. However, the main purposes of the chapter are to consider
the location of target cells for cancer induction in the different regions of the alimentary tract, 30 and other implications of risk data for model structure, including the approach taken to the
partition of the large intestine.
(19) Chapter 5 describes the features of the new biokinetic model and its increased
complexity in relation to the Publication 30 model. The application of the model to the 35 examples given in Chapter 3 is discussed. Chapter 6 provides a review of transit data and
Human Alimentary Tract Model – Introduction - 29 June-6 August 2004
7
gives default transit times for the different regions and for different ages. Chapter 7 gives
morphometric data used in dosimetry, including age-related dimensions, depths of target
layers, and the simplifying assumptions made for the purposes of dosimetric modelling. It also
discusses dosimetric approaches and gives age-related specific absorbed fractions (SAFs).
Chapter 8 gives examples of the results of dose calculation for the examples given in Chapters 5 3 and 5, illustrating the effect of age on doses to different regions and the effect of
assumptions regarding retention in different regions. It also gives a brief overview of variability
and uncertainties in dose calculation. Finally, it concludes with an overview with the key
features of the model.
10 (20) Annexes A and B were developed with the Reference Man Task Group and provide
review on the embryology, anatomy and physiology and derived physiological model which
was used for defining the dosimetric model. Annex C provides reference values for anatomical
and physiological features of the alimentary tract. They are consistent with reference values
given in ICRP Publication 89 (ICRP, 2002). Annex D provides a selective review of data on 15 radionuclide absorption and retention in the gut, including consideration of mechanistic aspects
and the role of chemical speciation in determining the behaviour of radionuclides. Annex E
gives information on variability and uncertainties. Annex F gives specific absorption values
(SAFs).
20 NOTE THAT ANNEXES ARE NOT INCLUDED IN THIS CONSULTATION DOCUMENT
1.6. References
Bhattacharyya, M.H., Larsen, R.P., Oldham, R.D., Moretti, E.S., and Spaletto, M.I. (1986) 25 Effects of duration of fast and animal age on the gastrointestinal absorption of plutonium. Radiat. Res. 107, 73-82.
Berkovski V. (1999) Radioiodine biokinetics inn the mother and the fetus. Part 1. pregnant
women. In: radiation and thyroid cancer, World Scientific Publishing. Publication N° 30 EUR 18552 EN pp 319-325,
Brambell, F.M.R. (1970) Transmission of passive immunity from mother to young. Frontiers in Biology 18, North Holland, Amsterdam.
Clarke, R.M., Hardy, R.N. (1971) Structural changes and the uptake of polyvinyl pyrrolidone 35
in the small intestine. J. Anat. 108, 79-87. Dolphin, J.W. and Eve, I.S. (1966). Dosimetry of the gastrointestinal tract. Health Phys. 12,
163-172. 40 Eve, IS, (1966) A review of the physiology of the gastrointestinal tract in relation to radiation
doses from radioactive materials. Health Phys. 12, 131-161
Human Alimentary Tract Model – Introduction - 29 June-6 August 2004
8
Fritsch, P., Moutairou, K., Lataillade, G., Beauvallet, M., L'Hullier, I., Lepage, M., Métivier,
H., Masse, R. (1988) Localisation of plutonium retention in the small intestine of the neonatal rat, guinea pig, baboon and macaca after Pu-citrate ingestion. Int. J. Radiat. Biol. 54, 537-543. 5
Harrison, J.D., Bomford, J.A., David, A.J. (1987) The gastrointestinal absorption of plutonium
and americium in neonatal mammals. In: G.B. Gerber, H. Métivier and H. Smith (Eds.), Age-related Factors in Radionuclide Metabolism. Martinus Nijhoff, Lancaster. pp.27-34.
10 ICRP (1977) Recommendations of the International Commission on Radiological Protection.
ICRP Publication 26. Annals of the ICRP 1(3), Pergamon Press, Oxford. Reprinted (with additions) in 1987.
ICRP (1979) Limits for Intakes of Radionuclides by Workers. ICRP Publication 30, Part 1. 15
Annals of the ICRP 2(3/4). Pergamon Press, Oxford. ICRP (1980) Limits for Intakes of Radionuclides by Workers. ICRP Publication 30, Part 2.
Annals of the ICRP 4(3/4). Pergamon Press, Oxford. 20 ICRP (1981) Limits for Intakes of Radionuclides by Workers. ICRP Publication 30, Part 3
(including addendum to Parts 1 and 2). Annals of the ICRP 6(2/3). Pergamon Press, Oxford.
ICRP (1988) Limits for Intakes of Radionuclides by Workers: An Addendum. ICRP 25
Publication 30, Part 4. Annals of the ICRP 19(4). Pergamon Press, Oxford. ICRP (1989) Age-dependent Doses to Members of the Public from Intake of Radionuclides:
Part 1. ICRP Publication 56. Annals of the ICRP, 20(2). Pergamon Press, Oxford. 30 ICRP (1991) 1990 Recommendations of the International Commission on Radiological
Protection. ICRP Publication 60. Annals of the ICRP 21(1-3), Pergamon Press, Oxford. ICRP (1993) Age-dependent Doses to Members of the Public from Intake of Radionuclides:
Part 2, Ingestion Dose Coefficients. ICRP Publication 67. Annals of the ICRP 23(3/4). 35 Elsevier Science Ltd., Oxford.
ICRP (1994) Human Respiratory Tract Model for Radiological Protection. ICRP Publication
66. Annals of the ICRP 24(1-3). Elsevier Science Ltd., Oxford. 40 ICRP (1995a) Age-dependent Doses to Members of the Public from Intake of Radionuclides:
Part 3, Ingestion Dose Coefficients. ICRP Publication 69. Annals of the ICRP 25(1). Elsevier Science Ltd., Oxford.
ICRP (1995b) Age-dependent Doses to Members of the Public from Intake of Radionuclides: 45
Part 4, Inhalation Dose Coefficients. ICRP Publication 71. Annals of the ICRP 25(3-4). Elsevier Science Ltd., Oxford.
ICRP (1996) Age-dependent Doses to Members of the Public from Intake of Radionuclides:
Part 5 Compilation of Ingestion and Inhalation Dose Coefficients. ICRP Publication 72. 50 Annals of the ICRP 26(1). Elsevier Science Ltd, Oxford.
ICRP (2001) Doses to the Embryo and Fetus from Intakes of Radionuclides by the Mother.
Human Alimentary Tract Model – Introduction - 29 June-6 August 2004
9
ICRP Publication 88. Annals of the ICRP 31 (1-3) Elsevier Science Ltd, Oxford. Corrected version, May 2002.
ICRP (2002) Basic anatomical and physiological data for use in radiological protection,
reference values. ICRP Publication 89, Annals of the ICRP 32 (3-4) Elsevier Science Ltd, 5 Oxford.
ICRP (2004) Doses to infants from radionuclides ingested in mothers’ milk. ICRP Publication
XX. Annals of the ICRP Elsevier Science Ltd, Oxford. 10 Inaba J., Nishimura Y., and Ichikawa R. (1984) Effect of age on the metabolism of some
important radionuclides in the rat. In: Radiation risk Protection, Vol I, Proc 6th Int. Congress of IRPA. Eds A.Kaul, R.Neider, J.Pensko, F.E.Stieve and H.Brunner (Berlin: Fachverband fur Strahlenschutz e V) pp481-484.
15 Métivier, H. (1998) The work of Committee 2 of ICRP on a new model for the human
alimentary tract. Radiation Protection Dosimetry 79, 273-278. NCRP (2004) Biokinetic model for radionuclides in wounds. 20 NEA. (1988) Committee on radiation protection and public health, NEA,
OECD.Gastrointestinal absorption of selected radionuclides. Report by an NEA expert group, Paris. NEA OECD.
Poston, J.W., Kodimer, K.A., Bolch, W.E., Poston, J.W. (1996a) Calculation of absorbed 25
energy in the gastrointestinal tract. Health Phys. 71, 300-306. Poston, J.W., Kodimer, K.A., Bolch, W.E., Poston, J.W. (1996b) A revised model for the
calculation of absorbed energy in the gastrointestinal tract. Health Phys. 71, 307-314. 30 Renaud-Salis, V., Lataillade, G., and Métivier, H. (1990) Effect of mass, oxidation state and
duration of chronic ingestion on plutonium absorption in fed rats. Internat. J. Radiat. Biol. 58, 691-704.
Roth P., Giussani A., Werner E., (1998) Kinetics of Gastrointestinal Absorption, Radiation 35
Protection Dosimetry 79, 279-282. Simko, M ., Nosske, D. (1996) Basis for a revision of the gastrointestinal tract model.
Radiation Protection Dosimetry 63, 29-36. 40 Stubbs J.B. (1991) A new mathematical model of gastrointestinal transit that incorporates
age- and gender-depedent physiological parameters. In: Proceedings of the Fifth International Symposium on Radiopharmaceutical Dosimetry, Watson, E. E.; Schlafke-Stelson, A., eds. Springfield, Virginia: National Technical Information Service.
45 Stubbs, J.B. (1992) Results from a new mathematical model of gastrointestinal transit that
incorporates age- and gender-dependent physiological parameters. Radiation Protection Dosimetry 41, 63-69.
Sullivan, M.F., Hackett, P.L., George, L.A., Thompson, R.C. (1960) Irradiation of the 50
intestine by radioisotopes. Radiat. Res. 13, 343-355. Sullivan, M.F., Cross, F.T., Dagle, G.E. (1987) Dosimetry of the gastrointestinal tract. In:
G.B. Gerber, H. Métivier and H. Smith (Eds.), Age-related Factors in Radionuclide

Human Alimentary Tract Model – Introduction - 29 June-6 August 2004
10
Metabolism. Martinus Nijhoff, Lancaster. pp.49-66.
Human Alimentary Tract Model – Chapitre 2 –29 June-6 August 2004
11
2. ANATOMY AND PHYSIOLOGY OF THE ALIMENTARY TRACT SYSTEM
5 2.1. Introduction
(21) These chapters provides a brief description of the structure and function of the
alimentary tract and associated organs, intended to be sufficient to enable the reader to
understand the material presented in subsequent chapters. The main morphometric 10 parameter values used in the model are given in Chapter 7. Detailed descriptions of the
development, anatomy and physiology of the alimentary system, in support of model
development and dose calculations, are given in Annexes A and B.
2.2. General features 15
(22) The alimentary tract (Figure 2.1), also described as the digestive or gastrointestinal
tract, is by definition primarily concerned with the intake, digestion and absorption of
nutrients which may be termed alimentation. It comprises the oral cavity, including the
mouth, teeth, salivary glands and pharynx, the oesophagus, the stomach, the small 20 intestine, including duodenum, jejunum and ileum, the large intestine, including ascending,
transverse and descending colon, rectum and anus. Two associated organs, the pancreas
and liver, also play more general systemic roles in the body but are included in the
alimentary tract system.
25 (23) The alimentary tract is formed by a folding of the embryonic disc into a tube during
the 3rd and 4th week of development. The epithelium lining of this tube will also form some
accessory organs such as salivary glands, lungs, liver and the biliary tract and pancreas.
The respiratory system is also derived from the alimentary tract and the pharynx is shared by
the two systems. 30
Human Alimentary Tract Model – Chapitre 2 –29 June-6 August 2004
12
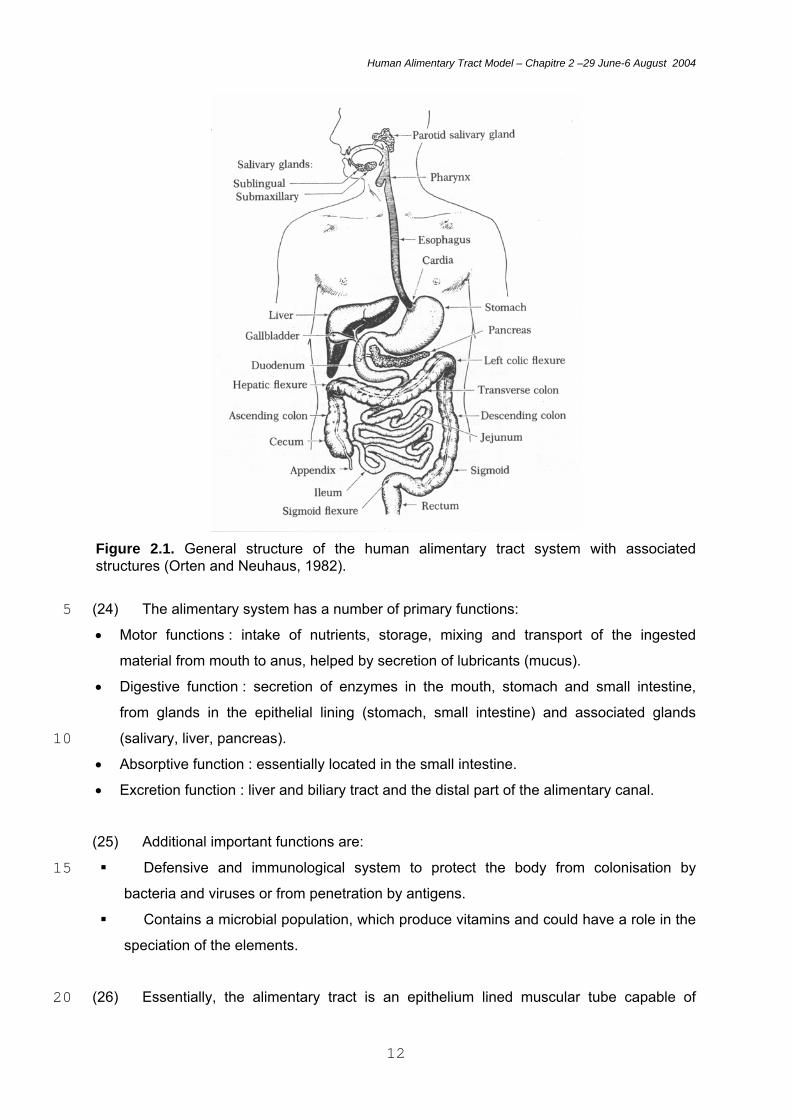
Figure 2.1. General structure of the human alimentary tract system with associated structures (Orten and Neuhaus, 1982).
(24) The alimentary system has a number of primary functions: 5 • Motor functions : intake of nutrients, storage, mixing and transport of the ingested
material from mouth to anus, helped by secretion of lubricants (mucus).
• Digestive function : secretion of enzymes in the mouth, stomach and small intestine,
from glands in the epithelial lining (stomach, small intestine) and associated glands
(salivary, liver, pancreas). 10 • Absorptive function : essentially located in the small intestine.
• Excretion function : liver and biliary tract and the distal part of the alimentary canal.
(25) Additional important functions are:
Defensive and immunological system to protect the body from colonisation by 15 bacteria and viruses or from penetration by antigens.
Contains a microbial population, which produce vitamins and could have a role in the
speciation of the elements.
(26) Essentially, the alimentary tract is an epithelium lined muscular tube capable of 20
Human Alimentary Tract Model – Chapitre 2 –29 June-6 August 2004
13
propelling ingested material through a series of different physiological environments created
by its secretory and absorptive epithelia. In these compartments, food already broken down
mechanically is broken chemically into smaller molecules which can be absorbed by
epithelial cells. The absorbed molecules then pass into the vascular system for circulation
within the body. As the interior surface of the alimentary tract is continuous at the mouth 5 and anus with the external surface of the body, material within its lumen can be regarded as
outside the body, actually entering it in the form of small molecules and ions traversing the
epithelial lining of the tract.
(27) The glands lining the tract supply the water, enzymes and chemical environment 10 required for digestion and the movement of material through the tract. Small glands are
present in the wall of the tract, eg. gastric glands of the stomach, while larger glands are
connected to the tract by secretory ducts. These larger glands are the major oral salivary
glands (parotid, submaxillary and sublingual) and the pancreas and liver.
15 (28) The motility of the alimentary tract depends on muscles within its wall controlled by
the autonomic nervous system and, in the case of the mouth and anus, on skeletal muscles
under voluntary motor control.
2.3. Alimentation 20
(29) The breakdown of solid ingested material is started in the mouth by the mechanical
action of the teeth and the tongue (mastication). These actions greatly increase the surface
area of the materials and mix them with secretions from the salivary glands which begin the
process of digestion. After swallowing (deglutition), and rapid transport to the stomach via 25 the oesophagus, gastric digestion proceeds by the action of acidic, enzymic secretions from
numerous gastric glands, which also secrete protective mucus. Passing through the pylorus
into the first part of the small intestine, the duodenum, the semi-fluid products of gastric
digestion encounter alkaline fluids produced by liver, pancreas and duodenum. Bile salts
emulsify liquid masses by tension active action, and the pancreatic secretions contain a wide 30 variety of enzymes capable of hydrolysing many classes of macromolecules. Digestion
proceeds throughout the considerable length of the small intestine (up to 3 to 4 m),
accompanied by absorption of the resulting small molecules such as amino acids,
monosaccharides, triglycerides, nucleotides together with vitamins and minerals by the
specialised epithelial cells (enterocytes) lining the small intestine. These molecules are 35 transferred from the enterocytes into the capillary network. The rate of such movements

Human Alimentary Tract Model – Chapitre 2 –29 June-6 August 2004
14
depends on the surface area of absorptive membrane bordering the intestinal lumen. The
specialised absorptive region of the small intestine has a very large surface area due to a
combination of intestinal length, folding of the wall and the presence of villi and microvilli
(see below).
5 (30) The alimentary tract also transports water and electrolytes across its wall. As the
enzymes and lubricants are all in aqueous solutions or suspensions, large quantities of
water and ions, especially sodium and chloride, are released into the tract. These are
selectively resorbed through specialised absorptive cells which are especially numerous in
the more caudal parts of the small intestine, the colon and rectum. Absorptive cells in the 10 intestine reabsorb bile salts and other secreted materials, and absorb vitamins produced by
the symbiotic bacteria in the colon. The large intestine has numerous mucus glands which
lubricate the passage of the increasingly solidified faecal material moving through it. Finally,
faeces are stored and then expelled under voluntary control via the colon and rectum.
15 2.4. Vascular supply and drainage
(31) The arterial supply of both ends of the tract is shared with that of the surrounding
regional structures. This applies to the oral cavity, pharynx and thoracic oesophagus, and to
the lower two-thirds of the rectum and the anal canal. The rest of the tract receives a very 20 rich blood supply, consistent with its secretory and absorptive roles. Three major branches
of the abdominal aorta serve the abdominal oesophagus, stomach, small and large
intestines, liver, spleen and pancreas (Figure 2.2). Similar distinctions apply to venous
drainage. Thus, the proximal and distal ends of the tract share drainage with surrounding
structures, leading to return of blood directly to the general circulation, while blood from the 25 majority of the tract flows directly to the liver via the hepatic portal vein. As shown in Figure
2.2, the liver receives a large volume of nutrient-rich blood via the portal vein as well as a
smaller volume of oxygenated blood via the hepatic artery. Hepatocytes in the liver control
the entry of nutrients into the general circulation via the hepatic vein. They also remove
toxic substances from the blood, some of which (after detoxification) are excreted in bile into 30 the duodenum. The liver also contains a smaller population of Kupffer cells, which are part
of the reticuloendothelial system and are capable of engulfing bacteria and other foreign
materials by phagocytosis.
35
Human Alimentary Tract Model – Chapitre 2 –29 June-6 August 2004
15
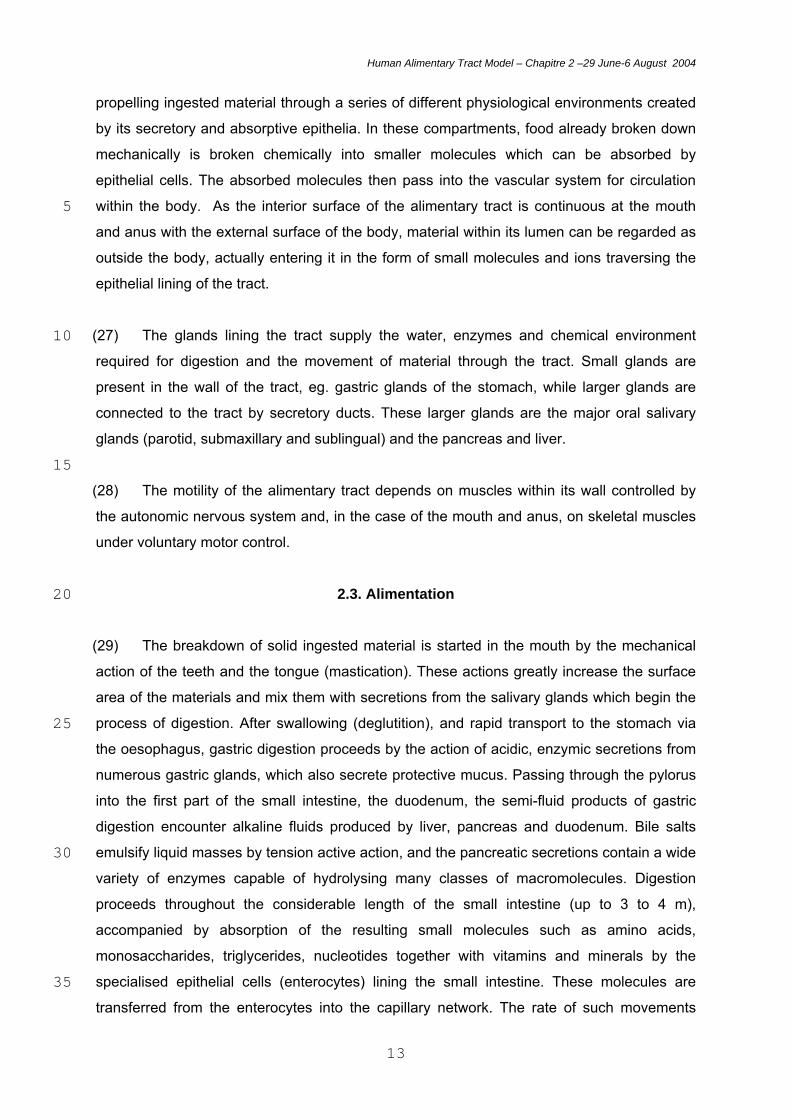
Figure to be changed (JFB)
Figure 2.2. The major blood vessels and organs supplied with blood in the splanchnic circulation. Figures in brackets are approximate blood flow rates (ml/min) for an adult at rest. (From Gastrointestinal Physiology, 2000) 5
(32) As is the case for all organs of the body, vascular drainage of the alimentary tract is
accompanied by lymphatic drainage. The small intestine has particularly rich lymphatic
drainage which forms an accessory transport system for the transfer of lipids from the site of
absorption (see below). Lymph conveyed from the stomach, and small and large intestines, 10 through a series of converging lymphatic vessels, empties through the thoracic duct into
venous blood entering the heart. Throughout the lymphatic system, there are large numbers of
lymph nodes, containing phagocytic cells and lymphocytes, providing an important line of
defence against microorganisms which might otherwise enter the circulation by this route.
15 2.5. Microanatomy of the alimentary tract
(33) The hollow tube of the alimentary canal, extending from the pharynx to the anus, is
made up of four concentric layers. From the lumen outward, these layers are the mucosa,
submucosa, muscularis, and adventitia or serosa, as described below (Figure 2.3). The oral 20 cavity and oropharynx also have a mucosal lining.
Human Alimentary Tract Model – Chapitre 2 –29 June-6 August 2004
16
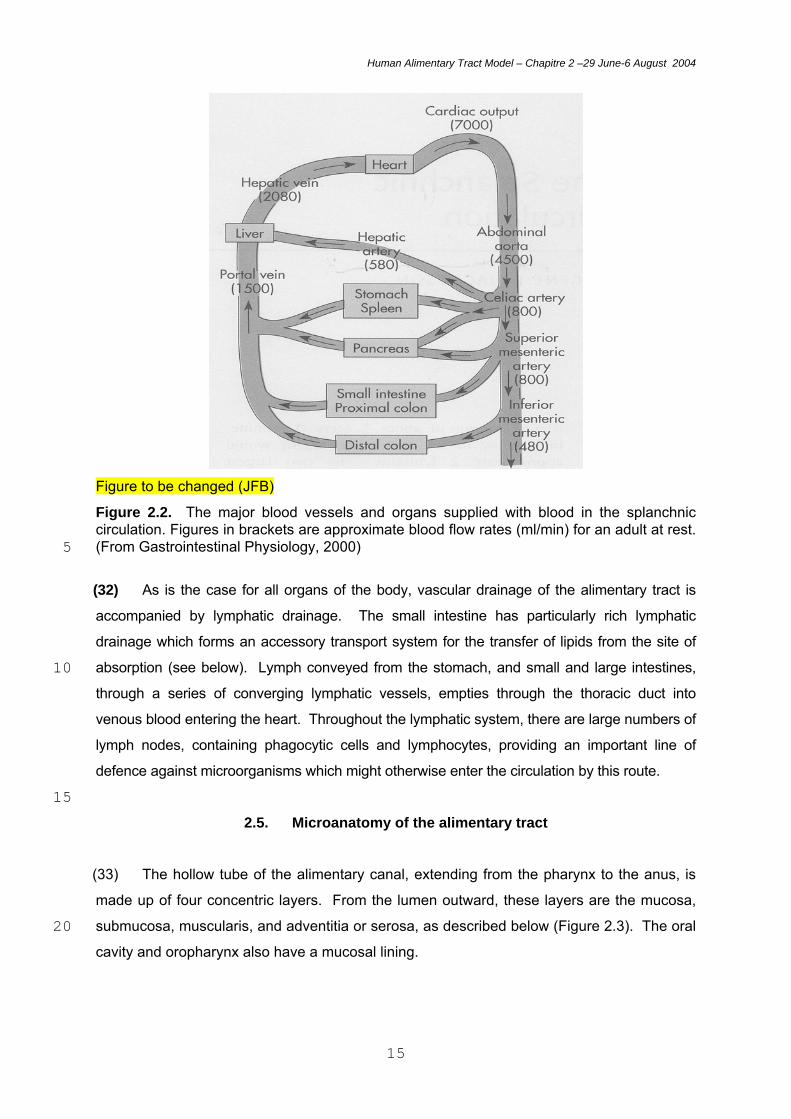
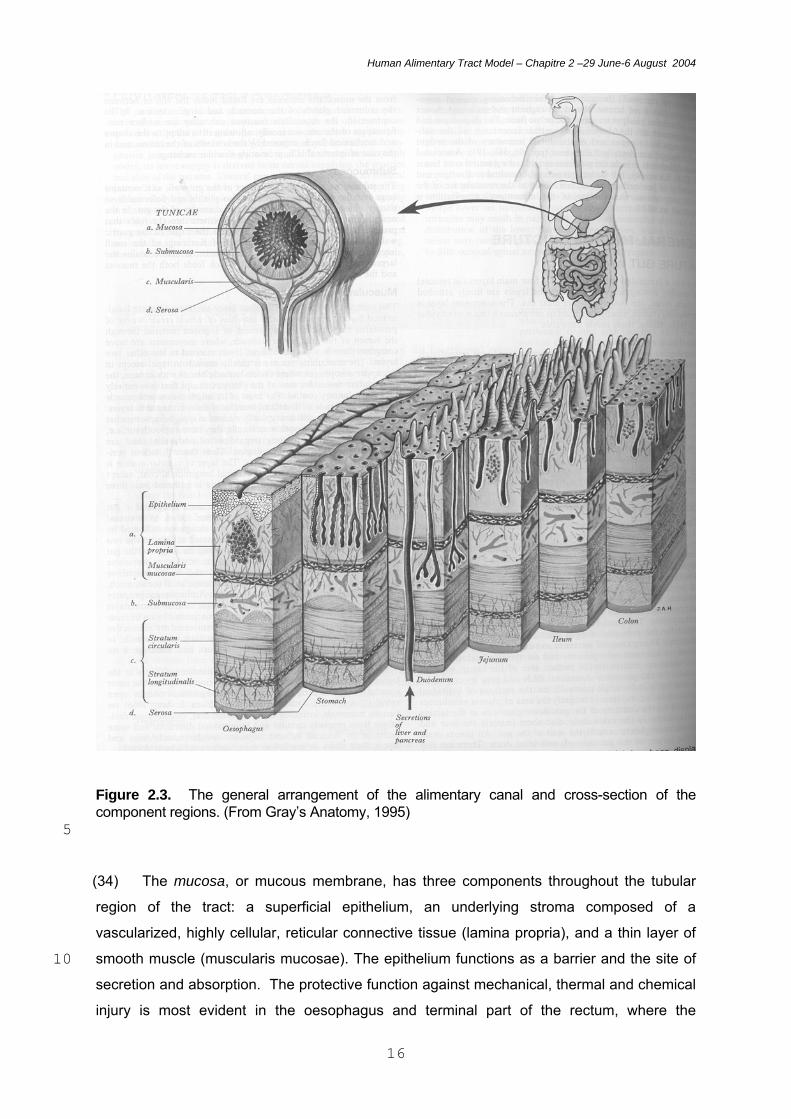
Figure 2.3. The general arrangement of the alimentary canal and cross-section of the component regions. (From Gray’s Anatomy, 1995) 5
(34) The mucosa, or mucous membrane, has three components throughout the tubular
region of the tract: a superficial epithelium, an underlying stroma composed of a
vascularized, highly cellular, reticular connective tissue (lamina propria), and a thin layer of
smooth muscle (muscularis mucosae). The epithelium functions as a barrier and the site of 10 secretion and absorption. The protective function against mechanical, thermal and chemical
injury is most evident in the oesophagus and terminal part of the rectum, where the
Human Alimentary Tract Model – Chapitre 2 –29 June-6 August 2004
17
epithelium is thick and stratified, and is covered in mucus which acts as a protective
lubricant, as also in the oral cavity and pharynx. Elsewhere in the gut the epithelium is
simple, comprising a single layer of either cuboidal or columnar cells, and includes cells for
absorption and various types of secretory cells. The barrier function and selectivity of
absorption is assisted by the presence of tight junctions over the entire epithelium. The 5 surface area of the epithelium is increased by the presence of mucosal folds and pits (plicae
and rugae), by crypts, by villi and by glands, while microvilli on the surface of individual
absorptive cells considerably increase the area of plasma membranes presented to the
contents of the gut. Some glands lie in the lamina propria and some in the submucosa, and
the liver and pancreas lie outside the wall of the gut. All glands drain into the lumen of the 10 gut through individual ducts. There are also scattered endocrine cells within the epithelial
lining.
(35) Lymphoid tissue is found throughout the mucosa of the alimentary tract, referred to
as gut-associated lymphoid tissue (GALT). This includes masses of lymphoid tissue 15 situated mainly in the lamina propria, but sometimes expanding into the submucosa. They
contain B and T lymphocytes and related cells involved in the immune defence of the gut
wall. In addition to organised nodules of lymphoid tissue, there are disseminated
populations of lymphocytes within the lamina propria and epithelial base. Organised
nodules include the lymphoid ring of the tonsils, and the particularly prominent nodules in the 20 small intestine, called Peyer’s patches, and in the appendix.
(36) The submucosa is a fibrous layer that in some places contains accumulations of
lymphatic tissue as well as glands that extend from the mucosa. The submucosa is a
vascular service area containing large blood vessels that send finer vessels into the layers 25 that represent the specific organ functions, the mucosa and the muscularis. The muscularis
contains two or more layers of muscle that is smooth in all parts except the upper
oesophagus and the anal sphincter. Contractions of the inner, circular layers constrict the
lumen, and contractions of the outer, longitudinally arranged layers shorten the tube. At the
various sphincters and valves along the length of the tube, the layer of circular muscle is 30 greatly thickened. The adventitia of the tract is composed of several layers of loose
connective tissue, alternating between collagenous and elastic tissue.
35
Human Alimentary Tract Model – Chapitre 2 –29 June-6 August 2004
18
2.6. Epithelia of the alimentary tract
(37) It is the stem cells of the epithelial lining of the alimentary tract that are regarded as
the targets for radiation-induced cancer (see Chapter 4). The epithelial layer is constantly
renewed by cell division and differentiation, originating from stem cells located in the basal 5 layer of the epithelium of the oral cavity, pharynx and oesophagus, and in the crypts in other
regions. The depth of the stem cells from the intestinal lumen varies between regions.
10
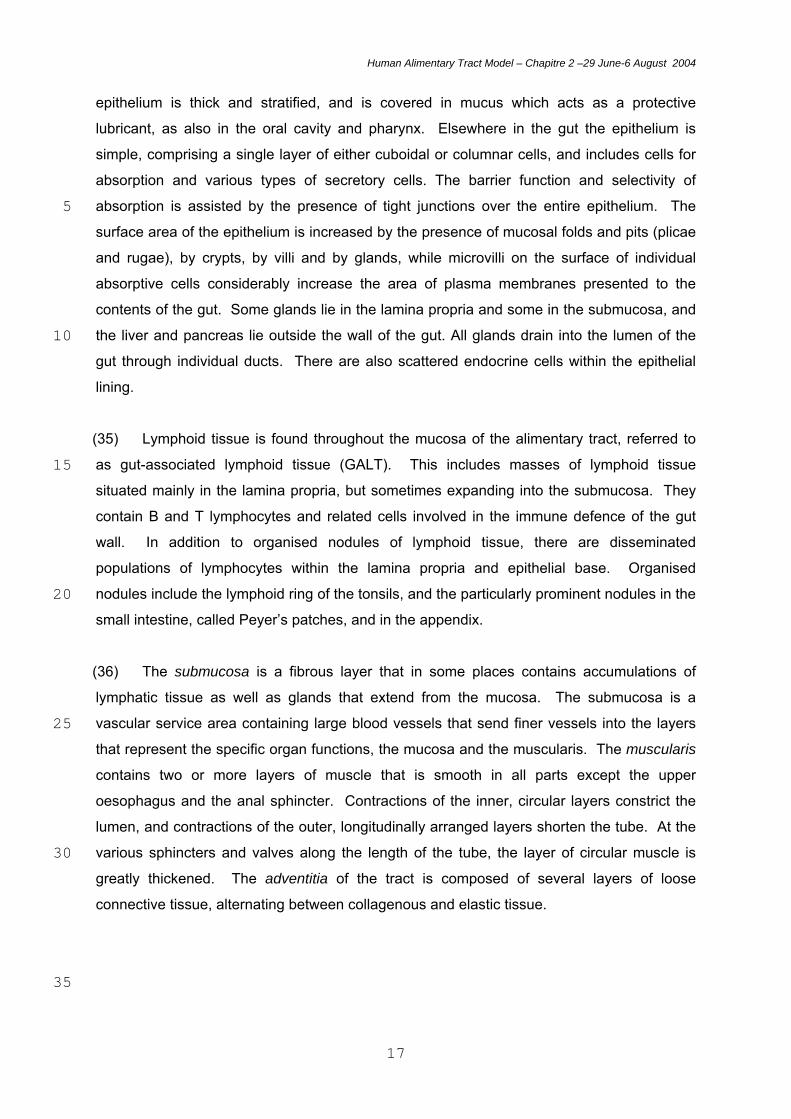
Figure 2.4. Illustrations of cross-sectional dimensions of the epithelial lining of the mouth – stratified squamous epithelium: A. dorsal tongue, B. ventral tongue, palate, gum, cheek and floor of mouth. Published courtesy of Professor Chris Potten, Epistem Ltd. 15 Oral cavity, pharynx and oesophagus
(38) The epithelial lining of the oral cavity, pharynx and oesophagus is a thick layer of
protective tissue, many cells deep, classed as stratified squamous epithelium. In some
regions of the oral cavity, as in the example of the tongue (Figure 2.4), the epthelium may be 20
Human Alimentary Tract Model – Chapitre 2 –29 June-6 August 2004
19
keratinised like skin; that is, the hardened outer layers of keratinocytes protect against
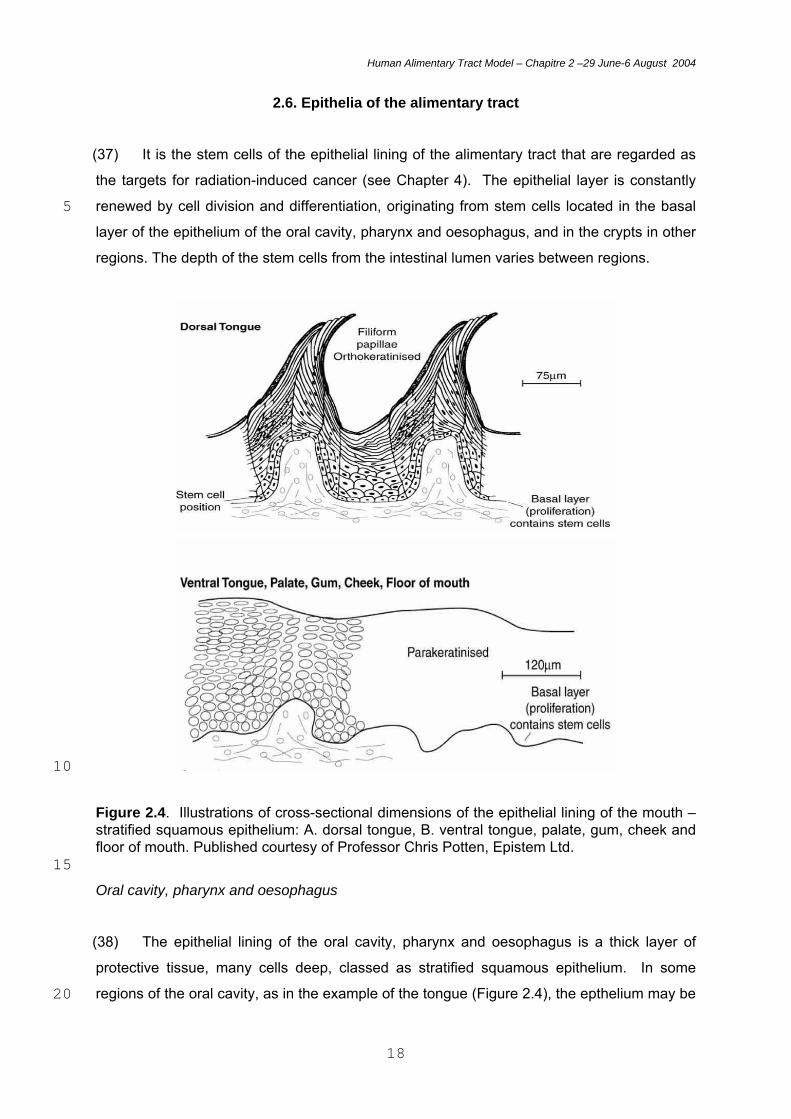
abrasion and water loss. Elsewhere, the stratified squamous epithelium is non-keratinised,
as in the oesophagus (Figure 2.5).
5 Figure 2.5. Illustration of the cross-sectional structure and dimensions of the oesophageal stratified squamous epithelium. Published courtesy of Professor Chris Potten, Epistem Ltd. 10 Stomach
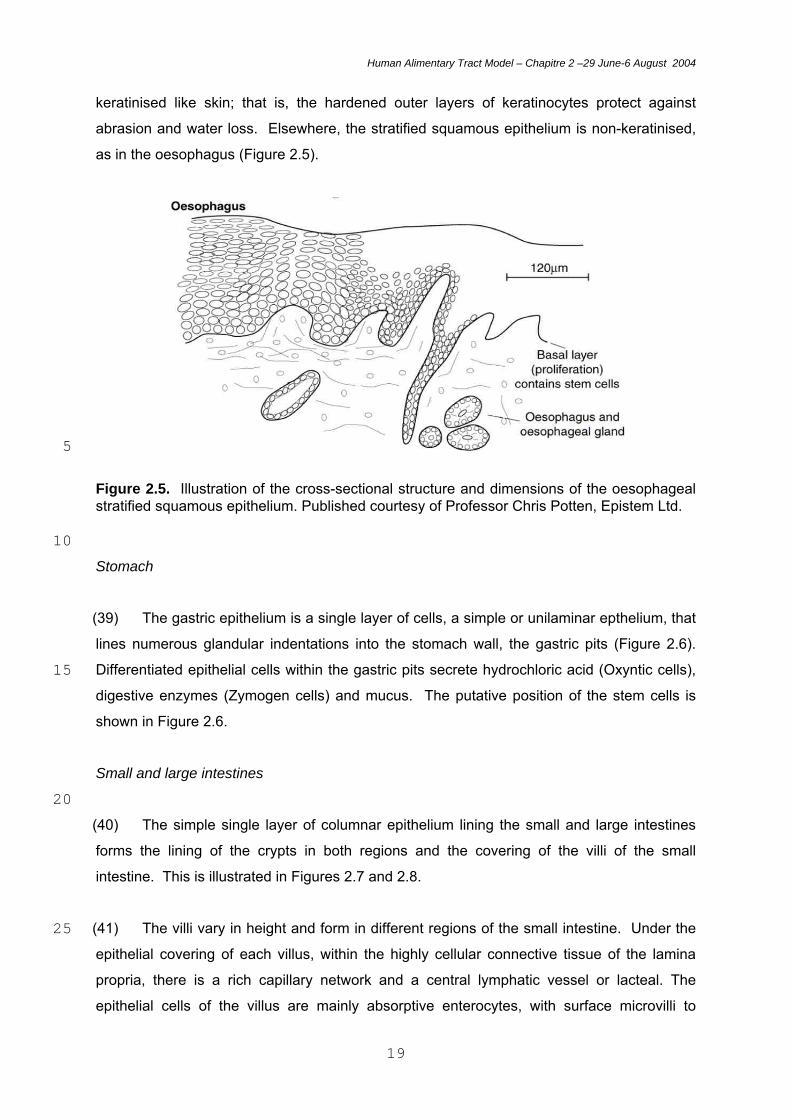
(39) The gastric epithelium is a single layer of cells, a simple or unilaminar epthelium, that
lines numerous glandular indentations into the stomach wall, the gastric pits (Figure 2.6).
Differentiated epithelial cells within the gastric pits secrete hydrochloric acid (Oxyntic cells), 15 digestive enzymes (Zymogen cells) and mucus. The putative position of the stem cells is
shown in Figure 2.6.
Small and large intestines
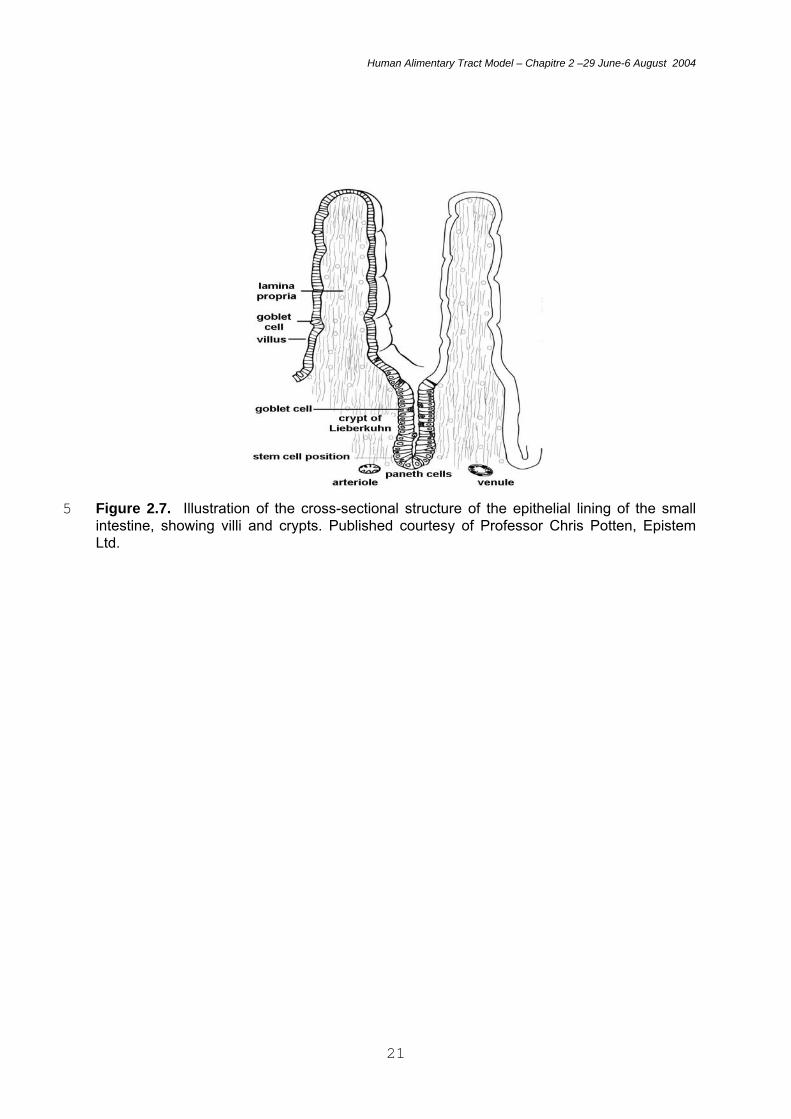
20 (40) The simple single layer of columnar epithelium lining the small and large intestines
forms the lining of the crypts in both regions and the covering of the villi of the small
intestine. This is illustrated in Figures 2.7 and 2.8.
(41) The villi vary in height and form in different regions of the small intestine. Under the 25 epithelial covering of each villus, within the highly cellular connective tissue of the lamina
propria, there is a rich capillary network and a central lymphatic vessel or lacteal. The
epithelial cells of the villus are mainly absorptive enterocytes, with surface microvilli to
Human Alimentary Tract Model – Chapitre 2 –29 June-6 August 2004
20
increase the surface area for uptake of nutrients. Interspersed between the enterocytes are
goblet cells that produce and secrete mucus.
(42) At the bases of the villi are simple tubular invaginations that extend as far as the
underlying muscularis mucosae but do not penetrate it. The stem cells that give rise to and 5 constantly renew the epithelial layer of cells are positioned at the base of the crypts,
immediately above a group of specialised Paneth cells. Cell division results in a constant
movement of cells up the crypts and villi, with cells ultimately lost from the tips of the villi into
the lumen of the intestine. The precise function of the Paneth cells is not known, although
they secrete an anti-bacterial lysozyme. 10
(43) The epithelium overlying lymphoid nodules in the intestine, including the Peyer’s
patches of the small intestine, is characterised by the presence of microfold or membranous
epithelial (M) cells. These cells typically possess a reduced number of shortened, irregular
microvilli or microfolds on their apical surface. They act as antigen sampling cells, 15 transporting luminal antigens to the underlying lymphoid tissue.
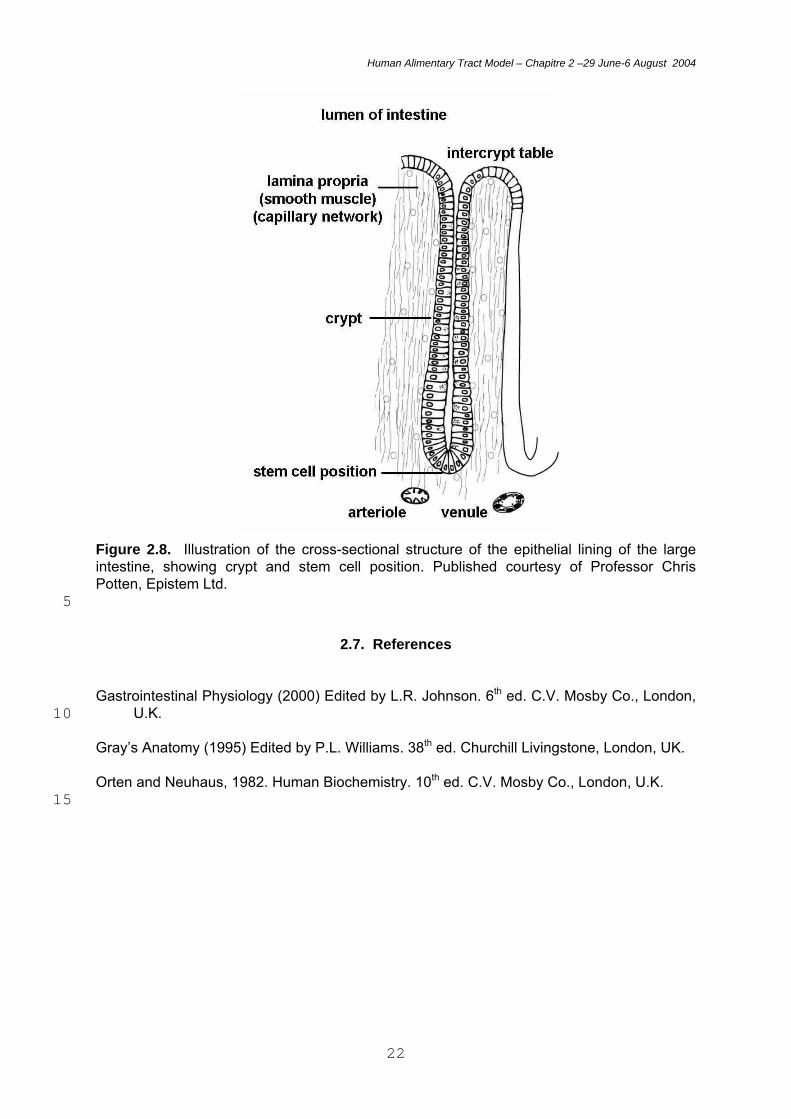
(44) In the large intestine, deep, straight crypts penetrate into the lamina propria from a
luminal intercryptal plate; there are no villi. The stem cells are in the base of the crypts;
there are no Paneth cells. As in the small intestine, cell division leads to a constant flow of 20 cells up the crypts, with loss of cells in the large intestine from the intercryptal plate.
Figure 2.6. Illustration of the cross-sectional structure and dimensions of a typical gastric gland in the stomach, lined with a single layer of columnar epithelial cells. Published courtesy of Professor Chris Potten, Epistem Ltd. 25
Human Alimentary Tract Model – Chapitre 2 –29 June-6 August 2004
21
Figure 2.7. Illustration of the cross-sectional structure of the epithelial lining of the small 5 intestine, showing villi and crypts. Published courtesy of Professor Chris Potten, Epistem Ltd.
Human Alimentary Tract Model – Chapitre 2 –29 June-6 August 2004
22
Figure 2.8. Illustration of the cross-sectional structure of the epithelial lining of the large intestine, showing crypt and stem cell position. Published courtesy of Professor Chris Potten, Epistem Ltd. 5
2.7. References
Gastrointestinal Physiology (2000) Edited by L.R. Johnson. 6th ed. C.V. Mosby Co., London, U.K. 10
Gray’s Anatomy (1995) Edited by P.L. Williams. 38th ed. Churchill Livingstone, London, UK. Orten and Neuhaus, 1982. Human Biochemistry. 10th ed. C.V. Mosby Co., London, U.K. 15
Human Alimentary Tract Model - Chapter 3 - June-8 August 2004
23
3. ABSORPTION, RETENTION AND SECRETION OF RADIONUCLIDES IN THE HUMAN ALIMENTARY TRACT
3.1. Introduction 5 (45) Doses delivered to regions of the alimentary tract from radionuclides within it depend
not only on rates of transfer through the lumen (see Chapter 6) but also on the extent of their
absorption to blood and distribution to other tissues. Absorption takes place very largely in
the specialised absorptive region of the small intestine (SI). High levels of absorption can 10 lead to lower doses to the large intestine. However, the alimentary tract is also a route of
excretion and, depending on the radionuclide, variable proportions of the absorbed systemic
activity will enter the tract and pass through the large intestine. In addition, regions of the
alimentary tract can receive doses from radionuclides carried in blood or deposited in tissues
after absorption. The extent of absorption of individual radionuclides is dependent on the 15 chemical properties of the element as well as the specific chemical form of the intake.
Similarly, the extent of secretion of systemic activity into the tract and hence excretion is
dependent on the chemical form of the element in blood and tissues. The possible retention
of radionuclides in the tissues of the alimentary tract may also result in increased doses.
Thus, for example, there is evidence of retention of radionuclides on the surface of teeth, and 20 retention in the wall of the small intestine.
(46) Information on radionuclide absorption, retention and secretion is obtained largely
from animal experiments, supported by more limited data from human studies. It is important
to recognise that there are uncertainties associated with the available data and the 25 application of animal data to radionuclide behaviour in humans. In addition, there may be
considerable variation between individuals in, for example, the absorption of an element or
radionuclide from the alimentary tract to blood. Thus, while it is normal practice to use single
values for such biokinetic parameters for the purposes of dose estimation, this is done in the
knowledge that ranges apply in terms of uncertainty on central values and of variability 30 between individuals.
(47) This chapter outlines the processes of radionuclide absorption, retention and
secretion. The chapter ends with specific examples used later in the report to illustrate the
use of the new biokinetic model and the dosimetric approaches adopted, including the effect 35 on doses of the different assumptions made and the effect of uncertainties. Annex E gives
Human Alimentary Tract Model - Chapter 3 - June-8 August 2004
24
further information on radionuclide behaviour in the alimentary tract. However, a
comprehensive review of radionuclide behaviour is not within the scope of this report.
Element specific information and parameter values for the HATM will be given in forthcoming
publications on dose coefficients for workers and members of the public. The information
given on radionuclide behaviour in forthcoming publications will in most cases refer to 5 comprehensive reviews undertaken previously for the purposes of calculating dose
coefficients for workers (ICRP, 1979, 1980, 1981) and members of the public (ICRP, 1989,
1993, 1995a, b). In all but a few cases, information is only available on total absorption from
the alimentary tract, assumed to be from the small intestine, and on the extent of faecal
excretion. However, for a limited number of elements and their radioisotopes, more 10 information will be presented and used in the calculation of doses, as illustrated by the
examples given in this chapter.
3.2. Radionuclide absorption 15 3.2.1. Types of intake (48) Absorption is the process that leads to the transfer of radionuclides from the 20 alimentary tract to blood and hence to other body tissues. Radionuclides may enter the
alimentary tract directly as a result of their ingestion or indirectly after inhalation and
mucociliary escalation of particles from the respiratory tract to the oropharynx and
oesophagus (ICRP, 1979, 1989, 1995b). The chemical form of the radionuclide entering the
alimentary tract will vary according to the type of exposure. For example, occupational 25 exposures may involve ingestion of inorganic forms of radionuclides not normally present in
the environment. Environmental exposures mainly involve ingestion of radionuclides
incorporated into food materials, bound to organic constituents of food, and/or inorganic
forms present in food and/or water. In each case, changes in chemical form are likely to
occur during digestive processes, beginning in the mouth, but principally occurring in the 30 stomach and small intestine. These changes in chemical form or speciation will determine
the availability of the radionuclide for absorption and hence the extent of uptake through the
intestinal epithelium to the bloodstream.
(49) For radionuclides deposited in the respiratory tract (RT) following inhalation, 35 clearance occurs as two competing processes, absorption to blood and particle transport
largely by mucociliary clearance. In the HRTM (ICRP, 1994), it is assumed that material
removed by particle clearance is swallowed and enters the alimentary tract. In considering
absorption from the alimentary tract, it was considered in ICRP Publication 71 (1995b) that,
Human Alimentary Tract Model - Chapter 3 - June-8 August 2004
25
for environmental exposure, the radionuclides might typically be present as minor
constituents of the inhaled particles, and that therefore absorption to blood would depend on
dissolution of the particle matrix, as well as the element and chemical form. This may also
apply to the direct ingestion of particles containing radionuclides.
5 3.2.2. Absorption in small intestine
(50) Generally, the absorption of radionuclides occurs together with the absorption of
nutrients in the small intestine. Absorption may involve passive diffusion or active transport
through the single layer of epithelial cells lining the small intestine. The extent of absorption 10 of radionuclides will depend on the element and its chemical form. Thus, for example, the
behaviour of tritium as tritiated water follows body water with essentially free passage from
the alimentary tract to blood (ICRP, 1989). Caesium ions behave similarly to K+ and are
rapidly absorbed (ICRP, 1989). Calcium (II), iron (III) and related elements are absorbed by
active transport mechanisms that respond to physiological demand. In contrast, isotopes of 15 the actinide elements, while showing some similarities to Fe(III) in their behaviour in the
body, are very poorly absorbed (<0.1% of ingested amounts) (ICRP, 1989).
(51) In addition to the passage of ions and molecules across the microvillus membrane,
materials including macromolecules and small particles may also enter epithelial cells by 20 pinocytosis – engulfment at the cell surface into small vesicles which are internalised. This
may occur in the normal epithelial absorptive cell and has been demonstrated in the
lymphoid M cells of Peyers patches (Bockman and Cooper, 1971; Joel et al., 1978, 1984;
Owen, 1977). The available evidence suggests that while this is not an important contributor
to uptake in adults, in neonates it provides a mechanism for the acquisition of passive 25 immunity by the uptake of antibodies from milk, also allowing uptake of other materials
including radionuclides (see below). Because the epithelial layer is being constantly
replaced by cell division in the crypts, any material entering the absorptive cells but not
transferred to the bloodstream will be lost into the lumen: the time taken for cells to traverse
the length of the villi in humans is about 6 days and approximately 17 million cells/day are 30 shed into the intestine (see below and 3.3. Radionuclide retention). Passage of particles
through tight junctions between epithelial enterocytes in the small intestine has also been
studied as a route of entry into blood or lymph. Although there is little direct information
regarding the fate of particles entering the body this way, current understanding of the nature
of these junctions suggests that this is not an important route of uptake. 35
Human Alimentary Tract Model - Chapter 3 - June-8 August 2004
26
3.2.3. Absorption from other regions
(52) Although the small intestine is the predominant site of absorption of nutrients and
other substances, there is evidence that absorption of some elements and their radioisotopes
can occur in other regions of the alimentary tract, including the mouth, stomach and colon. 5 Absorption from stomach can occur for highly lipid-soluble substances, such as alcohol and
some weak acids. The large intestine is known to absorb water and electrolytes such as
sodium and chloride (see Annex D).
(53) Absorption from the oral cavity is unlikely to be a major contributor to total absorption. 10 Studies using rats have shown substantial absorption of carrier-free 18F and 125I from the
mouth but only after artificially prolonged periods of retention (Gabler, 1968; Patten et al.,
1978). Thus, the absorption of administered 125I was 7% after 1 hour, 13% after 2 hours and
24% after 3.5 hours. The absorption of 18F was 7% after 2.5 hours (Patten et al., 1978).
15 (54) Although the stomach is not generally considered to be an absorptive organ, there is
evidence that some elements, including iodine, copper and mercury, can be absorbed to
some extent from the stomach (Van Campen and Mitchell, 1965; Sasser et al., 1978). Van
Campen and Mitchell (1965) demonstrated substantial absorption of 64Cu through the ligated
rat stomach. In similar studies, Wagner (1962) showed that 50% of a 29 µg dose of fluoride 20 was absorbed from the ligated rat stomach within 1 hr and only 16% remained after 5 hr.
Eisele and Mraz (1981) reported uptake of 95Nb from the ligated stomach of rats of about 1%
after 4hr, greater than measured for the duodenum, jejunum, and ileum (<0.2% in each
case).
25 3.2.4. Absorption in infants
(55) There is evidence from animal experiments and some supporting human data that
absorption of many elements is substantially greater in newborn mammals than in adults. A
number of factors, including the milk diet, may contribute to this increased availability of 30 elements for absorption, but the pinocytotic activity associated with the uptake of intact
gamma globulins from milk (Brambell, 1970; Clarke and Hardy, 1971) is thought to have an
important role (Sullivan, 1980; Harrison et al., 1987; Barton, 1987). The acquisition of
passive immunity by this process occurs in many mammalian species including mice, rats,
hamsters, dogs and cattle. However, prenatal transfer of antibodies, through the yolk sac or 35 placenta, also occurs in some species and has been considered to be the predominant, or
only, mechanism in man and other primates, rabbits and guinea pigs. Nevertheless, it would
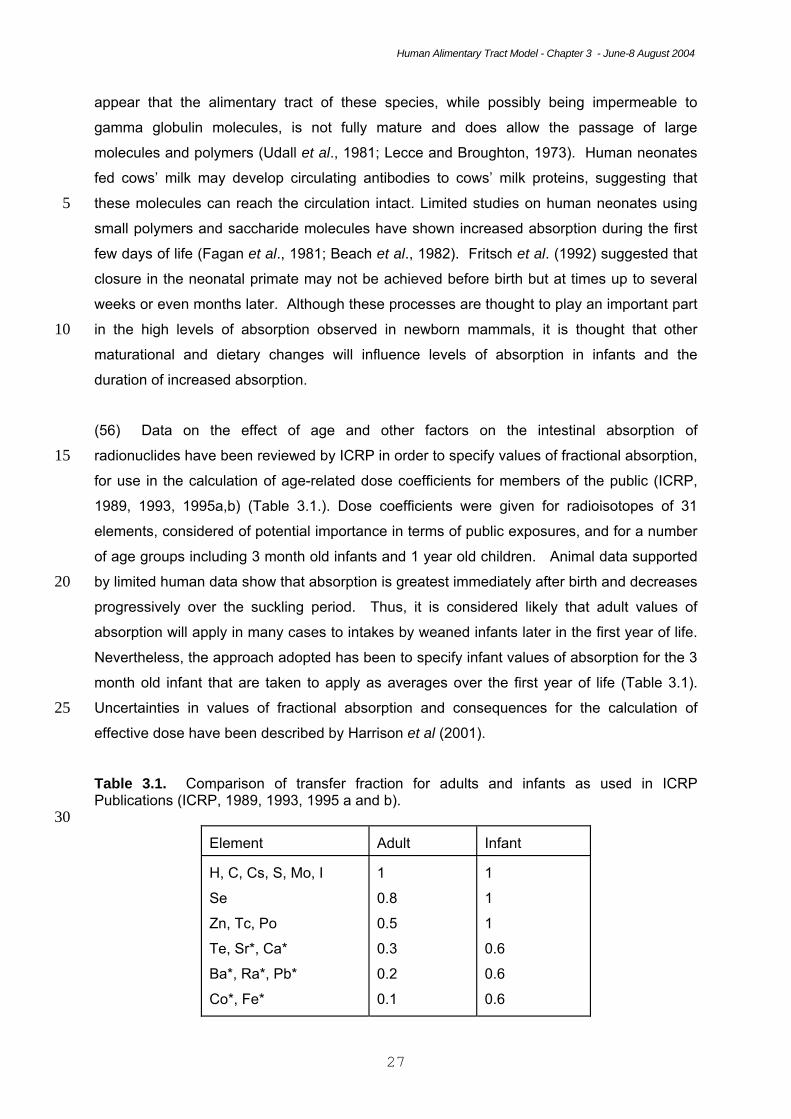
Human Alimentary Tract Model - Chapter 3 - June-8 August 2004
27
appear that the alimentary tract of these species, while possibly being impermeable to
gamma globulin molecules, is not fully mature and does allow the passage of large
molecules and polymers (Udall et al., 1981; Lecce and Broughton, 1973). Human neonates
fed cows’ milk may develop circulating antibodies to cows’ milk proteins, suggesting that
these molecules can reach the circulation intact. Limited studies on human neonates using 5 small polymers and saccharide molecules have shown increased absorption during the first
few days of life (Fagan et al., 1981; Beach et al., 1982). Fritsch et al. (1992) suggested that
closure in the neonatal primate may not be achieved before birth but at times up to several
weeks or even months later. Although these processes are thought to play an important part
in the high levels of absorption observed in newborn mammals, it is thought that other 10 maturational and dietary changes will influence levels of absorption in infants and the
duration of increased absorption.
(56) Data on the effect of age and other factors on the intestinal absorption of
radionuclides have been reviewed by ICRP in order to specify values of fractional absorption, 15 for use in the calculation of age-related dose coefficients for members of the public (ICRP,
1989, 1993, 1995a,b) (Table 3.1.). Dose coefficients were given for radioisotopes of 31
elements, considered of potential importance in terms of public exposures, and for a number
of age groups including 3 month old infants and 1 year old children. Animal data supported
by limited human data show that absorption is greatest immediately after birth and decreases 20 progressively over the suckling period. Thus, it is considered likely that adult values of
absorption will apply in many cases to intakes by weaned infants later in the first year of life.
Nevertheless, the approach adopted has been to specify infant values of absorption for the 3
month old infant that are taken to apply as averages over the first year of life (Table 3.1).
Uncertainties in values of fractional absorption and consequences for the calculation of 25 effective dose have been described by Harrison et al (2001).
Table 3.1. Comparison of transfer fraction for adults and infants as used in ICRP Publications (ICRP, 1989, 1993, 1995 a and b). 30
Element
Adult
Infant
H, C, Cs, S, Mo, I
Se
Zn, Tc, Po
Te, Sr*, Ca*
Ba*, Ra*, Pb*
Co*, Fe*
1
0.8
0.5
0.3
0.2
0.1
1
1
1
0.6
0.6
0.6
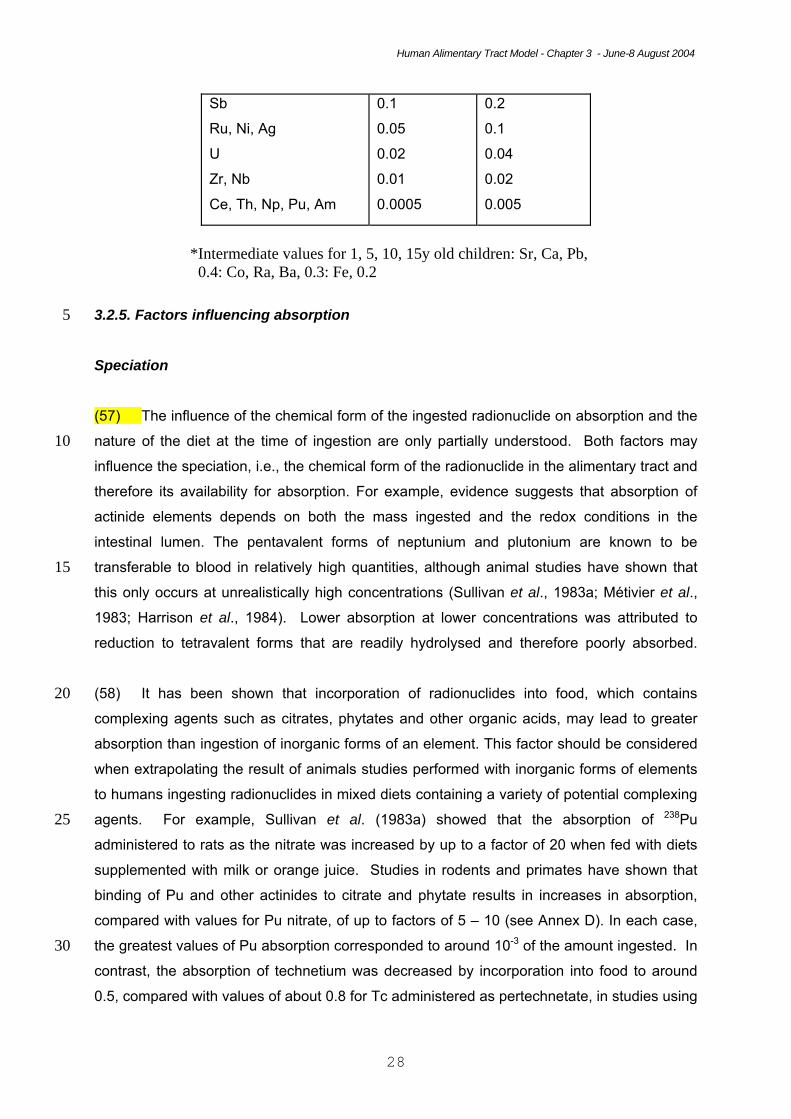
Human Alimentary Tract Model - Chapter 3 - June-8 August 2004
28
Sb
Ru, Ni, Ag
U
Zr, Nb
Ce, Th, Np, Pu, Am
0.1
0.05
0.02
0.01
0.0005
0.2
0.1
0.04
0.02
0.005
*Intermediate values for 1, 5, 10, 15y old children: Sr, Ca, Pb, 0.4: Co, Ra, Ba, 0.3: Fe, 0.2
3.2.5. Factors influencing absorption 5
Speciation (57) The influence of the chemical form of the ingested radionuclide on absorption and the
nature of the diet at the time of ingestion are only partially understood. Both factors may 10 influence the speciation, i.e., the chemical form of the radionuclide in the alimentary tract and
therefore its availability for absorption. For example, evidence suggests that absorption of
actinide elements depends on both the mass ingested and the redox conditions in the
intestinal lumen. The pentavalent forms of neptunium and plutonium are known to be
transferable to blood in relatively high quantities, although animal studies have shown that 15 this only occurs at unrealistically high concentrations (Sullivan et al., 1983a; Métivier et al.,
1983; Harrison et al., 1984). Lower absorption at lower concentrations was attributed to
reduction to tetravalent forms that are readily hydrolysed and therefore poorly absorbed.
(58) It has been shown that incorporation of radionuclides into food, which contains 20 complexing agents such as citrates, phytates and other organic acids, may lead to greater
absorption than ingestion of inorganic forms of an element. This factor should be considered
when extrapolating the result of animals studies performed with inorganic forms of elements
to humans ingesting radionuclides in mixed diets containing a variety of potential complexing
agents. For example, Sullivan et al. (1983a) showed that the absorption of 238Pu 25 administered to rats as the nitrate was increased by up to a factor of 20 when fed with diets
supplemented with milk or orange juice. Studies in rodents and primates have shown that
binding of Pu and other actinides to citrate and phytate results in increases in absorption,
compared with values for Pu nitrate, of up to factors of 5 – 10 (see Annex D). In each case,
the greatest values of Pu absorption corresponded to around 10-3 of the amount ingested. In 30 contrast, the absorption of technetium was decreased by incorporation into food to around
0.5, compared with values of about 0.8 for Tc administered as pertechnetate, in studies using
Human Alimentary Tract Model - Chapter 3 - June-8 August 2004
29
rats, guinea pigs and sheep (Sullivan et al., 1983b; Gerber et al., 1989). A low value of
around 0.1 was also obtained in a volunteer study of absorption of 99Tc from lobster flesh
(Hunt et al., 2001; Harrison and Phipps, 2001). Further examples of the effect of chemical
form on radionuclide absorption are given in 3.5 and Annex 3.
5 Fasting (59) The absorption of radionuclides from drinking water might be increased when
ingested after a period without food. Thus, for example, fasting has been shown to increase
the absorption of actinide elements, including Pu (NEA, 1988). James et al. (1985) 10 measured absorption in human volunteers given Pb acetate in water to be about 0.65 after a
12 hour fast compared with about 0.4 when taken with a substantial meal. Heard and
Chamberlain (1982) showed that fasting values of absorption of about 0.4 – 0.5 could be
reduced to about 0.1 – 0.2 by giving Pb with tea, coffee or beer rather than water.
15 Physiological stages (60) For physiologically essential elements and their radioisotopes, absorption may be
increased during periods of increased demand - during pregnancy and lactation in female
adults, and during periods of increased growth in children. This also applies to chemically 20 similar elements – for example, to strontium because of its chemical similarity to calcium.
Human data on Ca absorption reported by Allen (1982) show an increase in absorption from
about 0.3 before pregnancy to about 0.5 at 5 – 6 months after conception. Cross et al.
(1995) measured changes in absorption during pregnancy in a group of 10 women, from 0.36
before pregnancy to values of 0.40, 0.56 and 0.62 towards the end of the first, second and 25 third trimesters, respectively. Consideration was given in Publication 88 (ICRP, 2001) to
changes in absorption during pregnancy for the physiologically essential elements, calcium
and iron, and related elements.
3.3 Radionuclide retention 30 (61) Retention occurs when radionuclides are bound to tissues within regions of the
alimentary tract. While radionuclide retention is generally low and may be ignored in most
cases, there is some experimental evidence of retention on teeth, and retention within the
mucosa of the small intestine. Retention in the small intestine is pronounced in newborn 35 animals and is associated with increased levels of absorption (see above).
Human Alimentary Tract Model - Chapter 3 - June-8 August 2004
30
3.3.1. Retention on teeth
(62) Retention on teeth as a result of deposition on tooth surfaces after radionuclide
ingestion has been shown to occur in experimental studies of a number of elements,
including radium, cadmium, lead, tin, polonium, strontium and plutonium (see Annex D). 5 Mechanisms of deposition are not well understood, although it is postulated that it is the
consequence of the adsorption of the element on the tooth enamel. Consequently, retention
on teeth might depend strongly on the speciation of the radionuclide but, as with the
absorption processes, only few data are available and therefore no clear conclusion can be
drawn at this stage. 10
(63) Experiments using beagle dogs showed that ingestion of 48 to 1330 kBq/day of 90Sr
for 18 months resulted in a greater incidence of melanoma and carcinoma of the oral
mucosa, than animals receiving 90Sr by intravenous injection (Book et al., 1982). These
results suggest that greater doses were received by the oral mucosa after ingestion than 15 intravenous injection of 90Sr and, because of the rapid transit of ingested materials through
the mouth (Chapter 6), retention would be required for this to occur. However, no direct
information was provided on the possible sites or extent of retention.
(64) Bhattacharyya et al. (1985) reported detailed findings of the retention of 109Cd, 210Pb 20 and 236Pu on the teeth of mice after ingestion in drinking water. In each case, comparisons
were made between the tissue distribution observed in these mice and in corresponding
groups given the radionuclides either by gavage into the stomach or by intravenous injection.
The results obtained showed clear evidence of retention in the mouth, and on teeth in
particular. 25
(65) Comparisons of the behaviour of Pu(VI) and Pu(IV) ingested as the bicarbonates in
drinking water showed substantial levels of retention on teeth and in the mouth for Pu(VI) but
lower levels for Pu(IV). Analyses of teeth showed retention of 0.5% of the ingested activity of 236Pu(VI) and about 0.02% for 236Pu(IV), measured at 6 days after ingestion. To demonstrate 30 that this retention was due to surface adherence, surface measurements of alpha activity
were made, showing that retention was confined to the exposed portions of teeth and was
absent from the roots. In vitro tests with mouse teeth immersed in 236Pu(VI) bicarbonate
solution showed that 15% of the 236Pu was adsorbed onto the teeth after 5 hours. The
addition of small amounts of bone ash (hydroxyapatite) to solutions of both Pu(VI) and Pu(IV) 35 in bicarbonate solutions resulted in nearly complete removal of Pu from these solutions. In
addition to the retention on teeth observed after ingestion of 236Pu(VI) and 236Pu(IV),
Human Alimentary Tract Model - Chapter 3 - June-8 August 2004
31
measurements also showed a lower level of retention on other mouth surfaces, accounting
for about 0.03% and 0.01% of the ingested activity, respectively. Comparisons with the
distribution of 236Pu after gavage or intravenous injection showed that the distribution of Pu
absorbed from the alimentary tract was the same for ingestion in drinking water and gavage
and the same as after systemic administration. 5
(66) Bhattacharyya et al. (1985) also showed retention of 109Cd and 210Pb in the heads of
mice, attributable mainly to surface adherence to teeth, after administration of 109Cd(II)
chloride and 210Pb(II) nitrate in drinking water. At 60 hours after administration of 109Cd(II),
retention was about 0.2% and 0.4% of the ingested activities, respectively. As for Pu, the 10 distribution of 109Cd and 210Pb between other tissues for the different routes of administration
showed that the distribution of Cd and Pb absorbed from the alimentary tract was the same
as the distribution after systemic injection. Other data on the behaviour of ingested Cd and
Pb are less clear but provide some support for the suggestion of retention on teeth (Nomura,
1980; Cleymaet et al., 1993; Wesenberg, 1983). 15
(67) For Pu, Renaud-Salis et al. (1990) conducted an extensive and detailed study of the
absorption of tissue distribution of 238Pu in rats after chronic administration of Pu(IV) or
Pu(VI) bicarbonates in drinking water over an 85 day period. They showed that retention on
teeth represented from up to 97% of the total Pu(IV) or Pu(VI) retained in the body, with no 20 effect of administered mass. This deposition on teeth corresponded to a half time of retention
to about 2-4 weeks. However, while retention on teeth remained constant at this level during
and after chronic ingestion of Pu(IV), the level of retention after administration of Pu(VI) fell
by an order of magnitude during the ingestion period. The authors postulated that the
presence of different proportions of both monomeric (ionic) and polymeric (hydrolysed and 25 polymerised) forms of Pu may account for the difference in behaviour, relating to the greater
stability of Pu(VI) ions at neutral pH. The inconsistent results of Bhattacharyya et al. (1985)
and Renaud-Salis et al. (1990) regarding the behaviour of Pu(IV) or Pu(VI) may relate to
differences in ingested mass; masses of 238Pu in the latter study were from 50 – 1500 times
greater than in the former study. 30
3.3.2. Retention in the wall of the small intestine
(68) In general, there is a lack of evidence on possible retention of radionuclides in the gut
wall, other than in newborn animals (see below). However, studies comparing the time-35 course of the retention and excretion of iron and uranium after oral and intravenous
Human Alimentary Tract Model - Chapter 3 - June-8 August 2004
32
administration suggest that some retention in the intestinal wall may occur, either during a
period of prolonged absorption, or temporarily prior to loss into the gut lumen.
(69) Werner et al. (1987) studied absorption and retention of Fe as an example of an
essential element. Comparison of whole body retention of 59Fe in human volunteers after 5 either oral or intravenous administration and whole body retention of a 51Cr non-absorbable
marker after oral administration provided evidence of temporary retention of about 20% of
the ingested 59Fe. The author’s interpretation of the results obtained were that, of about 40%
total uptake by the absorptive enterocytes of the small intestine, about half passed directly
through the lamina propria to the capillary network of the villi. It was suggested that the other 10 half may be incorporated by macrophages lying under the epithelial layer and subsequently
transferred to goblet cells in the epithelium and excreted back into the lumen of the intestine.
The data presented were consistent with a half-time of intestinal retention of about 3 days.
The proposed mechanism is consistent with observations of iron secretion by goblet cells
(Refsum and Schreiner, 1980), but there is no direct evidence for the involvement of 15 macrophages. Werner et al. (1987) referred to, but did not present, data showing that the
extent of temporary uptake of iron within the intestine was dependent on iron status, and
suggested that it forms part of the mechanisms operating to regulate iron absorption. They
also suggested that similar mechanisms may apply to other essential elements and also to
some non-essential elements, particularly those sharing absorptive pathways with essential 20 elements.
(70) Leggett and Harrison (1995) noted that some studies show a prolongation in the
pattern of urinary excretion of U after oral intake compared with that typically seen after
intravenous injection of uranyl nitrate. For example, Larsen et al. (1984) compared urinary 25 excretion of U in the baboon after gavage of 233U and intravenous injection of 236U. The
results indicated that at three days after administration, less than 50% of the total taken up
from the alimentary tract had been excreted in urine compared with about 80% after systemic
administration. It was concluded by Leggett and Harrison (1995) that these baboon data and
the urinary excretion data from U absorption studies on human volunteers (Hursh et al., 30 1969; Wrenn et al., 1989; Harduin et al., 1994) are consistent with the assumption that U
passes through the intestinal wall with a half-time of 1–3 days and behaves the same as
directly injected U once it reaches blood. However, it is also conceivable that U absorption is
rapid but that the chemical form reaching blood results in a rate of urinary excretion that is
slower than after intravenous injection of uranyl nitrate. 35
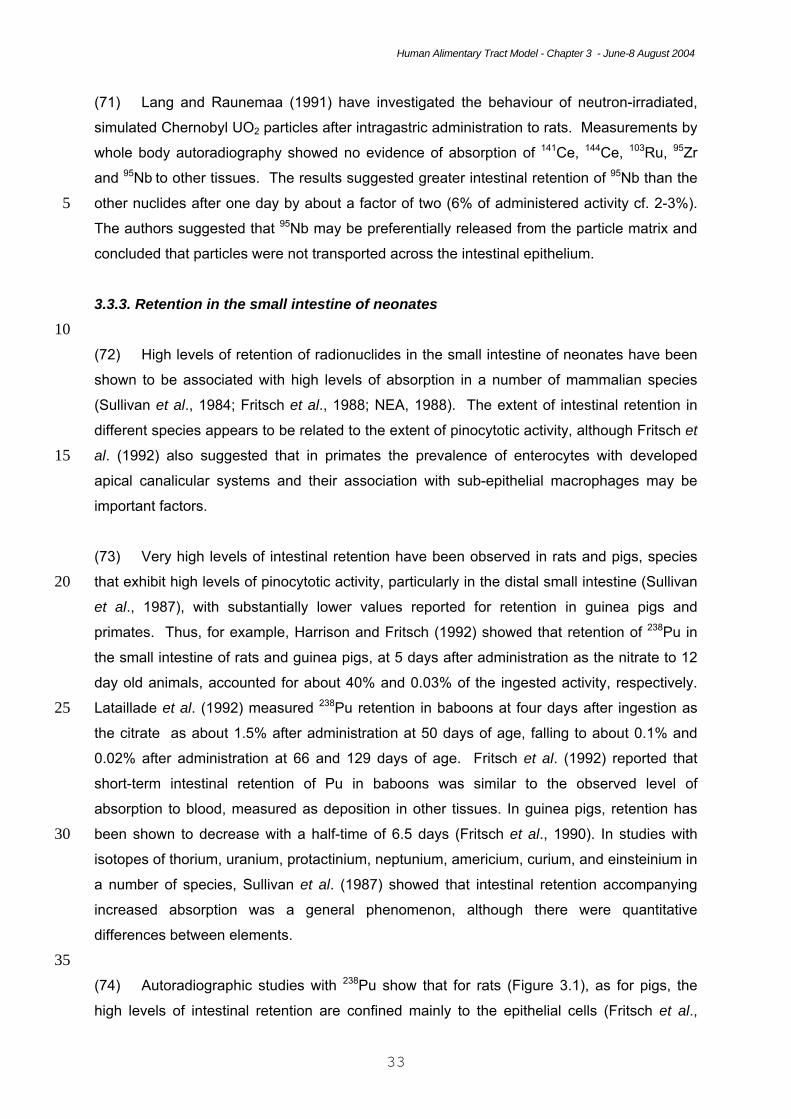
Human Alimentary Tract Model - Chapter 3 - June-8 August 2004
33
(71) Lang and Raunemaa (1991) have investigated the behaviour of neutron-irradiated,
simulated Chernobyl UO2 particles after intragastric administration to rats. Measurements by
whole body autoradiography showed no evidence of absorption of 141Ce, 144Ce, 103Ru, 95Zr
and 95Nb to other tissues. The results suggested greater intestinal retention of 95Nb than the
other nuclides after one day by about a factor of two (6% of administered activity cf. 2-3%). 5 The authors suggested that 95Nb may be preferentially released from the particle matrix and
concluded that particles were not transported across the intestinal epithelium.
3.3.3. Retention in the small intestine of neonates 10 (72) High levels of retention of radionuclides in the small intestine of neonates have been
shown to be associated with high levels of absorption in a number of mammalian species
(Sullivan et al., 1984; Fritsch et al., 1988; NEA, 1988). The extent of intestinal retention in
different species appears to be related to the extent of pinocytotic activity, although Fritsch et
al. (1992) also suggested that in primates the prevalence of enterocytes with developed 15 apical canalicular systems and their association with sub-epithelial macrophages may be
important factors.
(73) Very high levels of intestinal retention have been observed in rats and pigs, species
that exhibit high levels of pinocytotic activity, particularly in the distal small intestine (Sullivan 20 et al., 1987), with substantially lower values reported for retention in guinea pigs and
primates. Thus, for example, Harrison and Fritsch (1992) showed that retention of 238Pu in
the small intestine of rats and guinea pigs, at 5 days after administration as the nitrate to 12
day old animals, accounted for about 40% and 0.03% of the ingested activity, respectively.
Lataillade et al. (1992) measured 238Pu retention in baboons at four days after ingestion as 25 the citrate as about 1.5% after administration at 50 days of age, falling to about 0.1% and
0.02% after administration at 66 and 129 days of age. Fritsch et al. (1992) reported that
short-term intestinal retention of Pu in baboons was similar to the observed level of
absorption to blood, measured as deposition in other tissues. In guinea pigs, retention has
been shown to decrease with a half-time of 6.5 days (Fritsch et al., 1990). In studies with 30 isotopes of thorium, uranium, protactinium, neptunium, americium, curium, and einsteinium in
a number of species, Sullivan et al. (1987) showed that intestinal retention accompanying
increased absorption was a general phenomenon, although there were quantitative
differences between elements.
35 (74) Autoradiographic studies with 238Pu show that for rats (Figure 3.1), as for pigs, the
high levels of intestinal retention are confined mainly to the epithelial cells (Fritsch et al.,
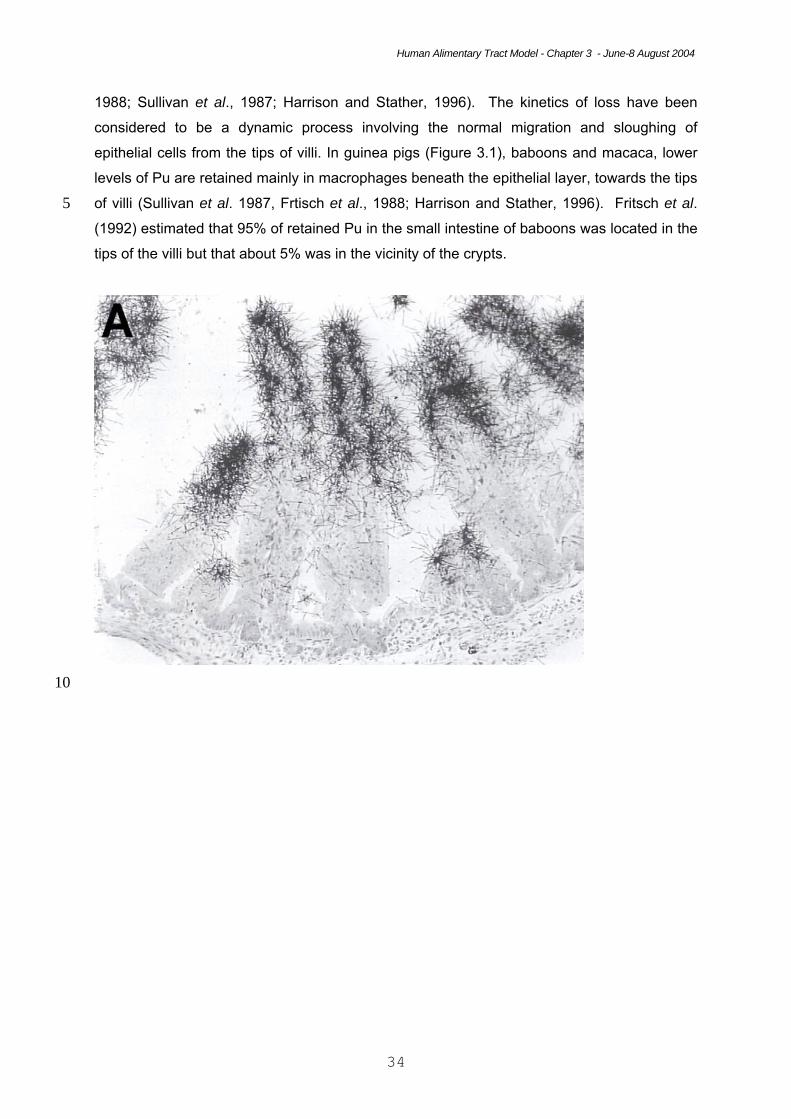
Human Alimentary Tract Model - Chapter 3 - June-8 August 2004
34
1988; Sullivan et al., 1987; Harrison and Stather, 1996). The kinetics of loss have been
considered to be a dynamic process involving the normal migration and sloughing of
epithelial cells from the tips of villi. In guinea pigs (Figure 3.1), baboons and macaca, lower
levels of Pu are retained mainly in macrophages beneath the epithelial layer, towards the tips
of villi (Sullivan et al. 1987, Frtisch et al., 1988; Harrison and Stather, 1996). Fritsch et al. 5 (1992) estimated that 95% of retained Pu in the small intestine of baboons was located in the
tips of the villi but that about 5% was in the vicinity of the crypts.
10
Human Alimentary Tract Model - Chapter 3 - June-8 August 2004
35
Figure 3.1. Autoradiographs showing the retention of 238Pu in the villi of the small intestine
of newborn rats (A) and guinea pigs (B) after administration as the nitrate (from Harrison and
Stather, 1996).
5 3.4. Radionuclide secretion
(75) Secretions of the gastrointestinal tract are digestive enzymes and mucus produced by
the salivary glands, the epithelial cells of the gastrointestinal mucosa, the pancreas, and the
liver. Most digestive secretions are formed only in response to the presence of food in the 10 alimentary tract, and the quantity secreted in each segment of the tract is the amount needed
for proper digestion. Radionuclides are excreted from the body in intestinal secretions. The
resulting faecal excretion, together with urinary excretion are the main routes of radionuclides
losses from the body.
15 (76) Biliary secretion is known to be a particularly important excretion pathway for a
number of elements and then radionuclides and has been incorporated explicitly in the
physiologically based models for plutonium, americium, and several other elements (ICRP,
1993). For other elements activity removed from systemic regions is taken to be excreted in
either faeces or urine according to a constant ratio (ICRP 1994). Additional information 20 describing secretion into the alimentary tract will be given in forthcoming publications on
dose coefficients for workers and members of the public, together with element-specific
models, systemic models.
Human Alimentary Tract Model - Chapter 3 - June-8 August 2004
36
(77) The rate of transfer of radionuclides into the alimentary tract in specific secretions
other than bile is generally difficult to quantify. However, such transfers have been postulated
for a number of elements on the basis that endogenous faecal excretion cannot be
accounted for entirely by the rate of loss of activity via the liver. In the ICRP’s physiologically 5 based models for plutonium and other elements, endogenous faecal excretion is accounted
for, in part, by a transfer from blood to the upper large intestine that represents collective
non-biliary secretion of activity into the alimentary tract. (ICRP, 1993 and 1995)
(78) Some elements with apparently low rates of biliary secretion, including barium and 10 radium, show high total rates of excretion into the gastrointestinal tract as indicated by a
rapid loss from the systemic pool and high rate of faecal excretion. In the physiologically
based models for barium and radium given in ICRP Publication 67 (1993), losses from the
systemic circulation are accounted for largely as a direct transfer from blood to the upper
large intestine representing unspecified secretions. 15
(79) Transfer from blood to the upper large intestine, which represents most of the right
colon, have been used in ICRP models to account for gastrointestinal secretions for which
there is presumably no reabsorption to blood. This is in contrast to assumptions regarding
biliary secretion of radionuclides; in this case, the radionuclide is assigned to the contents of 20 the small intestine and thus is available for reabsorption to blood at the same rate as
assumed for the initial input of the radionuclide into the small intestine.
(80) Transfer of systemic activity through secretions into the alimentary tract has been
estimated in considerable detail for the alkali metals potassium, rubidium, and caesium 25 (Leggett and Williams, 1986, 1988; Leggett et al., 2003). Estimates for caesium are
summarized in Table 3.2. The estimates are given in terms of transfer coefficients, defined
as fractional transfers of the steady-state content of a donor compartment per unit time. For
example, if plasma contained 0.1 Bq of caesium under steady-state conditions, then a
transfer coefficient of 1.935 d-1 from plasma to the oral cavity contents in saliva indicates a 30 daily transfer of 1.935 d-1 x 0.1 Bq = 0.1935 Bq d-1. For all secretions other than bile, the
donor compartment is assumed in these calculations to be plasma, even though there may
be a brief residence of caesium in intermediate tissues (e.g., salivary glands in the case of
transfer of caesium from plasma to saliva). For bile, the donor compartment is assumed to
be the liver. 35
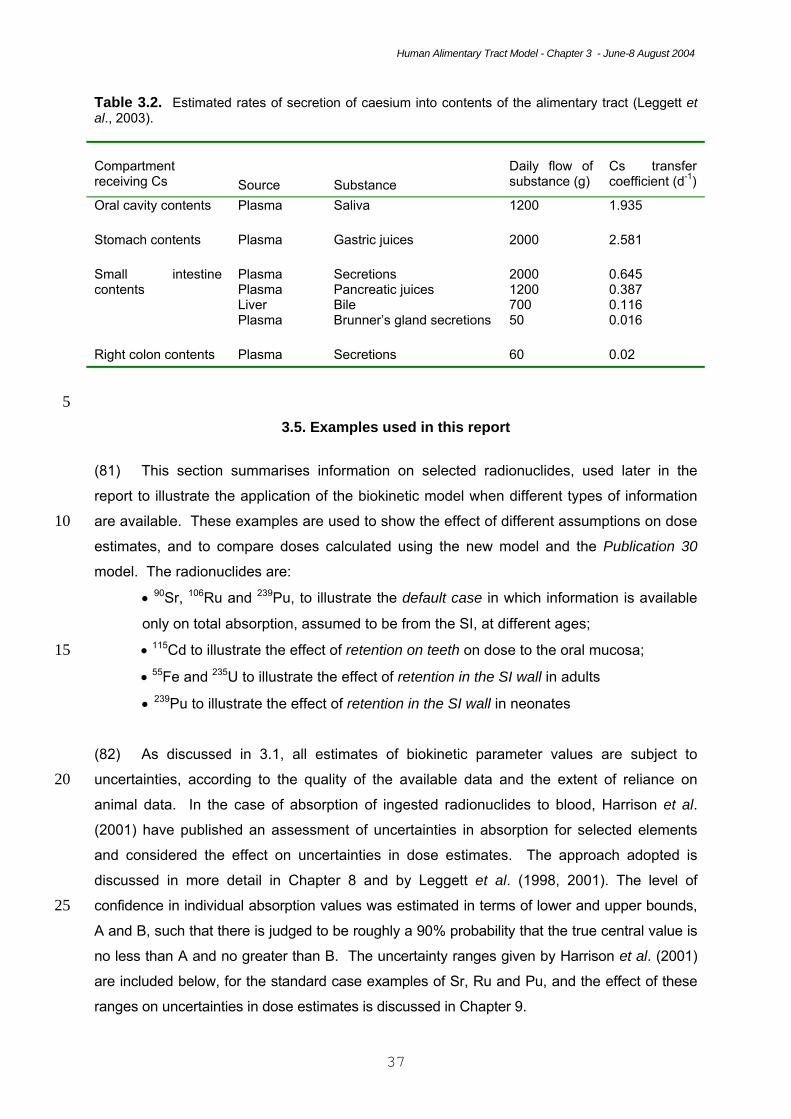
Human Alimentary Tract Model - Chapter 3 - June-8 August 2004
37
Table 3.2. Estimated rates of secretion of caesium into contents of the alimentary tract (Leggett et al., 2003). Compartment receiving Cs
Source
Substance
Daily flow of substance (g)
Cs transfer coefficient (d-1)
Oral cavity contents Plasma Saliva 1200 1.935 Stomach contents
Plasma
Gastric juices
2000
2.581
Small intestine contents
Plasma Plasma Liver Plasma
Secretions Pancreatic juices Bile Brunner’s gland secretions
2000 1200 700 50
0.645 0.387 0.116 0.016
Right colon contents
Plasma
Secretions
60
0.02
5 3.5. Examples used in this report
(81) This section summarises information on selected radionuclides, used later in the
report to illustrate the application of the biokinetic model when different types of information
are available. These examples are used to show the effect of different assumptions on dose 10 estimates, and to compare doses calculated using the new model and the Publication 30
model. The radionuclides are:
• 90Sr, 106Ru and 239Pu, to illustrate the default case in which information is available
only on total absorption, assumed to be from the SI, at different ages;
• 115Cd to illustrate the effect of retention on teeth on dose to the oral mucosa; 15
• 55Fe and 235U to illustrate the effect of retention in the SI wall in adults
• 239Pu to illustrate the effect of retention in the SI wall in neonates
(82) As discussed in 3.1, all estimates of biokinetic parameter values are subject to
uncertainties, according to the quality of the available data and the extent of reliance on 20 animal data. In the case of absorption of ingested radionuclides to blood, Harrison et al.
(2001) have published an assessment of uncertainties in absorption for selected elements
and considered the effect on uncertainties in dose estimates. The approach adopted is
discussed in more detail in Chapter 8 and by Leggett et al. (1998, 2001). The level of
confidence in individual absorption values was estimated in terms of lower and upper bounds, 25 A and B, such that there is judged to be roughly a 90% probability that the true central value is
no less than A and no greater than B. The uncertainty ranges given by Harrison et al. (2001)
are included below, for the standard case examples of Sr, Ru and Pu, and the effect of these
ranges on uncertainties in dose estimates is discussed in Chapter 9.
Human Alimentary Tract Model - Chapter 3 - June-8 August 2004
38
3.5.1. Default case – information available on total absorption and excretion via the alimentary tract Strontium 5
(83) Due to the presence of Sr isotopes in fall-out material and its long-term retention in
bone as a Ca analogue, the metabolism of Sr has been the subject of a number of human
volunteer studies. Similar absorption values were obtained from studies in which inorganic
forms of radiostrontium were administered orally in solution (Spencer et al., 1960; Suguri et al., 10 1963; Shimmins et al., 1967) and from experiments where known quantities of radiostrontium
incorporated in food were ingested (Fujita, 1966; Carr, 1967). In each case, mean values were
between 0.1 and 0.3, averaging about 0.2. LeRoy et al. (1966) measured the absorption of Sr
from real and simulated fall-out and after administration of 85Sr chloride. Ten volunteers
ingested samples of local fallout, largely comprising silicaceous soil constituents (40-700 µm 15 particles). The estimated absorption averaged 0.03 with a range of 0 - 0.09. For simulated
fallout prepared as glass microspheres (30-40 µm), the estimated fractional absorption was
0.16 (range 0.06 - 0.25), with a value of 0.17 (0.08 - 0.34) after administration as the chloride.
(84) A number of factors have been found to increase absorption, including fasting and low 20 dietary levels of Ca, Mg and P; milk diets and vitamin D may also increase absorption. Spencer
et al. (1972) showed that overnight fasting increased absorption from about 0.25 to 0.55.
McAughey et al. (1994) also reported a fractional absorption of 0.55 (0.38 - 0.72) for 4
volunteers after an overnight fast compared with 0.11 in a single volunteer ingesting Sr after
breakfast. A decrease in Ca content of the diet from 30 - 40 to 0 - 10 mg d-1 kg-1 increased Sr 25 absorption from an average of 0.2 to 0.4 (Shimmins et al., 1967).
(85) Results from animal studies are generally similar (Coughtrey and Thorne, 1983) to
those from volunteer studies. Results for the absorption of Sr administered as the titanate
(SrTiO3) to rats show low levels of absorption of about 0.01 (McClellan and Bustad, 1964). 30
(86) Results obtained by Widdowson et al. (1960) suggested that absorption of strontium in
7 day old infants fed with cows’ milk was greater than 0.7. Bedford et al. (1960) reported that
absorption in 5-15-year-old children was the same as in adults. Taylor (1962) obtained
absorption values of 0.95 + 0.004. (SE, n=31) for 14-18 day old rats and 0.74+0.024 (SE, n=5) 35 for 22 day old animals.
Human Alimentary Tract Model - Chapter 3 - June-8 August 2004
39
(87) The fractional absorption, values used in Publication 67 (ICRP, 1993) for ingestion of Sr
by members of the public were 0.3 for adults, 0.6 for 3 month old infants and an intermediate
value of 0.4 for children. Harrison et al. (2001) proposed confidence intervals of 0.1 (A) to 0.4
(B) for adults, 0.1 – 0.5 for 10 year old children and 0.15 – 0.75 for 3 month old infants. For the
purposes of illustration, these values are applied in this report to absorption from the small 5 intestine, with no delay in transfer to blood; that is, no retention in the SI wall.
(88) The excretion of Sr via the alimentary tract is modelled explicitly by a systemic
biokinetic model for the alkaline earth elements, developed by Leggett et al. (1982, 1992)
and adopted by ICRP (1993). Data for human subjects receiving radiostrontium by 10 intravenous injection indicate that secretions into the alimentary tract account for 20-25% of
endogenous loss of strontium on average (Leggett, 1992). Data from animal studies indicate
that biliary secretion accounts for only a small portion of the total secretion of strontium or its
physiological analogue, calcium, into the alimentary tract (Lengemann, 1963; Wiseman,
1964). In the ICRP’s biokinetic model for strontium (ICRP, 1993), secretion of systemic 15 strontium into the contents of the alimentary tract is represented, for simplicity, as a transfer
from blood plasma to the contents of the upper large intestine (see Chapter 5).
Ruthenium 20 (89) Measurements of the absorption of Ru in male volunteers after ingestion of chloro-
complexes of Ru(III) and Ru(IV) gave values of about 0.01 and a similar value was obtained for
absorption from contaminated clams (Yamagata et al., 1969); values for nitrosyl Ru(III) were
about three times greater.
25 (90) Results from a number of studies of the absorption of 106Ru administered as the
chloride to mice, rats, rabbits, guinea pigs, chickens, cats, dogs and monkeys, including values
for fasted animals, were in the range of 0.03 - 0.06 (Burykina, 1962; Thompson et al., 1958;
Furchner et al., 1971; Bruce and Carr, 1961; Stara et al., 1971). Values for 106Ru administered
as the oxide to rats and rabbits were in the range of 0.003 - 0.03. Bruce and Carr (1961, 1963) 30 measured the absorption of Ru administered in the form of nitrosyl derivatives. Both nitrato and
nitro- complexes of nitrosyl Ru are formed during dissolution in nitric acid in the reprocessing or
U fuels. The nitro-complexes are probably more important because they are more resistant to
hydrolysis in neutral and alkaline conditions. Results obtained for the nitrato-nitrosyl complex in
rats and rabbits were 0.06 and 0.13, respectively. A value of 0.04 was reported for the 35 absorption of Ru administered to rats as a nitro-nitrosyl.
Human Alimentary Tract Model - Chapter 3 - June-8 August 2004
40
(91) Few data are available on the absorption of ruthenium in young animals. Matsusaka et
al. (1969) reported absorption of about 0.07 in newborn mice given 106Ru as the chloro-
complex in dilute HCl compared with less than 0.01 in 21 day-old and adult animals. Inaba et
al. (1984) measured the absorption of 103Ru administered as the chloride as 0.08 in 5 day-old
rats and 0.05 in adults. 5
(92) The ICRP (1989) f1 values for Ru ingested by members of the public were 0.05 for
adults and 0.1 for 3 month-old infants. The value for adults was also applied to children from
one year of age. Harrison et al. (2001) proposed confidence intervals of 0.005 (A) to 0.1 (B) for
adults, 0.005 to 0.15 for 10 year old children and 0.005 to 0.2 for 3 month old infants. For the 10 purposes of illustration, these values are applied in this report to absorption from the small
intestine, with no delay in transfer to blood; that is, no retention in the SI wall.
(93) Data on laboratory animals indicate that secretion of ruthenium into the alimentary
tract accounts for 20-50% of total excretion of systemic ruthenium (Thompson et al., 1958; 15 Runkle et al., 1980; Snipes, 1981). The main sites of secretion of ruthenium have not been
determined. In the ICRP’s current systemic biokinetic model for Ru (ICRP, 1989, 1993),
secretion into the alimentary tract is represented as a transfer from blood to the contents of
the upper large intestine.
20 Plutonium (94) Three studies of the absorption of Pu in humans have been reported. In the first,
concentrations of fall-out Pu in autopsy samples of bone, liver and lung from five male
residents of Lappland were compared with corresponding concentrations in tissues of persons 25 who had lived in southern Finland (Mussalo-Rauhamaa et al., 1984). The dietary intake of Pu
by the Lapps was derived mainly from reindeer meat, especially liver, and was about 10 - 15
times greater than that in southern Finns. The authors used the data to calculate an f1 of 8 x
10-4, a value which they recognized to be based on insufficient sample analyses and uncertain
assumptions concerning the exposure of the two groups to inhaled Pu. Hunt et al. (1986, 30 1990) have carried out two studies of the absorption of 239/240Pu and 241Am by eight volunteers,
six men and two women, who consumed winkles collected on the Cumbrian coast near to the
Sellafield nuclear-fuel reprocessing plant. The reported f1 values for Pu ranged from 2 x 10⁻⁵ to
5 x 10⁻⁴, with a median of 1 x 10⁻⁴ and a mean of 2 x 10⁻⁴ (+1 SD), suggesting 90% confidence
limits of about 8 x 10⁻⁵ to 4 x 10⁻⁴. Ham and Harrison (2000) reported measurements of the 35 absorption of 244Pu administered in citrate solution to five male volunteers. The f1 values
obtained, based on comparisons or urinary excretion of 244Pu after oral and intravenous
Human Alimentary Tract Model - Chapter 3 - June-8 August 2004
41
administration, were 1.3 x 10⁻⁴, 2.4 x 10⁻⁴, 7.8 x 10⁻⁴, 8.9 x 10⁻⁴ and 1.2 x 10⁻³, with a mean
value of 6 x 10⁻⁴.
(95) Animal data on the absorption of Pu in species including rodents, pigs, dogs and
primates has been extensively reviewed (ICRP, 1986; Harrison, 1991). The chemical form 5 ingested is an important factor affecting absorption. The lowest values obtained are for the
oxide, ranging from about 2x10⁻⁴ in the rat (Sullivan, 1980) to about 3x10⁻⁸ in the pig (Smith,
1970). These large differences are probably a reflection of the solubility of the oxide
preparation, which is affected by the method of production (Mewhinney et al., 1976), the
proportion of small particles present (Stather et al., 1975) and the specific activity of the isotope 10 (Fleischer and Raabe, 1977). Mixed Pu-sodium oxides contain a higher proportion of very
small particles (about 1 nm diameter) and a greater soluble fraction than the pure oxides
(Stather et al., 1975) and suspensions of 238Pu oxide are more prone than those of 239Pu oxide
(6.27x10⁸ and 2.25x10⁶ kBq g-1, respectively) to radiolytic breakdown to small particles
(Fleischer and Raabe, 1977). Comparisons of the behaviour of inhaled Pu oxide and mixed 15 U/Pu oxides in rats and baboons showed that although solubility in the lung was low in each
case, transfer of Pu to liver and bone was about two to three times greater for the mixed oxide
(Lataillade et al., 1995).
(96) The range in values of uptake for Pu administered to animals as the nitrate, chloride or 20 bicarbonate is not as large as for the oxide. In general, the results are between 10-4 and 10-5.
Fasting has been shown to increase absorption by up to an order of magnitude. For example,
absorption in mice fasted for 8 hours before and 8 hours after the administration of 236Pu
bicarbonate was about 10-3 compared with 2x10⁻⁴ in fed animals (Larsen et al., 1981). High
values of 10-3 to 2x10⁻³ have been reported for uptake of 237Pu nitrate given as a single dose to 25 rats and mice (Sullivan, 1981; Sullivan et al., 1982). These results were taken as evidence of
increased absorption at low masses. However, in experiments to determine the effect of
chronic ingestion at low concentrations, a value of 3x10⁻⁵ was obtained for the nitrate in rats
(Weeks et al, 1956) and 10-5 for the bicarbonate in hamsters (Stather et al., 1981). It would
appear that in general ingested mass and valence are not important factors affecting 30 absorption. However, at high masses of Pu(V), absorption may be increased by an order of
magnitude as demonstrated by Métivier et al. (1985) in studies using baboons.
(97) The absorption of Pu administered to animals as organic complexes or incorporated
into food materials is generally greater than for inorganic forms (ICRP, 1986). For example, 35 most of the reported values for Pu citrate are in the range 6x10⁻⁵ to 6x10⁻⁴ compared with the
range of 10-5 to 10-4 for the nitrate. An organic form of importance in reprocessing is Pu-
Human Alimentary Tract Model - Chapter 3 - June-8 August 2004
42
tributylphosphate for which Métivier et al. (1983) measured absorption in rats as about 10-4 to
2x10⁻⁴.
(98) There is strong evidence from animal experiments to conclude that Pu absorption from
the gastrointestinal tract may be increased by at least an order of magnitude in the human 5 neonate (see 3.2), but that any increased absorption would probably decrease rapidly during
the first few days or weeks of life (ICRP, 1986; Harrison and Fritsch, 1992; Fritsch et al., 1992).
The age by which absorption of Pu might decrease to adult levels is not known, but animal
studies indicate that adult values may be reached by about the time of weaning.
10 (99) ICRP (1993) f1 values for Pu ingested by members of the public are 5 x 10⁻⁴ for adults
and 5 x 10⁻³ for 3 month old infants. The adult value is also applied to children from one year
of age. Harrison et al. (2001) proposed confidence intervals of 1 x 10⁻⁴ (A) - 1 x 10⁻³ (B) for
adults and children, and 1 x 10⁻⁴ to 1 x 10⁻² for 3-month-old infants. For the purposes of
illustration, these values are applied in this report to absorption from the small intestine, with no 15 delay in transfer to blood; that is, no retention the SI wall.
(100) The excretion of Pu via the alimentary tract is explicitly modelled by the systemic
biokinetic model for the actinide elements, developed by Leggett and colleagues (Leggett and
Eckerman, 1984; Leggett, 1985, 1992) and adopted by ICRP (1993). On the basis of data on 20 human subjects injected with tracer amounts of Pu (Langham et al., 1950; Newton et al., 1998)
and measurements on Pu workers at times remote from intake, it has been estimated that
faecal excretion typically accounts for 25-40% of total excretion of systemic Pu over a period of
months or years after uptake of Pu to blood (Leggett, 1985, 2003; ICRP, 1993; Khokhryakov et
al., 2004). Data on rodents indicate that biliary secretion of Pu is an important source of 25 endogenous faecal excretion of Pu but is not the only source (Ballou et al., 1972). Kinetic
analysis of human injection data (Langham et al., 1950; Newton et al., 1998) indicate that
endogenous faecal excretion of Pu can be represented reasonably well as the sum of two
feeds from systemic pools. One of these feeds roughly parallels the activity of Pu in blood
while the second lags behind the blood content. In the ICRP’s systemic biokinetic models for 30 Pu (ICRP, 1993), these two feeds are assumed to represent secretion from blood directly into
the intestinal contents (assumed for simplicity to occur in the upper large intestine) and transfer
from the liver to the contents of the small intestine in bile, respectively. The model predicts that
these two sources contribute nearly equally to endogenous faecal excretion of Pu over a period
of months or years after uptake of Pu to blood. 35
Human Alimentary Tract Model - Chapter 3 - June-8 August 2004
43
3.5.2. Retention on teeth Cadmium (101) As discussed in 3.3, Bhattacharyya et al. (1985) reported detailed findings of the 5 retention of 109Cd, 210Pb and 236Pu on the teeth of mice after ingestion in drinking water. In
each case, comparisons were made between the tissue distribution observed in these mice
and in corresponding groups given the radionuclides either by gavage into the stomach or by
intravenous injection. The results obtained showed clear evidence of retention in the mouth,
and on teeth in particular. The example of Cd is pursued here because 115Cd retained on 10 teeth will deliver dose to the target cells within the oral mucosa, assumed to be the basal
layer of the squamous epithelium (see Chapters 2, 4 and 7).
(102) Bhattacharyya et al. (1985) measured retention of about 0.2% of ingested 109Cd(II) on
teeth at 60 hours after administration. No information is available from this study on the 15 duration of retention of 109Cd or the other nuclides on teeth. Results obtained by Renauld-
Salis et al. (1990) for the retention of 238Pu on rats’ teeth, after administration as Pu(VI) in
drinking water, can be taken to suggest half-times of retention of 2 – 4 weeks, although
results for Pu(IV) suggested longer retention. However, it seems unlikely that retention times
in rodents would apply to humans, given recognised differences in oral hygiene. For the 20 purposes of illustration in this report, it is assumed that 0.2% of ingested 115Cd is retained on
teeth with an arbitrary half-time of retention of 1 week.
(103) Cadmium was not considered among the 31 elements for which radionuclide dose
coefficients have been given for members of the public. Ingestion of isotopes of Cd by workers 25 was considered in Publication 30 (ICRP 1980). The f1 values adopted for ingestion of
inorganic forms of Cd was 0.05, on the basis of measurements of absorption in mice, rats and
goats. Greater values of 0.06 – 0.25 were reported by Rahola et al. (1972) for absorption of
Cd by volunteers given Cd in calves’ liver. The effects of assumptions regarding absorption
are not pursued in this report; the illustrative calculations in Chapters 8 and 9 assume 30 absorption of 0.05 from the small intestine.
3.5.3. Retention in the SI wall Iron 35
Human Alimentary Tract Model - Chapter 3 - June-8 August 2004
44
(104) As discussed in 3.3, Werner et al. (1987) studied absorption and retention of Fe in
human volunteers, as an example of an essential element. Comparison of whole body
retention of 59Fe after either oral or intravenous administration and whole body retention of a 51Cr non-absorbable marker after oral administration provided evidence of temporary
retention of about 20% of the ingested 59Fe. The authors interpretation of the results 5 obtained were that, of about 40% total uptake by the absorptive enterocytes of the small
intestine, about half passed directly through the lamina propria to the capillary network of the
villi. It was suggested that the other half may be incorporated by macrophages lying under
the epithelial layer and subsequently transferred to goblet cells in the epithelium and
excreted back into the lumen of the intestine. The data presented were consistent with a 10 half-time of intestinal retention of about 3 days.
(105) The fractional absorption of 0.2 obtained by Werner et al. (1987) compares with a value
of 0.1 used by ICRP (1995a) for adult members of the public. However, as discussed in
Publication 69 (ICRP 1995a), iron absorption can vary substantially depending on a number of 15 factors, including the amount of Fe in the diet, the chemical form ingested and the nature of
other dietary constituents, and the Fe status of the individual. Iron deficiency is associated with
increased absorption; increases during pregnancy and lactation are discussed in 3.2. In
normal adults, values of 0.01 – 0.07 have been reported for Fe absorption form vegetable
foodstuffs, while values of 0.1 – 0.2 are more typical of Fe absorption from meat and fish. 20 Werner et al. (1987) did not give details of Fe status and chemical form administered but it is
likely that the Fe was administered after a period of fasting, a standard procedure adopted by
these authors.
(106) For illustrative purposes in this report (see chapter 8), the parameter values of Werner 25 et al. (1987) are used without change. That is, it is assumed that total uptake into the SI wall is
0.4 of ingested 55Fe, that 0.2 is absorbed to blood and that the remaining 0.2 is returned from
the SI wall into the gut lumen. It is assumed that this retention is confined to the villi.
Uranium 30 (107) As discussed in 3.3, Leggett and Harrison (1995) noted that the baboon data of
Larsen et al (1984) and urinary excretion data from U absorption studies on human
volunteers (Hursh et al., 1969; Wrenn et al., 1989; Harduin et al., 1994) are consistent with
the assumption that U passes through the intestinal wall with a half-time of 1 – 3 days and 35 behaves the same as directly injected U once it reaches blood.
Human Alimentary Tract Model - Chapter 3 - June-8 August 2004
45
(108) Information on the absorption of U is available from studies involving direct
measurements of absorption in human volunteers, dietary balance data for several different
human groups, and measurements of absorption in a variety of laboratory animals (Harrison
and Leggett, 1995; ICRP, 1995a). On the basis of these data, an f1 value of 0.02 was used in
Publication 69 (ICRP, 1995a) for adult members of the public. Harrison et al. (2001) proposed 5 confidence intervals of 0.006 (A) - 0.03 (B). For illustrative purposes in this report, SI
absorption of 0.02 is assumed and the effect of slow passage through the SI wall with a half-
time of 2 days is examined. It is assumed that the temporary retention in the SI wall is
confined to the villi. 10 Plutonium
(109) As discussed in 3.3, studies using different mammalian species have shown retention
of radionuclides in the wall of the small intestine of newborn animals, associated with increased
absorption during this period of development. Species differences in the extent and location of 15 retention relate to differences in the acquisition of passive immunity (Harrison and Fritsch,
1992; Fritsch et al., 1992). Retention in humans is likely to resemble that observed in guinea
pigs and primates – that is, relatively low levels of retention, mainly within villi, beneath the
epithelial layer – rather than rats and pigs, with high levels of retention in the epithelial
enterocytes of the villi. 20
(110) Lataillade et al. (1992) measured retention of 238Pu retention in baboons at four days
after ingestion as the citrate as about 1.5% after administration at 50 days of age, with lower
values at greater ages (see 3.3). Similarly, Fritsch et al. (1992) reported that short-term
intestinal retention of Pu in baboons was similar to the observed level of absorption to blood. 25 tissues. From autoradiographic studies they estimated that 95% of retained Pu in the small
intestine of baboons was located in the tips of the villi but that about 5% was in the vicinity of
the crypts. The data for primates do not provide reliable information on the time-course of
retention but studies using guinea pigs, with a similar pattern or retention in sub-epithelial
macrophages, have shown a decrease in retention with a reported half-time of 6.5 days 30 (Fritsch et al., 1990).
(111) For illustrative purposes in this report, it is assumed that uptake into the SI wall in
human infants corresponds to 0.02 of ingested 239Pu, that absorption to blood is 5 x 10⁻³ (as
in ICRP, 1989) and that the half-time of retention in the wall is 1 week. It is further assumed 35 that 95% of the retained 239Pu is located in the villi and that 5% is located in the lamina
propria surrounding the crypts (see Chapters 2 and 7).
Human Alimentary Tract Model - Chapter 3 - June-8 August 2004
46
3.6. References
Allen, L.H. (1982) Calcium bioavailability and absorption: a review. Amer. J. Clin. Nutr. 35, 783-808. 5 Ballou, J. E.; Hess, J. O. Biliary plutonium excretion in the rat. Health Phys. 22: 369-372; 1972
Barton, J.C. (1987) The absorption of metals as a function of age. In: Age-related Factors in Radionuclide Metabolism and Dosimetry. (G.B. Gerber, H. Métivier, H. Smith, Eds.) Proc. CEC Workshop, Angers, France, 1986. Martinus Nijhoff, Lancaster. Pp. 1-12.
Beach, R.D., Menzies, I.S., Clayden, G.S., Scopes, J.W. (1982) Gastrointesitnal permeability 10 changes in the preterm neonate. Arch. Disease Childhood 57, 141-145.
Bedford, J., Harrison, G.E., Raymond, W.H.A., Sutton, A. (1960) The metabolism of strontium in children, Br. Med J. 1, 589-592.
Bhattacharyya, M.H., Larsen, R.P., Furr, H.C., Peterson, D.P., Oldham, R.D., Moretti, E.S., Spaletto, M.I. (1985) Adsorption of Pu, Pb and Cd to mouth surfaces during oral administration 15 to mice. Health Phys. 48, 207-213.
Bhattacharyya, M.H., Larsen, R.P., Cohen, N., Ralston, L.G., Moretti, E.S., Oldham, R.D., Ayres, L. (1989) Gastrointestinal absorption of plutonium and uranium in fed and fasted adult baboons and mice: application to humans. Radiat. Prot. Dosim. 26, 159-165.
Bockman, D.E., Cooper, M.D. (1971) Fine strucural analysis of pinocytosis in lymphoid follicle-20 associated epithelium of chick bursa and rabbit appendix. Fed. Proc. 30, 511.
Book,SA, M Goldman, N J Parks, L S Rosenblatt, W L Spangler. (1983). Strontium-90 and radium-226 toxicity : experimental design and current status. Internal report from Laboratory for Energy-Related Health Research. UCD 472-128, 2-43.
Brambell, F.M.R. (1970) Transmission of passive immunity from mother to young. Frontiers in 25 Biology. 18 (Amsterdam: North Holland).
Bruce, R.S. , Carr, T.E.F. (1961) Studies in the metabolism of carrier-free radio-ruthenium - I. Preliminary investigations. Reactor Sci. Technol. (JNE Pts AB) 14, 9-17.
Bruce, R.S. (1963) Some factors influencing the absorption, retention and elimination of radioruthenium. In: Diagnosis and Treatment of Radioactive Poisoning. pp. 207-224. IAEA, 30 Vienna.
Burykina, L.N. (1962) The metabolism of radioactive ruthenium in the organism of experimental animals. In: The Toxicology of Radioactive Substances, Vol. 1 (A.A. Letavel and E.P. Kurlyandsicaya, Eds.) pp.60-76. Pergamon Press, Oxford.
Carr, T. (1967) An attempt to quantitate the short term movement of strontium in the human 35 adult. In: Stontium Metabolism. (Ed. Lenihan, J; Loutit, J; Martin, J.)
Clarke, R.M., Hardy, R.N. (1971) Structural changes and the uptake of polyvinyl pyrrolidone in the small intestine. J. Anat. 108, 79-87.
Cleymaet,R, P Bottenberg, D Slop, D Coomans, (1993), In vivo evaluation of the level of lead in human superficial enamel using a double biopsy: Rev.Belge Med.Dent., 48, 72-81. 40 Coughtrey, P.J., Thorne M.C. (1983) Radionuclide distribution and Transport in terestrial and quatic Ecosystems, (Balkema A.A. ed.,) Rotterdam. Vol 1. pp.170-210. Sr Vol 3. pp. 275-286 Sb pp. 341-357 I.
Cross, N.A., Hillman, L.S., Allen, S.H. et al. (1995) Calcium homeostasis and bone metabolism during pregnancy, lactation and post-weaning: a lonitudinal study. Amer. J. Clin. Nutr. 61, 514-45
Human Alimentary Tract Model - Chapter 3 - June-8 August 2004
47
523.
Eisele, G.R., Mraz, F. (1981) Absorption of 95Nb from ligated segments of the gastrointestinal tract of the rat. Health Phys. 40, 235-238.
Fagan, E.A., Murphy, R., Chadwick, V.S. (1981) Measurements of intestinal permeability in human neonates. Clin. Science 60, 5. 5 Fleischer, R.L., Raabe, O.G. (1977) Fragmentation of respirable PuO2 particles in water by alpha decay - a mode of dissolution. Health Phys. 32, 253-
Fritsch, P., Moutairou, K., Lataillade, G., Beauvallet, M., L’Hullier, I., Lepage, M. (1988) Localisation of plutonium retention in the small intestine of the neonatal rat, guinea pig, baboon, and macaca after Pu-citrate ingestion. Int. J. Radiat. Biol. 54, 537-543. 10 Fritsch, P., Moutairou, K., Lataillade, G., Beauvallet, M., L’Hullier, I., Lepage, M., Métivier, H., Masse, R. (1990) Kinetics of plutonium retention in the gastrointestinal tract after Pu-citrate ingestion by two day old guinea pigs. Int. J. Radiat. Biol.
Fritsch, P., Moutairou, K., Harrison, J.D. (1992) Mechanisms of intestinal absorption of ingested plutonium in neonatal mammals. Radiat. Prot. Dosim. 41, 77-82. 15 Fujita, M., Yabe, A., Akaishi, J., Ohtani, S. (1966) Relationship between ingestion, excretion and accumulation of fallout caesium-137 in man on a long time scale. Health Phys. 12, 1649-1653.
Furchner, J.E., Richmond, C.R., Drake, G.A. (1971) Comparative metabolism of radionuclides in mammals, VII. Retention of 106-Ru in the mouse, rat, monkey and dog. Health Phys. 21, 20 355-365.
Gabler, W.L. (1968) Absorption of fluoride through the oral mucosa of rats. Arch. Oral Biol. 13, 619-623.
Gerber, G.B., VanHees, M., Garten, C.T. et al. (1989) Technetium absorption and turnover in monogastric and polygastric animals. Health Phys. 57, 315-319. 25 Ham, G.J., Harrison, J.D. (2000) The gastrointestinal absorption and urinary excretion of plutonium in male volunteers. Radiat. Prot. Dosim. 87, 267-272.
Harduin, J.C., Royer, Ph, Piechowski, J. (1994) Uptake and urinary excretion of uranium after oral administration in man. Proc. CEC/US-DOE/NRPB/IPSN Workshop: Intakes of Radionuclides. September 1993, Bath. Radiat. Prot. Dosim. 53, 245-248. 30 Harrison, J.D., Popplewell, D.S., David, A.J. (1984) The effect of concentration and chemical form on the gastrointestinal absorption of neptunium. Internat. J. Radiat. Biol. 46, 269-277.
Harrison, J.D., Bomford, J.A., David, A.J. (1987) The gastrointestinal absorption of plutonium and americium in neonatal mammals. In: Age-related Factors in Radionuclide Metabolism and Dosimetry. (G.B. Gerber, H. Métivier, H. Smith, Eds.) Proc. CEC Workshop, Angers, France, 35 1986. Martinus Nijhoff, Lancaster. Pp. 27-34.
Harrison, J.D. (1991) The gastrointestinal absorption of the actinide elements. Sci. Total Environment 100, 43-60.
Harrison, J.D., Stather, J.W. (1996) The assessment of doses and effects from the intake of radioactive particles. J. Anat. 189, 521-530. 40 Harrison, J.D., Fritsch, P. (1992) The effect of age on the absorption and intestinal retention of ingested radionuclides. Radiat. Prot. Dosim. 41, 71-76.
Harrison, J.D., Leggett, R.W., Nosske, D., Paquet, F., Phipps, A.W., Taylor, D.M., Métivier, H. (2001) Reliability of the ICRP’s dose coefficients for members of the public, II. Uncertainties in the absorption of ingested radionuclides and the effect on dose estimates. Radiat. Prot. 45 Dosim. 95, 295-308.
Human Alimentary Tract Model - Chapter 3 - June-8 August 2004
48
Harrison, J.D., Phipps, A.W. (2001) Invited editorial: Gut transfer and doses from environmental technetium. J. Radiol. Prot. 21, 9-11.
Heard, M.J. Chamberlain, A.C. (1982) Effects of meals and meals times on uptake of lead from the gastointestinal in himans. Human Toxicol. 1, 411-415.
Hunt, G.J., Leonard, D.R.P., Lovett, M.B. (1986) Transfer of environmental plutonium and 5 americium across human gut. Sci. Total Environ. 53, 89-109.
Hunt, G.J., Leonard, D.R.P., Lovett, M.B. (1990) Transfer of environmental plutonium and americium across the human gut: A second Study. Sci. Total Environ. 90, 273-282.
Hunt, G.J., Young, A.K., Bonfield, R.A. (2001) Transfer across the human gut of environmental technetium in lobsters (homarus gammarus L.) from the Irish Sea. J. Radiol. Prot. 21, 21-29. 10 Hursh, J.B., Neuman, W.R., Toribara, T., Wilson, H., Waterhouse, C. (1969) Oral ingestion of uranium by man. Health Phys. 17, 619-621.
Inaba, J., Nishimura, Y., Ichikawa, R. (1984) Effect of age on the metabolism of some important radionuclides in the rat. In: Radiation Risk Protection, Vol. I. Proc. 6th Int. Congress of IRPA (A. Kaul, R. Neider, J. Pensko, F.-E. Stieve and H. Brunner, Eds) pp.481-484. 15 Fachverband fur Strahlenschutz e.V., Berlin.
International Commission on Radiological Protection. (1979) Limits on Intakes of Radionuclides for Workers. ICRP Publication 30, Pt.1. Pergamon Press, Oxford. Ann. ICRP 2, (3/4).
International Commission on Radiological Protection. (1986), The Metabolism of Plutonium and Related Elements, ICRP Publication 48. Pergamon Press, Oxford. Ann. ICRP 16, (2/3). 20 International Commission on Radiological Protection. (1989) Age-dependent Doses to Members of the Public from Intake of Radionuclides. Pt.1. ICRP Publication 56. Pergamon Press, Oxford. Ann. ICRP 20 (2). Ann. ICRP 20, (2).
International Commission on Radiological Protection. (1993) Age-dependent Doses to Members of the Public from Intake of Radionuclides. Pt.2. Ingestion Dose Coefficients. ICRP 25 Publication 67. Elsevier Science Ltd., Oxford. Ann. ICRP 23, (3/4).
International Commission on Radiological Protection. (1995a) Age-dependent Doses to Members of the Public from Intake of Radionuclides. Pt.3. Ingestion Dose Coefficients. ICRP Publication 69. Elsevier Science Ltd., Oxford. Ann. ICRP 25, (1).
International Commission on Radiological Protection. (1995b) Age-dependent Doses to 30 Members of the Public from Intake of Radionuclides. Pt.4. Inhalation Dose Coefficients. ICRP Publication 71. Elsevier Science Ltd., Oxford. Ann. ICRP 25, (3-4).
James, H.M., Hilburn M.E., Blair, J.A. (1985) effects of meals and meal times on uptake of lead from the gastrointestinal tract in humans. Human Toxicol. 4, 401-407.
Joel, D.D., Laissue, J.A., Lefevre, M.E. (1978) Distribution and fate of ingested carbon 35 particles in mice. J. Reticuloendothel. Soc. 24, 477-487.
Joel, D.D., Sordat, B., Hess, M.W., Cottier, H. (1984) Uptake and retention of particles from the intestine by Peyer's patches in mice. Experentia. 26, 694
Khokhryakov, V. F.; Suslova, K. G.; Kudryavtseva, T. I.; Schadilov, A. E.; Vostroitin, V. V.; Lagounova, N. Yu.; Barabanshchikova, A. Yu. Relative role of plutonium excretion with urine 40 and feces from human body. Health Phys. 86:523-527; 2004.
Lataillade, G., Verry, M., Rateau, G., Métivier, H., Masse, R. (1995) Plutonium solubility in rat and monkey lungs after inhalation of industrial plutonium oxide and mixed uranium and plutonium oxide. Int. J. Radiat. Biol. 67, 373-380.
Human Alimentary Tract Model - Chapter 3 - June-8 August 2004
49
Lataillade, G., Fritsch, P., Duserre, C., Rateau, G., Verry, M., Métivier, H. (1992) Absorption gastrointestinale du plutonium et du neptunium chez le singe babouin nouveau né. CEA-R-5598, Gif sur Yvette. CEA. 1-19.
Lang, S., Raunemaa, T. (1991) Behavior of neutron-activated uranium dioxide dust particles in the gastrointestinal tract of the rat. Radiat. Res. 126, 273-279. 5 Langham, W. H., Bassett, S. H., Harris, P. S., Carter, R. E. Distribution and excretion of Pu administered to man, Los Alamos Scientific Laboratory, LA-1151; 1950.
Larsen, R.P., Bhattacharyya, M.H., Oldham,R.D., Moretti, E.S., Spaletto, M.I. (1981) Continued studies of the gastrointestinal absorption of plutonium in rodents. In: Annual Report for Radiological and Environmental Research Division, Argonne National Laboratory, Illinois. ANL-10 81-85 (Pt.II) pp.105-116.
Larsen, R.P., Orlandini, K.A. (1984) Gastrointestinal absorption of uranium in man. In: Environmental Research Division Annual Report, July 1982 - June 1983; Argonnne National Laboratory, ANL-83-100-Pt.2. pp.46-50.
Le Roy, G.V., Rust, J.H., Hasterlik, R.J. (1966) The consequences of ingestion by man or real 15 and simulated fall-out. Health Phys. 12, 449-473.
Leggett, R.W., Eckerman, K.F., Williams, L.R. (1982) Strontium-90 in bone; a casestudy in age-dependent dosimetric modelling. Health Phys. 43, 307-322.
Leggett, R.W., Eckerman, K.F. (1984) A model for the age-dependent skeletal renetion of plutonium. In: Radaition-Risk-Protection. (A. Kaul, R. Neider, J. Pensko, Eds.) Fachverband fur 20 Strahlenschutz e.V. Berlin. pp.454-457.
Leggett, R. W. (1985) A model of the retention, translocation, and excretion of systemic Pu, Health Phys. 49:1115-1137.
Leggett, R. W., Williams, L. R. (1986) A model for the kinetics of potassium in healthy humans, Phys. Med. Biol. 31, 23-42. 25 Leggett, R. W., Williams, L. R. (1988) A biokinetic model for rubidium in humans, Health Physics 55, 685-702.
Leggett, R.W. (1992) A retention-excretion model for americium in humans. Health Phys. 62, 288-310.
Leggett, R.W. (1992) A generic age-dependent biokinetic model for calcium-like elements. 30 Radiat. Prot. Dosim. 41, 183-198.
Leggett, R.W., Harrison, J.D. (1995) Fractional absorption of ingested U in humans. Health Phys. 68, 1-15.
Leggett, R.W., Bouville, A., Eckerman, K.F. (1998) Reliability of ICRP’s systemic biokinetic models. Radiat. Prot. Dosim. 79, 335-342. 35 Leggett, R.W. (2001) Reliability of the ICRP’s dose coefficients for members of the public. I. Sources of uncertainty in the biokinetic models. Radiat. Prot. Dosim. 95, 199-213.
Leggett, R. W., Williams, L. R., Melo, D. R., Lipsztein, J. L. (2003) A physiologically based biokinetic model for cesium in the human body. Science of the Total Environment, 2003 (in press). 40 Leggett R.W. (2003). Reliability of the ICRP's dose coefficients for members of the public. III. Plutonium as a case study of uncertainties in the systemic biokinetics of radionuclides. Radiation Protection Dosimetry 106:103-120.
Lengemann, F. W. (1963).Overall aspects of calcium and strontium absorption. In: Wasserman, R. H., ed. The transfer of calcium and strontium across biological membranes. 45 Academic Press. New York; pp. 85-96.
Human Alimentary Tract Model - Chapter 3 - June-8 August 2004
50
Matsusaka, N., Inaba, J., Ichikawa, R., Ikeda, M., Ohkubo, Y. (1969) Some special features of nuclide metabolism in juvenile mammals. In: Radiobiology of the Fetal and Juvenile Mammal (M.R. Sikov and D.D. Mahlam, Eds) pp.217-226, USAEC-DT1.
McAughey, J.J., Vernon, L., Haines, J., Sanders, T., Clark, R. (1994) Fractional gut absorption of strontium, barium and neodymium following administration of stable isotope tracers. In: Proc. 5 9th Int. Conf. on Heavy Metals in the Environment. Toronto, 1993.
McClellan, R.O., Bustad, L.K. (1964) Gastrointestinal absorption of 85Sr titanate. In: Hanford Biology Research Annual Report for 1963. Washington (HW 80500). pp.100-101.
Métivier, H., Masse, R., Lafuma, J. (1983a) Metabolism of plutonium introduced as tri-N-butyl phosphate complex in the rat and removal attempts by DTPA. Health Phys. 44, 623-634. 10 Métivier, H., Masse, R., Lafuma, J. (1983b) Effet de la masse sur l'absorption intestinale du neptunium V chez le singe et le rat. Radioprotection. 18, 13-17.
Métivier, H., Madic, C., Bourges, J., Masse, R. (1985) Valency five, similarities between plutonium and neptunium in gastrointestinal uptake. In: Speciation of Fission and Activation Products in the Environment. (R.A. Bulman and J.R. Cooper, Eds.) Elsevier Applied Science 15 Publishers, London. pp.175-178.
Métivier, H. (1998) The work of Committee 2 of ICRP on a new model for the human alimentary tract. Radiat. Prot. Dosim. 79, 273-277.
Mewhinney, J.A., Muggenburg, B.A., McClellan, R.O., Miglio, J.J. (1976) The effect of varying physical and chemical characteristics of inhaled plutonium aerosols on metabolism and 20 excretion. In: Proc. Int. Seminar on Diagnosis and Treatment of Incorporated Radionuclides. Vienna, IAEA. pp.87-
Mussalo-Rauhamma, H., Jaakola, T., Miettinen, J.K., Laiho, K. (1984) Plutonium in Finnish Lapps- An estimate of the gastrointestinal absorption of plutonium by man based on a comparison of the plutonium content of Lapps and Southern Finns. Health Phys. 46, 549-559. 25 NEA. (1988) Committee on radiation protection and public health, NEA, OECD. Gastrointestinal absorption of selected radionuclides. Report by an NEA expert group, Paris. NEA OECD.
Newton, D.; Talbot, R. J.; Kang, C.; Warner, A. J. Uptake of Pu by the human liver. Radiat. Prot. Dosim. 80:385-395; 1998. 30 Nomura,R, 980, Experimental study on biological effect of cadmium. Cadmium distribution in teeth and various viscera of dogs: Nippon Eiseigaku Zasshi., 35, 550-564.
Owen, R.L. (1977) Sequential uptake of horseradish peroxidase by lymphoid follicle epithelium of Peyer's patches in the normal unobstructed mouse intestine: an ultrastructural study. Gastroenterology. 72, 440-451. 35 Patten, J.R., Whitford, G.M., Stringer, G.I., Pashley, D.H. (1978) Oral absorption of radioactive fluoride and iodide in rats. Arch. Oral Biol. 23, 215-217.
Rahola, T., Aaran, R., Miettinen, J.K. (1972) Half-time studies of mercury and cadmium by whole-body counting. In: Assessment of Radioactive Contamination in Man. IAEA-SM-150/13 pp.553-562. 40 Refsum, S.B., Schreiner, B. (1980) Iron excretion from the goblet cells of the small intestine of man. Scan. J. Gastroenterol. 15, 1013-1020.
Renauld-SalisV., Lataillade, G., Métivier, H. (1990) Effect of mass, oxidation state and duration of chronic ingestion on plutonium absorption in fed rats. Int. J. Radiat. Biol. 58, 691-704.
Runkle, G. E.; Snipes, M. B.; McClellan, R. O.; Cuddihy, R. G. Metabolism and dosimetry of 45 inhaled 106RuO4 in Fischer-344 rats. Health Phys. 39:543-553; 1980.
Human Alimentary Tract Model - Chapter 3 - June-8 August 2004
51
Sasser, L.B., Jarboe, G.E., Walter, B.K., Kelman, B.J. (1978) Absorption of mercury from ligated segments of the rat gastrointestinal tract. Proc. Soc. Exp. Biol. Med. 157, 57-60.
Smith, V.H. (1970) Fate of ingested 238PuO2 in miniature swine. In: Pacific Northwest Laboratory Annual Report for 1969. Pt.1. Biomedical Sciences. Richland, Wash. BNWL-1306. pp.62-63. 5 Snipes, M. B. Metabolism and dosimetry of 106Ru inhaled as 106RuO4 by beagle dogs. Health Phys. 41:303-317; 1981.
Spencer, H., Samachson, J., Laszlo, D. (1960) Metabolism of strontium-85 and calcium-45 in man. Metabolism Clinical and Experimental. 9, 916-925.
Spencer, H., Kramer, L., Norris, C., Samachson, J. (1972) Certain aspects of radiostrontium 10 metabolism in man. In: Proc. 2nd Int. Symp. Strontium Metabolism (J.M. Lenihan, Ed.), pp. 335-346.
Spencer, H., Osis, D., Fisenne, I.M., Perry, P.M., Harley, N.H. (1990) Measured intake and excretion patterns of naturally occurring 234U, 238U and calcium in humans. Radiat. Res. 124, 90-95. 15 Stara, J.F., Nelsoon, N.S., Della Rosa, R.J., Bustad, L.K. (1971) Comparative metabolism of radionuclides in mammals: a review. Health Phys. 20, 113-137.
Stather, J.W., Howden, S., Carter, R.F. (1975) A method for investigating the metabolism of the transportable fraction of plutonium aerosols. Phys. Med. Biol. 20, 106-X
Stather, J.W., Harrison, J.D., David, A.J., Sumner, S.A. (1981) The gastrointestinal absorption 20 of plutonium in the hamster after ingestion at low concentrations in drinking water. Health Phys. 41, 780-783.
Suguri, S., Ohtani, S., Oshino, M., Yanagishita, K. (1963) The behavior of strontium 85 in a normal man following a single ingestion - application of the whole body counter for the retention. Health Physics 9, 529-535. 25 Sullivan M.F. (1980) Absorption of actinide elements from the gastrointestinal tract of neonatal animals. Health Phys. 38, 173-185.
Sullivan, M.F. (1981) Influence of plutonium mass on absorption from the gastrointestinal tract of adult and neonatal rodents. In: Pacific Northwest Laboratory Annual Report for 1980. Pt.1. Biomedical Sciences. Richland, Wash. PNL-3700, pp.185-186. 30 Sullivan, M.F., Miller, B.M., Ryan, J.L. (1982) Gut-related radionuclide studies. In: Pacific Northwest Laboratory Annual Report for 1981. Pt.1. Biomedical Sciences. Richland, Wash. PNL-4100, pp.119-122.
Sullivan, M.F., Miller, B.M., Ryan, J.L. (1983a) The effect of mass on the gastrointestinal absorption of plutonium and neptunium. Radiat. Res. 94, 199-209. 35 Sullivan, M.F., Miller, B.M., Gorham, L.S. (1983b) Nutritional influences on plutonium absorption from the gastrointestinal tract of the rat. Radiat. Res. 96, 580-591.
Sullivan, M.F., Miller, B.M., Goebel, J.C. (1984) Gastrointestinal absorption of metals (51Cr, 65Zn, 95mTc, 109Cd, 113Sn, 147Pm, and 238Pu) by rats and swine. Environ. Res. 35, 439-453. 40 Sullivan, M.F., Cross, F.T., Dagle, G.E. (1987) Dosimetry of the gastrointestinal tract. In: Age-related Factors in Radionuclide Metabolism and Dosimetry. (G.B. Gerber, H. Métivier, H. Smith, Eds.) Proc. CEC Workshop, Angers, France, 1986. Martinus Nijhoff, Lancaster. pp.49-66.
Taylor, D.M., Bligh, P.H., Duggan, M.H. (1962) The absorption of calcium, strontium, barium 45 and radium from the gastrointestinal tract of the rat. Biochem J. 83, 25-29.
Human Alimentary Tract Model - Chapter 3 - June-8 August 2004
52
Thompson, R.C., Weeks, M.H., Hollis, L., Ballou, J.F., Oakley, W.D. (1958) Metabolism of radioruthenium in the rat. Amer. J. Roentgen. 79, 1026-1044.
Udall, J.N., Pang, K., Fritze, L., Kleinman, R., Walker, W.A. (1981) Development of gastrointestinal mucosal barrier: I. The effect of age on intestinal permeability to macromolecules. Pediatr. Res. 15, 241-244. 5 Van Campen, D.R., Mitchell, E.A. (1965) Absorption of Cu64, Zn65, Mo99 and Fe59 from ligated segments of the rat gastrointestinal tract. J. Nutr. 86, 120-124.
Wagner,MJ, (1962), Absorption of fluoride by the gastric mucosa in the rat: J.Dent.Res., 41, 667-674.
Weeks, M.H., Katz, J., Oakley, W.D., Ballou, J.E., George, L.A., Bustad, L.K., Thompson, R.C., 10 Kornberg, H.A. (1956) Further studies on the gastrointestinal absorption of plutonium. Radiat. Res. 4, 339-347.
Werner, E., Roth, P., Hansen, Ch. (1987) Intestinal absorption of metals. In: Age-related Factors in Radionuclide Metabolism and Dosimetry. (G.B. Gerber, H. Métivier, H. Smith, Eds.) Proc. CEC Workshop, Angers, France, 1986. Martinus Nijhoff, Lancaster. pp.27-33. 15 Wesenberg,GB, F Wesenberg, 1983, Effect of cadmium on the immune response in rats: Environmental Research, 31, 413-419.
Widdowson, E.M., Slater, E.J., Harrison, G.E., Stutton, A. (1960) Absorption, excretion and retention of strontium by breast-fed and bottle-fed babies. Lancet 2, 941-944.
Wiseman, G. Absorption from the Intestine. London: Academic Press; 1964. 20 Wrenn, M.D., Durbin, P.W., Howard, B., Lipzstein, J., Rundo, J., Still, E.T., Willis, D.L. (1985) Metabolism of ingested U and Ra. Health Phys. 48, 601-603.
Wrenn, M.D., Singh, N.A., Ruth, H., Rallison, M.I., Burleigh, D.P. (1989) Gastrointestinal absorption of soluble uranium from drinking water by man. Radiat. Prot. Dosim. 26, 119-122.
Yamagata, N., Iwashima, K., Iinuma, T.N., Watari, K. , Nagai, T. (1969) Uptake and retention 25 experiments of radioruthenium in man -I. Health Phys. 16, 159-166.
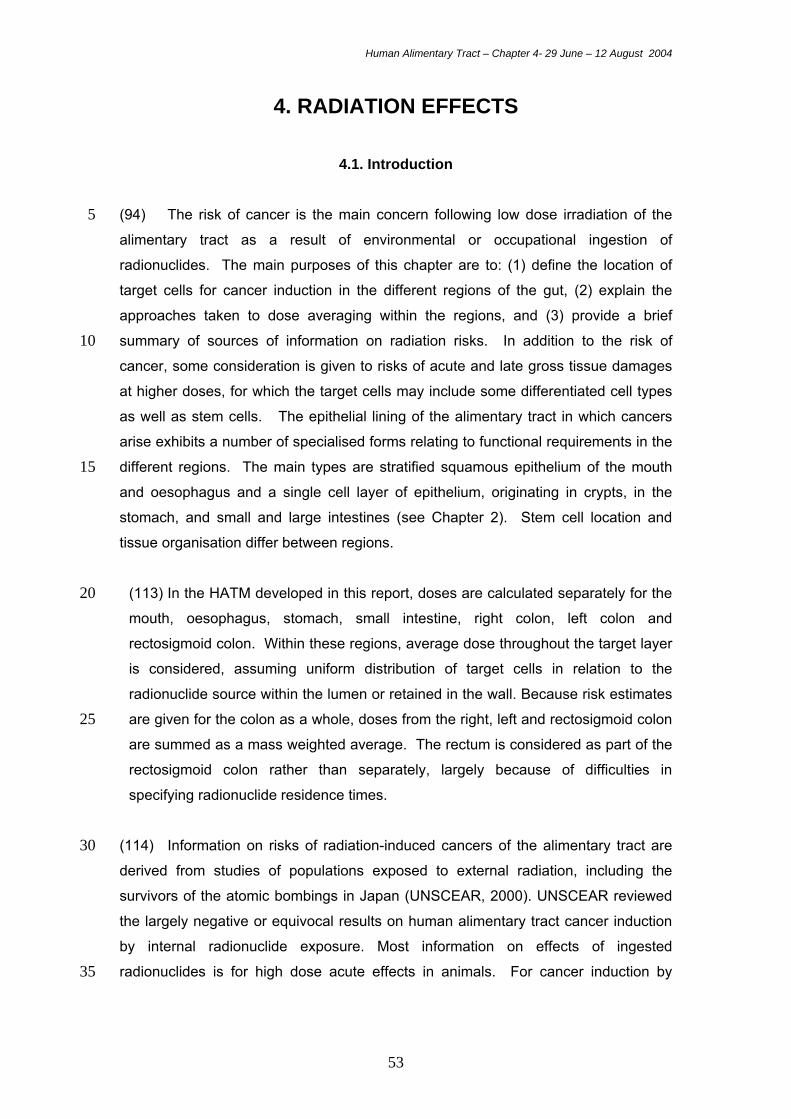
Human Alimentary Tract – Chapter 4- 29 June – 12 August 2004
53
4. RADIATION EFFECTS
4.1. Introduction
(94) The risk of cancer is the main concern following low dose irradiation of the 5 alimentary tract as a result of environmental or occupational ingestion of
radionuclides. The main purposes of this chapter are to: (1) define the location of
target cells for cancer induction in the different regions of the gut, (2) explain the
approaches taken to dose averaging within the regions, and (3) provide a brief
summary of sources of information on radiation risks. In addition to the risk of 10 cancer, some consideration is given to risks of acute and late gross tissue damages
at higher doses, for which the target cells may include some differentiated cell types
as well as stem cells. The epithelial lining of the alimentary tract in which cancers
arise exhibits a number of specialised forms relating to functional requirements in the
different regions. The main types are stratified squamous epithelium of the mouth 15 and oesophagus and a single cell layer of epithelium, originating in crypts, in the
stomach, and small and large intestines (see Chapter 2). Stem cell location and
tissue organisation differ between regions.
(113) In the HATM developed in this report, doses are calculated separately for the 20 mouth, oesophagus, stomach, small intestine, right colon, left colon and
rectosigmoid colon. Within these regions, average dose throughout the target layer
is considered, assuming uniform distribution of target cells in relation to the
radionuclide source within the lumen or retained in the wall. Because risk estimates
are given for the colon as a whole, doses from the right, left and rectosigmoid colon 25 are summed as a mass weighted average. The rectum is considered as part of the
rectosigmoid colon rather than separately, largely because of difficulties in
specifying radionuclide residence times.
(114) Information on risks of radiation-induced cancers of the alimentary tract are 30 derived from studies of populations exposed to external radiation, including the
survivors of the atomic bombings in Japan (UNSCEAR, 2000). UNSCEAR reviewed
the largely negative or equivocal results on human alimentary tract cancer induction
by internal radionuclide exposure. Most information on effects of ingested
radionuclides is for high dose acute effects in animals. For cancer induction by 35
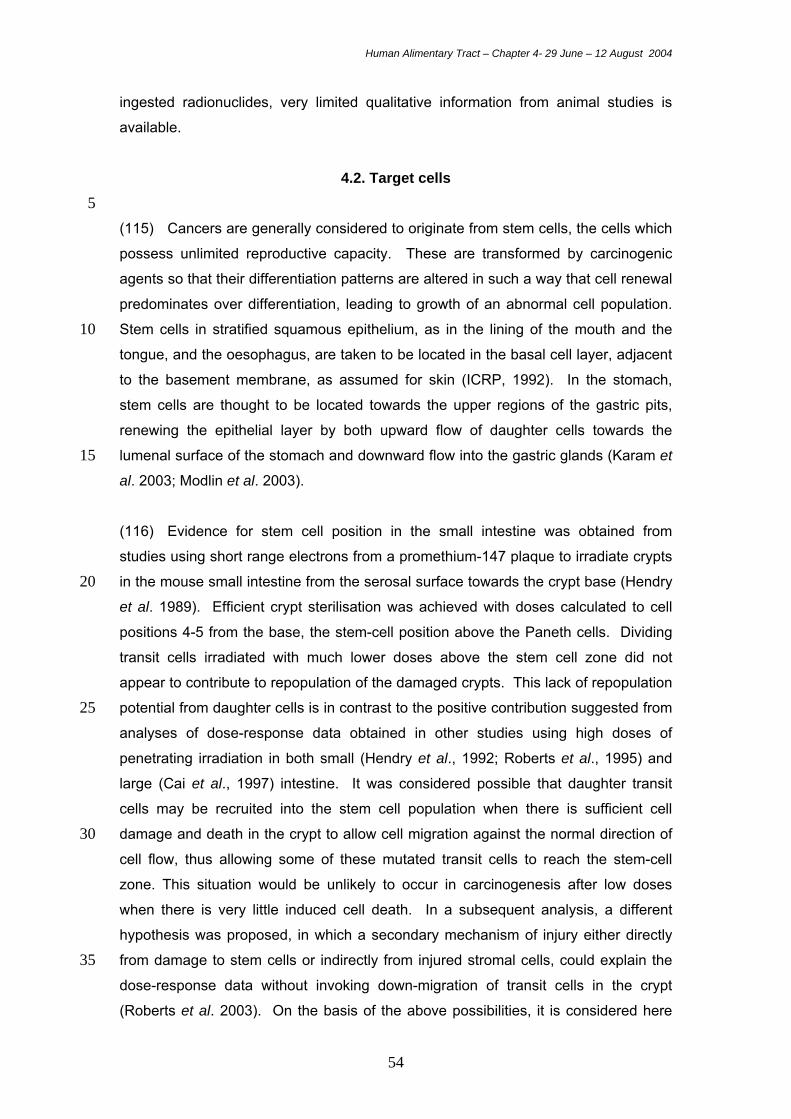
Human Alimentary Tract – Chapter 4- 29 June – 12 August 2004
54
ingested radionuclides, very limited qualitative information from animal studies is
available.
4.2. Target cells 5 (115) Cancers are generally considered to originate from stem cells, the cells which
possess unlimited reproductive capacity. These are transformed by carcinogenic
agents so that their differentiation patterns are altered in such a way that cell renewal
predominates over differentiation, leading to growth of an abnormal cell population.
Stem cells in stratified squamous epithelium, as in the lining of the mouth and the 10 tongue, and the oesophagus, are taken to be located in the basal cell layer, adjacent
to the basement membrane, as assumed for skin (ICRP, 1992). In the stomach,
stem cells are thought to be located towards the upper regions of the gastric pits,
renewing the epithelial layer by both upward flow of daughter cells towards the
lumenal surface of the stomach and downward flow into the gastric glands (Karam et 15 al. 2003; Modlin et al. 2003).
(116) Evidence for stem cell position in the small intestine was obtained from
studies using short range electrons from a promethium-147 plaque to irradiate crypts
in the mouse small intestine from the serosal surface towards the crypt base (Hendry 20 et al. 1989). Efficient crypt sterilisation was achieved with doses calculated to cell
positions 4-5 from the base, the stem-cell position above the Paneth cells. Dividing
transit cells irradiated with much lower doses above the stem cell zone did not
appear to contribute to repopulation of the damaged crypts. This lack of repopulation
potential from daughter cells is in contrast to the positive contribution suggested from 25 analyses of dose-response data obtained in other studies using high doses of
penetrating irradiation in both small (Hendry et al., 1992; Roberts et al., 1995) and
large (Cai et al., 1997) intestine. It was considered possible that daughter transit
cells may be recruited into the stem cell population when there is sufficient cell
damage and death in the crypt to allow cell migration against the normal direction of 30 cell flow, thus allowing some of these mutated transit cells to reach the stem-cell
zone. This situation would be unlikely to occur in carcinogenesis after low doses
when there is very little induced cell death. In a subsequent analysis, a different
hypothesis was proposed, in which a secondary mechanism of injury either directly
from damage to stem cells or indirectly from injured stromal cells, could explain the 35 dose-response data without invoking down-migration of transit cells in the crypt
(Roberts et al. 2003). On the basis of the above possibilities, it is considered here
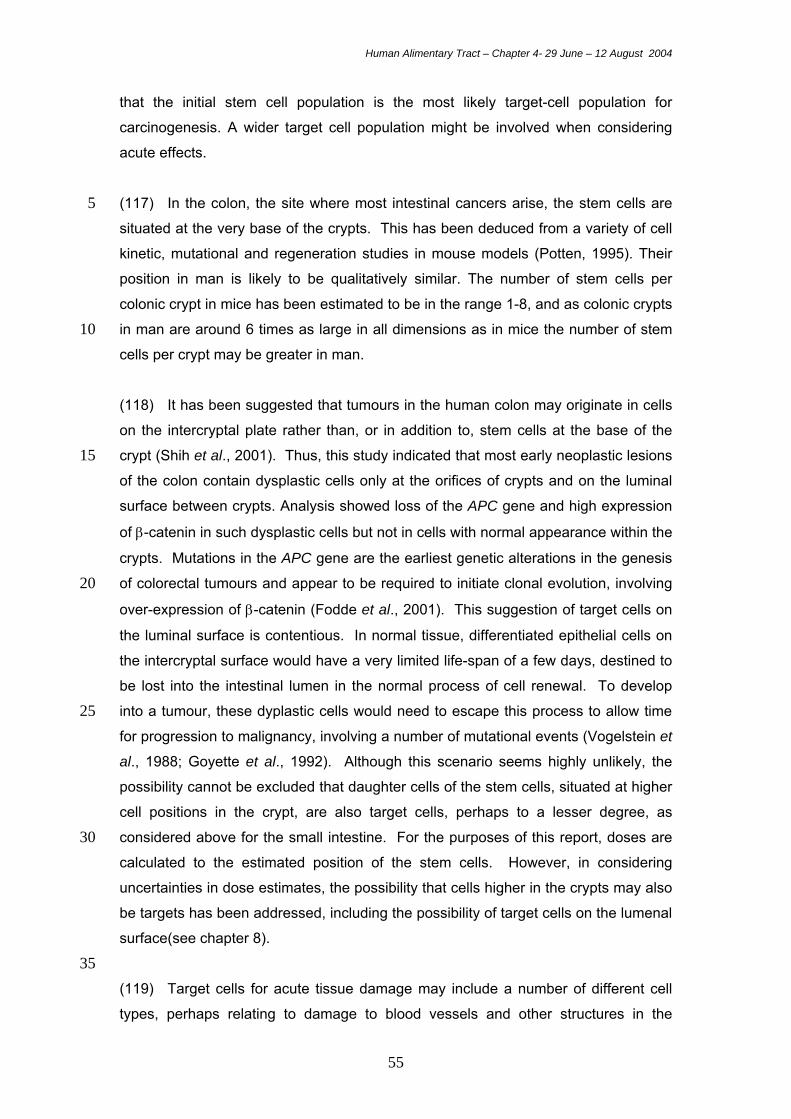
Human Alimentary Tract – Chapter 4- 29 June – 12 August 2004
55
that the initial stem cell population is the most likely target-cell population for
carcinogenesis. A wider target cell population might be involved when considering
acute effects.
(117) In the colon, the site where most intestinal cancers arise, the stem cells are 5 situated at the very base of the crypts. This has been deduced from a variety of cell
kinetic, mutational and regeneration studies in mouse models (Potten, 1995). Their
position in man is likely to be qualitatively similar. The number of stem cells per
colonic crypt in mice has been estimated to be in the range 1-8, and as colonic crypts
in man are around 6 times as large in all dimensions as in mice the number of stem 10 cells per crypt may be greater in man.
(118) It has been suggested that tumours in the human colon may originate in cells
on the intercryptal plate rather than, or in addition to, stem cells at the base of the
crypt (Shih et al., 2001). Thus, this study indicated that most early neoplastic lesions 15 of the colon contain dysplastic cells only at the orifices of crypts and on the luminal
surface between crypts. Analysis showed loss of the APC gene and high expression
of β-catenin in such dysplastic cells but not in cells with normal appearance within the
crypts. Mutations in the APC gene are the earliest genetic alterations in the genesis
of colorectal tumours and appear to be required to initiate clonal evolution, involving 20
over-expression of β-catenin (Fodde et al., 2001). This suggestion of target cells on
the luminal surface is contentious. In normal tissue, differentiated epithelial cells on
the intercryptal surface would have a very limited life-span of a few days, destined to
be lost into the intestinal lumen in the normal process of cell renewal. To develop
into a tumour, these dyplastic cells would need to escape this process to allow time 25 for progression to malignancy, involving a number of mutational events (Vogelstein et
al., 1988; Goyette et al., 1992). Although this scenario seems highly unlikely, the
possibility cannot be excluded that daughter cells of the stem cells, situated at higher
cell positions in the crypt, are also target cells, perhaps to a lesser degree, as
considered above for the small intestine. For the purposes of this report, doses are 30 calculated to the estimated position of the stem cells. However, in considering
uncertainties in dose estimates, the possibility that cells higher in the crypts may also
be targets has been addressed, including the possibility of target cells on the lumenal
surface(see chapter 8).
35 (119) Target cells for acute tissue damage may include a number of different cell
types, perhaps relating to damage to blood vessels and other structures in the
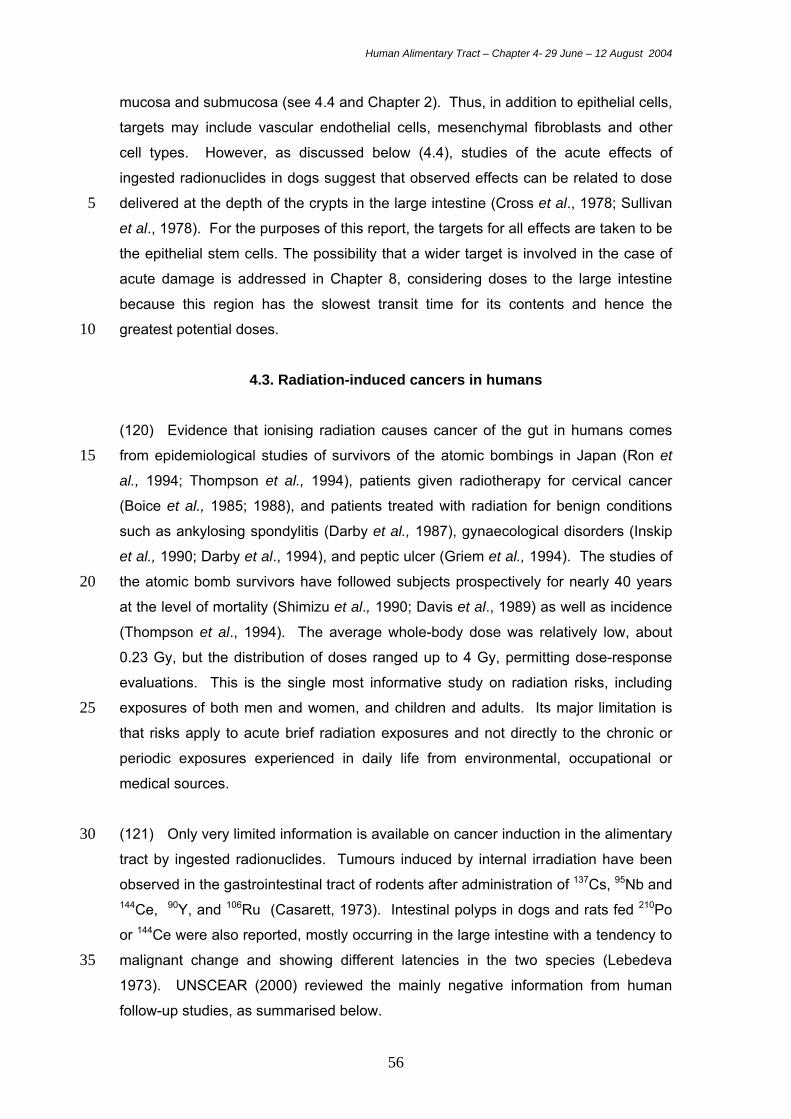
Human Alimentary Tract – Chapter 4- 29 June – 12 August 2004
56
mucosa and submucosa (see 4.4 and Chapter 2). Thus, in addition to epithelial cells,
targets may include vascular endothelial cells, mesenchymal fibroblasts and other
cell types. However, as discussed below (4.4), studies of the acute effects of
ingested radionuclides in dogs suggest that observed effects can be related to dose
delivered at the depth of the crypts in the large intestine (Cross et al., 1978; Sullivan 5 et al., 1978). For the purposes of this report, the targets for all effects are taken to be
the epithelial stem cells. The possibility that a wider target is involved in the case of
acute damage is addressed in Chapter 8, considering doses to the large intestine
because this region has the slowest transit time for its contents and hence the
greatest potential doses. 10
4.3. Radiation-induced cancers in humans (120) Evidence that ionising radiation causes cancer of the gut in humans comes
from epidemiological studies of survivors of the atomic bombings in Japan (Ron et 15 al., 1994; Thompson et al., 1994), patients given radiotherapy for cervical cancer
(Boice et al., 1985; 1988), and patients treated with radiation for benign conditions
such as ankylosing spondylitis (Darby et al., 1987), gynaecological disorders (Inskip
et al., 1990; Darby et al., 1994), and peptic ulcer (Griem et al., 1994). The studies of
the atomic bomb survivors have followed subjects prospectively for nearly 40 years 20 at the level of mortality (Shimizu et al., 1990; Davis et al., 1989) as well as incidence
(Thompson et al., 1994). The average whole-body dose was relatively low, about
0.23 Gy, but the distribution of doses ranged up to 4 Gy, permitting dose-response
evaluations. This is the single most informative study on radiation risks, including
exposures of both men and women, and children and adults. Its major limitation is 25 that risks apply to acute brief radiation exposures and not directly to the chronic or
periodic exposures experienced in daily life from environmental, occupational or
medical sources.
(121) Only very limited information is available on cancer induction in the alimentary 30 tract by ingested radionuclides. Tumours induced by internal irradiation have been
observed in the gastrointestinal tract of rodents after administration of 137Cs, 95Nb and 144Ce, 90Y, and 106Ru (Casarett, 1973). Intestinal polyps in dogs and rats fed 210Po
or 144Ce were also reported, mostly occurring in the large intestine with a tendency to
malignant change and showing different latencies in the two species (Lebedeva 35 1973). UNSCEAR (2000) reviewed the mainly negative information from human
follow-up studies, as summarised below.
Human Alimentary Tract – Chapter 4- 29 June – 12 August 2004
57
Mouth (122) The oral cavity is not among the cancer sites for which the studies of the
atomic bomb survivors have provided evidence of radiation sensitivity. The primary 5 sites of most spontaneously arising tumours in western countries are the lips and
tongue, although cancers of the buccal mucosa, floor of the mouth and tonsils are
also seen (del Ragato et al., 1985). More than 90% of oral cavity tumours are
squamous cell carcinoma.
10 Oesophagus (123) Only one of the four population studies evaluating radiation-induced
oesophageal cancer reported a significant excess. Studies of cervical cancer
patients and Massachusetts tuberculosis patients were negative. The A-bomb series 15 found modest increases that were not significant. Ankylosing spondylitis patients
received the highest estimated dose, 4 Gy, and were at a significantly increased risk
of mortality in comparison with the general population. The relative risk at 1 Gy was
estimated as 1.3 (Darby et al., 1987) and absolute risk as 0.21 per 104 PY Gy-1.
20 (124) Information on the distribution of cancers arising in the oesophagus suggests
that the greatest proportions are seen in the distal region. However, ingested
radionuclides have been assumed to deliver dose uniformly during their transit
through the oesophagus. Dose has been averaged for the oesophagus assuming
uniform distribution of target cells throughout the basal layer of the stratified 25 squamous epithelium.
Stomach (125) Stomach cancer has accounted for 16% of the total excess cancer 30 attributable to radiation in the atomic bomb survivors (Thompson et al., 1994).
Significant excess has occurred in 2 other series, cervical cancer patients and peptic
ulcer patients. The relative risk of fatal stomach cancer at 1 Gy was estimated from
the A-bomb studies as 1.2 and absolute risk as 2 per 104 PY Gy-1. UNSCEAR (2000)
reviewed data for stomach cancer in patients treated with 131I for hyperthyroidism. A 35 significant excess in terms of incidence and mortality was reported in a Swedish
study, with risks consistent with the estimate from the A-bomb study. However,
Human Alimentary Tract – Chapter 4- 29 June – 12 August 2004
58
UNSCEAR (2000) cautioned that because of the small numbers of stomach cancers
and uncertainties in the risk estimate for 131I exposure, it was not possible to draw
conclusions about the relative effect of acute external and protracted internal
radiation exposures.
5 (126) Stomach cancer has been shown to be significantly increased in radon
exposed cohorts of underground miners (Darby et al. 1995). However, there was no
trend in stomach cancer mortality with the low levels of cumulative radon exposure to
the stomach, and excesses of stomach cancer have been reported for other groups
of miners, suggesting that factors other than radon exposure were responsible in 10 each case. Female radium dial painters starting work after 1930 showed an increase
in stomach cancer mortality (Stebbings et al., 1984), but those starting work before
1930, with generally higher radium exposure, did not show an increased risk. These
data do not provide convincing evidence of stomach cancer induction by alpha-
emitting radionuclides. 15
(127) In general, large regional differences in dose between different parts of the
stomach would not be expected and it is reasonable to calculate average dose. The
target is taken to be the stem cell zone, treated as a continuous uniform layer in the
stomach wall (see Chapter 7). 20
Small intestine (128) The very low incidence of naturally occurring tumours and the low
susceptibility for induction of cancer of the small intestine by radiation in both humans 25 and experimental animals remain unexplained, although hypotheses based on
apoptosis which deletes mutated stem cells have been proposed (Potten et al.,
1992). These suggest that radiation-induced TP53-dependent apoptosis in the stem
cell zone in the small intestine prevents the propagation of mutated dividing
progenitor cells. This is consistent with the increased frequency of cancer in Tp53-30 null mice compared to wild-type mice. In the large intestine, Tp53 is not expressed in
the stem cell zone, and bcl-2 expression promotes cell survival and allows the
development of mutated progenitor cells (Merritt et al., 1995).
(129) Dose to the small intestine has been calculated as an average throughout the 35 length of the tube on the assumption of a constant uniform rate of transit. The target
Human Alimentary Tract – Chapter 4- 29 June – 12 August 2004
59
layer is taken to be a continuous uniform layer corresponding to the stem cell zone
(see chapter 7).
Large intestine 5 (130) Colon cancer has occurred in excess in most irradiated populations with the
notable exception of cervical cancer patients (Thompson et al., 1994). Conceivably,
at the cytotoxic doses used to treat cancer of the uterine cervix, cell killing prevented
significant cell transformation (Boice et al., 1987). Estimates of relative risk (RR) at 1
Gy ranged from 1.13 to 1.67 and the absolute risk per l04 PY-Gy from 0.45 to 2.18. 10 The only evidence that cancer of the rectum can be induced by radiation comes from
the study of cervical cancer patients where the doses were very high, ranging
between 30 to 60 Gy. It is possible that gross tissue damage is a necessary
precursor to the initiation of rectal cancer, as appears to be the case for some other
types of cancer, such as bone tumours (Gössner, 2003). 15
(131) Concerning internal exposures to low LET (131I) and high LET radiation (radon
and radium), UNSCEAR (2000) noted that the low doses to the colon do not allow
conclusions to be drawn.
20 (132) Data on 957 colon cancer cases recorded to date in the 80,000 bomb
survivors included in the study have been used to comment on the possibility of
regional differences in risk (Preston, 2003). The point estimates tended to vary
between regions. The sex-averaged ERR/Sv estimates were 0.65 (all regions), 0.16
(ascending colon), 1.4 (transverse colon), 0.67 (descending colon), and 0.78 25 (overlapping regions or not specified). However, these differences were not
significant (p=0.25). Hence, a constant risk is assumed for different regions of the
colon.
(133) Differences in clinical presentation and surgical management of right and left 30 sided colon cancer are well established and recent studies have shown differences at
the cytogenetic and molecular level (Richman and Adlard, 2002). Such differences
may reflect different embryonic origins. Thus, the ascending colon and proximal two-
thirds of the transverse colon, together with the small intestine, develop from the
midgut. The distal third of the transverse colon, the descending colon, the 35 rectosigmoid colon, rectum and upper two-thirds of the anal canal develop from the
hindgut.
Human Alimentary Tract – Chapter 4- 29 June – 12 August 2004
60
(134) Data on the colon, particularly transit data (see Chapter 6), are often reported
in terms of the right colon, left colon, and rectosigmoid. The right colon in this case is
the ascending colon plus the proximal half of the transverse colon; the left colon is
the distal half of the transverse colon plus the descending colon. These divisions are 5 used in this report. In addition, the last part of the colon, the rectosigmoid colon, is
taken to include the rectum, largely because of difficulties in specifying radionuclide
residence times separately for the rectum. Doses have been calculated separately
for each of the three regions and then summed to give an overall colon dose,
calculated as a mass weighted mean. For each region, dose has been calculated as 10 an average throughout the length of the tube on the assumption of a constant
uniform rate of transit. The target layer is taken to be a continuous uniform layer
corresponding to the stem cell zone. Uncertainties associated with the assumptions
made are considered in Annex E.
15 4.4. Tissue damage
(135) The early effects of high doses of radiation, involving gross cell killing in
haemopoietic, intestinal or nervous tissue, are collectively referred to as the “acute
radiation syndromes” and have been extensively reviewed (Bond et al., 1965; Young, 20 1987; UNSCEAR, 1988). Haemopoietic stem cells are more sensitive to radiation
than intestinal stem cells but because of the more rapid cell division and renewal in
the small intestine, sufficiently high doses (10 – 20 Gy) can cause death within 1 – 2
weeks due to breakdown of the intestinal epithelium. This destruction of the mucosal
lining of the intestine results in fluid, protein and electrolyte loss, infection and 25 haemorrhage. Survival depends on the presence of a sufficient number of stem cells
to repopulate the epithelium. As discussed above (4.1), it is possible that immediate
daughter cells of stem cells may retain the potential to re-establish epithelial integrity.
Delayed effects, involving other cell types including vascular endothelial cells and
mesenchymal fibroblasts, may be seen in the small and large intestines and in other 30 regions of the alimentary tract. Damage includes damage to blood vessels, such as
endarteritis and fibrosis, excess collagen deposition in the submucosa and strictures.
(136) Dose-effect relationships for intestinal damage have been obtained from
animal data; this is considered reasonable because different mammals respond in a 35 similar way to irradiation of the gut (Bond et al., 1965; Maisin et al., 1971). Damage
to the intestinal mucosa has been shown to occur at doses > 1 Gy and be
Human Alimentary Tract – Chapter 4- 29 June – 12 August 2004
61
increasingly severe at doses of 5 – 10 Gy. Data obtained from studies in which the
alimentary tract of rats was exposed to X-irradiation, either in situ or surgically
exteriorised, indicated an LD50 (death of 50% of animals) of about 15 Gy for acute
exposure (Sullivan et al., 1959). Values of LD50 of about 33 Gy for rats (25 - 41 Gy)
and 40 Gy for dogs (20 - 52 Gy) were obtained in experiments in which rats ingested 5 either 106Ru/106Rh (average 1.4 MeV beta) or 147Pm (average 0.06 MeV beta) and
dogs were given 106Ru/106Rh (Sullivan et al., 1978; Cross et al., 1978). The estimated
dose to crypt cells in rats was the same for both 106Ru/106Rh and 147Pm, about 35 Gy,
although the dose to the mucosal surface was about 35 times greater for 147Pm than
for 106Ru/106Rh. This dose is comparable to a dose of about 13 Gy of external 10 irradiation delivered acutely and is consistent with an expected reduction in effect at
lower dose rate. Death was due to damage to the large intestine in both rats and
dogs. Based on these data, an LD50 of 35 Gy has been suggested, with a simple
linear function with a LD0 of 20 Gy and an LD100 of 50 Gy (Pochin, 1988).
15 (137) Comparisons of the toxicity of 106Ru/106Rh in rats of different ages, in terms of
administered activity, showed sensitivity in the order: newborn > adults > weanlings
(Sullivan et al., 1987). The reason for the sensitivity of the newborn is the uptake
and retention of radionuclides in the mucosal cells of the intestine, particularly the
proximal small intestine. This non-specific uptake of radionuclides, discussed in 20 Chapter 3, occurs to a decreasing extent over the suckling period and distinct
species differences have been observed. It would appear that at the high levels of
retention observed in rats, doses of up to 100 Gy d-1 may be received by cells
towards the tips of the villi without evidence of mucosal injury (Sullivan et al., 1987).
The greater sensitivity of adults than weanlings to the effect of 106Ru/106Rh was 25 probably a reflection of greater transit times in the adult.
(138) There are few reports of acute injury to the intestinal mucosa of humans
following radionuclide ingestion. Notably, extensive internal contamination with 137CsCl (>3.1 MBq) occurred in 22 persons in the Goiania accident in Brazil (IAEA, 30 1987). Eight individuals developed acute radiation syndrome, including symptoms
such as nausea, vomiting, and watery diarrhoea during the prodromal phase. Doses
received by these individuals were estimated using cytogenetic dosimetry to range
between 3 and 7 Gy, accumulated over a period of 2 weeks. In 4 persons who
received doses estimated between 4 and 6 Gy and who died of radiation injuries, 35 intestinal bleeding was found at autopsy (IAEA, 1987; Brandao-Mello et al., 1991).
Human Alimentary Tract – Chapter 4- 29 June – 12 August 2004
62
4.5. References
Boice, J.D.Jr., Blettner, M., Kleinerman, R.A. et al. (1987). Radiation dose and leukemia risk in patients treated for cancer of the cervix. J. Natl. Cancer Inst. 79, 5 1295-1311. Boice, J.D., Day, N.E., Andersen, A. et al. (1985). Second cancers following radiation treatment for cervical cancer. An international collaboration among cancer registries. J. Natl. Cancer Inst. 74, 955-975. 10 Boice, J.D.Jr., Engholm, G., Kleinennan, R.A. et al. (1988). Radiation dose and second cancer risk in patients treated for cancer of the cervix. Radiat. Res. 116, 3-55. 15 Bond, V.P., Fliedner, T.M. and Archambeau, J.O. (1965). Mammalian radiation lethality: a disturbance in cellular kinetics. Academic Press, New York. Brandao-Mello, C.E., Oliverira, A.R., Valverde, N.J., Farina, R., Cordeiro, J.M. (1991). Clinical and haematological aspects of 137Cs: the Goiania radiation accident. 20 Health Physics, 60, 31-39. Cai, W.B. Roberts, S. A. Bowley, E., Hendry, J.H., Potten, C. S. (1997). Differential survival of murine small and large intestinal crypts following ionising radiation. Int. J. Radiat. Biol. 71. 145-55. 25 Casarett, G.W. (1973) Pathogenesis of radionuclide-induced tumors. In: C.L. Sanders, R.H. Busch, J.E. Ballou and D.D. Mahlum (Eds.), Radionuclide Carcinogenesis. NTIS, Springfield. pp.1-14. 30 Cross, F.T., Endres, G.W.R. and Sullivan, M.F. (1978). Dose to the GI tract from ingested insoluble beta emitters. Radiat. Res. 73, 37-50. Darby, S.C., Doll, R., Gill, S.K. et al. (1987). Long-term mortality after a single treatment course with X-rays in patients treated for ankylosing spondylitis. Br. J. 35 Cancer 55, 179-190 Darby, S.C., Reeves, U., Key, T., Doll, R. and Stovall, M. (1994). Mortality in a cohort of women given X-ray therapy for metropathia haemorrhagica. Int. J. Cancer 56, 793-801. 40 Darby, S.C., Whitley, G.R. et al. (1995) Radon and cancers other than lung cancer in underground miners: a collaborative analysis of 11 studies. J. Nat. Cancer Inst. 87, 378-384. 45 Davis, F.G., Boice, J.D.Jr., Urubec, Z. et al. (1989). Cancer mortality in a radiation-exposed cohort of Massachusetts tuberculosis patients. Cancer Res. 49, 6130-6136. Del Regato, J.A., Spjut, H.J. and Cox, J.D. (1985) Ackerman and del Regato’s Cancer Diagnosis, Treatment and Prognosis. The C.V. Mosby Co., St. Louis, 50 Missouri.
Human Alimentary Tract – Chapter 4- 29 June – 12 August 2004
63
Fodde, R., Smits, R. and Clevers, H. (2001) APC, signal transduction and genetic instability in colorectal cancer. Nature Reviews 1, 55-67. Gössner, W. (2003) Target cells in internal dosimetry. Radiat. Protect. Dos. 105 (1-4), 39-42. 5 Goyette MC, Cho K, Fasching CL, Levy DB, Kinzler KW, Paraskeva C, Vogelstein B, Stanbridge EJ. Progression of colorectal cancer is associated with multiple tumor suppressor gene defects but inhibition of tumorigenicity is accomplished by correction of any single defect via chromosome transfer. Mol Cell Biol. 1992 10 Mar;12(3):1387-95. Griem, M.L., Kleinerman, R.A., Boice, J.D.Jr. et al. (1994). Cancer following radiotherapy for peptic ulcer. J. Natl. Cancer Inst. 86, 842-849. 15 Hendry, J.H., Potten, C.S., Ghafoor, A., Moore, J.V., Roberts, S.A. and Williams, P.C. (1989). The response of murine intestinal crypts to short-range promethium-147 beta irradiation: deductions concerning clonogenic cell numbers and positions. Radiat. Res. 118(2): 364-74. 20 Hendry, J.H., Roberts, S.A., Potten, C.S. (1992). The clonogenic content of murine intestinal crypts: degendence on radiation dose used in its determination. Radiat. Res. 132. 115-1 19. IAEA (1987). The Radiological Accident in Goiania. International Atomic Energy 25 Agency, PO Box 100, A-1400 Vienna, Austria. ICRP (1992) The biological basis for dose limitation in the skin. ICRP Publication 59. Ann. ICRP 22(2). 30 ICRP (1991). Recommendations of the International Commission on Radiological Protection. ICRP Publication 60, Pergamon Press, Oxford. Inskip, P.D., Monson, R.R., Wagoner, J.K. et al. (1990). Cancer mortality following radium treatment for uterine bleeding. Radiat. Res. 123, 331-334. 35 Lebedeva, G.A. (1973) Intestinal polyps arising under the influence of various kinds of ionising radiations. Vop. Onkol. 19, 47-51. Maisin, J., Maisin, J.R. and Dunjic, A. (1971) The gastrointestinal tract. In: C.C. 40 Berjis, (Eds.) Pathology of Irradiation. William and Wilkins, Baltimore. p.296. Meritt, A. J., Potten, C.S., Watson, A.J., Loh, D.Y., Makayam, K., Hickman, J.A. (1995). Differential expression of bcl-2 in intestinal epithelia. Correlation with attenuation of apoptosis in colonic crypts and the incidence of colonic neoplasia. J. 45 Cell. Sci. 108. 2261-2271 Potten, C.S., (1995). Structure, function and proliferative organisation of mammalian gut. P1-31 in: Radiation and Gut. eds C S Potten and J H Hendry. Elsevier, Amsterdam. 50 Pochin, E.E. (1988) Sizewell B Inquiry. The biological bases of the assumptions made by NRPB in the calculation of health effects. Proof of Evidence. Chilton, NRPB/P/2. 55
Human Alimentary Tract – Chapter 4- 29 June – 12 August 2004
64
Potten, C.S; Li, Y.Q., O'Connor, P.J., and Winton, D,J. (1992) A possible explanation for the differential cancer incidence in the intestine, based on distribution of the cytotoxic effects of carcinogens in the murine large bowel. Carcinogenesis. Dec; 13(12): 2305-12. 5 Richman, S. and Adlard, J. (2002) Left and right sided large bowel cancer. Brit. Med. J. 324, 931-932. Roberts, S.A., Hendry, J.H., Potten, C.S. (1995). The deduction of the clonogen content of intestinal crypts: a direct comparison of fractionated-dose and graded-10 dose methodologies. Radiat. Res. 141. 303.108. Roberts, S.A., Hendry, J.H., Potten, C.S. (2003). Intestinal crypt clonogens: a new interpretation of radiation survival curve shape and clonogenic cell number. Cell Prolif. 36, 215-231. 15 Ron, E., Preston, D.L., Mabuchi, K. et al. (1994). Cancer incidence in atomic bomb survivors. Part IV. Comparison of cancer incidence and mortality. Radiat. Res. 137, S98-S112. 20 Shi, I-M., Wang, T-L., Traverso, G., Romans, K., Hamilton, S.R., Ben-Sasson, S., Kinzler, K.W. and Vogelstein, B. (2001) Top-down morphogenesis of colorectal tumors. Proc. Natl. Acad. Sci. 98, 2640-2645. Shimizu, Y., Kato, H. and Schull, W.J. (1990). Studies of the mortality of A-bomb 25 survivors. Part 9: Mortality, 1950-1985; Part 2: Cancer mortality based on the recently revised doses (DS86). Radiat. Res. 121, 120-141. Stebbings, J.H., Lucas, H.F. and Stehney, A.F. (1984) Mortality from cancers of major sites in female radium dial workers. Amer. J. Ind. Med. 5, 435-459. 30 Sullivan, M.F., Marks, S., Hackett, P.L. and Thompson, R.C. (1959) X-irradiation of the exteriorised or in situ intestine of the rat. Radiat. Res. 73, 11, 653-666. Sullivan, M.F., Ruemmber, P.S., Reamer, J.L. et al. (1978). Acute toxicity of Beta-35 emitting radionuclides that may be released in a reactor accident and ingested. Radiat. Res. 73, 21-36. Sullivan, M.F., Cross, F.T. and Dagle, G.E. (1987) Dosimetry of the gastrointestinal tract. In: G.B. Gerber, H. Métivier and H. Smith (Eds.), Age-related Factors in 40 Radionuclide Metabolism. Martinus Nijhoff, Lancaster. pp.49-66. Thompson, D.E., Mabuchi, K., Ron, E. et al. (1994). Cancer incidence in atomic bomb survivors. Part II. Solid tumors, 1958-1987. Radiat. Res. 137, S17-S67. 45 UNSCEAR (1988) United Nations Scientific Committee on the Effects of Atomic Radiation). Sources, Effects and Risks of Ionizing Radiation. U.N., New York. UNSCEAR (2000) United Nations Scientific Committee on the Effects of Atomic Radiation). Sources and Effects of Ionizing Radiation. U.N., New York. 50 Vogelstein, B.E., Fearon, E.R., Hamilton, S.R., Kerr, S.E., Preisinger, A.C., Lepper, T. M., Nakamura, K., White, R., Smits, A.M.M and Bos, J.L. (1988) Genetic alterations during colorectal-tumor development. N. Eng. J. Med. 319, 525-532. 55
Human Alimentary Tract – Chapter 4- 29 June – 12 August 2004
65
Young, R.W. (1987) Acute radiation syndrome. In: Military Radiobiology. (Eds. J.J. Conklin and R.I. Walker). Academic Press, New York.
Human Alimentary Tract Model - Chapter 5 – 29 June 14 August 2004
67
5. DESCRIPTION OF THE HUMAN ALIMENTARY TRACT MODEL
5.1. Introduction
5 (139) The structure of the HATM is shown in Figure 5.1. The model depicts the following
processes:
• entry of a radionuclide into the oral cavity by ingestion or into the oesophagus after
mechanical clearance from the respiratory tract; sequential transfer through the
contents of the oral cavity, oesophagus, stomach, small intestine, and segments of 10 the colon, followed by emptying in faeces;
• radionuclide deposition and retention on or between the teeth and return to the oral
cavity; deposition and retention in the oral mucosa or walls of the stomach and
intestines;
• transfer from the oral mucosa or walls of the stomach and intestines back into the 15 luminal contents or into blood (absorption);
• and transfer from various secretory organs or blood into the contents of certain
segments of the alimentary tract (secretion).
(140) The organs and fluids represented in Figure 5.1 by dashed boxes are not part of the 20 HATM but are included in the schematic to show connections with the respiratory tract
model or systemic biokinetic models.
(141) First-order kinetics is assumed. This is a considerable simplification of the complex
processes involved in transfer of material through the lumen of the alimentary tract 25 (Chapter 6) but is expected to provide a reasonably accurate representation of the mean
residence time of a radionuclide in each segment of the tract.
(142) For computational purposes, each parameter value of the model is represented by a
transfer coefficient (also called a rate coefficient or rate constant). A transfer coefficient 30 describes the rate of outflow of a substance from a compartment and is defined as the
instantaneous fraction of the contained substance leaving the compartment per unit time.
This is the common approach in biokinetic modelling.
(143) Parameter values of the model include both generic values and element-specific 35
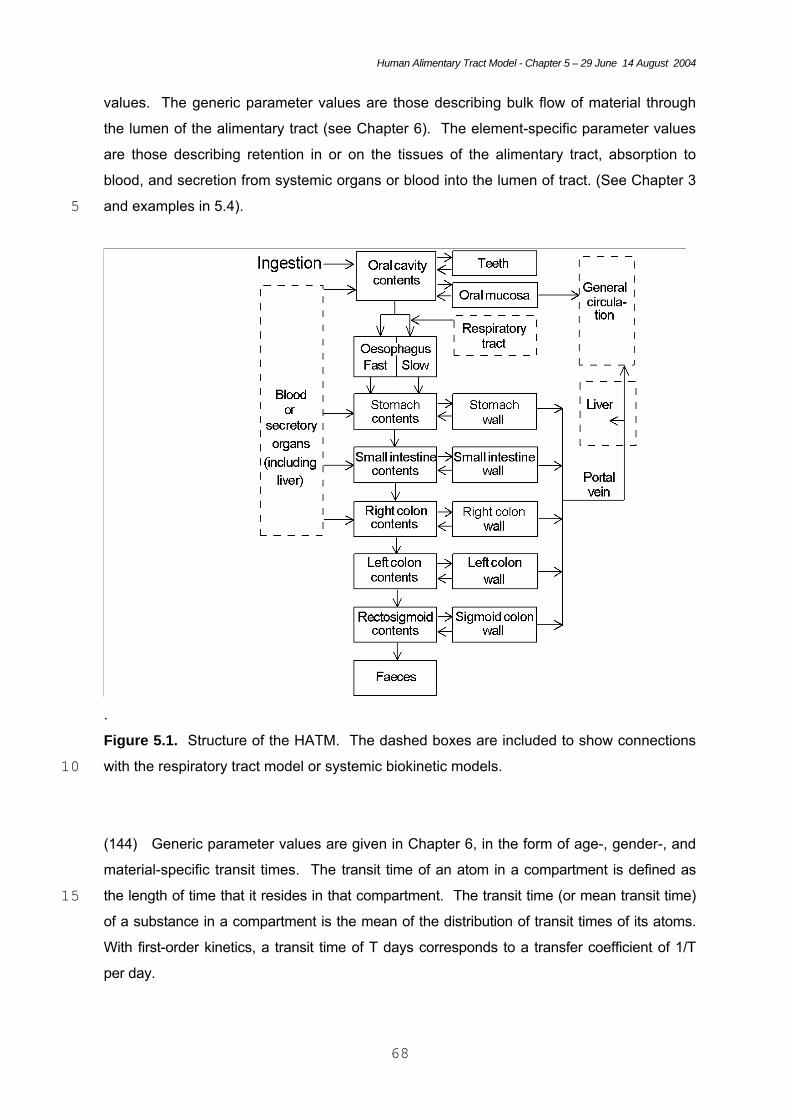
Human Alimentary Tract Model - Chapter 5 – 29 June 14 August 2004
68
values. The generic parameter values are those describing bulk flow of material through
the lumen of the alimentary tract (see Chapter 6). The element-specific parameter values
are those describing retention in or on the tissues of the alimentary tract, absorption to
blood, and secretion from systemic organs or blood into the lumen of tract. (See Chapter 3
and examples in 5.4). 5
.
Figure 5.1. Structure of the HATM. The dashed boxes are included to show connections
with the respiratory tract model or systemic biokinetic models. 10
(144) Generic parameter values are given in Chapter 6, in the form of age-, gender-, and
material-specific transit times. The transit time of an atom in a compartment is defined as
the length of time that it resides in that compartment. The transit time (or mean transit time) 15 of a substance in a compartment is the mean of the distribution of transit times of its atoms.
With first-order kinetics, a transit time of T days corresponds to a transfer coefficient of 1/T
per day.
Human Alimentary Tract Model - Chapter 5 – 29 June 14 August 2004
69
(145) Element-specific parameter values of the HATM are not given in this report except
as examples of applications of the model (see 5.4). Recommendations of element-specific
parameter values will be made in future ICRP reports in which the HATM is applied.
(146) Except where specific information is available to derive an element-specific transfer 5 coefficient, the coefficient is assumed to be zero. As a minimum, information generally is
available to derive non-zero transfer coefficients describing total absorption to blood. As
discussed in section 5.4, in cases in which all absorption is assumed to take place in the
small intestine and there is assumed to be no retention in the wall of the small intestine, the
parameters can be calculated from an assumed absorption fraction in the same way as in 10 the Publication 30 model (ICRP, 1979). For some elements, there is quantitative
information on absorption in segments of the tract other than the small intestine, or
retention or secretion in some segments of the tract (Chapter 3).
5.2. Main differences from the ICRP Publication 30 model 15
(147) The biokinetic model differs from that of the ICRP Publication 30 (1979) model
(Figure 5.2) in the following main ways:
(1) In the previous model, the stomach is the point of entry of a radionuclide into
the alimentary tract. The HAT model includes compartments representing the oral 20 cavity and oesophagus to account for doses received from transit or retention of
activity in the upper regions of the tract.
(2) The previous model divides the large intestine into two regions, the upper large
intestine and the lower large intestine. The HAT model partitions the large
intestine into three regions frequently addressed in colonic transit studies 25 (3) The previous model accounts only for decays of a radionuclide occurring
during its transit through the lumen of the stomach and intestines. The HAT model
includes compartments to account for nuclear transformations due to retention of a
radionuclide in tissues of the alimentary tract in those cases where tissue retention
is indicated by available information. 30 (4) The previous model depicts absorption of a radionuclide as occurring only in
the small intestine. The HAT model includes pathways to account for absorption
from the oral mucosa, stomach, or segments of the colon if specific information is
available.
(5) ) In the previous model, the transit times through the segments of the 35 alimentary tract are independent of age, gender, and the type of material ingested.
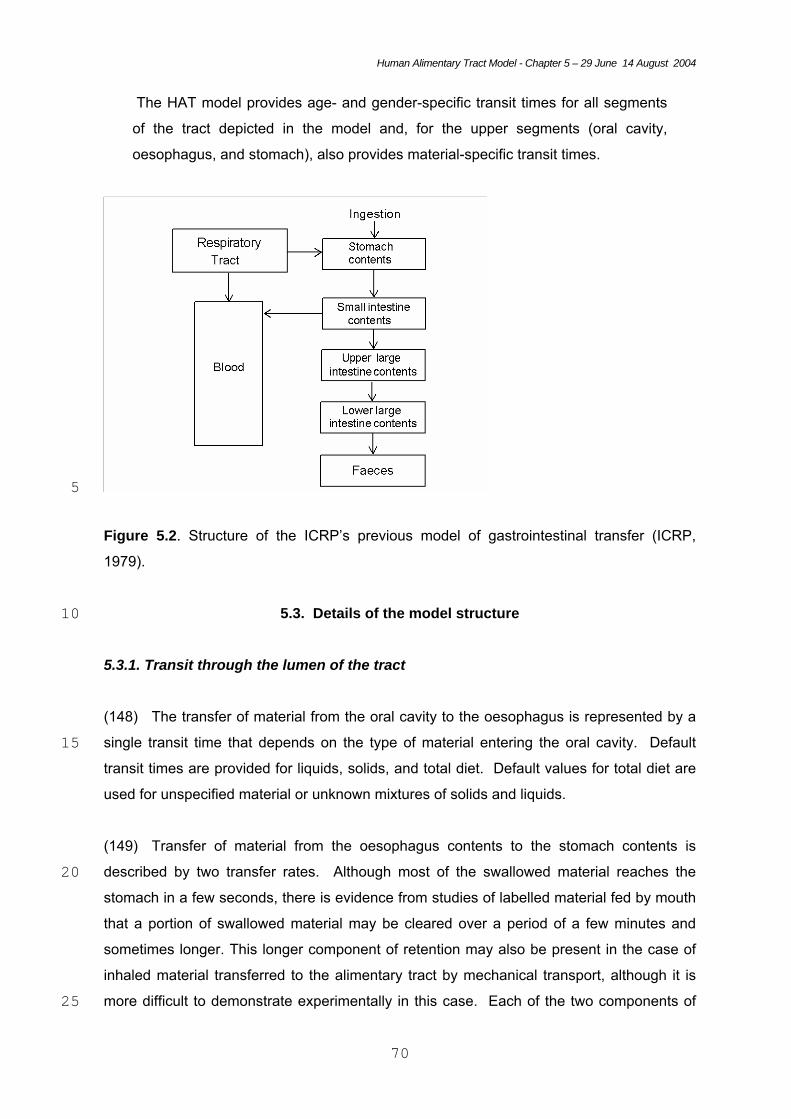
Human Alimentary Tract Model - Chapter 5 – 29 June 14 August 2004
70
The HAT model provides age- and gender-specific transit times for all segments
of the tract depicted in the model and, for the upper segments (oral cavity,
oesophagus, and stomach), also provides material-specific transit times.
5
Figure 5.2. Structure of the ICRP’s previous model of gastrointestinal transfer (ICRP,
1979).
5.3. Details of the model structure 10
5.3.1. Transit through the lumen of the tract
(148) The transfer of material from the oral cavity to the oesophagus is represented by a
single transit time that depends on the type of material entering the oral cavity. Default 15 transit times are provided for liquids, solids, and total diet. Default values for total diet are
used for unspecified material or unknown mixtures of solids and liquids.
(149) Transfer of material from the oesophagus contents to the stomach contents is
described by two transfer rates. Although most of the swallowed material reaches the 20 stomach in a few seconds, there is evidence from studies of labelled material fed by mouth
that a portion of swallowed material may be cleared over a period of a few minutes and
sometimes longer. This longer component of retention may also be present in the case of
inhaled material transferred to the alimentary tract by mechanical transport, although it is
more difficult to demonstrate experimentally in this case. Each of the two components of 25
Human Alimentary Tract Model - Chapter 5 – 29 June 14 August 2004
71
transfer from the oesophagus contents to the stomach contents is represented by a single
transit time that depends on the type of material entering the oesophagus. Default transit
times are provided for liquids, solids, and total diet. Values for total diet are used for
unspecified material or unknown mixtures of liquids and solids. The size and retention time
of the long-term component of retention in the oesophagus are highly variable and, as with 5 other features of this model, may be adjusted in specific applications in which the default
values do not appear to be appropriate.
(150) Transfer of material from the stomach contents to the small intestine contents is
represented by a single transit time that depends on the type of material entering the 10 stomach. Default transit times are provided for water or other non-caloric liquids, caloric
liquids, solids, and total diet. Values for total diet are used for unspecified material or
unknown mixtures of solids and liquid.
(151) After material enters the small intestine, its transit time is assumed to be 15 independent of the type of material that initially entered the alimentary tract. Emptying of
material from the contents of a segment to the contents to the next segment (e.g., small
intestine contents to right colon contents) or from the rectosigmoid in faeces is represented
by a single transit time.
20 (152) The portion of the alimentary tract extending from the caecum to the anus is viewed
as consisting of three regions: right colon, left colon, and rectosigmoid. The right colon is
defined as the caecum, ascending colon, and proximal half of the transverse colon; the left
colon is the distal half of the transverse colon plus the descending colon; and the
rectosigmoid is the sigmoid colon plus the rectum. This division of the large intestine differs 25 from that of previous models of the alimentary tract (ICRP, 1979; NCRP, 1998) but is useful
for purposes of modelling colonic transit. Because this is a standard division for diagnostic
and experimental examinations of colonic transit, considerable information is available on
transit times through each of these three segments. The Task Group concluded that the
division of the large intestine into right colon, left colon, and rectosigmoid allows best 30 estimates of the time-dependent distribution of ingested, inhaled, or secreted activity in the
colon, based on current information (see also Chapter 6).
(153) Although the rectum serves mainly as a conduit, it also serves as a storage organ
when the amount of material entering from the sigmoid colon is too small to evoke the urge to 35 defecate or if defecation is not convenient. In the latter case, the receptors in the rectum
Human Alimentary Tract Model - Chapter 5 – 29 June 14 August 2004
72
respond to the distension stimulus, the urge to defecate may subside, and a relatively large
mass of material may be stored for some time. Due to difficulties in determining a meaningful
residence time for material in the rectum, the rectum is not considered as a separate
compartment.
5 5.3.2. Retention in or on tissues of the alimentary tract
(154) Provision is made in the model to address retention of radionuclides on the teeth or
in tissues of the alimentary tract after transfer from the lumen of the tract. This is to be
distinguished from systemic activity that is transferred from blood into tissues of the 10 alimentary tract, which is not addressed in the HATM but may be included in systemic
biokinetic models used in conjunction with the HATM.
(155) There is evidence of retention of some elements on the teeth after ingestion (see
Chapter 3). This is depicted as a transfer from the contents of the oral cavity to the surface 15 of the teeth and return from the teeth to the oral cavity.
(156) Provision is made to address transfer from the oral cavity contents into the oral
mucosa, from stomach contents into the stomach wall, from small intestine contents into
the small intestine wall, or from the contents of any segment of the colon into the wall of the 20 corresponding segment. Activity entering the oral mucosa leaves this compartment with a
half-time estimated from element-specific information. Activity leaving the oral mucosa may
be assigned to the oral cavity or may be assigned partly or wholly to blood to represent
direct absorption from the oral mucosa. Similarly, activity leaving the wall of the stomach,
small intestine, or any segment of the colon with an element- and segment-specific half-25 time may be divided between the luminal contents of the corresponding segment and
absorbed activity; in this case, absorbed activity is assigned to the portal vein and is
available for uptake by the liver before entering the general circulation.
5.3.3. Absorption to blood 30
(157) While absorption occurs predominantly in the small intestine, provision is made for
absorption in the oral cavity, stomach, or any segment of the colon. It is known, for example,
that absorption from the stomach can occur for highly lipid-soluble substances such as
alcohol and some weak acids, and that substances administered as suppositories can be 35 absorbed from the colon after movement of contents from the rectum into the sigmoid colon.
Human Alimentary Tract Model - Chapter 5 – 29 June 14 August 2004
73
Other examples of absorption from different regions of the alimentary tract are given in
Chapter 3.
(158) Absorption from the oral cavity is depicted as transfer from the oral cavity contents to
the oral mucosa and direct transfer from the oral mucosa to blood. Absorption from any other 5 segment of the alimentary tract is depicted as transfer from the contents to the wall of that
segment, followed by transfer to blood in the portal vein with the potential for direct uptake by
the liver prior to entry into the general circulation. This reflects the fact that blood flowing
through the capillary beds of the stomach and intestines merge in the portal vein and is then
circulated through the liver before entering the general circulation (see Chapter 2). Blood 10 also reaches the liver from the general circulation via the hepatic artery, and all blood leaves
the liver via the hepatic vein. In general, information is not available to determine whether
there is significant accumulation of radionuclides in the liver during their passage to the
general circulation. Because the liver is also the main route of excretion of radionuclides to
the alimentary tract, there is the possibility of absorbed material passing directly back to the 15 intestine without entering the general circulation.
(159) Absorption from a given region to blood may be assumed to occur after an extremely
brief residence (in effect, instantaneously), or after a more prolonged residence time in the
tissues of that region. For most elements and their radioisotopes, information is not available 20 on retention in the walls of the alimentary tract or direct uptake of absorbed activity by the
liver. In such cases, absorption to blood may be depicted as rapid transfer through these
compartments into the general circulation.
(160) The model does not account for slow transfer from the alimentary tract to blood via the 25 lymphatic system. In most cases, this is not expected to comprise a significant proportion of
total absorption to blood. While there is evidence that particles may be transported through
the mesenteric lymphatic system, only transitory retention in mesenteric lymph nodes has
been observed.
30 (161) In the planned ICRP reports which will recommend the use of the HATM for a range
of elements, information for each element will be given in terms of the alimentrary tract
transfer factor, fA which replaces the f1 value of the Publication 30 model (ICRP, 1979) and
distinguishes the uses of the new and old models. Some examples of fA are given in Table
5.1. In the majority of cases, information will only be available on the total absorption of the 35 element and its radioisotopes to blood with no information on regional absorption. As in the
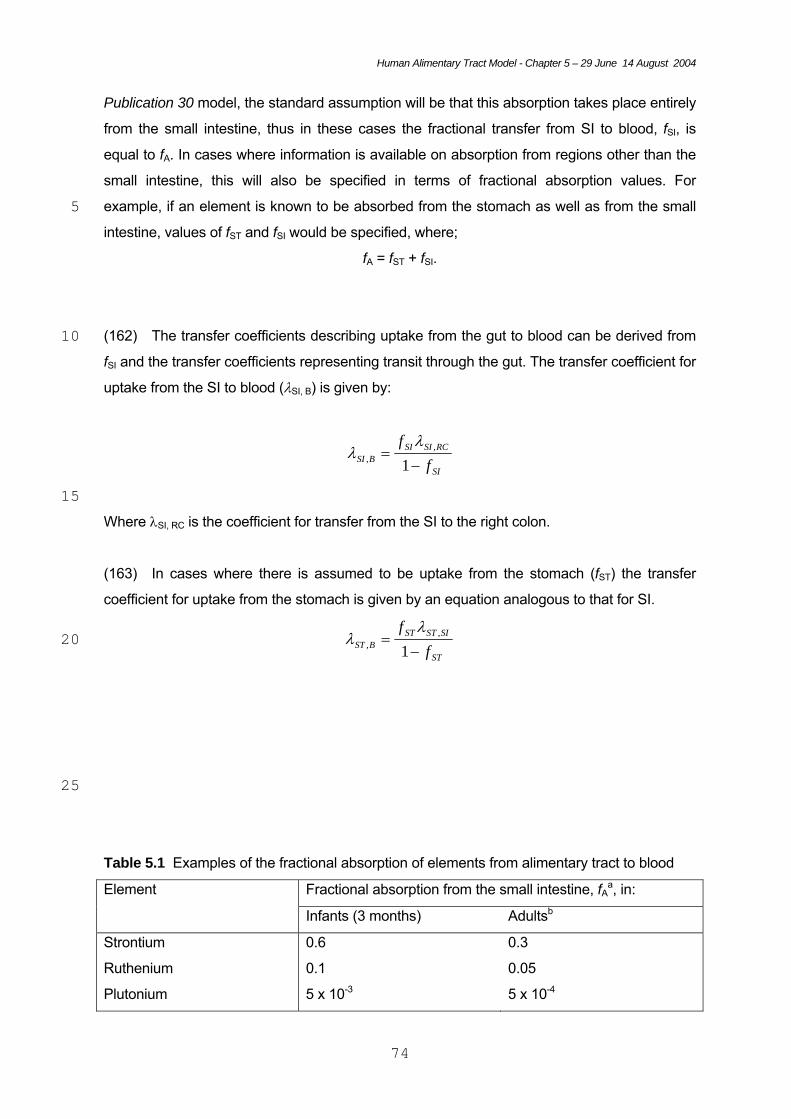
Human Alimentary Tract Model - Chapter 5 – 29 June 14 August 2004
74
Publication 30 model, the standard assumption will be that this absorption takes place entirely
from the small intestine, thus in these cases the fractional transfer from SI to blood, fSI, is
equal to fA. In cases where information is available on absorption from regions other than the
small intestine, this will also be specified in terms of fractional absorption values. For
example, if an element is known to be absorbed from the stomach as well as from the small 5 intestine, values of fST and fSI would be specified, where;
fA = fST + fSI.
(162) The transfer coefficients describing uptake from the gut to blood can be derived from 10 fSI and the transfer coefficients representing transit through the gut. The transfer coefficient for
uptake from the SI to blood (λSI, B) is given by:
SI
RCSISIBSI f
f−
=1
,,
λλ
15 Where λSI, RC is the coefficient for transfer from the SI to the right colon.
(163) In cases where there is assumed to be uptake from the stomach (fST) the transfer
coefficient for uptake from the stomach is given by an equation analogous to that for SI.
ST
SISTSTBST f
f−
=1
,,
λλ 20
25
Table 5.1 Examples of the fractional absorption of elements from alimentary tract to blood
Fractional absorption from the small intestine, fAa, in: Element
Infants (3 months) Adultsb
Strontium 0.6 0.3
Ruthenium 0.1 0.05
Plutonium 5 x 10⁻³ 5 x 10⁻⁴
Human Alimentary Tract Model - Chapter 5 – 29 June 14 August 2004
75
afSI denotes absorption from the small intestine and in these examples and most cases will
equal fA, the total absorption. Values of fA will be given in forthcoming ICRP publications. In
those cases where absorption from other regions is also specified, additional fractional
absorption values (eg. fST) will also be given, together with values of fSI and fA. 5 bMembers of the public.
5.3.4. Secretion into the luminal contents
(164) Secretions into the alimentary tract originate mainly in the liver, salivary glands, the 10 epithelial cells of the gastrointestinal mucosa, and the pancreas. In this model, secretions
may be assigned to the contents of the oral cavity, stomach, small intestine, or right colon.
For example, activity secreted in saliva would generally be assigned to the contents of the
oral cavity, and activity secreted in liver bile or pancreatic juices would be assigned to the
contents of the small intestine. However, the receptor compartment may be changed to fit 15 the assumptions of the systemic biokinetic model applied to absorbed activity. For
example, it may be assumed in the systemic model that there is no reabsorption of
secreted activity, in which case secreted activity might be assigned to the contents of the
right colon, assuming no absorption from this region.
20 (165) When modelling secretion of a radionuclide into the alimentary tract, the source of
the secreted material will depend on the systemic biokinetic model used in conjunction with
the HATM. For example, a systemic biokinetic model may include a compartment
representing the pancreas, in which case pancreatic secretion could be represented as
transfer from the pancreas into the contents of the small intestine. In many cases it may be 25 convenient and sufficient to assume that the secreted material originates in plasma rather
than a secretory organ such as the pancreas or salivary glands.
5.4. Radionuclide-specific examples of the use of the model 30
(166) In chapter 3, specific examples of radionuclide behaviour were discussed to illustrate
the types of information that may be available, and for use later in the report to show the
effect of different assumptions on dose estimates and to compare doses calculated using the
new model and the ICRP Publication 30 model. The radionuclides considered in chapter 3 35 are:
Human Alimentary Tract Model - Chapter 5 – 29 June 14 August 2004
76
• 90Sr, 106Ru and 239Pu, to illustrate the standard case in which information is
available only on total absorption and excretion, at different ages;
• 115Cd to illustrate the effect of retention on teeth on dose to the oral mucosa;
• 59Fe and 235U to illustrate the effect of retention in the SI wall for adults
• 239Pu to illustrate the effect of retention in the SI wall for neonates 5
Exemple of Absorption of strontium, ruthenium and plutonium
(167) In these examples, and in most cases, no information will be available on retention in
the wall of the small intestine during absorption. The transfer coefficient from the contents to 10 the wall of the small intestine will be computed on the basis of fSI, and the transfer coefficient
from the wall to blood will be given a high value to correspond to rapid transfer to blood with
negligible retention in the wall. Alternatively, for computational simplicity the transfer can be
taken to occur directly from the contents to blood.
15 Exemple of Cadmium retention on teeth
(168) On the basis of the limited data discussed in Chapter 3, the example used in this
report is of fractional uptake, fteeth, of 2 x10⁻³ of ingested Cd and retention with an arbitrary
half-time of 7 days. Transfer coeffcients from the contents of the oral cavity to the teeth, and 20 for removal from teeth, have been set to correspond to these values. To avoid the
unnecessary complication of considering further uptake, activity removed from teeth is taken
to be transferred directly to the esophagus (slow) compartment (similar to the assumption
adopted for Fe in the SI wall, see below).
25 Retention of iron, uranium and plutonium in the wall of the small Intestine
(169) For the example of iron ingested in soluble form by adults, discussed in Chapter 3, the
data of Werner et al. (1987) suggest an fSI of 0.2. However, while 0.2 is absorbed to blood,
initial uptake into the SI wall is 0.4, of which 0.2 is absorbed directly to blood and 0.2 is 30 retained in the SI wall with a half-time of retention of 3 days and lost into the SI contents.
(170) To model this specific case without consideration of recycling between SI content and
SI wall, requires an adaptation of the standard model. Figure 5.3 shows that absorption to
blood is taken to occur directly from the contents of the small intestine, while the compartment 35 representing the SI wall is used to account for retention in the wall followed by return back
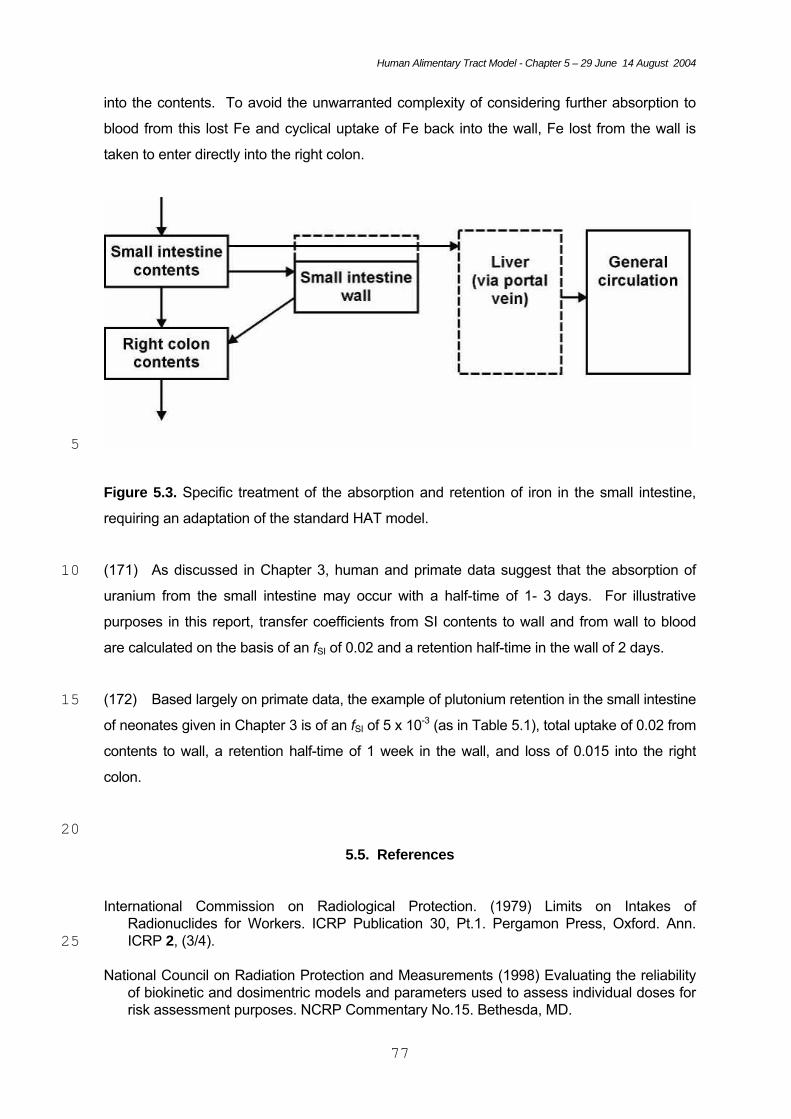
Human Alimentary Tract Model - Chapter 5 – 29 June 14 August 2004
77
into the contents. To avoid the unwarranted complexity of considering further absorption to
blood from this lost Fe and cyclical uptake of Fe back into the wall, Fe lost from the wall is
taken to enter directly into the right colon.
5
Figure 5.3. Specific treatment of the absorption and retention of iron in the small intestine,
requiring an adaptation of the standard HAT model.
(171) As discussed in Chapter 3, human and primate data suggest that the absorption of 10 uranium from the small intestine may occur with a half-time of 1- 3 days. For illustrative
purposes in this report, transfer coefficients from SI contents to wall and from wall to blood
are calculated on the basis of an fSI of 0.02 and a retention half-time in the wall of 2 days.
(172) Based largely on primate data, the example of plutonium retention in the small intestine 15 of neonates given in Chapter 3 is of an fSI of 5 x 10⁻³ (as in Table 5.1), total uptake of 0.02 from
contents to wall, a retention half-time of 1 week in the wall, and loss of 0.015 into the right
colon.
20 5.5. References
International Commission on Radiological Protection. (1979) Limits on Intakes of Radionuclides for Workers. ICRP Publication 30, Pt.1. Pergamon Press, Oxford. Ann. ICRP 2, (3/4). 25
National Council on Radiation Protection and Measurements (1998) Evaluating the reliability
of biokinetic and dosimentric models and parameters used to assess individual doses for risk assessment purposes. NCRP Commentary No.15. Bethesda, MD.

Human Alimentary Tract Model - Chapter 5 – 29 June 14 August 2004
78
Werner, E., Roth, P., Hansen, Ch. (1987) Intestinal absorption of metals. In: Age-related
Factors in Radionuclide Metabolism and Dosimetry. (G.B. Gerber, H. Métivier, H. Smith, Eds.) Proc. CEC Workshop, Angers, France, 1986. Martinus Nijhoff, Lancaster. pp.27-33. 5
Human Alimentary Tract model - Chapter 6 - 15 August 2004
79
6. TRANSIT TIMES THROUGH THE ALIMENTARY TRACT
6.1. Introduction
5 (173) The kinetics of material in the lumen of the alimentary tract depends on its composition and
location within the tract. For example, liquids usually are removed from the stomach more rapidly
than solids, and water or other non-caloric liquids are removed more rapidly than caloric liquids.
Gastric emptying of liquids can be described reasonably well in terms of a mono-exponential
function, while solids are removed from the stomach in a nearly linear pattern. Liquids may move 10 ahead of solids in the proximal right colon, but liquids and solids apparently transfer together
through most portions of the colon in slow, highly variable mass movements.
(174) Due to differences in emptying patterns for various materials and segments of the
alimentary tract as well as individual preferences of investigators, transit data for the tract have 15 been reported in a variety of units. For the purpose of deriving parameter values for the model
developed in this document, reported transfer times through the lumen were reduced to the
common basis of a transit time. The transit time of an atom in a region of the tract is the length of
time that it resides in that region. The transit time of a substance in a region is the mean of the
distribution of transit times of its atoms. 20
(175) This chapter summarizes information on the normal movement of material through the
lumen of the alimentary tract and provides default transit times representing that movement. The
experimental data underlying the selected parameter values are more fully described and
referenced in Annex C. 25
(176) The default regional transit times given here are central estimates based on collected data
for a given gender, age group, and type of material (e.g., solids, liquids, caloric liquids, or non-
caloric liquids). As extensively illustrated in Annex C, transit of material through each of the major
segments of the tract shows considerable inter- and intra-subject variability even under normal 30 conditions. Extremely large deviations from the norm may result from constipation, diarrhea,
unusual diet, pharmaceuticals, and a variety of diseases that affect the nervous system or
increase energy requirements, for example. Thus, the default transit times given here may not be
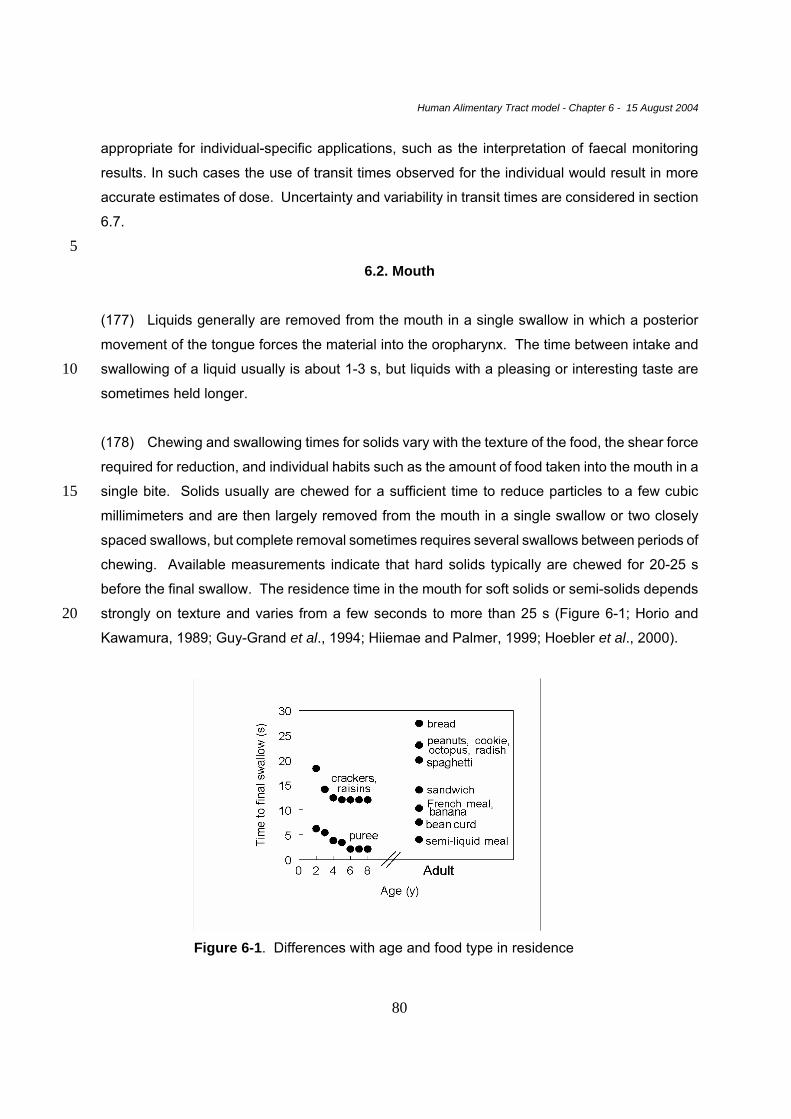
Human Alimentary Tract model - Chapter 6 - 15 August 2004
80
appropriate for individual-specific applications, such as the interpretation of faecal monitoring
results. In such cases the use of transit times observed for the individual would result in more
accurate estimates of dose. Uncertainty and variability in transit times are considered in section
6.7.
5 6.2. Mouth
(177) Liquids generally are removed from the mouth in a single swallow in which a posterior
movement of the tongue forces the material into the oropharynx. The time between intake and
swallowing of a liquid usually is about 1-3 s, but liquids with a pleasing or interesting taste are 10 sometimes held longer.
(178) Chewing and swallowing times for solids vary with the texture of the food, the shear force
required for reduction, and individual habits such as the amount of food taken into the mouth in a
single bite. Solids usually are chewed for a sufficient time to reduce particles to a few cubic 15 millimimeters and are then largely removed from the mouth in a single swallow or two closely
spaced swallows, but complete removal sometimes requires several swallows between periods of
chewing. Available measurements indicate that hard solids typically are chewed for 20-25 s
before the final swallow. The residence time in the mouth for soft solids or semi-solids depends
strongly on texture and varies from a few seconds to more than 25 s (Figure 6-1; Horio and 20 Kawamura, 1989; Guy-Grand et al., 1994; Hiiemae and Palmer, 1999; Hoebler et al., 2000).
Figure 6-1. Differences with age and food type in residence
Human Alimentary Tract model - Chapter 6 - 15 August 2004
81
times in the mouth. Based on data summarized in Annex C.
(179) Differences with age in food residence times in the mouth arise from changes with age in
the composition of diet, gradually improved chewing skills at early ages, and anatomical changes
associated with ageing. Data on sucking and swallowing rates in normal infants during feeding 5 from a bottle (Colley and Creamer, 1958) suggest a transit time in the mouth on the order of 1-3 s.
Starting at about 4 - 6 months of age there is a transition from an entirely liquid diet to increasingly
textured foods and gradually improved efficiency in chewing and swallowing. For solids and semi-
solids, the average time for processing food in the mouth may be higher at age 1-2 y than for older
children (Figure 6-1) because the younger children often hold food in the mouth without chewing 10 and tend to swallow several times per bite of food, whereas older children initiate chewing more
quickly and often swallow only once or twice (Stolovitz and Gisel, 1991). Data for pre-teenage
children suggest chewing times for solid foods similar to those observed in adults (Ingervall and
Thilander, 1975; Wickwire et al., 1981; Gisel and Patrick, 1988). The swallow time appears to be
prolonged in elderly persons due to an increase in the pharyngeal transit time (Shaw et al., 1995; 15 Rademaker et al., 1998).
(180) Default transit times for the mouth are based on the assumption that the transit time of a
liquid is the time from intake to first swallow and the mean transit time of a solid is assumed to be
three-quarters of the time from intake to final swallow. For liquids, the time between intake and 20 first swallow is assumed to be 2 s. For solids, the time from intake to final swallow is assumed to
be 20 s, based on a diet that includes a relatively high percentage of hard solids and/or chewy soft
solids such as bread and pasta. The implied transit times are 2 s for liquids and 15 s for solids.
Transit times are assumed to be independent of age after infancy because changes with age in
residence times for specific foods may be largely offset by changes in diet. 25
Table 6.1. Default transit times for the mouth.
Transit time (s) Ingested material
3-month Infant
Age > 1 y
Solids
--
15
Liquids
2
2
Human Alimentary Tract model - Chapter 6 - 15 August 2004
82
Total diet 2 12
5 6.3. Oesophagus
(181) When material is swallowed, a coordinated and sequential set of peristaltic contractions
produces a zone of pressure that moves down the oesophagus with the bolus in front of it. As the
bolus approaches the lower oesophageal sphincter, the sphincter relaxes, allowing the bolus to 10 enter the stomach. The rate of movement of a bolus varies with its composition and location
within the oesophagus and the position of the body. Velocities ranging from about 40 cm/sec to
about 1 cm/sec have been reported for different segments of the oesophagus and different
conditions. The velocity of the bolus during most of the oesophageal transport usually is in the
range 2-6 cm/sec, and the time required for the wave to travel from the pharynx to the stomach 15 usually is in the range 5-12 sec. The average time required for material to reach the stomach may
be slightly less than the time required for the peristaltic wave to reach the stomach, depending on
the physical nature of the swallowed material and the contribution of gravity. For example, liquids
swallowed by a subject in an upright position may traverse the oesophagus in less than 5 s and
thus may reach the stomach before the peristaltic contraction. However, swallowed liquids may be 20 arrested at the lower end of the oesophagus and await the arrival of the peristaltic wave before
they are admitted to the stomach (Brobeck, 1979; Guyton, 1982; Johnson, 1998).
(182) Typically, transit of liquids is more rapid than that of solids, and transit of solids mixed with
liquid is more rapid than that of drier solids. Esophageal transit generally is faster in the upright 25 than the supine position (Figure 6-2).
(183) Depending on the form of the material and the amount of lubrication from saliva or other
liquids, the oesophagus may not be totally emptied by the first peristaltic contraction initiated by
the swallow. The distension induced by residual material initiates another peristaltic contraction, 30 called a secondary peristalsis, in the absence of a swallow. The secondary peristalsis usually is
not sensed. Several secondary contractions often are required to remove the remaining material.
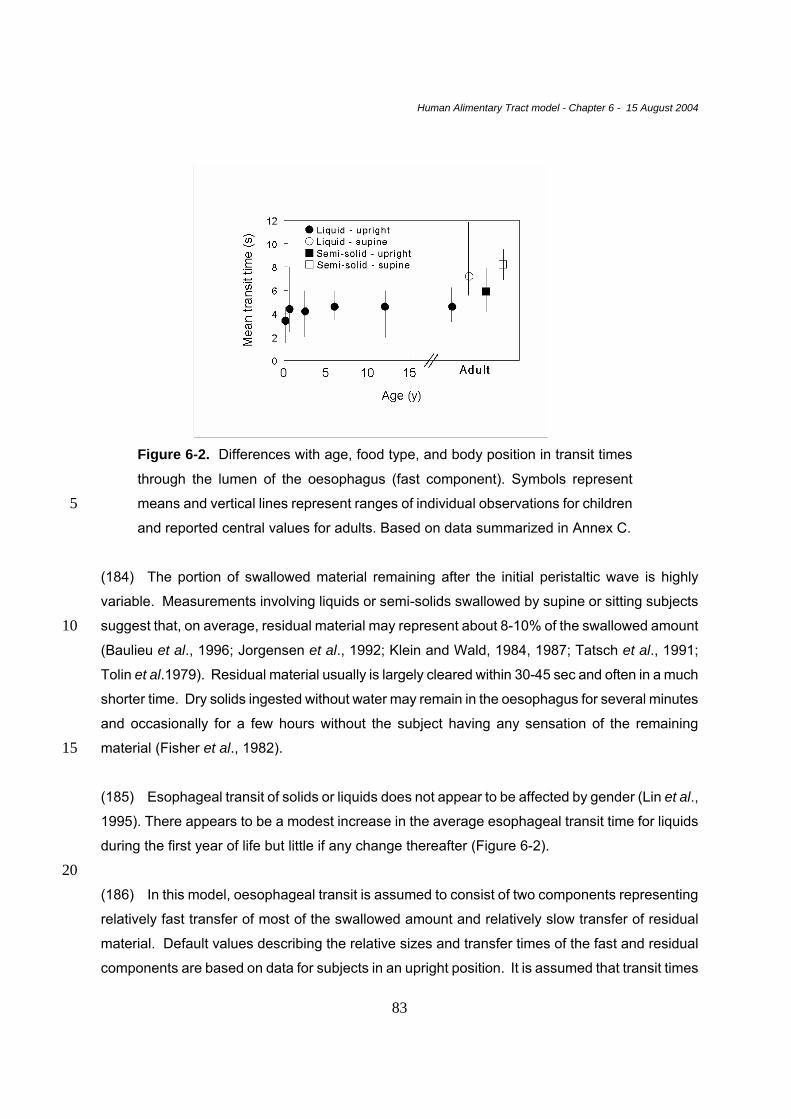
Human Alimentary Tract model - Chapter 6 - 15 August 2004
83
Figure 6-2. Differences with age, food type, and body position in transit times
through the lumen of the oesophagus (fast component). Symbols represent
means and vertical lines represent ranges of individual observations for children 5 and reported central values for adults. Based on data summarized in Annex C.
(184) The portion of swallowed material remaining after the initial peristaltic wave is highly
variable. Measurements involving liquids or semi-solids swallowed by supine or sitting subjects
suggest that, on average, residual material may represent about 8-10% of the swallowed amount 10 (Baulieu et al., 1996; Jorgensen et al., 1992; Klein and Wald, 1984, 1987; Tatsch et al., 1991;
Tolin et al.1979). Residual material usually is largely cleared within 30-45 sec and often in a much
shorter time. Dry solids ingested without water may remain in the oesophagus for several minutes
and occasionally for a few hours without the subject having any sensation of the remaining
material (Fisher et al., 1982). 15
(185) Esophageal transit of solids or liquids does not appear to be affected by gender (Lin et al.,
1995). There appears to be a modest increase in the average esophageal transit time for liquids
during the first year of life but little if any change thereafter (Figure 6-2).
20 (186) In this model, oesophageal transit is assumed to consist of two components representing
relatively fast transfer of most of the swallowed amount and relatively slow transfer of residual
material. Default values describing the relative sizes and transfer times of the fast and residual
components are based on data for subjects in an upright position. It is assumed that transit times
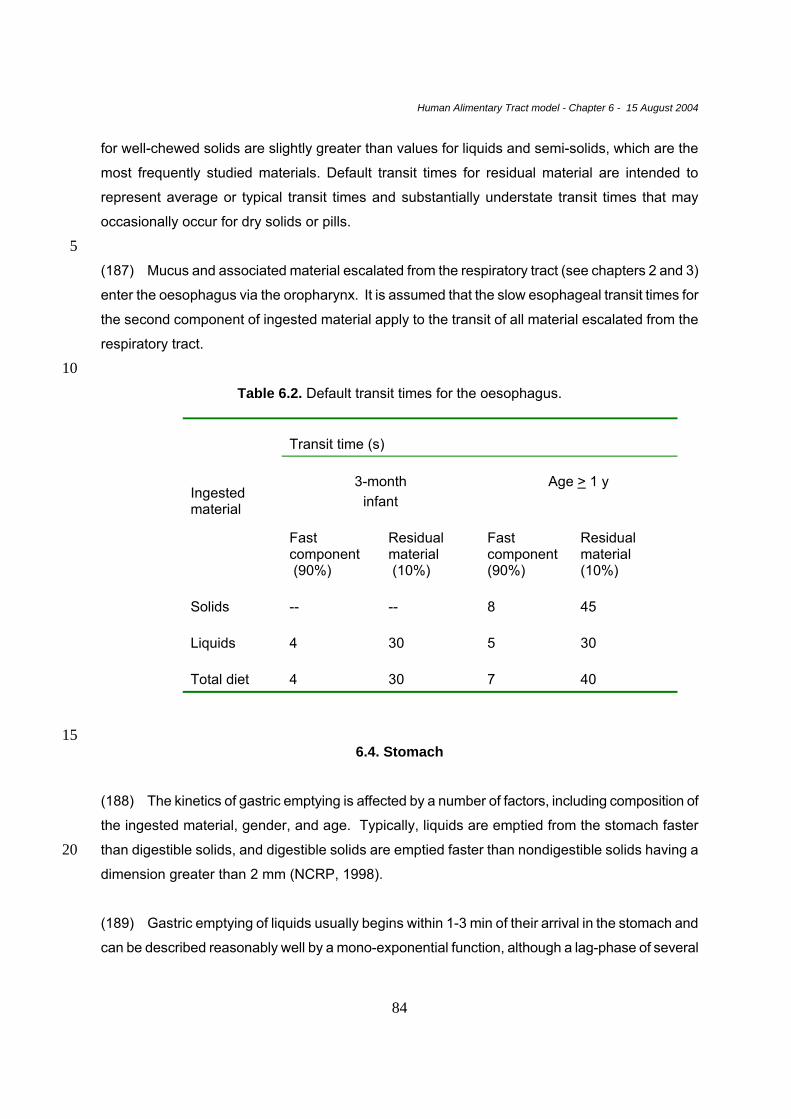
Human Alimentary Tract model - Chapter 6 - 15 August 2004
84
for well-chewed solids are slightly greater than values for liquids and semi-solids, which are the
most frequently studied materials. Default transit times for residual material are intended to
represent average or typical transit times and substantially understate transit times that may
occasionally occur for dry solids or pills.
5 (187) Mucus and associated material escalated from the respiratory tract (see chapters 2 and 3)
enter the oesophagus via the oropharynx. It is assumed that the slow esophageal transit times for
the second component of ingested material apply to the transit of all material escalated from the
respiratory tract.
10 Table 6.2. Default transit times for the oesophagus.
Transit time (s)
3-month infant
Age > 1 y
Ingested material
Fast component (90%)
Residual material (10%)
Fast component (90%)
Residual material (10%)
Solids
--
--
8
45
Liquids
4
30
5
30
Total diet
4
30
7
40
15
6.4. Stomach
(188) The kinetics of gastric emptying is affected by a number of factors, including composition of
the ingested material, gender, and age. Typically, liquids are emptied from the stomach faster
than digestible solids, and digestible solids are emptied faster than nondigestible solids having a 20 dimension greater than 2 mm (NCRP, 1998).
(189) Gastric emptying of liquids usually begins within 1-3 min of their arrival in the stomach and
can be described reasonably well by a mono-exponential function, although a lag-phase of several
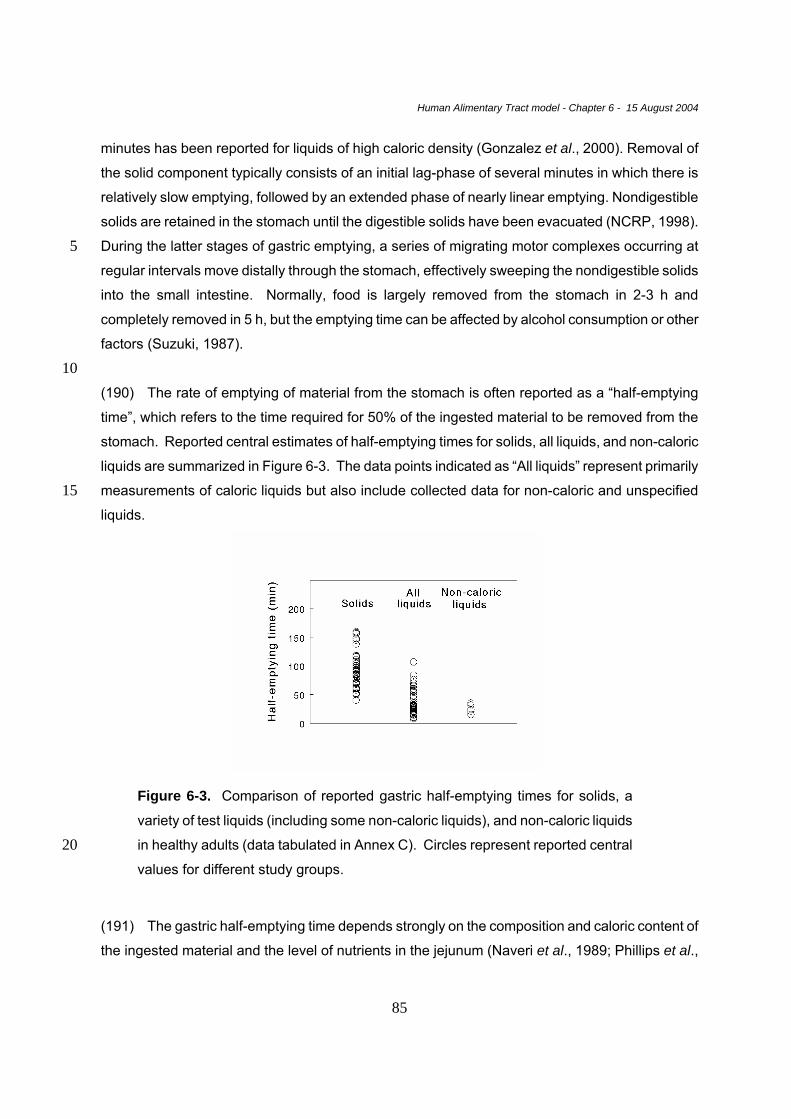
Human Alimentary Tract model - Chapter 6 - 15 August 2004
85
minutes has been reported for liquids of high caloric density (Gonzalez et al., 2000). Removal of
the solid component typically consists of an initial lag-phase of several minutes in which there is
relatively slow emptying, followed by an extended phase of nearly linear emptying. Nondigestible
solids are retained in the stomach until the digestible solids have been evacuated (NCRP, 1998).
During the latter stages of gastric emptying, a series of migrating motor complexes occurring at 5 regular intervals move distally through the stomach, effectively sweeping the nondigestible solids
into the small intestine. Normally, food is largely removed from the stomach in 2-3 h and
completely removed in 5 h, but the emptying time can be affected by alcohol consumption or other
factors (Suzuki, 1987).
10 (190) The rate of emptying of material from the stomach is often reported as a “half-emptying
time”, which refers to the time required for 50% of the ingested material to be removed from the
stomach. Reported central estimates of half-emptying times for solids, all liquids, and non-caloric
liquids are summarized in Figure 6-3. The data points indicated as “All liquids” represent primarily
measurements of caloric liquids but also include collected data for non-caloric and unspecified 15 liquids.
Figure 6-3. Comparison of reported gastric half-emptying times for solids, a
variety of test liquids (including some non-caloric liquids), and non-caloric liquids
in healthy adults (data tabulated in Annex C). Circles represent reported central 20 values for different study groups.
(191) The gastric half-emptying time depends strongly on the composition and caloric content of
the ingested material and the level of nutrients in the jejunum (Naveri et al., 1989; Phillips et al.,
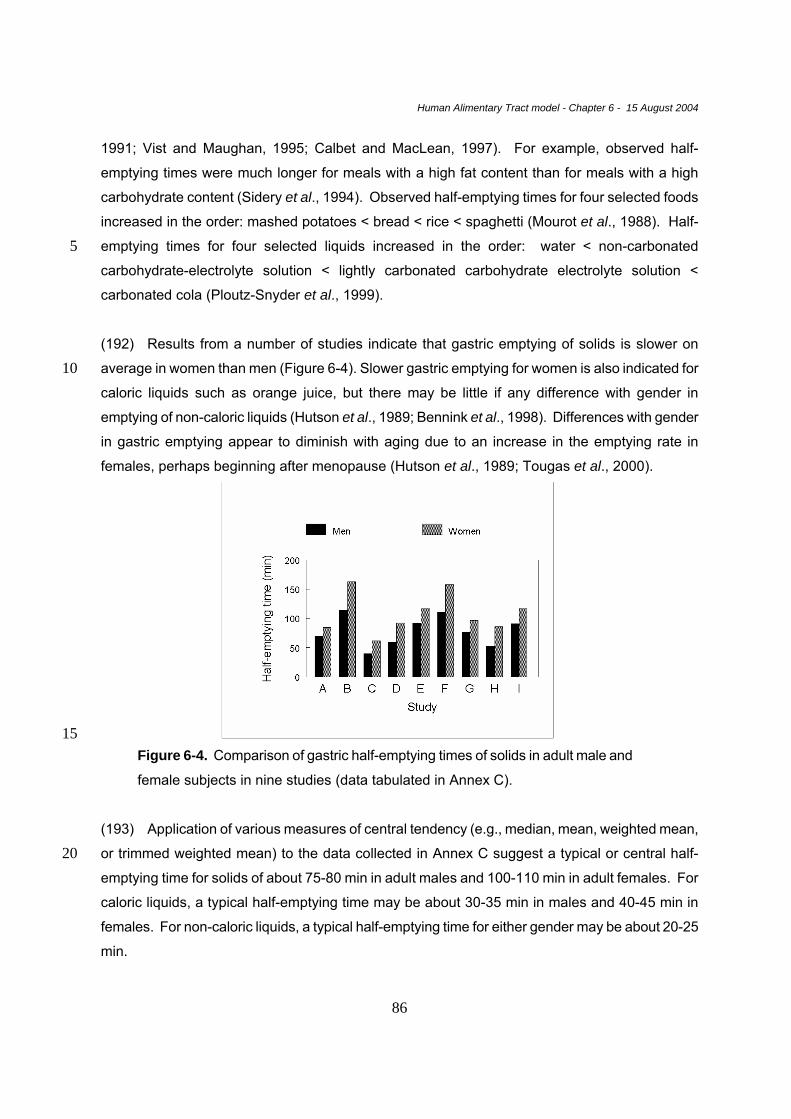
Human Alimentary Tract model - Chapter 6 - 15 August 2004
86
1991; Vist and Maughan, 1995; Calbet and MacLean, 1997). For example, observed half-
emptying times were much longer for meals with a high fat content than for meals with a high
carbohydrate content (Sidery et al., 1994). Observed half-emptying times for four selected foods
increased in the order: mashed potatoes < bread < rice < spaghetti (Mourot et al., 1988). Half-
emptying times for four selected liquids increased in the order: water < non-carbonated 5 carbohydrate-electrolyte solution < lightly carbonated carbohydrate electrolyte solution <
carbonated cola (Ploutz-Snyder et al., 1999).
(192) Results from a number of studies indicate that gastric emptying of solids is slower on
average in women than men (Figure 6-4). Slower gastric emptying for women is also indicated for 10 caloric liquids such as orange juice, but there may be little if any difference with gender in
emptying of non-caloric liquids (Hutson et al., 1989; Bennink et al., 1998). Differences with gender
in gastric emptying appear to diminish with aging due to an increase in the emptying rate in
females, perhaps beginning after menopause (Hutson et al., 1989; Tougas et al., 2000).
15 Figure 6-4. Comparison of gastric half-emptying times of solids in adult male and
female subjects in nine studies (data tabulated in Annex C).
(193) Application of various measures of central tendency (e.g., median, mean, weighted mean,
or trimmed weighted mean) to the data collected in Annex C suggest a typical or central half-20 emptying time for solids of about 75-80 min in adult males and 100-110 min in adult females. For
caloric liquids, a typical half-emptying time may be about 30-35 min in males and 40-45 min in
females. For non-caloric liquids, a typical half-emptying time for either gender may be about 20-25
min.
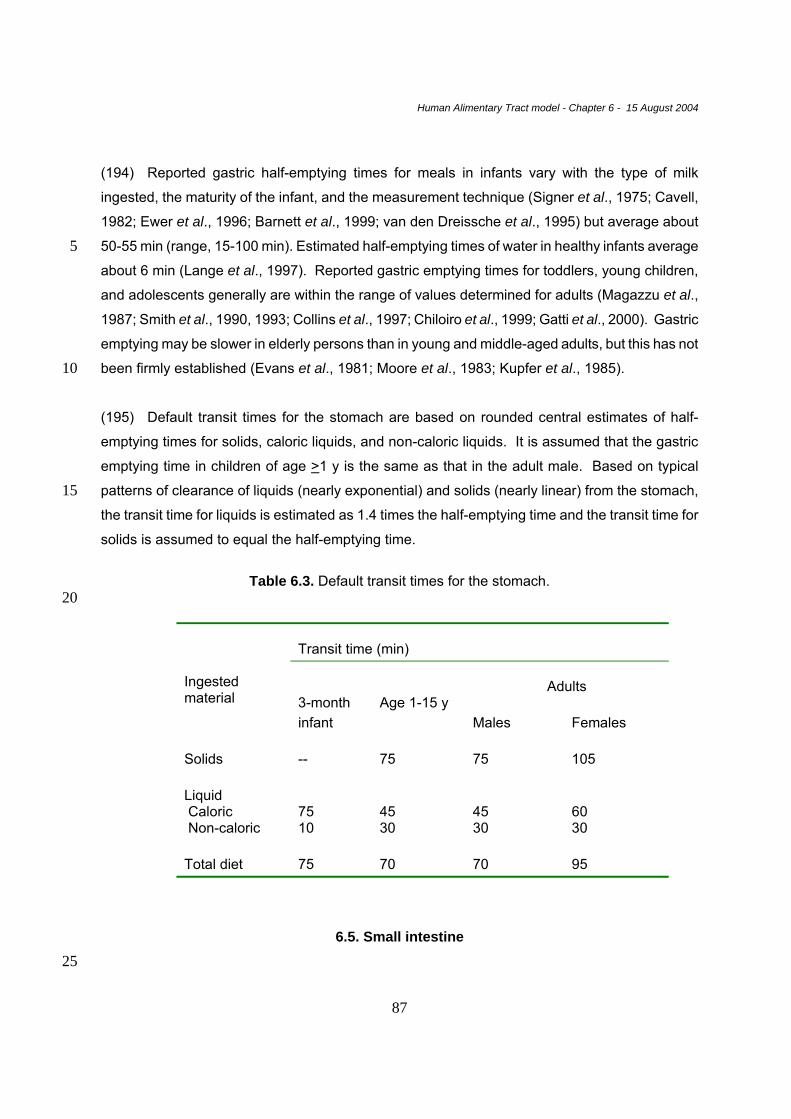
Human Alimentary Tract model - Chapter 6 - 15 August 2004
87
(194) Reported gastric half-emptying times for meals in infants vary with the type of milk
ingested, the maturity of the infant, and the measurement technique (Signer et al., 1975; Cavell,
1982; Ewer et al., 1996; Barnett et al., 1999; van den Dreissche et al., 1995) but average about
50-55 min (range, 15-100 min). Estimated half-emptying times of water in healthy infants average 5 about 6 min (Lange et al., 1997). Reported gastric emptying times for toddlers, young children,
and adolescents generally are within the range of values determined for adults (Magazzu et al.,
1987; Smith et al., 1990, 1993; Collins et al., 1997; Chiloiro et al., 1999; Gatti et al., 2000). Gastric
emptying may be slower in elderly persons than in young and middle-aged adults, but this has not
been firmly established (Evans et al., 1981; Moore et al., 1983; Kupfer et al., 1985). 10
(195) Default transit times for the stomach are based on rounded central estimates of half-
emptying times for solids, caloric liquids, and non-caloric liquids. It is assumed that the gastric
emptying time in children of age >1 y is the same as that in the adult male. Based on typical
patterns of clearance of liquids (nearly exponential) and solids (nearly linear) from the stomach, 15 the transit time for liquids is estimated as 1.4 times the half-emptying time and the transit time for
solids is assumed to equal the half-emptying time.
Table 6.3. Default transit times for the stomach.
20
Transit time (min)
Adults
Ingested material
3-month infant
Age 1-15 y
Males Females
Solids
--
75
75
105
Liquid Caloric Non-caloric
75 10
45 30
45 30
60 30
Total diet
75
70
70
95
6.5. Small intestine 25

Human Alimentary Tract model - Chapter 6 - 15 August 2004
88
(196) Movement of material through the small intestine appears to be a nearly linear process
(NCRP, 1998). Measurements of the rate of transfer of material through the small intestine
generally are reported as transit times.
(197) The ileum, the distal part of the small intestine, acts as a reservoir and transfers boluses of 5 variable sizes into the colon. Intake of a subsequent meal may stimulate transfer into the colon,
but this appears to depend on the composition of the material in the ileum (Ewe et al., 1989;
Camilleri et al., 1989; Price et al., 1993; Hebden et al., 1998).
(198) The transit time through the small intestine is influenced by the luminal contents. For 10 example, fat in the small intestine induces significantly faster transit than proteins but delays
ileocolonic transit (Hammer et al., 1998). It has not been clearly established whether liquids and
solids are transferred at the same rate through the small intestine.
(199) Reported central estimates for the transit time through the small intestine are in the range 15 1.8-8 h and average 3.9 +/- 1.5 h (standard deviation) (Figure 6-5). This excludes estimates
based on the frequently applied hydrogen breath test, which is now regarded as unreliable
(Madsen et al., 1991; Wutzke et al., 1997). Limited comparisons of small intestinal transit in adult
males and females and in adults and children have not revealed significant differences with
gender or age in the rate of transit of material through the small intestine (Madsen, 1992; Argenyi 20 et al., 1995; Bennink et al., 1999).
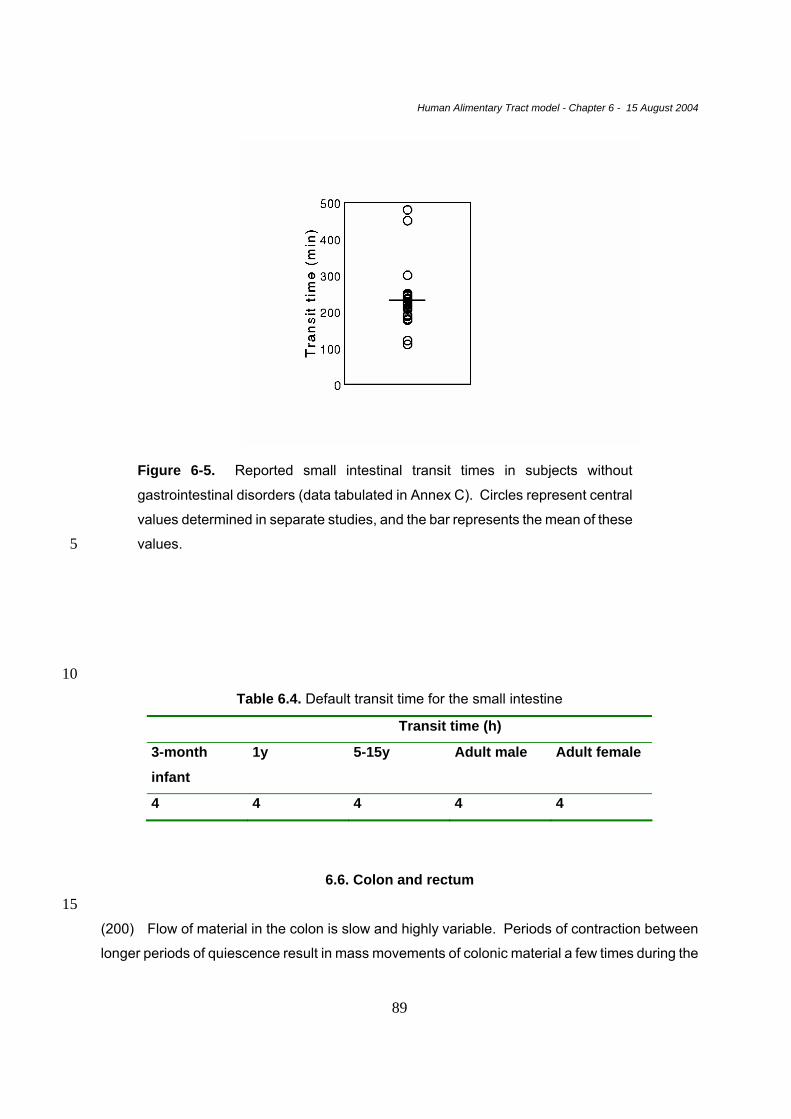
Human Alimentary Tract model - Chapter 6 - 15 August 2004
89
Figure 6-5. Reported small intestinal transit times in subjects without
gastrointestinal disorders (data tabulated in Annex C). Circles represent central
values determined in separate studies, and the bar represents the mean of these
values. 5
10 Table 6.4. Default transit time for the small intestine
Transit time (h)
3-month
infant
1y 5-15y Adult male Adult female
4 4 4 4 4
6.6. Colon and rectum
15 (200) Flow of material in the colon is slow and highly variable. Periods of contraction between
longer periods of quiescence result in mass movements of colonic material a few times during the
Human Alimentary Tract model - Chapter 6 - 15 August 2004
90
day (Karaus and Wienbeck, 1991). Fluids may move ahead of solids in the proximal right colon,
but solids and fluids appear to move together throughout most of the colon.
(201) The rectum serves mainly as a conduit but can also serve as a storage organ. Entry of
material from the sigmoid colon usually evokes the rectoanal inhibitory reflex, signaling the need to 5 defecate. The rectum serves as a storage organ when the amount of material received from the
sigmoid colon is too small to evoke this reflex or when this reflex is neglected (Shafik et al., 1997).
The average residence time of material in the rectum cannot be estimated with much confidence.
(202) Reported central estimates of colonic transit times for groups of healthy adult subjects, 10 tabulated in Annex C, range from 17 to 68 h and average 35 +/- 11 h (standard deviation). On
average, the transit time through the colon is 30-40% longer in women than in men, although there
is considerable overlap in individual estimates for the two genders (Figure 6-6). For example, in a
study involving 80 adult males and 84 adult females, the estimated mean transit time was 30 +/- 2
h (SEM) for males and 42 +/- 3 h for females, but upper 95% values were 65 h for males and 86 h 15 for females (Meier et al., 1995). Data on changes with age in colonic transit times are not
definitive but suggest that the average colonic transit time is shorter in children than in adult males
(Figure 6-6).
(203) The time to first appearance of ingested carmine red or other markers in feces (marker 20 passage time) is used to diagnose bowel function in infants and children as well as adults. The
marker passage time underestimates the mean transit time through the gastrointestinal tract but is
a useful relative measure of whole gut transit and, by inference, colonic transit. Marker passage
times increase noticeably during the first few months of life, particularly for infants receiving mainly
breast milk (Sievers et al., 1993). On the other hand, measurements of whole-gut transit in 25 persons of all ages suggest that the colonic transit time does not change radically with age
between birth and adulthood (Arhan et al., 1981; Corazziari et al., 1985; Saavedra et al., 1989).
(204) In this model, the portion of the alimentary tract extending from the caecum to the anus is
divided into three regions, right colon, left colon, and rectosigmoid, which is a standard division for 30 diagnostic and experimental examinations of colonic transit (Bouchoucha and Thomas, 2000).
Collected data on transit through the right and left colon and rectosigmoid are summarized in
Figure 6-7. On average, the transit time is about the same for each of these regions, but
considerable variation from this pattern has been observed in individual cases.
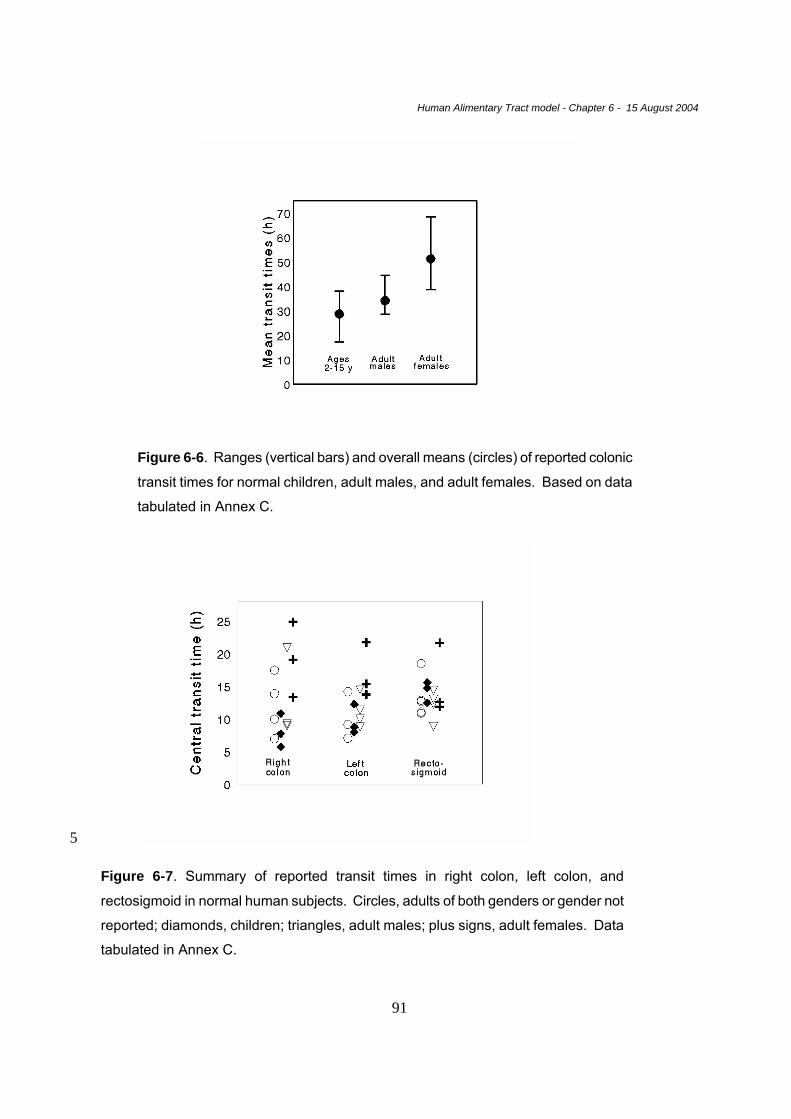
Human Alimentary Tract model - Chapter 6 - 15 August 2004
91
Figure 6-6. Ranges (vertical bars) and overall means (circles) of reported colonic
transit times for normal children, adult males, and adult females. Based on data
tabulated in Annex C.
5
Figure 6-7. Summary of reported transit times in right colon, left colon, and
rectosigmoid in normal human subjects. Circles, adults of both genders or gender not
reported; diamonds, children; triangles, adult males; plus signs, adult females. Data
tabulated in Annex C.

Human Alimentary Tract model - Chapter 6 - 15 August 2004
92
(205) Default transit times for the right colon, left colon, and rectosigmoid are based on the
following central estimates and assumptions:
• in the adult male, the total colonic transit time (caecum to anus) is 36 h.
• the colonic transit time in adult females is one-third greater than that in adult males, i.e., 5 48 h.
• in adults, the transit time is the same for the right colon, left colon, and rectosigmoid, i.e.,
12 h for each segment in males and 16 h for each segment in females.
• in males, the colonic transit time increases by about 25% (precisely, 8 h) between birth
and adulthood, with the rate of increase being highest during the first year of life and more 10 gradual thereafter.
15
Table 6.5. Default transit times for right colon, left colon, and rectosigmoid 20
Transit time (h)
Segment
3-month infant
1 y
5-15 y
Adult male
Adult female
Right colon
8
10
11
12
16
Left colon
8
10
11
12
16
Rectosigmoid
12
12
12
12
16
6.7 Uncertainty and variability
(206) This section provides a brief review of uncertainty and inter- and intra-individual variability 25 in transit times through different segments of the alimentary tract. Chapter 8 considers the various
Human Alimentary Tract model - Chapter 6 - 15 August 2004
93
sources of uncertainty in the HATM and their effect on dose estimates.
(207) As discussed in Chapter 3 and in more detail in Chapter 8, “uncertainty” refers in this report
to the level of confidence that can be placed in a given component (e.g., parameter value) or
prediction of the HATM, as an estimate of the central value (usually, an arithmetic or geometric 5 mean) in the population. “Variability” refers to quantitative differences between different members
of a population under similar conditions (inter-individual variability) or within an individual under
different conditions (intra-individual variability).
6.7.1. Uncertainties associated with model formulation 10
Use of first-order kinetics
(208) Representation of movement of material through the lumen of the alimentary tract as a
series of first-order transfers between well-mixed pools is a considerable simplification. For 15 example, material traverses the small intestine in a more or less linear fashion and is transferred
to the ascending colon in multi-bolus form. Flow of material in the rectosigmoid region of the colon
is slow, variable, and intermittent, with periods of contraction between longer periods of
quiescence resulting in mass movements of material a few times during the day.
20 (209) The assumption of first-order kinetics is made for computational convenience. The
emptying half-time for a segment of the tract is set to reproduce central estimates of reported
mean transit times of material through that segment, in the absence of radioactive decay. For
relatively short-lived radionuclides, first-order kinetics can overestimate decays in the lower
regions of the tract because it implies an immediate appearance of some ingested atoms in all 25 regions of the tract. For example, an ingested radionuclide with half-life 20 min is likely to decay
almost entirely between the mouth and caecum (ignoring absorption to blood) because more than
10 radiological half-lives may elapse before the first appearance of the ingested material in the
right colon, but the HATM predicts on the basis of first-order kinetics that about 3% of the total
decays in the alimentary tract would occur in the colon. 30
(210) In interpreting bioassay data, it should be kept in mind that the HATM or other first-order
gastrointestinal models will not yield meaningful predictions of the faecal excretion rate during the
early hours after intake due to its simplification of kinetics in the tract. For the case of ingestion of
Human Alimentary Tract model - Chapter 6 - 15 August 2004
94
a radionuclide by an adult male, the HATM predicts that, in the absence of absorption to blood,
total faecal excretion is about 3% of the ingested amount after 12 h. The time to first appearance
of ingested carmine red or other ingested markers in faeces of healthy adults (see Annex C) is
typically greater than 12 h.
5 (211) The HATM predicts that total faecal excretion of an unabsorbable marker would be about
22% of the ingested amount after 1 d, 69% after 2 d, 91% after 3 d, 98% after 4 d, and >99.5%
after 5 d. These predictions are broadly consistent with reported data for carmen red or other
markers and with more variable data on accidental intakes of radionuclides, although it appears
that faecal excretion often is more nearly complete after about 3 d than the model predicts. Of 10 course, It can be misleading to check the model against small numbers of individual cases due to
substantial inter- and intra-subjects variability in the transit time. In some individual cases, nearly
all of the swallowed amount appears in faeces during the first day. In other cases, 2-3 days or
longer elapse before any appreciable faecal excretion of ingested material.
15 Division of the tract into compartments
(212) With the exception of the division of the colon, the compartments used to describe transfer
of material through the lumen of the alimentary tract represent anatomically and functionally
distinct regions of the tract. The colon has been divided in a number of different ways in different 20 radiation protection models. The model of Publication 30 divides the colon into the upper large
intestine (ULI) and the lower large intestine (LLI), where the ULI includes the ascending and
transverse colons and the LLI includes the descending colon, sigmoid colon, and rectum. A model
developed for use in nuclear medicine (Stubbs, 1991, 1992; NCRP, 1998) divides the colon into
the ascending colon, transverse colon, and rectosigmoid. The HATM divides the colon into the 25 right colon, left colon, and rectosigmoid. The right colon is defined as the caecum, ascending
colon, and proximal half of the transverse colon; the left colon is the distal half of the transverse
colon plus the descending colon; and the rectosigmoid is the sigmoid colon plus the rectum. This
division is often used for diagnostic and experimental examinations of colonic transit, and
considerable information is available on transit times through each of these three segments. The 30 Task Group concluded that the division of the large intestine into right colon, left colon, and
rectosigmoid allows best estimates of the time-dependent distribution of ingested, inhaled, or
secreted activity in the colon, based on modern data.
Human Alimentary Tract model - Chapter 6 - 15 August 2004
95
(213) The Task Group considered whether the rectum should be represented as a separate
compartment, since it is commonly assumed to function mainly as conduit rather than a storage
organ. Information found in the literature indicated, however, that the rectum can serve for
extended periods as a storage organ and in some cases could contain a substantial portion of the
total activity in the alimentary tract. For example, Notghi et al. (1993) used a polymer-coated 5 capsule to deliver 111In-resin into the ileocaecal region in eight volunteer subjects and at 24 hours
found activity mainly in the rectum in two of the subjects. In a study involving 48 healthy volunteers
(mean age 38.4 +/-15.8 SD years; 30 men, 18 women), Shafik et al. (1997) investigated whether
the rectum serves as a storage organ as well as a conduit. Stools in the rectum were found in
about two-thirds of the subjects. The subjects with an empty rectum had their last defecation 5.2 10 +/- 3.6 h before examination, and the subjects with a partiallly filled rectum had their last
defecation 15.6 +/-12.9 h earlier. In view of such findings, and because of the difficulties in
determining a meaningful transit time separately for the rectum, the Task Group concluded that
the rectum should not be treated as a separate compartment. .
15 6.7.2 Uncertainties in measurement techniques and interpretation
(214) In the years since the development of the Publication 30 model (ICRP, 1979), numerous
investigations of the kinetics of material in the gastrointestinal tract have been conducted by
improved, non-invasive techniques, such as external viewing of radio-labeled foods, liquids, or 20 indigestible substances (see previous sections and Annex C). While the uncertainties associated
with measurement techniques have been substantially reduced, the difficulties involved in
determining true transit times should not be underestimated. For example, the physical
characteristics of markers used in modern studies apparently can affect colonic transit times
(Olmos et al., 1994). Also, some methods still in common use do not appear to provide 25 representative or reproducible results (e.g. see the discussion of the hydrogen breath test in
Annex C).
(215) Uncertainties also are inherent in the assumptions and algorithms used to translate
measurements into estimates of the mean transit time. For example, measurements of colonic 30 transit frequently are based on counts of ingested radio-opaque markers in the regions of interest.
It has been argued that this technique may substantially underestimate actual transit times in
many cases because the experimental methods may not closely approximate the underlying
assumptions of continuous ingestion of markers and attainment of steady-state by the time of
Human Alimentary Tract model - Chapter 6 - 15 August 2004
96
counting (Bouchoucha and Thomas, 2000). The extent of underestimate may vary considerably
from one study to another due to differences in numbers and patterns of administration of the
marker and times of measurement.
6.7.3 Variability in transit times 5
(216) Annex C describes a number of factors that can have substantial influence on transit rates
of material in different segments of the alimentary tract, and several of these factors are
mentioned in the present chapter. The following paragraphs summarize some of the main sources
of variability in transit times and the extent of variability indicated by reported data. The reader is 10 referred to Annex C for further details and a list of references.
(217) The time that food is held in the mouth varies from a few seconds to 30 seconds or more,
depending on the composition and texture of the food, the level of hunger, personal habits,
customs, and other factors. The residence time in the mouth can be increased by up to an order 15 of magnitude by some diseases that interfere with chewing or swallowing such as poliomyelitis
and encephalitis.
(218) In the HATM, esophageal transit is viewed as consisting of two components, one
representing relatively fast transfer of most of the swallowed amount and one representing 20 relatively slow transfer of a small fraction of residual material. For normal subjects, transit times for
liquids are generally in the range 3-12 s for the fast component. Esophageal transit of solids varies
considerably with the composition of the ingested material and the amount of fluid ingested with
the solid. Transit is particularly slow for relatively dry, non-viscous solids. The portion of
swallowed material remaining after the initial peristaltic wave and the time that the residual 25 material remains in the esophagus are both highly variable. Residual material usually is cleared
completely within 30-45 sec and often within a much shorter time, but capsules or solid food
ingested without water may remain in the esophagus for several minutes or even hours. Transit
times are increased by cold fluids and decreased by warm fluids. Esophageal transit generally is
faster in the upright than the supine position, particularly for solids. Changes with age in 30 esophageal transit appear to be modest. Esophageal transit is affected by a number of disorders
of the digestive system including hiatal hernia, esophageal reflux, esophageal spasm, and
esophageal diverticulosis and is particularly slow in persons with achalasia, a condition in which
the lower esophageal sphincter fails to relax during the swallowing mechanism. In achalasia, the
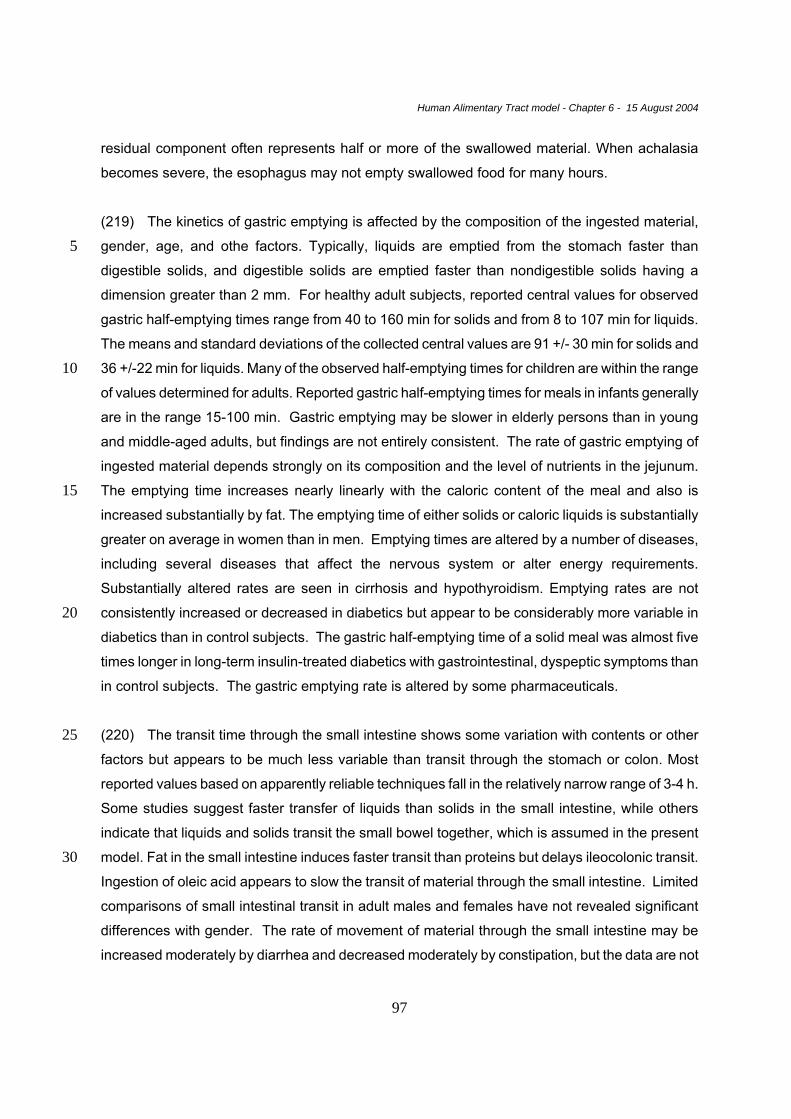
Human Alimentary Tract model - Chapter 6 - 15 August 2004
97
residual component often represents half or more of the swallowed material. When achalasia
becomes severe, the esophagus may not empty swallowed food for many hours.
(219) The kinetics of gastric emptying is affected by the composition of the ingested material,
gender, age, and othe factors. Typically, liquids are emptied from the stomach faster than 5 digestible solids, and digestible solids are emptied faster than nondigestible solids having a
dimension greater than 2 mm. For healthy adult subjects, reported central values for observed
gastric half-emptying times range from 40 to 160 min for solids and from 8 to 107 min for liquids.
The means and standard deviations of the collected central values are 91 +/- 30 min for solids and
36 +/-22 min for liquids. Many of the observed half-emptying times for children are within the range 10 of values determined for adults. Reported gastric half-emptying times for meals in infants generally
are in the range 15-100 min. Gastric emptying may be slower in elderly persons than in young
and middle-aged adults, but findings are not entirely consistent. The rate of gastric emptying of
ingested material depends strongly on its composition and the level of nutrients in the jejunum.
The emptying time increases nearly linearly with the caloric content of the meal and also is 15 increased substantially by fat. The emptying time of either solids or caloric liquids is substantially
greater on average in women than in men. Emptying times are altered by a number of diseases,
including several diseases that affect the nervous system or alter energy requirements.
Substantially altered rates are seen in cirrhosis and hypothyroidism. Emptying rates are not
consistently increased or decreased in diabetics but appear to be considerably more variable in 20 diabetics than in control subjects. The gastric half-emptying time of a solid meal was almost five
times longer in long-term insulin-treated diabetics with gastrointestinal, dyspeptic symptoms than
in control subjects. The gastric emptying rate is altered by some pharmaceuticals.
(220) The transit time through the small intestine shows some variation with contents or other 25 factors but appears to be much less variable than transit through the stomach or colon. Most
reported values based on apparently reliable techniques fall in the relatively narrow range of 3-4 h.
Some studies suggest faster transfer of liquids than solids in the small intestine, while others
indicate that liquids and solids transit the small bowel together, which is assumed in the present
model. Fat in the small intestine induces faster transit than proteins but delays ileocolonic transit. 30 Ingestion of oleic acid appears to slow the transit of material through the small intestine. Limited
comparisons of small intestinal transit in adult males and females have not revealed significant
differences with gender. The rate of movement of material through the small intestine may be
increased moderately by diarrhea and decreased moderately by constipation, but the data are not
Human Alimentary Tract model - Chapter 6 - 15 August 2004
98
definitive. The transit time through the small intestine appears to be altered by some
pharmaceuticals. Limited data suggest that the transit time through the small intestine may be
reduced by stress and physical exercise and increased during pregnancy.
(221) Reported central transit times through the total colon vary by about a factor of 4 (range, 17-5 68 h) but are typically in the range 24-48 h. On average, transit times are 30-40% greater in adult
females than in adult males and appear to be greater in adult males than in children. Results of
studies of potential changes with adult age in colonic transit times are equivocal. Measurements of
segmental transit times in relatively large study groups indicate upper 95% values of roughly 24 h
for the right colon, 36 h for the left colon, and 40 h for the rectosigmoid. Average oro-rectal transit 10 times, expected to represent mainly colonic transit, vary substantially from one region of the world
to another, presumably due mainly to differences in dietary fibre. For example, measured oro-
rectal transit times were longer on average for populations whose diets consisted largely of
refined, low-fiber foods (means, 48-83 h) than for populations that ate mainly unrefined, high-fibre
foods (means, 34-36 h) or mixed diets (means, 41-47 h). Transit through the colon may be altered 15 substantially by constipation or diarrhea. In one study, colonic transit times of about 18 h and 5 d
were determined for groups of subjects with diarrhea and constipation, respectively, while no
significant difference in gastric emptying or small intestine transit was found between the two
groups. A number of disease states affect colonic transit. Patients with progressive systemic
sclerosis showed an increase in the estimated median gastric emptying time and colonic transit 20 time compared with control subjects but no abnormality in the small intestine transit time. Diarrhea
and decreased gastrointestinal transit times are common manifestations of hyperthyroidism,
whereas constipation frequently occurs in hypothyroidism. The transit time through the colon may
be altered substantially by drugs. 25
6.8. References
Argenyi, E. E.; Soffer, E. E.; Jadsen, M. T.; Berbaum, K. S.; Walkner, W. O. (1995) Scintigraphic evaluation of small bowel transit in healthy subjects: inter- and intrasubject variability. Am. J. Gastroenterol. 90:938-942. 30 Arhan, P.; Devroede, G.; Jehannin, B.; Lanza, M.; Faverdin, C.; Dornic, C.; Persoz, B.; Tetreault, L.; Perey, B.; Pellerin, D. (1981) Segmental colonic transit time. Dis. Colon Rectum 24:625-629. Barnett, C.; Snel, A.; Omari, T.; Davidson, G.; Haslam, R.; Butler, R. (1999) Reproducibility of the 35 13C-octanoic acid breath test for assessment of gasric emptying in healthy preterm infants. J. Pediatr. Gastroenterol. Nutr. 29:26-30.
Human Alimentary Tract model - Chapter 6 - 15 August 2004
99
Baulieu, F.; Picon, L.; Baulieu, J. L.; Guilloteau, D.; Paycha, F.; Metman, E. (1996) Transit radio-isotopique de l'oesophage. Médicine Nucléaire - Imagerie fonctionelle et métabolique 20:108-115. Bennink, R.; Peeters, M.; Van den Maegdenbergh, V.; Geypens, B.; Rutgeerts, P.; De Roo, M.; 5 Mortelmans, L. (1998) Comparison of total and compartmental gastric emptying and antral motility between healthy men and women. Eur. J. Nucl. Med. 25:1293-129. Bennink, R.; Peeters, M.; Van den Maegdenbergh, V.; Geypens, B.; Rutgeerts, P.; De Roo, M.; Mortelmans, L.( 1999) Evaluation of small-bowel transit for solid and liquid test meal in healthy 10 men and women. Eur. J. Nucl. Med. 26:1560-1566. Bouchoucha, M.; Thomas, S. R. (2000) Error analysis of classic colonic transit time estimates. Am. J. Physiol. Gastrointest. Liver Physiol. 279:G520-G527. 15 Brobeck, J. R., ed. (1979) Best and Taylor’s Physiological Basis of Medical Practice. Tenth edition. Baltimore: Williams and Wilkins Co. Calbet, J. A.; MacLean, D. A. (1997) Role of caloric content on gastric emptying in humans. J. Physiol. (Lond.) 498 (Part 2):553-559. 20 Camilleri, M; Colemont, L. J.; Phillips, S. F.; Brown, M. L.; Thomforde, G. M.; Chapman, N; Zinsmeister, A. R. (1989) Human gastric emptying and colonic filling of solids characterized by a new method. Am. J. Physiol. 257:G284-G290. 25 Cavell, B. (1982) Reservoir and emptying function of the stomach of the premature infant. Acta Paediatr. Scand. Suppl. 296:60-61. Chiloiro, M.; Caroli, M.; Guerra, V.; Lodadea Piepoli, A.; Riezzo, G (1999). Gastric emptying in normal weight and obese children � an ultrasound study. Int. J. Obes. Relat. Metab. Disord. 30 23:1303-1306. Colley, J. R. T.(1958) Creamer, B. Sucking and swallowing in infants. Br. Med. J. 2:422-423. Collins, C. E.; Francis, J. L.; Thomas, P.; Henry, R. L.; O. Loughlin, E. V. (1997) Gastric emptying 35 time is faster in cystic fibrosis. J. Pediatr. Gastroenterol. Nutr. 25:492-498. Corazziari, E.; Cucchiara, S.; Staiano, A.; Romaniello, G.; Tamburrini, O.; Torsoli, A.; Auricchio, S. (1985) Gastrointestinal transit time, frequency of defecation, and anorectal manometry in healthy and constipated children. J. Pediatr. 106:379-382. 40 Ewe, K.; Press, A. G.; Dederer, W. (1989) Gastrointestinal transit of undigestible solids measured by metal detector EAS II. Eur. J. Clin. Invest.19:291-297. Ewer, A. K.; Yu, V. Y. (1996) Gastric emptying in pre-term infants: the effect of breast milk fortifier. 45 Acta Paediatr. 85:1112-1115. Evans, M. A.; Triggs, E. J.; Cheung, M.; Broe, G. A.; Creasey, H. (1981) Gastric emptying rate in the elderly: implications for drug therapy. J. Am. Geriatr. Soc. 29:201-205. 50
Human Alimentary Tract model - Chapter 6 - 15 August 2004
100
Gatti, C.; di Abriola, F.; Dall’Oglio, L.; Villa, M.; Franchini, F.; Amarri, S. (2000) Is the 13C-acetate breath test a valid procedure to analyse gastric emptying in children? J. Pediatr. Surg. 35:62-65. Gisel, E. G.; Patrick, J. (1988) Identification of children with cerebral palsy unable to maintain a normal nutritional state. Lancet; 283-285. 5 Gonzalez, A.; Mugueta, C.; Parra, D.; Labayen, I.; Martinez, A.; Varo, N.; Monreal, I.; Gil, M. J. (2000) Characterisation with stable isotopes of the presence of a lag phase in the gastric emptying of liquids. Eur. J. Nutr. 39:224-228. 10 Guy Grand, B.; Lehnert, V.; Doassans, M.; Bellisle, F. (1994) Type of test-meal affects palatability and eating style in humans. Appetite 22:125-134. Guyton, A. C. (1982) Human physiology and mechanisms of disease. Third edition. Philadelphia: W. B. Saunders. 15 Hammer, J.; Hammer, K.; Kletter, K. (1998) Lipids infused into the jejunum accelerate small intestinal transit but delay ileocolonic transit of solids and liquids. Gut 43:111-116. Hebden, J. M.; Blackshaw, P. E.; Perkins, A. C.; D’Amato, M.; Spiller, R. C. (1998) Small bowel 20 transit of a bran meal residue in humans: sieving of solids from liquids and response to feeding. Gut 42:685-689. Hiiemae, K. M.; Palmer, J. B. (1999) Food transport and bolus formation during complete feeding sequences on foods of different initial consistency. Dysphagia 14:31-42. 25 Hoebler, C.; Devaux, M.-F.; Karinthi, A.; Belleville, C.; Barry, J.-L. (2000) Particle size of solid food after human mastication and in vitro simulation of oral breakdown. Int. J. Food Sci. Nutr. 51:353-366. 30 Horio, T.; Kawamura, Y. (1989) Effects of texture of food on chewing patterns in the human subject. J. Oral Rehab. 16:177-183. Hutson, W. R.; Roehrkasse, R. L.; Wald, A. (1989) Influence of gender and menopause on gastric emptying and motility. Gastroenterology 96:11-17. 35 Ingervall, B.; Thilander, B. (1985) Activity of temporal and masseter muscles in children with a lateral forced bite. Angle Ortho. 45:249-380. Johnson, L. R. (1998) Essential medical physiology. Second edition. Philadelphia : 40 Lippincott-Raven. Jorgensen, F.; Hesse, B.; Tromholt, N.; Hojgaard, L.; Stubgaard, M. (1992) Esophageal scintigraphy: reproducibility and normal ranges. Nucl. Med. 33:2106-2109. 45 Karaus, M.; Wienbeck, M. (1991) Colonic motility in humans � a growing understanding. Bailieres Clin. Gastroenterol. 5:453-478. Klein, H. A.; Wald, A. (1984) Computer analysis of radionuclide esophageal transit studies. J. Nucl. Med. 25:957-964. 50
Human Alimentary Tract model - Chapter 6 - 15 August 2004
101
Klein, H. A.; Wald, A. (1987) Normal variation in radionuclide esophageal transit studies. Eur. J. Nucl. Med. 13:115-120. Kupfer, R. M.; Heppell, M.; Haggith, J. W.; Bateman, D. N. (1985) Gastric emptying and small-bowel transit rate in the elderly. J. Am. Geriatr. Soc. 33:340-343. 5 Lange, A.; Funch-Jensen, P.; Thommesen, P.; Schiotz, P. O. (1997) Gastric emptying patterns of a liquid meal in newborn infants measured by epigastric impedance. Neurogastroenterol. Motil. 9:55-62. 10 Madsen, J. L. (1992) Effects of gender, age, and body mass index on gastrointestinal transit times. Dig. Dis. Sci. 37:1548-1553. Madsen, J. L.; Larsen, N. E.; Hilsted, J.; Worning, H. (1991) Scintigraphic determination of gastrointestinal transit times. A comparison with breath hydrogen and radiologic methods. Scand. 15 J. Gastroenterol. 26:1263-1271. Magazzu, G.; Baldari, S.; Conti Nibali, S.; Astori, M.; Arrigo, T.; De Luca, F. (1987) Scintigraphic study of gastric emptying in children with common obesity. Pediatrie 42:383-385. 20 Meier, R.; Beglinger, C.; Dederding, J. P.; Meyer-Wys, B.; Fumagalli, M.; Rowedder, A.; Turberg, Y.; Brignoli, R. (1995) Influence of age, gender, hormonal status and smoking habits on colonic transit time. Neurogastroenterol. Motil. 7:235-238. Moore, J. G.; Tweedy, C.; Christian, P. E.; Datz, F. L. (1983) Effect of age on gastric emptying of 25 liquid-solid meals in man. Dig. Dis. Sci. 28:340-344. Mourot, J.; Thouvenot, P.; Couet, C.; Antoine, J. M.; Krobicka, A.; Debry, G. (1988) Relationship between the rate of gastric emptying and glucose and insulin responses to starchy foods in young healthy adults. Am. J. Clin. Nutr. 48:1035-1040. 30 Naveri, H.; Tikkanen, H.; Kairento, A. L.; Harkonen, M. (1989) Gastric emptying and serum insulin levels after intake of glucose-polymer solutions. Eur. J. Appl. Physiol. 58:661-665. NCRP. (1998) Evaluating the reliability of biokinetic and dosimetric models and parameters used 35 to assess individual doses for risk assessment purposes. NCRP Commentary No. 15. Bethesday, Maryland: National Council on Radiation Protection and Measurements. Notghi, A.; Kumar, D.; Panagamuwa, B.; Tulley, N. J.; Hesslewood, S. R.; Harding, L. K. (1993) Measurement of colonic transit time using radionuclide imaging: analysis by condensed images. 40 Nucl. Med. Commun. 14:204-211. Olmos, J.; Soifer, L.; De Paula, J. A.; San Roman, J.; Varela, E.; Bustos Fernandez, L.; Gadea, O.; De Paula, A. (1994) [Do the physical characteristics of radiopaque markers modify the results of the measurement of colonic transit time?] [Article in Spanish] Acta Gastroenterol Latinoam 25:287-45 290. Phillips, W. T.; Schwartz, J. G.; Blumhardt, R.; McMahan, C. A. (1991) Linear gastric emptying of hyperosmolar glucose solutions. J. Nucl. Med. 32:377-381. 50
Human Alimentary Tract model - Chapter 6 - 15 August 2004
102
Ploutz-Snyder, L.; Foley, J.; Ploutz-Snyder, R.; Kanaley, J.; Sagendorf, K.; Meyer, R. (1999) Gastric gas and fluid emptying assessed by magnetic resonance imaging. Eur. J. Appl. Physiol. 79:212-220. Price, J. M.; Davis, S. S.; Sparrow, R. A.; Wilding, I. R. (1993) The effect of meal composition on 5 the gastrocolonic response: implications for drug delivery to the colon. Pharm. Res. 10:722-726. Rademaker, A. W.; Pauloski, B. R.; Colangelo, L. A.; Logemann, J. A. (1998) Age and volume effects on liquid swallowing funciton in normal women. J. Speech Lang. Hear. Res. 41:275-284. 10 Saavedra, J. M.; Brown, K. H.; Nakashima, J. (1989) A new approach to characterize whole-gut transit in infants with use of a nonabsorbable intestinal marker. Am. J. Clin. Nutr. 50:1464-1471. Shafik, A.; Ali, Y. A.; Afifi, R. (1997) Is the rectum a conduit or storage organ. Int. Surg. 82:194-197. 15 Shaw, D. W.; Cook, I. J.; Gabb, M.; Holloway, R. H.; Simula, M. E.; Panagopoulos, V.; Dent, J. (1995) Influence of normal aging on oral-pharyngeal and upper esophageal sphincter function during swallowing. Am. J. Physiol. 268:G389-G396. 20 Sidery, M. B.; Macdonald, I. A.; Blackshaw, P.E. (1994) Superior mesenteric artery blood flow and gastric emptying in humans and the differential effects of high fat and high carbohydrate meals. Gut 35:186-190. Sievers, E.; Oldigs, H.-D.; Schulz-Lell, G.; Schaub, J. (1993) Faecal excretion in infants. Eur. J. 25 Pediatr. 152:452-454. Signer, E. (1975) Gastric emptying in newborns and young infants. Measurement of the rate of emptying using indium-113m-microcolloid. Acta Paediatr. Scand. 64:525-530. 30 Smith, H. L.; Hollins, G. W.; Booth, I. W. (1993) Epigastric impedance recording for measuring gastric emptying in children: how useful is it? J. Pediatr. Gastroenterol. Nutr. 17:201-206. Smith, H. L.; Hollins, G. W.; Booth, I. W.; Weller, P. H. (1990) Gastric emptying of liquids in cystic fibrosis. Acta Univ. Carol. [Med.] (Praha) 36:161-164. 35 Stolovitz, P.; Gisel, E. G. (1991) Circumoral movements in response to three different food textures in children 6 months to 2 years of age. Dysphagia 6:17-25. Stubbs, J. B. (1991) A new mathematical model of gastrointestinal transit that incorporates age- 40 and gender-depedent physiological parameters. In: Proceedings of the Fifth International Symposium on Radiopharmaceutical Dosimetry, Watson, E. E.; Schlafke-Stelson, A., eds. Springfield, Virginia: National Technical Information Service. Stubbs, J. B. (1992) Results from a new mathematical model of gastrointestinal transit that 45 incorporates age and gender-dependent physiological parameters. Radiat. Prot. Dosim. 41:63-69. Suzuki, S. (1987) Experimental studies on the presumption of the time after food intake from stomach contents. Forensic Sci. Int. 35:83-117. 50 Tatsch, K.; Schroettle, W.; Kirsch, C. M. (1991) Multiple swallow test for the quantitative and
Human Alimentary Tract model - Chapter 6 - 15 August 2004
103
qualitative evaluation of esophageal motility disorders. J. Nucl. Med. 32:1365-1370. Tolin, R. D.; Malmud, L. S.; Reilley, J.; Fisher, R. S. (1979) Esophageal scintigraphy to quantitate esophageal transit (quantitation of esophageal transit). Gastroenterology 76:1402-1408. 5 Tougas, G; Chen, Y; Coates, G; Paterson, W; Dallaire, C; Pare, P; Boivin, M; Watier, A; Daniels, S; Diamant, N. (2000) Standardization of a simplified scintigraphic methodology for the assessment of gastric emptying in a multicenter setting. Am J Gastroenterol. 95:78-86. van den Driessche, M.; Peeters, K.; Marien, P.; Ghoos, Y.; Devlieger, H.; Veereman-Wauters, G. 10 (1999) Gastric emptying in formula-fed and breast-fed infants measured with the 13C-octanoic acid breath test. J. Pediatr. Gastroenterol. Nutr. 29:46-51. Vist, G. E.; Maughan, R. J. (1995) The effect of osmolality and carbohydrate content on the rate of gastric emptying of liquids in man. J. Physiol. (Lond.) 486 (Part 2):523-531. 15 Wickwire, N. A.; Gibbs, C. H.; Jacobson, A. P.; Lundeen, H. C. (1981) Chewing patterns in normal children. Angle Ortho. 51:48-60. Wutzke, K. D.; Heine, W. E.; Plath, C.; Leitzmann, P.; Radke, M.; Mohr, C.; Richter, I.; Gulzow, H. 20 U.; Hobusch, D. (1997) Evaluation of oro-coecal transit time: a comparison of the lactose-[13C, 15N]ureide 13CO2- and the lactulose H2-breath test. Eur. J. Clin. Nutr. 51:11-19.
25
Human Alimentary Tract Model- Chapter 7- Morphometry & Dosimetry – 15 August 2004
103
7. MORPHOMETRY AND DOSIMETRY
7.1 Introduction 5
(222) This chapter presents morphometric data for regions of the human alimentary tract
and describes the geometric models used to represent these regions for the purposes of
calculating Absorbed Fractions (AF) and Specific Absorbed Fractions (SAF) for non-
penetrating radiation. It also outlines methods for deriving photon SAF values both for the
alimentary tract and other regions of the body. A mathematical description of the method of 10
age-dependent dose calculation is presented and some example AF and SAF values for
electrons and alpha particles are discussed.
(223) Information is given in this chapter on anatomical parameter values for newborn
infants, 1, 5, 10 and 15 year-old children and adults. The data are consistent with 15
information given in Publication 89 on Basic Anatomical and Physiological Data for use in
Radiological Protection (ICRP, 2002). These data are used to compute values of Specific
Effective Energy (SEE; see section 7.3.1) for the above age groups. SEE values for
intermediate ages are derived by interpolation (linear interpolation by inverse body mass is
usually used). Further information on morphometry is given in Annexes A, B and D. 20
(224) Throughout this Chapter source is used to describe those regions where nuclear
transformations occur, generally the contents of the lumen, or the mucosal layer of the wall
of a region, and target is used to describe regions which contain the radiosensitive cells, ie.
the salivary glands or the wall of a region. 25
7.2. Morphometry 7.2.1. Oral cavity 30
(225) For the purposes of calculating absorbed fractions, the lower portion of the head is
represented by a right circular cylinder which contains the oral cavity, teeth, tongue and
salivary glands. The radius of the cylinder is 6.45 cm and the total height is 13 cm. Within
this cylinder the teeth are represented by a semi-circular arc of internal and external radii
3.6 cm and 4.45 cm respectively. The teeth are assumed to be cubes with sides of 0.85 35
cm, on the basis of data showing variations in tooth height from 0.65 cm to 1.1 cm,
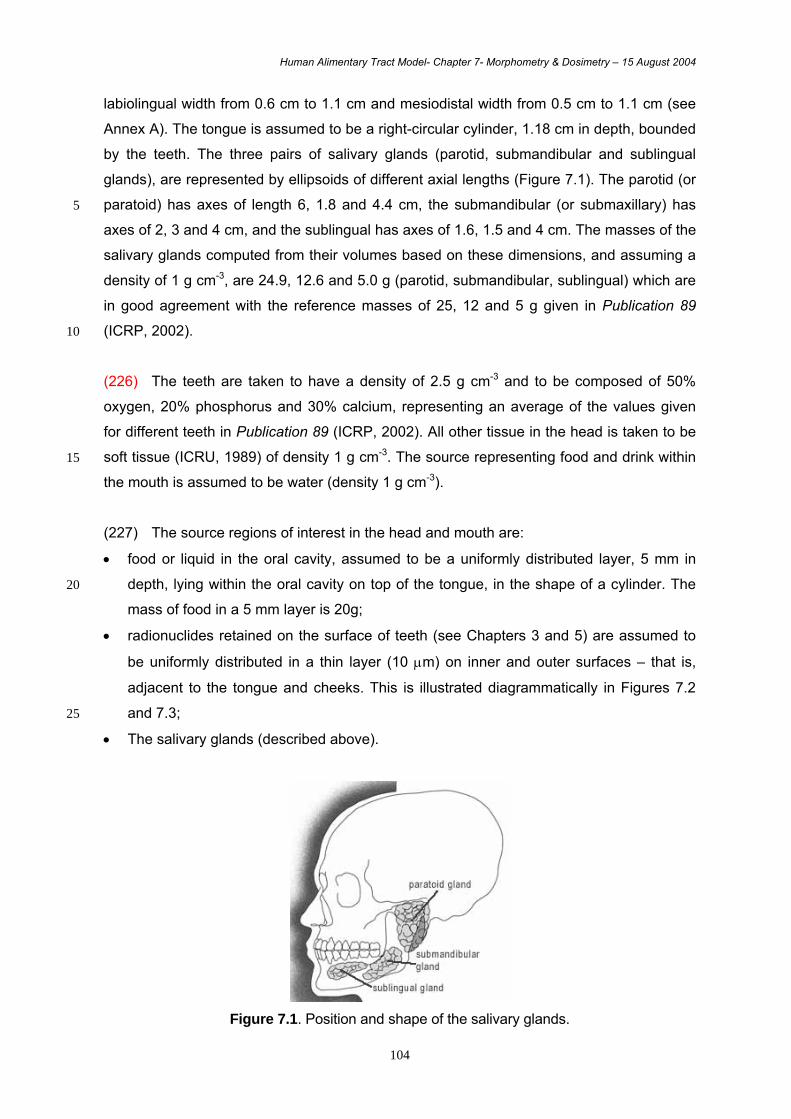
Human Alimentary Tract Model- Chapter 7- Morphometry & Dosimetry – 15 August 2004
104
labiolingual width from 0.6 cm to 1.1 cm and mesiodistal width from 0.5 cm to 1.1 cm (see
Annex A). The tongue is assumed to be a right-circular cylinder, 1.18 cm in depth, bounded
by the teeth. The three pairs of salivary glands (parotid, submandibular and sublingual
glands), are represented by ellipsoids of different axial lengths (Figure 7.1). The parotid (or
paratoid) has axes of length 6, 1.8 and 4.4 cm, the submandibular (or submaxillary) has 5
axes of 2, 3 and 4 cm, and the sublingual has axes of 1.6, 1.5 and 4 cm. The masses of the
salivary glands computed from their volumes based on these dimensions, and assuming a
density of 1 g cm-3, are 24.9, 12.6 and 5.0 g (parotid, submandibular, sublingual) which are
in good agreement with the reference masses of 25, 12 and 5 g given in Publication 89
(ICRP, 2002). 10
(226) The teeth are taken to have a density of 2.5 g cm-3 and to be composed of 50%
oxygen, 20% phosphorus and 30% calcium, representing an average of the values given
for different teeth in Publication 89 (ICRP, 2002). All other tissue in the head is taken to be
soft tissue (ICRU, 1989) of density 1 g cm-3. The source representing food and drink within 15
the mouth is assumed to be water (density 1 g cm-3).
(227) The source regions of interest in the head and mouth are:
• food or liquid in the oral cavity, assumed to be a uniformly distributed layer, 5 mm in
depth, lying within the oral cavity on top of the tongue, in the shape of a cylinder. The 20
mass of food in a 5 mm layer is 20g;
• radionuclides retained on the surface of teeth (see Chapters 3 and 5) are assumed to
be uniformly distributed in a thin layer (10 µm) on inner and outer surfaces – that is,
adjacent to the tongue and cheeks. This is illustrated diagrammatically in Figures 7.2
and 7.3; 25
• The salivary glands (described above).
Figure 7.1. Position and shape of the salivary glands.

Human Alimentary Tract Model- Chapter 7- Morphometry & Dosimetry – 15 August 2004
105
(228) Biokinetic models which identify salivary glands as a source region are unlikely to
specify different uptakes for the different glands. Therefore values of AF are given in this
report for the mass-weighted mean of the three pairs of the salivary glands.
5
(229) The target regions in the mouth and lower head are taken to be:
• the salivary glands;
• the basal cells of the epithelial layer of the tongue, and inner surfaces of the oral cavity.
As illustrated by Figure 2.4, the depth varies substantially within and between different
regions in the mouth, with an overall range of about 70 – 400 µm. For the purposes of 10
this report, the target depth is taken to be a 10 µm layer at from 190 to 200 µm. This
depth is assumed to apply to all age groups. In situations where information is available
on retention of radionuclides in the oral mucosa, it is assumed for dosimetric purposes
that the source region has activity uniformly distributed within a 200 µm thick layer of
the epithelia of the oral cavity and tongue. 15
Figure 7.2. The geometric model (cross-section) used to calculate values of Absorbed Fraction (AF) in the head and mouth, showing the source region of radionuclides in diet in relation to target regions in the tongue, and epithelial lining of the mouth. 20
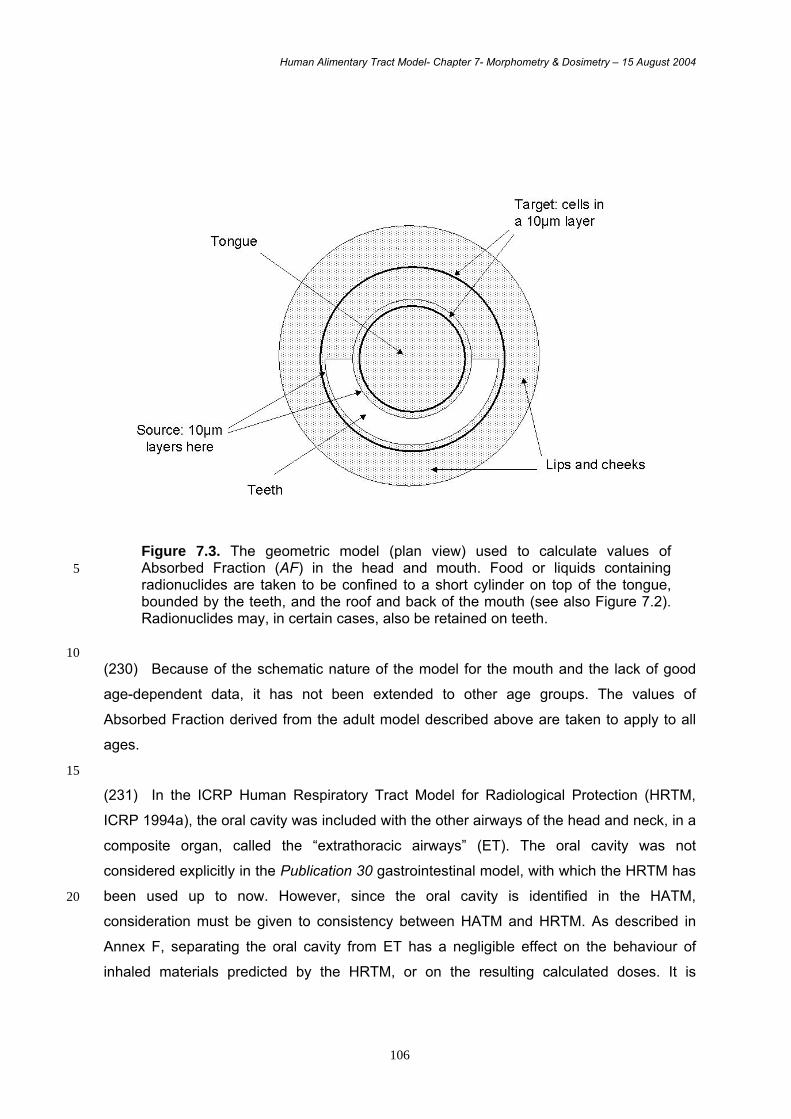
Human Alimentary Tract Model- Chapter 7- Morphometry & Dosimetry – 15 August 2004
106
Figure 7.3. The geometric model (plan view) used to calculate values of Absorbed Fraction (AF) in the head and mouth. Food or liquids containing 5 radionuclides are taken to be confined to a short cylinder on top of the tongue, bounded by the teeth, and the roof and back of the mouth (see also Figure 7.2). Radionuclides may, in certain cases, also be retained on teeth.
10 (230) Because of the schematic nature of the model for the mouth and the lack of good
age-dependent data, it has not been extended to other age groups. The values of
Absorbed Fraction derived from the adult model described above are taken to apply to all
ages.
15
(231) In the ICRP Human Respiratory Tract Model for Radiological Protection (HRTM,
ICRP 1994a), the oral cavity was included with the other airways of the head and neck, in a
composite organ, called the “extrathoracic airways” (ET). The oral cavity was not
considered explicitly in the Publication 30 gastrointestinal model, with which the HRTM has
been used up to now. However, since the oral cavity is identified in the HATM, 20
consideration must be given to consistency between HATM and HRTM. As described in
Annex F, separating the oral cavity from ET has a negligible effect on the behaviour of
inhaled materials predicted by the HRTM, or on the resulting calculated doses. It is
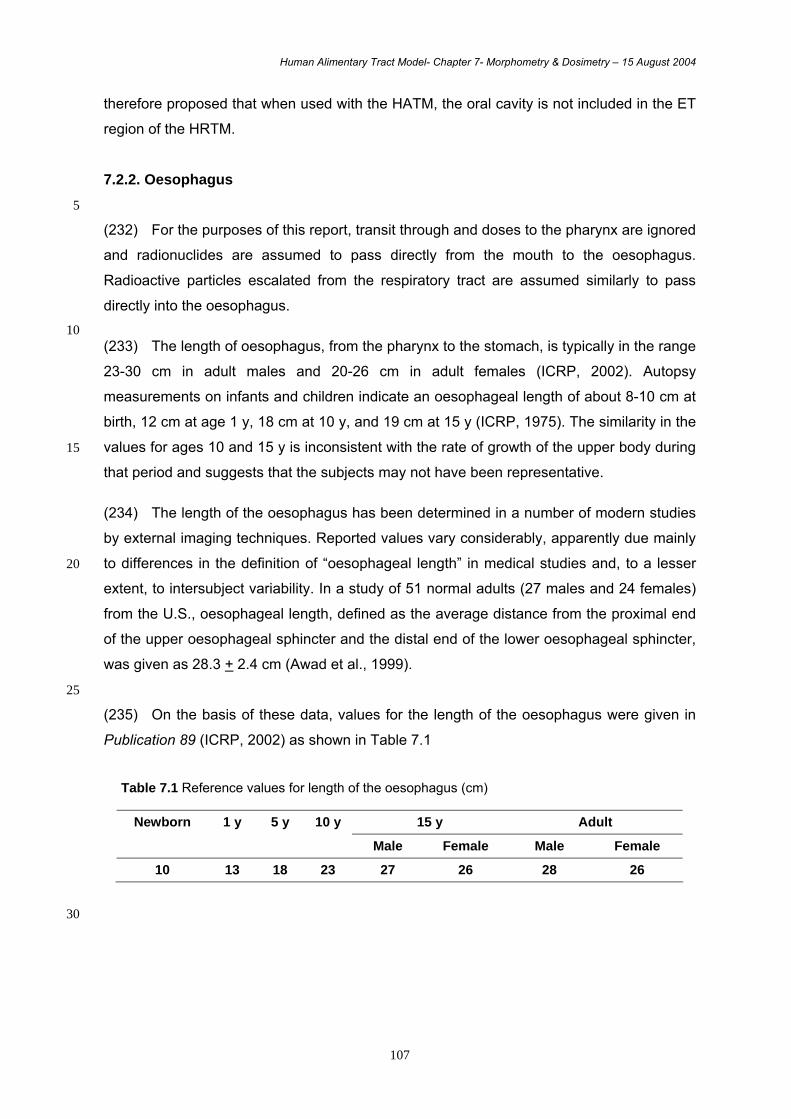
Human Alimentary Tract Model- Chapter 7- Morphometry & Dosimetry – 15 August 2004
107
therefore proposed that when used with the HATM, the oral cavity is not included in the ET
region of the HRTM.
7.2.2. Oesophagus
5
(232) For the purposes of this report, transit through and doses to the pharynx are ignored
and radionuclides are assumed to pass directly from the mouth to the oesophagus.
Radioactive particles escalated from the respiratory tract are assumed similarly to pass
directly into the oesophagus. 10 (233) The length of oesophagus, from the pharynx to the stomach, is typically in the range
23-30 cm in adult males and 20-26 cm in adult females (ICRP, 2002). Autopsy
measurements on infants and children indicate an oesophageal length of about 8-10 cm at
birth, 12 cm at age 1 y, 18 cm at 10 y, and 19 cm at 15 y (ICRP, 1975). The similarity in the
values for ages 10 and 15 y is inconsistent with the rate of growth of the upper body during 15
that period and suggests that the subjects may not have been representative. (234) The length of the oesophagus has been determined in a number of modern studies
by external imaging techniques. Reported values vary considerably, apparently due mainly
to differences in the definition of “oesophageal length” in medical studies and, to a lesser 20
extent, to intersubject variability. In a study of 51 normal adults (27 males and 24 females)
from the U.S., oesophageal length, defined as the average distance from the proximal end
of the upper oesophageal sphincter and the distal end of the lower oesophageal sphincter,
was given as 28.3 + 2.4 cm (Awad et al., 1999).
25
(235) On the basis of these data, values for the length of the oesophagus were given in
Publication 89 (ICRP, 2002) as shown in Table 7.1
Table 7.1 Reference values for length of the oesophagus (cm)
Newborn 1 y 5 y 10 y 15 y Adult
Male Female Male Female
10 13 18 23 27 26 28 26
30
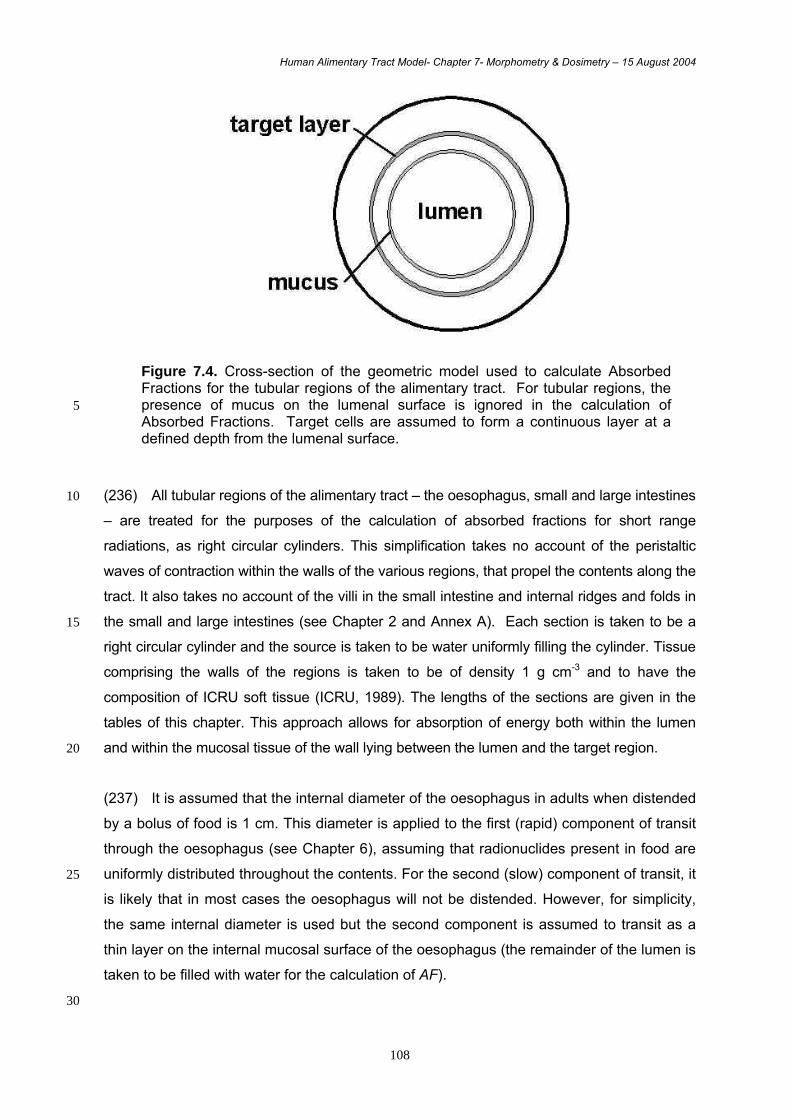
Human Alimentary Tract Model- Chapter 7- Morphometry & Dosimetry – 15 August 2004
108
Figure 7.4. Cross-section of the geometric model used to calculate Absorbed Fractions for the tubular regions of the alimentary tract. For tubular regions, the presence of mucus on the lumenal surface is ignored in the calculation of 5 Absorbed Fractions. Target cells are assumed to form a continuous layer at a defined depth from the lumenal surface.
(236) All tubular regions of the alimentary tract – the oesophagus, small and large intestines 10
– are treated for the purposes of the calculation of absorbed fractions for short range
radiations, as right circular cylinders. This simplification takes no account of the peristaltic
waves of contraction within the walls of the various regions, that propel the contents along the
tract. It also takes no account of the villi in the small intestine and internal ridges and folds in
the small and large intestines (see Chapter 2 and Annex A). Each section is taken to be a 15
right circular cylinder and the source is taken to be water uniformly filling the cylinder. Tissue
comprising the walls of the regions is taken to be of density 1 g cm-3 and to have the
composition of ICRU soft tissue (ICRU, 1989). The lengths of the sections are given in the
tables of this chapter. This approach allows for absorption of energy both within the lumen
and within the mucosal tissue of the wall lying between the lumen and the target region. 20
(237) It is assumed that the internal diameter of the oesophagus in adults when distended
by a bolus of food is 1 cm. This diameter is applied to the first (rapid) component of transit
through the oesophagus (see Chapter 6), assuming that radionuclides present in food are
uniformly distributed throughout the contents. For the second (slow) component of transit, it 25
is likely that in most cases the oesophagus will not be distended. However, for simplicity,
the same internal diameter is used but the second component is assumed to transit as a
thin layer on the internal mucosal surface of the oesophagus (the remainder of the lumen is
taken to be filled with water for the calculation of AF).
30
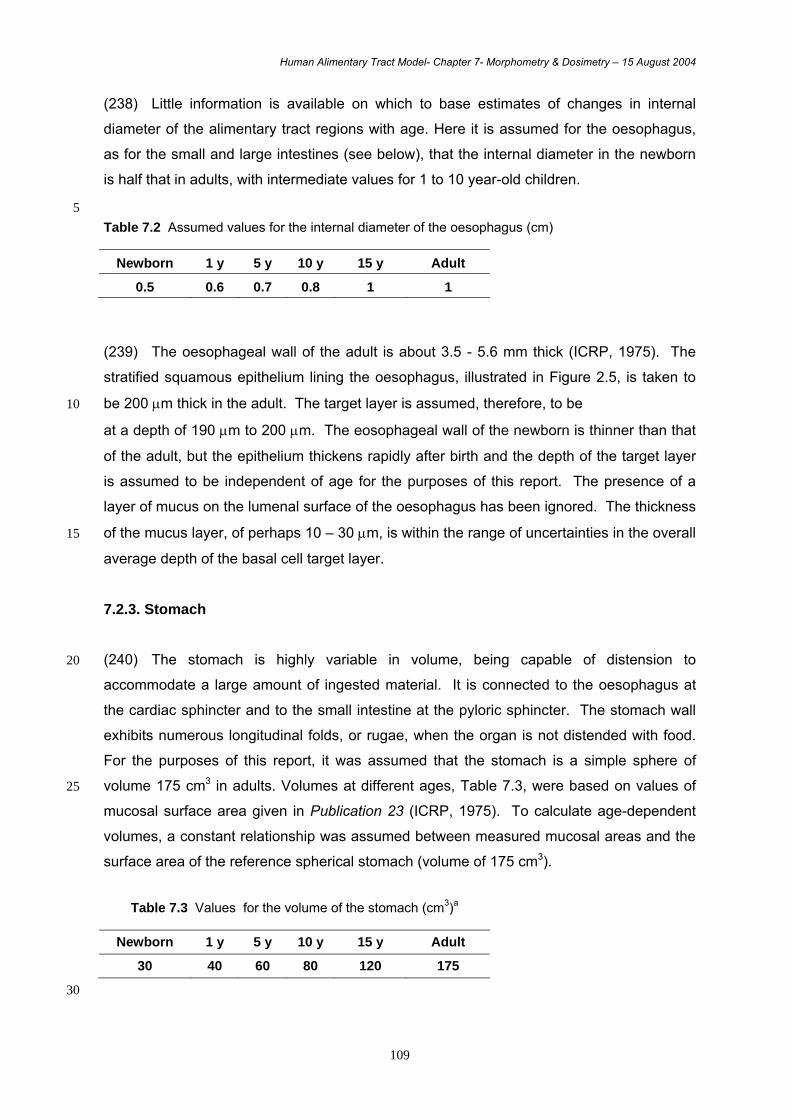
Human Alimentary Tract Model- Chapter 7- Morphometry & Dosimetry – 15 August 2004
109
(238) Little information is available on which to base estimates of changes in internal
diameter of the alimentary tract regions with age. Here it is assumed for the oesophagus,
as for the small and large intestines (see below), that the internal diameter in the newborn
is half that in adults, with intermediate values for 1 to 10 year-old children.
5 Table 7.2 Assumed values for the internal diameter of the oesophagus (cm)
Newborn 1 y 5 y 10 y 15 y Adult
0.5 0.6 0.7 0.8 1 1
(239) The oesophageal wall of the adult is about 3.5 - 5.6 mm thick (ICRP, 1975). The
stratified squamous epithelium lining the oesophagus, illustrated in Figure 2.5, is taken to
be 200 µm thick in the adult. The target layer is assumed, therefore, to be 10
at a depth of 190 µm to 200 µm. The eosophageal wall of the newborn is thinner than that
of the adult, but the epithelium thickens rapidly after birth and the depth of the target layer
is assumed to be independent of age for the purposes of this report. The presence of a
layer of mucus on the lumenal surface of the oesophagus has been ignored. The thickness
of the mucus layer, of perhaps 10 – 30 µm, is within the range of uncertainties in the overall 15
average depth of the basal cell target layer.
7.2.3. Stomach (240) The stomach is highly variable in volume, being capable of distension to 20
accommodate a large amount of ingested material. It is connected to the oesophagus at
the cardiac sphincter and to the small intestine at the pyloric sphincter. The stomach wall
exhibits numerous longitudinal folds, or rugae, when the organ is not distended with food.
For the purposes of this report, it was assumed that the stomach is a simple sphere of
volume 175 cm3 in adults. Volumes at different ages, Table 7.3, were based on values of 25
mucosal surface area given in Publication 23 (ICRP, 1975). To calculate age-dependent
volumes, a constant relationship was assumed between measured mucosal areas and the
surface area of the reference spherical stomach (volume of 175 cm3).
Table 7.3 Values for the volume of the stomach (cm3)a
Newborn 1 y 5 y 10 y 15 y Adult
30 40 60 80 120 175 30
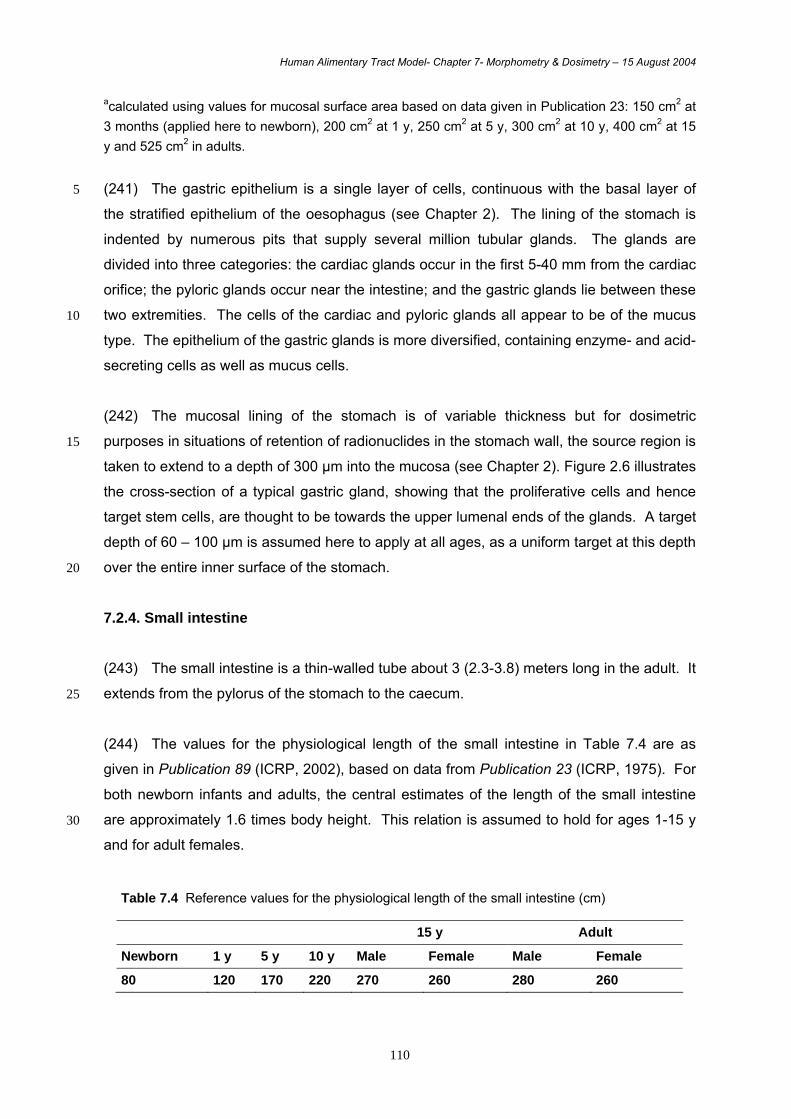
Human Alimentary Tract Model- Chapter 7- Morphometry & Dosimetry – 15 August 2004
110
acalculated using values for mucosal surface area based on data given in Publication 23: 150 cm2 at 3 months (applied here to newborn), 200 cm2 at 1 y, 250 cm2 at 5 y, 300 cm2 at 10 y, 400 cm2 at 15 y and 525 cm2 in adults.
(241) The gastric epithelium is a single layer of cells, continuous with the basal layer of 5
the stratified epithelium of the oesophagus (see Chapter 2). The lining of the stomach is
indented by numerous pits that supply several million tubular glands. The glands are
divided into three categories: the cardiac glands occur in the first 5-40 mm from the cardiac
orifice; the pyloric glands occur near the intestine; and the gastric glands lie between these
two extremities. The cells of the cardiac and pyloric glands all appear to be of the mucus 10
type. The epithelium of the gastric glands is more diversified, containing enzyme- and acid-
secreting cells as well as mucus cells.
(242) The mucosal lining of the stomach is of variable thickness but for dosimetric
purposes in situations of retention of radionuclides in the stomach wall, the source region is 15
taken to extend to a depth of 300 µm into the mucosa (see Chapter 2). Figure 2.6 illustrates
the cross-section of a typical gastric gland, showing that the proliferative cells and hence
target stem cells, are thought to be towards the upper lumenal ends of the glands. A target
depth of 60 – 100 µm is assumed here to apply at all ages, as a uniform target at this depth
over the entire inner surface of the stomach. 20
7.2.4. Small intestine (243) The small intestine is a thin-walled tube about 3 (2.3-3.8) meters long in the adult. It
extends from the pylorus of the stomach to the caecum. 25
(244) The values for the physiological length of the small intestine in Table 7.4 are as
given in Publication 89 (ICRP, 2002), based on data from Publication 23 (ICRP, 1975). For
both newborn infants and adults, the central estimates of the length of the small intestine
are approximately 1.6 times body height. This relation is assumed to hold for ages 1-15 y 30
and for adult females.
Table 7.4 Reference values for the physiological length of the small intestine (cm)
15 y Adult
Newborn 1 y 5 y 10 y Male Female Male Female
80 120 170 220 270 260 280 260
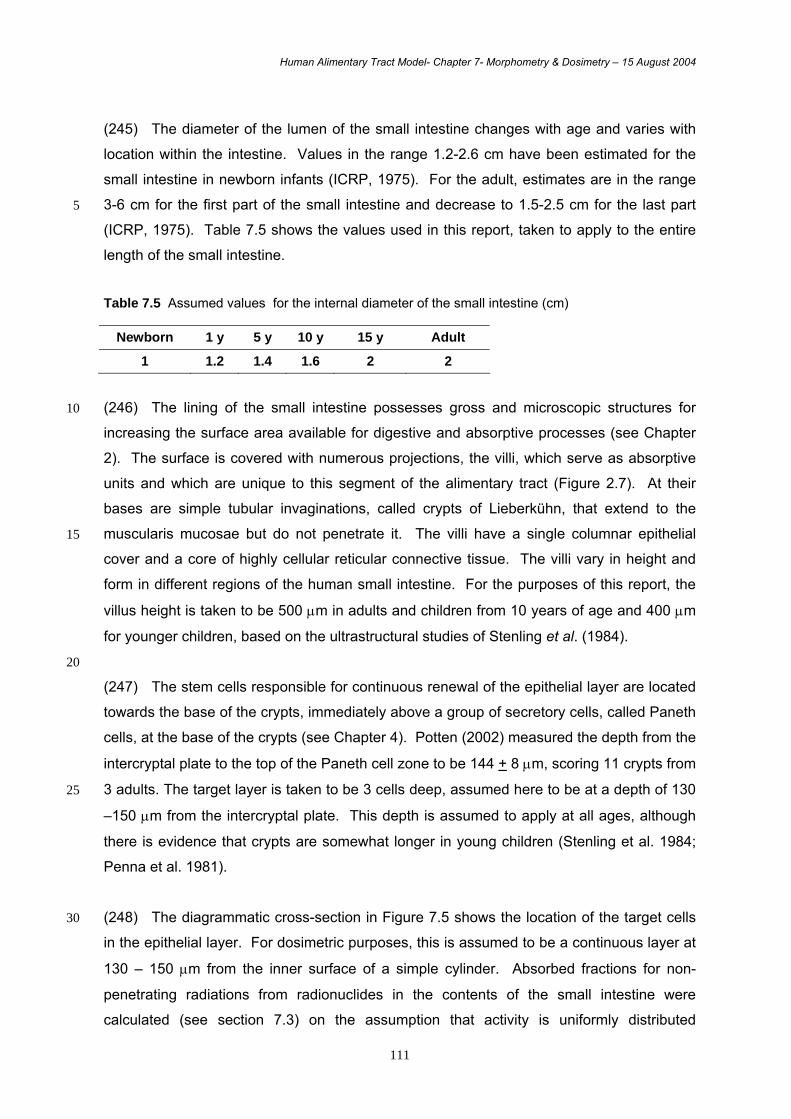
Human Alimentary Tract Model- Chapter 7- Morphometry & Dosimetry – 15 August 2004
111
(245) The diameter of the lumen of the small intestine changes with age and varies with
location within the intestine. Values in the range 1.2-2.6 cm have been estimated for the
small intestine in newborn infants (ICRP, 1975). For the adult, estimates are in the range
3-6 cm for the first part of the small intestine and decrease to 1.5-2.5 cm for the last part 5
(ICRP, 1975). Table 7.5 shows the values used in this report, taken to apply to the entire
length of the small intestine.
Table 7.5 Assumed values for the internal diameter of the small intestine (cm)
Newborn 1 y 5 y 10 y 15 y Adult
1 1.2 1.4 1.6 2 2
(246) The lining of the small intestine possesses gross and microscopic structures for 10
increasing the surface area available for digestive and absorptive processes (see Chapter
2). The surface is covered with numerous projections, the villi, which serve as absorptive
units and which are unique to this segment of the alimentary tract (Figure 2.7). At their
bases are simple tubular invaginations, called crypts of Lieberkühn, that extend to the
muscularis mucosae but do not penetrate it. The villi have a single columnar epithelial 15
cover and a core of highly cellular reticular connective tissue. The villi vary in height and
form in different regions of the human small intestine. For the purposes of this report, the
villus height is taken to be 500 µm in adults and children from 10 years of age and 400 µm
for younger children, based on the ultrastructural studies of Stenling et al. (1984).
20
(247) The stem cells responsible for continuous renewal of the epithelial layer are located
towards the base of the crypts, immediately above a group of secretory cells, called Paneth
cells, at the base of the crypts (see Chapter 4). Potten (2002) measured the depth from the
intercryptal plate to the top of the Paneth cell zone to be 144 + 8 µm, scoring 11 crypts from
3 adults. The target layer is taken to be 3 cells deep, assumed here to be at a depth of 130 25
–150 µm from the intercryptal plate. This depth is assumed to apply at all ages, although
there is evidence that crypts are somewhat longer in young children (Stenling et al. 1984;
Penna et al. 1981).
(248) The diagrammatic cross-section in Figure 7.5 shows the location of the target cells 30
in the epithelial layer. For dosimetric purposes, this is assumed to be a continuous layer at
130 – 150 µm from the inner surface of a simple cylinder. Absorbed fractions for non-
penetrating radiations from radionuclides in the contents of the small intestine were
calculated (see section 7.3) on the assumption that activity is uniformly distributed
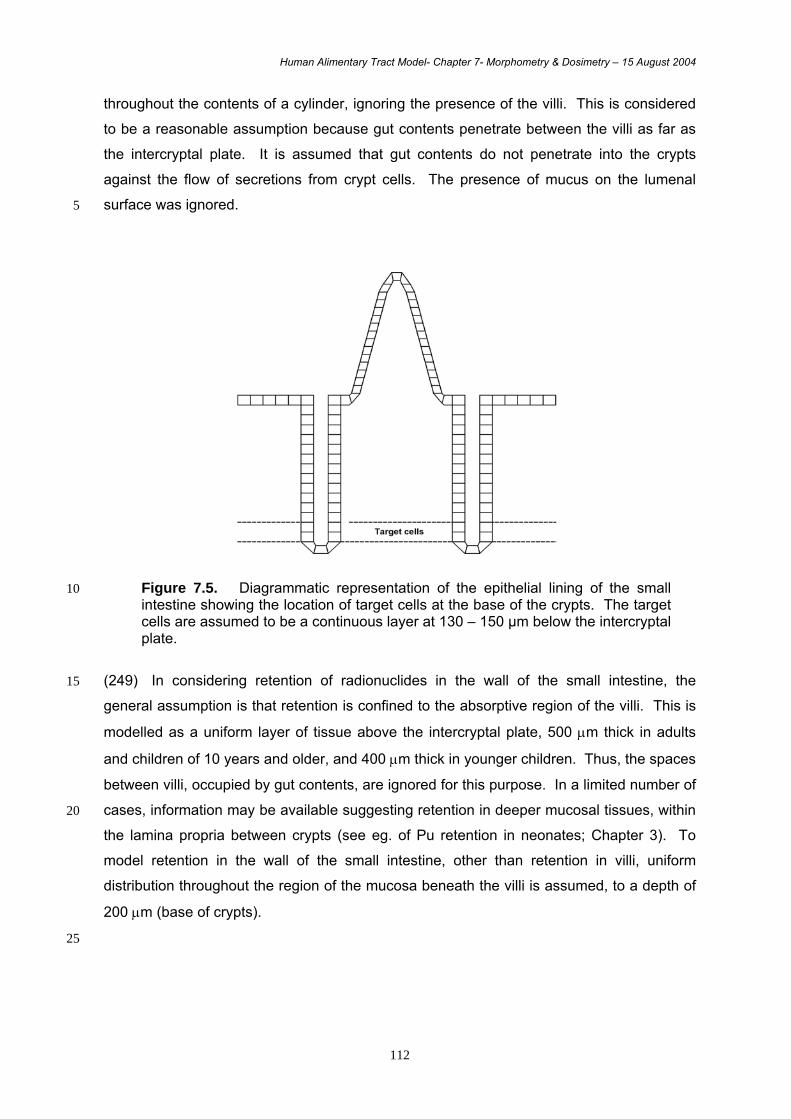
Human Alimentary Tract Model- Chapter 7- Morphometry & Dosimetry – 15 August 2004
112
throughout the contents of a cylinder, ignoring the presence of the villi. This is considered
to be a reasonable assumption because gut contents penetrate between the villi as far as
the intercryptal plate. It is assumed that gut contents do not penetrate into the crypts
against the flow of secretions from crypt cells. The presence of mucus on the lumenal
surface was ignored. 5
Figure 7.5. Diagrammatic representation of the epithelial lining of the small 10 intestine showing the location of target cells at the base of the crypts. The target cells are assumed to be a continuous layer at 130 – 150 µm below the intercryptal plate.
(249) In considering retention of radionuclides in the wall of the small intestine, the 15
general assumption is that retention is confined to the absorptive region of the villi. This is
modelled as a uniform layer of tissue above the intercryptal plate, 500 µm thick in adults
and children of 10 years and older, and 400 µm thick in younger children. Thus, the spaces
between villi, occupied by gut contents, are ignored for this purpose. In a limited number of
cases, information may be available suggesting retention in deeper mucosal tissues, within 20
the lamina propria between crypts (see eg. of Pu retention in neonates; Chapter 3). To
model retention in the wall of the small intestine, other than retention in villi, uniform
distribution throughout the region of the mucosa beneath the villi is assumed, to a depth of
200 µm (base of crypts).
25
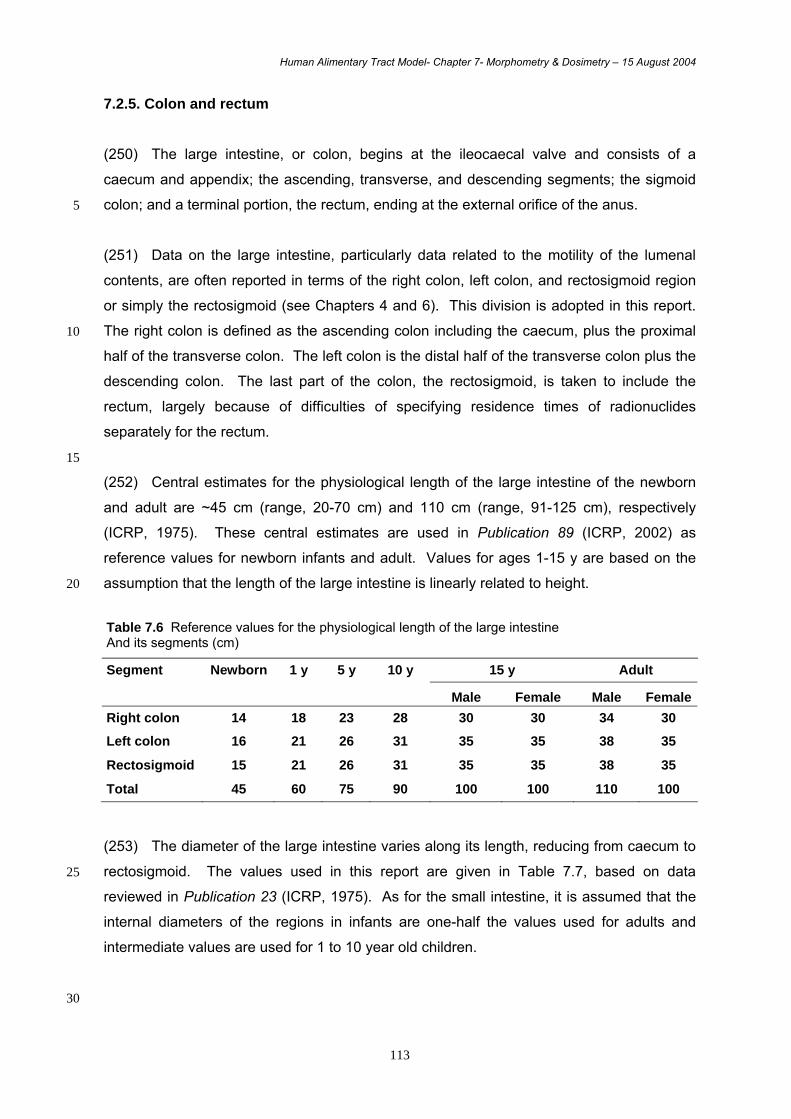
Human Alimentary Tract Model- Chapter 7- Morphometry & Dosimetry – 15 August 2004
113
7.2.5. Colon and rectum (250) The large intestine, or colon, begins at the ileocaecal valve and consists of a
caecum and appendix; the ascending, transverse, and descending segments; the sigmoid
colon; and a terminal portion, the rectum, ending at the external orifice of the anus. 5
(251) Data on the large intestine, particularly data related to the motility of the lumenal
contents, are often reported in terms of the right colon, left colon, and rectosigmoid region
or simply the rectosigmoid (see Chapters 4 and 6). This division is adopted in this report.
The right colon is defined as the ascending colon including the caecum, plus the proximal 10
half of the transverse colon. The left colon is the distal half of the transverse colon plus the
descending colon. The last part of the colon, the rectosigmoid, is taken to include the
rectum, largely because of difficulties of specifying residence times of radionuclides
separately for the rectum.
15
(252) Central estimates for the physiological length of the large intestine of the newborn
and adult are ~45 cm (range, 20-70 cm) and 110 cm (range, 91-125 cm), respectively
(ICRP, 1975). These central estimates are used in Publication 89 (ICRP, 2002) as
reference values for newborn infants and adult. Values for ages 1-15 y are based on the
assumption that the length of the large intestine is linearly related to height. 20
Table 7.6 Reference values for the physiological length of the large intestine And its segments (cm)
Segment Newborn 1 y 5 y 10 y 15 y Adult
Male Female Male FemaleRight colon 14 18 23 28 30 30 34 30
Left colon 16 21 26 31 35 35 38 35
Rectosigmoid 15 21 26 31 35 35 38 35
Total 45 60 75 90 100 100 110 100 (253) The diameter of the large intestine varies along its length, reducing from caecum to
rectosigmoid. The values used in this report are given in Table 7.7, based on data 25
reviewed in Publication 23 (ICRP, 1975). As for the small intestine, it is assumed that the
internal diameters of the regions in infants are one-half the values used for adults and
intermediate values are used for 1 to 10 year old children.
30
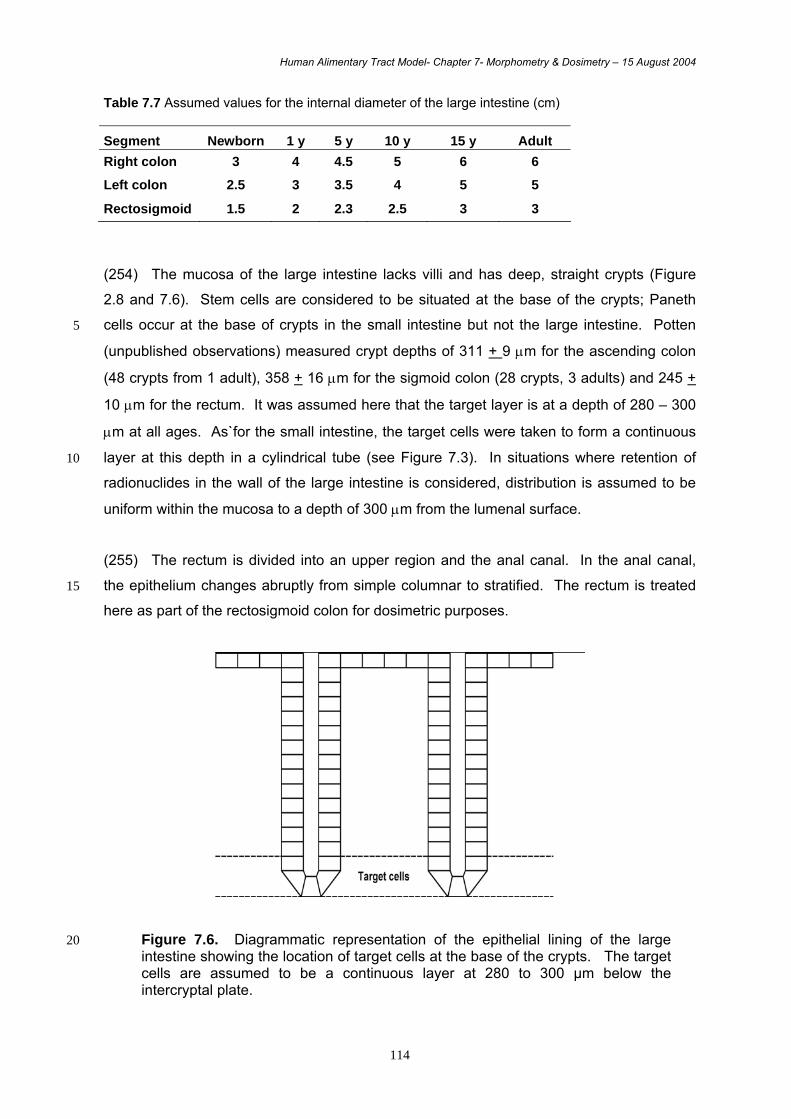
Human Alimentary Tract Model- Chapter 7- Morphometry & Dosimetry – 15 August 2004
114
Table 7.7 Assumed values for the internal diameter of the large intestine (cm) Segment Newborn 1 y 5 y 10 y 15 y Adult Right colon 3 4 4.5 5 6 6
Left colon 2.5 3 3.5 4 5 5
Rectosigmoid 1.5 2 2.3 2.5 3 3
(254) The mucosa of the large intestine lacks villi and has deep, straight crypts (Figure
2.8 and 7.6). Stem cells are considered to be situated at the base of the crypts; Paneth
cells occur at the base of crypts in the small intestine but not the large intestine. Potten 5
(unpublished observations) measured crypt depths of 311 + 9 µm for the ascending colon
(48 crypts from 1 adult), 358 + 16 µm for the sigmoid colon (28 crypts, 3 adults) and 245 +
10 µm for the rectum. It was assumed here that the target layer is at a depth of 280 – 300
µm at all ages. As`for the small intestine, the target cells were taken to form a continuous
layer at this depth in a cylindrical tube (see Figure 7.3). In situations where retention of 10
radionuclides in the wall of the large intestine is considered, distribution is assumed to be
uniform within the mucosa to a depth of 300 µm from the lumenal surface.
(255) The rectum is divided into an upper region and the anal canal. In the anal canal,
the epithelium changes abruptly from simple columnar to stratified. The rectum is treated 15
here as part of the rectosigmoid colon for dosimetric purposes.
Figure 7.6. Diagrammatic representation of the epithelial lining of the large 20 intestine showing the location of target cells at the base of the crypts. The target cells are assumed to be a continuous layer at 280 to 300 µm below the intercryptal plate.
Human Alimentary Tract Model- Chapter 7- Morphometry & Dosimetry – 15 August 2004
115
7.3. Dosimetry
(256) This section gives an overview of the dosimetric methods used in this report, explains
how the Absorbed Fractions (AF) and Specific Absorbed Fractions (SAF) used in the HAT 5
model have been computed from the geometric models described in section 7.2, and
compares some of the HATM SAF values with Publication 30 model values (ICRP, 1979).
7.3.1. Dosimetric Principles 10
(257) To evaluate doses to target tissues, the methods of age-dependent dosimetry first
described in Publication 56 (ICRP, 1989) are applied. In short, the committed equivalent
dose, HT, in each target tissue, T, is determined by
- the total number of nuclear transformations of each radionuclide of the decay chain in
the source regions, S, over a period τ after intake of the radionuclide, τ in general 15
being 50 years for adults and from the time of intake to age 70 years for children;
- the energy absorbed per unit mass in the target tissue, T, suitably modified by the
radiation weighting factor for each type of radiation emitted per nuclear
transformation.
20
The equivalent dose rate, )0t(t,T.
H at age t resulting from an intake at age t0, in target tissue
T can be expressed as
∑∑ ←⋅=S j jt)S;SEE(T)0t(t,jS,qc)0t(t,
.TH (1)
where qS,j(t,t0) is the activity of decay chain member j present in the source region S at age t
after an intake at age t0; SEE(T←S;t)j is the equivalent dose in the target tissue T per nuclear 25
transformation in region S at age t for radionuclide j (equation 3); and c is any numerical
constant required by the units of q and SEE.
(258) The committed equivalent dose in the target tissue T accumulated by age 70 y due to
a single intake of a radionuclide at age t0, HT(70-t0) is: 30
∫ ∑∑ ←⋅⋅=∫=−70
ot S jdtjt)S;SEE(T)0t(t,jS,qc)dt0t(t,
70
0tTH)0t(70TH & (2)
Where j > 1 are potential members of the decay chain headed by the radionuclide.
Human Alimentary Tract Model- Chapter 7- Morphometry & Dosimetry – 15 August 2004
116
(259) For each radionuclide, the specific effective energy, SEE, at age t takes into account
the contributions of each radiation emitted by the radionuclide weighted by the appropriate
radiation weighting factor. The SEE quantity of Equations 1 and 2 is computed as:
5
⎥⎦
⎤⎢⎣
⎡←∫
∞←∑
←
dE ) t E, ;S (TAF E (E)Y 0
w β R, + ) t , Ei ;S T (AF w i R, Y i Ei i
) t ( MT
1
= ) t ;S T (SEE (3)
where Ei is the energy of the i-th discrete radiation emitted by the radionuclide with intensity
Yi per nuclear transformation, MT(t) is the mass of the target tissue T at age t, wR,i is the
radiation weighting factor applicable to the i-th radiation, AF (T<-S; Ei, t) is the absorbed 10
fraction quantity representing the fraction of the energy Ei emitted in S that is absorbed in T
for an individual of age t, and Y (E) dE denotes the number of electrons in the beta or
positron spectrum, with energy between E and E + dE. Information on the energies and
intensities of the radiations emitted by the radionuclides considered here are contained in
Publication 38 (ICRP, 1983) and are available, including the beta spectra, in electronic form 15
(Eckerman et al., 1994). The quotient of absorbed fraction, AF, and mass, MT, is known as
the Specific Absorbed Fraction (SAF). Information in the literature is often available,
particularly for photons, in terms of SAF rather than AF.
(260) In the HATM, doses are calculated separately for the right colon, the left colon, and 20
the rectosigmoid section. Chapter 4 concludes that the relative risk of radiation effects is not
significantly different in these three regions of the colon. Therefore, in this report, the dose
coefficient for colon to be used in conjunction with the tissue weighting factor (wT) given for
colon (ICRP, 1991) is calculated as the mass-weighted average of the dose coefficients for
the three sections of the colon, i.e. 25
rsmlcmrcmrshrsmlchlcmrchrcm
colonh++++
=
Where hT and mT are the equivalent dose coefficients for, and mass of, section T of the
colon, and rc, lc and rs denote right colon, left colon and rectosigmoid respectively.
30
7.3.2. Absorbed Fractions for photons (261) Absorbed Fractions (AF) and Specific Absorbed Fractions (SAF) for photons are
calculated using computer models of the human body. The Medical Internal Radiation
Human Alimentary Tract Model- Chapter 7- Morphometry & Dosimetry – 15 August 2004
117
Committee (MIRD) of the US Society of Nuclear Medicine developed a phantom in which
organs were represented as simple mathematical shapes such as spheres, ellipses and
cones (Snyder et al., 1969). This phantom and its later derivatives (Cristy and Eckerman,
1987, 1993, Stabin et al., 1995), collectively known as MIRD-type phantoms, have been
used to calculate photon values of SAF for previous ICRP dose compendia (ICRP 1994, 5
1996, 2001). Recently, however, a new type of phantom has become available which offers
the prospect of increased realism and accuracy in dose calculations. These phantoms are
based on computed tomography (CT) or magnetic resonance images (MRI) obtained from
high resolution scans of individuals. They consist of a large number of volume elements
known as voxels (volume pixels), and are usually known as voxel phantoms. 10
(262) This development began about 15 years ago and a number of laboratories around
the world have developed voxel phantoms for both males (Dimbylow, 1997; Zankl and
Wittman, 2001; Zubal et al., 1994; Saito et al., 2001; Petoussi-Henss et al., 2002; Xu et al.,
2000) and females (Fill et al., 2004). Some of these phantoms have already been used for 15
internal dosimetry (Chao and Xu, 2001; Smith et al., 2001; Zankl et al., 2003; Fill et al.,
2004).
(263) Voxel phantoms can provide more anatomically realistic models than the MIRD-type
phantoms. However, a voxel phantom is a model of an individual person while, for 20
calculating doses for application to population groups, models that are typical of average
male and female members of the population are required. There are a number of
approaches to deriving a typical phantom from an original individual-specific model. One
such method is to change the dimensions of the original voxels (Dimbylow, 1997; Chao et
al., 2001, Fill et al., 2004), another is to add or subtract layers of voxels to a region. Work is 25
in progress (Zankl et al., 2003; Fill et al., 2004) to produce reference voxel models for
radiation protection purposes. It is expected that these models will include the anatomical
regions associated with the HATM. Thus, in the planned future application of the HATM to
a range of radionuclides, results from the reference voxel models will be used to calculate
photon doses, and information concerning the use of the HATM in conjunction with the 30
voxel phantom will be given at that time. For the illustrative calculations given in this report,
results from Cristy and Eckerman (1993) based on MIRD-type phantoms have been used.
7.3.3. Absorbed Fractions for electrons 35
(264) Absorbed Fractions for electrons have been computed using the geometric models,
described in Section 7.2, which specify the source and target regions for each region of the
Human Alimentary Tract Model- Chapter 7- Morphometry & Dosimetry – 15 August 2004
118
HATM. Activity in any source region is taken to be distributed uniformly within the region. The
mass of each target region is computed from the dimensions of the geometric model and the
depth and thickness of the target region (Table 7.8); a tissue density of 1 g cm-3 is assumed
(other than for teeth, see section 7.2.1).
5
(265) Absorbed Fractions for electrons have been calculated using the MCNP General
Purpose Monte Carlo Code (Briesmeister, 1997). The simplified geometric models used in
this report (section 7.2) to represent the various regions of the alimentary tract are specified
in MCNP. A large number of computer simulations of electron transport throughout the
geometric model is then carried out for a discrete initial energy using the condensed history 10
technique (Berger, 1963). The theories of Goudsmit-Saunderson (1940) and Landau (1944)
are used to predict the angular deflections and energy losses, respectively. More details
about MCNP are given by Briesmeister (1997). The total energy deposited in the target
region for all simulations is computed and the Absorbed Fraction is this energy divided by the
total initial energy summed over all the simulations. The calculation is repeated for a number 15
of energies; results for adult males are given in Annex G. Results for females and other age-
groups will be given in future reports. The results calculated for electrons are applied to beta
particles and positrons as well as to mono-energetic electrons.
Table 7.8. Summary of target cells depths and masses for target each region of the HATM 20
for adult males.
Region Target cell
depth (µm)
Target cell
massa (g)
Oral cavity 190-200 0.23
Oesophagus 190-200 0.091
Stomach 60-100 0.62
Small intestine 130-150 3.6
Right colon 280-300 1.3
Left colon 280-300 1.2
Recto-sigmoid 280-300 0.73
a - computed from the length and diameter of each section (or radius for stomach) and the depth and thickness of the target cells, assuming a tissue density of 1 g cm-3 .
(266) In cases where the source is a ‘wall region’ the above approach is also used. For
sections other than the small intestine, activity in the wall is taken to be uniformly distributed 25
Human Alimentary Tract Model- Chapter 7- Morphometry & Dosimetry – 15 August 2004
119
throughout the mucosal layer of the section (see section 7.2). For activity in the small
intestine wall, the general assumption is of uniform distribution throughout a layer
corresponding to the villi (section 7.2.4). The illustrative calculations given in this report
require values of AF only for the wall of the small intestine. These are therefore given in
Annex G for adult males; results for walls of all regions will be given in future reports, for 5
males and females and for all age-groups.
(267) Many of the systemic kinetic models used to describe the behaviour of activity
following absorption from the alimentary or respiratory tracts specify retention in ‘other
tissues’ or ‘other soft tissues’; other systemic models specify whole body distribution. In each 10
of these cases, the walls of the HATM regions are included as source regions, taking account
of normal processes of circulation and distribution of systemic activity. Thus, the target
regions of the HATM can receive doses from this activity as well as from activity in the
contents of the lumen or retained in the walls during absorption. For non-penetrating
radiation, including electrons and alpha particles, all tissues that constitute ‘other tissues’ (or 15
‘other soft tissues’ or ‘whole body’) are assigned the same dose; this dose is taken to apply to
the all target regions of the HATM. For the compartments of relatively rapid transit, such as
the mouth and oesophagus, systemic activity often contributes the main component of dose.
Examples 20
(268) These examples consider values of SAF in adult males to allow direct comparison
with SAF values given in Publication 30 (ICRP, 1979). Figure 7.7 shows the variation of SAF
with electron energy for the source ‘stomach contents’ and the target region in the stomach
wall. Above about 0.5 MeV the SAF of the HAT model is about 25% larger than the energy-25
independent Publication 30 value, but decreases rapidly to much smaller values at low
energies. The two approaches yield reasonably similar values of SAF, at least at moderate
to high energies, because the assumed position of the target cells is relatively shallow in the
stomach (depth of 60-100 µm) and the mass of the stomach contents used in the Publication
30 model is similar to that used in the HATM. 30
(269) Figure 7.8 shows the variation of SAF with electron energy for the source ‘right colon’
and compares results with Publication 30 value for the most anatomically similar region
(‘upper large intestine’, ULI). Above about 1 MeV the value calculated for the HATM is about
a factor of five lower than the Publication 30 value. The Publication 30 method effectively 35
calculated a dose at the surface of the contents of the lumen and applied this to the target
cells in the wall. A relatively low mass of the ULI contents (220 g) was used in the Publication
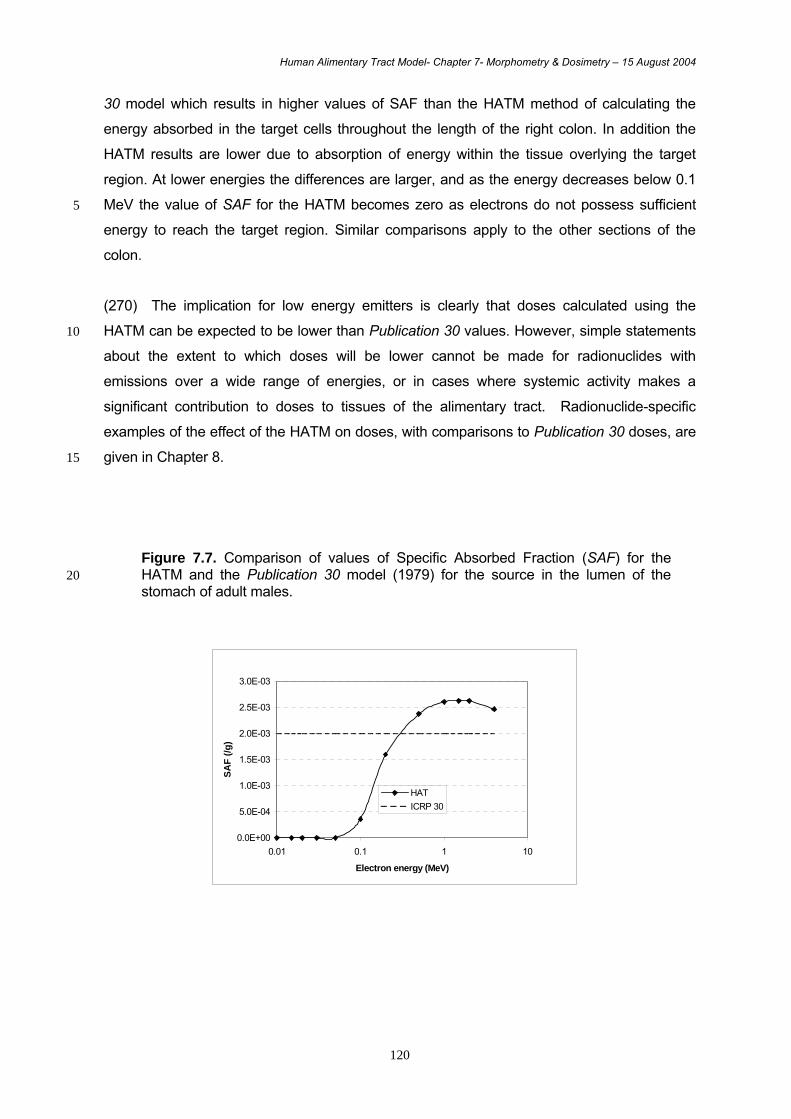
Human Alimentary Tract Model- Chapter 7- Morphometry & Dosimetry – 15 August 2004
120
30 model which results in higher values of SAF than the HATM method of calculating the
energy absorbed in the target cells throughout the length of the right colon. In addition the
HATM results are lower due to absorption of energy within the tissue overlying the target
region. At lower energies the differences are larger, and as the energy decreases below 0.1
MeV the value of SAF for the HATM becomes zero as electrons do not possess sufficient 5
energy to reach the target region. Similar comparisons apply to the other sections of the
colon.
(270) The implication for low energy emitters is clearly that doses calculated using the
HATM can be expected to be lower than Publication 30 values. However, simple statements 10
about the extent to which doses will be lower cannot be made for radionuclides with
emissions over a wide range of energies, or in cases where systemic activity makes a
significant contribution to doses to tissues of the alimentary tract. Radionuclide-specific
examples of the effect of the HATM on doses, with comparisons to Publication 30 doses, are
given in Chapter 8. 15
Figure 7.7. Comparison of values of Specific Absorbed Fraction (SAF) for the HATM and the Publication 30 model (1979) for the source in the lumen of the 20 stomach of adult males.
0.0E+00
5.0E-04
1.0E-03
1.5E-03
2.0E-03
2.5E-03
3.0E-03
0.01 0.1 1 10
Electron energy (MeV)
SAF
(/g)
HATICRP 30
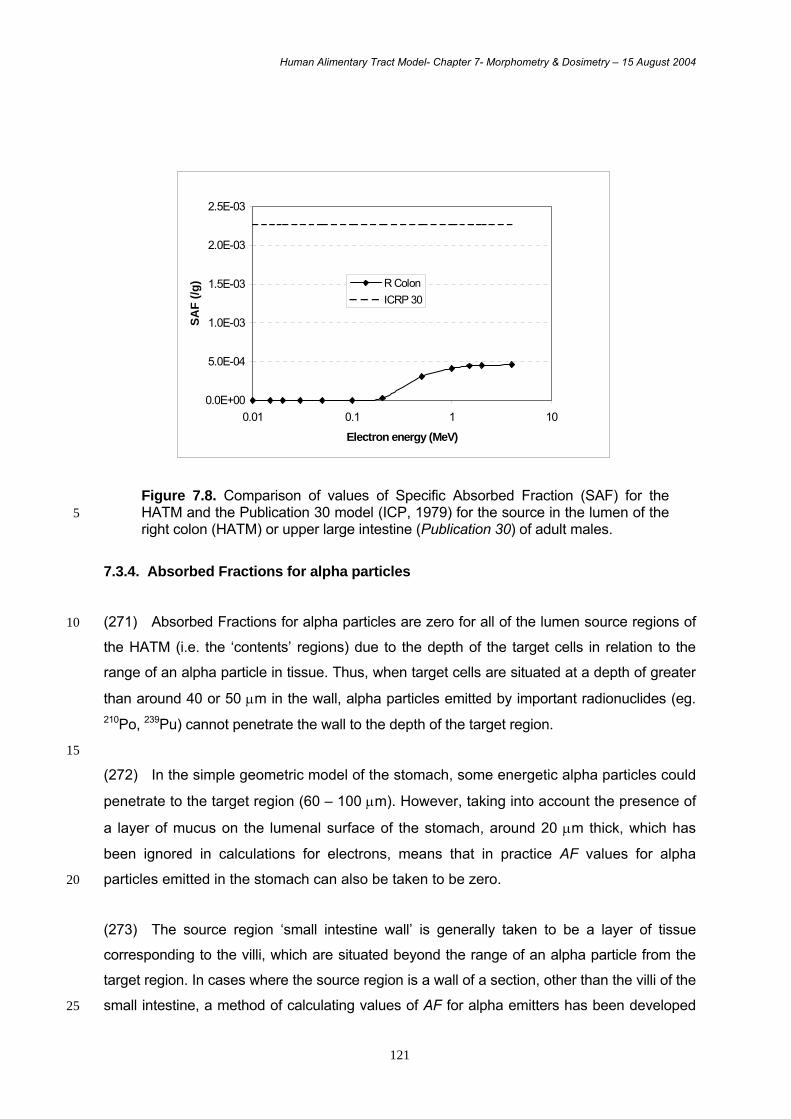
Human Alimentary Tract Model- Chapter 7- Morphometry & Dosimetry – 15 August 2004
121
Figure 7.8. Comparison of values of Specific Absorbed Fraction (SAF) for the HATM and the Publication 30 model (ICP, 1979) for the source in the lumen of the 5 right colon (HATM) or upper large intestine (Publication 30) of adult males.
7.3.4. Absorbed Fractions for alpha particles
(271) Absorbed Fractions for alpha particles are zero for all of the lumen source regions of 10
the HATM (i.e. the ‘contents’ regions) due to the depth of the target cells in relation to the
range of an alpha particle in tissue. Thus, when target cells are situated at a depth of greater
than around 40 or 50 µm in the wall, alpha particles emitted by important radionuclides (eg. 210Po, 239Pu) cannot penetrate the wall to the depth of the target region.
15
(272) In the simple geometric model of the stomach, some energetic alpha particles could
penetrate to the target region (60 – 100 µm). However, taking into account the presence of
a layer of mucus on the lumenal surface of the stomach, around 20 µm thick, which has
been ignored in calculations for electrons, means that in practice AF values for alpha
particles emitted in the stomach can also be taken to be zero. 20
(273) The source region ‘small intestine wall’ is generally taken to be a layer of tissue
corresponding to the villi, which are situated beyond the range of an alpha particle from the
target region. In cases where the source region is a wall of a section, other than the villi of the
small intestine, a method of calculating values of AF for alpha emitters has been developed 25
0.0E+00
5.0E-04
1.0E-03
1.5E-03
2.0E-03
2.5E-03
0.01 0.1 1 10
Electron energy (MeV)
SAF
(/g) R Colon
ICRP 30
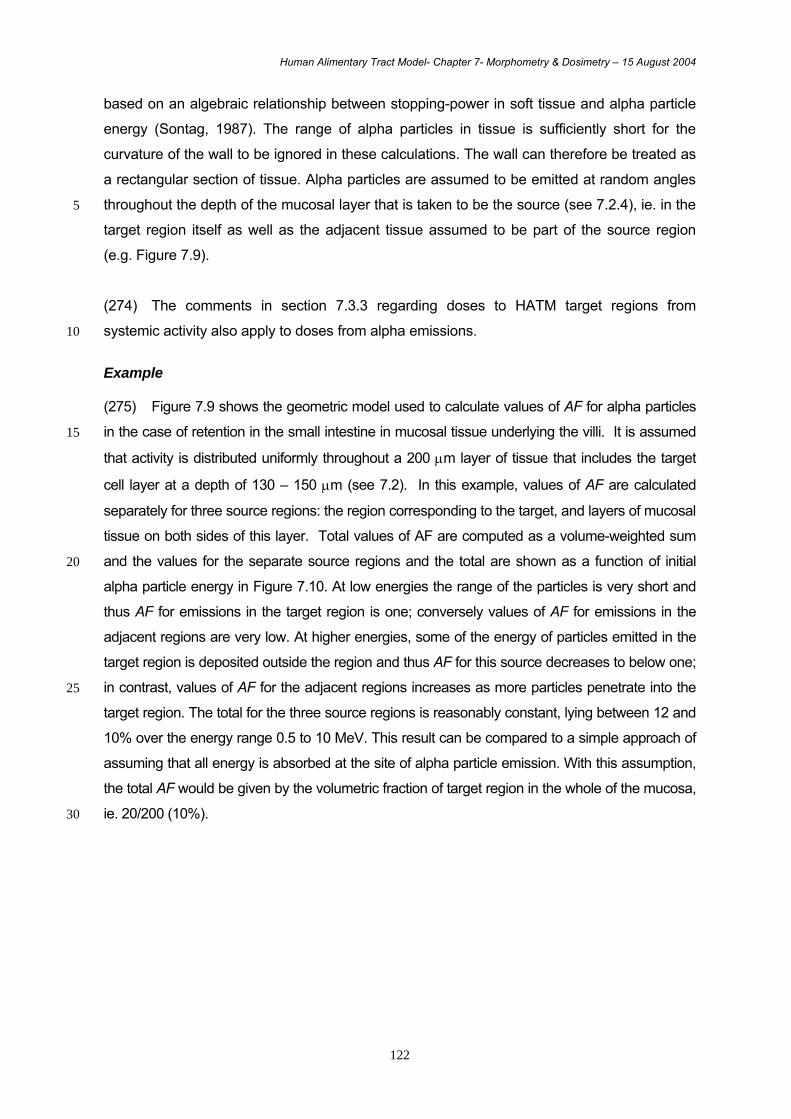
Human Alimentary Tract Model- Chapter 7- Morphometry & Dosimetry – 15 August 2004
122
based on an algebraic relationship between stopping-power in soft tissue and alpha particle
energy (Sontag, 1987). The range of alpha particles in tissue is sufficiently short for the
curvature of the wall to be ignored in these calculations. The wall can therefore be treated as
a rectangular section of tissue. Alpha particles are assumed to be emitted at random angles
throughout the depth of the mucosal layer that is taken to be the source (see 7.2.4), ie. in the 5
target region itself as well as the adjacent tissue assumed to be part of the source region
(e.g. Figure 7.9).
(274) The comments in section 7.3.3 regarding doses to HATM target regions from
systemic activity also apply to doses from alpha emissions. 10
Example (275) Figure 7.9 shows the geometric model used to calculate values of AF for alpha particles
in the case of retention in the small intestine in mucosal tissue underlying the villi. It is assumed 15
that activity is distributed uniformly throughout a 200 µm layer of tissue that includes the target
cell layer at a depth of 130 – 150 µm (see 7.2). In this example, values of AF are calculated
separately for three source regions: the region corresponding to the target, and layers of mucosal
tissue on both sides of this layer. Total values of AF are computed as a volume-weighted sum
and the values for the separate source regions and the total are shown as a function of initial 20
alpha particle energy in Figure 7.10. At low energies the range of the particles is very short and
thus AF for emissions in the target region is one; conversely values of AF for emissions in the
adjacent regions are very low. At higher energies, some of the energy of particles emitted in the
target region is deposited outside the region and thus AF for this source decreases to below one;
in contrast, values of AF for the adjacent regions increases as more particles penetrate into the 25
target region. The total for the three source regions is reasonably constant, lying between 12 and
10% over the energy range 0.5 to 10 MeV. This result can be compared to a simple approach of
assuming that all energy is absorbed at the site of alpha particle emission. With this assumption,
the total AF would be given by the volumetric fraction of target region in the whole of the mucosa,
ie. 20/200 (10%). 30
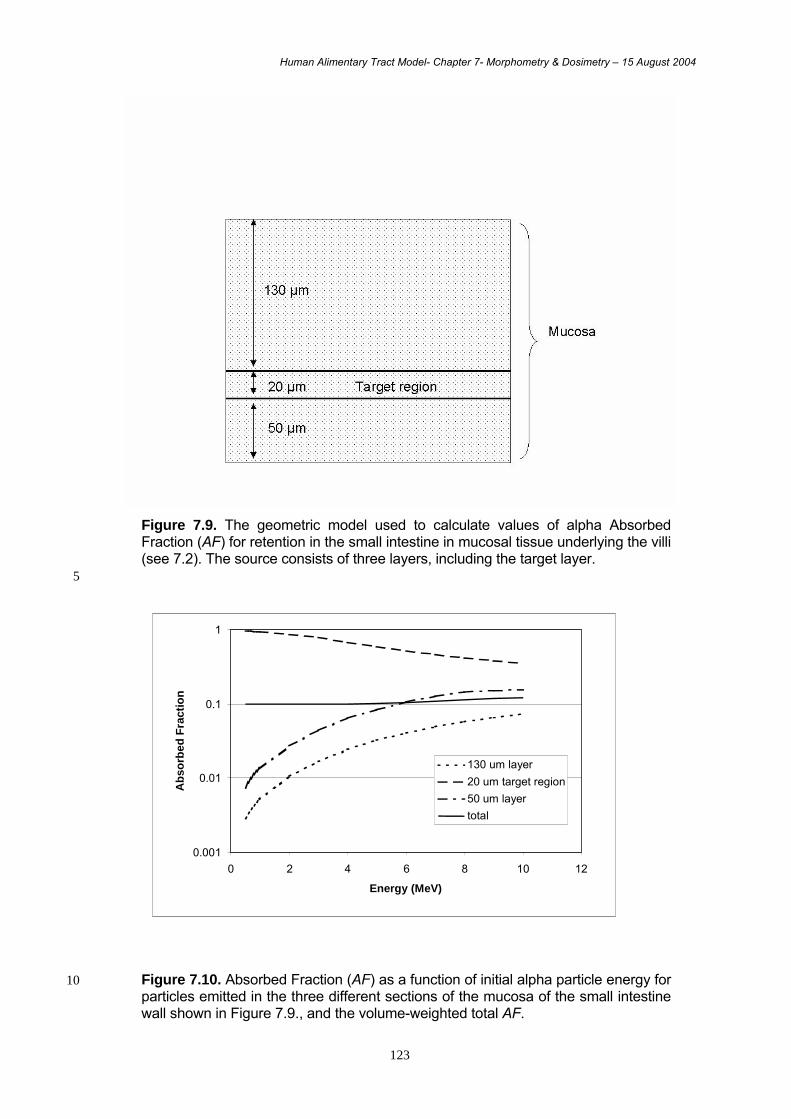
Human Alimentary Tract Model- Chapter 7- Morphometry & Dosimetry – 15 August 2004
123
Figure 7.9. The geometric model used to calculate values of alpha Absorbed Fraction (AF) for retention in the small intestine in mucosal tissue underlying the villi (see 7.2). The source consists of three layers, including the target layer.
5
Figure 7.10. Absorbed Fraction (AF) as a function of initial alpha particle energy for 10 particles emitted in the three different sections of the mucosa of the small intestine wall shown in Figure 7.9., and the volume-weighted total AF.
0.001
0.01
0.1
1
0 2 4 6 8 10 12
Energy (MeV)
Abs
orbe
d Fr
actio
n
130 um layer20 um target region50 um layertotal
Human Alimentary Tract Model- Chapter 7- Morphometry & Dosimetry – 15 August 2004
124
7.4. References Awad, Z.T., Watson, P., Filipi, C.J. et al (1999). Correlations between esophageal 5 diseases and manometric length: a study of 617 patients. J. Gastrointest. Surg. 3, 483-488.
Berger, M. J. Monte Carlo Calculation of the Penetration and Diffusion of Fast Charged Particles. In: Methods in Computational Physics, Vol. 1, edited by B. Alder, S. Fernbach, and M. Rotenberg, (Academic Press, New York, 1963) 135.
Briesmeister, J. F. (Ed.). MCNP - A General Monte Carlo N-Particle Transport Code, 10 version 4C. Los Alamos National Laboratory LA-12625-M, Los Alamos, New Mexico (1997).
Chao, T.C., Xu, X.G. (2001) Specific absorbed fractions from image-based VIP-Man body model and EGS4-VLSI Monte Carlo code: internal electron emitters. Phys. Med. Biol. 46, 901-927. 15
Chao, T.C., Bozkurt, A., Xu, X.G. (2001) ) Conversion coefficients based on the VIP-Man anatomical model and EGS4-VLSI code for external monoenergetic photons from 10 keV to 10 MeV. Health Physics 81, 163-183.
Cristy, M., Eckerman, K,F. (1987) Specific absorbed fractions of energy at various ages from internal photon sources. Oak Ridge National Laboratory, Oak Ridge, Tennessee. 20 ORNL/TM-8381/v1-7.
Cristy, M., Eckerman K F (1993). SEECAL: Program to calculate age-dependent specific effective energies. ORNL/TM-12351. Oak Ridge National Laboratory, Oak Ridge, Tennessee, USA.
Dimbylow, P. J. (1997) FDTD calculations of the whole-body averaged SAR in an 25 anatomically realistic voxel model of the human body from 1 MHz to 1 GHz. Phys. Med. Biol. 42 479-90.
Eckerman K.F., Westfall, R.J., Ryman, J.C., Cristy, M. (1994) Availability of nuclear decay data in electronic form, including beta spectra not previously published. Health Phys. 67, 338-45. 30
Fill, U.A., Zankl, M., Petoussi-Henss, N., Siebert, M., Regulla, D. (2004) Adult female voxel models of different stature and photon conversion coefficients for radiation protection. Health Phys. 86, 253-72.
Goudsmit, S., Saunderson, J. L. (1940) Multiple Scattering of Electrons. Phys. Rev. 57, 24.
ICRP (1975) Report of the Task Group on Reference Man. ICRP Publication 23. Pergamon 35 Press, Oxford.
ICRP (1979). Limits for Intakes of Radionuclides by Workers. ICRP Publication 30 Part 1. Annals of the ICRP 2 (3/4). Pergamon Press, Oxford.
ICRP (1983). Radionuclide Transformations: Energy and Intensity of Emissions. Annals of the ICRP 11-13. Pergamon Press, Oxford. 40
ICRP (1989). Age-Dependent Doses to Members of the Public from Intake of Radionuclides: Part 1. ICRP Publication 56. Annals of the ICRP 20 (2). Pergamon Press, Oxford.
ICRP (1991). 1990 Recommendations of the International Commission on Radiological Protection. ICRP Publication 60. Annals of the ICRP 21 (1-3). Pergamon Press, Oxford. 45
Human Alimentary Tract Model- Chapter 7- Morphometry & Dosimetry – 15 August 2004
125
ICRP (1994) Dose Coefficients for Intake of Radionuclides by Workers. ICRP Publication 68. Annals of the ICRP 24(4).
ICRP (1996) Age-dependent Doses to Members of the Public from Intake of Radionuclides Part 5: Compilation of Ingestion and Inhalation Dose Coefficients. ICRP Publication 72. Annals of the ICRP. 5
ICRP (2001) Doses to the Embryo and Fetus from intakes of radionuclides by the mother (corrected version May 2002). ICRP Publication 88. Ann. ICRP 31 (1-3).
ICRP (2002) Basis anatomical and physiological data for use in radiological protection: reference values. ICRP Publication 89. Ann. ICRP 32 (3-4).
International Commission on Radiation Units and Measurements. (1989). Tissue 10 Substitutes in Radiation Dosimetry and Measurement, ICRU Report 44.
Landau, L. (1944)On the Energy Loss of Fast Particles by Ionization. J. Phys. USSR 8.
Penna, F.J., Hill, I.D., Kingston, D., Roberston, K., Slavin, G. and Shiner, M. (1981). Jejunal mucosal morphometry in children with and without gut symptoms and in normal adults. J. Clin. Pathol. 34, 386-392. 15
Petoussi-Henss, N., Zankl, M., Fill, U. and Regulla, D. (2002) The GSF voxel family of phantoms. Phys. Med. Biol. 47, 89-106.
Potten, C. (2002). Personal communication
Saito K, Wittmann A, Koga S, Ida Y, Kamei T, Funabiki J, Zankl M. (2001) Construction of a computed tomographic phantom for a Japanese male adult and dose calculation system. 20 Radiat. Environ. Biophys. 40, 69-75.
Smith, T.J., Phipps, A.W., Petoussi-Henss, N. and Zankl, M. (2001) Impact on internal doses of photon SAFs derived with the GSF adult male voxel phantom. Health Physics 80, 477-485.
Snyder WS, Fisher HL Jr, Ford MR, Warner GG. (1969) Estimates of absorbed fractions for 25 monoenergetic photon sources uniformly distributed in various organs of a heterogeneous phantom. J Nucl Med. Suppl 3,7-52.
Sontag W. (1987) Dosimetry of alpha-emitting radionuclides in bone -a practical approach. Health Phys. 53, 495-501.
Stabin, M.G., Watson, E.E., Cristy, M., et al. (1995) Mathematical models and specific 30 absorbed fractions of photon energy in the nonpregnant adult female and at the end of each trimester of pregnancy. Oak Ridge National Laboratory, Oak Ridge, Tennessee. ORNL/TM-12907.
Stenling, R., Fredrikzon, B., Nyhlin, H. and Helander, H.F. (1984) Surface ultrastrucure of the small intestine mucosa in healthy children and adults: a scanning electron microscopic 35 study with some methodological aspects. Ultrastruct. Pathol. 6, 131-140.
Xu XG, Chao TC, Bozkurt A. (2000) VIP-Man: an image-based whole-body adult male model constructed from color photographs of the Visible Human Project for multi-particle Monte Carlo calculations. Health Phys. 78, 476-86.
Zankl M, Petoussi-Henss N, Fill U, Regulla D. (2003) The application of voxel phantoms to 40 the internal dosimetry of radionuclides. Radiat Prot Dosim.105, 539-48.
Zankl, M. and Wittman, A. (2001) The adult male voxel model "Golem" segmented from whole-body CT patient data. Radiat Environ Biophys 40, 153-162.
Zubal IG, Harrell CR, Smith EO, Rattner Z, Gindi G, Hoffer PB. (1994) Computerized three-dimensional segmented human anatomy. Med Phys. 21, 299-302. 45
Human Alimentary Tract Model - Chapitre 8 - Application – 16 August 2004
127
8. USE OF THE MODEL
8.1. Introduction
(276) This chapter includes example dose calculations which illustrate the implications of
the new model in comparison to the Publication 30 model, in terms of doses to regions of
the alimentary tract and of effective dose. It illustrates the standard case in which
radionuclide-specific information is available only on total absorption. It considers the
application of the model to cases where information is available on retention of
radionuclides on teeth or in the small intestine wall, and cases where information may be
available on absorption from different regions of the tract. The scope for differences in
alimentary tract doses between adult males and females and between different age-groups
is also discussed. Uncertainties are assessed, considering the effect on doses of
uncertainties in radionuclide absorption, location of target cells for cancer induction, transit
times of materials through the lumen of the tract, and dimensions of the colon. The Chapter
concludes with a brief overview of the new model and the effect of its use on estimates of
dose for a number of example radionuclides. It should be noted that where doses are
discussed, the values given are preliminary and for illustrative purposes only. Definitive
dose coefficients calculated using the new model will be published in forthcoming ICRP
reports on doses to workers and members of the public.
8.2. Examples of doses using the HATM
8.2.1. Default case – information available only on total absorption of the radionuclide to blood, assumed to be from the SI
(277) The examples in this section are for acute intake of strontium-90, ruthenium-106 and
plutonium-239 by adults. Preliminary estimates are given of committed equivalent doses to
alimentary tract regions and committed effective doses, including doses resulting from activity
in the lumen of the alimentary tract and doses arising from activity absorbed to blood and
retained in body tissues.
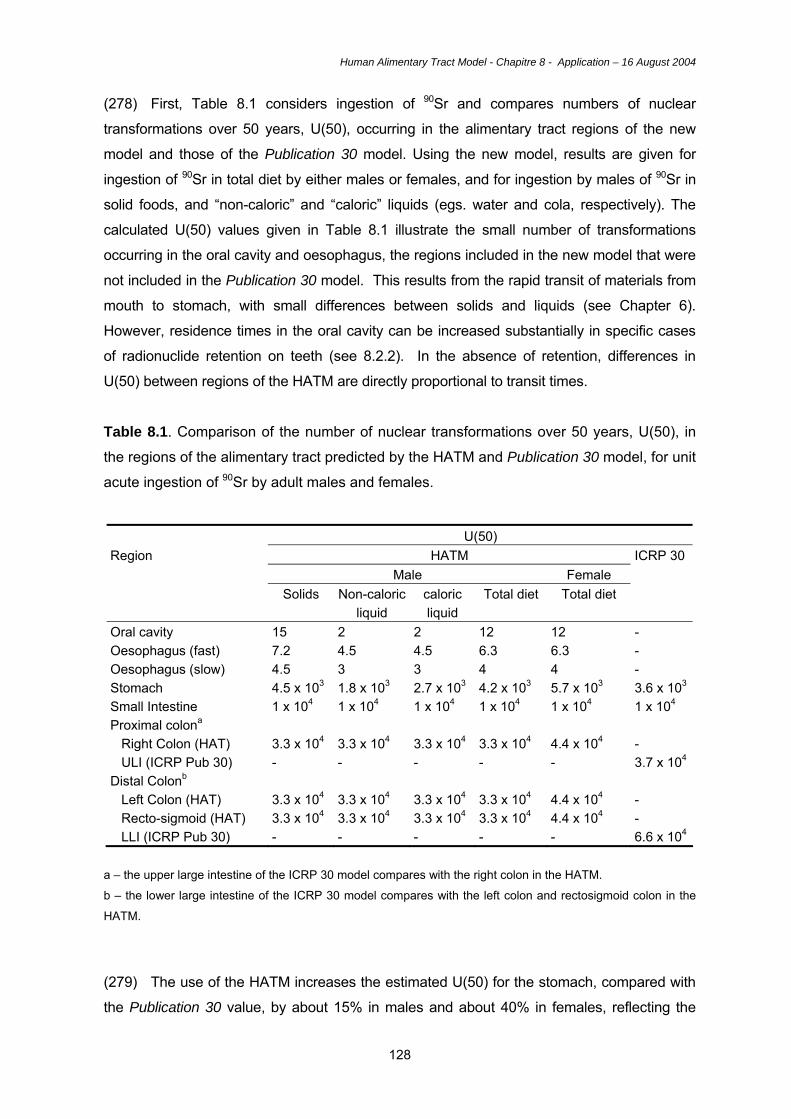
Human Alimentary Tract Model - Chapitre 8 - Application – 16 August 2004
128
(278) First, Table 8.1 considers ingestion of 90Sr and compares numbers of nuclear
transformations over 50 years, U(50), occurring in the alimentary tract regions of the new
model and those of the Publication 30 model. Using the new model, results are given for
ingestion of 90Sr in total diet by either males or females, and for ingestion by males of 90Sr in
solid foods, and “non-caloric” and “caloric” liquids (egs. water and cola, respectively). The
calculated U(50) values given in Table 8.1 illustrate the small number of transformations
occurring in the oral cavity and oesophagus, the regions included in the new model that were
not included in the Publication 30 model. This results from the rapid transit of materials from
mouth to stomach, with small differences between solids and liquids (see Chapter 6).
However, residence times in the oral cavity can be increased substantially in specific cases
of radionuclide retention on teeth (see 8.2.2). In the absence of retention, differences in
U(50) between regions of the HATM are directly proportional to transit times.
Table 8.1. Comparison of the number of nuclear transformations over 50 years, U(50), in
the regions of the alimentary tract predicted by the HATM and Publication 30 model, for unit
acute ingestion of 90Sr by adult males and females.
U(50) HATM ICRP 30
Male Female Region
Solids Non-caloric liquid
caloric liquid
Total diet Total diet
Oral cavity 15 2 2 12 12 - Oesophagus (fast) 7.2 4.5 4.5 6.3 6.3 - Oesophagus (slow) 4.5 3 3 4 4 - Stomach 4.5 x 10³ 1.8 x 10³ 2.7 x 10³ 4.2 x 10³ 5.7 x 10³ 3.6 x 10³
Small Intestine 1 x 10⁴ 1 x 10⁴ 1 x 10⁴ 1 x 10⁴ 1 x 10⁴ 1 x 10⁴ Proximal colona Right Colon (HAT) ULI (ICRP Pub 30)
3.3 x 10⁴ -
3.3 x 10⁴ -
3.3 x 10⁴ -
3.3 x 10⁴ -
4.4 x 10⁴ -
- 3.7 x 10⁴
Distal Colonb Left Colon (HAT) Recto-sigmoid (HAT) LLI (ICRP Pub 30)
3.3 x 10⁴ 3.3 x 10⁴ -
3.3 x 10⁴ 3.3 x 10⁴ -
3.3 x 10⁴ 3.3 x 10⁴ -
3.3 x 10⁴ 3.3 x 10⁴ -
4.4 x 10⁴ 4.4 x 10⁴ -
- - 6.6 x 10⁴
a – the upper large intestine of the ICRP 30 model compares with the right colon in the HATM. b – the lower large intestine of the ICRP 30 model compares with the left colon and rectosigmoid colon in the
HATM.
(279) The use of the HATM increases the estimated U(50) for the stomach, compared with
the Publication 30 value, by about 15% in males and about 40% in females, reflecting the
Human Alimentary Tract Model - Chapitre 8 - Application – 16 August 2004
129
longer mean transit times used in the new model (70 min in males and 95 min in females,
compared with 60 min in Publication 30). There are large differences in U(50) for the
stomach for solids and liquids using the HATM, with values for solids that are about 2.5 times
greater than for non-caloric liquids in males, and 3.5 times greater in females, reflecting their
transit times (see Chapter 6). Since the total transit time in the left colon and the
rectosigmoid colon of the HATM in males is the same as that in the lower large intestine (LLI)
of the Publication 30 model, the sum of U(50) for left colon and rectosigmoid is equal to U(50)
for LLI. Gender differences in colon transit times and U(50) values in the HATM are similar to
those for the stomach, with values about one-third greater in females than males. In the
calculation of dose coefficients this gender difference will be compounded by lower female
tissue masses, but for dose assessments is likely to be reduced by lower intakes of
foodstuffs by females in many situations.
(280) Figures 8.1 to 8.3 show estimates of committed equivalent doses to regions of the
alimentary tract and committed effective doses for the ingestion of unit activity of 90Sr, 106Ru
and 239Pu by adult males, comparing doses calculated using the HATM and the Publication
30 model. In each case, standard systemic models are used for the distribution and
retention of activity absorbed to blood (ICRP, 1989, 1993). Doses to the oral mucosa and
oesophagus are not available from the Publication 30 model; for the purposes of comparison
these have been assumed to be equal to the dose to a typical non-source organ such as
muscle. The figures show that doses to the oral mucosa and oesophagus calculated on the
basis of this assumption are very similar to doses obtained using the HATM. This is because
transit through the oral cavity and oesophagus in the HATM is rapid and the main component
of dose is from activity absorbed to blood, with systemic models assigning the same dose to
all unspecified soft tissues. The figures show that the HATM and Publication 30 model also
give quite similar doses to the stomach and small intestine for the examples considered. For 90Sr, doses to these regions will be dominated in each case by doses from activity absorbed
to blood, which are calculated using the Publication 67 (ICRP, 1993) systemic model. For 106Ru, dose to the stomach is slightly increased using the HATM rather than the Publication
30 model, because of the greater transit time in the HATM (70 min cf. 60 min) and similar
SEE values (see section 7.3) for the two models, while dose to the SI is lower using the
HATM because the transit time is unaltered and the SEE value is lower. For 239Pu, doses to
the stomach and SI are lower using the HATM than the Publication 30 model because doses
from activity in the lumen are zero in the HATM as a result of the explicit consideration of
doses to target regions. Doses to these regions from 239Pu shown in Figure 8.3 are solely due
to systemic activity when doses are calculated using the HATM and largely from systemic
activity when the Publication 30 model is used.
Human Alimentary Tract Model - Chapitre 8 - Application – 16 August 2004
130
(281) The largest differences shown in Figures 8.1 to 8.3 are for doses to regions of the
colon. As in Table 8.1, the right colon of the HATM has been compared with upper large
intestine of the Publication 30 model and left colon and rectosigmoid have been compared
with lower large intestine. For the three radionuclides considered here, colon doses
calculated using the HATM are significantly lower than using the Publication 30 model. This
is largely due to reductions in SEE values, reflecting the reduced SAF values calculated for
the HATM on the basis of a specified target region in the mucosal layer of the colon wall, as
opposed to the simple energy-independent method of Publication 30 (see Chapter 7); these
reductions are due to loss of energy in the contents of the lumen and mucosal tissue lying
between the lumen and the target region. As for other regions of the HATM, colon doses from 239Pu in the lumen are zero (section 7.3.4) and doses shown in Figure 8.3 are solely from
systemic activity. Similar decreases in colon doses compared with the Publication 30 model
will apply generally to pure alpha emitters.
(282) The extent to which differences in equivalent doses to the tissues of the alimentary
tract affects the effective dose, E, depends on the relative contribution of these tissues to E.
For 90Sr, E is dominated by skeletal doses (bone surfaces and red bone marrow) and there is
little difference in values of E calculated using the HATM and Publication 30 model. For 106Ru, doses to alimentary tract regions contribute significantly to E such that the value
obtained using the HATM is about half of that using the Publication 30 model. For 239Pu, as
for 90Sr, doses to alimentary tract regions make only a small contribution to E, the dominant
contributors being liver and skeletal tissues.
8.2.2. Effect of retention on teeth
(283) Experimental data were presented in Chapter 3 on the retention of radionuclides on
teeth in rodents and dogs, referring to studies by Book et al. (1982), Bhattacharyya et al.
(1985) and Renaud-Salis et al. (1990). The radionuclides studied were isotopes of Sr, Cd,
Pb and Pu. As discussed in Chapter 3, the example used for illustrative purposes in this
report is 115Cd, since its beta particle emissions, as well as photon emissions, will result in
irradiation of the target layer in the epithelium of the oral mucosa. It is assumed, for the
purposes of this example, that 0.2% of ingested 115Cd is retained on teeth with a half-time
of 1 week (see 3.5.2). The retained activity is assumed to be situated in a 10 µm layer on
the surface of the teeth and doses have been calculated using the Specific Absorbed
Fractions given in Annex G. As discussed in Chapter 7, target regions associated with the
oral cavity include the salivary glands as well as the oral mucosa. While electron and
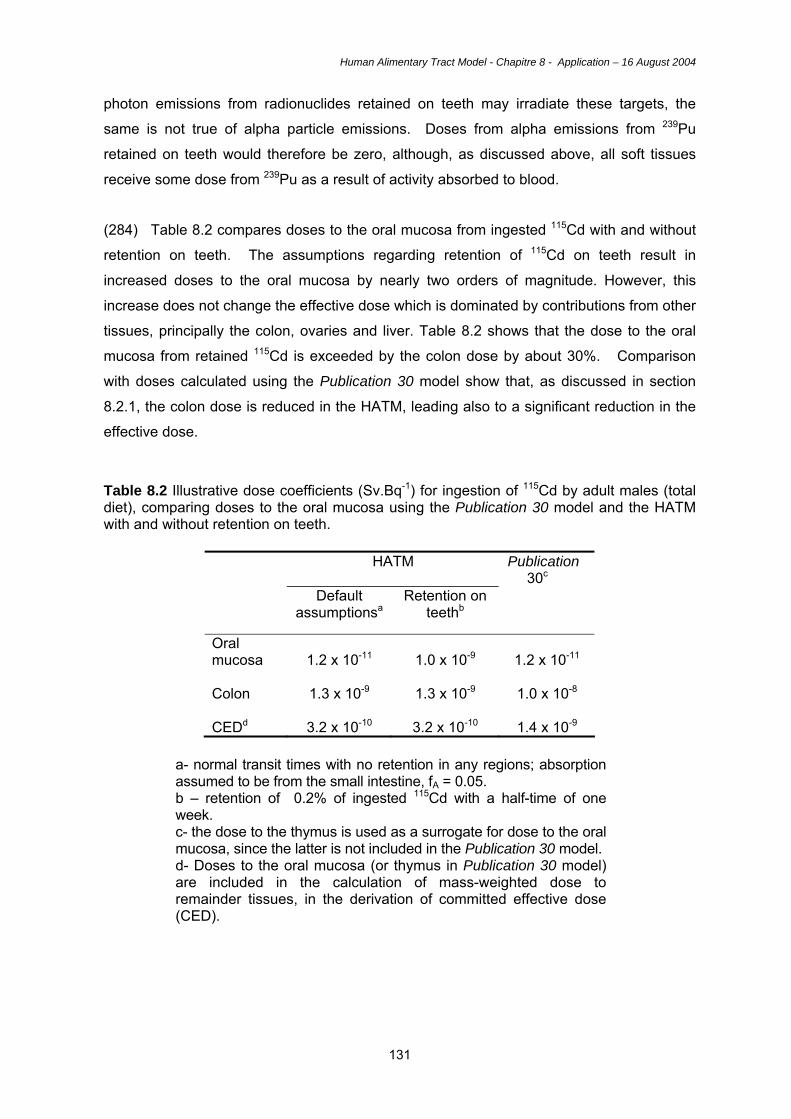
Human Alimentary Tract Model - Chapitre 8 - Application – 16 August 2004
131
photon emissions from radionuclides retained on teeth may irradiate these targets, the
same is not true of alpha particle emissions. Doses from alpha emissions from 239Pu
retained on teeth would therefore be zero, although, as discussed above, all soft tissues
receive some dose from 239Pu as a result of activity absorbed to blood.
(284) Table 8.2 compares doses to the oral mucosa from ingested 115Cd with and without
retention on teeth. The assumptions regarding retention of 115Cd on teeth result in
increased doses to the oral mucosa by nearly two orders of magnitude. However, this
increase does not change the effective dose which is dominated by contributions from other
tissues, principally the colon, ovaries and liver. Table 8.2 shows that the dose to the oral
mucosa from retained 115Cd is exceeded by the colon dose by about 30%. Comparison
with doses calculated using the Publication 30 model show that, as discussed in section
8.2.1, the colon dose is reduced in the HATM, leading also to a significant reduction in the
effective dose. Table 8.2 Illustrative dose coefficients (Sv.Bq-1) for ingestion of 115Cd by adult males (total diet), comparing doses to the oral mucosa using the Publication 30 model and the HATM with and without retention on teeth.
HATM Publication 30c
Default assumptionsa
Retention on teethb
Oral mucosa
1.2 x 10⁻¹¹
1.0 x 10⁻⁹
1.2 x 10⁻¹¹
Colon
1.3 x 10⁻⁹
1.3 x 10⁻⁹
1.0 x 10⁻⁸
CEDd
3.2 x 10⁻¹⁰
3.2 x 10⁻¹⁰
1.4 x 10⁻⁹
a- normal transit times with no retention in any regions; absorption assumed to be from the small intestine, fA = 0.05. b – retention of 0.2% of ingested 115Cd with a half-time of one week. c- the dose to the thymus is used as a surrogate for dose to the oral mucosa, since the latter is not included in the Publication 30 model. d- Doses to the oral mucosa (or thymus in Publication 30 model) are included in the calculation of mass-weighted dose to remainder tissues, in the derivation of committed effective dose (CED).
Human Alimentary Tract Model - Chapitre 8 - Application – 16 August 2004
132
8.2.3.Effect of retention in the wall of the small intestine (SI)
(285) Experimental data were presented in chapter 3 on the retention of ingested iron and
uranium in the small intestine in adults. On the basis of human data for 59Fe ingested in
soluble form, Werner et al. (1987) concluded that absorption to blood was 0.2 of the
ingested activity. This total absorption was assumed to take place from the small intestine,
ie. fA = fSI. However, while 0.2 was absorbed to blood, the data obtained were interpreted to
suggest initial uptake of 0.4 and subsequent return of 0.2 into the lumen of the SI with a
half-time of retention of 3 days. As discussed in Chapter 5, to model this specific case
without consideration of recycling between SI contents and SI wall requires an adaptation
of the standard model (see 5.4). Thus, absorption to blood is taken to occur directly from
the contents of the small intestine, while the compartment representing the SI wall is used
to account for retention in the wall followed by return into the contents. Activity is returned
to the right colon rather than the SI, to avoid unwarranted complexity of considering
recycling between SI contents and SI wall.
(286) The site of radionuclide retention in the small intestine is taken to be the absorptive
epithelial cells of the villi. In practice, as discussed in chapter 7, this is modelled as a
uniform layer of tissue above the intercryptal plate, with a height of 500 µm in adults (see
7.2.4). The target layer for cancer induction is assumed to be at the position of the stem
cells towards the bases of the crypts, at a depth of 130 – 150 µm below the intercryptal
plate.
(287) While human and animal data suggest that uranium may be retained in the intestinal
wall during its absorption (Chapter 3), this possibility is not considered further here because
alpha particle emissions from radioisotopes of U retained in the villi will not irradiate the
target layer at the bases of the crypts.
(288) Table 8.3 shows the effect of retention of ingested 59Fe in the SI wall on doses to
the SI, by comparing doses with and without retention. The assumptions made regarding
retention in the SI wall resulted in increased dose to the SI by about a factor of two; doses
to the colon are also higher due to photon cross-fire. Comparisons with doses obtained
using the Publication 30 model show that, as discussed in 8.2.1, the largest differences are
lower doses to the colon using the HATM.
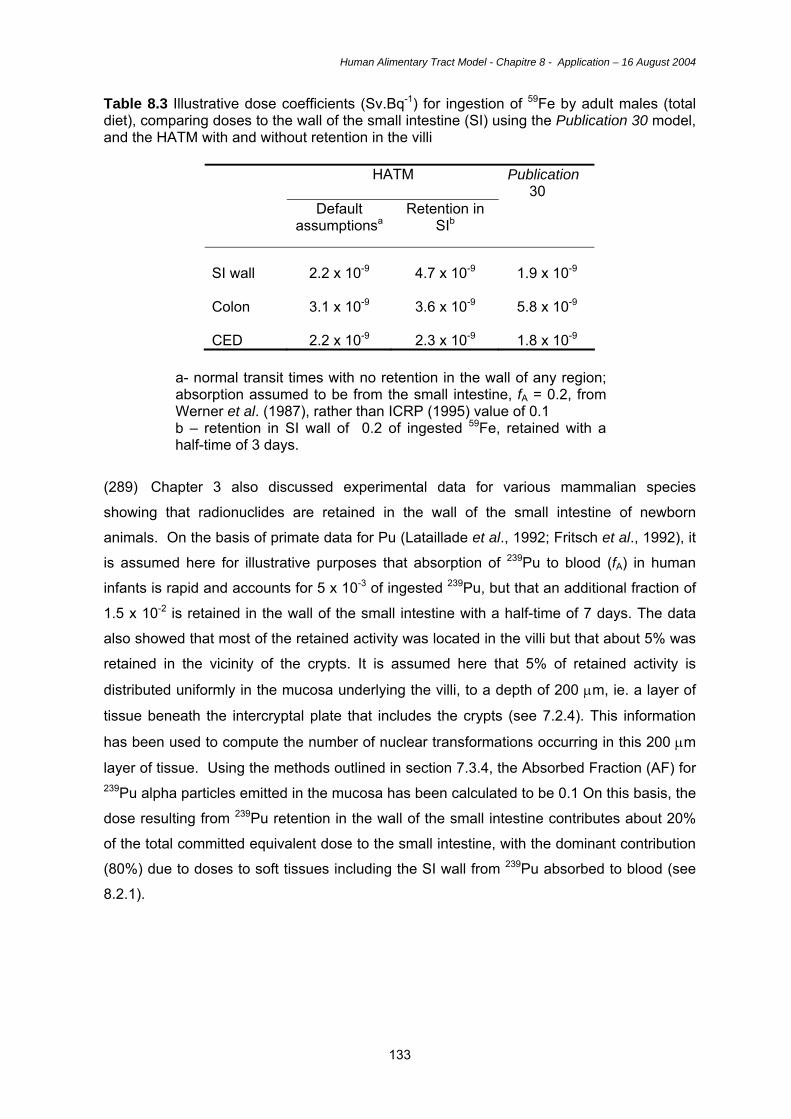
Human Alimentary Tract Model - Chapitre 8 - Application – 16 August 2004
133
Table 8.3 Illustrative dose coefficients (Sv.Bq-1) for ingestion of 59Fe by adult males (total diet), comparing doses to the wall of the small intestine (SI) using the Publication 30 model, and the HATM with and without retention in the villi
HATM Publication 30
Default assumptionsa
Retention in SIb
SI wall
2.2 x 10⁻⁹
4.7 x 10⁻⁹
1.9 x 10⁻⁹
Colon
3.1 x 10⁻⁹
3.6 x 10⁻⁹
5.8 x 10⁻⁹
CED
2.2 x 10⁻⁹
2.3 x 10⁻⁹
1.8 x 10⁻⁹
a- normal transit times with no retention in the wall of any region; absorption assumed to be from the small intestine, fA = 0.2, from Werner et al. (1987), rather than ICRP (1995) value of 0.1 b – retention in SI wall of 0.2 of ingested 59Fe, retained with a half-time of 3 days.
(289) Chapter 3 also discussed experimental data for various mammalian species
showing that radionuclides are retained in the wall of the small intestine of newborn
animals. On the basis of primate data for Pu (Lataillade et al., 1992; Fritsch et al., 1992), it
is assumed here for illustrative purposes that absorption of 239Pu to blood (fA) in human
infants is rapid and accounts for 5 x 10⁻³ of ingested 239Pu, but that an additional fraction of
1.5 x 10⁻² is retained in the wall of the small intestine with a half-time of 7 days. The data
also showed that most of the retained activity was located in the villi but that about 5% was
retained in the vicinity of the crypts. It is assumed here that 5% of retained activity is
distributed uniformly in the mucosa underlying the villi, to a depth of 200 µm, ie. a layer of
tissue beneath the intercryptal plate that includes the crypts (see 7.2.4). This information
has been used to compute the number of nuclear transformations occurring in this 200 µm
layer of tissue. Using the methods outlined in section 7.3.4, the Absorbed Fraction (AF) for 239Pu alpha particles emitted in the mucosa has been calculated to be 0.1 On this basis, the
dose resulting from 239Pu retention in the wall of the small intestine contributes about 20%
of the total committed equivalent dose to the small intestine, with the dominant contribution
(80%) due to doses to soft tissues including the SI wall from 239Pu absorbed to blood (see
8.2.1).
Human Alimentary Tract Model - Chapitre 8 - Application – 16 August 2004
134
8.2.4. Effect of absorption from stomach and small intestine
(290) In the absence of specific information, the reasonable assumption is made that all
absorption of radionuclides from the alimentary tract occurs in the small intestine, the
region that is adapted for absorption of nutrients and essential elements (see Chapter 2
and Annex B). However, as discussed in Chapter 3, animal studies have shown that
absorption of elements and their radioisotopes can occur, to some extent, in regions of the
alimentary tract other than the small intestine, including the stomach. Reliable quantitative
assessments of the extent of absorption from different regions under normal circumstances
of radionuclide ingestion do not appear to be possible on the basis of currently available
information, but studies have shown absorption from the stomach for the examples of I, F,
Cu and Nb (Patten et al. 1978; Gabler et al. 1968; Van Campen and Mitchell, 1965; Eisele
and Mraz, 1981).
(291) For illustrative purposes, the effect of absorption from the stomach is considered
here for the example of isotopes of iodine. For most isotopes of iodine (such as 131I and 129I), the more rapid entry of the isotope into the circulation following absorption from the
stomach will have the effect of slightly increasing doses to the thyroid while decreasing
doses to the stomach and small intestine. The impact on effective doses is small. For
isotopes of very short physical half-life (such as 132I), the assumption of uptake directly from
the stomach will increase thyroid doses and effective doses. For example, the assumption
that half of ingested iodine is absorbed from the stomach and half from the SI, compared
with the standard assumption of complete absorption from the SI, results in an increase in
thyroid dose of < 1% for 129I and 131I; This assumption of iodine absorption from the
stomach also has the effect of decreasing doses to the SI, and to the colon due to
irradiation from the SI contents, by 4 - 8% for the short-lived 131I (half-life 8 days), but not
the long-lived 129I (half-life 15.7 x 10⁶ years); effective dose is increased by < 1% for both
isotopes.
8.2.5 Doses to infants and children
(292) The HATM gives age-dependent transit times for the regions of the alimentary tract
(Chapter 6), as well as age-dependent dimensions (Chapter 7), while the Publication 30
model gave transit times only for adults. The Publication 30 model was used to calculate
doses to infants and children in Publications 56, 67, 69, 71 and 72, using the adult transit
times but applying age-dependent masses. In general, the shorter transit times for infants
and children specified in Chapter 6 will tend to reduce doses, while the smaller tissue masses
Human Alimentary Tract Model - Chapitre 8 - Application – 16 August 2004
135
and lumen volumes will tend to increase doses (the latter because there is less absorption of
energy within the smaller contents of the lumen).
(293) Quantitative examples of the effect of age on doses calculated using the HATM are
beyond the scope of the report; information on doses to children and infants will be given in
future reports.
8.2.6. Application to ingestion of particles
(294) The HATM can be used to calculate doses from discrete particles of high activity
such as fragments of irradiated fuel (often called ‘hot particles’), as well as for the normal
situation of distribution of activity throughout the contents of the alimentary tract. The
consideration of realistic target cell locations in the HATM enables doses to be calculated
using radiation transport calculations considering, for example, different particle sizes,
densities, and elemental compositions. The particles can be taken to be at different radial
positions within the lumen since this can lead to a different dose to the target cells.
Calculations of this sort have been performed using a model similar to the HATM (Darley et
al., 2003). This approach takes into account absorption of energy within the particle. It
generally yields lower doses than the Publication 30 model, although the extent of the
difference will depend on the radionuclides which provide the major fraction of the dose and
the size of the particles. Darley et al. (2003) considered the case of possible ingestion of
fragments of irradiated fuel, found in small numbers on the coast near the Dounreay
Nuclear Power Developmemt Establishment in Scotland. The principal radionuclides
contained within the particles are 137Cs and 90Sr/90Y, although they also contain small
amounts of plutonium isotopes and 241Am. Darley et al. (2003) obtained estimates of dose
to the lower large intestine that were lower than calculated using the Publication 30 model
by factors of about 30 for an adult and more than 50 for a one year-old child.
8.3. Uncertainties 8.3.1 Definitions
(295) In this report, “uncertainty” refers to the level of confidence that can be placed in a
given component (e.g., parameter value) or prediction of the HATM, as an estimate of the
central value (usually, an arithmetic or geometric mean) in the population. The uncertainty
in the central value of a model feature should not be confused with the “variability” of that
Human Alimentary Tract Model - Chapitre 8 - Application – 16 August 2004
136
feature in the population. Variability refers to quantitative differences between different
members of a population under similar conditions (inter-individual variability) or within an
individual under different conditions (intra-individual variability). For example, the transit
time of material through the colon may differ between two persons of the same size, race,
age, and gender and having identical diets (inter-individual variability) or may differ in the
same person at different times due to changes in diet, state of health, or other conditions
(intra-individual variability) (see Chapter 6 and Annex C).
(296) This section considers the uncertainty in some major components of the alimentary
tract model. Statements of uncertainty given here are subjective judgments of the Task
Group based on the quality and completeness of the underlying data. The uncertainty in a
given quantity is expressed in terms of a subjective confidence interval, that is, an interval
of positive values, [A,B], such that the true but unknown value is judged with reasonable
confidence to lie between A and B. Here, “reasonable confidence” is defined as a
subjective confidence level of 90%. That is, it is judged that there is only a small probability
(about 5%) that the true value is less than A and only a small probability (about 5%) that it
is greater than B.
(297) For purposes of comparing levels of uncertainty of model components that are
expressed in different terms or have different orders of magnitude, it is sometimes
convenient to apply the concept of an uncertainty factor (UF). An uncertainty factor for a
quantity with subjective confidence interval [A,B] is defined as (B/A)1/2. The quantity is
considered to be known within a factor of (B/A)1/2 in the sense that all values in the interval
are within a factor of (B/A)1/2 of the geometric mean of A and B. The description of
uncertainties in terms of uncertainty factors is simply a convenient way of summarising
conclusions regarding uncertainties in model components and has no implications with
regard to the central value or the distribution of possible values of a model component.
(298) Unless otherwise indicated, the following consideration of uncertainties in
anatomical and physiological characteristics of the alimentary tract refers to a young or
middle-aged adult male of weight 73 kg and height 176 cm. Uncertainties are usually
smaller for young or middle-aged males than for other segments of the population due to
greater availability of information for this group, but there are exceptions. For example,
knowledge of the retention time of material in the walls of the gastrointestinal tract is no
better for young or middle-aged adult males than for other age-groups.
Human Alimentary Tract Model - Chapitre 8 - Application – 16 August 2004
137
(299) Uncertainties are discussed in the following sections for a number of parameters of
the model, considering the effect on doses of uncertainties in radionuclide absorption,
location of target cells for cancer induction, transit times of materials through the lumen of
the tract, and dimensions of the colon.
8.3.2 Uncertainty in radionuclide absorption
(300) The uncertainty in fractional uptake from the gastrointestinal tract to blood varies
considerably from one element to another. In a relative sense, uncertainties in fractional
uptake are smallest for elements that are known to be nearly completely absorbed,
including hydrogen (as tritium), carbon, sodium, chlorine, potassium, bromine, rubidium,
molybdenum, iodine, caesium, thallium, fluorine, sulphur, and germanium. An uncertainty
factor in the range 1.1-1.5 might be appropriate for each of these elements, depending on
the quality and completeness of the data base for individual elements. Average uptake
from the gastrointestinal tract is also reasonably well established for several frequently
studied elements whose absorption is incomplete but represents at least a few percent of
intake, such as copper, zinc, magnesium, technetium, arsenic, calcium, strontium, barium,
radium, lead, iron, manganese, cobalt, and uranium. Uncertainty factors for these
elements would also vary with the element and generally would be greater than 1.5 but no
more than about 3. Relative uncertainties generally are greater for the remaining elements
due to sparsity of direct observations on human subjects (e.g. ruthenium, silver),
inconsistencies in reported absorption fractions (e.g. beryllium, antimony, silicon), or
absorption too low to be determined with much precision under most conditions (e.g. most
actinide and lanthanide elements). Absorption of a few poorly absorbed elements such as
plutonium, americium, and curium has been studied under controlled conditions in human
subjects, and average uptake in the adult may be known within a factor of 3 – 4 for these
elements. Relative uncertainties may be greatest for several elements whose absorption
has not been studied in man but for which animal data or other indirect evidence indicates
absorption of at most a few hundredths of a percent, such as samarium, gadolinium,
dysprosium, erbium, thulium, actinium, yttrium, and scandium. Absorption fractions for
these elements are order-of-magnitude estimates. Annex E presents data on the
absorption of selected elements, illustrating the types and quality of information available.
(301) As discussed in Chapter 3, Harrison et al. (2001) assessed uncertainties in
absorption of ingested radionuclides for selected elements and considered the effect of
these uncertainties on dose estimates. The available data are summarised in chapter 3 for
the examples of 90Sr, 106Ru and 239Pu, and A and B values relating to 90% confidence
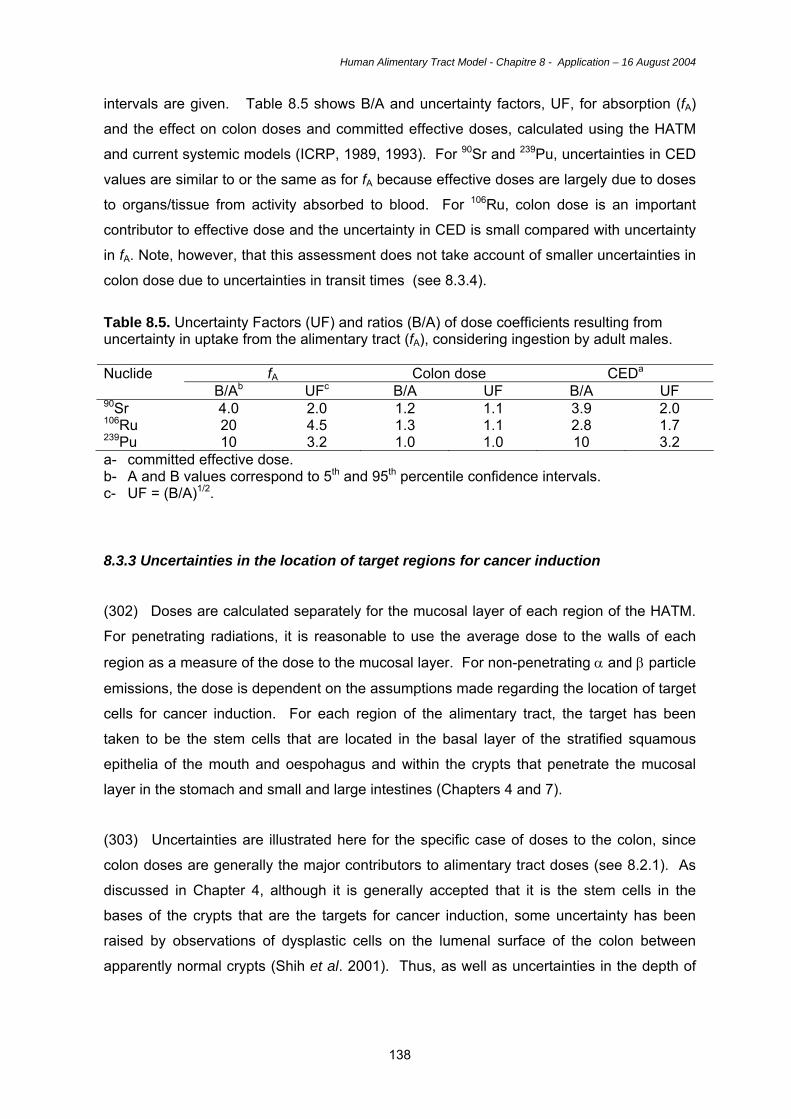
Human Alimentary Tract Model - Chapitre 8 - Application – 16 August 2004
138
intervals are given. Table 8.5 shows B/A and uncertainty factors, UF, for absorption (fA)
and the effect on colon doses and committed effective doses, calculated using the HATM
and current systemic models (ICRP, 1989, 1993). For 90Sr and 239Pu, uncertainties in CED
values are similar to or the same as for fA because effective doses are largely due to doses
to organs/tissue from activity absorbed to blood. For 106Ru, colon dose is an important
contributor to effective dose and the uncertainty in CED is small compared with uncertainty
in fA. Note, however, that this assessment does not take account of smaller uncertainties in
colon dose due to uncertainties in transit times (see 8.3.4).
Table 8.5. Uncertainty Factors (UF) and ratios (B/A) of dose coefficients resulting from uncertainty in uptake from the alimentary tract (fA), considering ingestion by adult males.
fA Colon dose CEDa Nuclide B/Ab UFc B/A UF B/A UF
90Sr 4.0 2.0 1.2 1.1 3.9 2.0 106Ru 20 4.5 1.3 1.1 2.8 1.7 239Pu 10 3.2 1.0 1.0 10 3.2 a- committed effective dose. b- A and B values correspond to 5th and 95th percentile confidence intervals. c- UF = (B/A)1/2. 8.3.3 Uncertainties in the location of target regions for cancer induction
(302) Doses are calculated separately for the mucosal layer of each region of the HATM.
For penetrating radiations, it is reasonable to use the average dose to the walls of each
region as a measure of the dose to the mucosal layer. For non-penetrating α and β particle
emissions, the dose is dependent on the assumptions made regarding the location of target
cells for cancer induction. For each region of the alimentary tract, the target has been
taken to be the stem cells that are located in the basal layer of the stratified squamous
epithelia of the mouth and oespohagus and within the crypts that penetrate the mucosal
layer in the stomach and small and large intestines (Chapters 4 and 7).
(303) Uncertainties are illustrated here for the specific case of doses to the colon, since
colon doses are generally the major contributors to alimentary tract doses (see 8.2.1). As
discussed in Chapter 4, although it is generally accepted that it is the stem cells in the
bases of the crypts that are the targets for cancer induction, some uncertainty has been
raised by observations of dysplastic cells on the lumenal surface of the colon between
apparently normal crypts (Shih et al. 2001). Thus, as well as uncertainties in the depth of
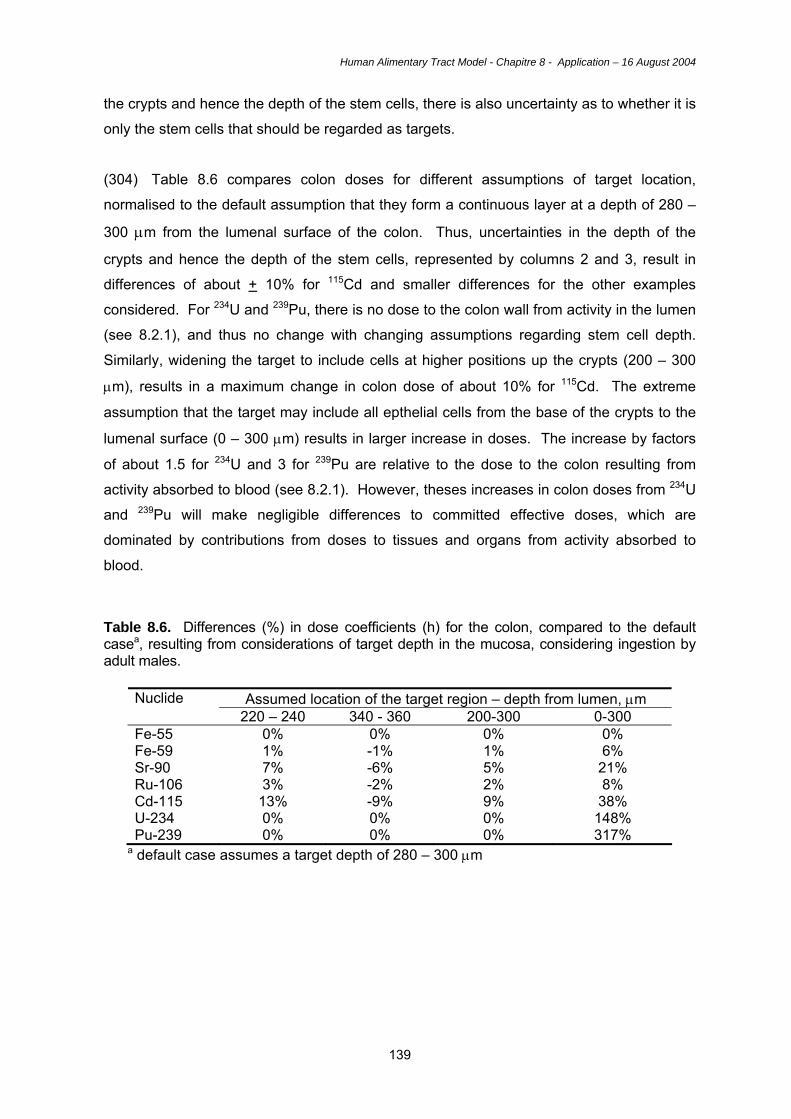
Human Alimentary Tract Model - Chapitre 8 - Application – 16 August 2004
139
the crypts and hence the depth of the stem cells, there is also uncertainty as to whether it is
only the stem cells that should be regarded as targets.
(304) Table 8.6 compares colon doses for different assumptions of target location,
normalised to the default assumption that they form a continuous layer at a depth of 280 –
300 µm from the lumenal surface of the colon. Thus, uncertainties in the depth of the
crypts and hence the depth of the stem cells, represented by columns 2 and 3, result in
differences of about + 10% for 115Cd and smaller differences for the other examples
considered. For 234U and 239Pu, there is no dose to the colon wall from activity in the lumen
(see 8.2.1), and thus no change with changing assumptions regarding stem cell depth.
Similarly, widening the target to include cells at higher positions up the crypts (200 – 300
µm), results in a maximum change in colon dose of about 10% for 115Cd. The extreme
assumption that the target may include all epthelial cells from the base of the crypts to the
lumenal surface (0 – 300 µm) results in larger increase in doses. The increase by factors
of about 1.5 for 234U and 3 for 239Pu are relative to the dose to the colon resulting from
activity absorbed to blood (see 8.2.1). However, theses increases in colon doses from 234U
and 239Pu will make negligible differences to committed effective doses, which are
dominated by contributions from doses to tissues and organs from activity absorbed to
blood.
Table 8.6. Differences (%) in dose coefficients (h) for the colon, compared to the default casea, resulting from considerations of target depth in the mucosa, considering ingestion by adult males.
Assumed location of the target region – depth from lumen, µm Nuclide 220 – 240 340 - 360 200-300 0-300
Fe-55 0% 0% 0% 0% Fe-59 1% -1% 1% 6% Sr-90 7% -6% 5% 21% Ru-106 3% -2% 2% 8% Cd-115 13% -9% 9% 38% U-234 0% 0% 0% 148% Pu-239 0% 0% 0% 317%
a default case assumes a target depth of 280 – 300 µm
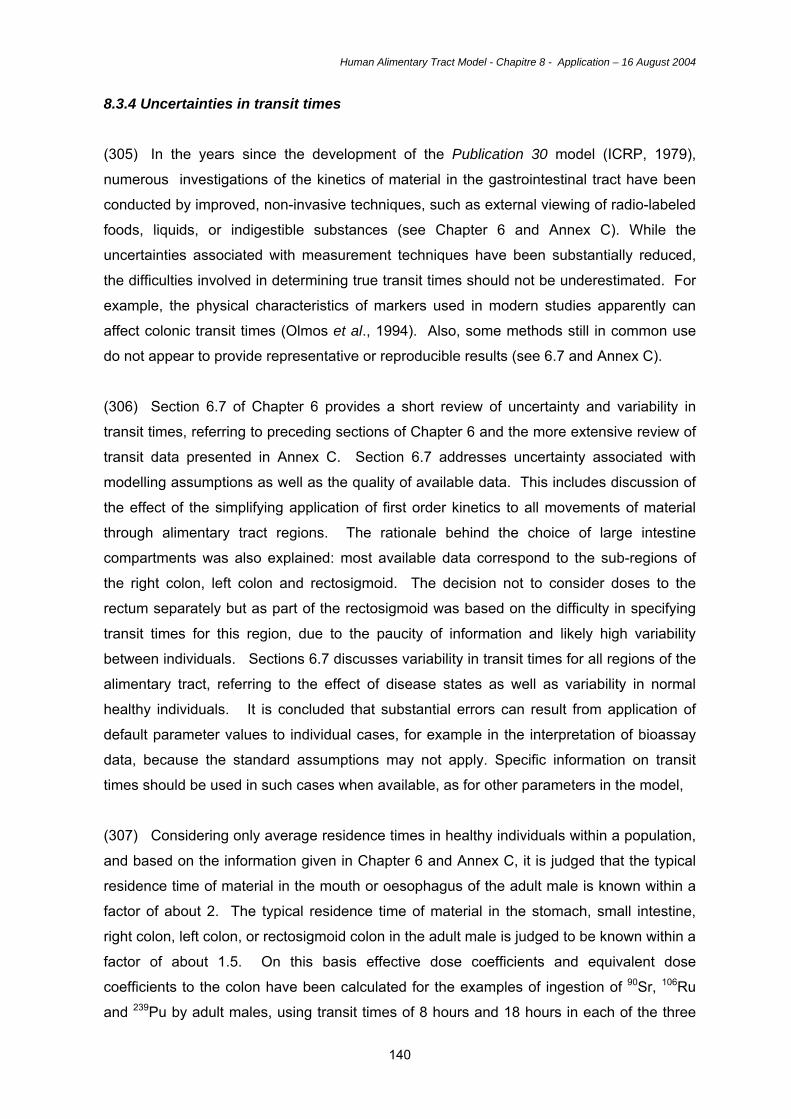
Human Alimentary Tract Model - Chapitre 8 - Application – 16 August 2004
140
8.3.4 Uncertainties in transit times
(305) In the years since the development of the Publication 30 model (ICRP, 1979),
numerous investigations of the kinetics of material in the gastrointestinal tract have been
conducted by improved, non-invasive techniques, such as external viewing of radio-labeled
foods, liquids, or indigestible substances (see Chapter 6 and Annex C). While the
uncertainties associated with measurement techniques have been substantially reduced,
the difficulties involved in determining true transit times should not be underestimated. For
example, the physical characteristics of markers used in modern studies apparently can
affect colonic transit times (Olmos et al., 1994). Also, some methods still in common use
do not appear to provide representative or reproducible results (see 6.7 and Annex C).
(306) Section 6.7 of Chapter 6 provides a short review of uncertainty and variability in
transit times, referring to preceding sections of Chapter 6 and the more extensive review of
transit data presented in Annex C. Section 6.7 addresses uncertainty associated with
modelling assumptions as well as the quality of available data. This includes discussion of
the effect of the simplifying application of first order kinetics to all movements of material
through alimentary tract regions. The rationale behind the choice of large intestine
compartments was also explained: most available data correspond to the sub-regions of
the right colon, left colon and rectosigmoid. The decision not to consider doses to the
rectum separately but as part of the rectosigmoid was based on the difficulty in specifying
transit times for this region, due to the paucity of information and likely high variability
between individuals. Sections 6.7 discusses variability in transit times for all regions of the
alimentary tract, referring to the effect of disease states as well as variability in normal
healthy individuals. It is concluded that substantial errors can result from application of
default parameter values to individual cases, for example in the interpretation of bioassay
data, because the standard assumptions may not apply. Specific information on transit
times should be used in such cases when available, as for other parameters in the model,
(307) Considering only average residence times in healthy individuals within a population,
and based on the information given in Chapter 6 and Annex C, it is judged that the typical
residence time of material in the mouth or oesophagus of the adult male is known within a
factor of about 2. The typical residence time of material in the stomach, small intestine,
right colon, left colon, or rectosigmoid colon in the adult male is judged to be known within a
factor of about 1.5. On this basis effective dose coefficients and equivalent dose
coefficients to the colon have been calculated for the examples of ingestion of 90Sr, 106Ru
and 239Pu by adult males, using transit times of 8 hours and 18 hours in each of the three
Human Alimentary Tract Model - Chapitre 8 - Application – 16 August 2004
141
segments of the colon (the default value is 12 hours for each segment). In the cases of 90Sr
and 106Ru the uncertainty factors for colon dose are 1.5 and 1.4 respectively, which are
nearly the same as that for transit time, reflecting their close association. For 239Pu, colon
dose arises solely from activity absorbed to blood, and variations in transit time have no
effect on colon dose. For 106Ru the colon dose from activity in the contents makes an
important contribution to effective dose, and thus the uncertainty in transit times leads to an
uncertainty factor in effective dose of about 1.2. In contrast for 90Sr and 239Pu, colon doses
contribute very little to effective doses and results are unchanged by variations in transit
time.
Table 8.7. Uncertainty Factors (UF) and ratios of dose coefficients (B/A) resulting from uncertainty in transit times in the colona, considering ingestion by adult males.
Colon dose CEDb Nuclide B/Ac UFd B/A UF
90Sr 2.3 1.5 1.0 1.0 106Ru 2.0 1.4 1.3 1.2 239Pu 1.0 1.0 1.0 1.0
a- for colon transit time, B/A = 2.3 (18/8), and UF = 1.5 (√2.3) b- committed effective dose. c- A and B values correspond to 5th and 95th percentile confidence intervals. d- UF = (B/A)1/2.
8.3.5 Uncertainty in anatomical features
(308) The dimensions and geometrical configurations of the structures of the tract were
formerly estimated from measurements on cadavers, and those estimates often did not
closely reflect conditions in the living body. More accurate determination of the geometry of
the gastrointestinal tract of a living person has become possible with the advent of external
visualisation techniques with high resolution. Nevertheless, it remains difficult to determine
typical sizes, shapes, and relative positions of structures of the tract with high accuracy due
to the considerable variability in these features from one person to another and from one
body position to another in the same person.
(309) Uncertainty factors of about 1.4 are assigned to the dimensions (e.g., length and
width, or internal diameter of the lumen) of most structures within the alimentary tract.
However, an uncertainty factor of 2 is assigned to the internal diameter of the oesophagus,
Human Alimentary Tract Model - Chapitre 8 - Application – 16 August 2004
142
for which the average over time is difficult to estimate in the living body. The typical internal
diameter of the oral cavity appears to be known within a factor of about 1.3.
(310) An uncertainty factor of 1.4 in the length of a region leads to the same uncertainty
factor in dose to the region, assuming that all other parameters remain unchanged, since
the mass of the target region is proportional to the length of the region. In practice, the
length of a region may be correlated with the transit time. For example, an increase in
length of a region could lead to an increase in transit time by the same factor with the result
that the dose is unaltered. This would tend to reduce the UF in dose to below 1.4.
(311) In order to examine the effect of uncertainty in diameter, the dose per nuclear
transformation (SEE value, Chapter 7) for a 6 cm diameter section is compared with that for
a 3 cm diameter section (UF of 1.4 in the parameter). Strontium-90 (mean beta energy =
0.20 MeV) and 90Y (mean beta energy = 0.94 MeV) are chosen to represent a range of
energies. In both cases the uncertainty factor in SEE is about 1.9. In contrast to other
parameters, this is a case where the uncertainty factor for the result (SEE or dose) is larger
than in the parameter (diameter). This is because the UF in the cross-sectional area of the
section, which is an indicator of the extent of energy absorption within the lumen, is 2 for a
UF of 1.4 in the diameter. However, such uncertainties in colon dose from 90Sr/90Y will have
a negligible effect on committed effective dose which is dominated by doses to tissues from
activity absorbed to blood
8. 4. Key features of the HATM
(312) The main features of the HATM can be summarised as follows:
• Inclusion of all alimentary tract regions. Doses are calculated for the oral cavity,
oesophagus, stomach, small intestine, right colon, left colon and rectosigmoid
(including the rectum). Colon doses are combined as a mass-weighted mean.
• Age-dependent parameter values for the dimensions of alimentary tract regions and
associated transit times of contents through the regions.
• Gender-dependent parameter values for adults for dimensions and transit times.
• Transit times for food and liquids, as well as for total diet, for the mouth, oesophagus
and stomach.
• Default assumption that total fractional absorption, fA, of an element and its
radioisotopes to blood occurs in the small intestine, ie. fSI = fA.
Human Alimentary Tract Model - Chapitre 8 - Application – 16 August 2004
143
• Model structure to allow for absorption in other regions, in situations where
information is available.
• Model structure to allow for retention in the mucosal tissues of the walls of alimentary
tract regions, and on teeth, in situations where information is available.
• Explicit calculations of dose to target regions for cancer induction within each
alimentary tract region, considering doses from radionuclides in the contents of the
regions, and considering mucosal retention of radionuclides when this is taken into
account.
(313) The oral cavity and oesophagus will receive very low doses from ingested
radionuclides in transit because of their short retention times (see Chapter 6 and 8.2.1).
However, these regions were included for completeness, because a specific wT was
assigned to the oesophagus in Publication 60 (ICRP, 1991), and because retention in the
mouth, on teeth for example (see 8.2.2), can result in a substantial increase in dose to the
oral mucosa. In general, the alimentary tract regions of greatest importance in terms of
doses and cancer risk are the stomach and particularly the colon. While the small intestine
may receive greater doses than the stomach, it is not sensitive to radiation-induced cancer
and is not assigned a specific wT value. Doses are calculated separately for the right colon,
left colon and rectosigmoid. This partitioning of the colon for the purposes of dose
calculations is predicated on the availability of transit time data. The rectum is taken to be
part of the recosigmoid, because of difficulties in determining transit times separately and
because the rectum does not have a specific wT value.
(314) Transit times are generally shorter in infants and children than in adults (see
Chapter 6) and, on this basis, the application of the Publication 30 model (for reference
adults) in a number of ICRP publications (e.g. Publication 72, 1996) considering
radionuclide ingestion by infants and children will have overestimated doses. In adults,
mean transit times for the stomach and colon are about one-third greater in females than
males. Slightly smaller masses in females (e.g. 10% lower mass of colon tissue) will
compound this gender difference.
(315) It is not within the scope of this report to specify values for the fractional absorption
of elements and their radioisotopes from the alimentary tract to blood (fA). This will be done
in forthcoming publications in which doses are calculated using the HATM. In general, the
values of fA will be the same as the f1 values given previously for use with the Publication
30 model, since in most cases there is unlikely to be sufficient new information to warrant a
Human Alimentary Tract Model - Chapitre 8 - Application – 16 August 2004
144
revision in values. In addition, the general default assumption will be that absorption
occurs solely from the small intestine, as in the Publication 30 model; that is, fSI = fA.
However, the HATM allows absorption to be specified for other regions as well as the small
intestine. As discussed for the examples of isotopes of iodine (see 8.2.4), doses to
alimentary tract regions and other tissues will in many cases be insensitive to assumptions
regarding the site of absorption.
(316) Human and animal data suggesting or showing retention of ingested radionuclides
in mucosal tissues of the walls of alimentary tract regions, principally the small intestine,
can be used to specify retention in the HATM. The inability of the Publication 30 model to
take account of such retention has long been regarded as an important deficiency.
However, as illustrated by calculations for examples from the few cases for which
quantitative information can be derived (59Fe, 239Pu in neonates; see 8.2.3), inclusion of
retention may not result in large increases in doses to the small intestine and increases in
committed effective doses are likely to be small.
(317) An important development in the HATM is the methodology used to calculate doses
in the various regions from non-penetrating alpha and electron radiations. Thus, while the
Publication 30 approach was to assume that the dose to the wall was one half of that to
contents of the region, with an additional factor of 0.01 included for alpha particles to allow
for their short range (see section 1.2), the HATM takes explicit account of the location of
the target tissue in the mucosal layer of the wall of each region. The targets relating to
cancer induction are taken in each case to be the epithelial stem cells, located in the basal
layers of the stratified epithelia of the oral cavity and oesophagus and within the crypts that
replenish the single cell layer epithelium of the stomach and small and large intestines (see
Chapters 4 and 7).
(318) As discussed in 8.2.1 and illustrated in Table 8.8, the HATM results in substantially
lower estimates of doses to the colon than obtained using the Publication 30 model. This is
because the HATM takes explicit account dose to the target region throughout the length of
the colon, and of loss of energy in the colon contents and the mucosal tissue overlying the
target stem cells (at a depth of 280 - 300 µm). This reduces energy deposition in the target
tissue for electrons and results in zero dose in the target tissue from alpha particles. In the
absence of retention of radionuclides in the alimentary tract wall, doses from ingested alpha
emitters to all regions of the alimentary tract will be solely due to their absorption to blood
and subsequent irradiation from systemic activity in soft tissues. For the stomach, the
HATM and Publication 30 approaches give more similar estimates of doses from electron-
Human Alimentary Tract Model - Chapitre 8 - Application – 16 August 2004
145
emitting nuclides. Table 8.8 illustrates that the large reductions in colon dose obtained
using the HATM compared with the Publication 30 model, of factors of up to about 5 – 10,
result generally in small changes in committed effective dose, which is dominated in most
cases by doses to tissues and organs resulting from activity absorbed to blood.
(319) The most important uncertainties associated with the HATM and Publication 30
model, in terms of effective doses from ingested radionuclides but not alimentary tract
doses, are uncertainties in fA values. As discussed in 8.3.2, uncertainty factors in fA of 2 for 90Sr and 3.2 for 239Pu translate directly to the same uncertainty factors for committed
effective doses. While uncertainties in typical transit times appear not to be large (see
8.3.4), it is recognised that variability between individuals can be substantial. The transit
times used in the HATM may not be applicable in individual circumstances. Uncertainties
associated with the depth of target tissues in the mucosa of the various alimentary tract
regions are small (see 8.3.3); doses are generally insensitive to the assumed depth of the
stem cells and the use of a wider target including lineage committed and fully differentiated
cells.
(320) The HATM will be applied to the calculation of doses from the ingested
radionuclides in forthcoming ICRP publications on doses to workers and members of the
public. These calculations will use the parameter values given in this report, together with
values of fractional absorption to blood, fA, and additional information on sites of absorption
and retention where available. The use of alternative assumptions is encouraged in
situations where specific information is available.
Table 8.8. Comparisona of ingestion dose coefficients (both equivalent and effective) derived using the HATM with those of the ICRP Publication 30 model.
Regional doses: Radionuclide Stomach Right Colonb Left colonc Effective
Dose Fe-55 0.9 0.5 0.2 -7% Sr-90 1.0 0.2 0.1 -6% Ru-106 1.2 0.2 0.1 -59% Pu-239 0.8 0.4 0.2 nil
a - equivalent dose coefficients are compared as a ratio, effective doses as a fractional change (%). b – compared with the upper large intestine of the ICRP Publication 30 model c – compared with the lower large intestine of the ICRP Publication 30 model
8.6. References
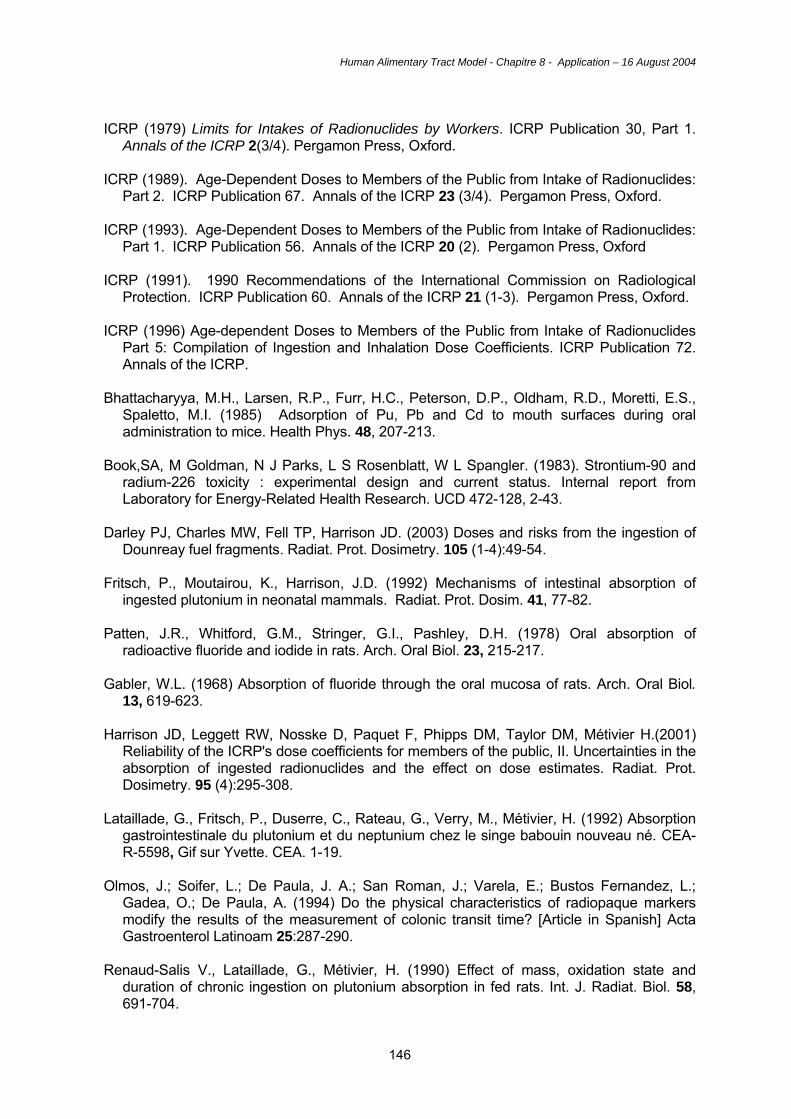
Human Alimentary Tract Model - Chapitre 8 - Application – 16 August 2004
146
ICRP (1979) Limits for Intakes of Radionuclides by Workers. ICRP Publication 30, Part 1.
Annals of the ICRP 2(3/4). Pergamon Press, Oxford. ICRP (1989). Age-Dependent Doses to Members of the Public from Intake of Radionuclides:
Part 2. ICRP Publication 67. Annals of the ICRP 23 (3/4). Pergamon Press, Oxford. ICRP (1993). Age-Dependent Doses to Members of the Public from Intake of Radionuclides:
Part 1. ICRP Publication 56. Annals of the ICRP 20 (2). Pergamon Press, Oxford ICRP (1991). 1990 Recommendations of the International Commission on Radiological
Protection. ICRP Publication 60. Annals of the ICRP 21 (1-3). Pergamon Press, Oxford. ICRP (1996) Age-dependent Doses to Members of the Public from Intake of Radionuclides
Part 5: Compilation of Ingestion and Inhalation Dose Coefficients. ICRP Publication 72. Annals of the ICRP.
Bhattacharyya, M.H., Larsen, R.P., Furr, H.C., Peterson, D.P., Oldham, R.D., Moretti, E.S.,
Spaletto, M.I. (1985) Adsorption of Pu, Pb and Cd to mouth surfaces during oral administration to mice. Health Phys. 48, 207-213.
Book,SA, M Goldman, N J Parks, L S Rosenblatt, W L Spangler. (1983). Strontium-90 and
radium-226 toxicity : experimental design and current status. Internal report from Laboratory for Energy-Related Health Research. UCD 472-128, 2-43.
Darley PJ, Charles MW, Fell TP, Harrison JD. (2003) Doses and risks from the ingestion of
Dounreay fuel fragments. Radiat. Prot. Dosimetry. 105 (1-4):49-54. Fritsch, P., Moutairou, K., Harrison, J.D. (1992) Mechanisms of intestinal absorption of
ingested plutonium in neonatal mammals. Radiat. Prot. Dosim. 41, 77-82. Patten, J.R., Whitford, G.M., Stringer, G.I., Pashley, D.H. (1978) Oral absorption of
radioactive fluoride and iodide in rats. Arch. Oral Biol. 23, 215-217. Gabler, W.L. (1968) Absorption of fluoride through the oral mucosa of rats. Arch. Oral Biol.
13, 619-623. Harrison JD, Leggett RW, Nosske D, Paquet F, Phipps DM, Taylor DM, Métivier H.(2001)
Reliability of the ICRP's dose coefficients for members of the public, II. Uncertainties in the absorption of ingested radionuclides and the effect on dose estimates. Radiat. Prot. Dosimetry. 95 (4):295-308.
Lataillade, G., Fritsch, P., Duserre, C., Rateau, G., Verry, M., Métivier, H. (1992) Absorption
gastrointestinale du plutonium et du neptunium chez le singe babouin nouveau né. CEA-R-5598, Gif sur Yvette. CEA. 1-19.
Olmos, J.; Soifer, L.; De Paula, J. A.; San Roman, J.; Varela, E.; Bustos Fernandez, L.;
Gadea, O.; De Paula, A. (1994) Do the physical characteristics of radiopaque markers modify the results of the measurement of colonic transit time? [Article in Spanish] Acta Gastroenterol Latinoam 25:287-290.
Renaud-Salis V., Lataillade, G., Métivier, H. (1990) Effect of mass, oxidation state and
duration of chronic ingestion on plutonium absorption in fed rats. Int. J. Radiat. Biol. 58, 691-704.
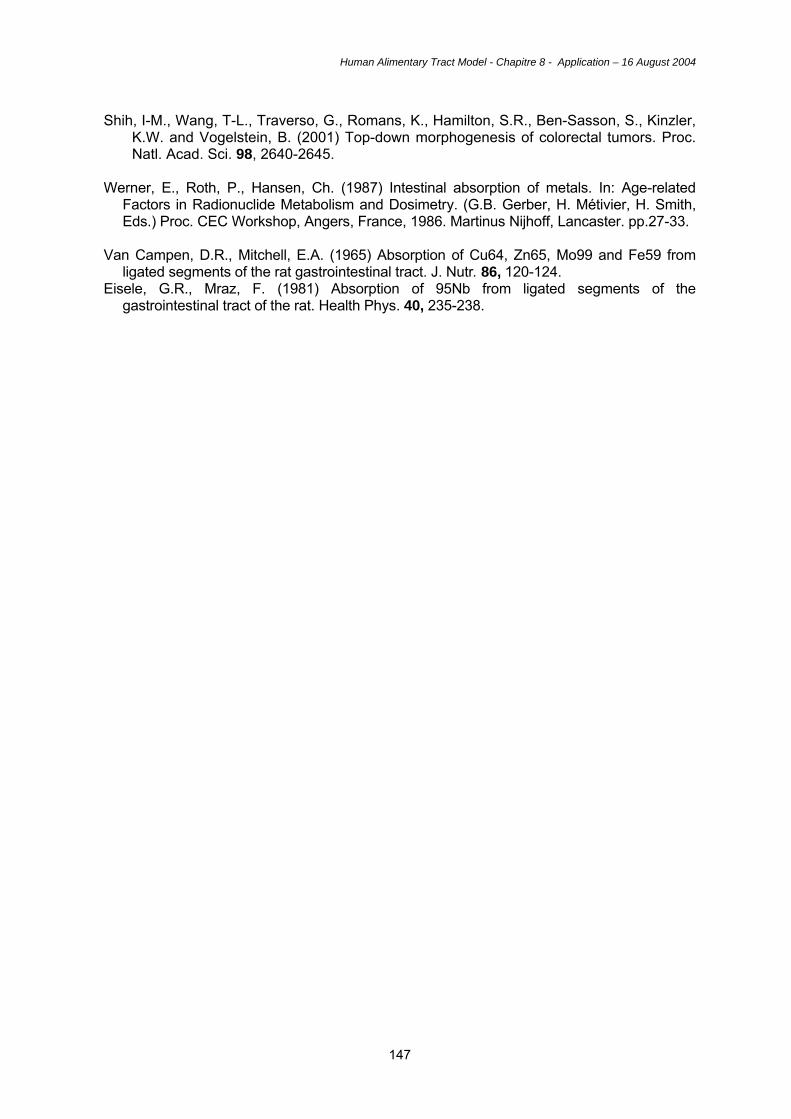
Human Alimentary Tract Model - Chapitre 8 - Application – 16 August 2004
147
Shih, I-M., Wang, T-L., Traverso, G., Romans, K., Hamilton, S.R., Ben-Sasson, S., Kinzler,
K.W. and Vogelstein, B. (2001) Top-down morphogenesis of colorectal tumors. Proc. Natl. Acad. Sci. 98, 2640-2645.
Werner, E., Roth, P., Hansen, Ch. (1987) Intestinal absorption of metals. In: Age-related
Factors in Radionuclide Metabolism and Dosimetry. (G.B. Gerber, H. Métivier, H. Smith, Eds.) Proc. CEC Workshop, Angers, France, 1986. Martinus Nijhoff, Lancaster. pp.27-33.
Van Campen, D.R., Mitchell, E.A. (1965) Absorption of Cu64, Zn65, Mo99 and Fe59 from
ligated segments of the rat gastrointestinal tract. J. Nutr. 86, 120-124. Eisele, G.R., Mraz, F. (1981) Absorption of 95Nb from ligated segments of the
gastrointestinal tract of the rat. Health Phys. 40, 235-238.
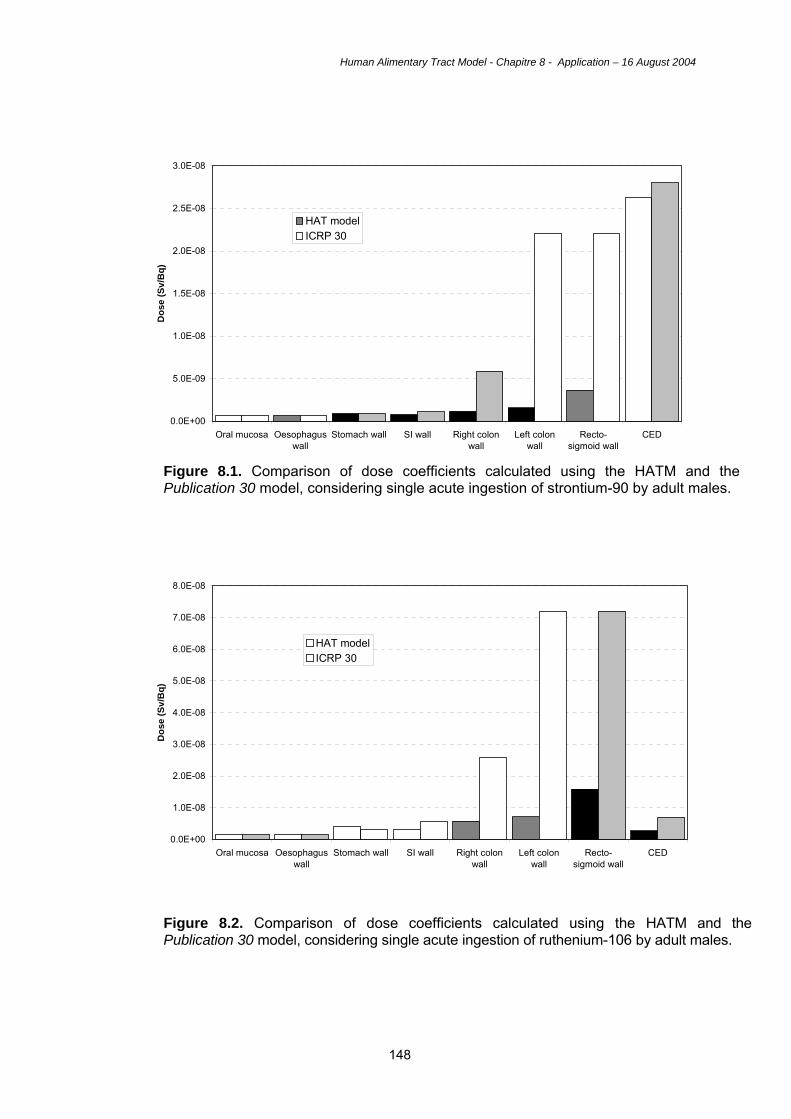
Human Alimentary Tract Model - Chapitre 8 - Application – 16 August 2004
148
Figure 8.1. Comparison of dose coefficients calculated using the HATM and the Publication 30 model, considering single acute ingestion of strontium-90 by adult males.
Figure 8.2. Comparison of dose coefficients calculated using the HATM and the Publication 30 model, considering single acute ingestion of ruthenium-106 by adult males.
0.0E+00
5.0E-09
1.0E-08
1.5E-08
2.0E-08
2.5E-08
3.0E-08
Oral mucosa Oesophaguswall
Stomach wall SI wall Right colonwall
Left colonwall
Recto-sigmoid wall
CED
Dos
e (S
v/B
q)
HAT modelICRP 30
0.0E+00
1.0E-08
2.0E-08
3.0E-08
4.0E-08
5.0E-08
6.0E-08
7.0E-08
8.0E-08
Oral mucosa Oesophaguswall
Stomach wall SI wall Right colonwall
Left colonwall
Recto-sigmoid wall
CED
Dos
e (S
v/B
q)
HAT modelICRP 30
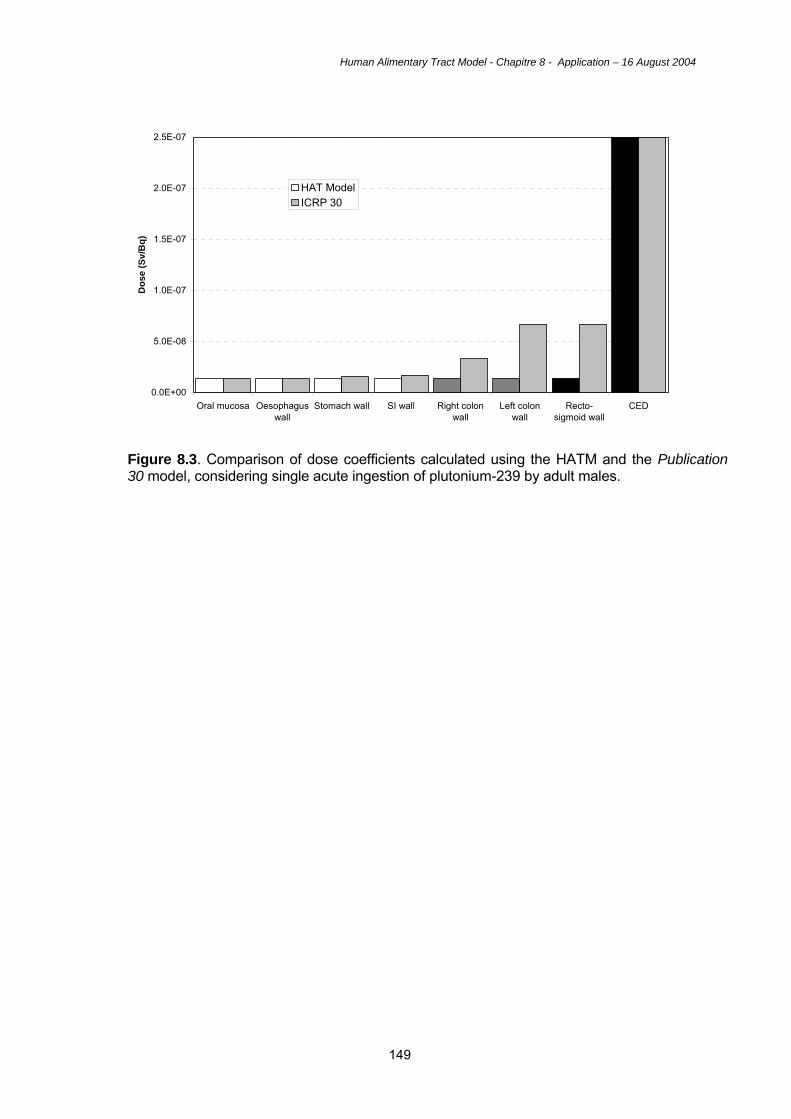
Human Alimentary Tract Model - Chapitre 8 - Application – 16 August 2004
149
Figure 8.3. Comparison of dose coefficients calculated using the HATM and the Publication 30 model, considering single acute ingestion of plutonium-239 by adult males.
0.0E+00
5.0E-08
1.0E-07
1.5E-07
2.0E-07
2.5E-07
Oral mucosa Oesophaguswall
Stomach wall SI wall Right colonwall
Left colonwall
Recto-sigmoid wall
CED
Dos
e (S
v/B
q)
HAT ModelICRP 30