2.3 system concepts and applications/media/resources/documents...energ y supply transfer, storag e,...
TRANSCRIPT

Werner WeissAEE - Institute for Sustainable Technologies (AEE IN TEC)A-8200 Gleisdorf, Feldgasse 19AUSTRIA
SYSTEM CONCEPTSAND APPLICATIONS

PLASTIC ABSORBERS
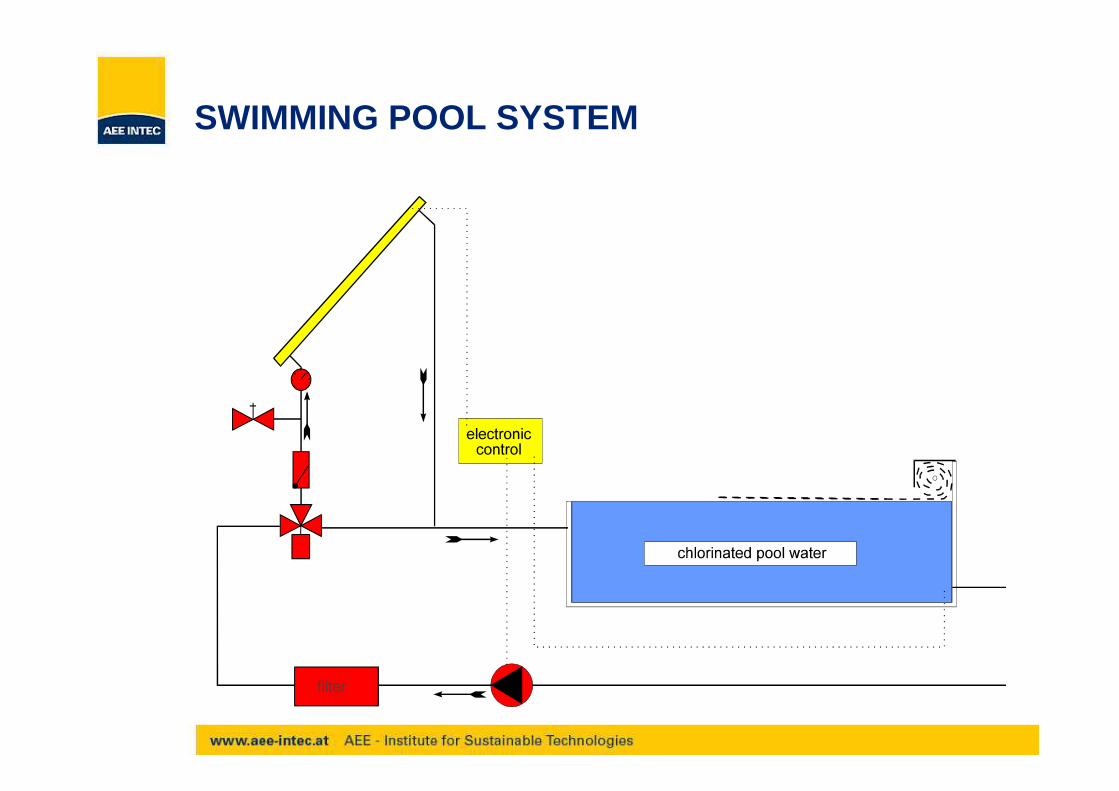
SWIMMING POOL SYSTEM

SWIMMING POOL SYSTEM

SWIMMING POOL SYSTEM
The energy demand of an outdoor pool is mostly influenced by the water temperature.
The largest losses are the surface of the pools.
That is the reason why the size of the absorber area is given as a proportion of the total water surface area.
As a rule of thumb, this should be between 80 and 100% of the pool area for weather conditions in central Europe.

Thermosyphon Systems for Hot Water Preparation
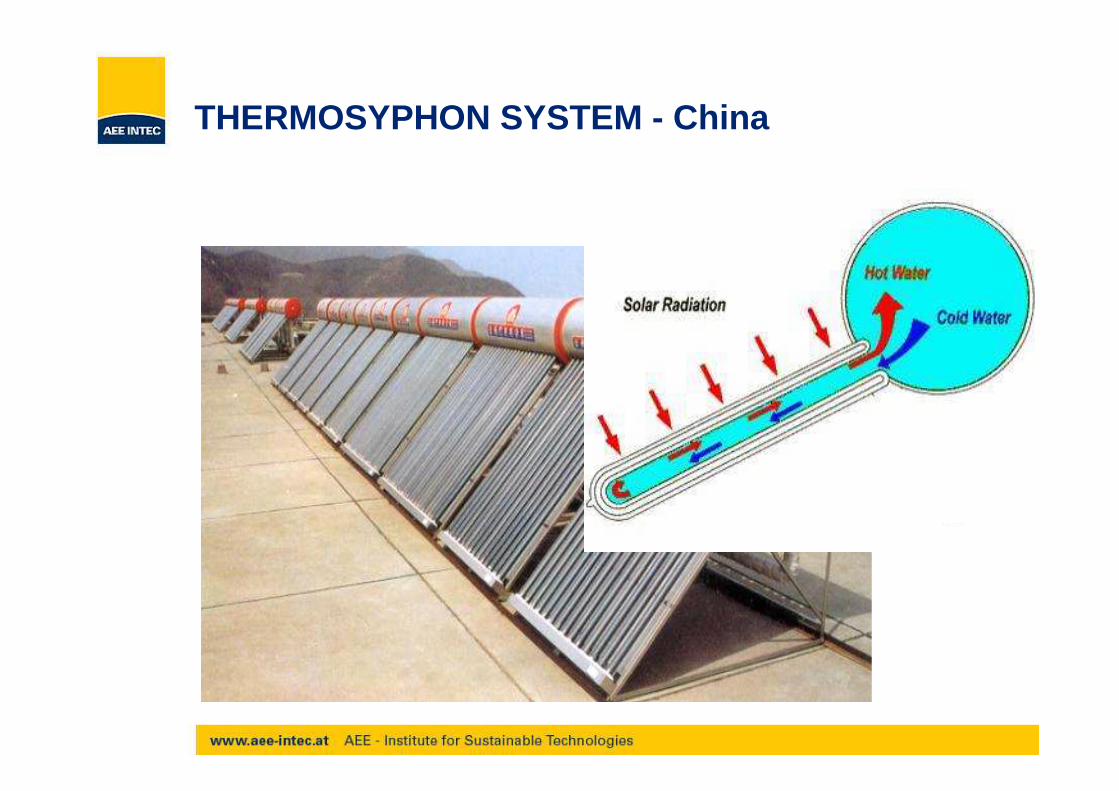
THERMOSYPHON SYSTEM - China

THERMOSYPHON SYSTEMS

INDIRECT SYSTEM

Indirect Thermosyphon System
Source: TONG HUA, China

Thermosyphon Systems – Balcony systems

Thermosyphon Systems – Balcony systems

Thermosyphon Systems – Balcony systems

Domestic Hot Water System with Forced Circulation

Domestic Hot Water System with Forced Circulation
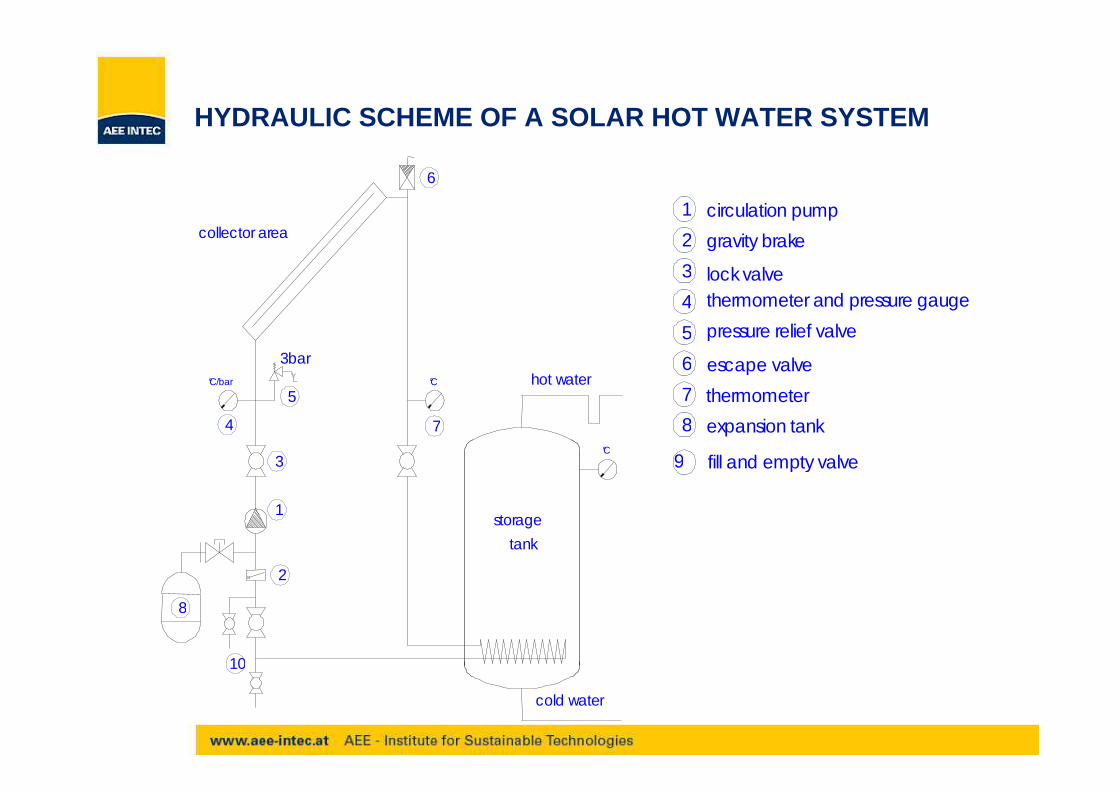
HYDRAULIC SCHEME OF A SOLAR HOT WATER SYSTEM
°C
tank
storage
hot water
cold water
3bar°C/bar
collector area
°C
1
2
3
5
6
7
10
8
4
escape valve
1
fill and empty valve
expansion tank
thermometer
pressure relief valve
thermometer and pressure gaugelock valve
gravity brake
circulation pump
9
8
7
6
5
4
3
2

Solar Combisystems
PreconditionsPreconditions
and and
RequirementsRequirements

Solar Combisystems
Jan Feb Mar Apr May Jun Jul Aug Sep Oct Nov Dec Jan
Total: 1126.91kWh/m²
0,0
0,9
1,8
2,7
3,6
4,5
5,4
6,3
7,2
8,1
9,0
[kWh/m²] Solar-Radiation

0
500
1000
1500
2000
2500
3000
Jan Feb Mar Apr May Jun Jul Aug Sep Oct Nov Dec
[kWh/month] Excess irradiation Excess consumption
Usable solar energy Irradiation
Reference consumption
3000
2500
2000
1500
1000
500
0
1
2
3
1
Solar Combisystems

Seasonal variations of the heat demand for space heating and DHW
Solar Combisystems

Hot WaterHot WaterHot water temperature: 60 °C
Cold water: 6 - 12 °C
W a rm w a sse rve rbra uch- Ta ge spro fi l
-40
-30
-20
-10
0
10
20
30
40
50
60
70
3,11 1 2 3 4 5 6 7 8 9 10 11 12 13 14 15 16 17 18 19 20 21 22 23 0
Z e it
Tem
pera
tur [
°C]
0
25
50
75
100
125
150
175
200
225
250
275
Zap
fmen
ge [l
/h]
Solar Combisystems

Space HeatingSpace Heating
Flow temperature: 30 - 50 °CReturn temperature: 20 - 40 °C
Demand:• is not always corresponding to the solar
irradiation
• varies in dependence of ambient temperature, passive solar gains and the internal gains of the
building
Solar Combisystems

Designs
ENERGY SUPPLY TRANSFER, STORAGE, CONTROL AND DISTRIB UTION LOAD
M
M
M
S A H1 (H2)
ENERGY SUPPLY TRANSFER, STORAGE, CONTROL AND DISTRIB UTION LOAD
M
H2
S
A H1
ENERGY SUPPLY TRANSFER, STORAGE, CONTROL AND DISTRIB UTION LOAD
M
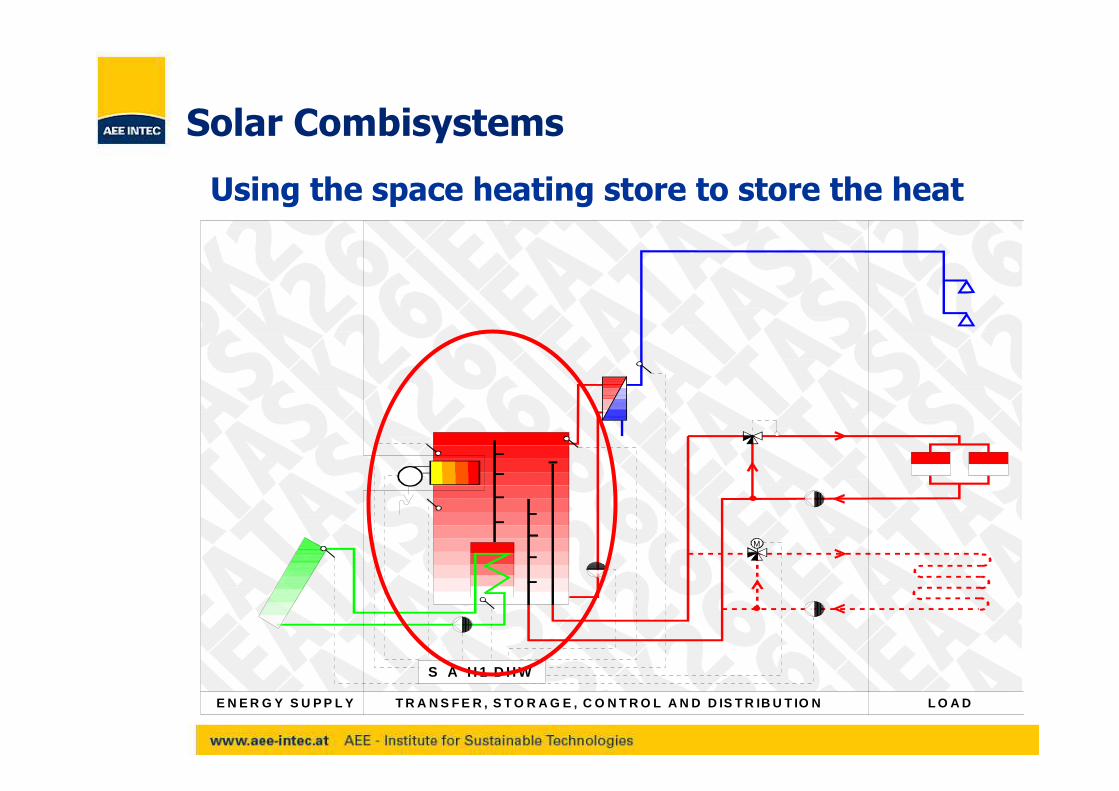
S A H1 DHW
Solar Combisystems

System using the thermal mass of the building to st ore the heat
E N E R G Y S U P P L Y T R A N S F E R , S T O R A G E , C O N T R O L A N D D IS T R IB U T IO N L O A D
M
M
M
S A H 1 (H 2)
Solar Combisystems
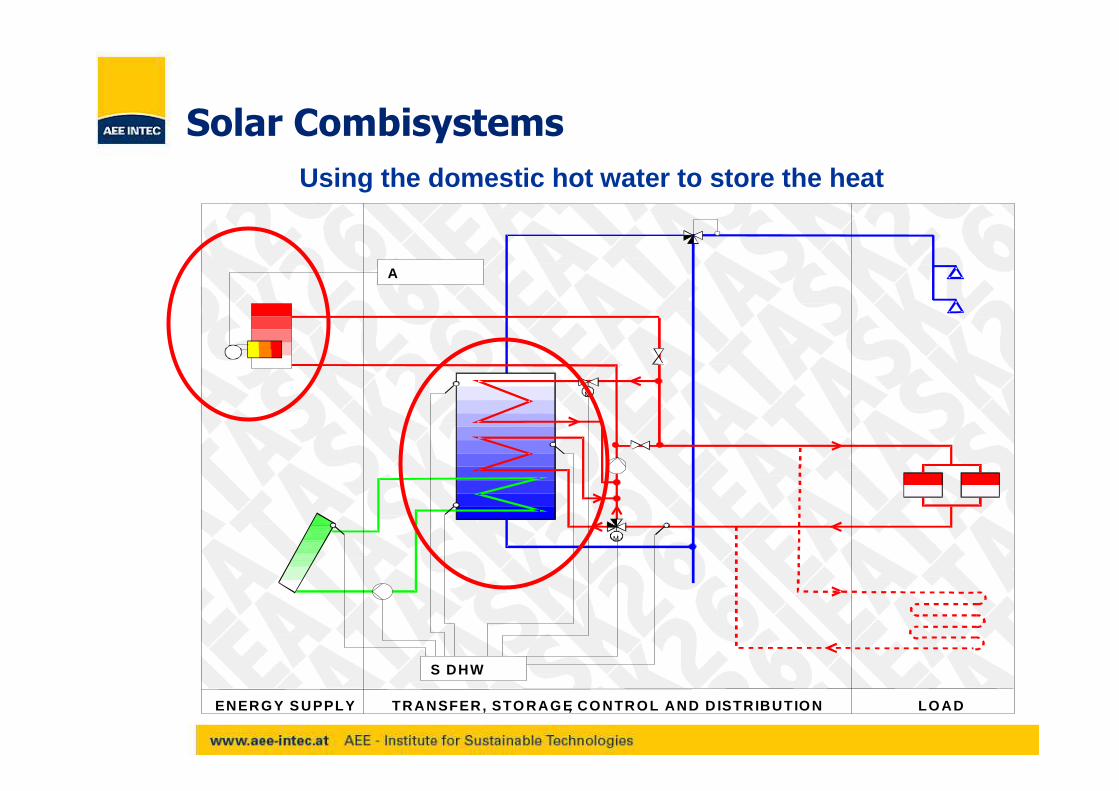
Using the domestic hot water to store the heat
ENERG Y SUPPLY TRANSFER, STO RAG E, CO NTRO L AND D ISTRIB UTIO N LO AD
M
M
S DHW
A
Solar Combisystems

E N E R G Y S U P P L Y T R A N S F E R , S T O R A G E , C O N T R O L A N D D IS T R IB U T IO N L O A D
M
H2
S
A H1
Using the domestic hot water to store the heat
Solar Combisystems
E N E R G Y S U P P L Y T R A N S F E R , S T O R A G E , C O N T R O L A N D D IS T R IB U T IO N L O A D
M
S A H 1 D H W
Using the space heating store to store the heat
Solar Combisystems

From
Complex
Designs…
Solar Combisystems

…to
Compact
Products
Solar Combisystems

Warmwasser
Heizkreis
Kollektor
KW
1996
Warmwasser
Kollektor
KW Heizkreis
1995
0
5
10
15
20
25
30
35
1 2 3
H yd rau lic C o n n ec tio n s
0
0 ,5
1
1 ,5
2
2 ,5
3
3 ,5
4
4 ,5
5
[m²]
1 2 3
S pa ce R e qu ire m en t
0
50
100
150
200
250
[kg]
1 2 3
W eig h t
Optimisation (SOLVIS)
Solar Combisystems

Solar Combisystems

Sizes SystemSytem Sizes of Solar Combisystems in different Euro pean Countries
0
500
1000
1500
2000
2500
3000
3500
4000
4500
5000
0 5 10 15 20 25 30 35 40 45 50 55 60 65
Collector Area [m²]
Sto
rage
Vol
ume
[ltr]
Austria
Denmark
France
Germany
Sweden
Italy
Netherlands
Solar Combisystems

Costs of Solar Combisystems in different European C ountries
0
200
400
600
800
1.000
1.200
1.400
1.600
1.800
2.000
0 5 10 15 20 25 30 35 40 45 50 55 60 65
Collector Area [m²]
Sys
tem
Cos
ts [€
/m² c
olle
ctor
are
a]
Inst. incl., Aux. excl., heat delivery excl. - Austria Inst. excl., Aux. excl., heat delivery excl. - Austria Inst. incl., Aux excl., heat delivery excl. - Denmark
Inst. excl., Aux. incl., heat delivery excl. - Germany Inst. excl., Aux. incl., heat delivery excl. - Netherlands Inst. incl., Aux. excl., heat delivery excl. - Italy
Inst. excl., Aux. excl., heat delivery excl. - Italy Inst. incl., Aux. excl., heat delivery excl. - France Inst. excl., Aux. incl., heat delivery incl. - France
Inst. excl., Aux. incl., heat delivery excl. - France Inst. excl., Aux. excl., heat delivery incl. - France Inst. excl., Aux. incl., heat delivery excl. - Sweden
Inst. excl., Aux. excl., heat delivery excl. - Sweden
Germany
Denmark, Sweden, Austria
Solar Combisystems

MULTI FAMILY HOUSES

Market Penetration
1,9 MioHauptwohnsitze
~ 1 ProzentDurchdringung
0
10
20
30
40
50
60
70
80
90
100
110
Geschoßwohnbauten
Pot
enzi
al u
nd M
arkt
durc
hdrin
gung
[%]
.
Geschoß-
wohnbauten
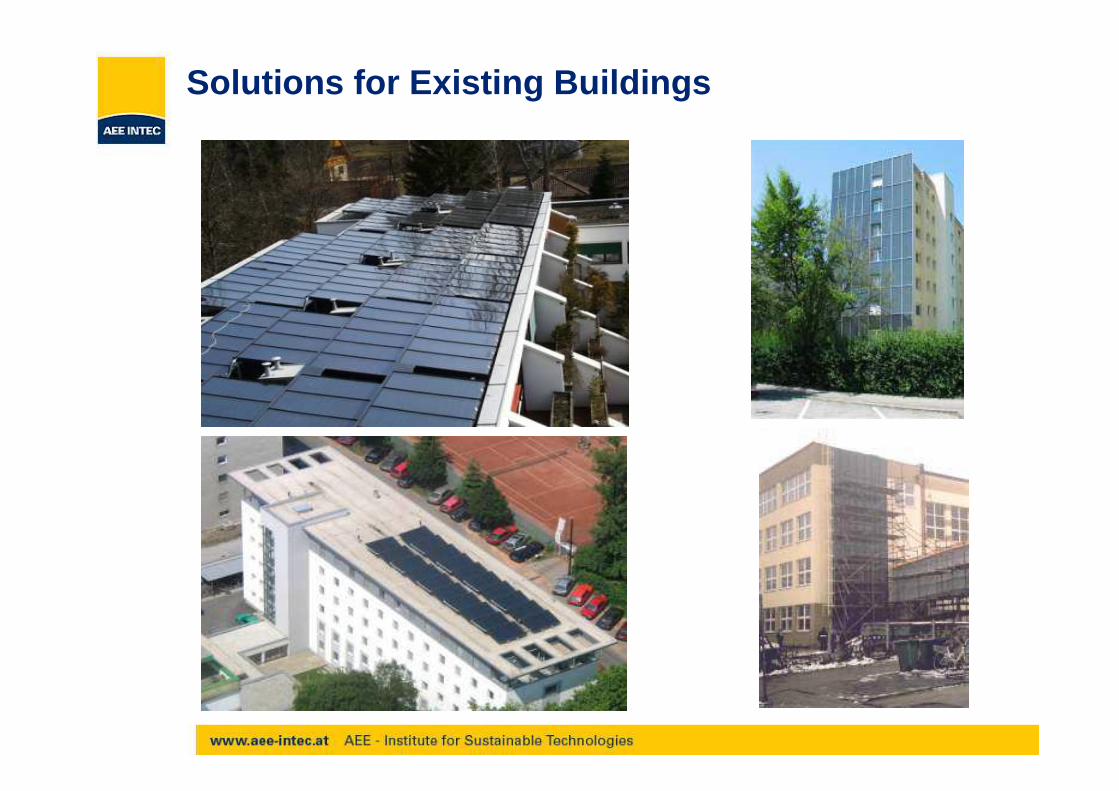
Solutions for Existing Buildings

Development of System Concepts1st Generation - Solar Plant Concepts for MFH(Concept for a small number of flats)
Kollek
torfe
ld
Kessel
KW
KW
Rau
mhe
izung
Trinkwasserspeicher

2nd Generation - Solar Plant Concepts for MFH
Kollekto
rfeld
T2
T3
Energiespeicher
Kessel
Raumheizung
KW
War
mw
ass
er
Bereitschafts- speicher
Zir
kula
tion
Development of System Concepts

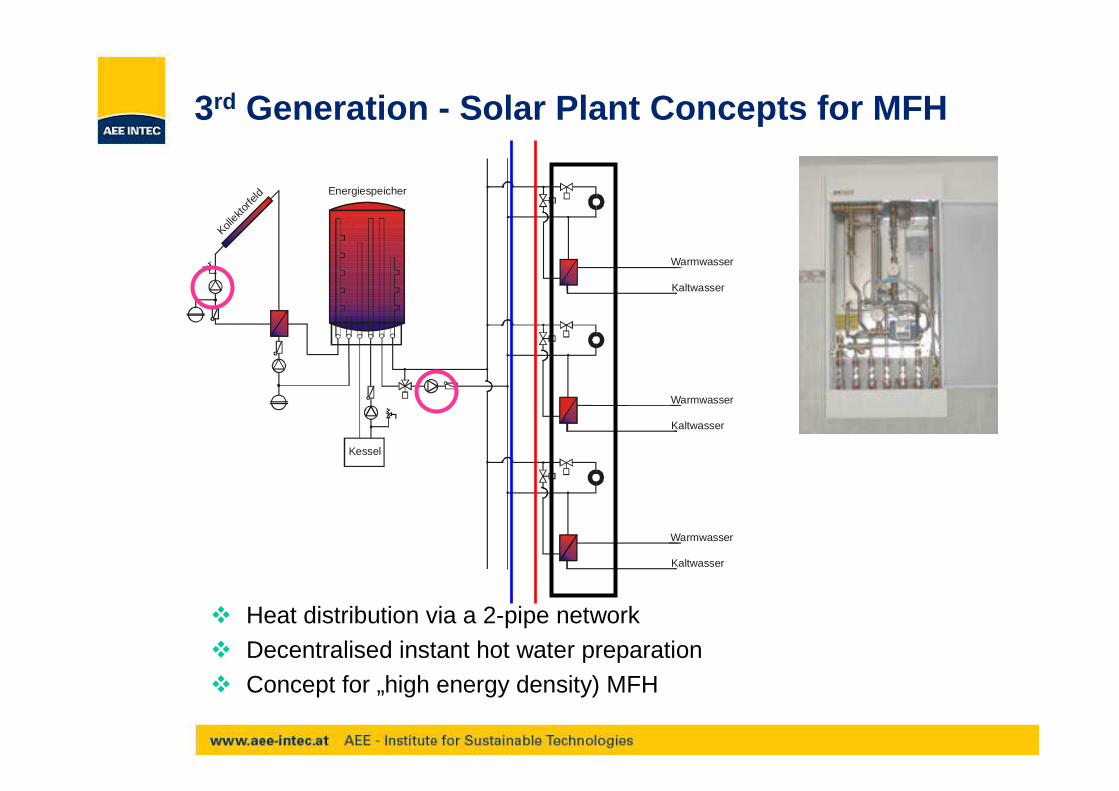
3rd Generation - Solar Plant Concepts for MFH
Heat distribution via 2-pipe network Domestic hot water preparation via decentralised storage tanksPreferred concept for row houses (low energy density)
Kollek
torfe
ld
T2
T3
Kessel
Energiespeicher
Kaltwasser
Kaltwasser
Kaltwasser
Warmwasser
Warmwasser
Warmwasser
Boiler
Boiler
Boiler
Kollek
torfe
ld
T2
T3
Kessel
Energiespeicher
Kaltwasser
Kaltwasser
Kaltwasser
Warmwasser
Warmwasser
Warmwasser
� Heat distribution via a 2-pipe network
� Decentralised instant hot water preparation
� Concept for „high energy density) MFH
3rd Generation - Solar Plant Concepts for MFH

Compact Heat Distribution Units
Netz VL
Netz RL
Warmwasser
Kaltwasser
1 Absperrventil2 Rückschlagklappe3 Sicherheitsventil4 Durchflussgesteuerter
Temperaturregler5 Rücklauftemperaturbegrenzer
6 Differenzdruckregler7 Zählerpassstück8 Zonenventil9 Passstück Kaltwasser
1
1
1
1 1
1
1
2 3
4
5
67 8
910°C
45°C
65°C
20 - 40°C
10
10 Zirkulationsbrücke
Heizung VL
Heizung RL
65°C
25 - 40°C

0
10
20
30
40
50
60
70
80
90
100
27.10.03 00:00 28.10.03 00:00 29.10.03 00:00 30.10.03 00:00 31.10.03 00:00 01.11.03 00:00 02.11.03 00:00 03.1 1.03 00:00
Tem
pera
tur
[°C]
T-Netz-VL T-Netz-RL T-Solarsek.-VL T-Solarsek.-RL T-Puffer-VL
Advantages of 2-pipe networks
Return flow nearly constant at 30°C Ideal conditions for solar thermal systems

� Distribution losses minimized
� Provides in all cases integration into the space
heating system
� No problems concerning legionnaires disease
� Easy counting of delivered energy for each flat
due to integrated heat meters
� Prefabricated heat transfer stations reduce the
labour cost, easy and faultless installation
Advantages of 2 pipe concepts

60 - 801,8 - 2,270 - 7525 - 30
Dimensioning with approx. 100% Solar fraction in Summer
50 - 700,9 - 1,450 - 6015 - 20
Dimensioning: Cost/Performance Optimum
Storagevolume
[Liter / m²collector area]
Collectorarea
[m² per Person]
Solar Fraction
Hot Water Demand
[%]
Solar Fraction
Total Heat Demand
[%]
Dimensioning of Collector area and Storage Volume

System Monitoring
Energie-speicher7.500 l
Wärmeverteilung für56 Wohneinheiten
36 kW Brauchwasserbereitung
Kaltwasser
Warmwasser
WMZ n
36 kW Brauchwasserbereitung
Kaltwasser
Warmwasser
WMZ n
Kollek
torfl
äche
120
m²
Neigun
g 30
°
TKoll
TSol RL
TSek RL
TSol VL
WMZSolar
Daten-logger
TSek VL TPo
TPm
TPu
TAussen
AutomatischerSystemwart
TNH RL
TNH VL
WMZ NH
Gas-brennwert-kessel225 kW
WMZ Netz
TNetz VL
TNetz RL

Wärmeverteilnetztemperaturen (Vorlauf und Rücklauf) von 7 Objekten.
20
25
30
35
40
45
50
55
60
65
70
15.2.2005 00:00 16.2.2005 00:00 17.2.2005 00:00 18.2.2 005 00:00 19.2.2005 00:00 20.2.2005 00:00 21.2.2005 00 :00
Sys
tem
tem
pera
tur
[°C]
Flow and return temperatures
ca. 55-65°C
ca. 25-37°C
Low return temperatures of 30°C are necessary for a n optimised operation of solar thermal systems
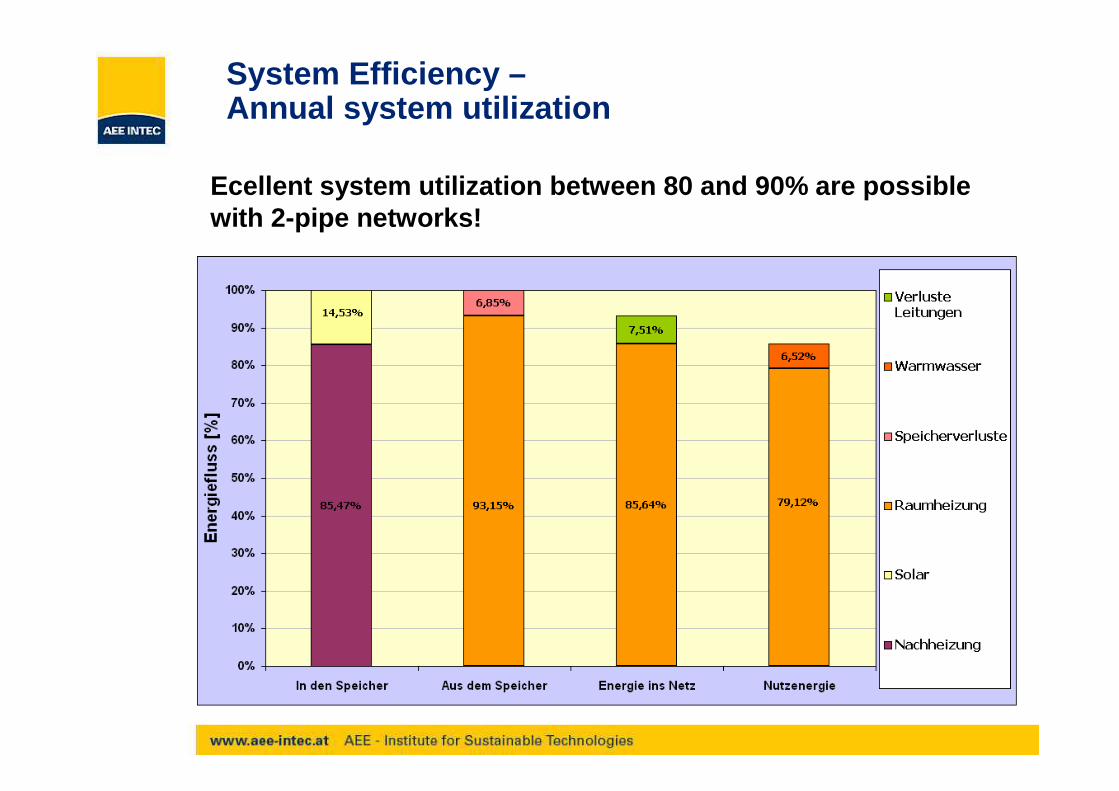
System Efficiency –Annual system utilization
Ecellent system utilization between 80 and 90% are po ssible with 2-pipe networks!

More Information:More Information:
The book:
Solar Heating Systems for Houses
A Design Handbook for Solar Combisystems
Solar Combisystems

Mluti-familiy Houses
ThisThis Design Design handbookhandbook isis availableavailable forfor €€ 29,80 at 29,80 at www.aee.atwww.aee.at

Data:10 Multi Family Houses, 370 Flats1160 m² Collector area, 102 m³ Storage VolumeAverage Solar Fraction 15 - 20% (DHW and Space Heating)
Monitoring Results of 10 Solar Plants with 2-Pipe Networks

Local District Heating – Hamburg, Germany
Source: ITW, University Stuttgart

Local District Heating - Steinfurt-Borghorst, Germany
Source: ITW, University Stuttgart

Wärmeübergabestation mitdirekter Heizungsanbindung
und Trinkwasserbereitungim Durchflußprinzip
Wärmeübergabestation mitindirekter Heizungseinbindung
und Trinkwasserbereitungmit Speicherladesystem
Kaltwasser
Hydraulische Weicheoder Pufferspeicher
Kaltwasser
Heiz-kessel
TW ZK
Langzeit-
Wärmespeicher
Solarnetz
Wärmeverteilnetz
Heizzentrale
Kollektorfeld
Kollektorfeld
Wärme-übergabe-station
Wärme-übergabe-station
Local District Heating with Seasonal Storage
Source: ITW, University Stuttgart

Kies-Wasser-Wärmespeicher
Erdsonden-Wärmespeicher Aquifer-Wärmespeicher
Heißwasser-Wärmespeicher
Seasonal Heat Storages
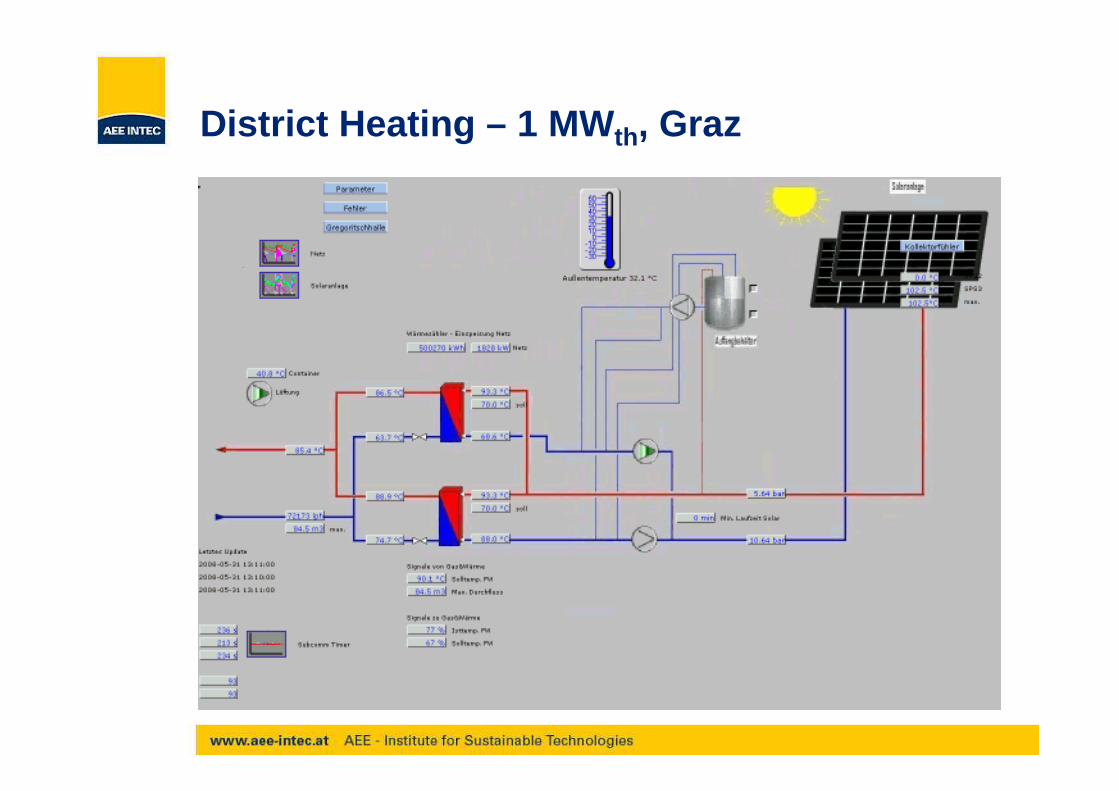
District Heating – 1 MW th, Graz

District Heating – 1 MW th, Graz

District Heating – 3MW th, AEVG, Graz, Austria

Solar District HeatingSolar District Heating –– MarstalMarstal, DK, DK –– 13 13 MWth

District Heating
Austria
Since the beginning of the 1980s about 500 biomass district heating networks have been built in Austria and more of these types of plants are continuously being built and successfully operated. Especially due to the amount of wood available in Austria, these plants are considered to be interesting and also highly acceptable regarding the independence from fossil energy imports.
Several of these central biomass plants have been equipped with solar collector arrays, acting as an auxiliary heat supplier.

District Heating - Eibiswald
Solar assisted biomass district heating plant, Eibiswald with an installed capacity of 875 kWth, (1250 m² collector array)

District Heating - Eibiswald
Heat production in 1996. Annual heat consumption at the customers: 3650 MWh
Eibiswald, W ärm eerzeugung Juli 1997 - Juni 1998
0
100
200
300
400
500
600
700
800
900
1000
Jul97
Aug97
Sep97
Okt97
Nov97
Dez97
Jän98
Feb98
Mrz98
Apr98
Mai98
Jun98
Monat
0%
10%
20%
30%
40%
50%
60%
70%
80%
90%
100%
Solaranlage
Biom asse + Ö lkessel
Solarer Deckungsgrad

District Heating - Eibiswald
Heat consumption at the customers in 1996. Solar fraction on theheat consumption: 14,1%
Eibiswald, W ärm everbrauch Juli 1997 - Juni 1998
0
100
200
300
400
500
600
700
800
900
1000
Jul97
Aug97
Sep97
Okt97
Nov97
Dez97
Jän98
Feb98
Mrz98
Apr98
Mai98
Jun98
Monat
0%
10%
20%
30%
40%
50%
60%
70%
80%
90%
100%
W ärm everbrauch bei den Abnehm ern
Solaranteil