25-yeartrendanalysis - new jersey · pitman, glassboro, and harrison. the landfill is ranked number...
TRANSCRIPT

The Lipari Landfill
Birth Weight Study;
25-Year Trend Analysis
NEW
JERSEYDEPARTMENT
OFHEALTH
A Bt:ITfc'R STATE OF HEALTH
Christine T. Whitman
Governor
Leonard Fishman
Commissioner of Health

THE LIPARI LANDFILL BIRTH WEIGHT STUDY:
A TWENTY-FIVE YEAR TREND ANALYSIS
NEW JERSEY DEPARTMENT OF HEALTH
ENVIRONMENTAL HEALTH SERVICES
JULY 1994

Report prepared by Michael Berry, M.P.H.
This report is the culmination of hours of dedicated hard work
by many persons associated with the project. It is with much
appreciation that I would like to especially acknowledge the
following for their valuable contributions.
Frank Bove
Ellen Dufficy
Jorge Esmart
Jacqueline Solomon
Jerald Fagliano
Richard Ritota
Councilman Douglas Stewart, Pitman
Clare Bonner, LINK Director
Michael Lowe, Gloucester County Health Department
This project was partially funded by the Agency for Toxic
Substances and Disease Registry. Federal funding was possible
due to the efforts and concern of Senator Frank Lautenberg.

TABLE OF CONTENTS
Page
ABSTRACT 1
INTRODUCTION 3
METHODS
Study Period and Population 7
Information on Potential Risk Factors 9
Data Analysis 10
RESULTS 15
DISCUSSION 19
REFERENCES 25
TABLES 29
FIGURES 53
LIST OF TABLES
Table 1. Lipari risk factor codes for statistical analysis.
Table 2. Race and sex for all births stratified by five-year time
period, 1961-85.
Table 3. Potential risk factors for birth weight by five-year
periods: white births, gestational age > 27 weeks, 1961-85.
Table 4. Average birth weight by five-year periods: white births,
gestational age > 27 weeks, 1961-85.
Table 5. Birth weight distributions by five-year periods: white
births, gestational age >27 weeks, 1961-85.
Table 6. Low birth weight proportions by five-year periods: white
births, gestational age > 27 weeks, 1961-85.
Table 7. Multiple regression analysis: white births, gestational
age > 27 weeks, Area 1 and Area 1A compared to Area 2,
1961-85, summary table of area of residence variable
only.
Table 8a. Regression analysis: white births, gestational age > 27
weeks, Area 1 and Area 1A compared to Area 2, 1961-65.
Table 8b. Regression analysis: white births, gestational age > 27
weeks, Area 1 and Area 1A compared to Area 2, 1966-70.
Table 8c. Regression analysis: white births, gestational age > 27
weeks, Area 1 and Area 1A compared to Area 2, 1971-75.
Table 8d. Regression analysis: white births, gestational age > 27
weeks, Area 1 and Area 1A compared to Area 2, 1976-80.
Table 8e. Regression analysis: white births, gestational age > 27
weeks, Area 1 and Area 1A compared to Area 2, 1981-85.
Table 9. Average birth weight for term births by birth period:
white births, gestational age 37-44 weeks, 1961-85.
Table 10. Low birth weight proportions for term births by birth
period: white births, gestational age 37-44 weeks, 1961-
85.
Table 11. Multiple regression analysis: white births, gestational
age 37-44 weeks, Area 1 and Area 1A compared to Area 2,
1961-85, summary table of area of residence variable
only.

Table 12a. Regression analysis: white births, gestational age > 27
weeks, Area 1 and Area 1A compared to Area 2, 1961-65.
Table 12b. Regression analysis: white births, gestational age > 27
weeks, Area 1 and Area 1A compared to Area 2, 1966-70.
Table 12c. Regression analysis: white births, gestational age > 27
weeks, Area 1 and Area 1A compared to Area 2, 1971-75.
Table 12d. Regression analysis: white births, gestational age > 27
weeks, Area 1 and Area 1A compared to Area 2, 1976-80.
Table 12e. Regression analysis: white births, gestational age > 27
weeks, Area 1 and Area 1A compared to Area 2, 1981-85.
Table 13 Low birth weight (<2500 grams) fpr term births by 3-year
running averages: white births, gestational age 37-44
weeks, 1961-85.
Table 14 Comparison of effects of lifestyle on birth weight to
present findings.
LIST OF FIGURES
Figure 1. Lipari landfill birth weight study area.
Figure 2. Average birth weight by 5-year period, gestaional age >
27 weeks.
Figure 3. Average birth weight by 5-year period, gestational age
37-44 weeks.

ABSTRACT
The purpose of the study was to evaluate the birth weights of
infants born to residents living near the Lipari Landfill, a
hazardous waste site that has been identified by the USEPA as the
number one Superfund site in the country. The landfill, which
operated from 1958 to 1971, was the site of disposal of nearly
three million gallons of hazardous chemical waste that were dumped
directly into a former gravel pit. Consequently, the landfill was
the source of hazardous leachate which migrated from the site into
two nearby streams and a lake in the vicinity of residences,
schools, and playgrounds.
Twenty-five years of birth certificates (1961-1985) were
collected from New Jersey Department of Health records for four
towns near the landfill. Births were assigned an exposure area
based on distance from the mother's residence to the landfill at
time of birth. Residents living within one kilometer of the site
(Area 1) were defined as "exposed". Those living beyond one
kilometer in the four towns were defined as the "unexposed"
population (Area 2) . Because of concerns of exposure
misclassification, Area 1 was further subdivided into two sectors:
Area 1A, the neighborhood immediately adjacent to the landfill and
Area IB, the rest of Area 1 less Area 1A.
Births were grouped into five discrete five-year time periods.
The distributions, means, and standard deviations of birth weights
and major confounding factors were generated and compared for Area
1 (or Area 1A) versus Area 2. The birth outcome variables analyzed
included the birth weight of the child in grams, proportion of low
birth weight babies, birth weight distribution, and gestational
age. Multiple and logistic regression methods were used to analyze
differences in the two study populations. Three-year running odds
ratios were calculated for term births in an effort to evaluate the
risk of low birth weight within shorter time periods.
During the 1971-1975 time period for births with gestational
age greater than 27 weeks, Areas 1 and 1A had significantly lower
average birth weight than Area 2 (80 grams and 152 grams
respectively). Area 1A had substantially higher average birth
weight for all other time periods compared to Area 2. Area 1A
average birth weight decreased substantially (187 grams) through
the time period 1966-1975 and then rebounded by about 306 grams
after 1975. The proportion of low birth weights in Area 1A was
significantly higher than in Area 2 during 1971-1975 (OR = 2.87;
90% CI = 1.54, 5.34; p < 0.005). Multiple regression identified
area of residence as statistically significantly associated with
birth weight for children born in Areas 1 and 1A during 1971-1975
(a decrease of 83 grams and 166 grams respectively) .
Term births (gestational ages between 37 and 44 weeks) showed
similar though stronger associations than all births greater than

27 weeks gestation. Area 1A term births were substantially
decreased (188 grams) through the 1966-1975 time period and thenrebounded by about 332 grams after 1975. The proportion of low
birth weights in Area 1A were substantially increased during 1971-
1975 compared to Area 2 (OR = 5.12; 90% CI = 2.47, 10.64,
p<0.0001). Multiple regression identified area of residence as
statistically significantly associated with birth weight for
children born in Areas 1 and 1A during 1971-1975 (a decrease of 84
grams and 177 grams respectively) . The three-year running odds
ratio analysis for Area 1A versus Area 2 showed significantlyelevated odds ratios for 1971 through 1976. During that time
period, the proportion of low birth weight was five to six times
higher for Area 1A than Area 2.
The results of this analysis of twenty-five years of birth
weights near the Lipari Landfill indicate that the population
living immediately adjacent (Area 1A) were significantly impacted
during the time period 1971-1975, the period postulated as havingthe greatest potential for exposure. The impact on birth weight
appears restricted to the one time period with average birth weightreturning to normal after 1975. The concentric ring approach to
defining exposure categories is susceptible to exposure
misclassification and biasing study results toward the null
hypothesis of no effect, as was evident in this study. Information
on other potential risk factors for low birth weight was not
available for analysis, however, the consistency of the findings
across the different analytic methods lends credence to the
validity of the results. The magnitude of the effect identified in
this study is in the range of birth weight reduction found instudies of cigarette smoking during pregnancy. The excess risk
appeared stronger in term births suggesting a mechanism of growth
retardation rather than prematurity.

INTRODUCTION
The Lipari Landfill is a 15-acre site located in Mantua
Township, Gloucester County, New Jersey, and borders the towns of
Pitman, Glassboro, and Harrison. The Landfill is ranked number one
on the United States Environmental Protection Agency's (USEPA)
National Priority List. In 1958 the site was first excavated as a
source of sand and gravel leaving an empty pit that was later back
filled with municipal refuse, household wastes, liquid and semi-
solid chemical wastes, and other industrial wastes. The landfill
operated until 1971 and accepted an estimated 12,000 cubic yards of
solid waste and 2.9 million gallons of liquid chemical waste.
Liquid wastes were emptied from containers and dumped into the
landfill from 1958 to 1969 and solid wastes were disposed of until
May 1971 (USEPA 1985) . It has been estimated by the USEPA that the
heaviest period of dumping occurred between 1967 through 1969.
Hazardous waste deposited into the landfill included cleaning
solvents, resins, paint and paint thinners, ester press cakes,
phenol wastes, and amine wastes. According to the on-site Remedial
Investigation/Feasibility Study (RI/FS), a major hazard identified
in the landfill was bis (2-chloroethyl) ether (BCEE) (USEPA 1985).
Other chemicals identified include benzene, toluene, methylene
chloride, 1,2-dichloroethane, formaldehyde, phenol, chromium,
nickel, mercury, lead, selenium, arsenic, and silver.
The landfill was the source of hazardous leachate which
migrated from the site into two nearby streams and a lake in the
vicinity of residences, schools, and playgrounds. Operation of the
landfill ended because of residents' complaints regarding odors,
respiratory problems, headaches, nausea, and dying vegetation.
In 1985, the Lipari Health Committee was formed by a group of
concerned local residents and community officials. The Committee
also included representatives from the New Jersey Department of
Health (NJDOH), Centers for Disease Control, Agency for Toxic
Substance and Disease Registry (ATSDR), USEPA, New Jersey
Department of Environmental Protection, Gloucester County Health
Department and the four neighboring communities. A subcommittee
was then formed to evaluate specific health related issues and
explore potential health study activities. The subcommittee agreed
that NJDOH should study birth certificate data for low birth weight
and State Cancer Registry data for selected cancer outcomes for
evidence of exposure-related health effects.
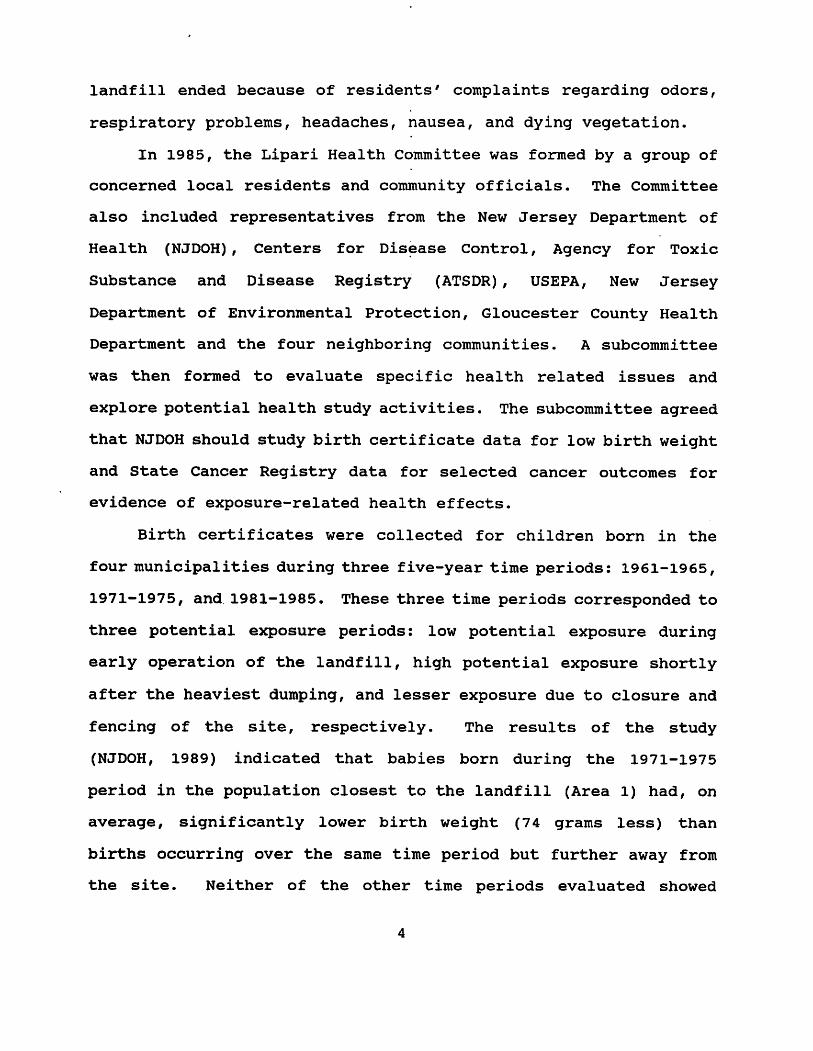
Birth certificates were collected for children born in the
four municipalities during three five-year time periods: 1961-1965,
1971-1975, and 1981-1985. These three time periods corresponded to
three potential exposure periods: low potential exposure during
early operation of the landfill, high potential exposure shortly
after the heaviest dumping, and lesser exposure due to closure and
fencing of the site, respectively. The results of the study
(NJDOH, 1989) indicated that babies born during the 1971-1975
period in the population closest to the landfill (Area 1) had, on
average, significantly lower birth weight (74 grams less) than
births occurring over the same time period but further away from
the site. Neither of the other time periods evaluated showed

differences in birth weight between the study populations. The
1989 report concluded that the "results are consistent with the
hypothesis that exposure to contaminants from the site is
associated with average low birth weight."
After completion of the report, an external review panel was
appointed to evaluate the study methods and results, and provide
comments regarding recommendations for further efforts to address
community needs. Although the panel could not conclude that the
observed low birth weight effect was attributable to exposure to
agents in the landfill, the panel did recommend analyzing birth
weight for the intervening years 1966-1970 and 1976-1980 in order
to add to the data on the time patterns of probable exposure in
relation to birth weight (NJDOH, 1989).
This report is an update of the earlier birth weight study
incorporating the missing ten years of births, 1966-1970 and 1976-
1980, and reanalyzing the entire twenty-five years of birth
certificate data.
METHODS
Study Period and Population
Twenty-five years (1961-1985) of birth certificate information
was collected from the New Jersey Department of Health's Center for
Health Statistics records for the four municipalities closest to
the landfill (Mantua, Pitman, Glassboro, and Harrison).
Additionally, birth certificates were requested and obtained from
the Pennsylvania Vital Statistics Office for study area children
born in Pennsylvania hospitals.
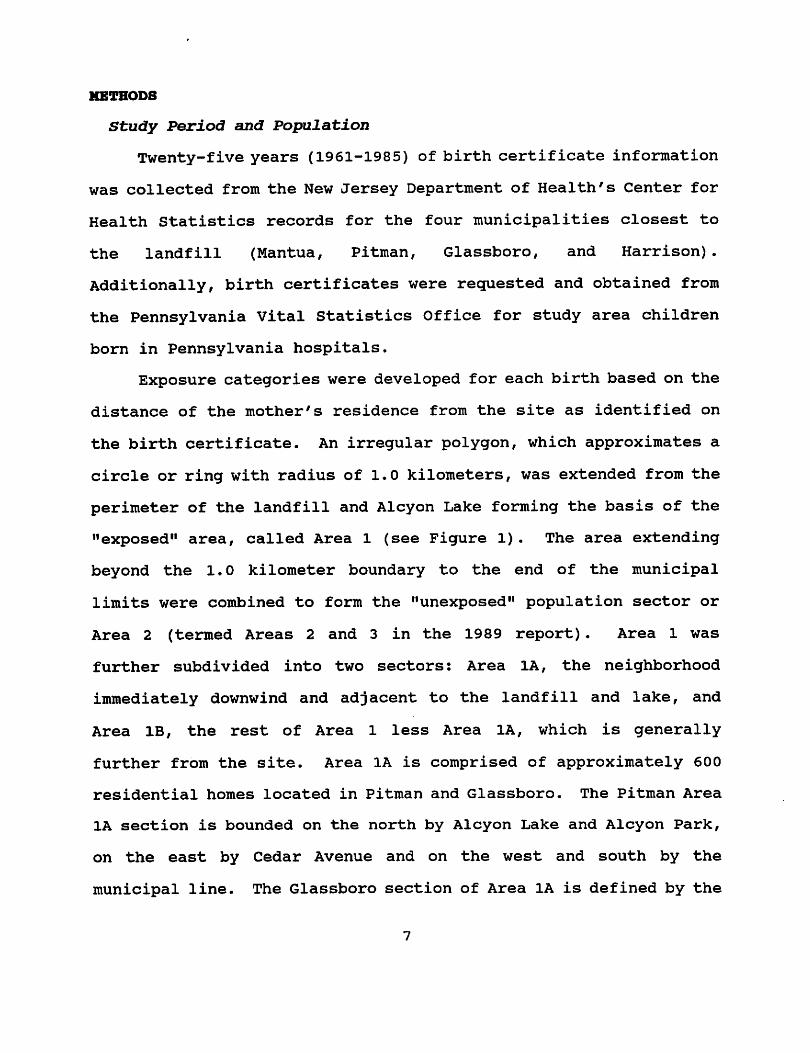
Exposure categories were developed for each birth based on the
distance of the mother's residence from the site as identified on
the birth certificate. An irregular polygon, which approximates a
circle or ring with radius of 1.0 kilometers, was extended from the
perimeter of the landfill and Alcyon Lake forming the basis of the
"exposed" area, called Area 1 (see Figure 1). The area extending
beyond the 1.0 kilometer boundary to the end of the municipal
limits were combined to form the "unexposed" population sector or
Area 2 (termed Areas 2 and 3 in the 1989 report). Area 1 was
further subdivided into two sectors: Area 1A, the neighborhood
immediately downwind and adjacent to the landfill and lake, and
Area IB, the rest of Area 1 less Area 1A, which is generally
further from the site. Area 1A is comprised of approximately 600
residential homes located in Pitman and Glassboro. The Pitman Area
1A section is bounded on the north by Alcyon Lake and Alcyon Park,
on the east by Cedar Avenue and on the west and south by the
municipal line. The Glassboro section of Area 1A is defined by the

self-contained residential subdivision of Lakeside Park.
Selection requirements for births to enter the study include:
1) the subject was a live birth;
2) the street address on the birth certificate indicated that the
mother lived in Area 1 or Area 2 at the time of birth of the
subject (excluded were those with missing addresses, addresses
indicating only post office or rural delivery number, incomplete
addresses and those addresses that could not be identified on the
U.S. Census block maps or by the local health officer in
consultation with the post office and field investigations;
3) the subject was a "singleton" live birth (no twins, triplets,
etc.);
4) the birth occurred during 1961 through 1985; and
5) information was available on sex and birth weight of the child,
and on mother's race.
Birth certificates that lacked information on birth weight or
street address were not included in the study since residential
proximity to the landfill and birth weight were factors of primary
interest. Because sex and race are associated with birth weight,
births lacking information on these potential confounders were also
excluded.
Birth certificates were aggregated into five five-year periods
selected to represent periods when exposure to toxic waste at the
site was likely to be: 1) non-existent or minimal (1961-1965), 2)
increasing and moderate to heavy due to increased dumping (1966-
1970), 3) heaviest due to runoff into the neighboring community and
8
contamination of Alcyon Lake (1971-1975), 4) decreasing and
moderate (1976-1980) since dumping had ended in 1971 and air
exposures would be expected to decrease over time due to earlier
volatilization of contaminants, and 5) minimal due to remedial work
(1981-1985).
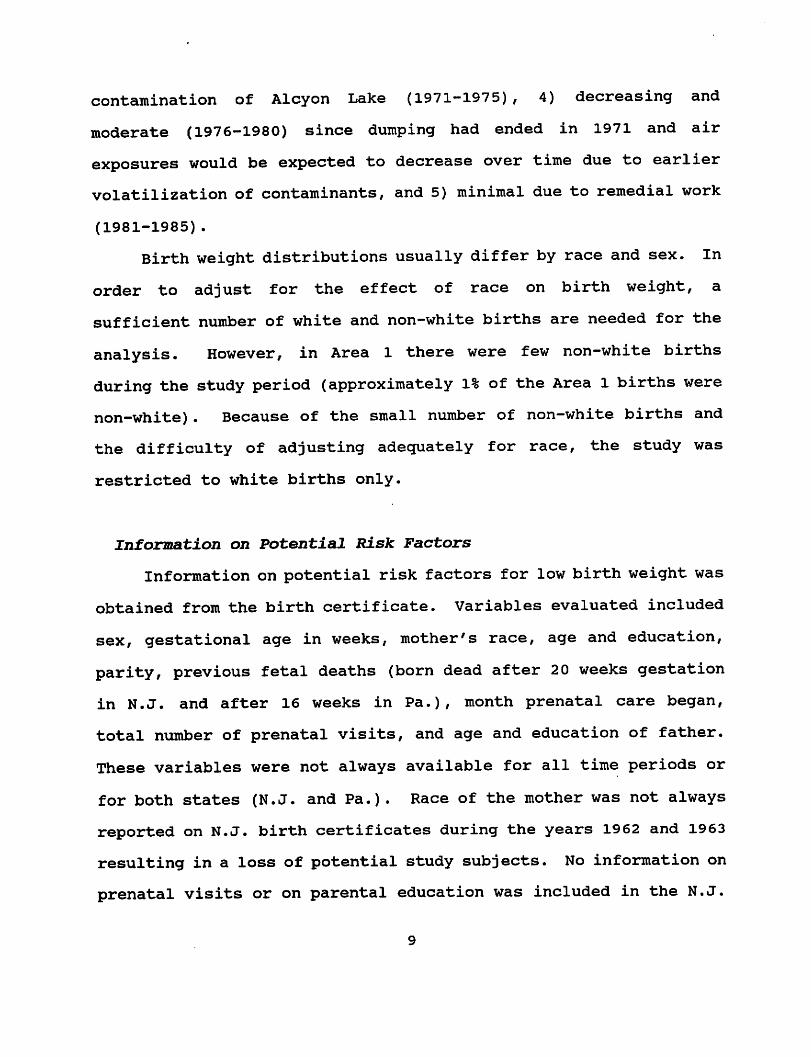
Birth weight distributions usually differ by race and sex. In
order to adjust for the effect of race on birth weight, a
sufficient number of white and non-white births are needed for the
analysis. However, in Area 1 there were few non-white births
during the study period (approximately 1% of the Area 1 births were
non-white). Because of the small number of non-white births and
the difficulty of adjusting adequately for race, the study was
restricted to white births only.
Information on Potential Risk Factors
Information on potential risk factors for low birth weight was
obtained from the birth certificate. Variables evaluated included
sex, gestational age in weeks, mother's race, age and education,
parity, previous fetal deaths (born dead after 20 weeks gestation
in N.J. and after 16 weeks in Pa.)/ month prenatal care began,
total number of prenatal visits, and age and education of father.
These variables were not always available for all time periods or
for both states (N.J. and Pa.). Race of the mother was not always
reported on N.J. birth certificates during the years 1962 and 1963
resulting in a loss of potential study subjects. No information on
prenatal visits or on parental education was included in the N.J.

birth certificates for 1961-1967 or on the Pa. birth certificates
for 1961-1965 and 1971-1975. Therefore, prenatal visits and
parental education could not be evaluated for the 1961-1965 or
1966-1970 periods. APGAR scores and previous miscarriages (fetal
loss before 20 weeks gestation) were not evaluated since they were
only available on N.J. and Pa. birth certificates for the period
1981-1985.
Information on other risk factors for low birth weight was not
available on the birth certificate and could not be evaluated.
These factors include maternal health, cigarette and alcohol
consumption during pregnancy, parental occupational information,
and parental socioeconomic status.
Data Analysis
The distributions, means, and standard deviations of birth
weights and major confounding factors were generated and compared
for Area 1 (or Area 1A) versus Area 2. The birth outcome variables
analyzed included: the birth weight of the child in grams,
proportion of low birth weight (less than 2500 grams) babies, birth
weight distribution and gestational age. In order to get a better
sense of birth weight distribution differences between Area 1 (or
Area 1A) and Area 2, birth weights were also grouped into six
categories (less than 1500 grams, 1500-1999 grams, 2000-2499 grams,
2500-2999 grams, 3000-4699 grams, and greater than 4700 grams).
Separate analyses were performed for each of the five five-year
periods.
10

Mother's residence at the time she gave birth was the
"exposure" variable. A "crude" analysis was performed comparing
the birth outcomes for the two areas. Then, analyses were
performed measuring the effect of the exposure variable on average
birth weight and on low birth weight proportion after the effects
of other potential risk factors were taken into account. These
other factors included the age, parity, education and number of
previous stillborns of the mother, length of gestation and sex of
the child, and prenatal care (NAS, 1973). (Paternal age and
education were not included in the analysis since they were highly
correlated with maternal age and education and because there was a
high proportion of missing data for these variables.) The National
Academy of Science's standard formula for prenatal visits was used
to define the quality of prenatal care (NAS, 1973) and is based on
the total number of prenatal doctor visits and the gestational
month the visits began. Not every birth certificate had complete
information for gestational age, maternal education, prenatal care,
parity, and previous fetal deaths. Dichotomous variables were
created corresponding to each of these risk factors and were coded
with a zero if the child had complete information for the risk
factor and a one if not. Whenever a risk factor variable was
included in the multiple regression analysis, its corresponding
variable for missing information was also included (Cohen and
Cohen, 1983). Table 1 presents the risk factor coding scheme used
in the analysis.
Descriptive analyses of average maternal age, gestational age,
11

parity, maternal education, and prenatal care are given separately
for each time period studied. Comparisons of birth weight
distribution and proportion of low birth weight between the two
areas are presented. Statistical significance was indicated by p-
values and confidence intervals (Breslow and Day, 1980).
Multiple regression and analysis of variance (ANOVA) methods
(Snedecor and Cochran, 1980) were used to analyze differences in
average birth weight between the two areas. Regression diagnostics
were performed to identify study subjects who strongly influenced
the analysis because they had extreme values for one (or more) of
the risk factors and/or the birth weight (Cook and Weisberg, 1982).
These subjects were then removed and an additional regression
analysis was performed to evaluate any changes in the size of the
difference between the two areas in average birth weight. Logistic
regression (Breslow and Day, 1980) was used to analyze differences
in the proportion of low birth weight babies between the two areas.
In all regression analyses, a hierarchical backward elimination
method (Greenberg and Kleinbaum, 1985) was used to assess
interaction and to eliminate variables. Significance tests were
standard t-tests based on the coefficients and their standard
errors (Breslow and Day, 1980).
Differences of birth weight distribution and average
gestational age between the two areas were evaluated by the chi-
square test and t-test (Snedecor and Cochran, 1980), respectively.
All p-values mentioned in the text and tables are two-tailed.
Separate analyses were performed on births of greater than 27 weeks
12
gestation and on births with gestational ages between 37 and 44
weeks ("term" births). In order to protect the validity of the
analysis, the 27-week gestational age cutoff was used to eliminate
data for early births with unreliable birth certificate data.
Analysis of term births provides an indication of whether there are
delays in the growth and development of fetuses.
Lastly, three-year running average odds ratios were calculated
for term births in Area 1A and Area 2 in an effort to evaluate the
risk of low birth weight within shorter time periods. Births for
each year were summed over three year overlapping intervals in
order to smooth out annual fluctuations of low birth weight
proportions due to the effect of small numbers of births per annum.
Odds ratios and p-values are presented.
13

RESULTS
Table 2 presents a breakdown of the race and sex for all
eligible births stratified by five-year time periods. The vast
majority (nearly 90%) of the births throughout the 25 year study
period were identified as white. For Area 1, virtually all births
were white (over 98%). Although race is an important risk factor
for birth weight, there were too few non-white births in Area 1 to
adjust for race in the analysis. As a result, only white births
were analyzed. Among white births, approximately 53% were males.
A summary of the known potential risk factors of the study
population births with gestational age greater than 27 weeks are
listed in Table 3. In general, mothers in Area 1A were, on
average, slightly older, more educated, and had better prenatal
care for every aggregate time period where data was available.
Although the quality of prenatal care were generally increasing for
all groups over time, Area 1A mothers had significantly better
prenatal care (p<0.05) than Area 2 mothers from 1971 through 1980.
Table 4 presents the average birth weight by five-year birth
periods for each Area. During the time period 1971-1975, Area 1
had an average birth weight 80 grams less than Area 2 while Area
lA's average birth weight was 152 grams less than Area 2. With the
exception of 1971-1975 period, Area 1A had substantially higher
average birth weights for every time period studied (Figure 2).
While Area 2 had consistently increasing average birth weight
throughout the birth periods, Area lA's average birth weight
decreased substantially (187 grams) through the time period 1966-
15

1975 and then rebounded by approximately 306 grains after 1975.
Tables 5 and 6 present birth weight distributions and low
birth weight proportions by birth period. Of note, Area 1A had a
significantly larger proportion of low birth weights for 1971-1975
when compared to Area 2 (OR = 2.87; 90% CI = 1.54, 5.34; p<0.005).
This strong result detected in Area 1A was responsible for the
significantly high proportion of low birth weights detected in all
of Area 1. The proportion of low birth weights in Area IB was
similar to Area 2 for each of the birth time periods analyzed.
Analysis of average birth weight by multiple regression and
analysis of variance was performed in which an interaction term for
area of residence and sex of child was included.. Table 7 presents
summary multiple regression results for area of residence only,
while Tables 8a through 8e present the full results of all
regression analyses by time period for births over 27 weeks
gestation. Area of residence was statistically significantly
associated with birth weight for children born in Area 1 and Area
1A for the 1971-1975 time period (a decrease of 83 grams and 166
grams respectively) . The interaction term was not statistically
significant indicating that the difference in average birth weight
between the "exposed" and "unexposed" areas was consistent across
the sexes for these births. For the time periods 1961-1965 and
1976-1980, Area 1A had a statistically significantly higher birth
weight than Area 2. Area of residence did not display any
associations with birth weight during any other time period
evaluated. In 1981-1985 the interaction term was statistically
16

significant for Area 1 (and Area 1A).
Logistic regression was used to analyze the difference in the
proportion of low birth weights between the exposure areas. Again,
area of residence was statistically significant for Area 1 (OR =
1.62? 90% CI = 1.52, 1.72) and Area 1A (OR = 3.16? 90% CI = 2.88,
3.44) for the time period 1971-1975. The interaction term for area
of residence and sex of child was not statistically significant,
indicating that the difference in the proportion of low birth
weights between the exposure areas was consistent across the sexes.
Area of residence did not display any association with low birth
weight proportions during any other time period evaluated.
Births with gestational ages between 37-44 weeks (term births)
were analyzed separately. The results are presented in Figure 3
and Tables 9 through 12e. Table 9 and Figure 3 present the average
birth weight by five-year birth period for each Area. As seen with
all births greater than 27 weeks gestation, term birth for Area 1A
were substantially decreased (188 grams) through the 1966-1975 time
period and then rebounded by about 332 grams after 1975. Table 10
presents the proportion of low birth weights by birth period. For
Area 1A term births, there was a dramatically increased proportion
of low birth weight babies for 1971-1975 compared to Area 2 (OR =
5.12? 90% CI = 2.47, 10.64; p < 0.0001).
In the multiple regression analysis (Table 11), Area 1 had a
statistically significant lower average birth weight for term
births (84 grams) than Area 2 during the time period 1971-1975.
Area 1A also had a statistically significant lower average birth
17
weight for term births (177 grains) than Area 2 for the time period
1971-1975 only. For the time periods 1961-1965 and 1976-1980, Area
1A had a statistically significant higher average birth weight for
term births (114 and 152 grams respectively) than Area 2. The
logistic regression analyses also detected a statistically
significant association for area of residence (Area 1 and Area 1A)
during the 1971-1975 time period.
Table 13 presents the results of the 3-year running average
odds ratio analysis for Area 1A versus Area 2 low birth weight,
term births. Again, the time periods with statistically
significant odds ratios occurred from 1971 through 1976. During
this critical time period, the proportion of low birth weights were
five to six times higher for Area 1A than Area 2. No low birth
weight babies were identified for Area 1A from the 1976-1978 period
onward.
18

DISCUSSION
Low birth weight is a significant determinant of infant
mortality and morbidity (NAS, 1985). Fortunately though, there is
no evidence to suggest that lower birth weight children are at
elevated risk for disease later in life.
After taking into account information on risk factors
available on the birth certificate, a lower average birth weight
and higher proportion of low birth weights were found in Area 1
compared to Area 2 during the period 1971-1975. It appears that
this strong residential association detected for Area 1 was
primarily concentrated in the section designated Area 1A. When
Area 1A births were removed from the 1971-1975 analysis, the
remaining Area IB birth outcome was similar to the Area 2
"unexposed" experience.
For the five-year time period 1971-1975, the average decrease
in birth weight in infants of gestational age greater than 27 weeks
for Area 1A relative to Area 2 was 166 grams. For Area 1A term
births, babies were on average 177 grams lower in birth weight than
Area 2 babies during the critical time period of 1971-1975. This
effect is in the range of birth weight reduction found in studies
of cigarette smoking during pregnancy (150 grams to 250 grams; see
Table 14 for a clinical perspective of this difference). Perhaps
the real impact to Area 1A was even greater than the 177 grams
decrease in average birth weight since Area 1A had significantly
higher average birth weights prior to and after the 1971-1975 time
period. The excess risk appeared stronger when only term births
19

were analyzed suggesting a mechanism of growth retardation rather
than prematurity. This is important since birth weight, after
controlling for gestional age, has been found to be strongly
associated with infant survival (Wilcox, 1992).
A serious potential weakness of this study, as well as most
environmental studies, is the possibility of exposure
misclassification. The critical piece of information required to
meaningfully evaluate health data is information on the actual
personal exposure to chemicals emanating from the landfill over
time; that is, who was exposed and who was not exposed and what was
the magnitude of the exposure that did occur. Since personal
exposure information did not exist, residential distance from the
landfill was used as a surrogate measure for potential past
exposure. The results of this study indicate that the original
"exposed" population designation of Area 1 was too large and
resulted in exposure misclassification, biasing the earlier study
and these results toward the null hypothesis of no effect. The
smaller residential subdivision of Area 1A, the neighborhood
immediately adjacent to the landfill, appears to be the better
exposure surrogate, providing the strongest association between
residential location and birth weight.
Information on other potential risk factors for low birth
weight was not available on the birth certificate and could not be
evaluated. These factors include maternal health, cigarette and
alcohol consumption during pregnancy, parental occupational
information, and parental socioeconomic status. Since these
20

unmeasured risk factors cannot be controlled for in the analysis,
incorrect results might have occurred in our study due to an uneven
distribution of these other risk factors in the population.
However, the consistency of the findings across the different
analytic methods lends credence to the validity of the results.
The USEPA has identified numerous chemical contaminants on-
site including benzene, bis(2-chloroethyl) ether (BCEE),
chloroform, 1,2-dichloroethane, ethylbenzene, 4-methyl-2-pentanone,
toluene, total xylenes, and a number of metals (arsenic, chromium,
lead, mercury, nickel, and zinc). There are few studies available
on the relationship between most of the compounds found at the
Lipari Landfill and low birth weight in pregnancy outcomes.
Positive associations with low birth weight have been reported for
cadmium in animals (Rudolph, 1986; Ali, 1986), cadmium in humans
(Frery, 1993), lead in humans (Heinrichs, 1983), benzene in animals
(Davis, 1986), and xylene in animals (Mirkova, 1983) . Negative
results were reported in studies of the relationship between low
birth weight and cadmium in humans (Huel, 1984) , lead in rats
(Winneke, 1983), and xylene in rats (Rosen, 1986). Although there
is a lack of toxicity data for many of the compounds found at the
landfill, the evidence from the metal and benzene studies provides
a reasonable biological plausibility for a potential relationship
between exposures to landfill contaminants and low birth weight in
the community.
Two occupational studies have identified associations between
chemical exposures and low birth weight: working mothers exposed to
21

polychlorinated biphenyls (Taylor, 1989) and paternal exposure to
auto body solvents (Daniell, 1988). However, two other studies did
not detect an occupational effect on low birth weights: female
veterinarians exposed to several known reproductive hazards
(Schenker, 1990) and women working in dry cleaning shops (Olsen,
1990).
There have been several other studies where birth weight has
been evaluated in proximity to an environmental pollutant. In a
study of a community potentially exposed to arsenic from a nearby
copper smelter in northern Sweden, investigators found a
statistically significant decline in average birth weight of 68
grams (Nordstrom, 1978).
However, investigations of communities living near: a toxic
waste site (Ozonoff, 1983), two different lead smelters (McMichael,
1986; Loiacono, 1992), dioxin contaminated soil (Stockbauer, 1988),
and a toxic waste landfill (Hertzman, 1987) did not find declines
in the birth weight or an elevated prevalence of low birth weight
infants. These studies generally had far fewer numbers than did
the Lipari study, and thus had less power to detect small
differences than did the current study.
Two other studies evaluated communites exposed to
environmental pollution using census tract codes as the surrogate
measure of exposure. In the first study, industrial pollution from
a plant could not be correlated with low birth weights in Monroe
County, New York (Bell, 1991). In the second, environmental
contamination in the San Francisco Bay area (Shaw, 1992) did not
22
detect differences in census tract average birth weight. These
last two studies were far less specific about defining the exposure
surrogate (census tract) and likely suffer more from exposure
misclassification than the current study.
In summation, the results of this twenty-five year analysis of
birth weights near the Lipari Landfill indicate that the population
living immediately adjacent (Area 1A) was substantially impacted
during the time period 1971-1975.
23

REFERENCES
Ali, M.M., Murthy, R.C., and Chandra: Developmental and Long-term
Neurobehavioral Toxicity of Low Level In-utero Cadmium Exposure in
Rats. Neurobehav. Tox. and Terat., 8(5):463, 1986.
Bell, B.P., Franks, P., Hildreth, N., and Melius, J.: Methylene
Chloride Exposure and Birth Weight in Monroe County, New York.
Environ. Res., 55(1):31-39, 1991.
Breslow, N.E. and Day, N.E.: Statistical Methods in Cancer
Research, Volume 1 - The Analysis of Case-Control Studies, W.
Davis, ed. IARC Scientific Publication No. 32, International
Agency for Research on Cancer, Lyon, France, 1980.
Cohen, J. and Cohen, P.: Applied Multiple Regression/Correlation
Analysis for the Behavorial Sciences, Second edition, New York,
Wiley, 1983.
Cook, R.D. and Weisberg, S.: Residuals and Influence in Regression.
Chapman and Hall, New York and London, 1982.
Daniell, W.E. and Vaughan, T.L.: Paternal Employment in SolventRelated Occupations and Adverse Pregnancy Outcomes. Br. J. Ind.
Med., 45(3):193-197, 1988.
Frery, N., Nessmann, C, Girard, F., Lafond, J., Moreau, T., Blot,
P., Lellouch, J., and Huel, G.: Environmental Exposure to Cadmium
and Human Birth Weight. Toxicology, 79(2):109-118, 1993.
Greenberg, R.S. and Kleinbaum, D.G.: Mathematical Modelling
Strategiesfor the Analysis of Epidemiological Research. Ann. Rev.
Public Health, 6:223-245, 1985.
Heinrichs, H.L.: Reproductive hazards of the Workplace and the
Home. Clin. Obstet. andGynecol., 26(2):429, 1983.
Hertzman, C., Hayes, M., Singer, J., and Highland, J.: Upper Ottawa
Street Landfill Site Health Study. Environ. Health Perspec.,
75:173-195, 1987.
Huel, G., Everson, R.B., and Menger, I.: Increased Hair Cadmium inNewborns of Women Occupationally Exposed to Heavy Metals. Environ.
Res., 35(1):115, 1984.
Klein, J., et al.: Cigarettes, Alcohol, and Marijuana: VaryingAssociations with Birth Weight. Int. J. Epi., 16:44-51, 1987.
Loiacono, N.J., Graziano, J.H., Kline, J.K., Popovac, D., Ahmedi,
X., Gashi, E., Mehmeti, A., and Rajovic, B.: Placental Cadmium andBirth Weight in women Living Near a Lead Smelter. Arch. Environ.
Health, 47 (4)-.250-255, 1992.
25
Martin, T.R. and Bracken, M.B.: The Association Between Low Birth
Weight and Caffeine Consumption During Pregnancy. Am. J. Epi., Vol.
126 (5), 1987.
McMichael, A.J., Vimpani, G.V., Robertson, E.F., Baghurst, P.A.,
and Clark, P.D.: The Port Pirie Cohort Study: Maternal Blood Lead
and Pregnancy Outcome. J. Epid. Commun. Health, 40(l):18-25, 1986.
Mirkova, E. , Zaikov, C, Antov, G., Mikhailova, A., and Khinova,
L.: Prenatal Toxicity of Xylene. J. Hyg. Epid. Micro, and Immunol.,
27(3):337, 1983.
National Academy of Science, Institute of Medicine: Study on Infant
Mortality, 1973.
National Academy of Science, Institute of Medicine: Preventing Low
Birth Weight, 1985.
New Jersey Department of Health, Environmental Health Service: A
Report on the Health Study of Residents Living Near the Lipari
Landfill, Trenton, New Jersey, 1979.
Nordstrom, S., Beckman, L., and Nordstrom, I.: Occupational and
Environmental Risks in and Around a Smelter in Northern Sweden, I.
Variations in Birth Weight. Hereditas, 88:51-54, 1978.
Olsen, J., Hemminki, K. , Ahlborg, G. , et. al: Low Birth Weight,
Congenital Malformations, and Spontaneous Abortions among Dry-
cleaning Workers in Scandinavia. Scand. J. Work Environ. Health,
16(3):163-168, 1990.
Ozonoff, D., Colten, M.E., and Cupples, T.: Silresim Area Health
Study Report of Findings. Boston Univ. School of Public Health.
Report to the Massachusetts Dept. of Environmental Quality
Engineering and Dept. of Public Health, 1983.
Rosen, M.B., Crofton, K.M., and Chernoff, N.: Postnatal Evaluation
of Prenatal Exposure to p-xylene in the Rat. Toxical. Health,
34(213):223, 1986.
Rudolph, L. and Swan, S.H.: Reproductive hazards in the
Microelectronics Industry. State of the Art Reviews: Occup. Med.,
1(1): 135, 1986.
Shaw, G.M., Schulman, J., Frisch, J.D., Cummins, S.K., and Harris,
J.A.: Congenital Malformations and Birth Weight in Areas withPotential Environmental Contamination. Arch. Environ. Health,
47(2):147-154, 1992.
Schenker, M.B., Samuels, S.J., Green, R.S., and Wiggins, P.:
Adverse Reproductive Outcomes Among Female Veterinarians. Am. J.
Epid., 132(1):96-106, 1990.
26

Snedecor, G.W. and Cochran, G. : Statistical Methods, Seventh
edition, Iowa State University Press, 1980.
Stockbauer, J.W., Hoffman, R.E., Schramm, W.F., and Edmonds, L.D.:
Reproductive Outcomes of Mothers with Potential Exposure to
2,3,7,8-tetrachlorodibenzo-p-dioxin. Am. J. Epid., 128(2):410-419,1988.
Susser, M. and Stein, Z.: Intrauterine Growth Retardation.
Seminars in Perinatololgy, 8:5-14, 1984.
Taylor, P.R., Stelma, J.M., and Lawrence, C.E.: The Relation of
Polychlorinated Biphenyls to Birth Weight and Gestational Age in
teh Offspring of Occupationally Exposed Mothers. Am. J. Epid.,
129(2):395-406, 1989.
United States Environmental Protection Agency: Remedial
Investigation/Feasibility Study for the Lipari Landfill, 1985.
Wilcox, A.J. and Skjaerven, R.: Birth Weight and Perinatal
Mortality: The Effect of Gestational Age. Am. J. Public Health
82(3):378-382, 1992.
Winneke, G., Lilienthal, H., and Werner, W.: Task Dependent
Neurobehavioral Effects of Lead in Rats. Arch. Toxicol., Suppl. 5,
84, 1983.
27


TABLE 1. LIPARI RISK FACTOR CODES FOR STATISTICAL ANALYSES
Area of residence (exposure)
Sex of child:
Gestational age:
Maternal age:
- Continuous variable:
- Dichotomous variable
Maternal education:
- Continuous variable:
- Dichotomous variable:
Parity:
Prenatal care:
Previous Stillbirths:
0 = Unexposed (Area 2)
1 = Exposed (Area 1 and 1A)
0 - Male
1 = Female
Weeks
Years
0 = Aged 19 to 35
1 = Not aged 19 to 35
Years
0 -» 12+ Years of education
1 = Less than 12 years of education
0 = First live birth
1 - Not first live birth
0 - Greater than or equal to the
minimum standard set by the
NAS for number of visits and
month of pregnancy care begun
1 = Below the standard
0 - No previous stillbirths
1 = One or more previous stillbirths
31

TABLE 2. RACE AND SEX FOR ALL BIRTHS STK
FIVE-YEAR TIME
CATEGORY YEARS
ELIGIBLE
BIRTHS**: 1961-65
1966-70
1971-75
1976-80
1981-85
RACE:
NON-WHITE 1961-65
1966-70
1971-75
1976-80
1981-85
WHITE 1961-65
1966-70
1971-75
1976-80
1981-85
MISSING DATA 1961-65
*** 1966-70
1971-75
1976-80
1981-85
SEX (WHITES ONLY):
MALES 1961-65
1966-70
1971-75
1976-80
1981-85
FEMALES 1961-65
1966-70
1971-75
1976-80
1981-85
PERIOD, 1961-85
TOTAL
2801
2509
2151
2132
1986
187
197
234
269
260
2148
2255
1910
1858
1685
466
57
7
5
41
1144
1139
1025
960
867
1004
1116
885
898
818
ATI*1ED
AREA 1
583
540
485
434
423
9
2
13
1
5
478
527
472
426
405
96
11
0
1
13
253
282
261
228
218
225
245
211
198
187
(AREA 1A)*
(172)
(120)
(90)
(81)
(91)
(0)
(0)
(1)(0)
(1)
(150)
(115)
(90)
(80)
(88)
(22)
(5)
(0)
(0)
(2)
(84)
(63)
(50)
(44)
(43)
(66)
(52)
(40)
(36)
(45)
AREA 2
2218
1969
1666
1698
1563
178
195
221
262
255
1670
1728
1438
1432
1280
370
46
7
4
28
891
857
764
732
649
779
871
674
700
631
* Area 1A numbers are also counted in the Area 1 column.
** Singleton births with information on residence, birthweight and with
maternal residence in Areas 1 or 2 at time of birth.
*** During part of the time period 1962-1963 information on race was not
requested on the NJDOH Vital Statistic birth certificate.
32

TABLE 3. POTENTIAL RISK FACTORS FOR BIRTH WEIGHT BY FIVE-YEAR PERIODS:
WHITE BIRTHS, GESTATIONAL AGE > 27 WEEKS, 1961-85
POTENTIAL
RISK FACTOR
MATERNAL AGE
(YEARS)
1961-65
1966-70
1971-75
1976-80
1981-85
GESTATIONAL AGE
(WEEKS)
1961-65
1966-70
1971-75
1976-80
1981-85
MATERNAL EDUCA
TION (YEARS)
1961-65
1966-70
1971-75
1976-80
1981-85
PARITY (NUMBER
OF PREGNANCIES)
1961-65
1966-70
1971-75
1976-80
1981-85
% POOR PRENATAL
CARE *
1961-65
1966-70
1971-75
1976-80
1981-85
AREA 1A
MEAN SD N
AREA 2
MEAN SD N
26.2
25.7
24.6
26.0
26.2
39.8
40.1
40.1
40.2
40.1
12.2
12.4
13.3
12.9
2.8
2.6
2.1
2.0
1.9
5.6
5.7
4.7
5.0
5.3
1.5
2.0
2.5
2.3
2.4
477
518
446
417
399
477
518
446
417
399
2.2
2.1
2.1
2.2
1.8
1.7
1.4
1.2
1.0
298
425
400
398
477
517
446
417
396
50.3%
53.4%
32.4%
24.4%
294
416
392
390
28.1
28.7
27.3
27.8
28.4
39.7
39.9
39.6
40.1
39.6
4.7
5.9
4.3
4.8
4.9
1.4
1.8
2.4
2.8
2.3
149
112
84
78
87
149
112
84
78
87
13.1
13.8
14.3
14.2
2.8
2.8
2.3
2.2
1.9
2.0
2.1
1.9
2.0
1.3
1.6
1.1
1.1
1.0
57
79
76
86
149
112
84
78
85
46.6%
42.1% **
23.3% **
19.3%
58
76
73
83
26.9
26.3
25.5
25.7
26.1
39.8
40.0
40.2
40.2
40.1
5.8
5.8
5.2
5.0
4.9
1.5
2.1
2.4
2.4
2.6
1660
1701
1369
1401
1256
1661
1701
1369
1401
1257
12.2
12.4
12.8
13.1
2.9
2.7
2.4
2.0
1.9
1.8
2.0
2.1
2.1
1.7
1.7
1.7
1.2
1.1
966
1269
1366
1253
1659
1695
1363
1399
1248
49.9%
53.8%
36.5%
27.4%
* The method is described in Institute of Medicine, National Academy of
Sciences' study on infant death, 1973. The variables are month prenatal
care began and number of prenatal visits as reported on the birth
certificate. Data for these variables were not available for the earlier
time period.
** Statistically significant (p<0.05), Area 1A compared to Area 2.
33
940
1227
1330
1227
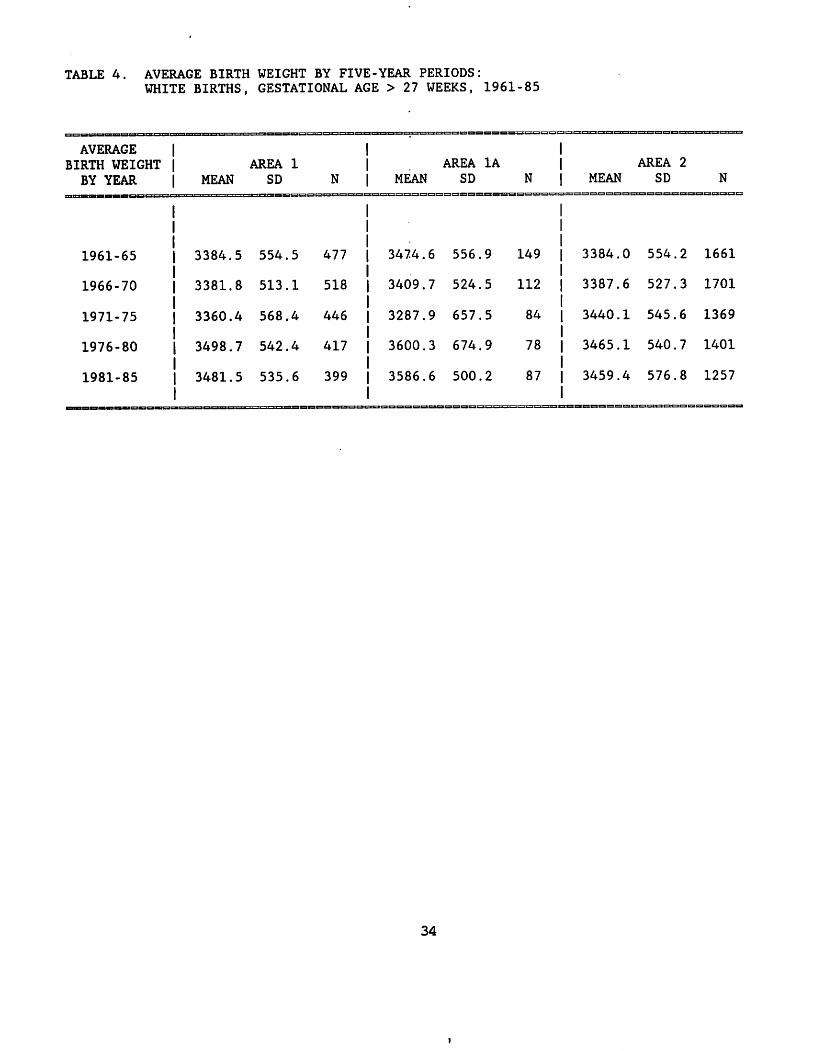
TABLE 4. AVERAGE BIRTH WEIGHT BY FIVE-YEAR PERIODS:
WHITE BIRTHS, GESTATIONAL AGE > 27 WEEKS, 1961-85
AVERAGE
BIRTH WEIGHT
BY YEAR
1961-65
1966-70
1971-75
1976-80
1981-85
MEAN
3384.5
3381.8
3360.4
i 3498.7
| 3481.5
AREA 1
SD
554.5
513.1
568.4
542.4
535.6
N
Ml
518
446
417
399
AREA 1A
MEAN SD
3474.6
3409.7
3287.9
3600.3
3586.6
556.9
524.5
657.5
674.9
500.2
N
149
112
84
78
87
MEAN
3384.0
3387.6
3440.1
3465.1
3459.4
AREA 2
SD
554.2
527.3
545.6
540.7
576.8
N
1661
1701
1369
1401
1257
34

TABLE 5. BIRTH WEIGHT DISTRIBUTIONS BY FIVE-YEAR PERIODS:
WHITE BIRTHS, GESTATIONAL AGE > 27 WEEKS, 1961-85
BIRTH WEIGHT
DISTRIBUTION
BY YEAR
YEAR: 1961-65
501-1499
1500-1999
2000-2499
2500-2999
3000-4699
4700 +
YEAR: 1966-70
501-1499
1500-1999
2000-2499
2500-2999
3000-4699
4700 +
YEAR: 1971-75
501-1499
1500-1999
2000-2499
2500-2999
3000-4699
4700 +
YEAR: 1976-80
501-1499
1500-1999
2000-2499
2500-2999
3000-4699
4700 +
YEAR: 1981-85
501-1499
1500-1999
2000-2499
2500-2999
3000-4699
4700 +
AREA 1
NUMBER (%)
4 (0.8)
3 (0.6)
18 (3.8)
85 (17.8)
364 (76.3)
3 (0.6)
p < 0.05 *
0 (0.0)
5 (1.0)
20 (4.0)
82 (15.9)
408 (78.8)
3 (0.6)
p > 0.10 *
2 (0.4)
11 (2.5)
15 (3.4)
68 (15.2)
346 (77.6)
4 (0.9)
0.10 > p > 0.05 *
1 (0.2)
4 (1.0)
11 (2.6)
42 (10.1)
350 (83.9)
9 (2.2)
p > 0.10 *
1 (0.2)
4 (1.0)
11 (2.6)
42 (10.1)
350 (83.9)
9 (2.2)
p > 0.10 *
AREA 1A
NUMBER (%)
1 (0.7)
0 (0.0)
6 (4.0)
16 (10.7)
123 (82.6)
3 (2.0)
0.10 > p > 0.05 *
0 (0.0)
1 (0.9)
5 (4.5)
16 (14.3)
89 (79.5)
1 (0.9)
p > 0.10 *
0 (0.0)
4 (4.8)
5 (6.0)
14 (16.7)
59 (70.2)
2 (2.4)
p < 0.005 *
1 d.3)
1 (1-3)
1 (1-3)
4 (5.1)
66 (84.6)
5 (6.4)
p < 0.005 *
0 (0.0)
0 (0.0)
2 (2.3)
6 (6.9)
78 (89.7)
1 (l.Dp > 0.10 *
AREA
NUMBER
1
16
74
278
1271
21
6
7
68
270
1338
12
7
10
38
188
1109
17
3
10
44
176
1150
18
13
7
33
158
1026
20
2
(%)
(0.1)
(1.0)
(4.5)
(16.7)
(76.5)
(1.3)
(0.4)
(0.4)
(4.0)
(15.9)
(78.7)
(0.7)
(0.5)
(0.7)
(2.8)
(13.7)
(81.0)
(1.2)
(0.2)
(0.7)
(3.1)
(12.6)
(82.1)
(1.3)
(1.0)
(0.6)
(2.6)
(12.7)
(81.6)
(1.6)
Chi-square test, 5 degrees of freedom,
Area 2.
35
Area 1 or Area 1A compared to

TABLE 6. LOW BIRTH WEIGHT PROPORTIONS BY FIVE-YEAR PERIODS:
WHITE BIRTHS, GESTATIONAL AGE > 27 WEEKS, 1961-85
LOW
BIRTH WEIGHT
BY YEAR
YEAR:
<2500
YEAR
<2500
YEAR
<2500
1961-65
GRAMS: YES
NO
: 1966-70
GRAMS: YES
NO
: 1971-75
GRAMS: YES
NO
AREA
NUMBER
Odds
90%
P >
Odds
90%
P >
25
452
Ratio
C.I. =
0.10
25
493
Ratio
C.I. =
0.10
28
418
1
(%
(5.
0.
(4.
0.
(6.
)
2)
0.96
65, 1.49
8)
1.13
56, 2.31
3)
AREA 1A
NUMBER (%)
7 (4.7)
142
Odds Ratio =
90% C.I. = 0
p > 0.10
6 (5.4)
106
Odds Ratio =
90% C.I. = 0
p > 0.10
9 (10.7)
75
0.85
.44, 1.
1.01
.69, 1.
AREA
NUMBER
91
1570
64
81
1620
49
55
1314
2
(%
(5.
(4.
(4.
)
5)
8)
0)
YEAR: 1976-80
<2500 GRAMS: YES
NO
YEAR: 1981-85
<2500 GRAMS: YES
NO
Odds Ratio =1.56
90% C.I. - 1.08, 2.37
p < 0.05 *
16 (3.8)
401
Odds Ratio =0.94
90% C.I. - 0.59, 1.51
p > 0.10
17 (4.3)
382
Odds Ratio =1.01
90% C.I. = 0.63, 1.61
p > 0.10
Odds Ratio =2.87
90% C.I. - 1.54, 5.34
p < 0.005 *
3 (3.8) 57 (4.1)
75 1344
Odds Ratio =0.95
90% C.I. = 0.35, 2.54
p > 0.10
2 (2.3) 53 (4.2)
85 1204
Odds Ratio =0.55
90% C.I. = 0.16, 1.77
p > 0.10
* Statistically significant p-value. Chi-
freedom. Area 1 or Area 1A compared to
36
square test, 1 degree of
Area 2.

TABLE 7 MULTIPLE REGRESSION ANALYSIS: WHITE BIRTHS, GESTATIONAL AGE > 27 WEEKS,AREA 1 AND AREA 1A COMPARED TO AREA 2, 1961-85
SUMMARY TABLE OF AREA OF RESIDENCE VARIABLE ONLY
BIRTH YEAR PERIOD
MULTIPLE
REGRESSION
1961-1965
1966-1970
1971-1975
1976-1980
1981-1985
I j AREA OF RESIDENCE VARIABLE ONLY |
I AREA 1 | AREA 1A
| COEFFICIENT SE P-VALUE | COEFFICIENT SE P-VALUE
I14.5 25.5 0.5712 |
14.9 23.7 0.5316 |
83.3 27.6 0.0026 |
16.3 27.4 0.5524 |
■49.8 40.6 0.2205 I
I
99
13
166
145
46
.8
.7
.5
.7
.7
42
46
59
57
81
.3
.4
.0
.9
.4
0
0
0
0
0
.0185
.7732
.0049
.0120
.5662
37

TABLE 8a REGRESSION ANALYSIS: WHITE BIRTHS, GESTATIONAL AGE >27 WEEKS,AREA 1 AND AREA 1A COMPARED TO AREA 2, 1961-65
REGRESSION METHOD
AND VARIABLE
A. MULTIPLE
REGRESSION
AREA OF RESIDENCE
SEX OF CHILD
GESTATIONAL AGE
MATERNAL AGE
PRIMIPARITY
MATERNAL EDUCATION
PRENATAL CARE
PREVIOUS FETAL DEATH
AREA AND SEX
(INTERACTION TERM)
B. LOGISTIC
REGRESSION
AREA OF RESIDENCE
SEX OF CHILD
GESTATIONAL AGE
MATERNAL AGE
PRIMIPARITY
MATERNAL EDUCATION
PRENATAL CARE
PREVIOUS FETAL DEATH
AREA AND SEX
(INTERACTION TERM)
COEFFICIENT
AREA
SE P-VALUE
14.5
148.5
163.7
5.8
25.5
21.3
7.0
1.8
0.5712
< 0.0001
< 0.0001
0.0015
R SQUARED =0.22
-0.06 0.28 0.8225
0.78 0.06 < 0.0001
0.46 0.24 0.0603
AREA 1A
COEFFICIENT SE P-VALUE
99
162
160
.8
.4
.4
42.
24.
7.
3
3
8
0
< 0
< 0
.0185
.0001
.0001
65.5 27.5 0.0161
R SQUARED =0.21
-0.20 0.46 0.6639
0.
0.
0.
75
75
60
0.
0.
0.
06
36
27
< 0
0
0
.0001
.0396
.0282
38

TABLE 8b. REGRESSION ANALYSIS: WHITE BIRTHS, GESTATIONAL AGE > 27 WEEKS,
AREA 1 AND AREA 1A COMPARED TO AREA 2, 1966-70
REGRESSION METHOD
AND VARIABLE COEFFICIENT
A. MULTIPLE
REGRESSION
AREA OF RESIDENCE
SEX OF CHILD
GESTATIONAL AGE
MATERNAL AGE
PRIMIPARITY
MATERNAL EDUCATION
PRENATAL CARE
PREVIOUS FETAL DEATH
AREA AND SEX
(INTERACTION TERM)
AREA 1
SE P-VALUE
AREA 1A
COEFFICIENT SE
-14.9
146.5
103.9
4.2
92.5
23.7
20.1
4.9
2.0
24.8
0.5316
< 0.0001
< 0.0001
0.0348
0.0002
P-VALUE
R SQUARED =0.19
13.7
151.7
105.1
4.9
107.7
46.4
22.3
5.5
2.2
27.9
0.7732
< 0.0001
< 0.0001
0.0253
0.0001
R SQUARED =0.20
B. LOGISTIC
REGRESSION
AREA OF RESIDENCE
SEX OF CHILD
GESTATIONAL AGE
MATERNAL AGE
PRIMIPARITY
MATERNAL EDUCATION
PRENATAL CARE
PREVIOUS FETAL DEATH
AREA AND SEX
(INTERACTION TERM)
0.08 0.26 0.7691
0.64 0.05 < 0.0001
0.20 0.48 0.6682
0.62 0.05 < 0.0001
39

TABLE 8c. REGRESSION ANALYSIS: WHITE BIRTHS, GESTATIONAL AGE > 27 WEEKS,
AREA 1 AND AREA 1A COMPARED TO AREA 2, 1971-75
REGRESSION METHOD
AND VARIABLE | COEFFICIENT
A. MULTIPLE
REGRESSION
AREA OF RESIDENCE
SEX OF CHILD
GESTATIONAL AGE
MATERNAL AGE
PRIMIPARITY
MATERNAL EDUCATION
PRENATAL CARE
PREVIOUS FETAL DEATH
AREA AND SEX
(INTERACTION TERM)
AREA 1
SE P-VALUE
AREA 1A
COEFFICIENT SE
-83.3
193.3
86.2
107.4
14.9
-71.7
88.9
27.6
24.1
5.0
25.0
5.9
24.2
35.8
0.0026
< 0.0001
< 0.0001
< 0.0001
0.0014
0.0030
0.0131
P-VALUE
R SQUARED =0.21
166.5
199.2
81.2
130.0
18.6
-93.8
115.5
59.0
21 A
5.7
28.8
6.8
27.6
40.3
0.0049
< 0.0001
< 0.0001
< 0.0001
0.0063
0.0007
0.0042
R SQUARED =0.20
B. LOGISTIC
REGRESSION
AREA OF RESIDENCE
SEX OF CHILD
GESTATIONAL AGE
MATERNAL AGE
PRIMIPARITY
MATERNAL EDUCATION
PRENATAL CARE
PREVIOUS FETAL DEATH
AREA AND SEX
(INTERACTION TERM)
0.48 0.30 0.0869
0.56 0.05 < 0.0001
1.15 0.45 0.0115
0.49 0.05 < 0.0001
-0.66 0.37 0.0717
40
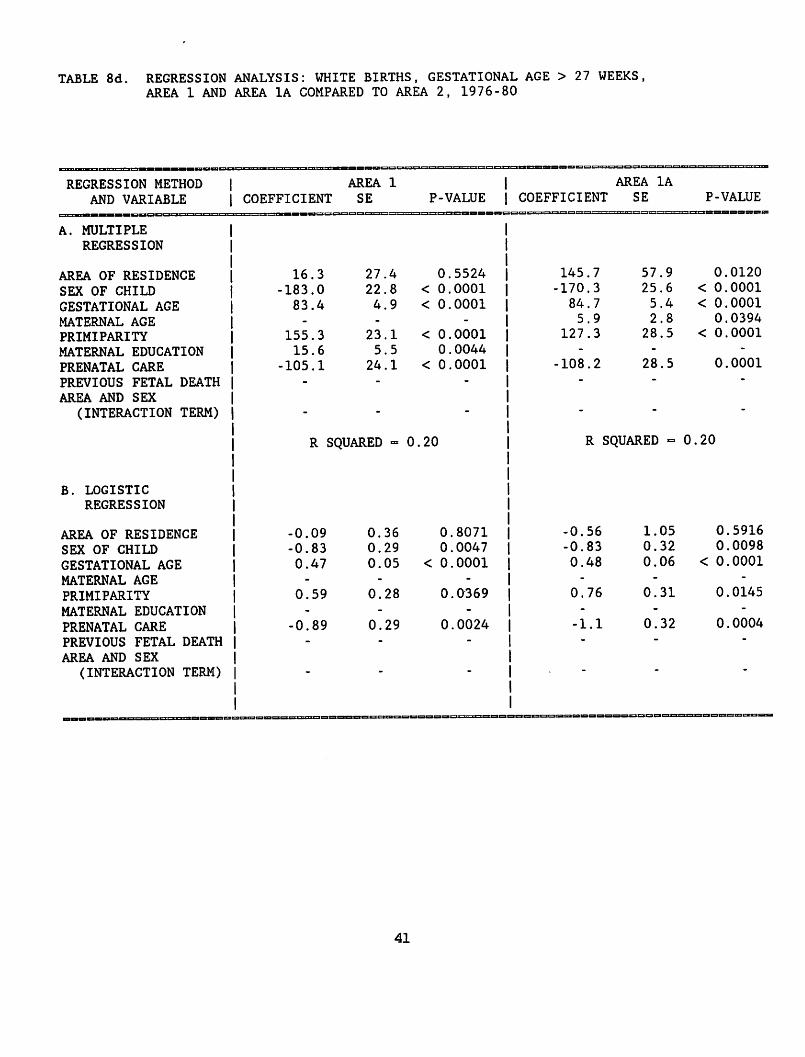
TABLE 8d. REGRESSION ANALYSIS: WHITE BIRTHS, GESTATIONAL AGE > 27 WEEKS,
AREA 1 AND AREA 1A COMPARED TO AREA 2, 1976-80
REGRESSION METHOD |
AND VARIABLE |
A. MULTIPLE |
REGRESSION |
AREA OF RESIDENCE |
SEX OF CHILD
GESTATIONAL AGE
MATERNAL AGE
PRIMIPARITY
MATERNAL EDUCATION
PRENATAL CARE
PREVIOUS FETAL DEATH
AREA AND SEX
(INTERACTION TERM)
B. LOGISTIC
REGRESSION
AREA OF RESIDENCE
SEX OF CHILD
GESTATIONAL AGE
MATERNAL AGE
PRIMIPARITY
MATERNAL EDUCATION
PRENATAL CARE
PREVIOUS FETAL DEATH
AREA AND SEX
(INTERACTION TERM)
COEFFICIENT
16.3
-183.0
83.4
-
155.3
15.6
-105.1
AREA
SE
27
22
4
-
23
5
24
-
-
R SQUARED
| -0.09
| -0.83
| 0.47
j
| 0.59
j
| -0.89
j
0.
0.
0.
-
0.
-
0.
-
1
.4
.8
.9
.1
.5
.1
36
29
05
28
29
P-VALUE
0.5524
< 0.0001
< 0.0001
-
< 0.0001
0.0044
< 0.0001
-
-
0.20
0.8071
0.0047
< 0.0001
-
0.0369
-
0.0024
-
| COEFFICIENT
| 145.7
| -170.3
| 84.7
| 5.9
| 127.3
| -108.2
AREA 1A
SE
57.9
25.6
5.4
2.8
28.5
28.5
| R SQUARED =
| -0.56
| -0.83
| 0.48
| 0.76
1 -1-1
1.05
0.32
0.06
0.31
0.32
P-VALUE
0.
< 0.
< 0.
0.
< 0.
0.
0.20
0.
0.
< 0.
0.
0.
0120
0001
0001
0394
0001
0001
5916
0098
0001
0145
0004
41

TABLE 8e. REGRESSION ANALYSIS: WHITE BIRTHS, GESTATIONAL AGE > 27 WEEKS,
AREA 1 AND AREA 1A COMPARED TO AREA 2, 1981-85
REGRESSION METHOD
AND VARIABLE
AREA 1
COEFFICIENT SE
AREA 1A
P-VALUE | COEFFICIENT SE
A. MULTIPLE
REGRESSION
AREA OF RESIDENCE
SEX OF CHILD
GESTATIONAL AGE
MATERNAL AGE
PRIMIPARITY
MATERNAL EDUCATION
PRENATAL CARE
PREVIOUS FETAL DEATH
AREA AND SEX
(INTERACTION TERM) 138.9 59.3 0.0193
R SQUARED =0.18
P-VALUE
-49.8
175.5
82.5
108.2
18.4
-77.4
40.6
29.1
5.1
25.5
6.2
29.2
0.2205
< 0.0001
< 0.0001
< 0.0001
0.0032
0.0083
46.7
-175.9
87.8
114.9
17.7
-65.0
81.4
28.8
5.6
28.1
7.0
32.2
0.5662
< 0.0001
< 0.0001
< 0.0001
0.0112
0.0407
223.1 114.6 0.0518
R SQUARED =0.20
B. LOGISTIC
REGRESSION
AREA OF RESIDENCE
SEX OF CHILD
GESTATIONAL AGE
MATERNAL AGE
PRIMIPARITY
MATERNAL EDUCATION
PRENATAL CARE
PREVIOUS FETAL DEATH
AREA AND SEX
(INTERACTION TERM)
0.18 0.32 0.5810
0.53 0.05 < 0.0001
0.69 0.29 0.0162
-0.85 0.80 0.2870
0.56 0.05 < 0.0001
0.76 0.33 0.0226
42

TABLE 9. AVERAGE BIRTH WEIGHT FOR TERM BIRTHS BY BIRTH PERIOD
WHITE BIRTHS, GESTATIONAL AGE 37-44 WEEKS, 1961-85
AVERAGE
BIRTH WEIGHT
BY YEAR
1961-65
1966-70
1971-75
1976-80
1981-85
MEAN
3425.5
3424.7
3410.5
3548.2
3522.9
AREA 1
SD
496.8
482.2
498.0
492.7
510.4
N
462
482
402
384
362
MEAN
3523.3
3455.6
3334.7
3705.6
3627.8
AREA 1A
SD
501.1
487.1
618.6
560.5
469.9
N
143
105
74
69
80
MEAN
3419.5
3420.1
3475.3
3497.3
3510.5
AREA 2
SD
518.9
483.7
499.7
503.3
494.2
N
1600
1593
1251
1264
1132
43
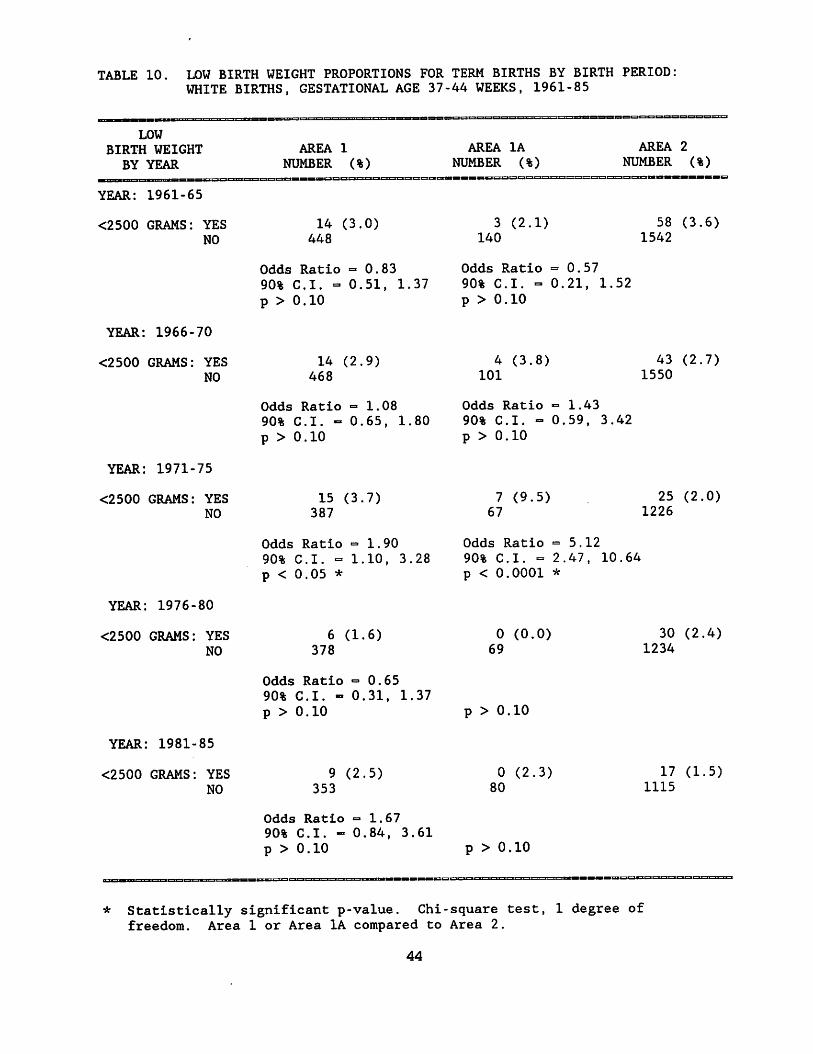
TABLE 10. LOW BIRTH WEIGHT PROPORTIONS FOR TERM BIRTHS BY BIRTH PERIOD:
WHITE BIRTHS, GESTATIONAL AGE 37-44 WEEKS, 1961-85
LOW
BIRTH WEIGHT
BY YEAR
YEAR: 1961-65
<2500 GRAMS: YES
NO
YEAR: 1966-70
<2500 GRAMS: YES
NO
AREA
NUMBER
14
448
Odds Ratio
90% C.I. -
p > 0.10
14
468
1
0
(3
0
(2
%)
.0)
0.83
.51, 1.37
.9)
AREA
NUMBER
3
140
1A
(%)
(2.1)
Odds Ratio =
90% C.I. = 0.
p > 0.10
4
101
(3.8)
0.57
21, 1
AREA
NUMBER
58
1542
.52
43
1550
2
(
(3
(2
%)
• 6)
• 7)
YEAR: 1971-75
<2500 GRAMS: YES
NO
YEAR: 1976-80
<2500 GRAMS: YES
NO
Odds Ratio =1.08
90% C.I. - 0.65, 1.80
p > 0.10
15 (3.7)
387
Odds Ratio =1.90
90% C.I. = 1.10, 3.28
p < 0.05 *
6 (1.6)
378
Odds Ratio =0.65
90% C.I. - 0.31, 1.37
p > 0.10
Odds Ratio =1.43
90% C.I. - 0.59, 3.42
p > 0.10
7 (9.5) 25 (2.0)
67 1226
Odds Ratio =5.12
90% C.I. = 2.47, 10.64
p < 0.0001 *
0 (0.0) 30 (2.4)
69 1234
p > 0.10
YEAR:
<2500
1981-85
GRAMS: YES
NO
Odds
90%
P >
9
353
Ratio
C.I. -
0.10
(2.
0.
5)
1.67
84, 3 .61
P
0
80
> 0
(2.
.10
3) 17
1115
(1 .5)
* Statistically significant p-value. Chi-square test, 1 degree of
freedom. Area 1 or Area 1A compared to Area 2.
44

TABLE 11. MULTIPLE REGRESSION ANALYSIS: WHITE TERM BIRTHS, GESTATIONAL AGE 37-44 WEEKSAREA 1 AND AREA 1A COMPARED TO AREA 2, 1961-85
SUMMARY TABLE OF AREA OF RESIDENCE VARIABLE ONLY
| | AREA OF RESIDENCE VARIABLE ONLY •
I AREA 1 | AREA 1A
BIRTH YEAR PERIOD j COEFFICIENT SE P-VALUE COEFFICIENT SE
MULTIPLE
REGRESSION
1961-1965
1966-1970
1971-1975
1976-1980
1981-1985
P-VALUE
19.8
-4.2
84.0
31.2
64.0
25.9
23.5
27.6
27.8
40.7
0.4445 |
0.8587 |
0.0024 |
0.2611 . |
0.1123 1
113.9
22.7
-177.0
151.8
23.0
43.1
45.6
59.8
59.2
79.3
0.0083
0.6193
0.0032
0.0105
0.7719
45

TABLE 12a. REGRESSION ANALYSIS: WHITE TERM BIRTHS, GESTATIONAL AGE 37-44 WEEKS,
AREA 1 AND AREA 1A COMPARED TO AREA 2, 1961-65
REGRESSION METHOD
AND VARIABLE
A. MULTIPLE
REGRESSION
AREA OF RESIDENCE
SEX OF CHILD
GESTATIONAL AGE
MATERNAL AGE
PRIMIPARITY
MATERNAL EDUCATION
PRENATAL CARE
PREVIOUS FETAL DEATH
AREA AND SEX
(INTERACTION TERM)
B. LOGISTIC
REGRESSION
AREA OF RESIDENCE
SEX OF CHILD
GESTATIONAL AGE
MATERNAL AGE
PRIMIPARITY
MATERNAL EDUCATION
PRENATAL CARE
PREVIOUS FETAL DEATH
AREA AND SEX
(INTERACTION TERM)
COEFFICIENT
AREA 1
SE P-VALUE
19.8
148.4
142.8
6.0
25.9
21.6
11.1
1.9
0.4445
< 0.0001
< 0.0001
0.0015
R SQUARED =0.10
-0.21 0.31 0.4490
0.
0.
0.
82
75
69
0.
0.
0.
10
39
27
< 0
0
0
.0001
.0549
.0106
AREA 1A
COEFFICIENT SE P-VALUE
113
156
141
.9
.0
.7
43.
23.
12.
1
7
1
0
< 0
< 0
.0083
.0001
.0001
61.6 28.1 0.0285
R SQUARED =0.10
-0.56 0.61 0.3546
0.
0.
0.
77
88
71
0
0
0
.11
.40
.30
< 0
0
0
.0001
.0270
.0163
46

TABLE 12b. REGRESSION ANALYSIS: WHITE TERM BIRTHS, GESTATIONAL AGE 37-44 WEEKS,AREA 1 AND AREA 1A COMPARED TO AREA 2, 1966-70
REGRESSION METHOD
AND VARIABLE I COEFFICIENT
AREA 1
SE P-VALUE
AREA 1A
COEFFICIENT SE
A. MULTIPLE
REGRESSION
AREA OF RESIDENCE
SEX OF CHILD
GESTATIONAL AGE
MATERNAL AGE
PRIMIPARITY
MATERNAL EDUCATION
PRENATAL CARE
PREVIOUS FETAL DEATH
AREA AND SEX
(INTERACTION TERM)
-4.2
146.0
104.8
4.1
108.5
23.5
19.9
7.1
2.0
24.4
0.8587
< 0.0001
< 0.0001
0.0398
< 0.0001
P-VALUE
R SQUARED =0.13
22.7
151.4
105.1
4.0
128.6
45.6
21.9
7.9
2.2
27.4
0.6193
< 0.0001
< 0.0001
0.0632
< 0.0001
R SQUARED =0.13
B. LOGISTIC
REGRESSION
AREA OF RESIDENCE
SEX OF CHILD
GESTATIONAL AGE
MATERNAL AGE
PRIMIPARITY
MATERNAL EDUCATION
PRENATAL CARE
PREVIOUS FETAL DEATH
AREA AND SEX
(INTERACTION TERM)
0.12 0.32 0.7154
0.60 0.10 < 0.0001
0.39 0.54 0.4640
0.56 0.11 < 0.0001
0.53 0.31 0.0856
47

TABLE 12c. REGRESSION ANALYSIS: WHITE TERM BIRTHS, GESTATIONAL AGE 37-44 WEEKS,AREA 1 AND AREA 1A COMPARED TO AREA 2, 1971-75
REGRESSION METHOD
AND VARIABLE
A. MULTIPLE
REGRESSION
AREA OF RESIDENCE
SEX OF CHILD
GESTATIONAL AGE
MATERNAL AGE
PRIMIPARITY
MATERNAL EDUCATION
PRENATAL CARE
PREVIOUS FETAL DEATH
AREA AND SEX
(INTERACTION TERM)
B. LOGISTIC
REGRESSION
AREA OF RESIDENCE
SEX OF CHILD
GESTATIONAL AGE
MATERNAL AGE
PRIMIPARITY
MATERNAL EDUCATION
PRENATAL CARE
PREVIOUS FETAL DEATH
AREA AND SEX
(INTERACTION TERM)
COEFFICIENT
AREA
SE P-VALUE
-84.0
•204
95
111.2
13.5
-56.6
103.4
27.6
24.1
7.4
25.1
5.9
24.1
35.9
0.0024
< 0.0001
< 0.0001
< 0.0001
0.0230
0.0190
0.0040
R SQUARED =0.16
0.71
0.53
0.35 0.0435
0.11 < 0.0001
AREA 1A
COEFFICIENT SE P-VALUE
177.0
208.6
93.2
5.6
108.1
13.8
-76.1
109.5
59.8
21A
8.4
3.2
32.7
7.0
27.6
40.7
0.0032
< 0.0001
< 0.0001
0.0820
0.0010
0.0492
0.0058
0.0073
R SQUARED =0.16
1.
0.
53
42
0
0
.49
.13
0
0
.0018
.0009
46

TABLE 12d. REGRESSION ANALYSIS: WHITE TERM BIRTHS, GESTATIONAL AGE 37-44 WEEKS,
AREA 1 AND AREA 1A COMPARED TO AREA 2, 1976-80
REGRESSION METHOD
AND VARIABLE
A. MULTIPLE
REGRESSION
AREA OF RESIDENCE
SEX OF CHILD
GESTATIONAL AGE
MATERNAL AGE
PRIMIPARITY
MATERNAL EDUCATION
PRENATAL CARE
PREVIOUS FETAL DEATH
AREA AND SEX
(INTERACTION TERM)
B. LOGISTIC
REGRESSION
AREA OF RESIDENCE
SEX OF CHILD
GESTATIONAL AGE
MATERNAL AGE
PRIMIPARITY
MATERNAL EDUCATION
PRENATAL CARE
PREVIOUS FETAL DEATH
AREA AND SEX
(INTERACTION TERM)
COEFFICIENT
AREA 1
SE P-VALUE
31.2
189.6
88.6
5.2
105.7
27.8
23.3
7.2
2.8
26.4
0.2611
< 0.0001
< 0.0001
0.0621
< 0.0001
-72.7 25.0 0.0498
R SQUARED =0.15
0.29
1.21
0.71
0.70
1.06
0.47
0.40
0.13
0.36
0.36
0.5277
0.0024
< 0.0001
0.0484
0.0031
AREA 1A
COEFFICIENT SE P-VALUE
151.8
175.9
91.9
7.7
111.4
59.2
26.3
8.1
2.9
29.5
0.0105
< 0.0001
< 0.0001
0.0085
0.0002
-73.9 28.0 0.0085
R SQUARED =0.15
5.71
1.15
0.69
0.93
1.29
18.70
0.43
0.14
040
0.41
0.7601
0.0077
< 0.0001
0.0197
0.0016
49

TABLE 12e. REGRESSION ANALYSIS: WHITE TERM BIRTHS, GESTATIONAL AGE 37-44 WEEKS,
AREA 1 AND AREA 1A COMPARED TO AREA 2, 1981-85
REGRESSION METHOD
AND VARIABLE
A. MULTIPLE |
REGRESSION
AREA OF RESIDENCE
SEX OF CHILD
GESTATIONAL AGE
MATERNAL AGE
PRIMIPARITY
MATERNAL EDUCATION
PRENATAL CARE
PREVIOUS FETAL DEATH
AREA AND SEX
(INTERACTION TERM)
B. LOGISTIC
REGRESSION
AREA OF RESIDENCE
SEX OF CHILD
GESTATIONAL AGE
MATERNAL AGE
PRIMIPARITY
MATERNAL EDUCATION
PRENATAL CARE
PREVIOUS FETAL DEATH
AREA AND SEX
(INTERACTION TERM)
COEFFICIENT
-64.0
-181.9
79.0
-
83.9
-82.7
-58.3
-
154.1
AREA
SE
40
28
7
-
25
37
29
-
58
R SQUARED
0.49
-
0.51
-
-
-0.85
-
-
0.
-
0.
-
-
0.
-
-
1
.7
.7
.8
.1
.6
.1
.2
- 0
42
14
45
P-VALUE |
0.1123
< 0.0001
< 0.0001
-
0.0009
0.0281
0.0458
-
0.0082
10
0.2422
0.0002
-
0.0632
COEFFICIENT
23.0
-181.3
83.3
-
93.0
-
-66.1
-
223.3
AREA 1A
SE
79.3
28.1
8.5
-
27.3
-
31.2
-
109.6
R SQUARED = 0.
-5.90
-
0.48
-
-
-1.05
-
-
17.92
-
0.17
-
-
0.55
-
-
P-VALUE
0.7719
< 0.0001
< 0.0001
-
0.0007
-
0.0340
-
0.0418
12
0.7420
-
0.0039
-
-
0.0551
-
-
50

TABLE 13. LOW BIRTHWEIGHT (<2500 GMS) FOR TERM BIRTHS BY 3-YEAR RUNNING
AVERAGES: WHITE BIRTHS, GESTATIONAL AGE 37-44 WEEKS, 1961-85
AREA 1A AREA 2
3-YEAR | LOW BIRTH WEIGHT | ODDS
PERIOD YES NO YES NO RATIO
90%
CONFIDENCE
INTERVAL P-VALUE
1961-63
1962-64
1963-65
1964-66
1965-67
1966-68
1967-69
1968-70
1969-71
1970-72
1971-73
1972-74
1973-75
1974-76
1975-77
1976-78
1977-79
1978-80
1979-81
1980-82
1981-83
1982-84
1983-85
1
1
2
3
3
3
2
2
2
3
3
4
5
4
2
0
0
0
0
0
0
0
0
83
80
66
70
65
58
64
59
57
52
35
34
39
39
41
42
43
47
46
57
52
51
42
37
35
33
31
29
21
23
26
29
19
16
14
16
13
15
20
21
19
13
8
6
10
14
876
781
832
972
956
892
892
935
962
909
778
704
669
669
678
715
752
774
759
707
674
653
669
0.285
0.279
0.764
1.344
1.521
2.197
1.212
1.219
1.164
2.760
4.168
5.916
5.361
5.278
2.205
0
0
0
0
0
0
0
0
0.054-1.519
0.052-1.488
0.222-2.569
0.488-3.697
0.551-4.205
0.779-6.193
0.355-4.136
0.359-4.143
0.344-3.941
0.970-7.851
1.430-12.151
2.235-15.659
2.218-12.958
1.989-14.005
0.624-7.792_
_
_
_
—
> 0.10
> 0.10
> 0.10
> 0.10
> 0.10
> 0.10
> 0.10
> 0.10
> 0.10
> 0.10
< 0.05
< 0.001
< 0.001
< 0.005
> 0.10
> 0.10
> 0.10
> 0.10
> 0.10
> 0.10
> 0.10
> 0.10
> 0.10
51
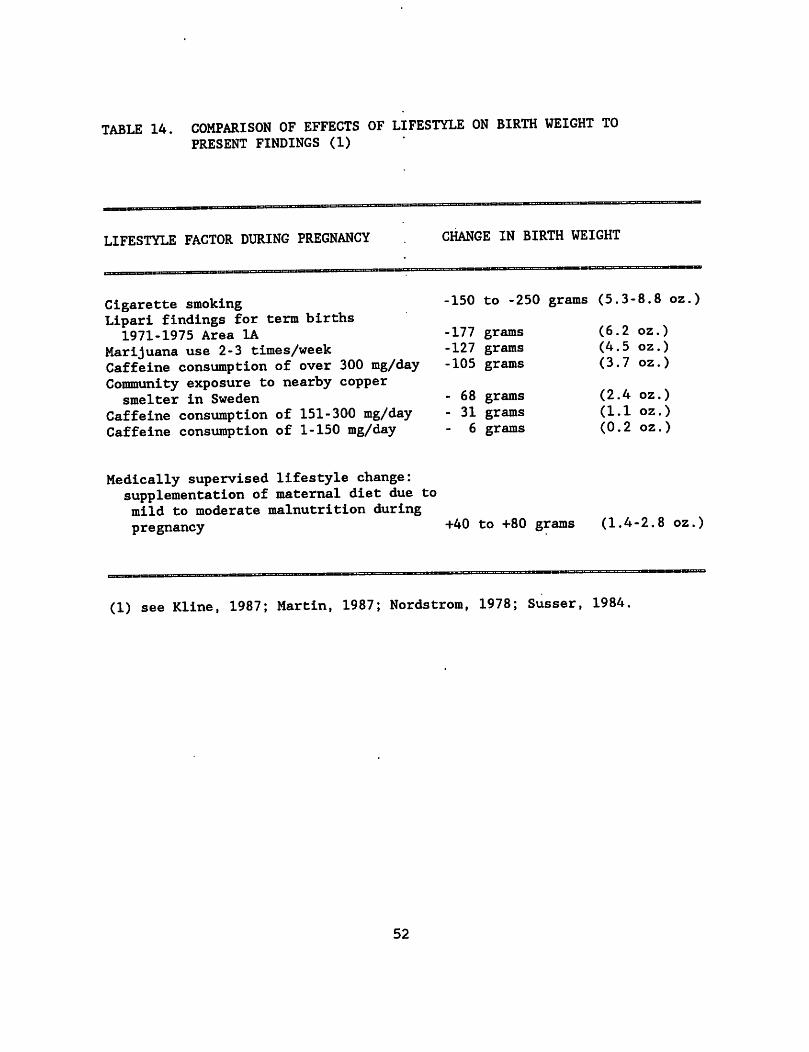
TABLE 14. COMPARISON OF EFFECTS OF LIFESTYLE ON BIRTH WEIGHT TO
PRESENT FINDINGS (1)
LIFESTYLE FACTOR DURING PREGNANCY . CHANGE IN BIRTH WEIGHT
Cigarette smoking -150 to -250 grams (5.3-8.8 oz.)
Lipari findings for term births1971-1975 Area 1A -177 grams (6.2 oz.)
Marijuana use 2-3 times/week -127 grams (4.5 oz.)Caffeine consumption of over 300 mg/day -105 grams (3.7 oz.)
Community exposure to nearby copper
smelter in Sweden - 68 grams (2.4 oz.)
Caffeine consumption of 151-300 mg/day - 31 grams (1.1 oz.)Caffeine consumption of 1-150 mg/day - 6 grams (0.2 oz.)
Medically supervised lifestyle change:
supplementation of maternal diet due to
mild to moderate malnutrition during
pregnancy +40 to +80 grams (1.4-2.8 oz.)
(1) see Kline, 1987; Martin, 1987; Nordstrom, 1978; Susser, 1984.
52

FIGURES
53

Figure
1.Lipari
LandfillBirthwcightStudyArea
PartofGloucesterCounty,
N.J.
Lipari
Landfill]and
Alcycm.Lake
Key
Highways
Hydrography
Railroads
Roads
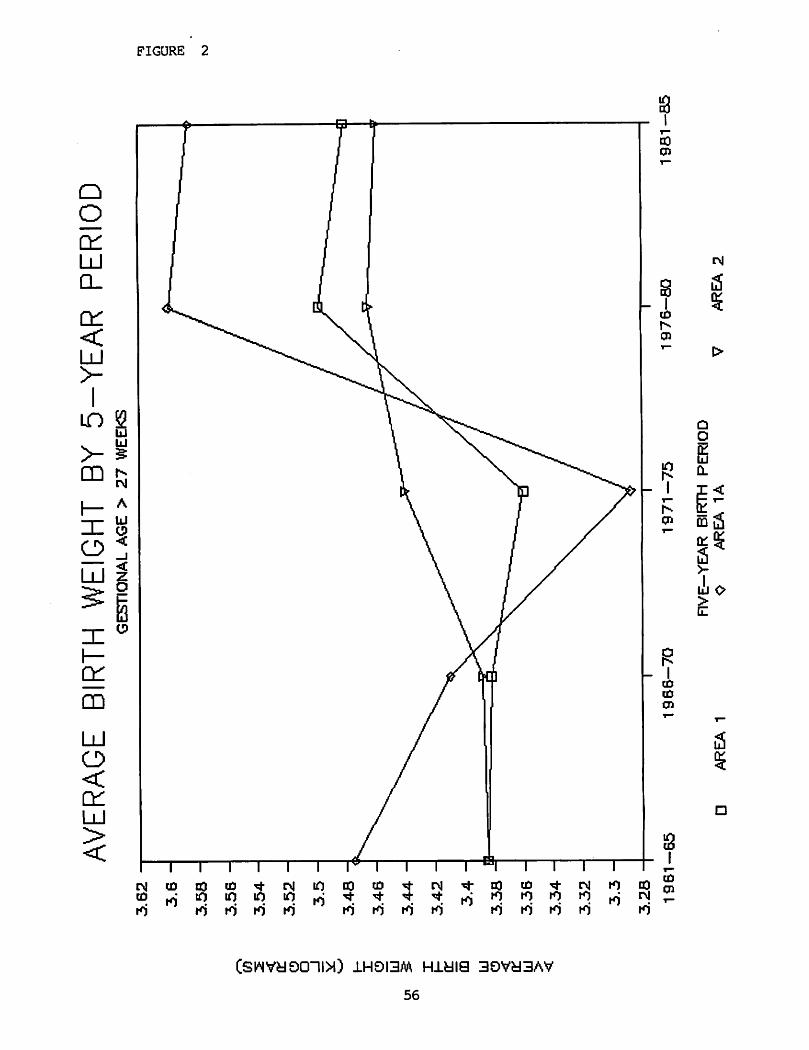
FIGURE 2
ao
EId
Q.
ft
I*
9c
ihobaa Hiyis
56

FIGURE 3
tM
Q
O
Eu
CL
Si
ToLlJ
9c
1H0I3M HldlG
57G4224