27 september 2021 annual report analysis max healthcare
TRANSCRIPT

27 September 2021 Annual Report Analysis
Max Healthcare
HSIE Research is also available on Bloomberg ERH HDF <GO> & Thomson Reuters
Emerges leaner and stronger
Max Healthcare’s annual report 2020-21 reflects the first year of consolidated
financial statements of the combined entity - Max and Radiant. In this report,
while financials are not comparable due to merger, we analyse the qualitative
characteristics and key components of the company’s balance sheet and P&L.
The management commentary reinforces its intent to grow aggressively by
additionally employing asset light models of expansion and exploring
inorganic opportunities. Key financial highlights include: (a) recognition of
goodwill and intangibles worth INR24.5bn and ~INR23bn (both together
account for ~85% of net worth) pursuant to purchase price allocation exercise
in relation to Max’s assets consequent to reverse merger; (b) structural cost
savings in material, doctor fees and other expenses. We revise our estimates to
reflect new bed expansion plans and forecast 17%/24% revenue/EBITDA
CAGR over FY21-28e. Based on our long term projections, we see ~95% upside
potential over the next five years (refer to our recent initiation: Max
Healthcare – a three-act play: growth, quality, returns for the detailed thesis).
We revise our TP to INR410/sh., based on Mar’24 EBITDA (from Mar’23).
Maintain BUY.
Identifies three pillars to focus on: (a) Optimise existing network by
investing in and retaining best clinical talent, improving efficiencies through
payor mix optimisation, thrust on medical tourism and initiatives focused
on digitisation at both back-end as well as front-end; (b) invest in growth -
to add 2,300+ beds (1,630 by FY28) via brownfield route, to operationalise
~1,000 beds each through asset light models (O&M and built-to-suit) and
greenfield projects (Gurugram) while continuing to explore suitable
inorganic opportunities; (c) value unlock in MaxLab – aggressive plans to
grow the non-captive pathology business via organic and inorganic route.
Payor mix improvement can drive 300-400bps EBITDA margin expansion:
The bed share of low-margin scheme business has steadily reduced from
~37% in FY20 to ~34% in FY21. Max intends to bring this down to ~15% in
the next three years. As per a recent company update, this can potentially
add ~300-400bps to core business EBITDA margin of ~25%.
Key financial highlights from AR: (a) Intangible assets stood at ~INR23bn
on account of recognition of service agreements with all PHFs amounting to
INR17bn, trademarks worth INR5bn, representing value of Max’s brand and
logo and O&M rights worth INR1.2bn, representing rights to operate
Nanavati hospital (Exhibit 25); (b) goodwill: Max-Radiant merger was a
“reverse merger” with Radiant being the accounting acquirer and, hence, all
of Max’s assets got revalued leading to goodwill recognition of INR24.5bn in
FY21 (Exhibit 28); (c) cost structure analysis suggests that Max has achieved
the leanest cost structure among major peers post the implementation of cost
initiatives with major savings in material and doctor fees followed by other
expenses (Exhibits 29, 30, 31).
Proforma financial summary YE Mar (INR mn) FY19 FY20 FY21 FY22E FY23E FY24E
Net Revenues 35,990 40,230 36,290 48,789 54,628 62,517
EBIDTA 3,480 5,894 6,362 12,387 14,651 17,663
EBITDA Margins 9.7 14.6 17.5 25.4 26.8 28.3
EV / EBITDA (x) 100.3 59.5 57.8 29.4 24.6 20.2
RoCE (%) 5.9 10.4 8.3 21.2 22.3 23.0
Net debt/EBITDA 5.5 3.5 2.3 1.0 0.6 0.2
Source: Company, HSIE Research, projections excl. vaccine opportunity
BUY
CMP (as on 24 Sept 2021) INR 365
Target Price INR 410
NIFTY 17,853
KEY
CHANGES OLD NEW
Rating BUY BUY
Price Target INR 360 INR 410
EBITDA % FY22E FY23E
+4% -5%
KEY STOCK DATA
Bloomberg code MAXHEALT IN
No. of Shares (mn) 966
MCap (INR bn) / ($ mn) 352/4,737
6m avg traded value (INR mn) 723
52 Week high / low INR 473/97
STOCK PERFORMANCE (%)
3M 6M 12M
Absolute (%) 42.1 79.8 235.6
Relative (%) 28.1 57.7 171.3
SHAREHOLDING PATTERN (%)
Jun-21 Mar-21
Promoters 70.46 70.46
FIs & Local MFs 7.95 4.88
FPIs 14.05 17.96
Public & Others 7.54 6.70
Pledged Shares 0.34 0.34
Source : BSE
SOTP based TP on FY24e:
a) 22x EV/EBITDA for hospitals
b) 30x EV/EBITDA for Max@Home
c) 30x EV/EBITDA for Max Lab
Bansi Desai, CFA
+91-22-6171-7341
Karan Vora
+91-22-6171-7359
Page | 2
Max Healthcare: Annual Report Analysis
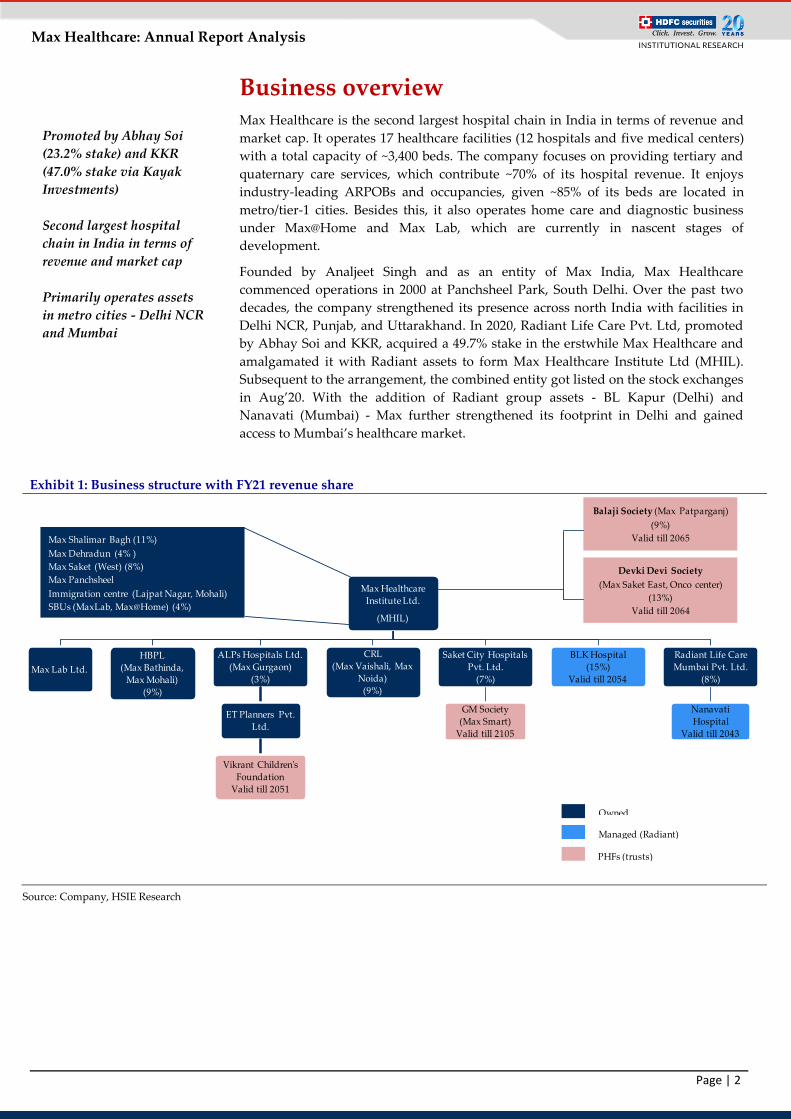
Business overview Max Healthcare is the second largest hospital chain in India in terms of revenue and
market cap. It operates 17 healthcare facilities (12 hospitals and five medical centers)
with a total capacity of ~3,400 beds. The company focuses on providing tertiary and
quaternary care services, which contribute ~70% of its hospital revenue. It enjoys
industry-leading ARPOBs and occupancies, given ~85% of its beds are located in
metro/tier-1 cities. Besides this, it also operates home care and diagnostic business
under Max@Home and Max Lab, which are currently in nascent stages of
development.
Founded by Analjeet Singh and as an entity of Max India, Max Healthcare
commenced operations in 2000 at Panchsheel Park, South Delhi. Over the past two
decades, the company strengthened its presence across north India with facilities in
Delhi NCR, Punjab, and Uttarakhand. In 2020, Radiant Life Care Pvt. Ltd, promoted
by Abhay Soi and KKR, acquired a 49.7% stake in the erstwhile Max Healthcare and
amalgamated it with Radiant assets to form Max Healthcare Institute Ltd (MHIL).
Subsequent to the arrangement, the combined entity got listed on the stock exchanges
in Aug’20. With the addition of Radiant group assets - BL Kapur (Delhi) and
Nanavati (Mumbai) - Max further strengthened its footprint in Delhi and gained
access to Mumbai’s healthcare market.
Exhibit 1: Business structure with FY21 revenue share
Source: Company, HSIE Research
Max Healthcare
Institute Ltd.
(MHIL)
Max Lab Ltd.
HBPL
(Max Bathinda,
Max Mohali)
(9%)
ALPs Hospitals Ltd.
(Max Gurgaon)
(3%)
ET Planners Pvt.
Ltd.
Vikrant Children's
Foundation
Valid till 2051
CRL
(Max Vaishali, Max
Noida)
(9%)
Saket City Hospitals
Pvt. Ltd.
(7%)
GM Society
(Max Smart)
Valid till 2105
BLK Hospital
(15%)
Valid till 2054
Radiant Life Care
Mumbai Pvt. Ltd.
(8%)
Nanavati
Hospital
Valid till 2043
Max Shalimar Bagh (11%)
Max Dehradun (4% )
Max Saket (West) (8%)
Max Panchsheel
Immigration centre (Lajpat Nagar, Mohali)
SBUs (MaxLab, Max@Home) (4%)
Balaji Society (Max Patparganj)
(9%)
Valid till 2065
Devki Devi Society
(Max Saket East, Onco center)
(13%)
Valid till 2064
Owned
Managed (Radiant)
PHFs (trusts)
Promoted by Abhay Soi
(23.2% stake) and KKR
(47.0% stake via Kayak
Investments)
Second largest hospital
chain in India in terms of
revenue and market cap
Primarily operates assets
in metro cities - Delhi NCR
and Mumbai

Page | 3
Max Healthcare: Annual Report Analysis
Key pillars to growth Max’s annual report 2020-21 and the recent company update provides insights into
its growth strategy and the key pillars it plans to focus on to achieve its growth
objectives.
Exhibit 2: A snapshot of key pillars to focus on
Source: Company presentation
Optimise existing network
Enhancing clinical capabilities – Max is well known for having high standards
of clinical care and employing high end medical technologies to offer quality
healthcare. A few initiatives taken at various hospitals last year include
enhancement of clinical teams for specialties like liver, gastroenterology and
pulmonology at Max Saket, adding teams for various surgeries (minimal access,
bariatric, robotic, spine and thoracic surgeries) at Vaishali, introducing
technologies like Radixact-x9 system, next gen. tomo-therapy, platform for cancer
care at Vaishali, introduction of Innova IGS 520 catheterisation lab (a floor-
mounted image-guided system) for cardiovascular and electrophysiology
procedures. The company continues to focus on tertiary/quaternary care
programmes and in investing in top-rated clinicians and retaining the existing
ones.
Improving operational efficiency and profitability – Over the past three years,
Max has successfully implemented INR3.3bn worth of cost savings initiatives and
synergies via renegotiation of material and indirect cost contracts, realignment of
personnel roles and responsibilities, optimisation of minimum guarantee fees to
doctors, savings in corporate overheads, and shutdown of unviable units. Going
forward, the company aims to improve operating efficiencies via better
integration, supply chain, and human resource management across facilities
Adding clinical teams and
introducing new
technologies at some of the
hospitals
Focus is on high-end
programmes and to invest
in top-rated clinicians and
retain the existing ones
To focus on improving
ARPOBs and occupancies

Page | 4
Max Healthcare: Annual Report Analysis
while also striving to improve ARPOBs and occupancies at existing units in order
to drive operating leverage.
Enhance medical tourism via setting up offices across the globe to solicit
international patients – Max’s international business has been impacted post
COVID and the contribution to hospital revenue fell to just ~4% in FY21 and ~5%
in Q1FY22 (vs. ~11% in FY20). Max aims to grow this segment aggressively over
the coming years. Among the metro cities, Delhi is the most preferred
destination, accounting for 40% of the medical tourists visiting India. Key
therapies such as oncology, orthopaedics, cardiac, transplants and neurology
form 65% of the overall demand. This bodes well for Max as it has Centers of
Excellence across these therapies in the Delhi NCR region. Accordingly, the
company has set up subsidiaries in Nigeria and UAE and an immigration center
in Mohali during the year to provide consultation services and solicit overseas
patients. It also aims to set up more offices globally to facilitate the same.
To build digital ecosystem that can leverage brand, customer loyalty, and data
– Max aims to leverage on increasing digitisation trend by connecting its back-
end delivery platform to enable more remote and virtual enabled services by
providing 'on demand' virtual assessment by medical caregiver. During the year,
it launched a video consult platform that enabled it to perform over 7-8% of
consultations (over ~1,00,000) on the platform. Moreover, Max also brought Ms.
Harmeen Mehta, a renowned digital leader, on board as an Independent director,
which further highlights the company’s focus on digital initiatives.
Invest in growth
Well defined roadmap for expansion – Max plans to expand aggressively by
adding 2,300+ beds (1,630 beds by FY28) on the base of ~3,400 beds currently
(~70% of the current capacity). This includes brownfield expansion in the most
attractive markets such as Saket Smart, Delhi (~1,100 beds), Vikrant Children’s
Foundation (~500 beds), Saket, Delhi and Nanavati hospital, Mumbai (~net 440
beds). The company has strong brand equity and proven execution capabilities in
these markets, which should result in these units turning profitable by the second
year of operations. More importantly, the land bank (~10.7 acres in Saket and ~3.9
acres in Juhu) and approvals are already in place, which should result in lower
Capex/bed (~INR13mn) and higher incremental RoCE for the new investments.
Exhibit 3: Revised indicative timelines for proposed expansion plans
Source: Company, HSIE Research
3,371 3,371
100190
329111
440
300
200
500350
250
5001,100
1,000
2,000
3,000
4,000
5,000
6,000
FY21 FY24e FY25e FY27e FY28e Beyond
FY28e
Total
Base Shalimar Bagh Mohali
Nanavati (2 phases) Vikrant (2 phases) Saket Smart (4 phases)
5,701
Planning to add 2,300+
beds (1,630 beds by FY28)
in Delhi and Mumbai at
Capex/ bed of INR13mn
Setting up subsidiaries and
offices across globe
(currently at Nigeria and
UAE) to attract and solicit
international patients
Set up an immigration
centre at Mohali
Launched video consults
platform and relaunched
Max Healthcare website
~7-8% of total consults
performed via online mode

Page | 5
Max Healthcare: Annual Report Analysis
Exhibit 4: Max Saket Complex – current vs. future layout
Source: Company presentation
Exhibit 5: Nanavati hospital – Planned layout
Source: Company presentation
Saket, Delhi
Plans to create ~2,400 bed
contiguous medical hub
spread over 23 acres of
land at prime location in
South Delhi
Existing 770 beds will be
augmented with - (a) ~1,100 additional beds
in Max Smart in four
phases as per current
brownfield expansion
plans, and (b) ~500 beds at Vikrant
Foundation post
acquisition of exclusive
rights to aid development
and provide medical
services at the proposed
hospital
Nanavati, Mumbai
Plans to add ~440 net beds
spread over 3.9 acres of
land in the iconic
Nanavati Hospital,
Mumbai via – addition of ~329 beds in
phase 1 by Q3FY25 as part
of a new block – demolition of ~160 beds
before commencement of
Phase 2 – addition of ~271 beds in
phase 2 by Q3FY27
New metro station to come
up next to Nanavati,
which will increase
accessibility and, hence,
footfalls
Bed expansion to aid
margin expansion and
enable spreading of
employee cost over a larger
base

Page | 6
Max Healthcare: Annual Report Analysis
Asset light model for future expansion – Max is already running a few of its
facilities in an asset light model. These include Radiant assets (BLK and
Nanavati) run on an O&M model and PHFs run via the medical services
agreements (MSA). Going forward, the company aims to partner through asset
light models (e.g. O&Ms or renting of built-to-suit properties in partnership with
REITs) for delivery of quality healthcare services across various metro and tier-1
cities in the country. Recently, Max entered a deal with Vikrant Foundation for
proving medical services to a Children’s hospital to be constructed in the Saket
Complex. The business structure of the same is akin to that of the existing PHFs.
We believe this deal is a testament to the new management’s intent and ability to
grow aggressively, but selectively by identifying value creating asset light
opportunities.
Exhibit 6: Illustrative structure of asset light model of expansion
Source: Company presentation
Pursue inorganic growth opportunities – The management has reiterated its
desire to look out for attractive inorganic opportunities in select markets, either
via large or a string of small and medium acquisitions.
Develop asset light adjacencies
Invest and grow the non-captive pathology business – Max Lab has expanded
steadily with presence in 14 cities, mainly in the north Indian states of Delhi
NCR, Uttarakhand, and Punjab, thereby leveraging upon its strong brand in the
region through the presence of its existing hospitals. It has become the third-
largest player in the Delhi NCR region after Dr. Lal Pathlabs and SRL.
The company plans to expand aggressively and aims to achieve a revenue of
INR2.5-3bn organically from INR676mn in FY21, implying a growth trajectory of
~40-45% CAGR over FY21-25e. Max has hived off this vertical into a separate
entity, which would be a wholly owned subsidiary of Max Healthcare which
should enable the management to maintain separate Key Performance Indicators
(KPIs) and track the performance with improved focus, transparency, and
accountability. The company is also evaluating inorganic routes for expansion to
achieve the desired scale and have stated goals to potentially unlock value at
some stage in the future.
Asset light model of
expansion via
-O&M model (BLK and
Nanavati),
-Medical Service
Agreement (PHFs/ trust
hospitals) or
-Partnerships with REITs
Plans to operationalise
~1,000 beds each through
asset light O&M
arrangements & greenfield
projects (Gurugram)
leading to benefits like:
- High RoCEs
- De-risking cost & time
over runs
- Faster growth without
draining CFs
Also, looking at inorganic
opportunities in tier-1 or
metro cities
Max plans to expand
aggressively and aims to
achieve a revenue target of
INR2.5-3bn organically
from INR676mn in FY21
over the FY21-25e

Page | 7
Max Healthcare: Annual Report Analysis
Exhibit 7: Indian diagnostics market is expected to grow at
~12% CAGR over FY20-23e
Exhibit 8: Shift to organised sector will drive further
market share gains
Source: Company, HSIE Research Source: Company, HSIE Research
Exhibit 9: We expect Max Lab revenue to grow by ~6.5x
over FY21-26e
Exhibit 10: EBITDA is expected to rise ~18x over the
same period with margins improving in line with peers
Source: Company, HSIE Research Source: Company, HSIE Research
Home care business is ramping up well – Max aims to scale its home care
business, primarily by adding new service lines and increasing the depth of
coverage. Key growth drivers include affordability of home care solutions (~40%
cheaper vs. hospital care), rising doctor acceptance, insurance policy coverage
and high quality service offerings. With the launch of X-ray and ECG at home in
FY19, it became the first player in the region to offer radiology services at home.
In line with the same, the company launched ECG@Home and also initiated post
discharge follow-ups for continued care at home. It currently attends daily
volumes of ~800 calls and manages 2,000+ transactions/shifts on a day-to-day
basis. While the patient preference for “at-home care” remaining low in India,
COVID has expedited the shift in patient behavior to some extent. The company,
however, aims to ramp up this business over the course of the next few years as it
can act as a funnel to attract patients to the company’s hospital network. The
recently launched digital platform will also help the company to build this
business over the long term.
472
684
950
0
200
400
600
800
1,000
FY17 FY20 FY23e
INR bn
Indian diagnostics marketOrganised
12-17%
Hospital
based45-50%
Unorganised
35-40%
86%
68%
65%
82%
54%
40%
30% 29%
20%
30%
40%
50%
60%
70%
80%
90%
0
1,000
2,000
3,000
4,000
5,000
FY
17
FY
18
FY
19
FY
20
FY
21
FY
22
e
FY
23
e
FY
24
e
FY
25
e
FY
26
e
INR mnRevenues Growth
-15%
-8%
-2%
6%10%
22%
23%25% 26% 27%
-20%
-10%
0%
10%
20%
30%
-200
0
200
400
600
800
1,000
1,200
FY
17
FY
18
FY
19
FY
20
FY
21
FY
22
e
FY
23
e
FY
24
e
FY
25
e
FY
26
e
INR mnEBITDA EBITDA Margins
Aims to scale up its home
care business by adding
new service lines (recently
added ECG@Home, post
discharege follow-ups) and
increasing the depth of
coverage
Growth drivers:
- Home care solutions
~40% cheaper compared to
hospitals
- Rising doctor acceptance
- Insurance policies
covering home care
- High quality services
through digital systems

Page | 8
Max Healthcare: Annual Report Analysis
Exhibit 11: Indian home healthcare market is expected to
grow in mid to high teen CAGR over 2020-2025
Exhibit 12: Organised sector is expected to contribute
USD300mn by 2025, implying ~40% CAGR
Source: Company, HSIE Research Source: Company, HSIE Research
Exhibit 13: We expect Max@Home revenue to grow by
~3.5x over FY21-26e…
Exhibit 14: …with EBITDA growth of ~8x over the same
period with improved margins
Source: Company, HSIE Research Source: Company, HSIE Research
5
11-13
0
2
4
6
8
10
12
14
2020 2025e
USD bn
Indian home healthcare market
1
4-5
0
1
2
3
4
5
2020 2025e
lacs
Organised sector coverage
23%
-9%
50%
35%
25%20%
15%
-20%
-10%
0%
10%
20%
30%
40%
50%
60%
0
500
1,000
1,500
2,000
2,500
FY
17
FY
18
FY
19
FY
20
FY
21
FY
22
e
FY
23
e
FY
24
e
FY
25
e
FY
26
e
INR mnRevenues Growth
-25%
-15%-10%
2%
10%
15%18% 20%
22% 23%
-30%
-20%
-10%
0%
10%
20%
30%
-100
0
100
200
300
400
500
600F
Y1
7
FY
18
FY
19
FY
20
FY
21
FY
22
e
FY
23
e
FY
24
e
FY
25
e
FY
26
e
INR mnEBITDA EBITDA Margins

Page | 9
Max Healthcare: Annual Report Analysis
Qualitative analysis In this section, we delve deeper into the non-financial aspects to assess the strength of
the business. We observe that Max appears to be in compliance with the requisite
corporate governance requirements including board composition, conduct of board
meetings, director’s remuneration, formation of various committees and audit
compliance, among others. The company also seems to have provided adequate
disclosures in relation to qualitative aspects and assumptions used to derive key
financial numbers like goodwill discounting rates, contingent liabilities, etc. Besides
this, the company does not have any material related party transactions with outside
related parties during the year.
Board of directors
Exhibit 15: Well diversified board with expertise and experience across various fields
Name Position Education Experience Appoint-
ment date Committees
Other major
directorships
Mr. Abhay Soi Promoter &
CMD
MBA from European
University, Belgium;
BA from St. Stephen's
College, Delhi
University
-Started career as restructuring
professional at Arthur Anderson
-Part of restructuring team at KPMG &
EY
-Co-founded USD350mn Special
Situations PE Fund
-Promoter and MD at Radiant Life
21-Jun-19
Audit,
stakeholder
relationship,
risk mgmt,
CSR
NA
Mr. Sanjay O.
Nayar
Non-Exec.
Director
MBA Finance from
IIM, Ahmedabad;
Graduation from
Delhi College of
Engineering
-Served Citi group for 25 years in
various positions in India, UK and US
-Was also CEO at Citi group's Indian
and South Asian operations
-Joined KKR in 2009, was Partner and
CEO of KKR India till Jan'21
-Currently serving as the Chairman at
KKR India
21-Jun-19 Audit, risk
mgmt JB Chemicals
Ms. Ananya
Tripathi
Non-Exec.
Director
Gold medalist across
both MBA from IIM,
Kozhikode and
engineering degree
from Pune University
-Worked as Associate Partner at
McKinsey for seven years
-Headed category business at Myntra
and was also the Chief Strategy Officer
-Currently serving as the director at
KKR Capstone
19-Jun-20
NRC,
stakeholder
relationship,
CSR
JB Chemicals
Mr. Mahendra
Lodha
Independent
Director CA and law graduate
Over 40 years of rich experience in
investment banking, corporate
restructuring and corporate and
project finance
21-Jun-19
Audit, NRC,
risk mgmt.,
CSR
NA
Mr. Kummamuri
Murthy
Independent
Director CA and CWA
-Has served as a director on board of
various companies like ONGC, IDBI
Bank, LIC HF, UTI Bank, UTI, IFCI,
etc.
-Was also associated as a Member/
Chairman of more than 50 high level
Government Committees
26-Aug-09
Audit, NRC,
stakeholder
relationship,
risk mgmt
Max Financial
Services,
NELCO, Max
Ventures and
Industries
Mr. Michael
Neeb Ind. Director
Bachelor’s degree in
accounting from
Baylor University and
MBA from University
of Dallas
-American businessman with 30+
years of experience in healthcare
industry
-Began career as Director of Finance
and project for Harris Methodist
affiliated hospitals, Texas
-Has worked with HCA Healthcare,
UK as CEO for 12 years
21-Jun-19 Audit, risk
mgmt NA
Ms. Harmeen
Mehta
Independent
Director
Massachusetts
Institute of
Technology, Harvard
University
Renowned digital leader with 10+
years of experience. She has a deep
background in Artificial Intelligence
and is currently serving as the Chief
Digital and Innovation Officer at BT
Group Plc
24-May-21 Audit, NRC,
risk mgmt NA
Source: Company, HSIE Research, CMD – Chairman and Managing Director
Page | 10
Max Healthcare: Annual Report Analysis
Board composition and director’s remuneration
Mr. Abhay Soi is the promoter and CMD of Max Healthcare. Max has seven directors
on its board with four of them being independent directors, which is in compliance
with the applicable provisions of the Companies Act, 2013.
Total director’s remuneration (including directors’ sitting fees) for the company
stands at ~0.5% of net reported revenue, as of FY21. Out of the INR113mn amount
paid to directors, ~INR105mn is being paid to Mr. Abhay Soi, primarily in the form of
salaries and perquisites.
Exhibit 16: Board composition and directors’ remuneration
INR mn Erstwhile Max Combined entity
FY18 FY19 FY20 FY21
Board Composition
No. of directors 11 13 7 7
No. of Independent Directors 3 3 4 4
% of Independent Directors 27.3% 23.1% 57.1% 57.1%
Director remuneration
Director's remuneration
81 113
As a % of sales
0.4% 0.5%
Source: Company, HSIE Research
Change in auditors
Deloitte has been appointed as the statutory auditors from FY21, replacing M/s S.R.
Batliboi (an EY affiliate), in order to comply with the applicable provisions of the
Companies Act in relation to the rotation of statutory auditors.
Exhibit 17: Audit fees’ structure
INR mn Erstwhile Max Combined entity
FY18 FY19 FY20 FY21
Core audit fee 4.5 7.0 9.4 9.2
Other services 0.1 0.6 0.1 8.1*
Reimbursement 0.2 0.1 0.1 0.1
Standalone Audit fees 4.8 7.7 9.6 17.4
Core audit fee % 94% 91% 98% 53%
Source: Company, HSIE Research, *incl. fee for business combination accounting
Exhibit 18: Snapshot of various audit teams post merger
Erstwhile Max Radiant Max (post merger)
Statutory Audit
Auditors M/s S.R. Batliboi and Co.
LLP (an EY affiliate)
M/s Deloitte Haskins &
Sells
M/s Deloitte Haskins &
Sells
Signing Partner Sanjay Vij Rajesh K. Hiranandani Rashim Tandon
Latest Opinion Unqualified Unqualified Unqualified
Cost Auditors M/s Chandra Wadhwa &
Co NA
M/s Chandra Wadhwa &
Co
Secretarial Auditors Jus & Associates NA M/s Sanjay Grover &
Associates
Source: Company, HSIE Research
Mr. Abhay Soi is the
promoter and CMD of
Max Healthcare, holding
23.2% stake in the
company (31 Aug’21)
4 out of 7 directors are
Independent Directors, in
line with the requirements
of law
Directors’ remuneration
appears reasonable and in
line with norms
Historically, over 90% of
audit fee has been for core
audit services
M/s Deloitte Haskins and
Sells have been appointed
as the statutory auditors
from FY21 onwards

Page | 11
Max Healthcare: Annual Report Analysis
Goodwill impairment testing rates
Exhibit 19: Goodwill discount rates vs. peers
% Max Apollo Fortis Narayana
Goodwill discount
rate 11-13%
Healthcare: 12%
Clinic: 16%
Pharmacy: 14.5%
12.7% 15.23%
Source: Company, HSIE Research
Trade receivables
Historical data suggests that Max’s debtor collection days have been higher
compared to Radiant, possibly on account of higher share of schemes business in
Max. However, with the merger of Radiant, the outstanding debtor % has moderated
in FY21. We expect this to go down further over the next few years as the company
focuses more on reducing the schemes business.
Exhibit 20: Trade receivable analysis
INR mn Erstwhile Radiant Erstwhile Max Combined entity
FY19 FY20 FY19 FY20 FY21
Total debtors 874 961 4,994 4,940 4,853
as a % of net sales 9.4% 9.0% 29.9% 26.5% 19.6%
Bad debts written off 31 227 136 53 323
as a % of total debtors 3.5% 23.6% 2.7% 1.1% 6.7%
Source: Company, HSIE Research
Maturity profile and break- up of group’s financial liabilities
Overall group financial liabilities of Max amounts to INR23.8mn, which includes
INR13.7bn of borrowings (incl. interest), INR4.4bn of trade payables, INR1.8bn of
lease liabilities and INR4.0bn of other financial liabilities.
Almost one-third of the group’s financial liabilities are due in FY22, representing an
estimated cash outflow of INR7.7bn over the 12-month period. We expect Max to
generate ~INR9bn operating cash flows (before adj. for WC changes and interest
payments) in FY22e, which should be more than sufficient to cover its liabilities.
Besides this, the balance sheet strength (net debt/EBITDA of ~0.5x as of June’21)
allows the company to leverage for Capex needs or to refinance the existing debt at
potentially favourable rates, if needed.
Exhibit 21: Current maturity profile of group’s financial liabilities
INR mn Erstwhile Max Combined entity
FY19 FY20 FY21
Maturity profile
0-1 years 5,371 15,356 7,657
1-5 years 5,970 6,135 9,206
>5 years 9,325 8,616 6,920
Total 20,665 30,107 23,783
Maturity profile (%)
0-1 years 26.0% 51.0% 32.2%
1-5 years 28.9% 20.4% 38.7%
>5 years 45.1% 28.6% 29.1%
Total 100.0% 100.0% 100.0%
Source: Company, HSIE Research, includes borrowings, trade payables, lease liabilities and other financial
liabilities
Goodwill impairment
testing rates used by Max
is in line with major peers
Combined entity’s debtor
collection days to tighten
further over the next few
years with a marked
reduction in schemes
business
Max is expected to
generate ~INR9bn OCF
(before adj. for WC
changes and interest
payments) in FY22e vs.
estimated cash outflow of
INR7.7bn
~33% of group’s financial
liabilities (incl. interest
payments) are due to be
paid within the next 12
months

Page | 12
Max Healthcare: Annual Report Analysis
Exhibit 22: Break-up of group’s financial liability maturity profile in FY21
INR mn 0-1 years 1-5 years >5 years Total
Borrowings (incl. interest) 1,602 6,442 5,613 13,658
Trade payables 4,357 0 0 4,357
Lease liabilities 111 391 1,307 1,809
Other financial liabilities 1,587 2,373 0 3,960
Total 7,657 9,206 6,920 23,783
% of total 32.2% 38.7% 29.1% 100.0%
Source: Company, HSIE Research, erstwhile Max nos. till FY20
Contingent liabilities
Contingent liabilities of INR3.7bn form ~17% of the total net worth with ~55% of the
liabilities towards corporate guarantees given to banks and financial institutions on
behalf of PHFs, while the balance ~45% are towards civil and tax cases against the
company.
The civil cases include a criminal lawsuit by the Assistant Charity Commissioner
(Hospital) against Nanavati hospital for alleged irregularities/ illegalities found in the
implementation of scheme framed by Bombay High Court. As per Max, this is a 2-3
year-old case and the same will not have any material impact. The other case law
pertains to additional payment of interest on account of delayed payments by Max
claimed by the plaintiff with respect to a land parcel allotted to the company in
Mohali (to be used for the proposed 190 bed expansion). However, as per the
company, the same has been settled, as of today.
Exhibit 23: ~45% of group’s current contingent liabilities represent civil and tax
cases
INR mn Erstwhile Max Combined entity
FY19 FY20 FY21
Contingent Liabilities 3,386 4,702 3,650
Net worth 9,632 9,874 21,390*
CL % of NW 35.2% 47.6% 17.1%
Source: Company, HSIE Research, *ex-PPA allocation impact of ~INR34-35bn
Key hospitals entailed in
litigation include
Nanavati (nothing
significant as per the
management) and Mohali
(now settled)

Page | 13
Max Healthcare: Annual Report Analysis
Quantitative analysis
Balance sheet items and extracts
Since the Max-Radiant merger came into effect from June’20, this is the first year of
the annual report reflecting consolidated financials which are inclusive of Max +
Radiant numbers. Since this was a case of reverse merger, the previous year’s
financials, as stated in the annual report, represent Radiant’s (the “accounting
acquier”) numbers and, hence, are not comparable. We have tried to compare current
year’s financials with previous year’s numbers of Max and Radiant separately
wherever possible and commented on the nature of some of the key balance sheet
components.
Exhibit 24: Extract of consolidated balance sheet
Year to March (INR mn) FY20
Radiant
FY20
Max
FY21
Combined Comments
Liabilities
Shareholder’s funds 25,532 9,874 56,387
Increase due to purchase price allocation of ~INR34bn on account of fair
valuation of Max’s assets at the time of merger and booking of INR12bn
worth of QIP proceeds
Other financial liabilities 2,419 30 2,373 Contingent consideration payable to Nanavati & BLK trustees calculated
as NPV of estimated future cash outflow
Unfavourable lease liability
(Other non-current liabilities) 0 0 2,252
NPV of est. outflow obligation for land at Mohali and Bathinda as per
concession agreement with the Punjab government
Put option liabilities/ payable
for share purchases 0 5,857 820
To buy stakes in CRL & Smart City (GM Modi agreement subsidiary)
which is almost done now. GM Modi/ CRL had a lock-in of 3-4 yrs, after
which they had the right to sell to Max which they exercised.
Assets
Intangibles Fixed Assets 1,426 9,515 23,335 Refer Exhibit 25
Goodwill 4,176 2,854 24,547
Increase in FY21 on account of revaluation of Max assets to fair value as
Radiant was considered as the accounting acquirer during the merger
(refer Exhibit 28 for details on allocation of goodwill to various CGUs)
Right of use assets 162 1,331 2,255 Primarily on account of Ind AS 116 impact
Loans 28 3,352 3,570 Loan to trust hospitals - INR1,370mn loan to GM Modi and INR250mn
loan to Devki Devi. Also, refer Exhibit 26
Other non-current assets 1,090 1,029 2,210 Refer Exhibit 27
Notes to Accounts
Receivable from PHFs NA 7,094 6,607 Incl. INR1,785mn deposits with PHFs, INR1,674mn advanced as loan,
INR717mn as prepaid expense and INR2,431mn as trade receivables
Source: Company, HSIE Research, CGUs – Cash generating units
Exhibit 25: Intangible fixed asset schedule (Extract)
Year to March (INR mn) FY20
Radiant
FY20
Max
FY21
Combined Comments
Intangible Fixed Assets
Service Agreements 0 9,333 16,861
Fair value of the Medical Services Agreements (MSA) with all three PHFs.
This is amortised over the e tenure of agreement. Till FY20, Max only
accounted for GMHRC Society’s (Max Smart) however now all PHF
contracts are recognized as MSA.
Trademarks 0 0 4,938 Represents Max’s brand image & logo which the entity uses even post the
merger; this is tested for impairment like goodwill
O&M rights 1,402 0 1,243 Represents fair value of equipments and other assets of Nanavati (ex-land
and building) on which the combined entity has the right-to-use
Source: Company, HSIE Research

Page | 14
Max Healthcare: Annual Report Analysis
Exhibit 26: Loans (Extract)
Year to March (INR mn) FY20
Radiant
FY20
Max
FY21
Combined Comments
Loans
Loans to other healthcare
providers 0 1,370 1,620 INR1,370mn loan to GM Modi and INR250mn loan to Devki Devi
Security Deposit 28 1,983 1,950 Incl. INR1,785mn deposits with PHFs (some of which is non-interest
bearing)
Source: Company, HSIE Research
Exhibit 27: Other non-current assets (Extract)
Year to March (INR mn) FY20
Radiant
FY20
Max
FY21
Combined Comments
Other non-current assets
Capital Advances 18 338 312
Incl. INR 162mn paid on account of the advance towards ~4.3acre land
located at Greater Noida with a market value of ~INR290mn. Max has
applied to Greater Noida Development Authorities for possession of land
after payment of all due amounts and is waiting for grant of possession.
The company may look to build a hospital in the future.
Unamortised contract expense 1,016 0 986 Represents cost of land and buildings of BLK and Nanavati hospital being
consolidated in the financials and expensed over the period of contract
Source: Company, HSIE Research
Goodwill
As of FY20, the goodwill appearing in Max and Radiant’s financials stood at
INR2.8bn and INR4.2bn respectively. The same has been revalued to INR24.5bn in
the combined financials (Max + Radiant) in FY21. This is because, from an accounting
point of view, the Max-Radiant merger was a “reverse merger” with Radiant being
the accounting acquirer and, hence, all of Max’s assets got revalued at fair value as on
the date of merger (1 June 2020). The resulting goodwill (excess of consideration paid
over the fair value of net assets) has been allocated to various cash generating units
(CGUs) as below:
Exhibit 28: Allocation of goodwill to various CGUs post merger
CGU (INR mn) Max + Radiant* Combined entity
FY19 FY20 FY21
Radiation oncology services at BLK 55 55 55
Operation & Management Contracts of the
accounting acquirer:
BLK (Silo) 3,467 3,467 3,467
Nanavati (Silo) 654 654 654
Hospital operations acquired upon business
combination w.e.f. June’20
Max Saket
4,832
Shalimar Bagh
2,073
Dehradun
1,873
Max Labs
653
Mohali
4,362
Bathinda
252
Saket City Hospitals Ltd. 2,050 2,050 3,719
Crosslay Remedies Ltd. 659 659 2,084
Alps Hospital Ltd. 145 145 522
Total 7,030 7,030 24,547
Source: Company, HSIE Research, *addition of goodwill appearing in Max and Radiant’s financials
Radiant was considered
as the “accounting
acquirer” in the Max-
Radiant merger leading to
revaluation of all of
Max’s assets
Hospitals with stronger
performance like Max
Saket, Mohali and
Vaishali (CRL) have
rightfully got the highest
share of goodwill
allocation

Page | 15
Max Healthcare: Annual Report Analysis
P&L analysis
The following statement shows changes in the key line items of the company’s P&L
whilst identifying reasons for the same:
Exhibit 29: Proforma consolidated income statement (including PHFs i.e. trust hospitals)
INR mn FY19 FY20 FY21 Comments
Revenues 36,108 40,263 36,290 Decline in occupancy and ARPOB due to lower OPDs, postponement of elective
surgeries, slowdown in medical tourism (lockdowns and farmer’s protests) Growth (%) 12% -10%
Consumables 8,416 9,234 9,733 Material cost optimisation offset against additional expense on PPE kit and other
related consumables due to COVID and reclassification of some expenses % of sales 23.3% 22.9% 26.8%
Doctor fees 8,744 9,496 5,664* Re-negotiations of minimum guarantees and variable fees payable to doctors as well
as by virtue of improving workforce productivity % of sales 24.2% 23.6% 15.6%
Employee cost 8,503 8,938 9,500 Workforce optimisation by enhancing productivity and temporary reduction of
remuneration of senior and middle management was offset by reclassification of
some expenses and actuarial valuation impact % of sales 23.5% 22.2% 26.2%
Other expenses 6,878 6,732 5,032* Cost optimisation programme (re-negotiations with vendors, reducing corp.
overheads, deferment of discretionary exp., increasing productivity of spend and
synergy benefits incl. policy harmonisation across the group). Also, refer Exhibit 31 % of sales 19.0% 16.7% 13.8%
EBITDA 3,480 5,863 6,362
Margins (%) 9.7% 14.6% 17.5%
Growth (%) 37% 8%
Depreciation 1,856 2,087 2,160
Other income 210 1,013 851
Interest 1,788 3,135 2,721 Decline in the borrowings in the fourth quarter of FY21
PBT 45 1,653 2,332
Tax 183 (29) 504 Normalised tax rate expected to be ~15-18% in FY22e and ~18-20% in FY23e. Rates
are low on account of MAT credits and tax exemptions to Nanavati, BLK and PHFs Effective tax rate (%) NM -1.7% 21.7%
MI/share in JV -28 0 231
Recurring PAT (166) 1,682 451
Extraordinary items 0 0 1,636 Adj. for ESOPs, loss on fair value of merger and other such one-off items
Reported PAT (166) 1,682 (1,185)
Source: Company, HSIE Research, *HSIE estimate
Cost structure
Post the successful implementation of INR3.3bn worth of cost savings initiatives and
synergies in the past three years, Max has optimised its cost structure and has
industry-best metrics on some of the cost line items. Max’s Q1FY22 EBITDA margin
is already at ~25% (ex-vaccines). This compares favorably with Apollo’s mature
hospital margin of ~22% and NH’s mature hospitals’ India business margin of ~14%
in Q1FY22.
Exhibit 30: Extract of proforma common size income statement
Particulars FY19 FY20 FY21 Q1 FY22
Proforma revenues 35,990 40,230 36,290 13,222
Consumables 23.3% 22.9% 26.8% 27.8%
Doctor fees 24.2% 23.6% 15.6% 13.4%
Employee costs 23.5% 22.2% 26.2% 21.0%
Other expenses 19.0% 16.7% 13.8% 10.5%
EBITDA margins 9.9% 14.6% 17.5% 27.3%
Source: Company, HSIE Research, Q1 nos. include vaccine revenue (~INR1.5bn) and EBITDA (INR600mn)
Savings in other expenses
Out of the INR3.3bn initiatives as mentioned above, INR2.2bn implemented in phase-
1, represented the structural cost savings. In the below table, we list some of the
major cost line items, which the company has managed to save and appear structural
in nature, while a few are also transient on account of COVID-led savings.
Post INR3.3bn cost
savings and synergies, Max
has one of the leanest cost
structures in the industry
Savings summary over
FY19-21e -
Doctor fees: ~861bps
Other expenses (incl.
operating leverage, other
savings): ~520bps
Total structural cost
savings: ~799bps

Page | 16
Max Healthcare: Annual Report Analysis
Exhibit 31: Savings in other expense Combined entity (INR mn) FY19 FY20 FY21* % chg. Comments
Rent 422 62 151 -64% Ind-AS impact
Facility maintenance 514 576 402 -22% COVID-led savings, synergies
Power and fuel 666 617 560 -16% Cost optimisation
Repairs to Plant 390 374 343 -12% Cost optimisation
Outside lab investigation 515 417 152 -70% Cost optimisation, regrouping
Travel and conveyance 184 195 102 -45% COVID-led savings
Legal and prof. fees 806 904 313 -61% COVID-led savings, synergies
Advertisement 642 818 183 -72% COVID-led savings
Misc. expenses 118 88 53 -55% Cost optimisation
Others 1,694 1,941 1,940 15% NA
Total other expenses^ 5,951 5,991 4,200 -29% Cost optimisation coupled with
COVID-led savings
As a % of sales 16.5% 20.4% 15.4% -104bps
Source: Company, HSIE Research, all nos. are excl. PHFs, % change column represent savings over FY19-
21e, *FY21 nos. annualised for Max, ^without adj. one-offs, restatements or eliminations worth ~INR700mn
for FY19 and FY20 each and ~INR300mn in FY21
Comparison with major peers
Cost structure
Exhibit 32: Comparison of hospitals’ business cost structures of listed peers
Particulars FY19 FY20 FY21 Q1 FY22
Consumables
Max 23.3% 22.9% 26.8% 27.8%
Apollo* 25.4% 26.0% 27.1% 28.2%
Fortis 19.6% 19.3% 22.0% 23.8%
Narayana 24.8% 24.6% 28.6% 27.5%
Doctor Fees
Max 24.2% 23.6% 15.6% 13.4%
Apollo* 23.3% 18.4% 17.9% 17.9%
Fortis 23.0% 23.9% 23.7% 21.3%
Narayana 17.8% 18.6% 22.2% 21.8%
Employee Costs
Max 23.5% 22.2% 26.2% 21.0%
Apollo* 17.6% 18.9% 21.1% 17.6%
Fortis 19.3% 17.7% 19.7% 15.9%
Narayana 25.1% 24.3% 25.7% 21.9%
Other expenses
Max 19.0% 16.7% 13.8% 10.5%
Apollo* 18.6% 20.1% 21.5% 18.0%
Fortis 34.6% 27.1% 26.5% 24.8%
Narayana 23.5% 20.8% 23.7% 21.3%
EBITDA margins
Max 9.7% 14.6% 17.5% 27.3%
Apollo* 15.1% 16.5% 12.4% 18.4%
Fortis 9.5% 12.7% 8.1% 14.2%
Narayana 8.8% 11.7% -0.2% 7.5%
Source: Company, HSIE Research, proforma nos. for Max (incl. PHFs),*Apollo revenues are grossed up for
doctor fees, Q1FY22 data includes vaccine contribution
Max has saved ~29% of
other expenses over FY19-
21e led by –
a) Structural cost
optimisation: power & fuel,
lab investigations, corp.
overheads, eliminating
waste and discretionary
spends, etc
b) COVID-led savings:
travel and conveyance,
advertising, etc
Consumables’ costs in FY21
and Q1FY22 increased due
to COVID and regrouping
of some other expenses
Doctor fee structure has
been rationalised over the
last two years. As per Max,
doctor fees at ~15-16% of
revenue are sustainable
Employee cost optimisation
has been offset by
regrouping of some expenses
Savings in other expenses
include HO cost
optimisation and other line
items as listed in Exhibit 31
Max has achieved the
leanest cost structure
among major peers

Page | 17
Max Healthcare: Annual Report Analysis
Depreciation
Max follows Straight Line Method (SLM) for depreciating both its tangible as well as
intangible assets, which is in line with other listed players like Apollo, NH and Fortis.
Exhibit 33: Comparison of depreciation vs. listed peers
Particulars FY19 FY20 FY21
Implied depn rate
Max (excl. PHFs) 8.2% 8.8% 7.0%
Apollo 6.6% 7.7% 6.0%
Narayana 5.6% 6.8% 6.2%
Depn % of sales
Max 5.1% 5.2% 6.0%
Max (excl. PHFs) 6.0% 6.3% 6.8%
Apollo 4.1% 5.5% 5.4%
Narayana 4.8% 5.9% 7.1%
Source: Company, HSIE Research, erstwhile Max nos. till FY20, combined entity nos. from FY21
Finance costs
Exhibit 34: Comparison of finance costs vs. listed peers
Particulars FY19 FY20 FY21
Max (excl. PHFs) 6.1% 8.0% 9.3%
Apollo 8.1% 10.4% 8.3%
Narayana 7.5% 8.3% 7.3%
Source: Company, HSIE Research, erstwhile Max nos. till FY20, combined entity nos. from FY21
Working capital (WC) days
The hospitals’ business has lower WC days as receivable and payable days tend to
offset each other. Accordingly, Max’s working capital days are expected to be ~5
days, which would be comparable to pure-play hospital companies like NH.
Exhibit 35: Working capital days of Max vs. peers
Particulars FY19 FY20 FY21
Working capital days
Max (excl. PHFs) 22 33 -1
Apollo 34 28 15
Narayana 2 -5 -12
Inventory days
Max (excl. PHFs) 6 8 8
Apollo 22 24 9
Narayana 11 7 7
Debtor days
Max (excl. PHFs) 79 81 54
Apollo 39 33 46
Narayana 34 31 39
Creditor days
Max (excl. PHFs) 63 56 63
Apollo 27 29 40
Narayana 43 42 58
Source: Company, HSIE Research, erstwhile Max nos. till FY20, combined entity nos. from FY21
Most hospital companies
use SLM method.
Fortis follows most
aggressive accounting
(higher depreciation),
followed by Max and then
Apollo/NH.
Max’s finance costs are
slightly higher than peers
Minimal working capital
required for hospitals’
business
Max’s working capital
days are one of the best in
the industry
Inventory days are
comparable to pure-play
hospitals entity like NH
Max seems to offer higher
credit period to debtors...
...while also enjoying
higher credit period from
suppliers

Page | 18
Max Healthcare: Annual Report Analysis
Financial projections We forecast 20% revenue CAGR over FY21-24e, driven by higher ARPOBs and
improved occupancy as the non-COVID business picks up across units.
Consequently, EBITDA growth is expected to be significant in the same period at 41%
CAGR on account of: (a) margin improvement in Nanavati hospital – we model
~1,574bps of improvement from 6% in FY20 to 22% in FY24e; (b) steady shift in payor
mix towards non-institutional patients; (c) higher contribution from international
patients as travel restrictions ease (international business was 4% in FY21 vs. 11% in
FY20); (d) ramp-up in the non-COVID business, which would drive higher ARPOBs
(COVID business was ~15% of FY21 revenue and has lower ARPOBs); (e) a portion of
synergies worth INR0.4bn to be realised in FY22.
Exhibit 36: Revenue summary
INR mn FY20 FY21 FY22e FY23e FY24e FY21-24e CAGR
Hospitals 39,053 34,918 46,513 51,325 58,096 18.5%
MHIL and subsidiaries 17,842 17,341 22,682 24,591 27,956 17.3%
PHFs 13,012 11,925 16,018 17,515 19,341 17.5%
Less: Inter-co. adj. -2,436 -2,842 -3,604 -3,678 -3,868 10.8%
Radiant 10,636 8,493 11,417 12,896 14,667 20.0%
Max@Home 768 696 1,044 1,410 1,762 36.3%
MaxLab 409 676 1,232 1,894 2,659 57.8%
Total Revenues 40,230 36,290 48,789 54,628 62,517 19.9%
Source: Company, HSIE Research, MHIL – Max Healthcare Institute Ltd, PHFs – Partnered Healthcare
Facilities
Exhibit 37: EBITDA break-up
INR mn FY20 FY21 FY22e FY23e FY24e FY21-24e CAGR
Hospitals 5,854 6,226 11,960 13,962 16,646 38.8%
MHIL and subsidiaries 2,982 3,965 6,331 7,047 8,090 26.8%
PHFs 1,423 1,690 3,704 4,144 4,898 42.6%
Less: Inter-co. adj. -1 -130 -188 -108 -294 31.3%
Radiant 1,450 701 2,112 2,879 3,953 78.0%
Max@Home 15 70 157 254 352 71.7%
MaxLab 25 67 271 436 665 115.4%
Proforma EBITDA 5,894 6,362 12,387 14,651 17,663 40.5%
Source: Company, HSIE Research, MHIL – Max Healthcare Institute Ltd, PHFs – Partnered Healthcare
Facilities
Exhibit 38: EBITDA margin summary
INR mn FY20 FY21 FY22e FY23e FY24e FY21-24e change
Hospitals 15.0% 17.8% 25.7% 27.2% 28.7% 1,082bps
MHIL and subsidiaries 16.7% 22.9% 27.9% 28.7% 28.9% 607bps
PHFs 10.9% 14.2% 23.1% 23.7% 25.3% 1,115bps
Radiant 13.6% 8.3% 18.5% 22.3% 26.9% 1,869bps
Max@Home 2.0% 10.0% 15.0% 18.0% 20.0% 1,000bps
MaxLab 6.0% 9.8% 22.0% 23.0% 25.0% 1,517bps
Proforma EBITDA margins 14.6% 17.5% 25.4% 26.8% 28.3% 1,072bps
Source: Company, HSIE Research, MHIL – Max Healthcare Institute Ltd, PHFs – Partnered Healthcare
Facilities
We expect healthy
double-digit growth
across hospitals over
FY21-24e on the back of
improved occupancy and
higher ARPOBs
EBITDA growth is
expected to be driven by:
(a) optimisation of payor
mix; (b) turnaround of
Nanavati hospital; (c)
operating leverage
We expect hospital
business EBITDA margin
to improve by ~1,082bps
over FY21-24e

Page | 19
Max Healthcare: Annual Report Analysis
An eye on the future: ~95% upside potential seen in five years
Max has a well-defined roadmap for expansion, which is expected to aid higher
growth trajectory of 24% EBITDA CAGR over FY21-28e. We list our assumptions for
the key fundamental drivers of the business.
ARPOBs – We forecast ~11% ARPOB CAGR over FY21-28e. With strong presence
in metro cities, focus on quaternary care, and optimisation of payor mix, Max’s
ARPOB growth is expected to be higher than the industry average of ~7%
witnessed in the past five years (pre-COVID).
Occupancies – Max enjoys industry-leading occupancies, owing to its
concentrated presence in Delhi and Mumbai – markets that are characterised by
demand-supply mismatch for quality beds and strong demand for medical
tourism. Despite the aggressive expansion plans in place, we expect Max to
maintain 70%+ occupancy levels through FY28e, given the strong underlying
demand and its proven execution capabilities in these markets.
Bed addition – We expect the addition of ~1,630 capacity beds by FY28. Key
capacity bed addition assumed is at Saket Smart (~600 beds), Vikrant Children’s
Foundation (~300 beds), Nanavati (~440 beds), Mohali (~190 beds) and Shalimar
Bagh (~100 beds).
Exhibit 39: We forecast ~17% revenue CAGR over FY21-28e…
Source: Company, HSIE Research
Exhibit 40: …and ~24% EBITDA CAGR over the same period
Source: Company, HSIE Research
36 36 36
9
1 1 2
13
23
223
10
70
0
20
40
60
80
100
120
FY
19
ba
se
AR
PO
B
gro
wth
Occ
up
an
cy
Bed
ad
dit
ions
Oth
ers
FY
22
e
rev
enu
es
AR
PO
B
gro
wth
Occ
up
an
cy
Bed
ad
dit
ions
Oth
ers
FY
28
e
rev
enu
es
INR bnFY19 base Incremental revenues Reductions
106
49
9.7% 9.7% 9.7%
0.1%3.3%
4.8%
6.8%
0.5%
15.5%
1.5% 0.4% 1.0%
17.1%
-1.3%
0%
4%
8%
12%
16%
20%
24%
28%
32%
FY19
base
GMs Doc.
fees
Emp.
exp.
Cost
savings
Others* FY22e GMs Doc.
fees
Emp.
exp.
Others* FY28e
FY19 base Improvements Reductions
26.8%25.2%
M Cap (INR bn) 353 679
Share price returns 5-yr return:
~95%as on 24th
Sept, 2021
INR3.5bn INR12.4bn INR28.7bn
EBITDA
At ~23x EV/EBITDA, we see
an upside potential of ~95%
in the next five years
Revenue growth driver
assumptions (FY21-28e) -
-ARPOB: 11% CAGR
-Occupancy: ~65-77%
-Capacity bed addition:
1,630

Page | 20
Max Healthcare: Annual Report Analysis
Change in estimates and target price
We tweak our FY22/23e EBITDA estimates by 4%/-5% to factor in improved outlook
for core hospitals’ business and revised expansion timelines. We also roll forward our
target price to Mar’24 EBITDA (from Mar’23). Maintain BUY.
Exhibit 41: SOTP valuation based on FY24 estimates
FY24e EBITDA Multiple INR mn
Hospitals
MHIL 7,795 22.0 1,71,500
PHFs 4,898 22.0 1,07,750
Radiant 3,953 22.0 86,955
Proforma hospitals EBITDA 16,646 22.0 3,66,206
Max Home 352 30.0 10,572
Max Lab 665 30.0 19,942
Fair value of Max's operating assets 17,663 22.5 3,96,719
CWIP
5,769
Enterprise value (EV)
4,02,488
Less: Net debt (FY23e)
793
Less: Lease liabilities (FY23e)
3,662
Less: Contingent consideration (FY23e)
3,872
Implied market cap
3,94,161
No. of equity shares
966.0
Target price
410
Source: HSIE Research
Exhibit 42: SOTP valuation based on FY28 estimates
FY28e EBITDA Multiple INR mn
Hospitals
MHIL 12,174 22.0 2,67,836
PHFs 7,613 22.0 1,67,489
Radiant 6,152 22.0 1,35,338
Proforma hospitals EBITDA 25,939 22.0 5,70,663
Max Home 702 30.0 21,046
Max Lab 2,091 30.0 62,738
Fair value of Max's operating assets 28,732 22.8 6,54,446
CWIP
2,719
Enterprise value (EV)
6,57,871
Less: Net debt (FY27e)
(27,769)
Less: Lease liabilities (FY27e)
2,897
Less: Contingent consideration (FY27e)
3,355
Implied market cap
6,79,388
No. of equity shares
966.0
Target price
705
Source: HSIE Research
Risks
Hospitals – Delay in capacity addition, delay in improvement in payor mix,
slower-than-expected pick-up in non-COVID business, cost base stabilising at
higher level post COVID, and unfavourable change in agreement with partnered
healthcare facilities (trusts).
SBUs – Delay in scaling up the business via organic or inorganic route.

Page | 21
Max Healthcare: Annual Report Analysis
Peer set comparison and valuation chart
Exhibit 43: Peer-set valuation
Domestic cos M.Cap
(INR bn)
CMP
(INR/sh.) RECO TP
EV/EBITDA (x) ROE PER(x) CAGR (FY20-23e)
22E 23E 22E 23E 22E 23E EBITDA Sales
Max Healthcare 353 365 BUY 410 29.4 24.6 21.2 22.3 5.5 4.9 35.5% 10.7%
Apollo 680 4,732 ADD 4,410 34.4 26.8 18.2 21.4 73.5 52.3 18.3% 17.1%
Narayana 106 521 ADD 575 16.8 13.6 23.6 25.2 35.2 27.3 24.4% 10.8%
Fortis 205 272 NA NA 21.2 18.1 6.0 7.1 61.3 41.4 26.1% 12.9%
HCG 31 249 NA NA 18.9 15.5 -3.9 2.0 -110.9 256.3 15.6% 9.6%
KIMS 98 1,224 NA NA 21.0 18.1 25.0 21.0 36.0 30.6 29.2% 19.1%
Aster DM 107 213 NA NA 11.3 9.6 10.9 13.7 26.0 18.4 9.0% 8.9%
Shalby 19 180 NA NA 17.0 14.3 6.6 7.6 27.9 23.9 17.5% 12.4%
Source: Bloomberg, HSIE Research, price as on Sept 24, 2021, Max TP based on FY24 estimates; whereas Apollo and NH TP based on FY23 estimates
Exhibit 44: Max is trading at ~10-15% discount to Apollo
Source: Bloomberg, HSIE Research, 1-yr fwd. EV/ EBITDA
10
15
20
25
30
35
Sep
-20
Dec
-20
Ma
r-2
1
Jun
-21
Sep
-21
Apollo Fortis Narayana Max

Page | 22
Max Healthcare: Annual Report Analysis
Proforma financials
Proforma Financial Summary (including PHFs)
Year to March (INR mn) FY18 FY19 FY20 FY21 FY22E FY23E FY24E
Revenue 33,913 35,990 40,230 36,290 48,789 54,628 62,517
YoY growth
6% 12% -10% 34% 12% 14%
Gross Profits
27,692 31,029 26,557 37,450 42,140 48,455
Gross Margin (%)
76.9% 77.1% 73.2% 76.8% 77.1% 77.5%
EBITDA 3,120 3,485 5,894 6,362 12,387 14,651 17,663
EBITDA Margin (%) 9.2% 9.7% 14.6% 17.5% 25.4% 26.8% 28.3%
EBIT
2,079 4,153 3,870 10,434 12,390 15,278
EBIT Margin (%)
5.8% 10.3% 10.7% 21.4% 22.7% 24.4%
Tax rate (%)
362.3% -1.7% 21.6% 10.7% 13.4% 14.7%
Adj. PAT
-161 1,682 451 7,918 9,754 12,225
PAT Margin (%)
-0.4% 4.2% 1.2% 16.2% 17.9% 19.6%
Capital Employed
29,792 37,815 41,543 43,954 50,379 59,866
Net Debt
12,416 12,350 6,618 4,225 793 -2,823
Lease liabilities
4,123 3,885 3,662 3,453
Contingent consideration
4,193 4,027 3,872 3,728
EV
3,49,117 3,50,497 3,67,456 3,64,660 3,60,851 3,56,881
Mcap
3,30,108 3,30,108 3,52,523 3,52,523 3,52,523 3,52,523
Book value
27.2 23.3 59.4 65.9 74.0 84.2
Adj. EPS
-0.3 3.1 0.5 8.2 10.1 12.7
Adj. RoCE
5.9 10.4 8.3 21.2 22.3 23.0
Adj. RoE
-1.1 12.4 2.6 31.0 29.9 29.5
EV/Revenues (x)
9.7 8.7 10.1 7.5 6.6 5.7
EV/ EBITDA
100.2 59.5 57.8 29.4 24.6 20.2
Net Debt/EBITDA (x)
5.5 3.5 2.3 1.0 0.6 0.2
Net Debt/Equity (x)
1.3 1.6 0.7 0.4 0.2 0.1
P/E (x)
116.6 782.0 44.5 36.1 28.8
P/BV (x)
13.4 15.7 6.1 5.5 4.9 4.3
Source: Company, HSIE Research

Page | 23
Max Healthcare: Annual Report Analysis
Rating Criteria
BUY: >+15% return potential
ADD: +5% to +15% return potential
REDUCE: -10% to +5% return potential
SELL: > 10% Downside return potential
Date CMP Reco. Target
9-Aug-21 278 BUY 330
12-Aug-21 301 BUY 350
30-Aug-21 335 BUY 360
27-Sep-21 365 BUY 410
RECOMMENDATION HISTORY
0
50
100
150
200
250
300
350
400
450
Sep
-20
Oct
-20
No
v-2
0
Dec
-20
Jan
-21
Feb
-21
Ma
r-2
1
Ap
r-2
1
Ma
y-2
1
Jun
-21
Jul-
21
Au
g-2
1
Sep
-21
Max Healthcare TP

Page | 24
Max Healthcare: Annual Report Analysis
Disclosure:
We, Bansi Desai, CFA and Karan Vora, CA, authors and the name subscribed to this report, hereby certify that all of the views expressed in this research
report accurately reflect our views about the subject issuer(s) or securities. HSL has no material adverse disciplinary history as on the date of publication of this
report. We also certify that no part of our compensation was, is, or will be directly or indirectly related to the specific recommendation(s) or view(s) in this
report.
Research Analyst or his/her relative or HDFC Securities Ltd. does not have any financial interest in the subject company. Also Research Analyst or his relative
or HDFC Securities Ltd. or its Associate may have beneficial ownership of 1% or more in the subject company at the end of the month immediately preceding
the date of publication of the Research Report. Further Research Analyst or his relative or HDFC Securities Ltd. or its associate does not have any material
conflict of interest.
Any holding in stock –No
HDFC Securities Limited (HSL) is a SEBI Registered Research Analyst having registration no. INH000002475.
Disclaimer:
This report has been prepared by HDFC Securities Ltd and is solely for information of the recipient only. The report must not be used as a singular basis of any
investment decision. The views herein are of a general nature and do not consider the risk appetite or the particular circumstances of an individual investor;
readers are requested to take professional advice before investing. Nothing in this document should be construed as investment advice. Each recipient of this
document should make such investigations as they deem necessary to arrive at an independent evaluation of an investment in securities of the companies
referred to in this document (including merits and risks) and should consult their own advisors to determine merits and risks of such investment. The
information and opinions contained herein have been compiled or arrived at, based upon information obtained in good faith from sources believed to be
reliable. Such information has not been independently verified and no guaranty, representation of warranty, express or implied, is made as to its accuracy,
completeness or correctness. All such information and opinions are subject to change without notice. Descriptions of any company or companies or their
securities mentioned herein are not intended to be complete. HSL is not obliged to update this report for such changes. HSL has the right to make changes and
modifications at any time.
This report is not directed to, or intended for display, downloading, printing, reproducing or for distribution to or use by, any person or entity who is a citizen
or resident or located in any locality, state, country or other jurisdiction where such distribution, publication, reproduction, availability or use would be
contrary to law or regulation or what would subject HSL or its affiliates to any registration or licensing requirement within such jurisdiction.
If this report is inadvertently sent or has reached any person in such country, especially, United States of America, the same should be ignored and brought to
the attention of the sender. This document may not be reproduced, distributed or published in whole or in part, directly or indirectly, for any purposes or in
any manner.
Foreign currencies denominated securities, wherever mentioned, are subject to exchange rate fluctuations, which could have an adverse effect on their value or
price, or the income derived from them. In addition, investors in securities such as ADRs, the values of which are influenced by foreign currencies effectively
assume currency risk. It should not be considered to be taken as an offer to sell or a solicitation to buy any security.
This document is not, and should not, be construed as an offer or solicitation of an offer, to buy or sell any securities or other financial instruments. This report
should not be construed as an invitation or solicitation to do business with HSL. HSL may from time to time solicit from, or perform broking, or other services
for, any company mentioned in this mail and/or its attachments.
HSL and its affiliated company(ies), their directors and employees may; (a) from time to time, have a long or short position in, and buy or sell the securities of
the company(ies) mentioned herein or (b) be engaged in any other transaction involving such securities and earn brokerage or other compensation or act as a
market maker in the financial instruments of the company(ies) discussed herein or act as an advisor or lender/borrower to such company(ies) or may have any
other potential conflict of interests with respect to any recommendation and other related information and opinions.
HSL, its directors, analysts or employees do not take any responsibility, financial or otherwise, of the losses or the damages sustained due to the investments
made or any action taken on basis of this report, including but not restricted to, fluctuation in the prices of shares and bonds, changes in the currency rates,
diminution in the NAVs, reduction in the dividend or income, etc.
HSL and other group companies, its directors, associates, employees may have various positions in any of the stocks, securities and financial instruments dealt
in the report, or may make sell or purchase or other deals in these securities from time to time or may deal in other securities of the companies / organizations
described in this report.
HSL or its associates might have managed or co-managed public offering of securities for the subject company or might have been mandated by the subject
company for any other assignment in the past twelve months.
HSL or its associates might have received any compensation from the companies mentioned in the report during the period preceding twelve months from the
date of this report for services in respect of managing or co-managing public offerings, corporate finance, investment banking or merchant banking, brokerage
services or other advisory service in a merger or specific transaction in the normal course of business.
HSL or its analysts did not receive any compensation or other benefits from the companies mentioned in the report or third party in connection with
preparation of the research report. Accordingly, neither HSL nor Research Analysts have any material conflict of interest at the time of publication of this
report. Compensation of our Research Analysts is not based on any specific merchant banking, investment banking or brokerage service transactions. HSL may
have issued other reports that are inconsistent with and reach different conclusion from the information presented in this report.
Research entity has not been engaged in market making activity for the subject company. Research analyst has not served as an officer, director or employee of
the subject company. We have not received any compensation/benefits from the subject company or third party in connection with the Research Report.
HDFC securities Limited, I Think Techno Campus, Building - B, "Alpha", Office Floor 8, Near Kanjurmarg Station, Opp. Crompton Greaves, Kanjurmarg
(East), Mumbai 400 042 Phone: (022) 3075 3400 Fax: (022) 2496 5066 Compliance Officer: Binkle R. Oza Email: [email protected] Phone: (022)
3045 3600
HDFC Securities Limited, SEBI Reg. No.: NSE, BSE, MSEI, MCX: INZ000186937; AMFI Reg. No. ARN: 13549; PFRDA Reg. No. POP: 11092018; IRDA
Corporate Agent License No.: CA0062; SEBI Research Analyst Reg. No.: INH000002475; SEBI Investment Adviser Reg. No.: INA000011538; CIN -
U67120MH2000PLC152193
HDFC securities
Institutional Equities
Unit No. 1602, 16th Floor, Tower A, Peninsula Business Park,
Senapati Bapat Marg, Lower Parel, Mumbai - 400 013
Board: +91-22-6171-7330 www.hdfcsec.com