2and functions
TRANSCRIPT

Linear Equationsand Functions22.1 Represent Relations and Functions
2.2 Find Slope and Rate of Change
2.3 Graph Equations of Lines
2.4 Write Equations of Lines
2.5 Model Direct Variation
2.6 Draw Scatter Plots and Best-Fitting Lines
2.7 Use Absolute Value Functions and Transformations
2.8 Graph Linear Inequalities in Two Variables
In Chapter 1, you learned the following skills, which you’ll use in Chapter 2:evaluating algebraic expressions, solving linear equations, and rewriting equations.
Prerequisite Skills
VOCABULARY CHECK
Copy and complete the statement.
1. A linear equation in one variable is an equation that can be written in theform ? where a and b are constants and a Þ 0.
2. The absolute value of a real number is the distance the number is from ? ona number line.
SKILLS CHECK
Evaluate the expression for the given value of x. (Review p. 10 for 2.1.)
3. 22(x 1 1) when x 5 25 4. 11x 2 14 when x 5 23
5. x2 1 x 1 1 when x 5 4 6. 2x2 2 3x 1 7 when x 5 1
Solve the equation. Check your solution. (Review p. 18 for 2.3.)
7. 5x 2 2 5 8 8. 26x 2 10 5 20 9. 2x 1 9 5 2x 2 27
Solve the equation for y. (Review p. 26 for 2.4.)
10. 2x 1 3y 5 6 11. 2x 2 y 5 10 12. x 1 4y 5 25
Before
70
2A.1.A
a.4
2A.4.A
a.3
2A.10.G
2A.1.B
2A.4.B
a.5
TEXAS
Prerequisite skills practice at classzone.com
In Chapter 2, you will apply the big ideas listed below and reviewed in theChapter Summary on page 140. You will also use the key vocabulary listed below.
Big Ideas1 Representing relations and functions
2 Graphing linear equations and inequalities in two variables
3 Writing linear equations and inequalities in two variables
• domain, range, p. 72
• function, p. 73
• linear function, p. 75
• slope, p. 82
• rate of change, p. 85
• parent function, p. 89
• y-intercept, p. 89
• slope-intercept form, p. 90
• x-intercept, p. 91
• point-slope form, p. 98
• direct variation, p. 107
• correlation coefficient, p. 114
• best-fitting line, p. 114
• absolute value function,p. 123
• transformation, p. 123
• linear inequality in twovariables, p. 132
KEY VOCABULARY
Other animations for Chapter 2: pages 73, 86, 90, 95, 98, 102, 107, 115, 133,and 140
You can use rates of change to find linear models. For example, you can use anaverage rate of change to model distance traveled as a function of time.
Algebra
The animation illustrated below for Exercise 44 on page 111 helps you answer thisquestion: If a whale migrates at a given rate, how far will it travel in different periodsof time?
Algebra at classzone.com
Change the time elapsed to find how farthe whales have traveled.
Gray whales migrate from Mexico’s BajaPeninsula to waters near Alaska.
Why?
Now
71

72 Chapter 2 Linear Equations and Functions
Key Vocabulary• relation• domain• range• function• equation in two
variables• linear function
Before You solved linear equations.
Now You will represent relations and graph linear functions.
Why? So you can model changes in elevation, as in Ex. 48.
2.1 Represent Relationsand Functions
Consider the relation given by the ordered pairs (22, 23), (21, 1), (1, 3), (2, 22),and (3, 1).
a. Identify the domain and range.
b. Represent the relation using a graph and a mapping diagram.
Solution
a. The domain consists of all the x-coordinates: 22, 21, 1, 2, and 3.The range consists of all the y-coordinates: 23, 22, 1, and 3.
b. Graph Mapping Diagram
x
y
1
123
22
1
3
2221123
Input Output
E X A M P L E 1 Represent relations
A relation is a mapping, or pairing, of input values with output values. The set ofinput values is the domain, and the set of output values is the range.
KEY CONCEPT For Your Notebook
Representing Relations
A relation can be represented in the following ways.
Ordered Pairs Table Graph Mapping Diagram
(22, 2)
(22, 22)
(0, 1)
(3, 1)
x y
22 2
22 22
0 1
3 1
x
y
1
122
0
3
22
2
1
Input Output
REVIEW GRAPHING
For help with plottingpoints in a coordinateplane, see p. 987.
a.1, a.3, a.5,2A.1.A
TEKS

2.1 Represent Relations and Functions 73
E X A M P L E 2 Identify functions
Tell whether the relation is a function. Explain.
a.
23
21
2
4
Input Output
2
3
24
b.
24
21
2
3
Input Output
22
1
4
Solution
a. The relation is a function because each input is mapped onto exactlyone output.
b. The relation is not a function because the input 1 is mapped onto both
21 and 2.
at classzone.com
FUNCTIONS A function is a relation for which each input has exactly one output.If any input of a relation has more than one output, the relation is not a function.
✓ GUIDED PRACTICE for Examples 1 and 2
1. Consider the relation given by the ordered pairs (24, 3), (22, 1), (0, 3), (1, 22),and (22, 24).
a. Identify the domain and range.
b. Represent the relation using a table and a mapping diagram.
2. Tell whether the relationis a function. Explain.
VERTICAL LINE TEST You can use the graph of a relation to determine whether itis a function by applying the vertical line test.
REVIEW LOGICALSTATEMENTS
For help with “if andonly if” statements, seep. 1002.
KEY CONCEPT For Your Notebook
Vertical Line Test
A relation is a function if and only if no vertical line intersects the graph of therelation at more than one point.
Function
x
y
1
1
Not a function
x
y
1
1
x 22 21 0 1 3
y 24 24 24 24 24
AVOID ERRORS
A relation can mapmore than one inputonto the same outputand still be a function.

74 Chapter 2 Linear Equations and Functions
✓ GUIDED PRACTICE for Example 3
3. WHAT IF? In Example 3, suppose that Kevin Garnett averages 24.2 pointsper game in his tenth season as he did in his ninth. If the relation given bythe second graph is revised to include the tenth season, is the relation still afunction? Explain.
EQUATIONS IN TWO VARIABLES Many functions can be described by an equationin two variables, such as y 5 3x 2 5. The input variable (in this case, x) is calledthe independent variable. The output variable (in this case, y) is called thedependent variable because its value depends on the value of the input variable.
An ordered pair (x, y) is a solution of an equation in two variables if substitutingx and y in the equation produces a true statement. For example, (2, 1) is a solutionof y 5 3x 2 5 because 1 5 3(2) 2 5 is true. The graph of an equation in twovariables is the set of all points (x, y) that represent solutions of the equation.
KEY CONCEPT For Your Notebook
Graphing Equations in Two Variables
To graph an equation in two variables, follow these steps:
STEP 1 Construct a table of values.
STEP 2 Plot enough points from the table to recognize a pattern.
STEP 3 Connect the points with a line or a curve.
E X A M P L E 3 Use the vertical line test
BASKETBALL The first graph below plots average points per game versus age atthe end of the 2003–2004 NBA regular season for the 8 members of the MinnesotaTimberwolves with the highest averages. The second graph plots averagepoints per game versus age for one team member, Kevin Garnett, over hisfirst 9 seasons. Are the relations shown by the graphs functions? Explain.
Solution
The team graph does not represent a function because vertical lines at x 5 28and x 5 29 each intersect the graph at more than one point. The graph for KevinGarnett does represent a function because no vertical line intersects the graph atmore than one point.
Age (years)26 28 30 32 34
Ave
rage
poi
nts
10
20
30
Timberwolves
x
y
00
Age (years)20 22 24 26 28
Ave
rage
poi
nts
10
20
30
Kevin Garnett
x
y
00
READING GRAPHS
The zigzag symbol onthe horizontal axis ofeach graph indicatesthat values of x wereskipped.

2.1 Represent Relations and Functions 75
E X A M P L E 4 Graph an equation in two variables
Graph the equation y 5 22x 2 1.
Solution
STEP 1 Construct a table of values.
STEP 2 Plot the points. Notice that they all lie on a line.
STEP 3 Connect the points with a line.
READING
The parentheses inf(x) do not indicatemultiplication. Thesymbol f(x) does notmean “f times x.”
x 22 21 0 1 2
y 3 1 21 23 25
LINEAR FUNCTIONS The function y 5 22x 2 1 in Example 4 is a linear functionbecause it can be written in the form y 5 mx 1 b where m and b are constants.The graph of a linear function is a line. By renaming y as f(x), you can writey 5 mx 1 b using function notation.
y 5 mx 1 b Linear function in x-y notation
f(x) 5 mx 1 b Linear function in function notation
The notation f(x) is read “the value of f at x,” or simply “f of x,” and identifies x asthe independent variable. The domain consists of all values of x for which f(x) isdefined. The range consists of all values of f(x) where x is in the domain of f .
E X A M P L E 5 Classify and evaluate functions
Tell whether the function is linear. Then evaluate the function when x 5 24.
a. f(x) 5 2x2 2 2x 1 7 b. g(x) 5 5x 1 8
Solution
a. The function f is not linear because it has an x2-term.
f(x) 5 2x2 2 2x 1 7 Write function.
f(24) 5 2(24)2 2 2(24) 1 7 Substitute 24 for x.
5 21 Simplify.
b. The function g is linear because it has the form g(x) 5 mx 1 b.
g(x) 5 5x 1 8 Write function.
g(24) 5 5(24) 1 8 Substitute 24 for x.
5 212 Simplify.
x
y
1
1
REPRESENTFUNCTIONS
Letters other than f,such as g or h, can alsoname functions.
✓ GUIDED PRACTICE for Examples 4 and 5
4. Graph the equation y 5 3x 2 2.
Tell whether the function is linear. Then evaluate the function when x 5 22.
5. f(x) 5 x 2 1 2 x3 6. g(x) 5 24 2 2x
76 Chapter 2 Linear Equations and Functions
E X A M P L E 6 Use a function in real life
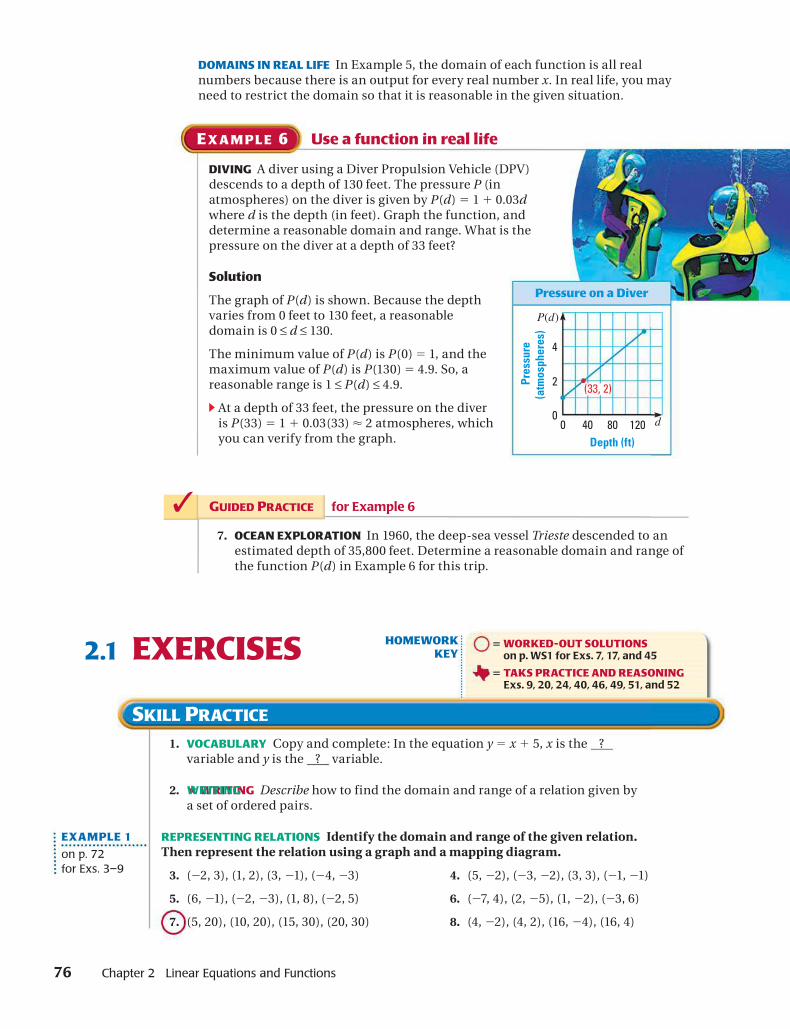
DIVING A diver using a Diver Propulsion Vehicle (DPV)descends to a depth of 130 feet. The pressure P (inatmospheres) on the diver is given by P(d) 5 1 1 0.03dwhere d is the depth (in feet). Graph the function, anddetermine a reasonable domain and range. What is thepressure on the diver at a depth of 33 feet?
Solution
The graph of P(d) is shown. Because the depthvaries from 0 feet to 130 feet, a reasonabledomain is 0 ≤ d ≤ 130.
The minimum value of P(d) is P(0) 5 1, and themaximum value of P(d) is P(130) 5 4.9. So, areasonable range is 1 ≤ P(d) ≤ 4.9.
c At a depth of 33 feet, the pressure on the diveris P(33) 5 1 1 0.03(33) < 2 atmospheres, whichyou can verify from the graph.
DOMAINS IN REAL LIFE In Example 5, the domain of each function is all realnumbers because there is an output for every real number x. In real life, you mayneed to restrict the domain so that it is reasonable in the given situation.
✓ GUIDED PRACTICE for Example 6
7. OCEAN EXPLORATION In 1960, the deep-sea vessel Trieste descended to anestimated depth of 35,800 feet. Determine a reasonable domain and range ofthe function P(d) in Example 6 for this trip.
1. VOCABULARY Copy and complete: In the equation y 5 x 1 5, x is the ?variable and y is the ? variable.
2. ★ WRITING Describe how to find the domain and range of a relation given bya set of ordered pairs.
REPRESENTING RELATIONS Identify the domain and range of the given relation.Then represent the relation using a graph and a mapping diagram.
3. (22, 3), (1, 2), (3, 21), (24, 23) 4. (5, 22), (23, 22), (3, 3), (21, 21)
5. (6, 21), (22, 23), (1, 8), (22, 5) 6. (27, 4), (2, 25), (1, 22), (23, 6)
7. (5, 20), (10, 20), (15, 30), (20, 30) 8. (4, 22), (4, 2), (16, 24), (16, 4)
EXAMPLE 1
on p. 72for Exs. 3–9
2.1 EXERCISES
Depth (ft)40 80 120
Pres
sure
(atm
osph
eres
)
2
4
Pressure on a Diver
d
P(d)
00
(33, 2)
WRITING
HOMEWORKKEY
5 WORKED-OUT SOLUTIONSon p. WS1 for Exs. 7, 17, and 45
5 TAKS PRACTICE AND REASONINGExs. 9, 20, 24, 40, 46, 49, 51, and 52
SKILL PRACTICE
2.1 Represent Relations and Functions 77
EXAMPLE 2
on p. 73for Exs. 10–20
EXAMPLE 3
on p. 74for Exs. 21–23
EXAMPLE 4
on p. 75for Exs. 25–33
9. What is the domain of the relation given by the ordered pairs(24, 2), (21, 23), (1, 4), (1, 23), and (2, 1)?
A 23, 1, 2, and 4 B 24, 21, 1, and 2
C 24, 23, 21, and 2 D 24, 23, 21, 1, 2, and 4
IDENTIFYING FUNCTIONS Tell whether the relation is a function. Explain.
10.
26
24
21
2
5
2
1
21
Input Output 11.
25
23
1
2
Input Output
22
1
4
12.
4
2
21
23
Input Output
21
5
13.
28
24
0
4
0
Input Output
ERROR ANALYSIS Describe and correct the error in the student’s work.
14.The relation given by the orderedpairs (24, 2), (21, 5), (3, 6), and(7, 2) is not a function becausethe inputs 24 and 7 are bothmapped to the output 2.
15.
x 0 1 2 1 0
y 5 6 7 8 9
The relation given by the table isa function because there is onlyone value of x for each value of y.
IDENTIFYING FUNCTIONS Tell whether the relation is a function. Explain.
16. (3, 22), (0, 1), (1, 0), (22, 21), (2, 21) 17. (2, 25), (22, 5), (21, 4), (22, 0), (3, 24)
18. (0, 1), (1, 0), (2, 3), (3, 2), (4, 4) 19. (21, 21), (2, 5), (4, 8), (25, 29), (21, 25)
20. The relation given by the ordered pairs (26, 3), (22, 4),(1, 5), and (4, 0) is a function. Which ordered pair can be included with thisrelation to form a new relation that is also a function?
A (1, 25) B (6, 3) C (22, 19) D (4, 4)
VERTICAL LINE TEST Use the vertical line test to tell whether the relation isa function.
21.
x
y
1
2
22.
x
y
2
1
23.
x
y
1
1
24. RESPONSE Explain why a relation is not a function if a vertical lineintersects the graph of the relation more than once.
GRAPHING EQUATIONS Graph the equation.
25. y 5 x 1 2 26. y 5 2x 1 5 27. y 5 3x 1 1
28. y 5 5x 2 3 29. y 5 2x 2 7 30. y 5 23x 1 2
31. y 5 22x 32. y 5 1}2
x 1 2 33. y 5 23}4
x 2 1
TAKS REASONING
TAKS REASONING
TAKS
78
EVALUATING FUNCTIONS Tell whether the function is linear. Then evaluate thefunction for the given value of x.
34. f(x) 5 x 1 15; f(8) 35. f(x) 5 x2 1 1; f(23)
36. f(x) 5 ⏐x⏐ 1 10; f(24) 37. f(x) 5 6; f(2)
38. g(x) 5 x3 2 2x2 1 5x 2 8; g(25) 39. h(x) 5 7 2 2}3
x; h(15)
40. RESPONSE Which, if any, of the relations described by theequations y 5⏐x⏐, x 5⏐y⏐, and ⏐y⏐5⏐x⏐ represent functions? Explain.
41. CHALLENGE Let f be a function such that f(a 1 b) 5 f(a) 1 f(b) for all realnumbers a and b. Show that f(2a) 5 2 p f(a) and that f(0) 5 0.
EXAMPLE 5
on p. 75for Exs. 34–39
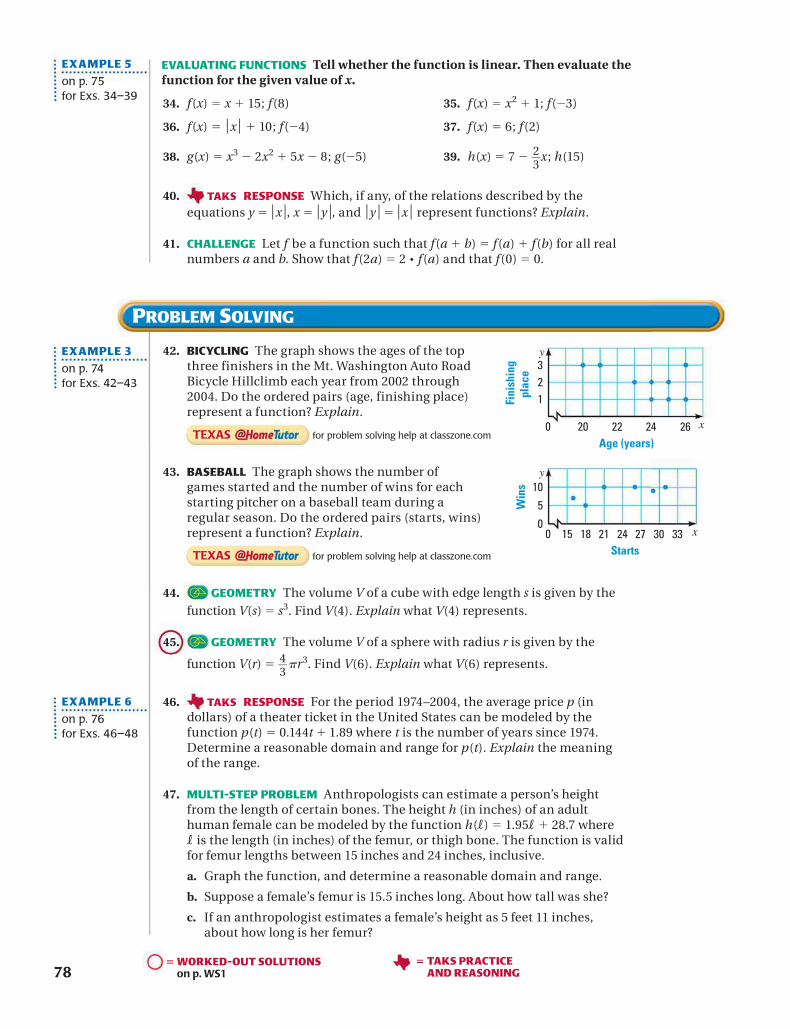
42. BICYCLING The graph shows the ages of the topthree finishers in the Mt. Washington Auto RoadBicycle Hillclimb each year from 2002 through2004. Do the ordered pairs (age, finishing place)represent a function? Explain.
43. BASEBALL The graph shows the number ofgames started and the number of wins for eachstarting pitcher on a baseball team during aregular season. Do the ordered pairs (starts, wins)represent a function? Explain.
44. GEOMETRY The volume V of a cube with edge length s is given by thefunction V(s) 5 s3. Find V(4). Explain what V(4) represents.
45. GEOMETRY The volume V of a sphere with radius r is given by the
function V(r) 5 4}3πr3. Find V(6). Explain what V(6) represents.
46. RESPONSE For the period 1974–2004, the average price p (indollars) of a theater ticket in the United States can be modeled by thefunction p(t) 5 0.144t 1 1.89 where t is the number of years since 1974.Determine a reasonable domain and range for p(t). Explain the meaningof the range.
47. MULTI-STEP PROBLEM Anthropologists can estimate a person’s heightfrom the length of certain bones. The height h (in inches) of an adulthuman female can be modeled by the function h(l) 5 1.95l1 28.7 wherel is the length (in inches) of the femur, or thigh bone. The function is validfor femur lengths between 15 inches and 24 inches, inclusive.
a. Graph the function, and determine a reasonable domain and range.
b. Suppose a female’s femur is 15.5 inches long. About how tall was she?
c. If an anthropologist estimates a female’s height as 5 feet 11 inches,about how long is her femur?
EXAMPLE 3
on p. 74for Exs. 42–43
EXAMPLE 6
on p. 76for Exs. 46–48
Fini
shin
gpl
ace
Age (years)20 22 24 26
321
0 x
y
Win
s
Starts18 24 3015 21 27 33
10
5
00 x
y
PROBLEM SOLVING
5 WORKED-OUT SOLUTIONSon p. WS1
TAKS
TAKS
5 TAKS PRACTICEAND REASONING

2.1 Represent Relations and Functions 79
48. MOUNTAIN CLIMBING A climber on MountRainier in Washington hikes from an elevationof 5400 feet above sea level to Camp Muir,which has an elevation of 10,100 feet. Theelevation h (in feet) as the climber ascendscan be modeled by h(t) 5 1000t 1 5400 wheret is the time (in hours). Graph the function,and determine a reasonable domain and range.What is the climber’s elevation after hiking3.5 hours?
49. ★ EXTENDED RESPONSE The table showsthe populations of several states and theirelectoral votes in the 2004 and 2008 U.S.presidential elections. The figures are basedon U.S. census data for the year 2000.
a. Identify the domain and range of therelation given by the ordered pairs (p, v).
b. Is the relation from part (a) a function?Explain.
c. Is the relation given by the ordered pairs(v, p) a function? Explain.
50. CHALLENGE The table shows groundshipping charges for an online retail store.
a. Is the shipping cost a function of themerchandise cost? Explain.
b. Is the merchandise cost a function of theshipping cost? Explain.
StatePopulation(millions), p
Electoralvotes, v
California 33.87 55
Florida 15.98 27
Illinois 12.42 21
New York 18.98 31
Ohio 11.35 20
Pennsylvania 12.28 21
Texas 20.85 34
Merchandise cost Shipping cost
$.01–$30.00 $4.50
$30.01–$60.00 $7.25
$60.01–$100.00 $9.50
Over $100.00 $12.50
EXTRA PRACTICE for Lesson 2.1, p. 1011 ONLINE QUIZ at classzone.com
51. TAKS PRACTICE Kate is studying a bacteria culture in biology class. Thetable shows the number of bacteria, b, in the culture after t hours. How manybacteria are there after 10 hours? TAKS Obj. 10
Time (hours), t 0 1 2 3 4 5
Bacteria (billions), b 1 2 4 8 16 32
A 64 billion B 128 billion C 256 billion D 1024 billion
52. TAKS PRACTICE What is the area of thecomposite figure? TAKS Obj. 8
F 138 cm2 G 141 cm2
H 162 cm2 J 210 cm2
MIXED REVIEW FOR TAKSTAKS PRACTICE at classzone.com
15 cm6 cm3 cm
7 cm 7 cm
6 cm
REVIEW
TAKS Preparationp. 470;TAKS Workbook
REVIEW
Lesson 1.5;TAKS Workbook
TAKS REASONING
80 Chapter 2 Linear Equations and Functions
Use Discrete and ContinuousFunctions
Key Vocabulary• discrete function• continuous function
GOAL Graph and classify discrete and continuous functions.
Use after Lesson 2.1
Extension
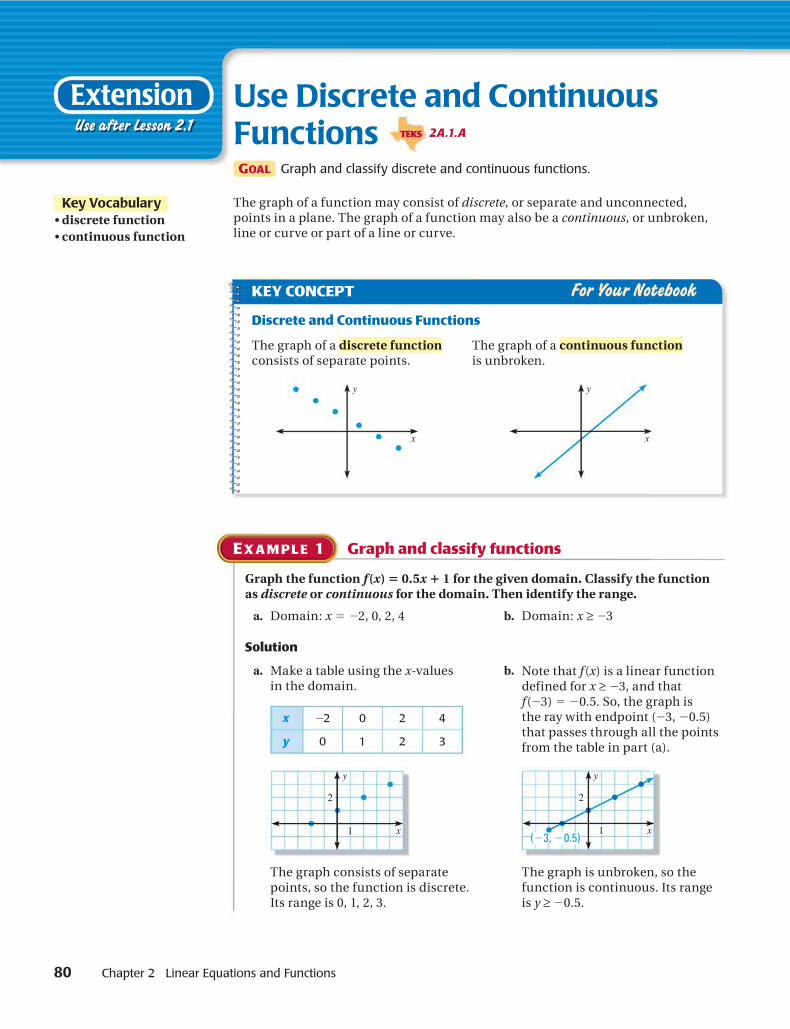
The graph of a function may consist of discrete, or separate and unconnected,points in a plane. The graph of a function may also be a continuous, or unbroken,line or curve or part of a line or curve.
E X A M P L E 1 Graph and classify functions
Graph the function f(x) 5 0.5x 1 1 for the given domain. Classify the functionas discrete or continuous for the domain. Then identify the range.
a. Domain: x 5 22, 0, 2, 4 b. Domain: x ≥ 23
Solution
a. Make a table using the x-valuesin the domain.
b. Note that f(x) is a linear functiondefined for x ≥ 23, and thatf(23) 5 20.5. So, the graph isthe ray with endpoint (23, 20.5)that passes through all the pointsfrom the table in part (a).
x 22 0 2 4
y 0 1 2 3
The graph consists of separatepoints, so the function is discrete.Its range is 0, 1, 2, 3.
The graph is unbroken, so thefunction is continuous. Its rangeis y ≥ 20.5.
KEY CONCEPT For Your Notebook
Discrete and Continuous Functions
The graph of a discrete functionconsists of separate points.
x
y
The graph of a continuous functionis unbroken.
x
y
x
y
1
2
x
y
1
2
(23, 20.5)
2A.1.ATEKS

Extension: Use Discrete and Continuous Functions 81
Graph the function for the given domain. Classify the function as discrete or continuous. Then identify the range of the function.
1. y 5 2x 1 3; domain: 22, 21, 0, 1, 2 2. f(x) 5 0.5x 2 4; domain: 24, 22, 0, 2, 4
3. y 5 23x 1 9; domain: x < 5 4. f(x) 5 1}3
x 1 6; domain: x ≥ 26
Write and graph the function described. Determine the domain and range. Then tell whether the function is discrete or continuous.
5. Amanda walks at an average speed of 3.5 miles per hour. The function d(x)gives the distance (in miles) Amanda walks in x hours.
6. A token to ride a subway costs $1.25. The function s(x) gives the cost of riding the subway x times.
7. A family has 3 gallons of milk delivered every Thursday. The function m(x)gives the total amount of milk that is delivered to the family after x weeks.
8. Steel cable that is 3}8
inch in diameter weighs 0.24 pound per foot. The
function w(x) gives the weight of x feet of steel cable.
9. On a number line, the signed distance from a number a to a number b is given by b 2 a. The function d(x) gives the signed distance from 3 to any number x.
EXAMPLE 1
on p. 80for Exs. 1–4
EXAMPLE 2
on p. 81for Exs. 5–8
PRACTICE
E X A M P L E 2 Graph and classify real-world functions
Write and graph the function described. Determine the domain and range. Then tell whether the function is discrete or continuous.
a. A student group is selling chocolate bars for $2 each. The function f(x)gives the amount of money collected after selling x chocolate bars.
b. A low-flow shower head releases 1.8 gallons of water per minute. The function V(x) gives the volume of water released after x minutes.
Solution
a. The function is f(x) 5 2x. The first four points of the graph of f(x) are shown. Only whole chocolate bars can be sold, so the domain is the set of whole numbers 0, 1, 2, 3, . . . . From the graph, you can see that the range is 0, 2, 4, 6, . . . . The graph consists of separate points, so the function is discrete.
b. The function is V(x) 5 1.8x. You can run the shower any nonnegative amount of time, so the domain is x ≥ 0. From the graph, you can see that the range is y ≥ 0. The graph is unbroken, so the function is continuous.
x
y
1
1
x
y
1
1

82 Chapter 2 Linear Equations and Functions
Key Vocabulary• slope• parallel• perpendicular• rate of change• reciprocal, p. 4
Before You graphed linear functions.
Now You will find slopes of lines and rates of change.
Why? So you can model growth rates, as in Ex. 46.
2.2 Find Slope andRate of Change
run 5 54 in.
rise 5 15 in.
KEY CONCEPT For Your Notebook
Slope of a Line
Words Algebra Graph
The slope m of anonvertical line isthe ratio of verticalchange (the rise) tohorizontal change(the run).
m 5y2 2 y1}x2 2 x1
5 rise}run
slope
x
y runx2 2 x1
risey2 2 y1
(x1, y1)
(x2, y2)
E X A M P L E 1 Find slope in real life
SKATEBOARDING A skateboard ramp has a rise of15 inches and a run of 54 inches. What is its slope?
Solution
slope 5 rise}run
5 15}54
5 5}18
c The slope of the ramp is 5}18
.
E X A M P L E 2 TAKS PRACTICE: Multiple Choice
Solution
Let (x1, y1) 5 (22, 1) and (x2, y2) 5 (3, 5).
m 5y2 2 y1}x2 2 x1
5 5 2 1}3 2 (22)
5 4}5
c The correct answer is C. A B C D
What is the slope of the line passing through the points (22, 1) and (3, 5)?
A 25}4
B 24}5
C 4}5
D 5}4
x
y
1
4
5
4
(3, 5)
(22, 1)
AVOID ERRORS
When calculating slope,be sure to subtract thex- and y-coordinates ina consistent order.
a.1, a.4, a.5TEKS
2.2 Find Slope and Rate of Change 83
Without graphing, tell whether the line through the given points rises, falls,is horizontal, or is vertical.
a. (25, 1), (3, 1) b. (26, 0), (2, 24) c. (21, 3), (5, 8) d. (4, 6), (4, 21)
Solution
a. m 5 1 2 1}3 2 (25)
5 0}8
5 0 Because m 5 0, the line is horizontal.
b. m 5 24 2 0}2 2 (26)
5 24}
85 21
}2
Because m < 0, the line falls.
c. m 5 8 2 3}5 2 (21)
5 5}6
Because m > 0, the line rises.
d. m 5 21 2 6}
4 2 45 27
}0
Because m is undefined, the line is vertical.
E X A M P L E 3 Classify lines using slope
✓ GUIDED PRACTICE for Examples 1 and 2
1. WHAT IF? In Example 1, suppose that the rise of the ramp is changed to12 inches without changing the run. What is the slope of the ramp?
2. What is the slope of the line passing through the points (24, 9) and (28, 3)?
A 22}3
B 21}2
C 2}3
D 3}2
Find the slope of the line passing through the given points.
3. (0, 3), (4, 8) 4. (25, 1), (5, 24) 5. (23, 22), (6, 1) 6. (7, 3), (21, 7)
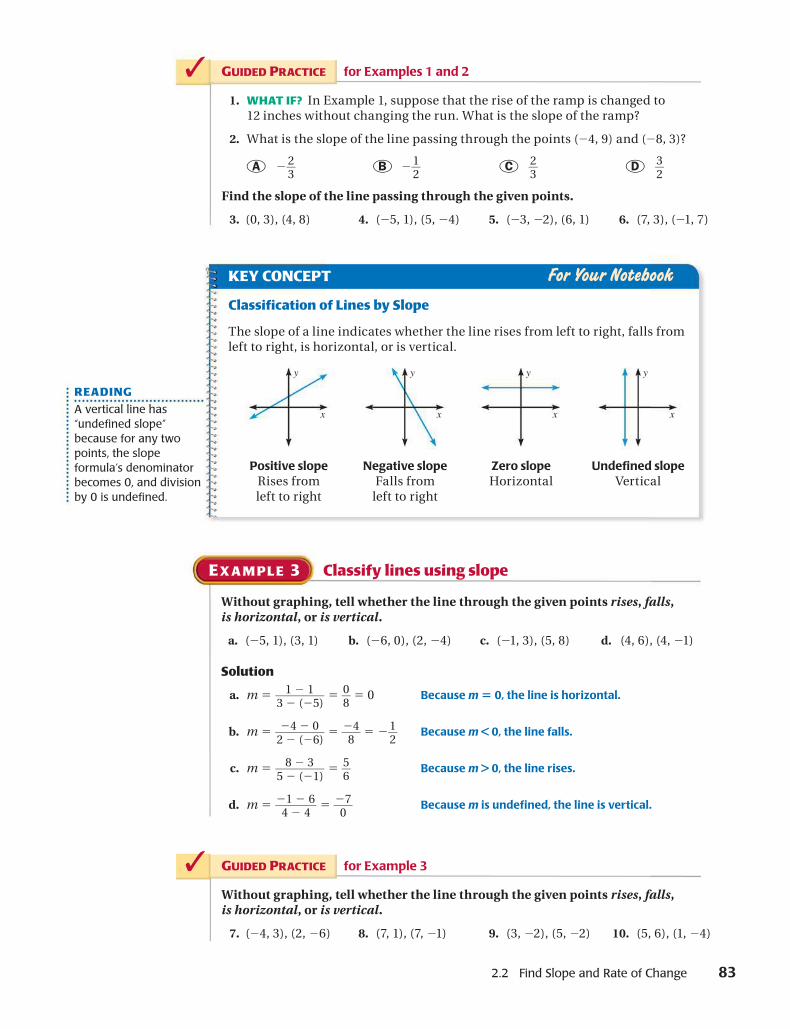
KEY CONCEPT For Your Notebook
Classification of Lines by Slope
The slope of a line indicates whether the line rises from left to right, falls fromleft to right, is horizontal, or is vertical.
x
y
Positive slopeRises fromleft to right
x
y
Negative slopeFalls from
left to right
x
y
Zero slopeHorizontal
x
y
Undefi ned slopeVertical
✓ GUIDED PRACTICE for Example 3
Without graphing, tell whether the line through the given points rises, falls,is horizontal, or is vertical.
7. (24, 3), (2, 26) 8. (7, 1), (7, 21) 9. (3, 22), (5, 22) 10. (5, 6), (1, 24)
READING
A vertical line has“undefi ned slope”because for any twopoints, the slopeformula’s denominatorbecomes 0, and divisionby 0 is undefi ned.

84 Chapter 2 Linear Equations and Functions
E X A M P L E 4 Classify parallel and perpendicular lines
Tell whether the lines are parallel, perpendicular, or neither.
a. Line 1: through (22, 2) and (0, 21) b. Line 1: through (1, 2) and (4, 23)Line 2: through (24, 21) and (2, 3) Line 2: through (24, 3) and (21, 22)
Solution
a. Find the slopes of the two lines.
m1 5 21 2 2}0 2 (22)
5 23}
25 23
}2
m2 53 2 (21)}2 2 (24)
5 4}6
5 2}3
c Because m1m2 5 23}2p 2
}3
5 21, m1 and m2
are negative reciprocals of each other. So, thelines are perpendicular.
b. Find the slopes of the two lines.
m1 523 2 2}
4 2 1 5 25}
35 25
}3
m2 522 2 3}21 2 (24) 5 25
}3
5 25}3
c Because m1 5 m2 (and the lines are different),you can conclude that the lines are parallel.
x
y
21
2(22, 2)
(24, 21)
(2, 3)
(0, 21)
Line 1
Line 2
x
y
1
1
(1, 2)
(21, 22)
(24, 3)
(4, 23)
Line 1
Line 2
PARALLEL AND PERPENDICULAR LINES Recall that two lines in a plane areparallel if they do not intersect. Two lines in a plane are perpendicular if theyintersect to form a right angle.
Slope can be used to determine whether two different nonvertical lines areparallel or perpendicular.
KEY CONCEPT For Your Notebook
Slopes of Parallel and Perpendicular Lines
Consider two different nonvertical lines l1 and l2 with slopes m1 and m2.
Parallel Lines The lines are parallel if and only ifthey have the same slope.
m1 5 m2
Perpendicular Lines The lines are perpendicular ifand only if their slopes are negative reciprocals ofeach other.
m1 5 2 1}m2
, or m1m2 5 21
x
y l1 l2
x
yl1 l2

2.2 Find Slope and Rate of Change 85
RATE OF CHANGE Slope can be used to represent an average rate of change, orhow much one quantity changes, on average, relative to the change in anotherquantity. A slope that is a real-life rate of change involves units of measure suchas miles per hour or degrees per day.
REVIEW RATES
Remember that arate is a ratio of twoquantities that havedifferent units.
✓ GUIDED PRACTICE for Example 5
13. WHAT IF? In Example 5, suppose that the diameter of the sequoia is248 inches in 1965 and 251 inches in 2005. Find the average rate of changein the diameter, and use it to predict the diameter in 2105.
FORESTRY Use the diagram, which illustrates the growth of a giant sequoia, tofind the average rate of change in the diameter of the sequoia over time. Thenpredict the sequoia’s diameter in 2065.
Solution
STEP 1 Find the average rate of change.
Average rate of change 5Change in diameter}
Change in time
5 141 in. 2 137 in.}
2005 2 1965
5 4 in.}40 years
5 0.1 inch per year
STEP 2 Predict the diameter of the sequoia in 2065.
Find the number of years from 2005 to 2065. Multiply this number bythe average rate of change to find the total increase in diameter duringthe period 2005–2065.
Number of years 5 2065 2 2005 5 60Increase in diameter 5 (60 years)(0.1 inch/year) 5 6 inches
c In 2065, the diameter of the sequoia will be about 141 1 6 5 147 inches.
✓ GUIDED PRACTICE for Example 4
Tell whether the lines are parallel, perpendicular, or neither.
11. Line 1: through (22, 8) and (2, 24) 12. Line 1: through (24, 22) and (1, 7)Line 2: through (25, 1) and (22, 2) Line 2: through (21, 24) and (3, 5)
TAKS REASONING: Multi-Step ProblemE X A M P L E 5
NG
86 Chapter 2 Linear Equations and Functions
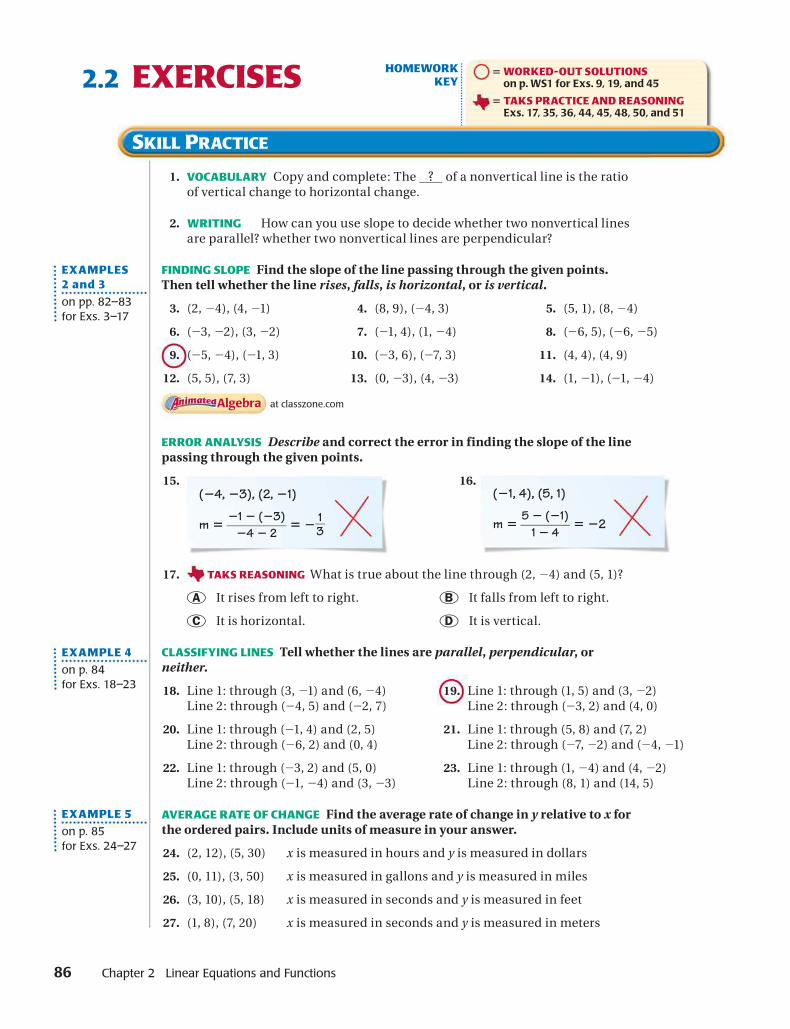
1. VOCABULARY Copy and complete: The ? of a nonvertical line is the ratioof vertical change to horizontal change.
2. How can you use slope to decide whether two nonvertical linesare parallel? whether two nonvertical lines are perpendicular?
FINDING SLOPE Find the slope of the line passing through the given points.Then tell whether the line rises, falls, is horizontal, or is vertical.
3. (2, 24), (4, 21) 4. (8, 9), (24, 3) 5. (5, 1), (8, 24)
6. (23, 22), (3, 22) 7. (21, 4), (1, 24) 8. (26, 5), (26, 25)
9. (25, 24), (21, 3) 10. (23, 6), (27, 3) 11. (4, 4), (4, 9)
12. (5, 5), (7, 3) 13. (0, 23), (4, 23) 14. (1, 21), (21, 24)
at classzone.com
ERROR ANALYSIS Describe and correct the error in finding the slope of the linepassing through the given points.
15.(24, 23), (2, 21)
m 521 2 (23)}
24 2 25 2
1}3
16.(21, 4), (5, 1)
m 55 2 (21)}1 2 4
5 22
17. What is true about the line through (2, 24) and (5, 1)?
A It rises from left to right. B It falls from left to right.
C It is horizontal. D It is vertical.
CLASSIFYING LINES Tell whether the lines are parallel, perpendicular, orneither.
18. Line 1: through (3, 21) and (6, 24) 19. Line 1: through (1, 5) and (3, 22)Line 2: through (24, 5) and (22, 7) Line 2: through (23, 2) and (4, 0)
20. Line 1: through (21, 4) and (2, 5) 21. Line 1: through (5, 8) and (7, 2)Line 2: through (26, 2) and (0, 4) Line 2: through (27, 22) and (24, 21)
22. Line 1: through (23, 2) and (5, 0) 23. Line 1: through (1, 24) and (4, 22)Line 2: through (21, 24) and (3, 23) Line 2: through (8, 1) and (14, 5)
AVERAGE RATE OF CHANGE Find the average rate of change in y relative to x forthe ordered pairs. Include units of measure in your answer.
24. (2, 12), (5, 30) x is measured in hours and y is measured in dollars
25. (0, 11), (3, 50) x is measured in gallons and y is measured in miles
26. (3, 10), (5, 18) x is measured in seconds and y is measured in feet
27. (1, 8), (7, 20) x is measured in seconds and y is measured in meters
2.2 EXERCISES
EXAMPLES2 and 3
on pp. 82–83for Exs. 3–17
EXAMPLE 4
on p. 84for Exs. 18–23
EXAMPLE 5
on p. 85for Exs. 24–27
HOMEWORKKEY
5 WORKED-OUT SOLUTIONSon p. WS1 for Exs. 9, 19, and 45
5 TAKS PRACTICE AND REASONINGExs. 17, 35, 36, 44, 45, 48, 50, and 51
SKILL PRACTICE
TAKS REASONI
WRITING
2.2 Find Slope and Rate of Change 87
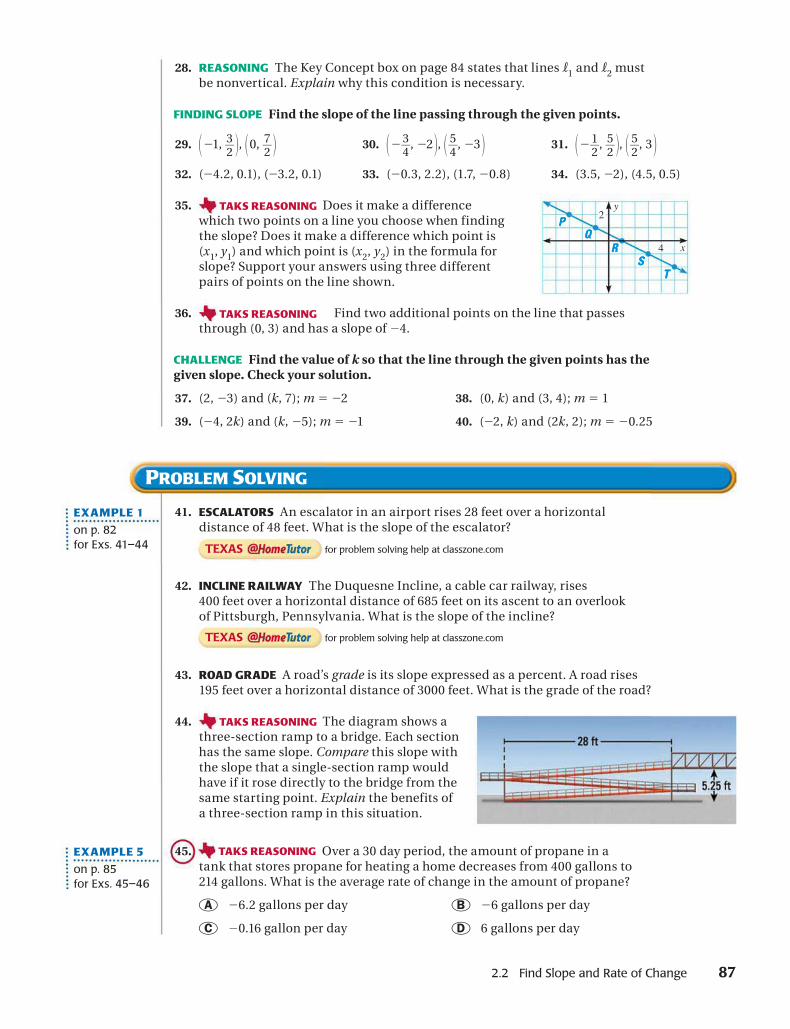
41. ESCALATORS An escalator in an airport rises 28 feet over a horizontaldistance of 48 feet. What is the slope of the escalator?
42. INCLINE RAILWAY The Duquesne Incline, a cable car railway, rises400 feet over a horizontal distance of 685 feet on its ascent to an overlookof Pittsburgh, Pennsylvania. What is the slope of the incline?
43. ROAD GRADE A road’s grade is its slope expressed as a percent. A road rises195 feet over a horizontal distance of 3000 feet. What is the grade of the road?
44. The diagram shows athree-section ramp to a bridge. Each sectionhas the same slope. Compare this slope withthe slope that a single-section ramp wouldhave if it rose directly to the bridge from thesame starting point. Explain the benefits ofa three-section ramp in this situation.
45. Over a 30 day period, the amount of propane in atank that stores propane for heating a home decreases from 400 gallons to214 gallons. What is the average rate of change in the amount of propane?
A 26.2 gallons per day B 26 gallons per day
C 20.16 gallon per day D 6 gallons per day
28. REASONING The Key Concept box on page 84 states that lines l1 and l2 mustbe nonvertical. Explain why this condition is necessary.
FINDING SLOPE Find the slope of the line passing through the given points.
29. 121, 3}2 2 , 10, 7
}2 2 30. 123
}4
, 22 2 , 1 5}4
, 23 2 31. 121}2
, 5}2 2 , 1 5
}2
, 3 2 32. (24.2, 0.1), (23.2, 0.1) 33. (20.3, 2.2), (1.7, 20.8) 34. (3.5, 22), (4.5, 0.5)
35. s it make a differencewhich t e you choose when findingthe slope? Does it make a difference which point is(x1, y1) and which point is (x2, y2) in the formula forslope? Support your answers using three differentpairs of points on the line shown.
36. Find two additional points on the line that passesthrough (0, 3) and has a slope of 24.
CHALLENGE Find the value of k so that the line through the given points has thegiven slope. Check your solution.
37. (2, 23) and (k, 7); m 5 22 38. (0, k) and (3, 4); m 5 1
39. (24, 2k) and (k, 25); m 5 21 40. (22, k) and (2k, 2); m 5 20.25
PROBLEM SOLVING
EXAMPLE 1
on p. 82for Exs. 41–44
EXAMPLE 5
on p. 85for Exs. 45–46
x
y
4
2
TTSS
RRŒŒ
PP TAKS
TAKS ING
TAKS REASON NI G
A RE SON
Doewo points on a lin
NI GSO REA N
TAKS R ASONINGE

88
46. BIOLOGY A red sea urchin grows itsentire life, which can last 200 years.The diagram gives information aboutthe growth in the diameter d of onered sea urchin. What is the averagegrowth rate of this urchin over thegiven period?
47. MULTI-STEP PROBLEM A building code requires the minimum slope, orpitch, of an asphalt-shingle roof to be a rise of 3 feet for each 12 feet of run.The asphalt-shingle roof of an apartment building has the dimensionsshown.
a. Calculate What is the slope of the roof?
b. Interpret Does the roof satisfy the building code?
c. Reasoning If you answered “no” to part (b), byhow much must the rise be increased to satisfy thecode? If you answered “yes,” by how much does therise exceed the code minimum?
48. Plans for a new water slide in an amusement parkcall for the slide to descend from a platform 80 feet tall. The slide will drop1 foot for every 3 feet of horizontal distance.
a. What horizontal distance do you cover when descending the slide?
b. Use the Pythagorean theorem to find the length of the slide.
c. Engineers decide to shorten the slide horizontally by 5 feet to allow fora wider walkway at the slide’s base. The plans for the platform remainunchanged. How will this affect the slope of the slide? Explain.
49. CHALLENGE A car travels 36 miles per gallon of gasoline in highway drivingand 24 miles per gallon in city driving. If you drive the car equal distanceson the highway and in the city, how many miles per gallon can you expectto average? (Hint: The average fuel efficiency for all the driving is the totaldistance traveled divided by the total amount of gasoline used.)
15 ft
80 ft
EXTRA PRACTICE for Lesson 2.2, p. 1011 ONLINE QUIZ at classzone.com
Growth of Red Sea Urchin
Age 30 Age 110
d = 15.5 cmd = 11.9 cm
50. TAKS PRACTICE A city is building a rectangular playground in acommunity park. The city has 560 feet of fencing to enclose the playground.The length of the playground should be 40 feet longer than the width. Whatis the length of the playground if all of the fencing is used? TAKS Obj. 10
A 120 ft B 160 ft
C 200 ft D 300 ft
51. TAKS PRACTICE A computer technician charges $185 for parts needed tofix a computer and $45 for each hour that he works on the computer. Whichequation best represents the relationship between the number of hours, h,the technician works on the computer and the total charges, c? TAKS Obj. 1
F c 5 45 2 185h G c 5 45 1 185h
H c 5 185 2 45h J c 5 185 1 45h
MIXED REVIEW FOR TAKSTAKS PRACTICE at classzone.com
REVIEW
Lesson 1.5;TAKS Workbook
REVIEW
Lesson 1.4;TAKS Workbook
TAKS REASONING
2.3 Graph Equations of Lines 89
2.3 Graph Equationsof Lines
Before You graphed linear equations by making tables of values.
Now You will graph linear equations in slope-intercept or standard form.
Why? So you can model motion, as in Ex. 64.
Key Vocabulary• parent function• y-intercept• slope-intercept form• standard form of a
linear equation• x-intercept
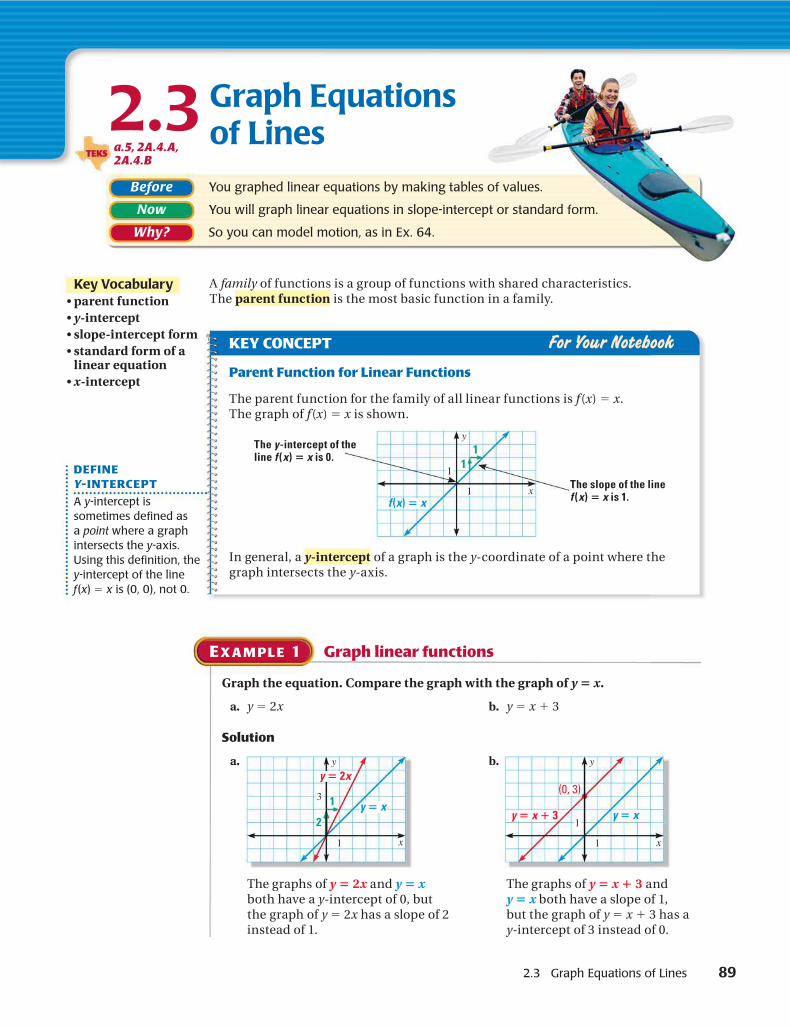
A family of functions is a group of functions with shared characteristics.The parent function is the most basic function in a family.
Graph the equation. Compare the graph with the graph of y 5 x.
a. y 5 2x b. y 5 x 1 3
Solution
a. b.
The graphs of y 5 2x and y 5 x The graphs of y 5 x 1 3 andboth have a y-intercept of 0, but y 5 x both have a slope of 1,the graph of y 5 2x has a slope of 2 but the graph of y 5 x 1 3 has ainstead of 1. y-intercept of 3 instead of 0.
E X A M P L E 1 Graph linear functions
x
y
1
3y 5 x
y 5 2x
2
1
x
y
1
1y 5 xy 5 x 1 3
(0, 3)
KEY CONCEPT For Your Notebook
Parent Function for Linear Functions
The parent function for the family of all linear functions is f(x) 5 x.The graph of f(x) 5 x is shown.
In general, a y-intercept of a graph is the y-coordinate of a point where thegraph intersects the y-axis.
x
y
1
1
f (x) 5 x
11
The y-intercept of theline f (x) 5 x is 0.
The slope of the linef (x) 5 x is 1.
DEFINEY-INTERCEPT
A y-intercept issometimes defi ned asa point where a graphintersects the y-axis.Using this defi nition, they-intercept of the linef (x) 5 x is (0, 0), not 0.
a.5, 2A.4.A,2A.4.B
TEKS
90 Chapter 2 Linear Equations and Functions
SLOPE-INTERCEPT FORM If you write the equations in Example 1 as y 5 2x 1 0and y 5 1x 1 3, you can see that the x-coefficients, 2 and 1, are the slopes of thelines, while the constant terms, 0 and 3, are the y-intercepts. In general, a linewith equation y 5 mx 1 b has slope m and y-intercept b. The equation y 5 mx 1 bis said to be in slope-intercept form.
KEY CONCEPT For Your Notebook
Using Slope-Intercept Form to Graph an Equation
STEP 1 Write the equation in slope-intercept form by solving for y.
STEP 2 Identify the y-intercept b and use it to plot the point (0, b) wherethe line crosses the y-axis.
STEP 3 Identify the slope m and use it to plot a second point on the line.
STEP 4 Draw a line through the two points.
✓ GUIDED PRACTICE for Examples 1 and 2
Graph the equation. Compare the graph with the graph of y 5 x.
1. y 5 22x 2. y 5 x 2 2 3. y 5 4x
Graph the equation.
4. y 5 2x 1 2 5. y 5 2}5
x 1 4 6. y 5 1}2
x 2 3
7. y 5 5 1 x 8. f(x) 5 1 2 3x 9. f(x) 5 10 2 x
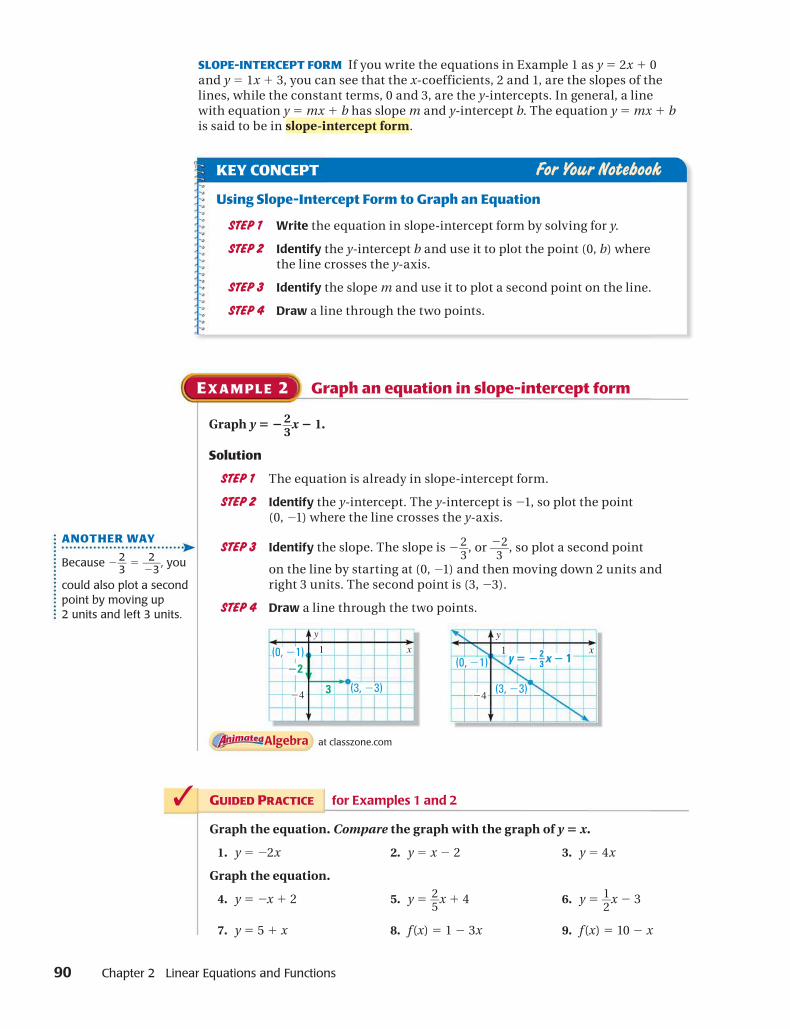
E X A M P L E 2 Graph an equation in slope-intercept form
Graph y 5 22}3
x 2 1.
Solution
STEP 1 The equation is already in slope-intercept form.
STEP 2 Identify the y-intercept. The y-intercept is 21, so plot the point(0, 21) where the line crosses the y-axis.
STEP 3 Identify the slope. The slope is 22}3
, or 22}
3 , so plot a second point
on the line by starting at (0, 21) and then moving down 2 units andright 3 units. The second point is (3, 23).
STEP 4 Draw a line through the two points.
x
y
1
3 (3, 23)24
(0, 21)22
x
y
1
(3, 23)24
(0, 21) y 5 2 x 2 123
at classzone.com
ANOTHER WAY
Because 22}3
52
}23
, you
could also plot a secondpoint by moving up2 units and left 3 units.
ON
2.3 Graph Equations of Lines 91
REAL-LIFE PROBLEMS In a real-life context, a line’s slope can represent an averagerate of change. The y-intercept in a real-life context is often an initial value.
E X A M P L E 3
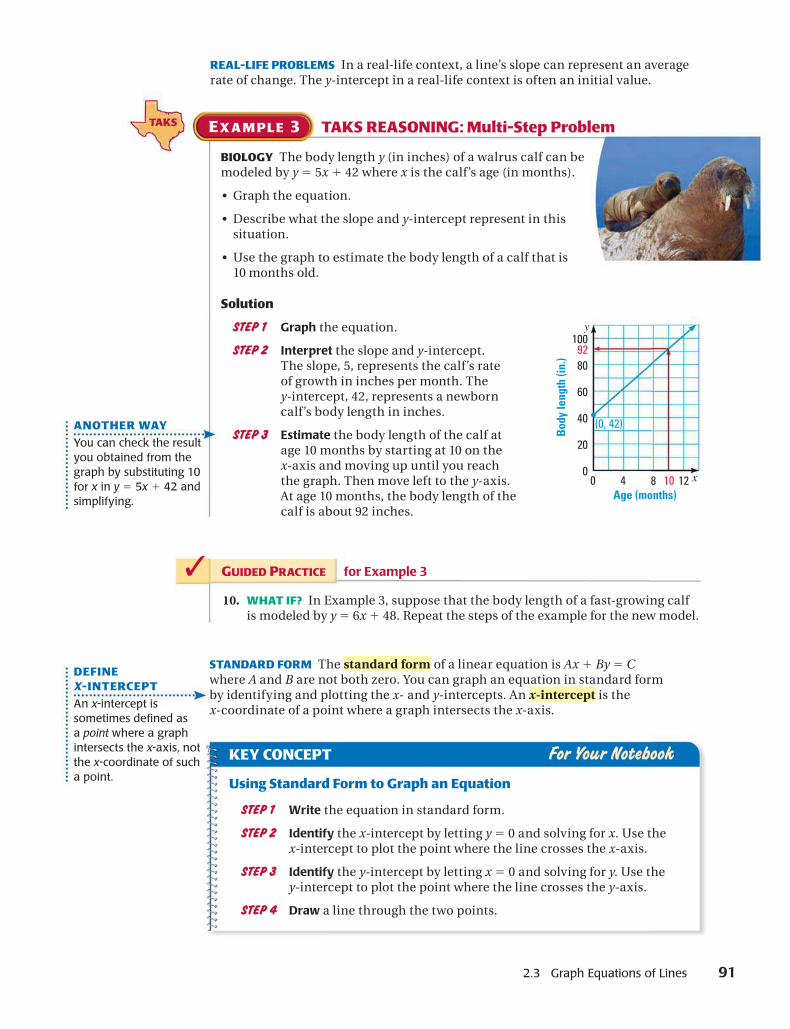
BIOLOGY The body length y (in inches) of a walrus calf can bemodeled by y 5 5x 1 42 where x is the calf’s age (in months).
• Graph the equation.
• Describe what the slope and y-intercept represent in thissituation.
• Use the graph to estimate the body length of a calf that is10 months old.
Solution
STEP 1 Graph the equation.
STEP 2 Interpret the slope and y-intercept.The slope, 5, represents the calf’s rateof growth in inches per month. They-intercept, 42, represents a newborncalf’s body length in inches.
STEP 3 Estimate the body length of the calf atage 10 months by starting at 10 on thex-axis and moving up until you reachthe graph. Then move left to the y-axis.At age 10 months, the body length of thecalf is about 92 inches.
✓ GUIDED PRACTICE for Example 3
10. WHAT IF? In Example 3, suppose that the body length of a fast-growing calfis modeled by y 5 6x 1 48. Repeat the steps of the example for the new model.
KEY CONCEPT For Your Notebook
Using Standard Form to Graph an Equation
STEP 1 Write the equation in standard form.
STEP 2 Identify the x-intercept by letting y 5 0 and solving for x. Use thex-intercept to plot the point where the line crosses the x-axis.
STEP 3 Identify the y-intercept by letting x 5 0 and solving for y. Use they-intercept to plot the point where the line crosses the y-axis.
STEP 4 Draw a line through the two points.
(0, 42)
Age (months)
Bod
y le
ngth
(in.
)
4 8 12
100
80
60
40
20
00 10
92
x
y
STANDARD FORM The standard form of a linear equation is Ax 1 By 5 Cwhere A and B are not both zero. You can graph an equation in standard formby identifying and plotting the x- and y-intercepts. An x-intercept is thex-coordinate of a point where a graph intersects the x-axis.
DEFINEX-INTERCEPT
An x-intercept issometimes defi ned asa point where a graphintersects the x-axis, notthe x-coordinate of sucha point.
ANOTHER WAY
You can check the resultyou obtained from thegraph by substituting 10for x in y 5 5x 1 42 andsimplifying.
i-Step ProblemA NG: MultT S IS RAK E
92 Chapter 2 Linear Equations and Functions
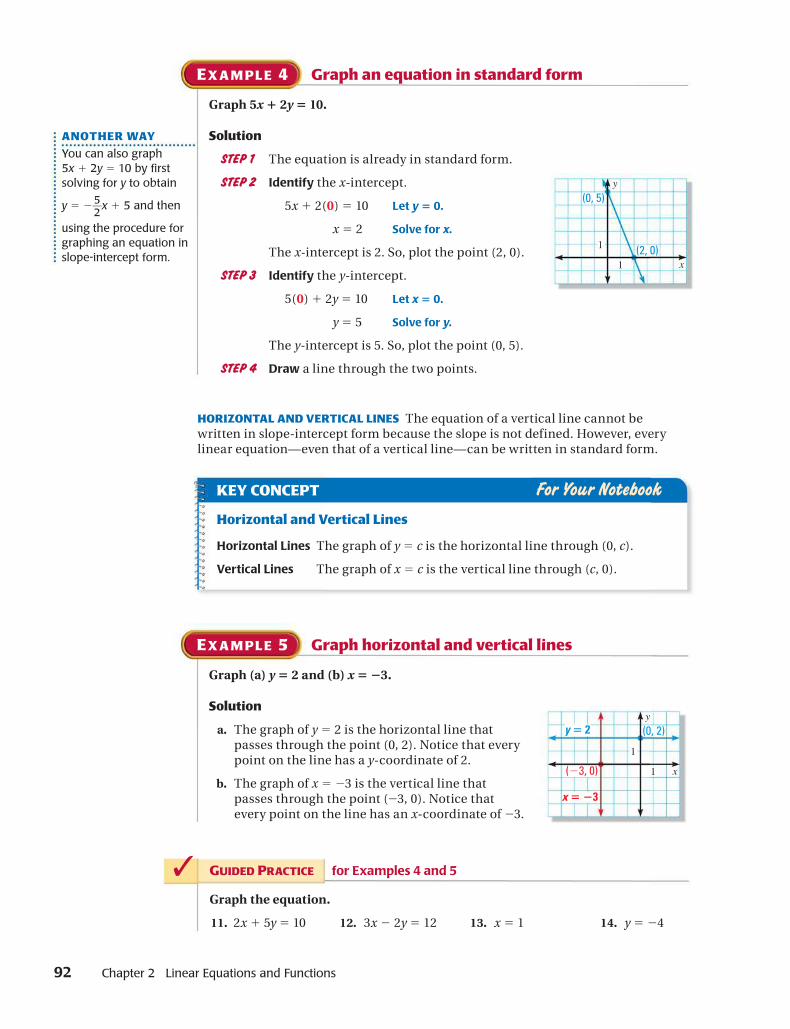
E X A M P L E 4 Graph an equation in standard form
Graph 5x 1 2y 5 10.
Solution
STEP 1 The equation is already in standard form.
STEP 2 Identify the x-intercept.
5x 1 2(0) 5 10 Let y 5 0.
x 5 2 Solve for x.
The x-intercept is 2. So, plot the point (2, 0).
STEP 3 Identify the y-intercept.
5(0) 1 2y 5 10 Let x 5 0.
y 5 5 Solve for y.
The y-intercept is 5. So, plot the point (0, 5).
STEP 4 Draw a line through the two points.
ANOTHER WAY
You can also graph5x 1 2y 5 10 by fi rstsolving for y to obtain
y 5 25}2
x 1 5 and then
using the procedure forgraphing an equation inslope-intercept form.
✓ GUIDED PRACTICE for Examples 4 and 5
Graph the equation.
11. 2x 1 5y 5 10 12. 3x 2 2y 5 12 13. x 5 1 14. y 5 24
KEY CONCEPT For Your Notebook
Horizontal and Vertical Lines
Horizontal Lines The graph of y 5 c is the horizontal line through (0, c).
Vertical Lines The graph of x 5 c is the vertical line through (c, 0).
E X A M P L E 5 Graph horizontal and vertical lines
Graph (a) y 5 2 and (b) x 5 23.
Solution
a. The graph of y 5 2 is the horizontal line thatpasses through the point (0, 2). Notice that everypoint on the line has a y-coordinate of 2.
b. The graph of x 5 23 is the vertical line thatpasses through the point (23, 0). Notice thatevery point on the line has an x-coordinate of 23.
x
y
1
1
(0, 2)
x 5 23
y 5 2
(23, 0)
x
y
1
1 (2, 0)
(0, 5)
HORIZONTAL AND VERTICAL LINES The equation of a vertical line cannot bewritten in slope-intercept form because the slope is not defined. However, everylinear equation—even that of a vertical line—can be written in standard form.
2.3 Graph Equations of Lines 93
2.3 EXERCISES
EXAMPLE 1
on p. 89for Exs. 3–8
EXAMPLE 2
on p. 90for Exs. 9–22
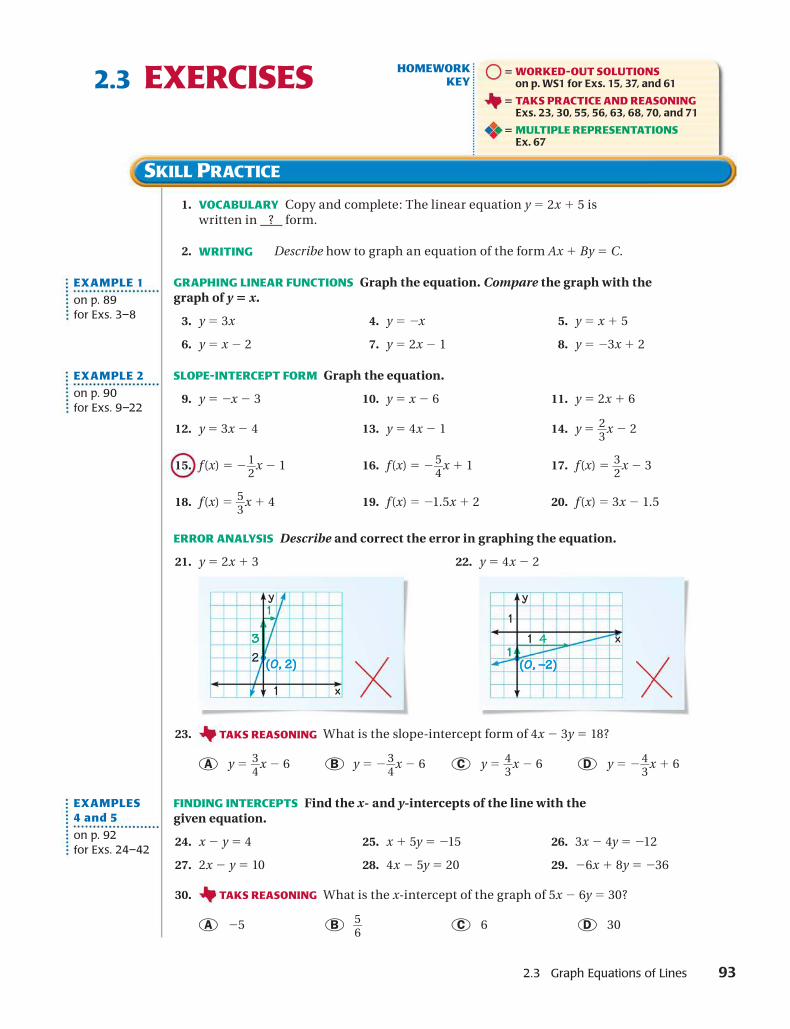
1. VOCABULARY Copy and complete: The linear equation y 5 2x 1 5 iswritten in ? form.
2. Describe how to graph an equation of the form Ax 1 By 5 C.
GRAPHING LINEAR FUNCTIONS Graph the equation. Compare the graph with thegraph of y 5 x.
3. y 5 3x 4. y 5 2x 5. y 5 x 1 5
6. y 5 x 2 2 7. y 5 2x 2 1 8. y 5 23x 1 2
SLOPE-INTERCEPT FORM Graph the equation.
9. y 5 2x 2 3 10. y 5 x 2 6 11. y 5 2x 1 6
12. y 5 3x 2 4 13. y 5 4x 2 1 14. y 5 2}3
x 2 2
15. f(x) 5 21}2
x 2 1 16. f(x) 5 25}4
x 1 1 17. f(x) 5 3}2
x 2 3
18. f(x) 5 5}3
x 1 4 19. f(x) 5 21.5x 1 2 20. f(x) 5 3x 2 1.5
ERROR ANALYSIS Describe and correct the error in graphing the equation.
21. y 5 2x 1 3 22. y 5 4x 2 2
23. What is the slope-intercept form of 4x 2 3y 5 18?
A y 5 3}4
x 2 6 B y 5 23}4
x 2 6 C y 5 4}3
x 2 6 D y 5 24}3
x 1 6
FINDING INTERCEPTS Find the x- and y-intercepts of the line with thegiven equation.
24. x 2 y 5 4 25. x 1 5y 5 215 26. 3x 2 4y 5 212
27. 2x 2 y 5 10 28. 4x 2 5y 5 20 29. 26x 1 8y 5 236
30. at is the x-intercept of the graph of 5x 2 6y 5 30?
A 25 B 5}6
C 6 D 30
EXAMPLES4 and 5
on p. 92for Exs. 24–42
x
y
11
114
(0, –2)(0, –2)
x
y
1
233
1
(0, 2)(0, 2)
HOMEWORKKEY
5 WORKED-OUT SOLUTIONSon p. WS1 for Exs. 15, 37, and 61
5 TAKS PRACTICE AND REASONINGExs. 23, 30, 55, 56, 63, 68, 70, and 71
5 MULTIPLE REPRESENTATIONSEx. 67
SKILL PRACTICE
WRITING
TAKS REASONING
TAKS REASONING Wh
945 MULTIPLE
REPRESENTATIONS
STANDARD FORM Graph the equation. Label any intercepts.
31. x 1 4y 5 8 32. 2x 2 6y 5 212 33. x 5 4
34. y 5 22 35. 5x 2 y 5 3 36. 3x 1 4y 5 12
37. 25x 1 10y 5 20 38. 2x 2 y 5 6 39. y 5 1.5
40. 2.5x 2 5y 5 215 41. x 5 25}2
42. 1}2
x 1 2y 5 22
CHOOSING A METHOD Graph the equation using any method.
43. 6y 5 3x 1 6 44. 23 1 x 5 0 45. y 1 7 5 22x
46. 4y 5 16 47. 8y 5 22x 1 20 48. 4x 5 21}2
y 2 1
49. 24x 5 8y 1 12 50. 3.5x 5 10.5 51. y 2 5.5x 5 6
52. 14 2 3x 5 7y 53. 2y 2 5 5 0 54. 5y 5 7.5 2 2.5x
55. Write equations of two lines, one with an x-interceptbut no y-intercept and one with a y-intercept but no x-intercept.
56. ★ tch y 5 mx for several values of m, both positive andnegative. Describe the relationship between m and the steepness of the line.
57. REASONING Consider the graph of Ax 1 By 5 C where B Þ 0. What are theslope and y-intercept in terms of A, B, and C?
58. CHALLENGE Prove that the slope of the line y 5 mx 1 b is m. (Hint: First findtwo points on the line by choosing convenient values of x.)
EXAMPLE 3
on p. 91for Exs. 59–62
5 WORKED-OUT SOLUTIONSon p. WS1
PROBLEM SOLVING
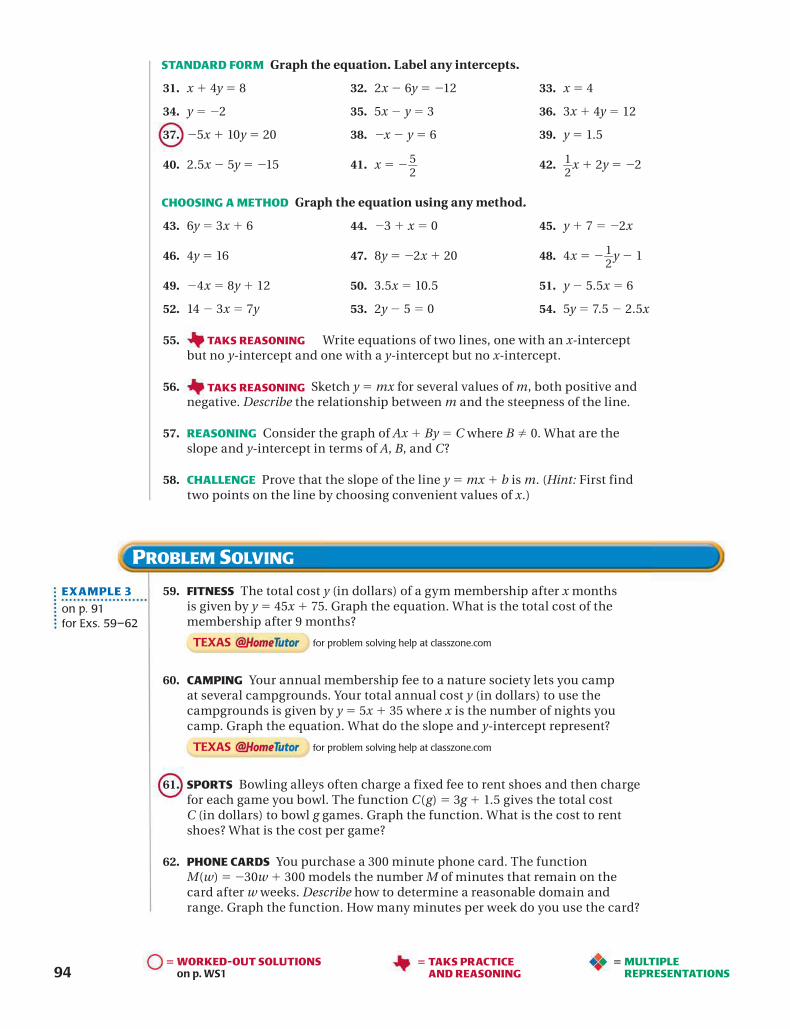
59. FITNESS The total cost y (in dollars) of a gym membership after x monthsis given by y 5 45x 1 75. Graph the equation. What is the total cost of themembership after 9 months?
60. CAMPING Your annual membership fee to a nature society lets you campat several campgrounds. Your total annual cost y (in dollars) to use thecampgrounds is given by y 5 5x 1 35 where x is the number of nights youcamp. Graph the equation. What do the slope and y-intercept represent?
61. SPORTS Bowling alleys often charge a fixed fee to rent shoes and then chargefor each game you bowl. The function C(g) 5 3g 1 1.5 gives the total costC (in dollars) to bowl g games. Graph the function. What is the cost to rentshoes? What is the cost per game?
62. PHONE CARDS You purchase a 300 minute phone card. The functionM(w) 5 230w 1 300 models the number M of minutes that remain on thecard after w weeks. Describe how to determine a reasonable domain andrange. Graph the function. How many minutes per week do you use the card?
5 TAKS PRACTICEAND REASONING
TAKS REASONI G SkeN
TAKS REASONING
2.3 Graph Equations of Lines 95
63. You receive a $30 gift card to a shop that sells fruitsmoothies for $3. If you graph an equation of the line that represents themoney y remaining on the card after you buy x smoothies, what will they-intercept be? Will the line rise or fall from left to right? Explain.
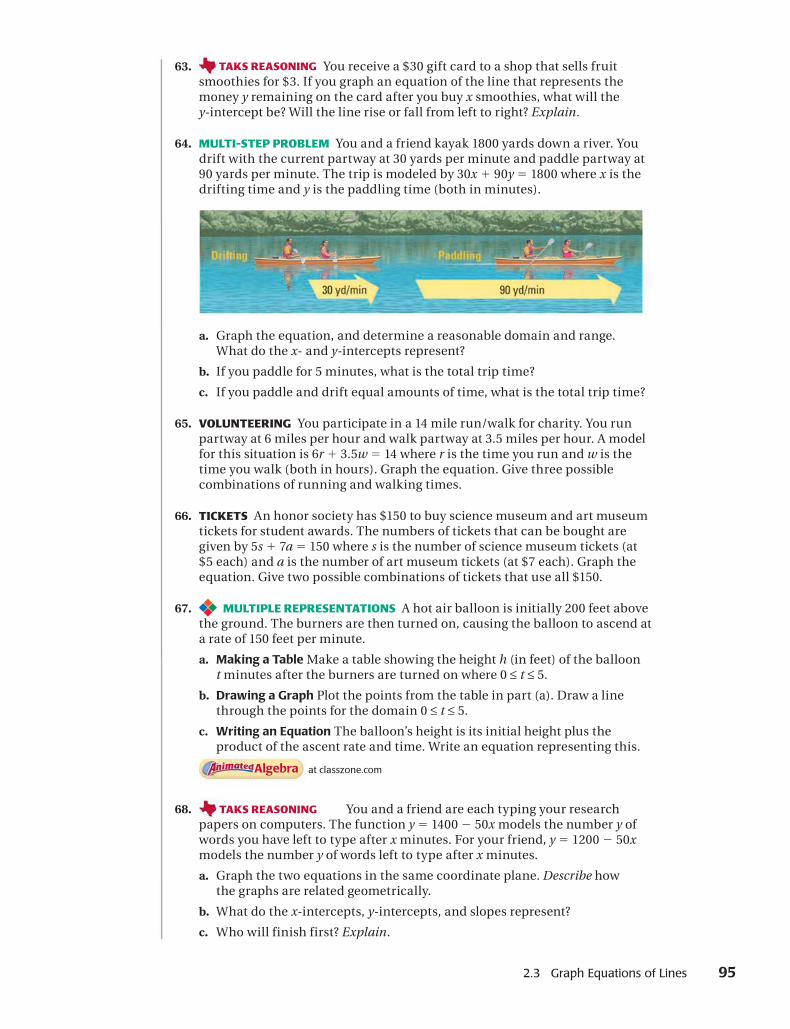
64. MULTI-STEP PROBLEM You and a friend kayak 1800 yards down a river. Youdrift with the current partway at 30 yards per minute and paddle partway at90 yards per minute. The trip is modeled by 30x 1 90y 5 1800 where x is thedrifting time and y is the paddling time (both in minutes).
a. Graph the equation, and determine a reasonable domain and range.What do the x- and y-intercepts represent?
b. If you paddle for 5 minutes, what is the total trip time?
c. If you paddle and drift equal amounts of time, what is the total trip time?
65. VOLUNTEERING You participate in a 14 mile run/walk for charity. You runpartway at 6 miles per hour and walk partway at 3.5 miles per hour. A modelfor this situation is 6r 1 3.5w 5 14 where r is the time you run and w is thetime you walk (both in hours). Graph the equation. Give three possiblecombinations of running and walking times.
66. TICKETS An honor society has $150 to buy science museum and art museumtickets for student awards. The numbers of tickets that can be bought aregiven by 5s 1 7a 5 150 where s is the number of science museum tickets (at$5 each) and a is the number of art museum tickets (at $7 each). Graph theequation. Give two possible combinations of tickets that use all $150.
67. MULTIPLE REPRESENTATIONS A hot air balloon is initially 200 feet abovethe ground. The burners are then turned on, causing the balloon to ascend ata rate of 150 feet per minute.
a. Making a Table Make a table showing the height h (in feet) of the balloont minutes after the burners are turned on where 0 ≤ t ≤ 5.
b. Drawing a Graph Plot the points from the table in part (a). Draw a linethrough the points for the domain 0 ≤ t ≤ 5.
c. Writing an Equation The balloon’s height is its initial height plus theproduct of the ascent rate and time. Write an equation representing this.
at classzone.com
68. You and a friend are each typing your researchpapers on computers. The function y 5 1400 2 50x models the number y ofwords you have left to type after x minutes. For your friend, y 5 1200 2 50xmodels the number y of words left to type after x minutes.
a. Graph the two equations in the same coordinate plane. Describe howthe graphs are related geometrically.
b. What do the x-intercepts, y-intercepts, and slopes represent?
c. Who will finish first? Explain.
TAKS REASONING
TAKS REASONING

96
Tell whether the relation is a function. Explain. (p. 72)
1.
25
24
23
22
1
Input Output 2.
25
21
2
4
22
0
2
6
Input Output 3.
22
21
4
5
Input Output
23
21
0
Tell whether the lines are parallel, perpendicular, or neither. (p. 82)
4. Line 1: through (23, 27) and (1, 9) 5. Line 1: through (2, 7) and (21, 22)Line 2: through (21, 24) and (0, 22) Line 2: through (3, 26) and (–6, 23)
Graph the equation. (p. 89)
6. y 5 25x 1 3 7. x 5 10 8. 4x 1 3y 5 224
9. ROWING SPEED In 1999, Tori Murden became the first woman to row acrossthe Atlantic Ocean. She rowed a total of 3333 miles during her crossing. Thedistance d rowed (in miles) can be modeled by d 5 41t where t representsthe time rowed (in days) at an average rate of 41 miles per day. Graph thefunction, and determine a reasonable domain and range. Then estimate howlong it took Tori Murden to row 1000 miles. (p. 72)
QUIZ for Lessons 2.1–2.3
69. CHALLENGE You want to cover a five-by-five grid completelywith x three-by-one rectangles and y four-by-one rectanglesthat do not overlap or extend beyond the grid.
a. Explain why x and y must be whole numbers that satisfythe equation 3x 1 4y 5 25.
b. Find all solutions (x, y) of the equation in part (a) suchthat x and y are whole numbers.
c. Do all the solutions from part (b) represent combinations of rectanglesthat can actually cover the grid? Use diagrams to support your answer.
EXTRA PRACTICE for Lesson 2.3, p. 1011 ONLINE QUIZ at classzone.com
3 by 13 by 1 4 by 14 by 1 5 by 55 by 5
70. TAKS PRACTICE In isosceles triangle ABC, the interior angle A measures1108. The measures of all three interior angles of triangle ABC are— TAKS Obj. 6
A 1108, 1108, and 1408 B 1108, 1108, and 1108
C 1108, 408, and 308 D 1108, 358, and 358
71. TAKS PRACTICE A paper cup is shaped like thecone shown. What is the approximate volume of thispaper cup? TAKS Obj. 8
F 6.5 in.3 G 10.5 in.3
H 26.2 in.3 J 41.9 in.3
MIXED REVIEW FOR TAKSTAKS PRACTICE at classzone.com
REVIEW
Skills ReviewHandbook p. 995;TAKS Workbook
REVIEW
TAKS Preparationp. 608;TAKS Workbook 4 in.
2.5 in.
2.3 Graph Equations of Lines 97
2.3 Graph Equations
GraphingCalculator ACTIVITYAACTIVITYGraphingCalculatorr
gp gp
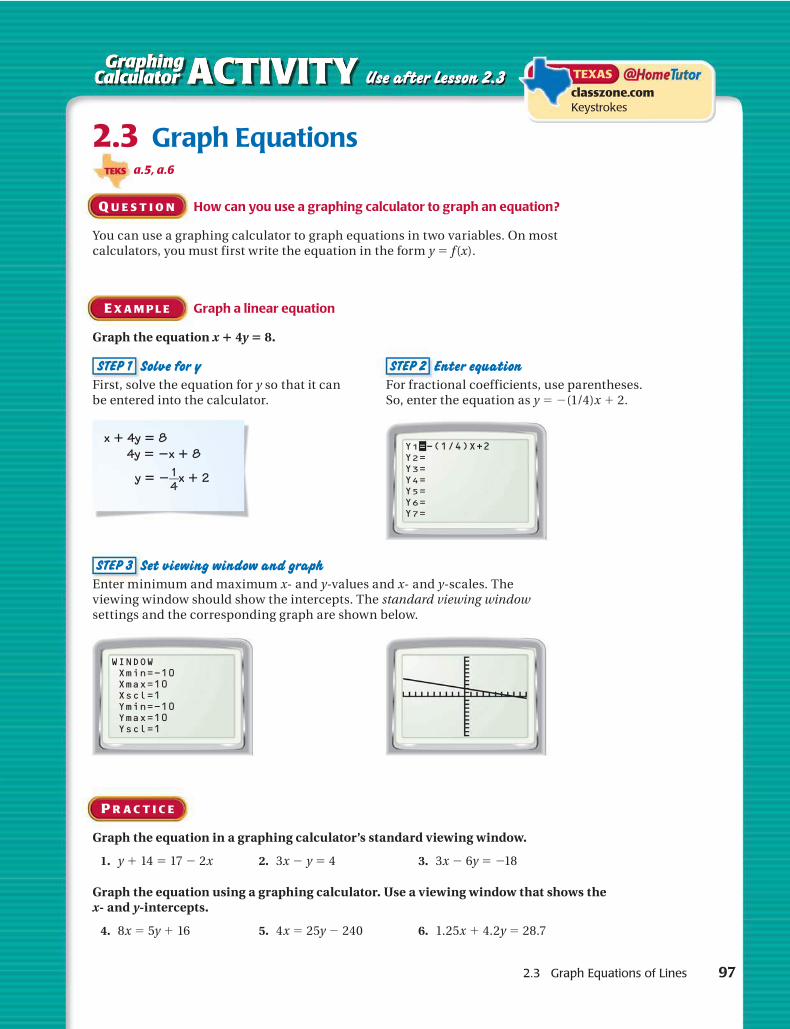
STEP 1 Solve for y
First, solve the equation for y so that it canbe entered into the calculator.
STEP 2 Enter equation
For fractional coefficients, use parentheses.So, enter the equation as y 5 2(1/4)x 1 2.
STEP 3 Set viewing window and graph
Enter minimum and maximum x- and y-values and x- and y-scales. Theviewing window should show the intercepts. The standard viewing windowsettings and the corresponding graph are shown below.
P R A C T I C E
Graph the equation in a graphing calculator’s standard viewing window.
1. y 1 14 5 17 2 2x 2. 3x 2 y 5 4 3. 3x 2 6y 5 218
Graph the equation using a graphing calculator. Use a viewing window that shows thex- and y-intercepts.
4. 8x 5 5y 1 16 5. 4x 5 25y 2 240 6. 1.25x 1 4.2y 5 28.7
x 1 4y 5 8 4y 5 2x 1 8
y 5 2 1}4
x 1 2
Y1=-(1/4)X+2Y2=Y3=Y4=Y5=Y6=Y7=
WINDOW Xmin=-10 Xmax=10 Xscl=1 Ymin=-10 Ymax=10 Yscl=1
Q U E S T I O N How can you use a graphing calculator to graph an equation?
You can use a graphing calculator to graph equations in two variables. On mostcalculators, you must first write the equation in the form y 5 f(x).
E X A M P L E Graph a linear equation
Graph the equation x 1 4y 5 8.
Use after Lesson 2.3 TEXAS
classzone.com Keystrokes
a.5, a.6TEKS

98 Chapter 2 Linear Equations and Functions
Key Vocabulary• point-slope form
Before You graphed linear equations.
Now You will write linear equations.
Why? So you can model a steady increase or decrease, as in Ex. 51.
2.4 Write Equations of Lines
Write an equation of the line shown.
Solution
From the graph, you can see that the slope is m 5 3}4
and the y-intercept is b 5 22. Use slope-interceptform to write an equation of the line.
y 5 mx 1 b Use slope-intercept form.
y 5 3}4
x 1 (22) Substitute 3}4
for m and 22 for b.
y 5 3}4
x 2 2 Simplify.
at classzone.com
E X A M P L E 1 Write an equation given the slope and y-intercept
KEY CONCEPT For Your Notebook
Writing an Equation of a Line
Given slope m and y-intercept b Use slope-intercept form:
y 5 mx 1 b
Given slope m and a point (x1, y1) Use point-slope form:
y 2 y1 5 m(x 2 x1)
Given points (x1, y1) and (x2, y2) First use the slope formula to find m.Then use point-slope form with eithergiven point.
✓ GUIDED PRACTICE for Example 1
Write an equation of the line that has the given slope and y-intercept.
1. m 5 3, b 5 1 2. m 5 22, b 5 24 3. m 5 23}4
, b 5 7}2
x
y
1
2 4
(0, 22)
3
a.1, a.3, a.4,2A.2.A
TEKS

2.4 Write Equations of Lines 99
Write an equation of the line that passes through (22, 3) and is (a) parallel to,and (b) perpendicular to, the line y 5 24x 1 1.
Solution
a. The given line has a slope of m1 5 24. So, a line parallel to it has a slopeof m2 5 m1 5 24. You know the slope and a point on the line, so use thepoint-slope form with (x1, y1) 5 (22, 3) to write an equation of the line.
y 2 y1 5 m2(x 2 x1) Use point-slope form.
y 2 3 5 24(x 2 (22)) Substitute for m2, x1, and y1.
y 2 3 5 24(x 1 2) Simplify.
y 2 3 5 24x 2 8 Distributive property
y 5 24x 2 5 Write in slope-intercept form.
b. A line perpendicular to a line with slope m1 5 24 has a slope
of m2 5 2 1}m1
5 1}4
. Use point-slope form with (x1, y1) 5 (22, 3).
y 2 y1 5 m2(x 2 x1) Use point-slope form.
y 2 3 5 1}4
(x 2 (22)) Substitute for m2, x1, and y1.
y 2 3 5 1}4
(x 1 2) Simplify.
y 2 3 5 1}4
x 1 1}2
Distributive property
y 5 1}4
x 1 7}2
Write in slope-intercept form.
E X A M P L E 3 Write equations of parallel or perpendicular lines
E X A M P L E 2 Write an equation given the slope and a point
Write an equation of the line that passes through (5, 4) and has a slope of 23.
Solution
Because you know the slope and a point on the line, use point-slope form to writean equation of the line. Let (x1, y1) 5 (5, 4) and m 5 23.
y 2 y1 5 m(x 2 x1) Use point-slope form.
y 2 4 5 23(x 2 5) Substitute for m, x1, and y1.
y 2 4 5 23x 1 15 Distributive property
y 5 23x 1 19 Write in slope-intercept form.
✓ GUIDED PRACTICE for Examples 2 and 3
4. Write an equation of the line that passes through (21, 6) and has a slope of 4.
5. Write an equation of the line that passes through (4, 22) and is (a) parallelto, and (b) perpendicular to, the line y 5 3x 2 1.
SIMPLIFYEQUATIONS
In this book, equationswritten in point-slopeform will be simplifi edto slope-intercept form.

100 Chapter 2 Linear Equations and Functions
E X A M P L E 5 Write a model using slope-intercept form
SPORTS In the school year ending in 1993, 2.00 millionfemales participated in U.S. high school sports. By 2003,the number had increased to 2.86 million. Write a linearequation that models female sports participation.
Solution
STEP 1 Define the variables. Let x represent the time(in years) since 1993 and let y represent thenumber of participants (in millions).
STEP 2 Identify the initial value and rate of change. Theinitial value is 2.00. The rate of change is the slope m.
m 5y2 2 y1}x2 2 x1
5 2.86 2 2.00}
10 2 05 0.86
}10
5 0.086Use (x1, y1) 5 (0, 2.00)and (x2, y2) 5 (10, 2.86).
STEP 3 Write a verbal model. Then write a linear equation.
Participants(millions)
5 Initialnumber
1 Rate ofchange
p Yearssince 1993
y 5 2.00 1 0.086 p x
c In slope-intercept form, a linear model is y 5 0.086x 1 2.00.
E X A M P L E 4 Write an equation given two points
Write an equation of the line that passes through (5, 22) and (2, 10).
Solution
The line passes through (x1, y1) 5 (5, 22) and (x2, y2) 5 (2, 10). Find its slope.
m 5y2 2 y1}x2 2 x1
510 2 (22)}
2 2 55 12
}23
5 24
You know the slope and a point on the line, so use point-slope form with eithergiven point to write an equation of the line. Choose (x1, y1) 5 (2, 10).
y 2 y1 5 m(x 2 x1) Use point-slope form.
y 2 10 5 24(x 2 2) Substitute for m, x1, and y1.
y 2 10 5 24x 1 8 Distributive property
y 5 24x 1 18 Write in slope-intercept form.
✓ GUIDED PRACTICE for Examples 4 and 5
Write an equation of the line that passes through the given points.
6. (22, 5), (4, 27) 7. (6, 1), (23, 28) 8. (21, 2), (10, 0)
9. SPORTS In Example 5, the corresponding data for males are 3.42 millionparticipants in 1993 and 3.99 million participants in 2003. Write a linearequation that models male participation in U.S. high school sports.
AVOID ERRORS
Because time isdefi ned in years since1993 in Step 1, 1993corresponds to x1 5 0and 2003 correspondsto x2 5 10.
ANOTHER WAY
For an alternativemethod for solving theproblem in Example 4,turn to page 105 forthe Problem SolvingWorkshop.
2.4 Write Equations of Lines 101
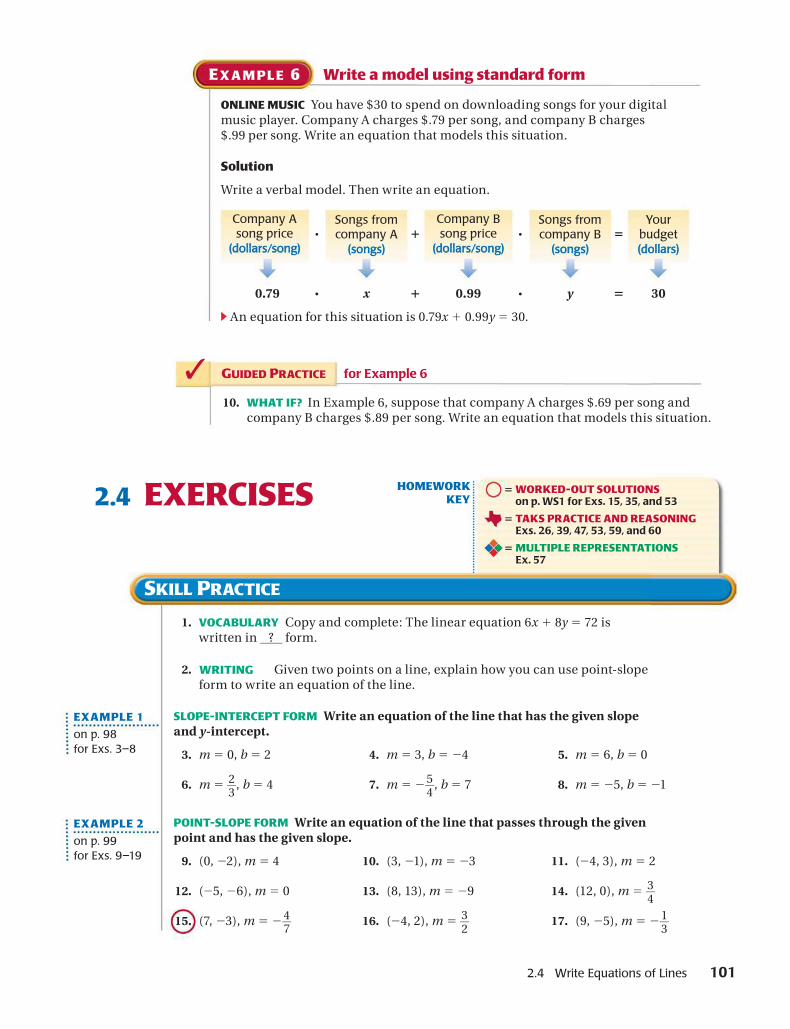
E X A M P L E 6 Write a model using standard form
ONLINE MUSIC You have $30 to spend on downloading songs for your digitalmusic player. Company A charges $.79 per song, and company B charges$.99 per song. Write an equation that models this situation.
Solution
Write a verbal model. Then write an equation.
Company Asong price
(dollars/song)p
Songs fromcompany A
(songs)1
Company Bsong price
(dollars/song)p
Songs fromcompany B
(songs)5
Yourbudget(dollars)
0.79 p x 1 0.99 p y 5 30
c An equation for this situation is 0.79x 1 0.99y 5 30.
✓ GUIDED PRACTICE for Example 6
10. WHAT IF? In Example 6, suppose that company A charges $.69 per song andcompany B charges $.89 per song. Write an equation that models this situation.
1. VOCABULARY Copy and complete: The linear equation 6x 1 8y 5 72 iswritten in ? form.
Given two points on a line, explain how you can use point-slopeform to write an equation of the line.
SLOPE-INTERCEPT FORM Write an equation of the line that has the given slopeand y-intercept.
3. m 5 0, b 5 2 4. m 5 3, b 5 24 5. m 5 6, b 5 0
6. m 5 2}3
, b 5 4 7. m 5 25}4
, b 5 7 8. m 5 25, b 5 21
POINT-SLOPE FORM Write an equation of the line that passes through the givenpoint and has the given slope.
9. (0, 22), m 5 4 10. (3, 21), m 5 23 11. (24, 3), m 5 2
12. (25, 26), m 5 0 13. (8, 13), m 5 29 14. (12, 0), m 5 3}4
15. (7, 23), m 5 24}7
16. (24, 2), m 5 3}2
17. (9, 25), m 5 21}3
2.4 EXERCISES
EXAMPLE 1
on p. 98for Exs. 3–8
EXAMPLE 2
on p. 99for Exs. 9–19
HOMEWORKKEY
5 WORKED-OUT SOLUTIONSon p. WS1 for Exs. 15, 35, and 53
5 TAKS PRACTICE AND REASONINGExs. 26, 39, 47, 53, 59, and 60
5 MULTIPLE REPRESENTATIONSEx. 57
SKILL PRACTICE
GWRITIN 2.

102
ERROR ANALYSIS Describe and correct the error in writing an equation ofthe line that passes through the given point and has the given slope.
18. (24, 2), m 5 3 19. (5, 1), m 5 22
y 2 y1 5 m(x 2 x1)
y 2 2 5 3(x 2 4)
y 2 2 5 3x 2 12
y 5 3x 2 10
y 2 y1 5 m(x 2 x1)
y 2 5 5 22(x 2 1)
y 2 5 5 22x 1 2
y 5 22x 1 7
PARALLEL AND PERPENDICULAR LINES Write an equation of the line that passesthrough the given point and satisfies the given condition.
20. (23, 25); parallel to y 5 24x 1 1 21. (7, 1); parallel to y 5 2x 1 3
22. (2, 8); parallel to y 5 3x 2 2 23. (4, 1); perpendicular to y 5 1}3
x 1 3
24. (26, 2); perpendicular to y 5 22 25. (3, 21); perpendicular to y 5 4x 1 1
26. hat is an equation of the line that passes through(1, 4) and is perpendicular to the line y 5 2x 2 3?
A y 5 2x 1 2 B y 5 1}2
x 1 7}2
C y 5 21}2
x 1 9}2D y 5 21
}2
x 1 4
VISUAL THINKING Write an equation of the line.
27.x
y
4
(5, 24)
(3, 0)21
28.
x
y
4
1
(4, 4)
(3, 21)
29.
x
y
1
1
(21, 5)(3, 4)
WRITING EQUATIONS Write an equation of the line that passes through thegiven points.
30. (21, 3), (2, 9) 31. (4, 21), (6, 27) 32. (22, 23), (2, 21)
33. (0, 7), (3, 5) 34. (21, 2), (3, 24) 35. (25, 22), (23, 8)
36. (15, 20), (212, 29) 37. (3.5, 7), (21, 20.5) 38. (0.6, 0.9), (3.4, 22.6)
39. Which point lies on the line that passes through thepoi 2 lope of 26?
A (6, 10) B (6, 6) C (7, 7) D (6, 24)
STANDARD FORM Write an equation in standard form Ax 1 By 5 C of the linethat satisfies the given conditions. Use integer values for A, B, and C.
40. m 5 23, b 5 5 41. m 5 4, b 5 23
42. m 5 23}2
, passes through (4, 27) 43. m 5 4}5
, passes through (2, 3)
44. passes through (21, 3) and (26, 27) 45. passes through (2, 8) and (24, 16)
at classzone.com
EXAMPLE 3
on p. 99for Exs. 20–26
EXAMPLE 4
on p. 100for Exs. 27–38
5 WORKED-OUT SOLUTIONSon p. WS1
5 TAKS PRACTICEAND REASONING
TAKS REASONING W
TAKS REASONING nt (9, 5) and has a s

2.4 Write Equations of Lines 103
46. REASONING Write an equation of the line that passes through (3, 4) andsatisfies the given condition.
a. Parallel to y 5 22 b. Perpendicular to y 5 22
c. Parallel to x 5 22 d. Perpendicular to x 5 22
47. Write an equation of a line l such that l and the linesy 5 23x 1 5 and y 5 2x 1 1 form a right triangle.
48. REASONING Consider two distinct nonvertical lines A1x 1 B1y 5 C1 andA2x 1 B2y 5 C2. Show that the following statements are true.
a. If the lines are parallel, then A1B2 5 A2B1.
b. If the lines are perpendicular, then A1A2 1 B1B2 5 0.
49. CHALLENGE Show that an equation of the line with x-intercept a and
y-intercept b is x}a
1y}b
5 1. This is the intercept form of a linear equation.
50. CAR EXPENSES You buy a used car for $6500. The monthly cost of owning thecar (including insurance, fuel, maintenance, and taxes) averages $350. Writean equation that models the total cost of buying and owning the car.
51. HOUSING Since its founding, a volunteer group has restored 50 houses. Itplans to restore 15 houses per year in the future. Write an equation thatmodels the total number n of restored houses t years from now.
52. GARDENING You have a rectangular plot measuring16 feet by 25 feet in a community garden. You wantto grow tomato plants that each need 8 square feet ofspace and pepper plants that each need 5 square feet.Write an equation that models how many tomato plantsand how many pepper plants you can grow. How manypepper plants can you grow if you grow 15 tomato plants?
53. ★ SHORT RESPONSE Concert tickets cost $15 for general admission, but only$9 with a student ID. Ticket sales total $4500. Write and graph an equationthat models this situation. Explain how to use your graph to find how manystudent tickets were sold if 200 general admission tickets were sold.
54. MULTI-STEP PROBLEM A company will lease office space in two buildings.The annual cost is $21.75 per square foot in the first building and $17 persquare foot in the second. The company has $86,000 budgeted for rent.
a. Write an equation that models the possible amounts of space rented inthe buildings.
b. How many square feet of space can be rented in the first building if2500 square feet are rented in the second?
c. If the company wants to rent equal amounts of space in the buildings,what is the total number of square feet that can be rented?
EXAMPLE 5
on p. 100for Exs. 50–51
EXAMPLE 6
on p. 101for Exs. 52–54
PROBLEM SOLVING
TAKS REASONING
TAKS REASONING

104
55. CABLE TELEVISION In 1994, the average monthly cost for expanded basiccable television service was $21.62. In 2004, this cost had increased to $38.23.Write a linear equation that models the monthly cost as a function of thenumber of years since 1994. Predict the average monthly cost of expandedbasic cable television service in 2010.
56. TIRE PRESSURE Automobile tire pressure increases about 1 psi (pound persquare inch) for each 108F increase in air temperature. At an air temperatureof 558F, a tire’s pressure is 30 psi. Write an equation that models the tire’spressure as a function of air temperature.
57. MULTIPLE REPRESENTATIONS Your class wants tomake a rectangular spirit display, and has 24 feet ofdecorative border to enclose the display
a. Writing an Equation Write an equation in standardform relating the possible lengths l and widths w ofthe display.
b. Drawing a Graph Graph the equation from part (a).
c. Making a Table Make a table of at least five possible pairsof dimensions for the display.
58. CHALLENGE You are participating in a dance-a-thonto raise money for a class trip. Donors can pledge anamount of money for each hour you dance, a fixedamount of money that does not depend on how longyou dance, or both. The table shows the amountspledged by four donors. Write an equation thatmodels the total amount y of money you will raisefrom the donors if you dance for x hours.
Donor Hourlyamount
Fixedamount
Clare $4 $15
Emilia $8 None
Julio None $35
Max $3 $20
EXTRA PRACTICE for Lesson 2.4, p. 1011 ONLINE QUIZ at classzone.com
w
l
59. TAKS PRACTICE At the end of the week, John has $180 in his bank account.During the week he withdrew $30 for lunches, deposited a $125 paycheck,and withdrew $22 to buy a shirt. How much money did John have in hisaccount at the beginning of the week? TAKS Obj. 10
A $95 B $100 C $107 D $117
60. TAKS PRACTICE Use the table to determine the expression that bestrepresents the total measure of the interior angles of any convex polygonhaving n sides. TAKS Obj. 6
Number of sides, n 3 4 5 6 7
Total measure of interiorangles (in degrees) 180 360 540 720 900
F 90(n 2 1) G 180(n 2 2)
H 360(n 2 3) J 360}n 2 1
MIXED REVIEW FOR TAKSTAKS PRACTICE at classzone.com
REVIEW
Skills ReviewHandbook p. 998;TAKS Workbook
REVIEW
TAKS Preparationp. 408;TAKS Workbook

Using Alternative Methods 105
LESSON 2.4Another Way to Solve Example 4, page 100
MULTIPLE REPRESENTATIONS In Example 4 on page 100, you wrote an equationof a line through two given points by first writing the equation in point-slopeform and then rewriting it in slope-intercept form. You can also write anequation of a line through two points by using the slope-intercept form to solvefor the y-intercept.
Write an equation of the line that passes through (5, 22) and (2, 10).
Solving for the y-Intercept To write an equation of a line through two points,you can substitute the slope and the coordinates of one of the points intoy 5 mx 1 b and solve for the y-intercept b.
STEP 1 Find the slope of the line.
STEP 2 Substitute the slope and the coordinatesof one point into the slope-intercept form.Use the point (5, 22).
STEP 3 Solve for b.
STEP 4 Substitute m and b into theslope-intercept form.
M E T H O D
y 5 mx 1 b
22 5 24(5) 1 b
22 5 220 1 b
18 5 b
y 5 24x 1 18
1. WRITE AN EQUATION Use the method aboveto write an equation of the line that passesthrough (2, 15) and (7, 35).
2. FITNESS At a speed of 45 yards per minute,a 120 pound swimmer burns 420 caloriesper hour and a 172 pound swimmer burns600 calories per hour. Use two differentmethods to write a linear equation that modelsthe number of calories burned per hour as afunction of a swimmer’s weight.
3. SAFETY A motorist lights an emergency flareafter having a flat tire. After burning for6 minutes, the flare is 13 inches long. Afterburning for 20 minutes, it is 6 inches long.Use two different methods to write a linearequation that models the flare’s length as afunction of time.
4. SNOWFALL After 4 hours of snowfall, the snowdepth is 8 inches. After 6 hours of snowfall,the snow depth is 9.5 inches. Use two differentmethods to write a linear equation that modelsthe snow depth as a function of time.
5. ARCHAEOLOGY Ancient cities often rose inelevation through time as citizens built ontop of accumulating rubble and debris. Anarchaeologist at a site dates artifacts from adepth of 54 feet as 3500 years old and artifactsfrom a depth of 26 feet as 2600 years old.Use two different methods to write a linearequation that models an artifact’s age as afunction of depth.
6. REASONING Suppose a line has slope m andpasses through (x1, y1). Write an expression forthe y-intercept b in terms of m, x1, and y1.
PR AC T I C E
PRO B L E M
m 510 2 (22)}
2 2 55 12
}23
5 24
ALTERNATIVE METHODSALTERNATIVE METHODSUsingUsing
a.5, a.6TEKS
106 Chapter 2 Linear Equations and Functions
Lessons 2.1–2.4
MIXED REVIEW FOR TEKSMIXED REVIEW FOR TEKS TAKS PRACTICE
classzone.com
MULTIPLE CHOICE
1. WEBSITES From January through June, thenumber of visitors to a news website increasedby about 1200 per month. In January, therewere 50,000 visitors to the website. Whichequation shows the number of visitors v asa function of the number of months t sinceJanuary? TEKS a.3
A v 5 50,000 2 1200t
B v 5 50,000 1 1200t
C v 5 1200 2 50,000t
D v 5 1200 1 50,000t
2. SLOPE What is the slope of a line parallel to
the line 1}4
y 2 3x 5 5? TEKS a.5
F 23
G 23}4
H 1}4
J 12
3. PARALLEL LINES Which equation represents aline that is parallel to the line x 1 3y 5 12 andcontains no points in Quadrant I? TEKS a.5
A y 5 21}3x 2 4
B y 5 21}3x 1 8
C y 5 23x 2 4
D y 5 3x 1 4
4. POPULATION The official population of BatonRouge, Louisiana, was 219,478 in 1990 and227,818 in 2000. What is the average rate ofchange in the population from 1990 to 2000?TEKS a.5
F 28340 people per year
G 2834 people per year
H 834 people per year
J 8340 people per year
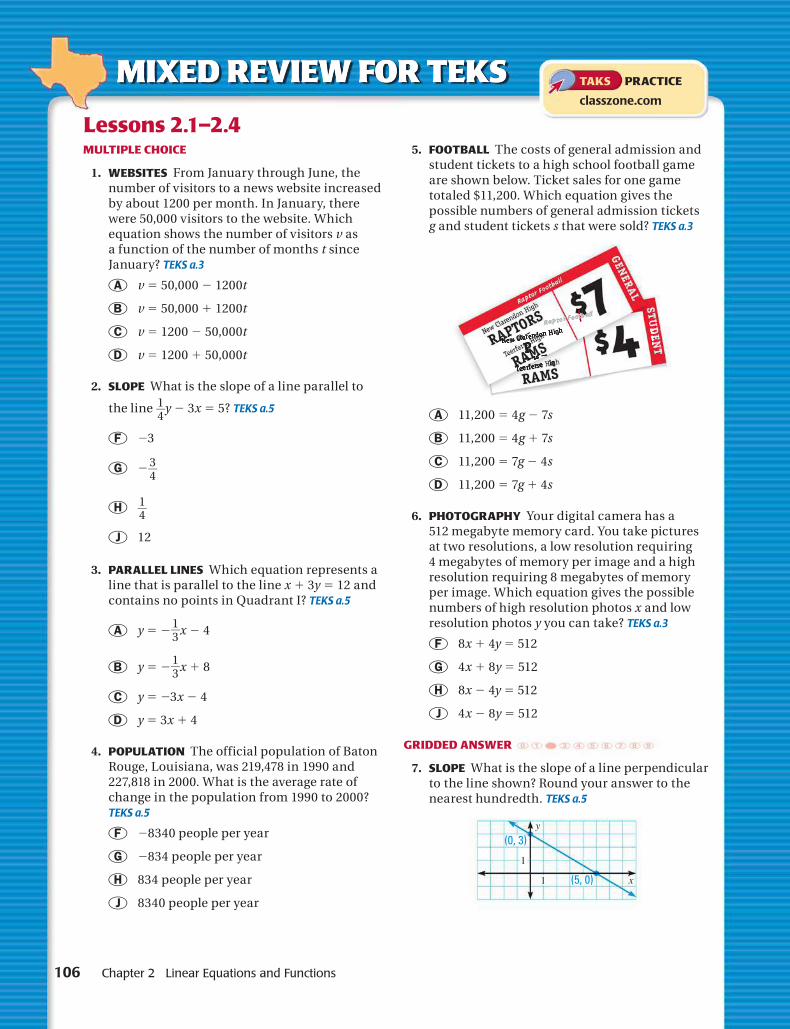
5. FOOTBALL The costs of general admission andstudent tickets to a high school football gameare shown below. Ticket sales for one gametotaled $11,200. Which equation gives thepossible numbers of general admission ticketsg and student tickets s that were sold? TEKS a.3
A 11,200 5 4g 2 7s
B 11,200 5 4g 1 7s
C 11,200 5 7g 2 4s
D 11,200 5 7g 1 4s
6. PHOTOGRAPHY Your digital camera has a512 megabyte memory card. You take picturesat two resolutions, a low resolution requiring4 megabytes of memory per image and a highresolution requiring 8 megabytes of memoryper image. Which equation gives the possiblenumbers of high resolution photos x and lowresolution photos y you can take? TEKS a.3
F 8x 1 4y 5 512
G 4x 1 8y 5 512
H 8x 2 4y 5 512
J 4x 2 8y 5 512
GRIDDED ANSWER 0 1 2 3 4 5 6 7 8 9
7. SLOPE What is the slope of a line perpendicularto the line shown? Round your answer to thenearest hundredth. TEKS a.5
x
y
1
1
(0, 3)
(5, 0)

2.5 Model Direct Variation 107
KEY CONCEPT For Your Notebook
Direct Variation
Equation The equation y 5 ax represents direct variation betweenx and y, and y is said to vary directly with x. The nonzeroconstant a is called the constant of variation.
Graph The graph of a direct variationequation y 5 ax is a line withslope a and y-intercept 0.
The family of direct variationgraphs consists of lines throughthe origin, such as those shown.
✓ GUIDED PRACTICE for Example 1
Write and graph a direct variation equation that has the given ordered pair asa solution.
1. (3, 29) 2. (27, 4) 3. (5, 3) 4. (6, 22)
2.5 Model Direct Variation
Before You wrote and graphed linear equations.
Now You will write and graph direct variation equations.
Why? So you can model animal migration, as in Ex. 44.
Key Vocabulary• direct variation• constant of variation
x
y
2
2y 5 x1
2
y 5 2x
E X A M P L E 1 Write and graph a direct variation equation
Write and graph a direct variation equation that has (24, 8) as a solution.
Solution
Use the given values of x and y to find the constant of variation.
y 5 ax Write direct variation equation.
8 5 a(24) Substitute 8 for y and 24 for x.
22 5 a Solve for a.
c Substituting 22 for a in y 5 ax gives the directvariation equation y 5 22x. Its graph is shown.
at classzone.com
x
y
2
6(24, 8)
a.3, 2A.1.B,2A.10.G
TEKS

108 Chapter 2 Linear Equations and Functions
E X A M P L E 2 Write and apply a model for direct variation
METEOROLOGY Hailstones form when strong updraftssupport ice particles high in clouds, where waterdroplets freeze onto the particles. The diagram shows ahailstone at two different times during its formation.
a. Write an equation that gives the hailstone’sdiameter d (in inches) after t minutes if you assumethe diameter varies directly with the time thehailstone takes to form.
b. Using your equation from part (a), predict thediameter of the hailstone after 20 minutes.
Solution
a. Use the given values of t and d to find the constant of variation.
d 5 at Write direct variation equation.
0.75 5 a(12) Substitute 0.75 for d and 12 for t.
0.0625 5 a Solve for a.
An equation that relates t and d is d 5 0.0625t.
b. After t 5 20 minutes, the predicted diameter of the hailstone isd 5 0.0625(20) 5 1.25 inches.
RATIOS AND DIRECT VARIATION Because the direct variation equation y 5 ax can
be written asy}x 5 a, a set of data pairs (x, y) shows direct variation if the ratio of
y to x is constant.
E X A M P L E 3 Use ratios to identify direct variation
SHARKS Great white sharks have triangular teeth.The table below gives the length of a side of a toothand the body length for each of six great whitesharks. Tell whether tooth length and body lengthshow direct variation. If so, write an equation thatrelates the quantities.
Tooth length, t (cm) 1.8 2.4 2.9 3.6 4.7 5.8
Body length, b (cm) 215 290 350 430 565 695
Solution
Find the ratio of the body length b to the tooth length t for each shark.
215}1.8
ø 119 290}2.4
ø 121 350}2.9
5 121
430}3.6
ø 119 565}4.7
ø 120 695}5.8
ø 120
c Because the ratios are approximately equal, the data show direct variation.
An equation relating tooth length and body length is b}t
5 120, or b 5 120t.
AVOID ERRORS
For real-world data,the ratios do not haveto be exactly the sameto show that directvariation is a plausiblemodel.

2.5 Model Direct Variation 109
✓ GUIDED PRACTICE for Examples 2 and 3
5. WHAT IF? In Example 2, suppose that a hailstone forming in a cloud has aradius of 0.6 inch. Predict how long it has been forming.
6. SHARKS In Example 3, the respective body masses m (in kilograms) of thegreat white sharks are 80, 220, 375, 730, 1690, and 3195. Tell whether toothlength and body mass show direct variation. If so, write an equation thatrelates the quantities.
EXAMPLE 1
on p. 107for Exs. 3–10
1. VOCABULARY Define the constant of variation for two variables x and y thatvary directly.
2. Given a table of ordered pairs (x, y), describe how to determinewhether x and y show direct variation.
WRITING AND GRAPHING Write and graph a direct variation equation that hasthe given ordered pair as a solution.
3. (2, 6) 4. (23, 12) 5. (6, 221) 6. (4, 10)
7. (25, 21) 8. (24, 28) 9. 1 4}3
, 242 10. (12.5, 5)
WRITING AND EVALUATING The variables x and y vary directly. Write anequation that relates x and y. Then find y when x 5 12.
11. x 5 4, y 5 8 12. x 5 23, y 5 25 13. x 5 35, y 5 27
14. x 5 218, y 5 4 15. x 5 24.8, y 5 21.6 16. x 5 2}3
, y 5 210
17.(3, 18) as a solution?
A y 5 2x2 B y 5 1}6
x C y 5 6x D y 5 4x 1 6
IDENTIFYING DIRECT VARIATION Tell whether the equation represents directvariation. If so, give the constant of variation.
18. y 5 28x 19. y 2 4 5 3x 20. 3y 2 7 5 10x
21. 2y 2 5x 5 0 22. 5y 5 24x 23. 6y 5 x
WRITING AND SOLVING The variables x and y vary directly. Write an equationthat relates x and y. Then find x when y 5 24.
24. x 5 5, y 5 215 25. x 5 26, y 5 8 26. x 5 218, y 5 22
27. x 5 212, y 5 84 28. x 5 220}3
, y 5 215}8
29. x 5 20.5, y 5 3.6
2.5 EXERCISES
EXAMPLE 2
on p. 108for Exs. 11–17
HOMEWORKKEY
5 WORKED-OUT SOLUTIONSon p. WS1 for Exs. 5, 15, and 41
5 TAKS PRACTICE AND REASONINGExs. 17, 30, 40, 44, 46, and 47
SKILL PRACTICE
WRITING
Which equation is a direct variation equation that has TAKS A N RE SO ING

110
30. Give an example of two real-life quantities that showdirect variation. ain your reasoning.
IDENTIFYING DIRECT VARIATION Tell whether the data in the table show directvariation. If so, write an equation relating x and y.
31.x 3 6 9 12 15
y 21 22 23 24 25
32.x 1 2 3 4 5
y 7 9 11 13 15
33.x 25 24 23 22 21
y 20 16 12 8 4
34.x 28 24 4 8 12
y 8 4 24 28 212
35. ERROR ANALYSIS A student tried todetermine whether the data pairs (1, 24),(2, 12), (3, 8), and (4, 6) show directvariation. Describe and correct theerror in the student’s work.
36. REASONING Let (x1, y1) be a solution, other than (0, 0), of a direct variationequation. Write a second direct variation equation whose graph isperpendicular to the graph of the first equation.
37. CHALLENGE Let (x1, y1) and (x2, y2) be any two distinct solutions of a direct
variation equation. Show thatx2}x1
5y2}y1
.
EXAMPLE 3
on p. 108for Exs. 31–34
EXAMPLE 2
on p. 108for Exs. 38–40
5 WORKED-OUT SOLUTIONSon p. WS1
38. SCUBA DIVING The time t it takes a diver to ascend safely to the surfacevaries directly with the depth d. It takes a minimum of 0.75 minute for a safeascent from a depth of 45 feet. Write an equation that relates d and t. Thenpredict the minimum time for a safe ascent from a depth of 100 feet.
39. WEATHER Hail 0.5 inch deep and weighing 1800 pounds covers a roof. Thehail’s weight w varies directly with its depth d. Write an equation that relatesd and w. Then predict the weight on the roof of hail that is 1.75 inches deep.
40. ur weight M on Mars varies directly with yourweight E on Earth. If you weigh 116 pounds on Earth, you would weigh44 pounds on Mars. Which equation relates E and M?
A M 5 E 2 72 B 44M 5 116E C M 5 29}11
E D M 5 11}29
E
41. INTERNET DOWNLOADS The ordered pairs (4.5, 23), (7.8, 40), and (16.0, 82)are in the form (s, t) where t represents the time (in seconds) needed todownload an Internet file of size s (in megabytes). Tell whether the data showdirect variation. If so, write an equation that relates s and t.
PROBLEM SOLVING
EXAMPLE 3
on p. 108for Exs. 41–43
1 p 24 5 24 2 p 12 5 243 p 8 5 24 4 p 6 5 24
Because the products xy areconstant, y varies directly with x.
5 TAKS PRACTICEAND REASONING
TAKS REASONI GExplN
TAKS REASONING Yo
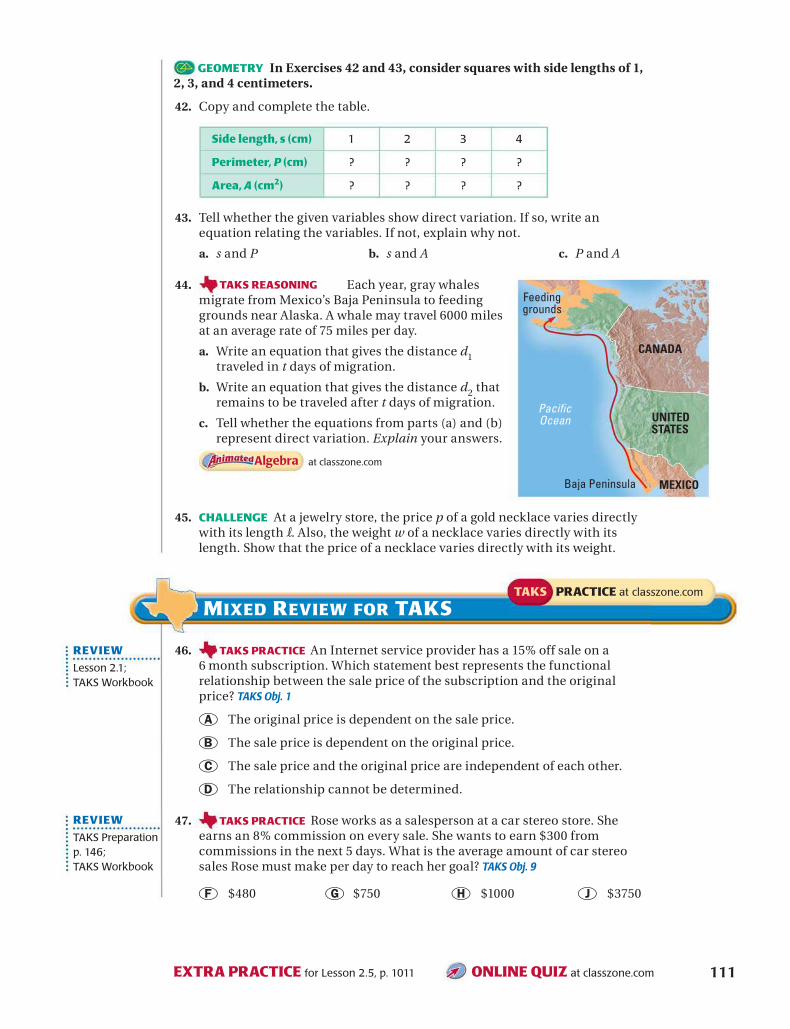
111EXTRA PRACTICE for Lesson 2.5, p. 1011 ONLINE Z at classzone.com
GEOMETRY In Exercises 42 and 43, consider squares with side lengths of 1,2, 3, and 4 centimeters.
42. Copy and complete the table.
43. Tell whether the given variables show direct variation. If so, write anequation relating the variables. If not, explain why not.
a. s and P b. s and A c. P and A
44. Each year, gray whalesmigrate from Mexico’s Baja Peninsula to feedinggrounds near Alaska. A whale may travel 6000 milesat an average rate of 75 miles per day.
a. Write an equation that gives the distance d1traveled in t days of migration.
b. Write an equation that gives the distance d2 thatremains to be traveled after t days of migration.
c. Tell whether the equations from parts (a) and (b)represent direct variation. Explain your answers.
at classzone.com
45. CHALLENGE At a jewelry store, the price p of a gold necklace varies directlywith its length l. Also, the weight w of a necklace varies directly with itslength. Show that the price of a necklace varies directly with its weight.
Side length, s (cm) 1 2 3 4
Perimeter, P (cm) ? ? ? ?
Area, A (cm2) ? ? ? ?
MEXICO
UNITEDSTATES
CANADA
PacificOcean
Feedinggrounds
Baja Peninsula
46. TAKS PRACTICE An Internet service provider has a 15% off sale on a6 month subscription. Which statement best represents the functionalrelationship between the sale price of the subscription and the originalprice? TAKS Obj. 1
A The original price is dependent on the sale price.
B The sale price is dependent on the original price.
C The sale price and the original price are independent of each other.
D The relationship cannot be determined.
47. TAKS PRACTICE Rose works as a salesperson at a car stereo store. Sheearns an 8% commission on every sale. She wants to earn $300 fromcommissions in the next 5 days. What is the average amount of car stereosales Rose must make per day to reach her goal? TAKS Obj. 9
F $480 G $750 H $1000 J $3750
MIXED REVIEW FOR TAKSTAKS PRACTICE at classzone.com
REVIEW
Lesson 2.1;TAKS Workbook
REVIEW
TAKS Preparationp. 146;TAKS Workbook
TAKS REASONING
QUI
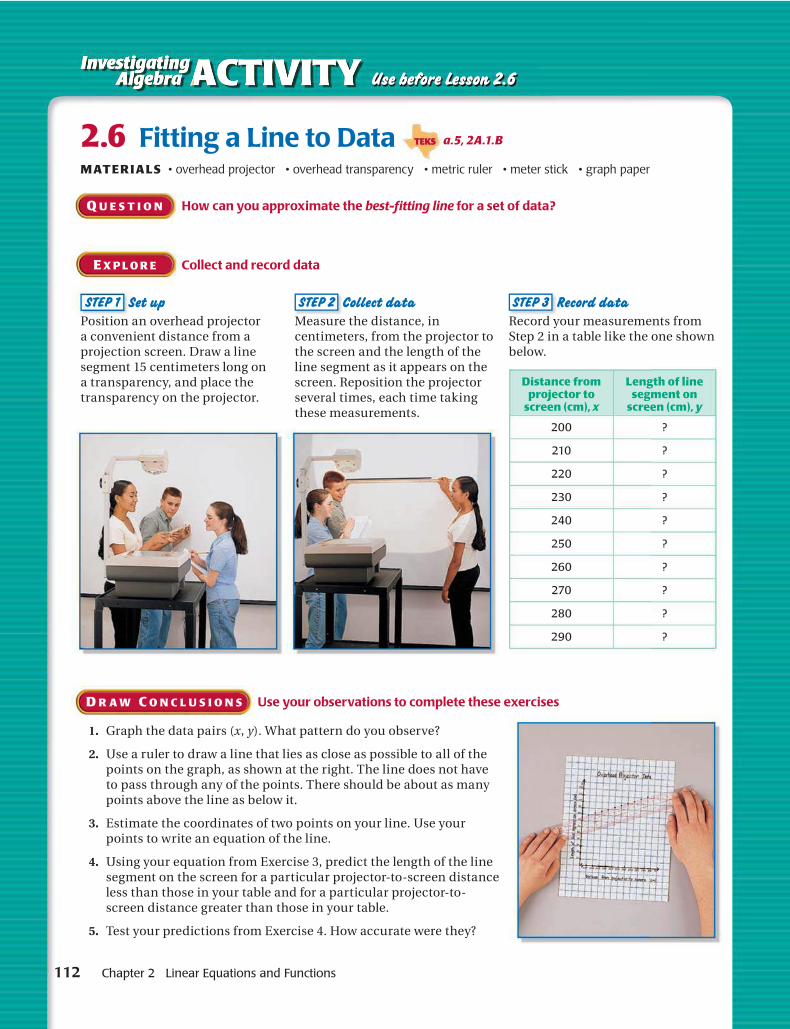
112 Chapter 2 Linear Equations and Functions
Q U E S T I O N How can you approximate the best-fitting line for a set of data?
E X P L O R E Collect and record data
STEP 1 Set up
Position an overhead projector a convenient distance from a projection screen. Draw a line segment 15 centimeters long on a transparency, and place the transparency on the projector.
STEP 2 Collect data
Measure the distance, in centimeters, from the projector to the screen and the length of the line segment as it appears on the screen. Reposition the projector several times, each time taking these measurements.
STEP 3 Record data
Record your measurements from Step 2 in a table like the one shown below.
Distance from projector to
screen (cm), x
Length of line segment on
screen (cm), y
200 ?
210 ?
220 ?
230 ?
240 ?
250 ?
260 ?
270 ?
280 ?
290 ?
D R A W C O N C L U S I O N S Use your observations to complete these exercises
1. Graph the data pairs (x, y). What pattern do you observe?
2. Use a ruler to draw a line that lies as close as possible to all of the points on the graph, as shown at the right. The line does not have to pass through any of the points. There should be about as many points above the line as below it.
3. Estimate the coordinates of two points on your line. Use your points to write an equation of the line.
4. Using your equation from Exercise 3, predict the length of the line segment on the screen for a particular projector-to-screen distance less than those in your table and for a particular projector-to-screen distance greater than those in your table.
5. Test your predictions from Exercise 4. How accurate were they?
Use before Lesson 2.6
2.6 Fitting a Line to Data MATERIALS • overhead projector • overhead transparency • metric ruler • meter stick • graph paper
ACTIVITYACTIVITYInvestigating Algebra
InvestigatingAlgebra
g gg
a.5, 2A.1.BTEKS
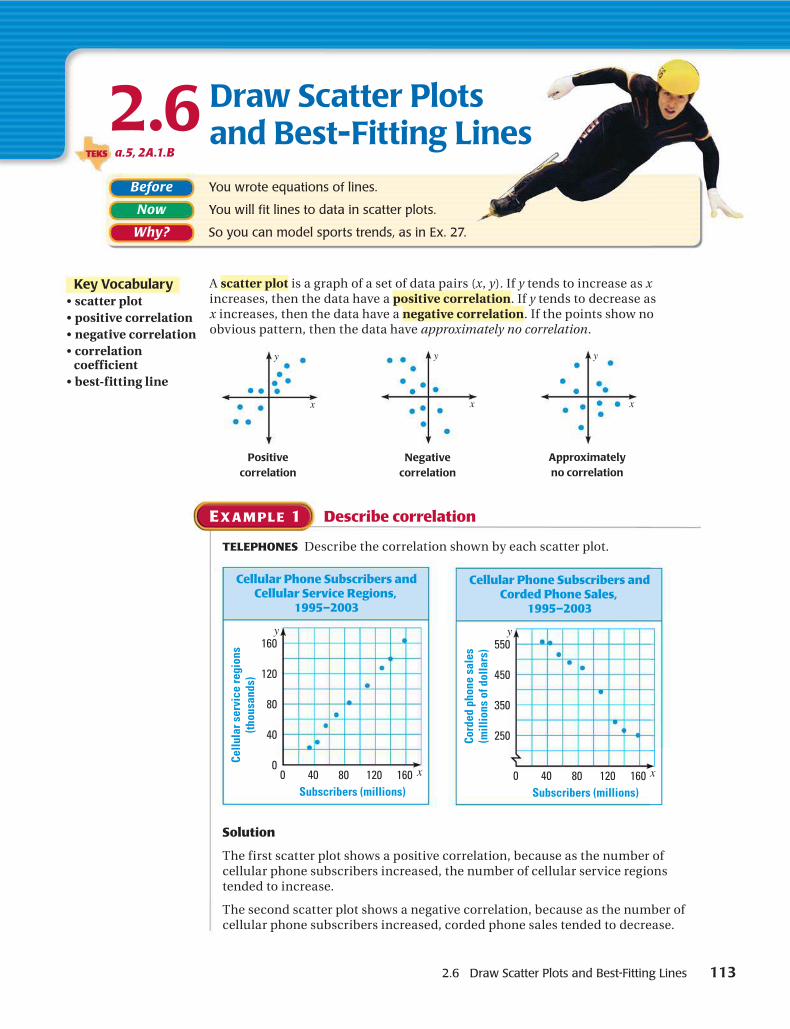
2.6 Draw Scatter Plots and Best-Fitting Lines 113
Draw Scatter Plotsand Best-Fitting Lines2.6
Before You wrote equations of lines.
Now You will fit lines to data in scatter plots.
Why? So you can model sports trends, as in Ex. 27.
Key Vocabulary• scatter plot• positive correlation• negative correlation• correlation
coefficient• best-fitting line
A scatter plot is a graph of a set of data pairs (x, y). If y tends to increase as xincreases, then the data have a positive correlation. If y tends to decrease asx increases, then the data have a negative correlation. If the points show noobvious pattern, then the data have approximately no correlation.
x
y
x
y
x
y
Positivecorrelation
Negativecorrelation
Approximatelyno correlation
E X A M P L E 1 Describe correlation
TELEPHONES Describe the correlation shown by each scatter plot.
Cellular Phone Subscribers andCellular Service Regions,
1995–2003
Subscribers (millions)
Cellu
lar s
ervi
ce re
gion
s(th
ousa
nds)
40 80 160120
160
120
80
40
00 x
y
Cellular Phone Subscribers andCorded Phone Sales,
1995–2003
Subscribers (millions)
Cord
ed p
hone
sal
es(m
illio
ns o
f dol
lars
)
40 80 120 160
550
450
350
250
0 x
y
Solution
The first scatter plot shows a positive correlation, because as the number ofcellular phone subscribers increased, the number of cellular service regionstended to increase.
The second scatter plot shows a negative correlation, because as the number ofcellular phone subscribers increased, corded phone sales tended to decrease.
a.5, 2A.1.BTEKS

114 Chapter 2 Linear Equations and Functions
CORRELATION COEFFICIENTS A correlation coefficient, denoted by r, is a numberfrom 21 to 1 that measures how well a line fits a set of data pairs (x, y). If r is near1, the points lie close to a line with positive slope. If r is near 21, the points lieclose to a line with negative slope. If r is near 0, the points do not lie close toany line.
r 5 0r 5 21 r 5 1
Points lie near line Points do not lie Points lie near line with a negative slope. near any line. with positive slope.
BEST-FITTING LINES If the correlation coefficient for a set of data is near 61, thedata can be reasonably modeled by a line. The best-fitting line is the line that liesas close as possible to all the data points. You can approximate a best-fitting lineby graphing.
E X A M P L E 2 Estimate correlation coefficients
Tell whether the correlation coefficient for the data is closest to 21, 20.5,0, 0.5, or 1.
a.
x
y
2 4 6
150
100
50
00
b.
x
y
2 4 6
150
100
50
00
c.
x
y
2 4 6
150
100
50
00
Solution
a. The scatter plot shows a clear but fairly weak negative correlation. So, ris between 0 and 21, but not too close to either one. The best estimategiven is r 5 20.5. (The actual value is r ø 20.46.)
b. The scatter plot shows approximately no correlation. So, the bestestimate given is r 5 0. (The actual value is r ø 20.02.)
c. The scatter plot shows a strong positive correlation. So, the bestestimate given is r 5 1. (The actual value is r ø 0.98.)
✓ GUIDED PRACTICE for Examples 1 and 2
For each scatter plot, (a) tell whether the data have a positive correlation, anegative correlation, or approximately no correlation, and (b) tell whether thecorrelation coefficient is closest to 21, 20.5, 0, 0.5, or 1.
1.
2 4 60 x
y
100
50
0
2.
2 4 60 x
y
100
50
0
3.
2 4 60 x
y
100
50
0
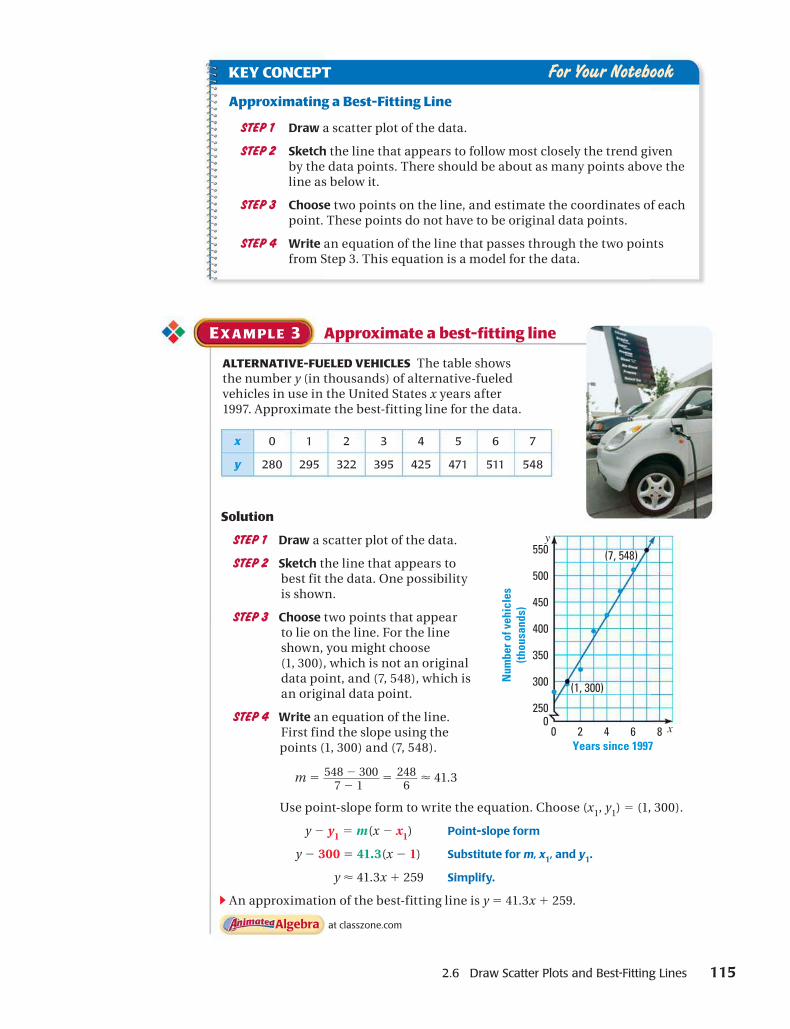
2.6 Draw Scatter Plots and Best-Fitting Lines 115
E X A M P L E 3 Approximate a best-fitting line
ALTERNATIVE-FUELED VEHICLES The table showsthe number y (in thousands) of alternative-fueledvehicles in use in the United States x years after1997. Approximate the best-fitting line for the data.
x 0 1 2 3 4 5 6 7
y 280 295 322 395 425 471 511 548
Solution
STEP 1 Draw a scatter plot of the data.
STEP 2 Sketch the line that appears tobest fit the data. One possibilityis shown.
STEP 3 Choose two points that appearto lie on the line. For the lineshown, you might choose(1, 300), which is not an originaldata point, and (7, 548), which isan original data point.
STEP 4 Write an equation of the line.First find the slope using thepoints (1, 300) and (7, 548).
m 5 548 2 300}
7 2 15 248
}6
ø 41.3
Use point-slope form to write the equation. Choose (x1, y1) 5 (1, 300).
y 2 y1 5 m(x 2 x1) Point-slope form
y 2 300 5 41.3(x 2 1) Substitute for m, x1, and y1.
y ø 41.3x 1 259 Simplify.
c An approximation of the best-fitting line is y 5 41.3x 1 259.
at classzone.com
KEY CONCEPT For Your Notebook
Approximating a Best-Fitting Line
STEP 1 Draw a scatter plot of the data.
STEP 2 Sketch the line that appears to follow most closely the trend givenby the data points. There should be about as many points above theline as below it.
STEP 3 Choose two points on the line, and estimate the coordinates of eachpoint. These points do not have to be original data points.
STEP 4 Write an equation of the line that passes through the two pointsfrom Step 3. This equation is a model for the data.
Years since 1997
Num
ber o
f veh
icle
s(th
ousa
nds)
4 82 6
550
500
450
400
350
300
2500
0 x
y
(1, 300)
(7, 548)
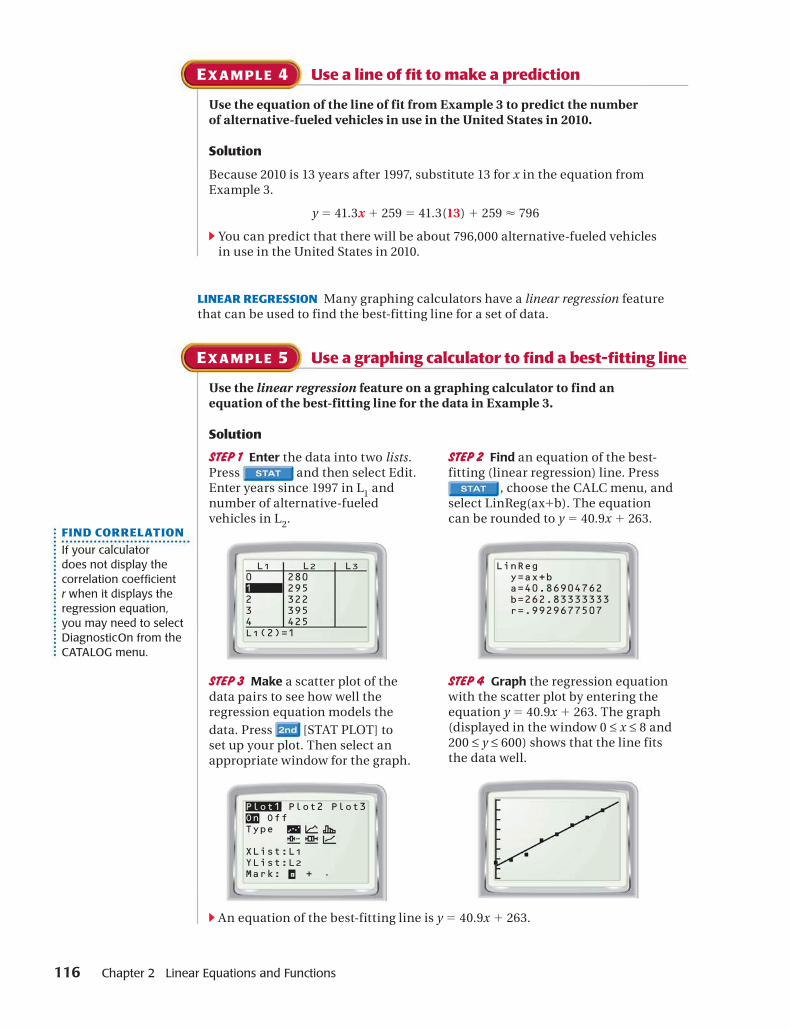
116 Chapter 2 Linear Equations and Functions
E X A M P L E 4 Use a line of fit to make a prediction
Use the equation of the line of fit from Example 3 to predict the numberof alternative-fueled vehicles in use in the United States in 2010.
Solution
Because 2010 is 13 years after 1997, substitute 13 for x in the equation fromExample 3.
y 5 41.3x 1 259 5 41.3(13) 1 259 ø 796
c You can predict that there will be about 796,000 alternative-fueled vehiclesin use in the United States in 2010.
LINEAR REGRESSION Many graphing calculators have a linear regression featurethat can be used to find the best-fitting line for a set of data.
E X A M P L E 5 Use a graphing calculator to find a best-fitting line
Use the linear regression feature on a graphing calculator to find anequation of the best-fitting line for the data in Example 3.
Solution
STEP 1 Enter the data into two lists.Press and then select Edit.Enter years since 1997 in L1 andnumber of alternative-fueledvehicles in L2.
L2280295322395425
L3 L101234L1(2)=1
STEP 2 Find an equation of the best-fitting (linear regression) line. Press
, choose the CALC menu, andselect LinReg(ax1b). The equationcan be rounded to y 5 40.9x 1 263.
LinReg y=ax+b a=40.86904762 b=262.83333333 r=.9929677507
STEP 3 Make a scatter plot of thedata pairs to see how well theregression equation models thedata. Press [STAT PLOT] toset up your plot. Then select anappropriate window for the graph.
Plot1 Plot2 Plot3On OffType
XList:L1YList:L2Mark: +
STEP 4 Graph the regression equationwith the scatter plot by entering theequation y 5 40.9x 1 263. The graph(displayed in the window 0 ≤ x ≤ 8 and200 ≤ y ≤ 600) shows that the line fitsthe data well.
c An equation of the best-fitting line is y 5 40.9x 1 263.
FIND CORRELATION
If your calculatordoes not display thecorrelation coeffi cientr when it displays theregression equation,you may need to selectDiagnosticOn from theCATALOG menu.
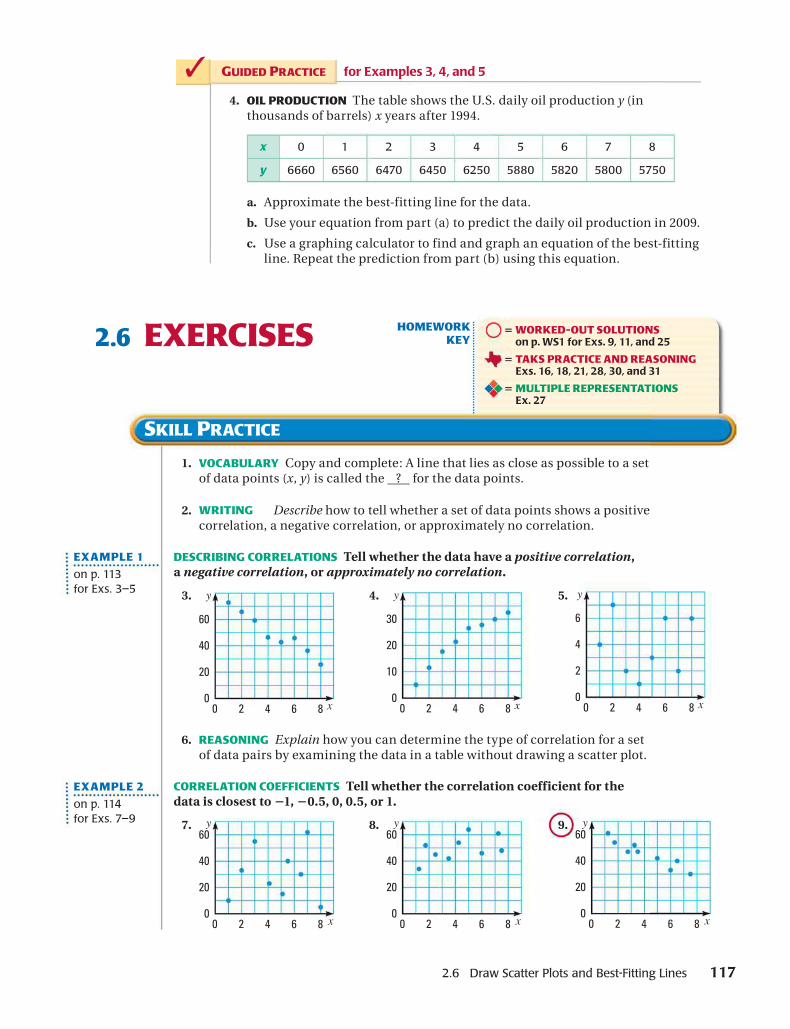
2.6 Draw Scatter Plots and Best-Fitting Lines 117
GUIDED PRACTICE for Examples 3, 4, and 5
4. OIL PRODUCTION The table shows the U.S. daily oil production y (inthousands of barrels) x years after 1994.
x 0 1 2 3 4 5 6 7 8
y 6660 6560 6470 6450 6250 5880 5820 5800 5750
a. Approximate the best-fitting line for the data.
b. Use your equation from part (a) to predict the daily oil production in 2009.
c. Use a graphing calculator to find and graph an equation of the best-fittingline. Repeat the prediction from part (b) using this equation.
✓
EXAMPLE 1
on p. 113for Exs. 3–5
EXAMPLE 2
on p. 114for Exs. 7–9
1. VOCABULARY Copy and complete: A line that lies as close as possible to a setof data points (x, y) is called the ? for the data points.
2. Describe how to tell whether a set of data points shows a positivecorrelation, a negative correlation, or approximately no correlation.
DESCRIBING CORRELATIONS Tell whether the data have a positive correlation,a negative correlation, or approximately no correlation.
3.
x
y
2 4 6 8
60
40
20
00
4.
x
y
2 4 6 8
30
20
10
00
5.
x
y
2 4 6 8
6
4
2
00
6. REASONING Explain how you can determine the type of correlation for a setof data pairs by examining the data in a table without drawing a scatter plot.
CORRELATION COEFFICIENTS Tell whether the correlation coefficient for thedata is closest to 21, 20.5, 0, 0.5, or 1.
7.
2 4 6 80 x
y60
40
20
0
8.
2 4 6 80 x
y60
40
20
0
9.
2 4 6 80 x
y60
40
20
0
2.6 EXERCISES
WRITING
HOMEWORKKEY
5 WORKED-OUT SOLUTIONSon p. WS1 for Exs. 9, 11, and 25
5 TAKS PRACTICE AND REASONINGExs. 16, 18, 21, 28, 30, and 31
5 MULTIPLE REPRESENTATIONSEx. 27
SKILL PRACTICE
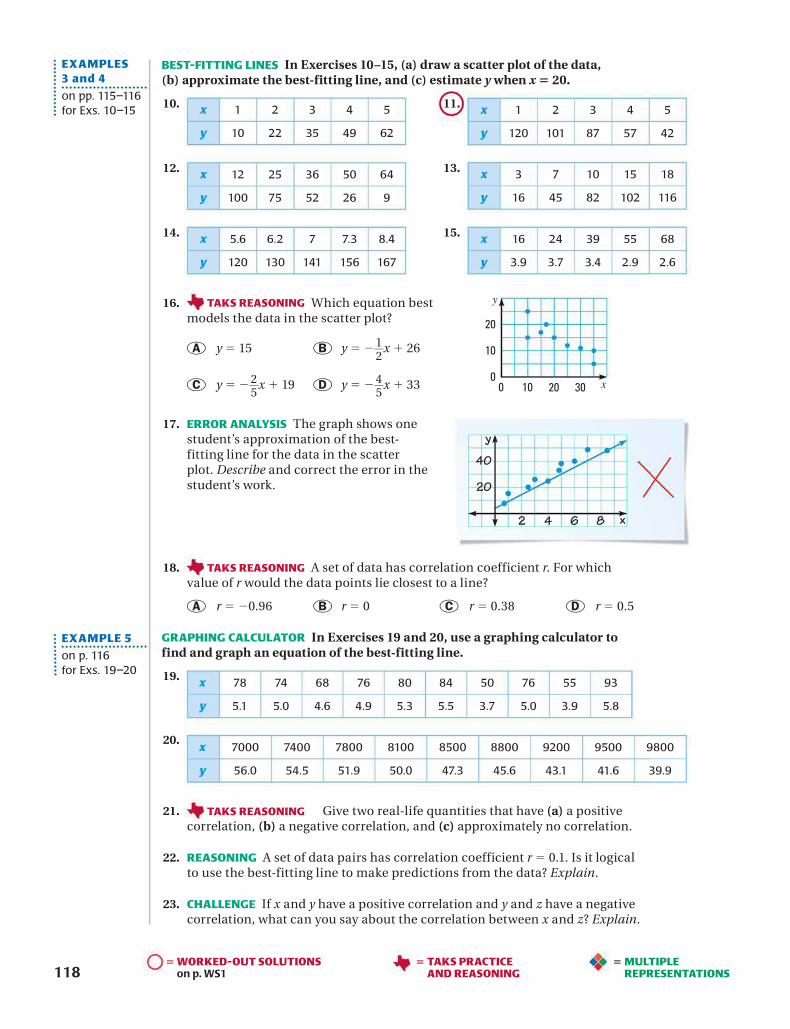
1185 MULTIPLE
REPRESENTATIONS
BEST-FITTING LINES In Exercises 10–15, (a) draw a scatter plot of the data,(b) approximate the best-fitting line, and (c) estimate y when x 5 20.
10. x 1 2 3 4 5
y 10 22 35 49 62
11. x 1 2 3 4 5
y 120 101 87 57 42
12. x 12 25 36 50 64
y 100 75 52 26 9
13. x 3 7 10 15 18
y 16 45 82 102 116
14. x 5.6 6.2 7 7.3 8.4
y 120 130 141 156 167
15. x 16 24 39 55 68
y 3.9 3.7 3.4 2.9 2.6
16. Which equation beste scatter plot?
A y 5 15 B y 5 21}2
x 1 26
C y 5 22}5
x 1 19 D y 5 24}5
x 1 33
17. ERROR ANALYSIS The graph shows onestudent’s approximation of the best-fitting line for the data in the scatterplot. Describe and correct the error in thestudent’s work.
18. ★ A set of data has correlation coefficient r. For whichvalue of r would the data points lie closest to a line?
A r 5 20.96 B r 5 0 C r 5 0.38 D r 5 0.5
GRAPHING CALCULATOR In Exercises 19 and 20, use a graphing calculator tofind and graph an equation of the best-fitting line.
19. x 78 74 68 76 80 84 50 76 55 93
y 5.1 5.0 4.6 4.9 5.3 5.5 3.7 5.0 3.9 5.8
20.x 7000 7400 7800 8100 8500 8800 9200 9500 9800
y 56.0 54.5 51.9 50.0 47.3 45.6 43.1 41.6 39.9
21. Give two real-life quantities that have (a) a positivecorrelation, (b) a negative correlation, and (c) approximately no correlation.
22. REASONING A set of data pairs has correlation coefficient r 5 0.1. Is it logicalto use the best-fitting line to make predictions from the data? Explain.
23. CHALLENGE If x and y have a positive correlation and y and z have a negativecorrelation, what can you say about the correlation between x and z? Explain.
EXAMPLES3 and 4
on pp. 115–116for Exs. 10–15
10 20 300 x
y
20
10
0
5 WORKED-OUT SOLUTIONSon p. WS1
EXAMPLE 5
on p. 116for Exs. 19–20
2 4 6 8
40
20
x
y
5 TAKS PRACTICEAND REASONING
TAKS REASONING models the data in th
TAKS REASONING
TAKS REASONING
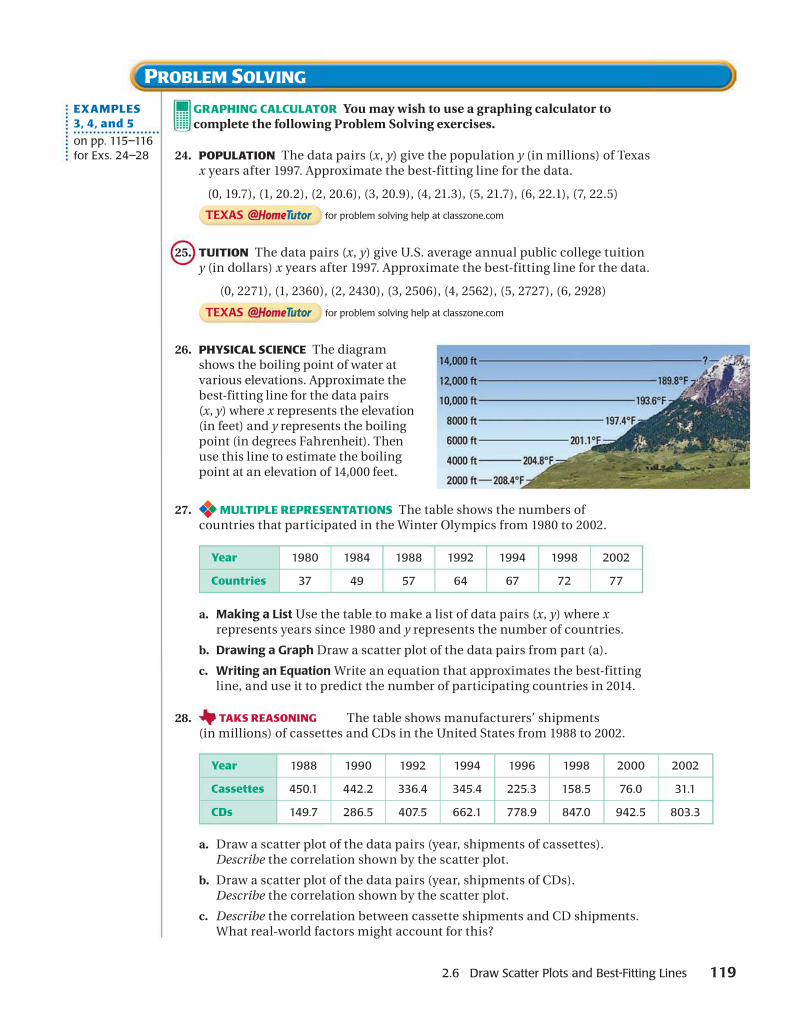
2.6 Draw Scatter Plots and Best-Fitting Lines 119
GRAPHING CALCULATOR You may wish to use a graphing calculator tocomplete the following Problem Solving exercises.
24. POPULATION The data pairs (x, y) give the population y (in millions) of Texasx years after 1997. Approximate the best-fitting line for the data.
(0, 19.7), (1, 20.2), (2, 20.6), (3, 20.9), (4, 21.3), (5, 21.7), (6, 22.1), (7, 22.5)
25. TUITION The data pairs (x, y) give U.S. average annual public college tuitiony (in dollars) x years after 1997. Approximate the best-fitting line for the data.
(0, 2271), (1, 2360), (2, 2430), (3, 2506), (4, 2562), (5, 2727), (6, 2928)
26. PHYSICAL SCIENCE The diagramshows the boiling point of water atvarious elevations. Approximate thebest-fitting line for the data pairs(x, y) where x represents the elevation(in feet) and y represents the boilingpoint (in degrees Fahrenheit). Thenuse this line to estimate the boilingpoint at an elevation of 14,000 feet.
27. MULTIPLE REPRESENTATIONS The table shows the numbers ofcountries that participated in the Winter Olympics from 1980 to 2002.
Year 1980 1984 1988 1992 1994 1998 2002
Countries 37 49 57 64 67 72 77
a. Making a List Use the table to make a list of data pairs (x, y) where xrepresents years since 1980 and y represents the number of countries.
b. Drawing a Graph Draw a scatter plot of the data pairs from part (a).
c. Writing an Equation Write an equation that approximates the best-fittingline, and use it to predict the number of participating countries in 2014.
28. The table shows manufacturers’ shipments(in millions) of cassettes and CDs in the United States from 1988 to 2002.
Year 1988 1990 1992 1994 1996 1998 2000 2002
Cassettes 450.1 442.2 336.4 345.4 225.3 158.5 76.0 31.1
CDs 149.7 286.5 407.5 662.1 778.9 847.0 942.5 803.3
a. Draw a scatter plot of the data pairs (year, shipments of cassettes).Describe the correlation shown by the scatter plot.
b. Draw a scatter plot of the data pairs (year, shipments of CDs).Describe the correlation shown by the scatter plot.
c. Describe the correlation between cassette shipments and CD shipments.What real-world factors might account for this?
EXAMPLES3, 4, and 5
on pp. 115–116for Exs. 24–28
PROBLEM SOLVING
TAKS REASONING

120
QUIZ for Lessons 2.4–2.6
29. CHALLENGE Data from some countries in North America show a positivecorrelation between the average life expectancy in a country and thenumber of personal computers per capita in that country.
a. Make a conjecture about the reason for the positive correlation betweenlife expectancy and number of personal computers per capita.
b. Is it reasonable to conclude from the data that giving residents of acountry more personal computers will lengthen their lives? Explain.
Write an equation of the line that satisfies the given conditions. (p. 98)
1. m 5 25, b 5 3 2. m 5 2, b 5 12
3. m 5 4, passes through (23, 6) 4. m 5 27, passes through (1, 24)
5. passes through (0, 7) and (23, 22) 6. passes through (29, 9) and (29, 0)
Write and graph a direct variation equation that has the given ordered pair as asolution. (p. 107)
7. (1, 2) 8. (22, 8) 9. (5, 216) 10. (12, 4)
The variables x and y vary directly. Write an equation that relates x and y. Thenfind y when x 5 8. (p. 107)
11. x 5 4, y 5 12 12. x 5 23, y 5 28 13. x 5 40, y 5 25 14. x 5 12, y 5 2
15. CONCERT TICKETS The table shows the average price of a concert ticket toone of the top 50 musical touring acts for the years 1999–2004. Write anequation that approximates the best-fitting line for the data pairs (x, y). Usethe equation to predict the average price of a ticket in 2010. (p. 113)
Years since 1999, x 0 1 2 3 4 5
Ticket price (dollars), y 38.56 44.80 46.69 50.81 51.81 58.71
EXTRA PRACTICE for Lesson 2.6, p. 1011 ONLINE QUIZ at classzone.com
30. TAKS PRACTICE Ted is planting flowers in a rectangular garden. Thelength of the garden is 55 feet and the perimeter is 150 feet. What is the areaof the garden? TAKS Obj. 10
A 900 ft2 B 1100 ft2 C 1800 ft2 D 2025 ft2
31. TAKS PRACTICE What is they-intercept of the line shown?TAKS Obj. 3
F 22}3 G 2
}3
H 2 J 3
MIXED REVIEW FOR TAKSTAKS PRACTICE at classzone.com
x
y
1212223 2 3 5
1
34
222324
REVIEW
TAKS Preparationp. 66;TAKS Workbook
REVIEW
Lesson 2.3;TAKS Workbook
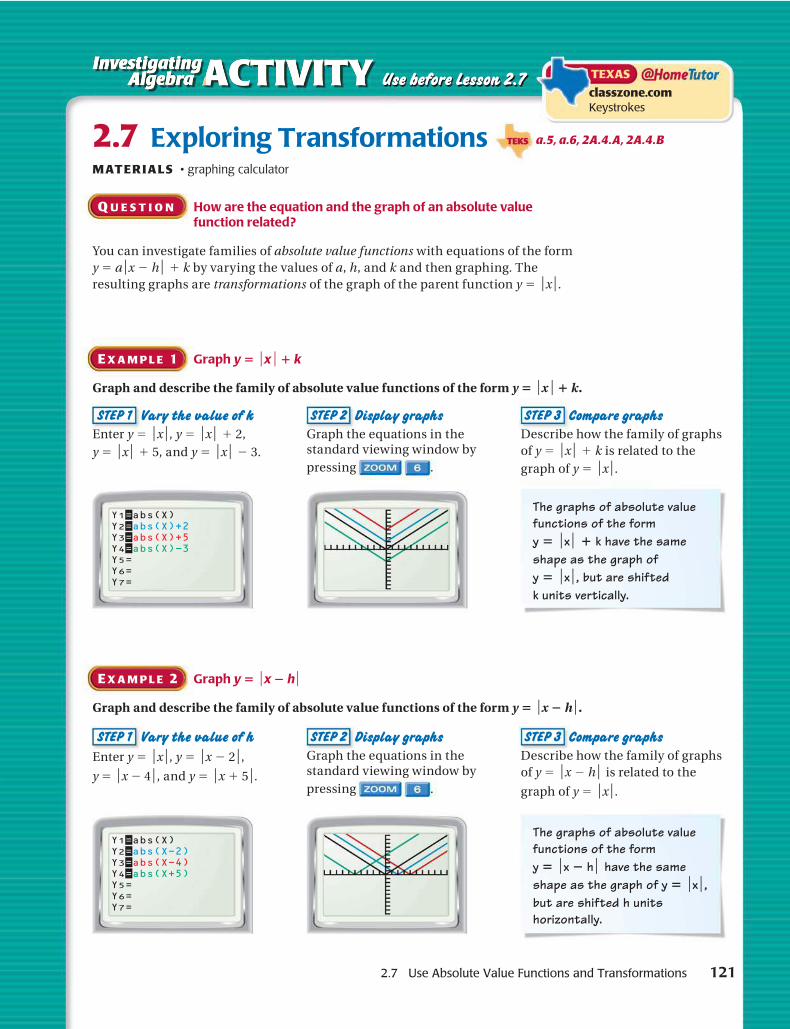
2.7 Use Absolute Value Functions and Transformations 121
Q U E S T I O N How are the equation and the graph of an absolute valuefunction related?
You can investigate families of absolute value functions with equations of the formy 5 a⏐x 2 h⏐ 1 k by varying the values of a, h, and k and then graphing. Theresulting graphs are transformations of the graph of the parent function y 5 ⏐x⏐.
E X A M P L E 1 Graph y 5 ⏐x⏐1 k
Graph and describe the family of absolute value functions of the form y 5 ⏐x⏐1 k.
E X A M P L E 2 Graph y 5 ⏐x 2 h⏐
Graph and describe the family of absolute value functions of the form y 5 ⏐x 2 h⏐.
ACTIVITYACTIVITYInvestigating Algebra
InvestigatingAlgebra
g gg
STEP 1 Vary the value of k
Enter y 5 ⏐x⏐, y 5 ⏐x⏐ 1 2,y 5 ⏐x⏐ 1 5, and y 5 ⏐x⏐ 2 3.
STEP 2 Display graphs
Graph the equations in thestandard viewing window bypressing .
STEP 3 Compare graphs
Describe how the family of graphsof y 5 ⏐x⏐ 1 k is related to thegraph of y 5 ⏐x⏐.
Y1=abs(X)Y2=abs(X)+2Y3=abs(X)+5Y4=abs(X)-3Y5=Y6=Y7=
The graphs of absolute valuefunctions of the formy 5 ⏐x⏐ 1 k have the sameshape as the graph ofy 5 ⏐x⏐, but are shiftedk units vertically.
STEP 1 Vary the value of h
Enter y 5 ⏐x⏐, y 5 ⏐x 2 2⏐,
y 5 ⏐x 2 4⏐, and y 5 ⏐x 1 5⏐.
STEP 2 Display graphs
Graph the equations in thestandard viewing window bypressing .
STEP 3 Compare graphs
Describe how the family of graphsof y 5 ⏐x 2 h⏐ is related to the
graph of y 5 ⏐x⏐.
Y1=abs(X)Y2=abs(X-2)Y3=abs(X-4)Y4=abs(X+5)Y5=Y6=Y7=
The graphs of absolute valuefunctions of the formy 5 ⏐x 2 h⏐ have the sameshape as the graph of y 5 ⏐x⏐,but are shifted h unitshorizontally.
Use before Lesson 2.7
2.7 Exploring TransformationsMATERIALS • graphing calculator
a.5, a.6, 2A.4.A, 2A.4.BTEKS
TEXAS
classzone.com Keystrokes
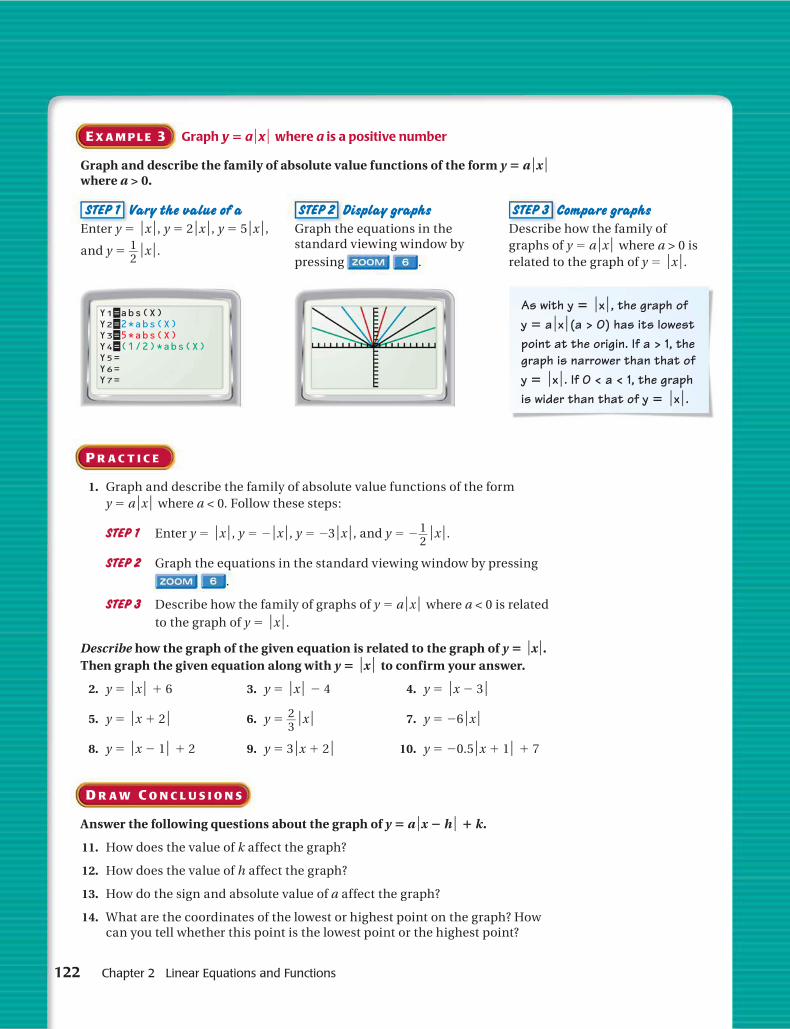
122 Chapter 2 Linear Equations and Functions
E X A M P L E 3 Graph y 5 a⏐x⏐ where a is a positive number
Graph and describe the family of absolute value functions of the form y 5 a⏐x⏐where a > 0.
STEP 1 Vary the value of a
Enter y 5 ⏐x⏐, y 5 2⏐x⏐, y 5 5⏐x⏐,
and y 5 1}2⏐x⏐.
STEP 2 Display graphs
Graph the equations in thestandard viewing window bypressing .
STEP 3 Compare graphs
Describe how the family ofgraphs of y 5 a⏐x⏐ where a > 0 isrelated to the graph of y 5 ⏐x⏐.
P R A C T I C E
1. Graph and describe the family of absolute value functions of the formy 5 a⏐x⏐ where a < 0. Follow these steps:
STEP 1 Enter y 5 ⏐x⏐, y 5 2⏐x⏐, y 5 23⏐x⏐, and y 5 21}2⏐x⏐.
STEP 2 Graph the equations in the standard viewing window by pressing.
STEP 3 Describe how the family of graphs of y 5 a⏐x⏐ where a < 0 is relatedto the graph of y 5 ⏐x⏐.
Describe how the graph of the given equation is related to the graph of y 5 ⏐x⏐.Then graph the given equation along with y 5 ⏐x⏐ to confirm your answer.
2. y 5 ⏐x⏐ 1 6 3. y 5 ⏐x⏐ 2 4 4. y 5 ⏐x 2 3⏐
5. y 5 ⏐x 1 2⏐ 6. y 5 2}3⏐x⏐ 7. y 5 26⏐x⏐
8. y 5 ⏐x 2 1⏐ 1 2 9. y 5 3⏐x 1 2⏐ 10. y 5 20.5⏐x 1 1⏐ 1 7
D R A W C O N C L U S I O N S
Answer the following questions about the graph of y 5 a⏐x 2 h⏐ 1 k.
11. How does the value of k affect the graph?
12. How does the value of h affect the graph?
13. How do the sign and absolute value of a affect the graph?
14. What are the coordinates of the lowest or highest point on the graph? Howcan you tell whether this point is the lowest point or the highest point?
Y1=abs(X)Y2=2*abs(X)Y3=5*abs(X)Y4=(1/2)*abs(X)Y5=Y6=Y7=
As with y 5 ⏐x⏐, the graph ofy 5 a⏐x⏐(a > 0) has its lowestpoint at the origin. If a > 1, thegraph is narrower than that ofy 5 ⏐x⏐. If 0 < a < 1, the graphis wider than that of y 5 ⏐x⏐.
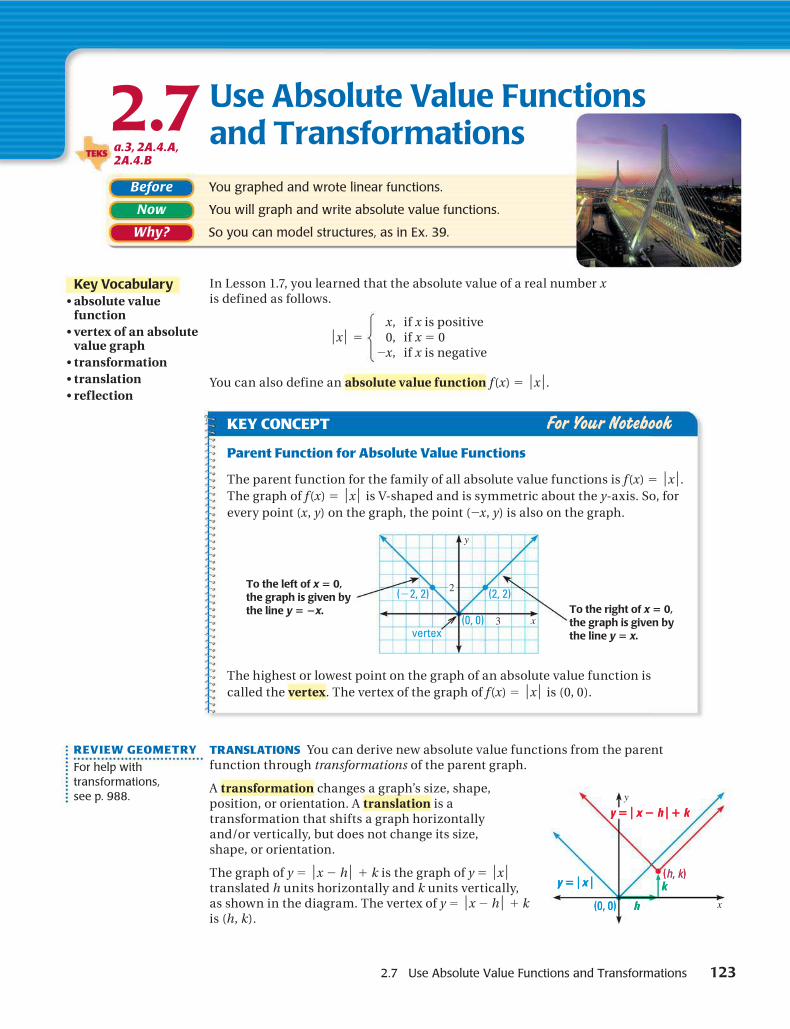
2.7 Use Absolute Value Functions and Transformations 123
In Lesson 1.7, you learned that the absolute value of a real number xis defined as follows.
x, if x is positive⏐x⏐ 5 0, if x 5 0
2x, if x is negative
You can also define an absolute value function f(x) 5 ⏐x⏐.
2.7 Before You graphed and wrote linear functions.
Now You will graph and write absolute value functions.
Why? So you can model structures, as in Ex. 39.
Key Vocabulary• absolute value
function• vertex of an absolute
value graph• transformation• translation• reflection
TRANSLATIONS You can derive new absolute value functions from the parentfunction through transformations of the parent graph.
A transformation changes a graph’s size, shape,position, or orientation. A translation is atransformation that shifts a graph horizontallyand/or vertically, but does not change its size,shape, or orientation.
The graph of y 5 ⏐x 2 h⏐ 1 k is the graph of y 5 ⏐x⏐translated h units horizontally and k units vertically,as shown in the diagram. The vertex of y 5 ⏐x 2 h⏐ 1 kis (h, k).
x
y
(0, 0)(0, 0)
(h, k)(h, k)
y 5 z x 2 h z 1 ky 5 z x 2 h z 1 k
y 5 z x zy 5 z x z kk
hh
KEY CONCEPT For Your Notebook
Parent Function for Absolute Value Functions
The parent function for the family of all absolute value functions is f(x) 5 ⏐x⏐.The graph of f(x) 5 ⏐x⏐ is V-shaped and is symmetric about the y-axis. So, forevery point (x, y) on the graph, the point (2x, y) is also on the graph.
The highest or lowest point on the graph of an absolute value function iscalled the vertex. The vertex of the graph of f(x) 5 ⏐x⏐ is (0, 0).
x
y
3
2(22, 2) (2, 2)
(0, 0)vertex
To the right of x 5 0,the graph is given bythe line y 5 x.
To the left of x 5 0,the graph is given bythe line y 5 2x.
Use Absolute Value Functionsand Transformations
REVIEW GEOMETRY
For help withtransformations,see p. 988.
a.3, 2A.4.A,2A.4.B
TEKS

124 Chapter 2 Linear Equations and Functions
E X A M P L E 1 Graph a function of the form y 5 ⏐x 2 h⏐ 1 k
Graph y 5 ⏐x 1 4⏐ 2 2. Compare the graph with the graph of y 5 ⏐x⏐.
Solution
STEP 1 Identify and plot the vertex,(h, k) 5 (24, 22).
STEP 2 Plot another point on the graph,such as (22, 0). Use symmetry toplot a third point, (26, 0).
STEP 3 Connect the points with a V-shapedgraph.
STEP 4 Compare with y 5 ⏐x⏐. The graph of y 5 ⏐x 1 4⏐ 2 2 is the graph ofy 5 ⏐x⏐ translated down 2 units and left 4 units.
x
y
24
(24, 22)
y 5 z x 1 4 z 2 2
y 5 z x z
22
24
21
E X A M P L E 2 Graph functions of the form y 5 a⏐x⏐
Graph (a) y 5 1}2⏐x⏐ and (b) y 5 23⏐x⏐. Compare each graph with the graph
of y 5 ⏐x⏐.
Solution
a. The graph of y 5 1}2⏐x⏐ is the graph of
y 5 ⏐x⏐ vertically shrunk by a factor
of 1}2
. The graph has vertex (0, 0) and
passes through (24, 2) and (4, 2).
b. The graph of y 5 23⏐x⏐ is thegraph of y 5 ⏐x⏐ verticallystretched by a factor of 3 andthen reflected in the x-axis. Thegraph has vertex (0, 0) and passesthrough (21, 23) and (1, 23).
x
y
1
2
y 5 z x z
y 5 z x z12
x
y
1
2y 5 z x z
y 5 23 z x z
STRETCHES, SHRINKS, AND REFLECTIONS When ⏐a⏐ ? 1, the graph of y 5 a⏐x⏐ is avertical stretch or a vertical shrink of the graph of y 5 ⏐x⏐, depending on whether⏐a⏐ is less than or greater than 1.
When a 5 21, the graph of y 5 a⏐x⏐ is a reflection in the x-axis of the graph ofy 5 ⏐x⏐. When a < 0 but a ? 21, the graph of y 5 a⏐x⏐ is a vertical stretch or shrinkwith a reflection in the x-axis of the graph of y 5 ⏐x⏐.
For ⏐a⏐ > 1 For ⏐a⏐ < 1
• The graph is vertically stretched, orelongated.
• The graph of y 5 a⏐x⏐ is narrower than
the graph of y 5 ⏐x⏐.
• The graph is vertically shrunk, orcompressed.
• The graph of y 5 a⏐x⏐ is wider than the
graph of y 5 ⏐x⏐.
INTERPRETFUNCTIONS
To identify thevertex, rewrite thegiven function as
y 5 ⏐x 2 (24)⏐ 1 (22).
So, h 5 24 and k 5 22.The vertex is (24, 22).
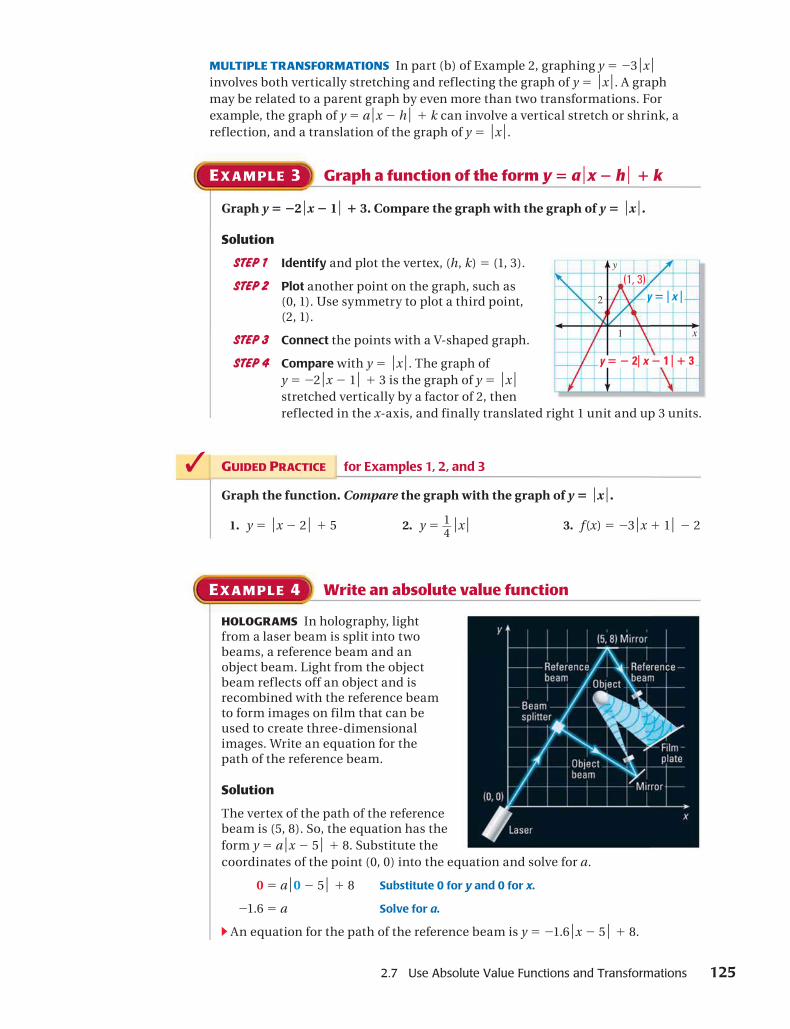
2.7 Use Absolute Value Functions and Transformations 125
✓ GUIDED PRACTICE for Examples 1, 2, and 3
Graph the function. Compare the graph with the graph of y 5 ⏐x⏐.
1. y 5 ⏐x 2 2⏐ 1 5 2. y 5 1}4⏐x⏐ 3. f(x) 5 23⏐x 1 1⏐ 2 2
HOLOGRAMS In holography, lightfrom a laser beam is split into twobeams, a reference beam and anobject beam. Light from the objectbeam reflects off an object and isrecombined with the reference beamto form images on film that can beused to create three-dimensionalimages. Write an equation for thepath of the reference beam.
Solution
The vertex of the path of the referencebeam is (5, 8). So, the equation has theform y 5 a⏐x 2 5⏐ 1 8. Substitute thecoordinates of the point (0, 0) into the equation and solve for a.
0 5 a⏐0 2 5⏐ 1 8 Substitute 0 for y and 0 for x.
21.6 5 a Solve for a.
c An equation for the path of the reference beam is y 5 21.6⏐x 2 5⏐ 1 8.
E X A M P L E 4 Write an absolute value function
MULTIPLE TRANSFORMATIONS In part (b) of Example 2, graphing y 5 23⏐x⏐involves both vertically stretching and reflecting the graph of y 5 ⏐x⏐. A graphmay be related to a parent graph by even more than two transformations. Forexample, the graph of y 5 a⏐x 2 h⏐ 1 k can involve a vertical stretch or shrink, areflection, and a translation of the graph of y 5 ⏐x⏐.
E X A M P L E 3 Graph a function of the form y 5 a⏐x 2 h⏐ 1 k
Graph y 5 22⏐x 2 1⏐ 1 3. Compare the graph with the graph of y 5 ⏐x⏐.
Solution
STEP 1 Identify and plot the vertex, (h, k) 5 (1, 3).
STEP 2 Plot another point on the graph, such as(0, 1). Use symmetry to plot a third point,(2, 1).
STEP 3 Connect the points with a V-shaped graph.
STEP 4 Compare with y 5 ⏐x⏐. The graph ofy 5 22⏐x 2 1⏐ 1 3 is the graph of y 5 ⏐x⏐stretched vertically by a factor of 2, thenreflected in the x-axis, and finally translated right 1 unit and up 3 units.
x
y
1
2 y 5 z x z
y 5 2 2z x 2 1 z 1 3
(1, 3)

126 Chapter 2 Linear Equations and Functions
E X A M P L E 5 Apply transformations to a graph
The graph of a function y 5 f(x) is shown.Sketch the graph of the given function.
a. y 5 2 p f(x)
b. y 5 2f(x 1 2) 1 1
Solution
a. The graph of y 5 2 p f(x) is the b. The graph of y 5 2f(x 1 2) 1 1 isgraph of y 5 f(x) stretched the graph of y 5 f(x) reflected invertically by a factor of 2. (There the x-axis, then translated leftis no reflection or translation.) 2 units and up 1 unit. To drawTo draw the graph, multiply the the graph, first reflect the labeledy-coordinate of each labeled points and connect their images.point on the graph of y 5 f(x) Then translate and connect theseby 2 and connect their images. points to form the final image.
TRANSFORMATIONS OF ANY GRAPH You can perform transformations on thegraph of any function f in the same way as for absolute value graphs.
✓ GUIDED PRACTICE for Examples 4 and 5
4. WHAT IF? In Example 4, suppose the reference beam originates at (3, 0) andreflects off a mirror at (5, 4). Write an equation for the path of the beam.
Use the graph of y 5 f(x) from Example 5 to graph the given function.
5. y 5 0.5 p f(x) 6. y 5 2f(x 2 2) 2 5 7. y 5 2 p f(x 1 3) 2 1
x
y
3
1
(2, 3) (5, 3)
(0, 0)
x
y
3
1
(2, 3) (5, 3)
(0, 0)(0, 0)
(2, 6) (5, 6)
x
y
2
1
(2, 3) (5, 3)
(22, 1)
(0, 22)(2, 23) (5, 23)
(3, 22)
AVOID ERRORS
In Example 5,part (b), the valueof h is 22 because2f (x 1 2) 1 1 5
2f (x 2 (22)) 1 1.Because 22 < 0, thehorizontal translation isto the left.
KEY CONCEPT For Your Notebook
Transformations of General Graphs
The graph of y 5 a p f(x 2 h) 1 k can be obtained from the graph of anyfunction y 5 f(x) by performing these steps:
STEP 1 Stretch or shrink the graph of y 5 f(x) vertically by a factor of ⏐a⏐ if⏐a⏐ ? 1. If ⏐a⏐ > 1, stretch the graph. If ⏐a⏐ < 1, shrink the graph.
STEP 2 Reflect the resulting graph from Step 1 in the x-axis if a < 0.
STEP 3 Translate the resulting graph from Step 2 horizontally h units andvertically k units.
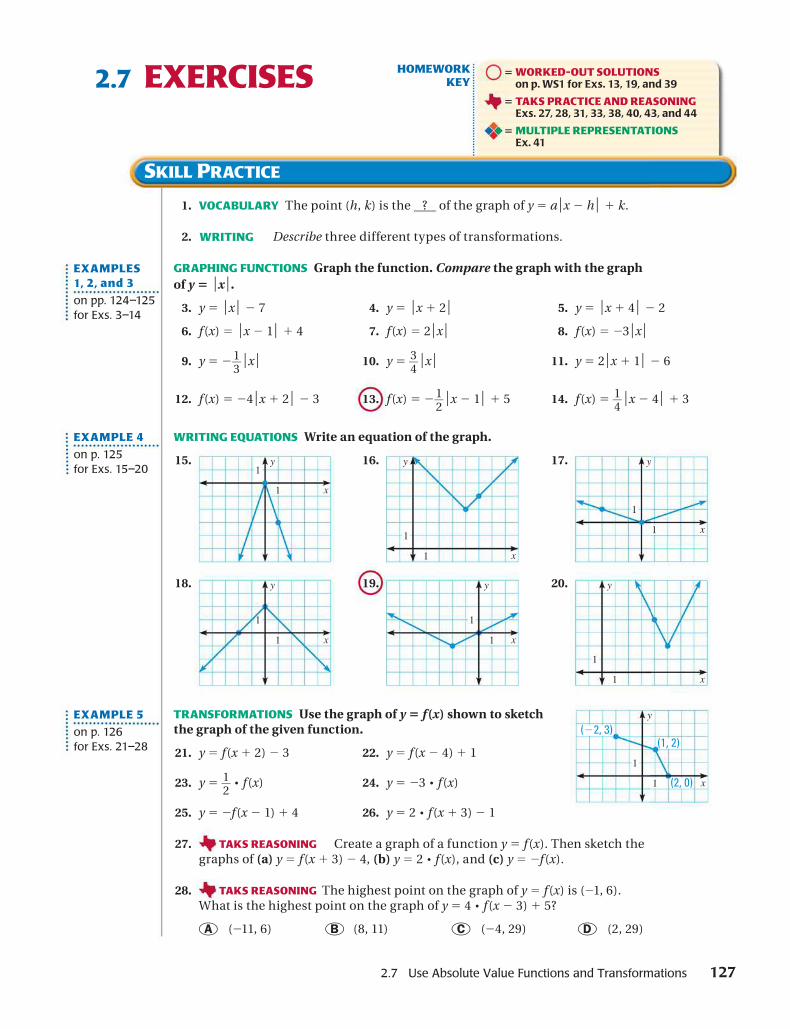
WRITING
2.7 Use Absolute Value Functions and Transformations 127
2.7 EXERCISES
1. VOCABULARY The point (h, k) is the ? of the graph of y 5 a⏐x 2 h⏐ 1 k.
2. Describe three different types of transformations.
GRAPHING FUNCTIONS Graph the function. Compare the graph with the graphof y 5 ⏐x⏐.
3. y 5 ⏐x⏐ 2 7 4. y 5 ⏐x 1 2⏐ 5. y 5 ⏐x 1 4⏐ 2 2
6. f(x) 5 ⏐x 2 1⏐ 1 4 7. f(x) 5 2⏐x⏐ 8. f(x) 5 23⏐x⏐
9. y 5 21}3⏐x⏐ 10. y 5 3
}4⏐x⏐ 11. y 5 2⏐x 1 1⏐ 2 6
12. f(x) 5 24⏐x 1 2⏐ 2 3 13. f(x) 5 21}2⏐x 2 1⏐ 1 5 14. f(x) 5 1
}4⏐x 2 4⏐ 1 3
WRITING EQUATIONS Write an equation of the graph.
15.
x
y
1
116.
x
y
1
1
17.
x
y
1
1
18.
x
y
1
1
19.
x
y
1
1
20.
x
y
1
1
TRANSFORMATIONS Use the graph of y 5 f(x) shown to sketchthe graph of the given function.
21. y 5 f(x 1 2) 2 3 22. y 5 f(x 2 4) 1 1
23. y 5 1}2p f(x) 24. y 5 23 p f(x)
25. y 5 2f(x 2 1) 1 4 26. y 5 2 p f(x 1 3) 2 1
27. Create a graph of a function y 5 f(x). Then sketch thegraphs of (a) y 5 f(x 1 3) 2 4, (b) y 5 2 p f(x), and (c) y 5 2f(x).
28. The highest point on the graph of y 5 f(x) is (21, 6).What is the highest point on the graph of y 5 4 p f(x 2 3) 1 5?
A (211, 6) B (8, 11) C (24, 29) D (2, 29)
EXAMPLE 4
on p. 125for Exs. 15–20
EXAMPLE 5
on p. 126for Exs. 21–28
EXAMPLES1, 2, and 3
on pp. 124–125for Exs. 3–14
x
y
1
1
(22, 3)(1, 2)
(2, 0)
HOMEWORKKEY
5 WORKED-OUT SOLUTIONSon p. WS1 for Exs. 13, 19, and 39
5 TAKS PRACTICE AND REASONINGExs. 27, 28, 31, 33, 38, 40, 43, and 44
5 MULTIPLE REPRESENTATIONSEx. 41
SKILL PRACTICE
N TAKS REASO NGI
TAKS REASO NG NI
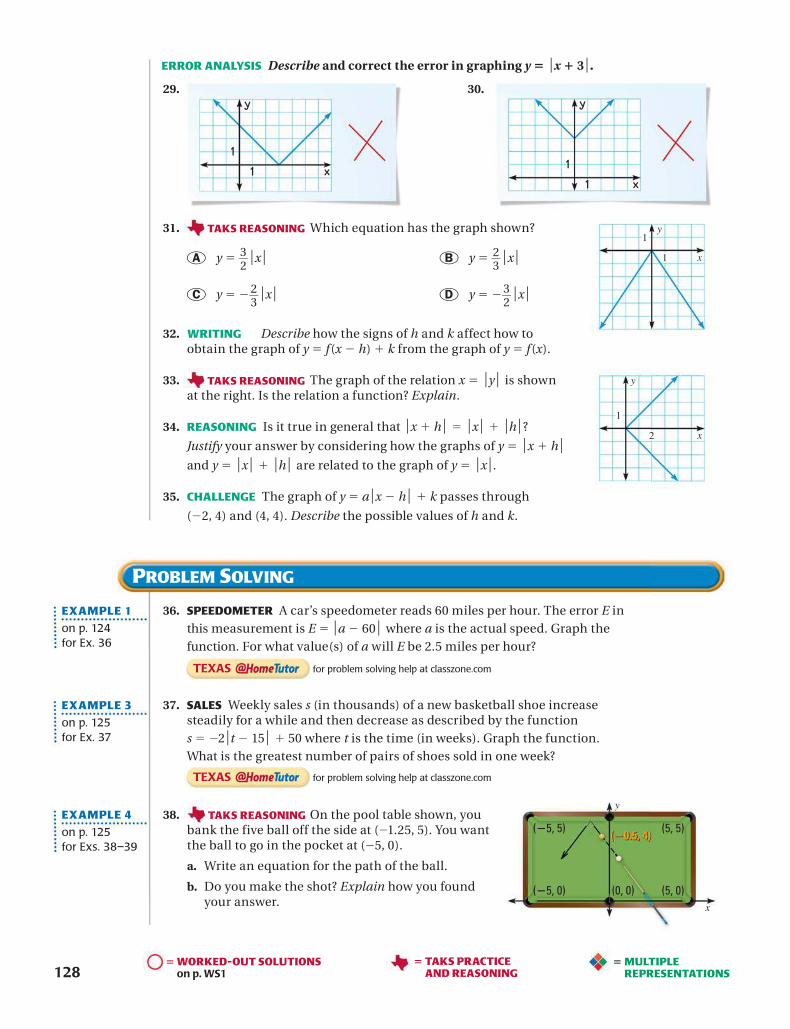
TAKS REASONING
128
ERROR ANALYSIS Describe and correct the error in graphing y 5 ⏐x 1 3⏐.
29. 30.
31. Which equation has the graph shown?
A y 5 3}2⏐x⏐ B y 5 2
}3⏐x⏐
C y 5 22}3⏐x⏐ D y 5 23
}2⏐x⏐
32. Describe how the signs of h and k affect how toobtain the graph of y 5 f(x 2 h) 1 k from the graph of y 5 f(x).
33. The graph of the relation x 5 ⏐y⏐ is shownat the right. Is the relation a function? Explain.
34. REASONING Is it true in general that ⏐x 1 h⏐ 5 ⏐x⏐ 1 ⏐h⏐?
Justify your answer by considering how the graphs of y 5 ⏐x 1 h⏐and y 5 ⏐x⏐ 1 ⏐h⏐ are related to the graph of y 5 ⏐x⏐.
35. CHALLENGE The graph of y 5 a⏐x 2 h⏐ 1 k passes through
(22, 4) and (4, 4). Describe the possible values of h and k.
EXAMPLE 1
on p. 124for Ex. 36
EXAMPLE 3
on p. 125for Ex. 37
PROBLEM SOLVING
36. SPEEDOMETER A car’s speedometer reads 60 miles per hour. The error E inthis measurement is E 5 ⏐a 2 60⏐ where a is the actual speed. Graph thefunction. For what value(s) of a will E be 2.5 miles per hour?
37. SALES Weekly sales s (in thousands) of a new basketball shoe increasesteadily for a while and then decrease as described by the functions 5 22⏐t 2 15⏐ 1 50 where t is the time (in weeks). Graph the function.What is the greatest number of pairs of shoes sold in one week?
38. On the pool table shown, youba he side at (21.25, 5). You wantthe ball to go in the pocket at (25, 0).
a. Write an equation for the path of the ball.
b. Do you make the shot? Explain how you foundyour answer.
EXAMPLE 4
on p. 125for Exs. 38–39
5 WORKED-OUT SOLUTIONSon p. WS1
5 MULTIPLEREPRESENTATIONS
x
y
1
1
x
y
2
1
x
y
11
x
y
11
5 TAKS PRACTICEAND REASONING
WRITING
TAKS REASONING
TAKS REASONINGnk the five ball off t

1 129ONLINE QUIZ at classzone.com
39. ENGINEERING The Leonard P. Zakim BunkerHill Bridge spans the Charles River in Boston.The bridge is suspended from two towers.Each tower has the dimensions shown. Writean absolute value function that represents theinverted V-shaped portion of a tower.
40. ★ nowstorm begins with light snow that increasesto very heavy snow before decreasing again. The snowfall rate r (in inchesper hour) is given by r(t) 5 20.5⏐t 2 4⏐ 1 2 where t is the time (in hours).
a. Graph Graph the function.
b. Interpret When is the snowfall heaviest? What is the maximum snowfallrate? How are your answers related to the function’s graph?
c. Extend The total snowfall is given by the area of the triangle formed bythe graph of r(t) and the t-axis. What is the total snowfall?
41. MULTIPLE REPRESENTATIONS The diagram shows a truck driving towarda radio station transmitter that has a broadcasting range of 50 miles.
a. Making a Table Make a table that shows the truck’s distance d (in miles)from the transmitter after t 5 0, 0.5, 1, 1.5, 2, 2.5, and 3 hours.
b. Drawing a Graph Use your table from part (a) to draw a graph that showsd as a function of t.
c. Writing an Equation Write an equation that gives d as a function of t.During what driving times is the truck within range of the transmitter?
42. CHALLENGE A hiker walks up and down a hill. The hill has a cross section
that can be modeled by y 5 24}3⏐x 2 300⏐ 1 400 where x and y are measured
in feet and 0 ≤ x ≤ 600. How far does the hiker walk?
43. TAKS PRACTICE Which expression is equivalent to12(n2 1 n) 2 5(n2 1 3n 2 2)? TAKS Obj. 2
A 27n2 1 3n 2 10 B 7n2 2 3n 1 10
C 17n2 1 27n 2 10 D 17n2 2 13n 1 10
44. TAKS PRACTICE In the figure shown, whatis the length of }YX in inches? TAKS Obj. 6
F 20 in. G 36 in.
H 56 in. J 3136 in.
MIXED REVIEW FOR TAKS
REVIEW
Lesson 1.2;TAKS Workbook
REVIEW
TAKS Preparationp. 324;TAKS Workbook
TAKS PRACTICE at classzone.com
W
ZX Y
39 in.15 in.
25 in.
ACTICE for Lesson 2.7, p. 101EXTRA PR
TAKS REASONING A s

130 Chapter 2 Linear Equations and Functions
ExtensionUse after Lesson 2.7
Use Piecewise Functions
GOAL Evaluate, graph, and write piecewise functions.
Key Vocabulary • piecewise function• step function
E X A M P L E 1 Evaluate a piecewise function
Evaluate the function g(x) above when (a) x 5 1 and (b) x 5 5.
Solution
a. g(x) 5 2x 2 1 Because 1 ≤ 1, use first equation.
g(1) 5 2(1) 2 1 5 1 Substitute 1 for x and simplify.
b. g(x) 5 3x 1 1 Because 5 > 1, use second equation.
g(5) 5 3(5) 1 1 5 16 Substitute 5 for x and simplify.
A piecewise function is defined by at least two equations, each of which applies to a different part of the function’s domain. One example of a piecewise function is the absolute value function f(x) 5 ⏐x⏐, which can be defined by the equations y 5 2x for x < 0 and y 5 x for x ≥ 0. Another example is given below.
2x 2 1, if x ≤ 1 g(x) 5 3x 1 1, if x > 1
The equation y 5 2x 2 1 gives the value of g(x) when x is less than or equal to 1, and the equation y 5 3x 1 1 gives the value of g(x) when x is greater than 1.
E X A M P L E 2 Graph a piecewise function
Graph the function f(x) 5
Solution
STEP 1 To the left of x 5 22, graph
y 5 23}2
x 2 1. Use an open dot at (22, 2)
because the equation y 5 23}2
x 2 1 does
not apply when x 5 22.
STEP 2 From x 5 22 to x 5 1, inclusive, graph y 5 x 1 1. Use solid dots at (22, 21) and (1, 2) because the equation y 5 x 1 1 applies to both x 5 22 and x 5 1.
STEP 3 To the right of x 5 1, graph y 5 3. Use an open dot at (1, 3) because the equation y 5 3 does not apply when x 5 1.
x
y
1
2
23}2
x 2 1, if x < 22
x 1 1, if 22 ≤ x ≤ 1
3, if x > 1
a.2, a.3, 2A.2.ATEKS

Extension: Use Piecewise Functions 131
E X A M P L E 3 Write a piecewise function
Write a piecewise function for the graph shown.
Solution
For x between 0 and 1, including x 5 0, the graph is the line segment given by y 5 1.
For x between 1 and 2, including x 5 1, the graph is the line segment given by y 5 2.
For x between 2 and 3, including x 5 2, the graph is the line segment given by y 5 3. So, a piecewise function for the graph is as follows:
1, if 0 ≤ x < 1f(x) 5 2, if 1 ≤ x < 2
3, if 2 ≤ x < 3
STEP FUNCTIONS The piecewise function in Example 3 is called a step functionbecause its graph resembles a set of stairs. A step function is defined by a constant value over each part of its domain. The constant values can increase with each “step” as in Example 3, or they can decrease with each step.
PRACTICE
EVALUATING FUNCTIONS Evaluate the function below for the given value of x.
9x 2 4, if x > 3f(x) 5 1
}2
x 1 1, if x ≤ 3
1. f(24) 2. f(2) 3. f(3) 4. f(5)
GRAPHING FUNCTIONS Graph the function.
5. f(x) 5 2x 1 1, if x ≥ 02x 1 1, if x < 0 6. g(x) 5
21}2
x 2 1, if x < 2
3x 2 7, if x ≥ 27.
3, if 0 < x ≤ 2h(x) 5 1, if 2 < x ≤ 4
5, if 4 < x ≤ 6
8. POSTAL RATES In 2005, the cost C (in dollars) 13.65, if 0 < w ≤ 8 17.85, if 8 < w ≤ 32C(w) 5 21.05, if 32 < w ≤ 48 24.20, if 48 < w ≤ 64 27.30, if 64 < w ≤ 80
to send U.S. Postal Service Express Mail up to 5 pounds depended on the weight w (in ounces) according to the function at the right.
a. Graph the function.
b. What is the cost to send a parcel weighing 2 pounds 9 ounces using Express Mail?
SPECIAL STEP FUNCTIONS Write and graph the piecewise function described using the domain 23 ≤ x ≤ 3.
9. Rounding Function The output f(x) is the input x rounded to the nearest integer. (If the decimal part of x is 0.5, then x is rounded up.)
10. Greatest Integer Function The output f(x) is the greatest integer less than or equal to the input x.
x
y
1
2
EXAMPLE 1
on p. 130for Exs. 1–4
EXAMPLE 2
on p. 130for Exs. 5–8
EXAMPLE 3
on p. 131for Exs. 9–10

132 Chapter 2 Linear Equations and Functions
Key Vocabulary• linear inequality in
two variables• solution of a linear
inequality• graph of a linear
inequality• half-plane
Before You solved linear inequalities in one variable.
Now You will graph linear inequalities in two variables.
Why? So you can model data encoding, as in Example 4.
2.8 Graph Linear Inequalitiesin Two Variables
A linear inequality in two variables can be written in one of these forms:
Ax 1 By < C Ax 1 By ≤ C Ax 1 By > C Ax 1 By ≥ C
An ordered pair (x, y) is a solution of a linear inequality in two variables if theinequality is true when the values of x and y are substituted into the inequality.
✓ GUIDED PRACTICE for Example 1
Tell whether the given ordered pair is a solution of 5x 2 2y ≤ 6.
1. (0, 24) 2. (2, 2) 3. (23, 8) 4. (21, 27)
GRAPHING INEQUALITIES The graph of a linear inequality in two variables is theset of all points in a coordinate plane that represent solutions of the inequality.
x
y
1
1
3x 2 2y > 2
The boundary line divides theplane into two half-planes.The shaded half-plane is thegraph of 3x 2 2y > 2.
All solutions of 3x 2 2y > 2lie on one side of theboundary line 3x 2 2y 5 2.
INTERPRET GRAPHS
A dashed boundaryline means that pointson the line are notsolutions. A solidboundary line meansthat points on the lineare solutions.
E X A M P L E 1 TAKS PRACTICE: Multiple Choice
Which ordered pair is a solution of 2x 1 5y > 9?
A (24, 21) B (22, 3) C (2, 24) D (6, 21)
Solution
Ordered Pair Substitute Conclusion
(24, 21) 2(24) 1 5(21) 5 213 ò 9 (24, 21) is not a solution.
(22, 3) 2(22) 1 5(3) 5 11 > 9 (22, 3) is a solution.
(2, 24) 2(2) 1 5(24) 5 216 ò 9 (2, 24) is not a solution.
(6, 21) 2(6) 1 5(21) 5 7 ò 9 (6, 21) is not a solution.
c The correct answer is B. A B C D
a.5TEKS

2.8 Graph Linear Inequalities in Two Variables 133
KEY CONCEPT For Your Notebook
Graphing a Linear Inequality
To graph a linear inequality in two variables, follow these steps:
STEP 1 Graph the boundary line for the inequality. Use a dashed line for< or > and a solid line for ≤ or ≥.
STEP 2 Test a point not on the boundary line to determine whether it is asolution of the inequality. If it is a solution, shade the half-planecontaining the point. If it is not a solution, shade the other half-plane.
Graph (a) y ≤ 23 and (b) x < 2 in a coordinate plane.
a. Graph the boundary line y 5 23. b. Graph the boundary line x 5 2.Use a solid line because the Use a dashed line because theinequality symbol is ≤. inequality symbol is <.
Test the point (0, 0). Because Test the point (0, 0). Because(0, 0) is not a solution of the (0, 0) is a solution of theinequality, shade the half-plane inequality, shade the half-planethat does not contain (0, 0). that contains (0, 0).
E X A M P L E 2 Graph linear inequalities with one variable
x
y
3(0, 0)
y ≤ 23
21
x
y
3
1
(0, 0)x < 2
Graph (a) y > 22x and (b) 5x 2 2y ≤ 24 in a coordinate plane.
a. Graph the boundary line y 5 22x. b. Graph the boundary lineUse a dashed line because the 5x 2 2y 5 24. Use a solid lineinequality symbol is >. because the inequality symbol is ≤.
Test the point (1, 1). Because Test the point (0, 0). Because(1, 1) is a solution of the (0, 0) is not a solution of theinequality, shade the half-plane inequality, shade the half-planethat contains (1, 1). that does not contain (0, 0).
E X A M P L E 3 Graph linear inequalities with two variables
x
y
1
2
(1, 1)
y > 2 2xx
y
3(0, 0)
5x 2 2y ≤ 24
23
at classzone.com
AVOID ERRORS
It is often convenient touse (0, 0) as a test point.However, if (0, 0) lies onthe boundary line, youmust choose a differenttest point.
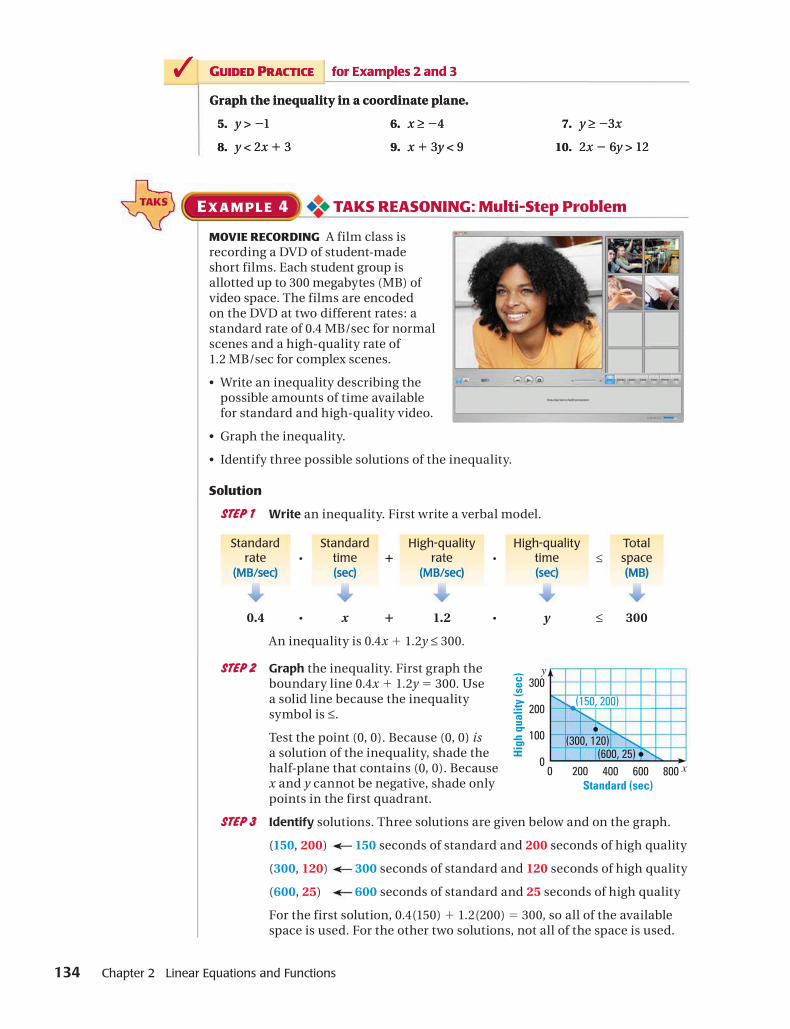
134 Chapter 2 Linear Equations and Functions
E X A M P L E 4
MOVIE RECORDING A film class isrecording a DVD of student-madeshort films. Each student group isallotted up to 300 megabytes (MB) ofvideo space. The films are encodedon the DVD at two different rates: astandard rate of 0.4 MB/sec for normalscenes and a high-quality rate of1.2 MB/sec for complex scenes.
• Write an inequality describing thepossible amounts of time availablefor standard and high-quality video.
• Graph the inequality.
• Identify three possible solutions of the inequality.
Solution
STEP 1 Write an inequality. First write a verbal model.
Standardrate
(MB/sec)p
Standardtime(sec)
1High-quality
rate(MB/sec)
pHigh-quality
time(sec)
≤Totalspace(MB)
0.4 p x 1 1.2 p y ≤ 300
An inequality is 0.4x 1 1.2y ≤ 300.
STEP 2 Graph the inequality. First graph theboundary line 0.4x 1 1.2y 5 300. Usea solid line because the inequalitysymbol is ≤.
Test the point (0, 0). Because (0, 0) isa solution of the inequality, shade thehalf-plane that contains (0, 0). Becausex and y cannot be negative, shade onlypoints in the first quadrant.
STEP 3 Identify solutions. Three solutions are given below and on the graph.
(150, 200) 150 seconds of standard and 200 seconds of high quality
(300, 120) 300 seconds of standard and 120 seconds of high quality
(600, 25) 600 seconds of standard and 25 seconds of high quality
For the first solution, 0.4(150) 1 1.2(200) 5 300, so all of the availablespace is used. For the other two solutions, not all of the space is used.
✓ GUIDED PRACTICE for Examples 2 and 3
Graph the inequality in a coordinate plane.
5. y > 21 6. x ≥ 24 7. y ≥ 23x
8. y < 2x 1 3 9. x 1 3y < 9 10. 2x 2 6y > 12
(300, 120)(600, 25)
(150, 200)
Standard (sec)
High
qua
lity
(sec
)
200 400 600 800
300
200
100
00 x
y
✓ GUIDED PRACTICE for Examples 2 and 3
Graph the inequality in a coordinate plane.
5. y > 21 6. x ≥ 24 7. y ≥ 23x
8. y < 2x 1 3 9. x 1 3y < 9 10. 2x 2 6y > 12
TAKS REASONING: Multi-Step Problem
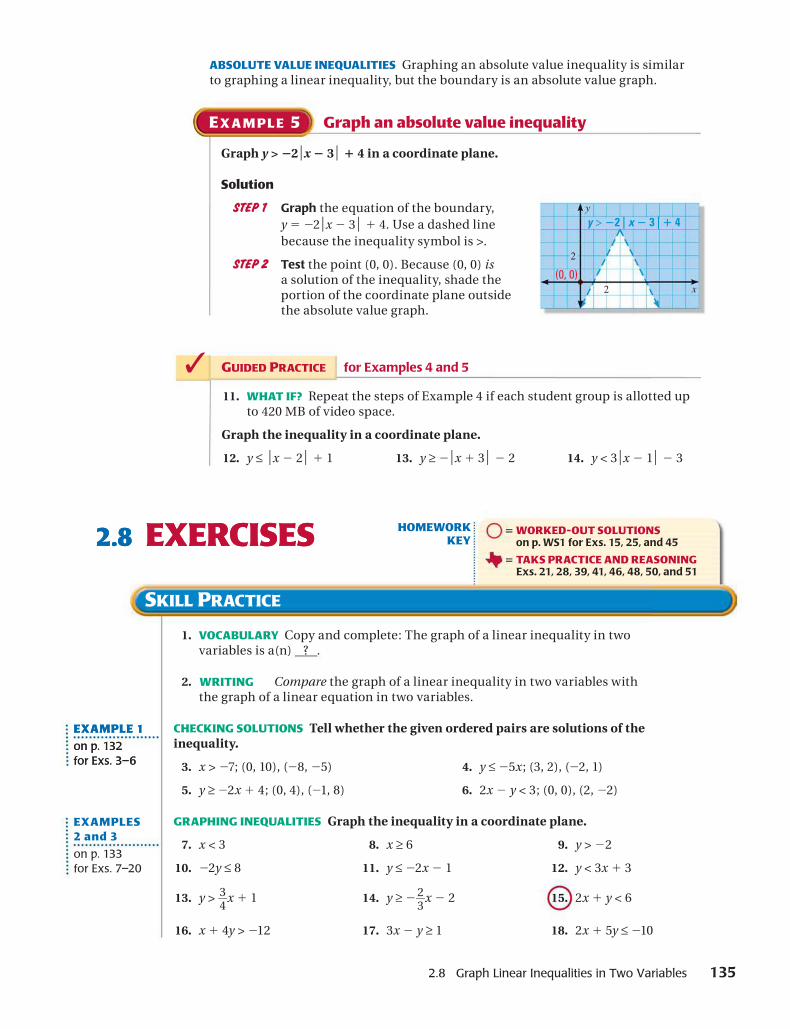
2.8 Graph Linear Inequalities in Two Variables 135
ABSOLUTE VALUE INEQUALITIES Graphing an absolute value inequality is similarto graphing a linear inequality, but the boundary is an absolute value graph.
✓ GUIDED PRACTICE for Examples 4 and 5
11. WHAT IF? Repeat the steps of Example 4 if each student group is allotted upto 420 MB of video space.
Graph the inequality in a coordinate plane.
12. y ≤ ⏐x 2 2⏐ 1 1 13. y ≥ 2⏐x 1 3⏐ 2 2 14. y < 3⏐x 2 1⏐ 2 3
1. VOCABULARY Copy and complete: The graph of a linear inequality in twovariables is a(n) ? .
2. Compare the graph of a linear inequality in two variables withthe graph of a linear equation in two variables.
CHECKING SOLUTIONS Tell whether the given ordered pairs are solutions of theinequality.
3. x > 27; (0, 10), (28, 25) 4. y ≤ 25x; (3, 2), (22, 1)
5. y ≥ 22x 1 4; (0, 4), (21, 8) 6. 2x 2 y < 3; (0, 0), (2, 22)
GRAPHING INEQUALITIES Graph the inequality in a coordinate plane.
7. x < 3 8. x ≥ 6 9. y > 22
10. 22y ≤ 8 11. y ≤ 22x 2 1 12. y < 3x 1 3
13. y > 3}4
x 1 1 14. y ≥ 22}3
x 2 2 15. 2x 1 y < 6
16. x 1 4y > 212 17. 3x 2 y ≥ 1 18. 2x 1 5y ≤ 210
2.8 EXERCISES
EXAMPLE 1
on p. 132for Exs. 3–6
EXAMPLES2 and 3
on p. 133for Exs. 7–20
2.8 EXERCISES
EXAMPLE 1
on p. 132for Exs. 3–6
E X A M P L E 5 Graph an absolute value inequality
Graph y > 22⏐x 2 3⏐ 1 4 in a coordinate plane.
Solution
STEP 1 Graph the equation of the boundary, y 5 22⏐x 2 3⏐ 1 4. Use a dashed line because the inequality symbol is >.
STEP 2 Test the point (0, 0). Because (0, 0) isa solution of the inequality, shade theportion of the coordinate plane outsidethe absolute value graph.
(0, 0)x
y
2
2
y > 22 z x 2 3 z 1 4
WRITING
HOMEWORKKEY
5 WORKED-OUT SOLUTIONSon p. WS1 for Exs. 15, 25, and 45
5 TAKS PRACTICE AND REASONINGExs. 21, 28, 39, 41, 46, 48, 50, and 51
SKILL PRACTICE

TAKS REASONING
WRITING
136
ERROR ANALYSIS Describe and correct the error in graphing the inequality.
19. y < 2x 1 3 20. y ≥ 23x 2 2
21. Which ordered pair is not a solution of 3x 2 5y < 30?
A (0, 0) B (21, 7) C (1, 27) D (25, 25)
ABSOLUTE VALUE INEQUALITIES Graph the inequality in a coordinate plane.
22. y > ⏐x 2 1⏐ 23. y < ⏐x⏐ 1 5 24. y > ⏐x 1 4⏐ 2 3
25. y ≤ 21}2⏐x 2 2⏐ 1 1 26. y < 3⏐x⏐ 1 2 27. y ≥ 2⏐x 2 1⏐ 2 4
28. The graph of which inequality is shown?
A y ≤ 22⏐x 1 1⏐ 1 3 B y ≥ 22⏐x 2 1⏐ 1 3
C y > 22⏐x 1 1⏐ 1 3 D y ≥ 22⏐x 1 1⏐ 1 3
CHECKING SOLUTIONS Tell whether the given ordered pairs aresolutions of the inequality.
29. y ≥ 22}3
x 1 1}2
; (26, 8), (23, 23) 30. 4.5 1 y < 1.6x; (0.5, 1), (3.8, 0)
31. 0.2x 1 0.7y > 21; (0.5, 21), (23, 21.5) 32. 1}4
x 2 y > 1; 1 4}3
, 0 2 , 1 2}3
, 242
GRAPHING INEQUALITIES Graph the inequality in a coordinate plane.
33. 3y < 4.5x 1 15 34. 21.5y 2 2x > 3 35. 2y 2 0.2 > 20.6x
36. 2}3
x 1 1}2
y > 2 37. y ≥ 25}2⏐x 2 3⏐ 2 3
}2
38. 2y 2 4 ≤ 23⏐x 1 2⏐
39. Wr ite a linear inequality in two variables that has(21, 3) and (1, 6) as solutions, but does not have (4, 0) as a solution.
40. Explain why it is not helpful when graphing a linear inequalitybin two varia les to choose a test point that lies on the boundary line.
41. Write an inequality forthe graph shown. Explain how you came upwith the inequality. Then describe a real-lifesituation that the first-quadrant portion ofthe graph could represent.
42. CHALLENGE Write an absolute value inequality that has exactly one solutionin common with y ≥ 2⏐x 2 3⏐ 1 5. The common solution should not be thevertex (3, 5) of the boundary. Explain how you found your inequality.
EXAMPLE 5
on p. 135for Exs. 22–28
5 WORKED-OUT SOLUTIONSon p. WS1
x
y
2
1
x
y
1
1
x
y
11 x
y
1
2
5 TAKS PRACTICEAND REASONING
TAKS REASONING
TAKS REASONING
TAKS REASONING

2.8 Graph Linear Inequalities in Two Variables 137
EXAMPLE 4
on p. 134for Exs. 43–48
43. CALLING CARDS You have a $20 phone card. Calls made using the card cost$.03 per minute to destinations within the United States and $.06 per minuteto destinations in Brazil. Write an inequality describing the numbers ofminutes you can use for calls to U.S. destinations and to Brazil.
44. RESTAURANT MANAGEMENT A pizza shop has 300 pounds (4800 ounces) ofdough. A small pizza uses 12 ounces of dough and a large pizza uses 18 ouncesof dough. Write and graph an inequality describing the possible numbers ofsmall and large pizzas that can be made. Then give three possible solutions.
45. CRAFTS Cotton lace costs $1.50 per yard and linen lace costs $2.50 per yard.You plan to order at most $75 of lace for crafts. Write and graph an inequalitydescribing how much of each type of lace you can order. If you buy 24 yardsof cotton lace, what are the amounts of linen lace you can buy?
46. You sell T-shirts for $15 each and caps for $10 each.Wr equality describing how many shirts and capsyou must sell to exceed $1800 in sales. Explain how you can modify thisinequality to describe how many shirts and caps you must sell to exceed$600 in profit if you make a 40% profit on shirts and a 30% profit on caps.
47. MULTI-STEP PROBLEM On a two week vacation, you and your brother canrent one canoe for $11 per day or rent two mountain bikes for $13 each perday. Together, you have $120 to spend.
a. Write and graph an inequality describing the possible numbers of daysyou and your brother can canoe or bicycle together.
b. Give three possible solutions of the inequality from part (a).
c. You decide that on one day you will canoe alone and your brother willbicycle alone. Repeat parts (a) and (b) using this new condition.
48. ★ While camping, you and a friend filter river waterinto two cylindrical containers with the radii and heights shown. You thenuse these containers to fill the water cooler shown.
a. Find the volumes of the containers and the cooler in cubic inches.
b. Using your results from part (a), write and graph an inequalitydescribing how many times the containers can be filled and emptiedinto the water cooler without the cooler overflowing.
c. Convert the volumes from part (a) to gallons (1 in.3 ø 0.00433 gal). Thenrewrite the inequality from part (b) in terms of these converted volumes.
d. Graph the inequality from part (c). Compare the graph with your graphfrom part (b), and explain why the results make sense.
PROBLEM SOLVING
TAKS REASONING
TAKS REASONING ite and graph an in
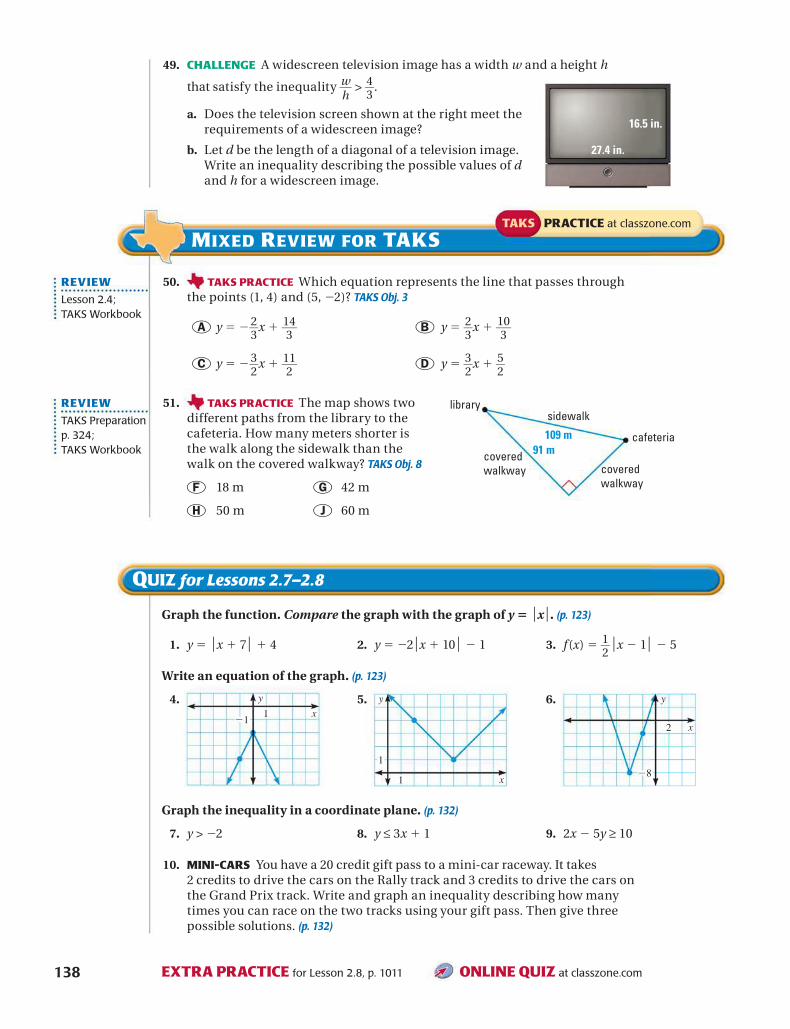
138
49. CHALLENGE A widescreen television image has a width w and a height h
that satisfy the inequality w}h
> 4}3
.
a. Does the television screen shown at the right meet therequirements of a widescreen image?
b. Let d be the length of a diagonal of a television image.Write an inequality describing the possible values of dand h for a widescreen image.
Graph the function. Compare the graph with the graph of y 5 ⏐x⏐. (p. 123)
1. y 5 ⏐x 1 7⏐ 1 4 2. y 5 22⏐x 1 10⏐ 2 1 3. f(x) 5 1}2⏐x 2 1⏐ 2 5
Write an equation of the graph. (p. 123)
4.x
y
121
5.
x
y
1
1
6.
x
y
2
28
Graph the inequality in a coordinate plane. (p. 132)
7. y > 22 8. y ≤ 3x 1 1 9. 2x 2 5y ≥ 10
10. MINI-CARS You have a 20 credit gift pass to a mini-car raceway. It takes2 credits to drive the cars on the Rally track and 3 credits to drive the cars onthe Grand Prix track. Write and graph an inequality describing how manytimes you can race on the two tracks using your gift pass. Then give threepossible solutions. (p. 132)
QUIZ for Lessons 2.7–2.8
EXTRA PRACTICE for Lesson 2.8, p. 1011 ONLINE QUIZ at classzone.com
50. TAKS PRACTICE Which equation represents the line that passes throughthe points (1, 4) and (5, 22)? TAKS Obj. 3
A y 5 22}3
x 1 14}3
B y 5 2}3
x 1 10}3
C y 5 23}2
x 1 11}2
D y 5 3}2
x 1 5}2
51. TAKS PRACTICE The map shows twodifferent paths from the library to thecafeteria. How many meters shorter isthe walk along the sidewalk than thewalk on the covered walkway? TAKS Obj. 8
F 18 m G 42 m
H 50 m J 60 m
MIXED REVIEW FOR TAKSTAKS PRACTICE at classzone.com
REVIEW
Lesson 2.4;TAKS Workbook
REVIEW
TAKS Preparationp. 324;TAKS Workbook
librarysidewalk
cafeteria
coveredwalkway
coveredwalkway
109 m91 m

139
Lessons 2.5–2.8MULTIPLE CHOICE
1. ARCHITECTURE An “A-frame” house isshown below. The coordinates x and y areboth measured in feet. Which absolute valuefunction models the front of the house?TEKS 2A.4.B
A y 5 22⏐x 2 12⏐
B y 5 2⏐x⏐ 1 20
C y 5 22⏐x 2 12⏐ 1 20
D y 5 2⏐x 2 12⏐ 2 20
2. LINEAR INEQUALITIES The graph of whichinequality is shown? TEKS a.5
x
y
1
1
F 2x 1 y ≥ 2
G 3x 1 2y ≤ 24
H 4x 1 3y ≥ 210
J 9x 1 4y ≤ 224
3. INTERNET COST The cost of an Internet servicesubscription varies directly with the lengthof the subscription. A 3 month subscriptioncosts $32.85. How much does a 12 monthsubscription cost? TEKS 2A.10.G
A $32.85 B $36
C $131.40 D $133.33
4. SUNSPOTS Based on the data in the graph,which conclusion is most accurate? TEKS 2A.1.B
Mean Monthly Sunspot Numbers
Month number
Num
ber o
f sun
spot
s
1 3 5 7 9
12
8
4
0 m
s
F The sunspot data show a positivecorrelation.
G The sunspot data show a negativecorrelation.
H The sunspot data show approximately nocorrelation.
J The sunspot data show a strongcorrelation.
5. FLOWER SALES A plant nurserysells marigolds for $2 per packand zinnias for $3 per pack. Youhave a total of $30 to spend.Which inequality describesthe numbers of packs ofmarigolds m and zinnias zyou can buy? TEKS a.3
A 2m 2 3z ≤ 30
B 2m 1 3z ≤ 30
C 3m 2 2z ≥ 30
D 3m 1 2z ≥ 30
GRIDDED ANSWER 0 1 2 3 4 5 6 7 8 9
6. FUNDRAISERS You are selling sandwiches andjuices to raise money for a class field trip. Yourdaily sales s (in dollars) increase for the firstseveral days and then decrease as given by thefunction s(t) 5 215⏐t 2 5⏐ 1 180 where t is thetime (in days). What is the maximum amountof money you raised in one day? TEKS a.5
MIXED REVIEW FOR TEKSMIXED REVIEW FOR TEKS TAKS PRACTICE
classzone.com
Mixed Review for TEKS 139

140 Chapter 2 Linear Equations and Functions
Big Idea 1
Big Idea 2
Big Idea 3
2 CHAPTER SUMMARYCHAPTER SUMMARYCHAPTER SUMMARYCHAPTER SUMMARYCHAPTER SUMMARYCHAPTER SUMMARYCHAPTER SUMMARY
BIG IDEAS For Your Notebook
Representing Relations and Functions
A relation pairs input values with output values. A relation is a function if eachinput value is paired with exactly one output value.
This relation is a function because each This relation is not a function becauseinput has exactly one output. a vertical line intersects the graph at
more than one point.
Graphing Linear Equations and Inequalities in Two Variables
Linear Function Direct Variation Absolute Value Linear InequalityEquation Function
x
y
(0, b)(0, b)
slope 5 mx
y
(0, 0)(0, 0) x
y
(h, k)(h, k)x
y
y 5 mx 1 b y 5 ax y 5 a⏐x 2 h⏐ 1 k Ax 1 By > C
Writing Linear Equations and Inequalities in Two Variables
Form Equation Key Facts
Slope-intercept form y 5 mx 1 b The graph is a line with slope m andy-intercept b.
Standard form Ax 1 By 5 C The graph is a line with intercepts
x 5C}A
and y 5C}B
.
Point-slope form y 2 y1 5 m(x 2 x1) The graph is a line that has slope mand passes through (x1, y1).
Direct variation y 5 ax, a Þ 0 The graph is a line that passesthrough the origin and has slope a(the constant of variation).
Linear inequality Ax 1 By > C The graph is a half-plane withboundary line Ax 1 By 5 C.
24
22
0
2
4
0
4
6
Input Output
x
y
1
1
Algebraclasszone.com
Electronic Function Library
2A.1.ATEKS
2A.4.ATEKS
a.3TEKS
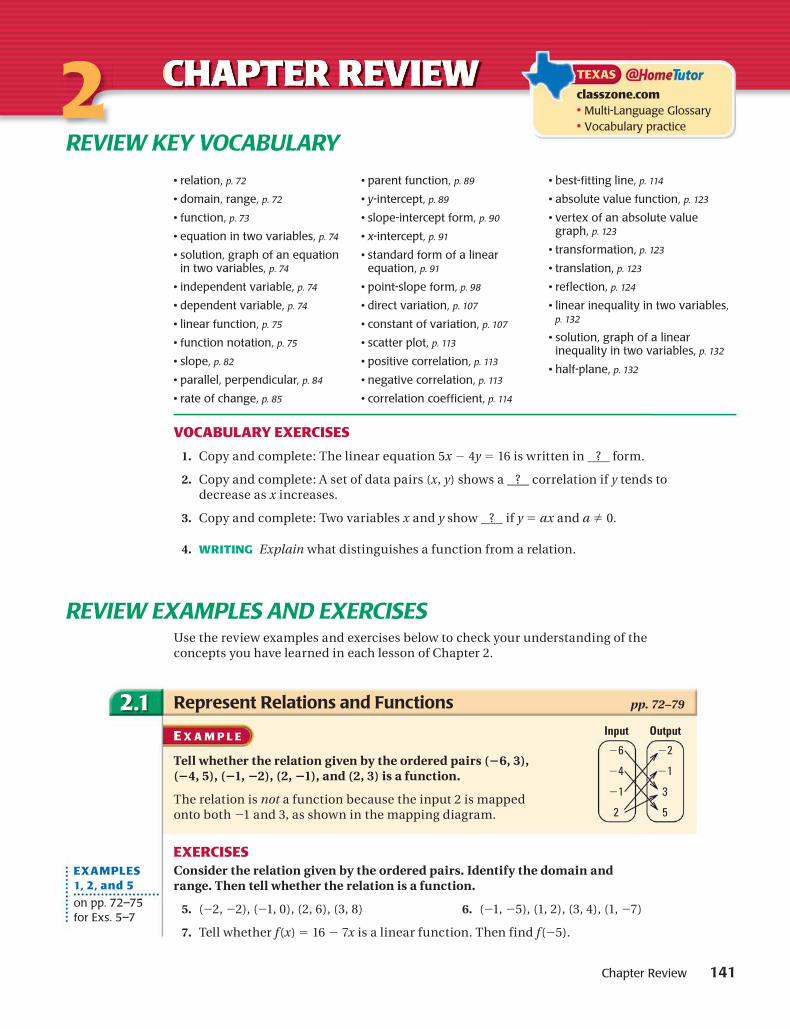
Chapter Review 141
REVIEW KEY VOCABULARY
Use the review examples and exercises below to check your understanding of theconcepts you have learned in each lesson of Chapter 2.
REVIEW EXAMPLES AND EXERCISES
2
EXAMPLES1, 2, and 5
on pp. 72–75for Exs. 5–7
Represent Relations and Functions pp. 72–79
E X A M P L E
Tell whether the relation given by the ordered pairs (26, 3),(24, 5), (21, 22), (2, 21), and (2, 3) is a function.
The relation is not a function because the input 2 is mappedonto both 21 and 3, as shown in the mapping diagram.
EXERCISESConsider the relation given by the ordered pairs. Identify the domain andrange. Then tell whether the relation is a function.
5. (22, 22), (21, 0), (2, 6), (3, 8) 6. (21, 25), (1, 2), (3, 4), (1, 27)
7. Tell whether f(x) 5 16 2 7x is a linear function. Then find f(25).
2.1
• relation, p. 72
• domain, range, p. 72
• function, p. 73
• equation in two variables, p. 74
• solution, graph of an equationin two variables, p. 74
• independent variable, p. 74
• dependent variable, p. 74
• linear function, p. 75
• function notation, p. 75
• slope, p. 82
• parallel, perpendicular, p. 84
• rate of change, p. 85
• parent function, p. 89
• y-intercept, p. 89
• slope-intercept form, p. 90
• x-intercept, p. 91
• standard form of a linearequation, p. 91
• point-slope form, p. 98
• direct variation, p. 107
• constant of variation, p. 107
• scatter plot, p. 113
• positive correlation, p. 113
• negative correlation, p. 113
• correlation coefficient, p. 114
• best-fitting line, p. 114
• absolute value function, p. 123
• vertex of an absolute valuegraph, p. 123
• transformation, p. 123
• translation, p. 123
• reflection, p. 124
• linear inequality in two variables,p. 132
• solution, graph of a linearinequality in two variables, p. 132
• half-plane, p. 132
VOCABULARY EXERCISES
1. Copy and complete: The linear equation 5x 2 4y 5 16 is written in ? form.
2. Copy and complete: A set of data pairs (x, y) shows a ? correlation if y tends todecrease as x increases.
3. Copy and complete: Two variables x and y show ? if y 5 ax and a Þ 0.
4. WRITING Explain what distinguishes a function from a relation.
26
24
21
2
22
21
3
5
Input Output
CHAPTER REVIEWCHAPTER REVIEWCHAPTER REVIEWCHAPTER REVIEWCHAPTER REVIEWCHAPTER REVIEWCHAPTER REVIEW TEXAS
classzone.com• Multi-Language Glossary• Vocabulary practice
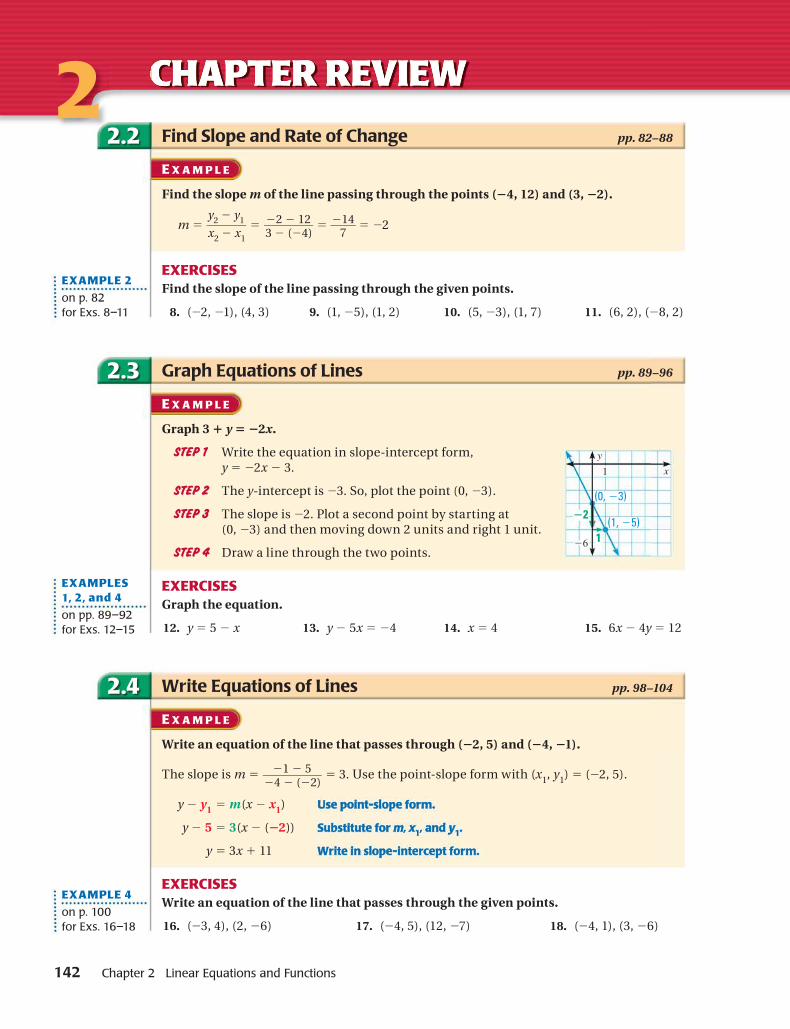
142 Chapter 2 Linear Equations and Functions
2Find Slope and Rate of Change pp. 82–88
E X A M P L E
Find the slope m of the line passing through the points (24, 12) and (3, 22).
m 5y2 2 y1}x2 2 x1
5 22 2 12}3 2 (24)
5 214}
75 22
EXERCISESFind the slope of the line passing through the given points.
8. (22, 21), (4, 3) 9. (1, 25), (1, 2) 10. (5, 23), (1, 7) 11. (6, 2), (28, 2)
2.2
EXAMPLE 2
on p. 82for Exs. 8–11
EXAMPLE 4
on p. 100for Exs. 16–18
Graph Equations of Lines pp. 89–96
E X A M P L E
Graph 3 1 y 5 22x.
STEP 1 Write the equation in slope-intercept form,y 5 22x 2 3.
STEP 2 The y-intercept is 23. So, plot the point (0, 23).
STEP 3 The slope is 22. Plot a second point by starting at(0, 23) and then moving down 2 units and right 1 unit.
STEP 4 Draw a line through the two points.
EXERCISESGraph the equation.
12. y 5 5 2 x 13. y 2 5x 5 24 14. x 5 4 15. 6x 2 4y 5 12
2.3
Write Equations of Lines pp. 98–104
E X A M P L E
Write an equation of the line that passes through (22, 5) and (24, 21).
The slope is m 5 21 2 5}24 2 (22)
5 3. Use the point-slope form with (x1, y1) 5 (22, 5).
y 2 y1 5 m(x 2 x1) Use point-slope form.
y 2 5 5 3(x 2 (22)) Substitute for m, x1, and y1.
y 5 3x 1 11 Write in slope-intercept form.
EXERCISESWrite an equation of the line that passes through the given points.
16. (23, 4), (2, 26) 17. (24, 5), (12, 27) 18. (24, 1), (3, 26)
2.4
EXAMPLES1, 2, and 4
on pp. 89–92for Exs. 12–15
x
y
1
(0, 23)
(1, 25)
26
22
1
CHAPTER REVIEWCHAPTER REVIEWCHAPTER REVIEWCHAPTER REVIEWCHAPTER REVIEWCHAPTER REVIEWCHAPTER REVIEW

Chapter Review 143
Model Direct Variation pp. 107–111
E X A M P L E
The variables x and y vary directly, and y 5 76 when x 5 28. Write an equationthat relates x and y. Then find y when x 5 26.
y 5 ax Write direct variation equation.
76 5 a(28) Substitute 76 for y and 28 for x.
29.5 5 a Solve for a.
An equation that relates x and y is y 5 29.5x. When x 5 26, y 5 29.5(26) 5 57.
EXERCISESThe variables x and y vary directly. Write an equation that relates x and y. Thenfind y when x 5 3.
19. x 5 6, y 5 248 20. x 5 29, y 5 15 21. x 5 23, y 5 2.4
22. PHYSICS Charles’s Law states that when pressure is constant, the volume Vof a gas varies directly with its temperature T (in kelvins). A gas occupies4.8 liters at a temperature of 300 kelvins. Write an equation that gives V asa function of T. What is the volume of the gas when the temperature is420 kelvins?
2.5
Draw Scatter Plots and Best-Fitting Lines pp. 113–120
E X A M P L E
The table shows the shoe size x and height y (in inches) for 7 men. Approximatethe best-fitting line for the data.
Draw a scatter plot and sketch the line that appearsto best fit the data points.
Choose two points on the line, such as (9, 69) and(12, 74). Use the points to find an equation of the line.
The slope is m 5 74 2 69}12 2 9
5 5}3
ø 1.67.
An equation is y 2 69 5 1.67(x 2 9), or y 5 1.67x 1 54.
EXERCISESApproximate the best-fitting line for the data.
23. x 22 21 0 1 2 3 4 5
y 4 3 2.5 2 0.5 21 22 23
2.6
x 9 9.5 10 10.5 11 11.5 12
y 69 70.5 70 71.5 72 74 74
EXAMPLE 3
on p. 115for Ex. 23
EXAMPLE 2
on p. 108for Exs. 19–22
Shoe size
Hei
ght (
in.)
8 9 10 11 12
680
70
72
74
0 x
y
TEXAS
classzone.comChapter Review Practice
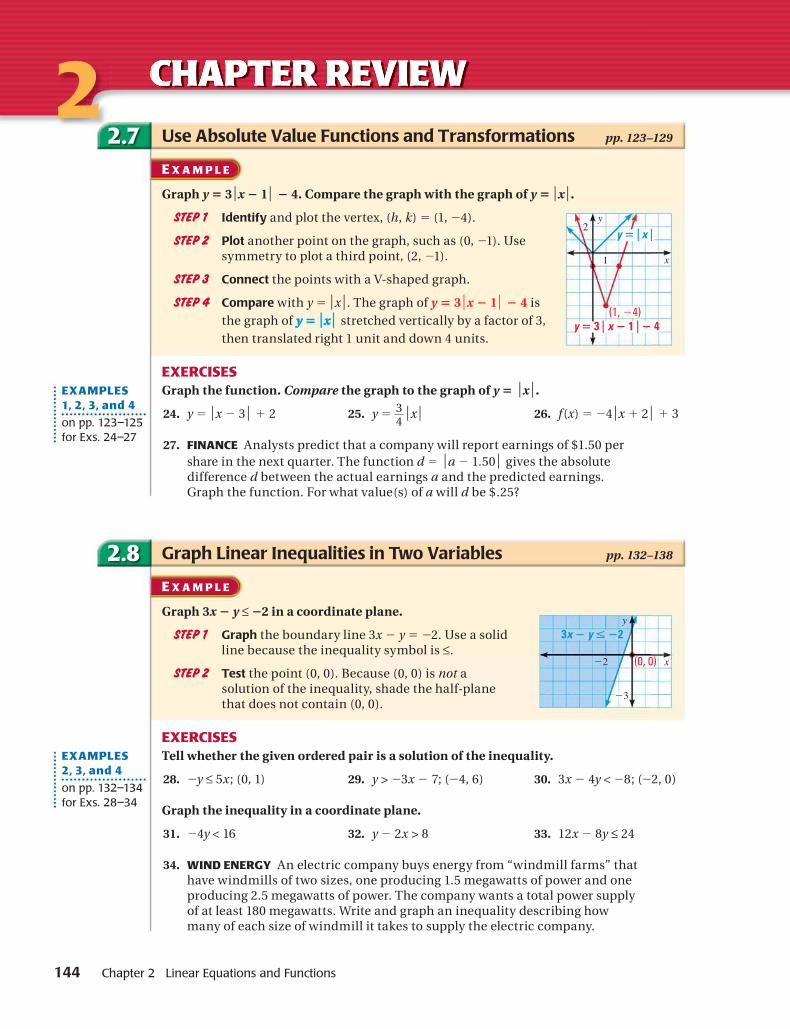
144 Chapter 2 Linear Equations and Functions
EXAMPLES1, 2, 3, and 4
on pp. 123–125for Exs. 24–27
Use Absolute Value Functions and Transformations pp. 123–129
E X A M P L E
Graph y 5 3⏐x 2 1⏐ 2 4. Compare the graph with the graph of y 5⏐x⏐.
STEP 1 Identify and plot the vertex, (h, k) 5 (1, 24).
STEP 2 Plot another point on the graph, such as (0, 21). Usesymmetry to plot a third point, (2, 21).
STEP 3 Connect the points with a V-shaped graph.
STEP 4 Compare with y 5⏐x⏐. The graph of y 5 3⏐x 2 1⏐ 2 4 is the graph of y 5⏐x⏐ stretched vertically by a factor of 3, then translated right 1 unit and down 4 units.
EXERCISESGraph the function. Compare the graph to the graph of y 5 ⏐x⏐.
24. y 5 ⏐x 2 3⏐ 1 2 25. y 5 3}4⏐x⏐ 26. f(x) 5 24⏐x 1 2⏐ 1 3
27. FINANCE Analysts predict that a company will report earnings of $1.50 pershare in the next quarter. The function d 5 ⏐a 2 1.50⏐ gives the absolutedifference d between the actual earnings a and the predicted earnings.Graph the function. For what value(s) of a will d be $.25?
2.7
Graph Linear Inequalities in Two Variables pp. 132–138
E X A M P L E
Graph 3x 2 y ≤ 22 in a coordinate plane.
STEP 1 Graph the boundary line 3x 2 y 5 22. Use a solidline because the inequality symbol is ≤.
STEP 2 Test the point (0, 0). Because (0, 0) is not asolution of the inequality, shade the half-planethat does not contain (0, 0).
EXERCISESTell whether the given ordered pair is a solution of the inequality.
28. 2y ≤ 5x; (0, 1) 29. y > 23x 2 7; (24, 6) 30. 3x 2 4y < 28; (22, 0)
Graph the inequality in a coordinate plane.
31. 24y < 16 32. y 2 2x > 8 33. 12x 2 8y ≤ 24
34. WIND ENERGY An electric company buys energy from “windmill farms” thathave windmills of two sizes, one producing 1.5 megawatts of power and oneproducing 2.5 megawatts of power. The company wants a total power supplyof at least 180 megawatts. Write and graph an inequality describing howmany of each size of windmill it takes to supply the electric company.
2.8
2
EXAMPLES2, 3, and 4
on pp. 132–134for Exs. 28–34
x
y
1
2
(1, �4)y 5 3 z x 2 1 z 2 4
y 5 z x z
x
y
(0, 0)22
23
3x 2 y ≤ 22
CHAPTER REVIEWCHAPTER REVIEWCHAPTER REVIEWCHAPTER REVIEWCHAPTER REVIEWCHAPTER REVIEWCHAPTER REVIEW
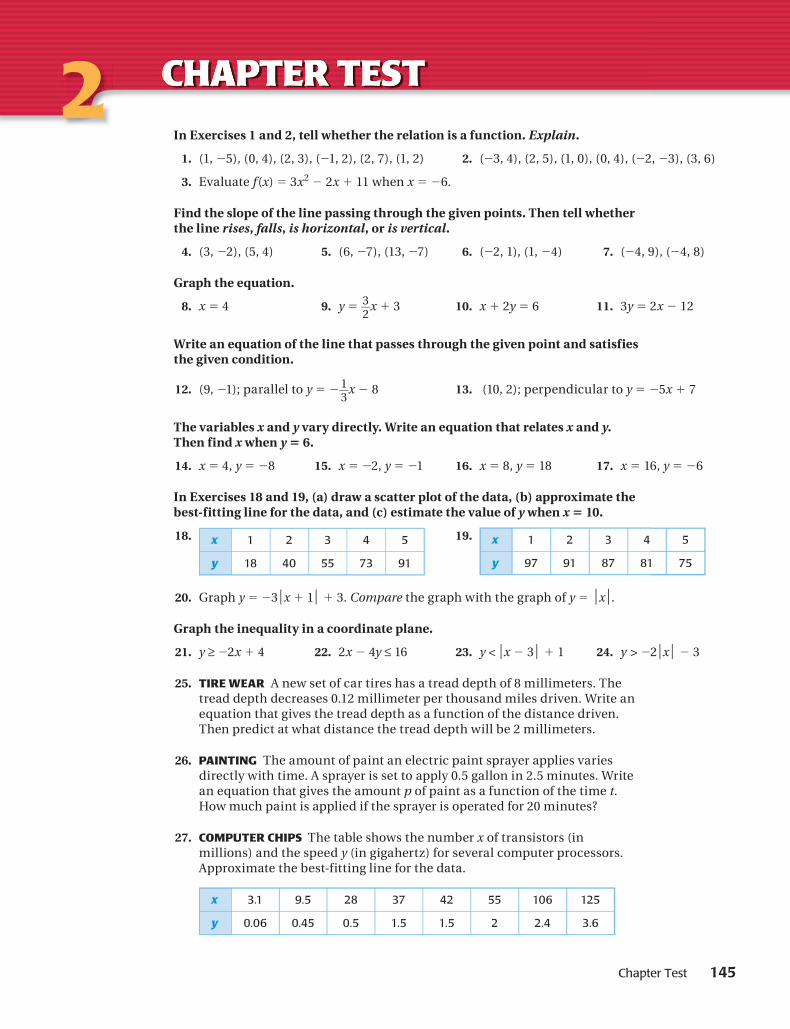
Chapter Test 145
2In Exercises 1 and 2, tell whether the relation is a function. Explain.
1. (1, 25), (0, 4), (2, 3), (21, 2), (2, 7), (1, 2) 2. (23, 4), (2, 5), (1, 0), (0, 4), (22, 23), (3, 6)
3. Evaluate f(x) 5 3x2 2 2x 1 11 when x 5 26.
Find the slope of the line passing through the given points. Then tell whether the line rises, falls, is horizontal, or is vertical.
4. (3, 22), (5, 4) 5. (6, 27), (13, 27) 6. (22, 1), (1, 24) 7. (24, 9), (24, 8)
Graph the equation.
8. x 5 4 9. y 5 3}2
x 1 3 10. x 1 2y 5 6 11. 3y 5 2x 2 12
Write an equation of the line that passes through the given point and satisfies the given condition.
12. (9, 21); parallel to y 5 21}3
x 2 8 13. (10, 2); perpendicular to y 5 25x 1 7
The variables x and y vary directly. Write an equation that relates x and y.Then find x when y 5 6.
14. x 5 4, y 5 28 15. x 5 22, y 5 21 16. x 5 8, y 5 18 17. x 5 16, y 5 26
In Exercises 18 and 19, (a) draw a scatter plot of the data, (b) approximate the best-fitting line for the data, and (c) estimate the value of y when x 5 10.
18. x 1 2 3 4 5
y 18 40 55 73 91
19. x 1 2 3 4 5
y 97 91 87 81 75
20. Graph y 5 23⏐x 1 1⏐ 1 3. Compare the graph with the graph of y 5 ⏐x⏐.
Graph the inequality in a coordinate plane.
21. y ≥ 22x 1 4 22. 2x 2 4y ≤ 16 23. y < ⏐x 2 3⏐ 1 1 24. y > 22⏐x⏐ 2 3
25. TIRE WEAR A new set of car tires has a tread depth of 8 millimeters. The tread depth decreases 0.12 millimeter per thousand miles driven. Write an equation that gives the tread depth as a function of the distance driven. Then predict at what distance the tread depth will be 2 millimeters.
26. PAINTING The amount of paint an electric paint sprayer applies varies directly with time. A sprayer is set to apply 0.5 gallon in 2.5 minutes. Write an equation that gives the amount p of paint as a function of the time t.How much paint is applied if the sprayer is operated for 20 minutes?
27. COMPUTER CHIPS The table shows the number x of transistors (in millions) and the speed y (in gigahertz) for several computer processors. Approximate the best-fitting line for the data.
x 3.1 9.5 28 37 42 55 106 125
y 0.06 0.45 0.5 1.5 1.5 2 2.4 3.6
CHAPTER TESTCHAPTER TESTCHAPTER TESTCHAPTER TESTCHAPTER TESTCHAPTER TESTCHAPTER TEST
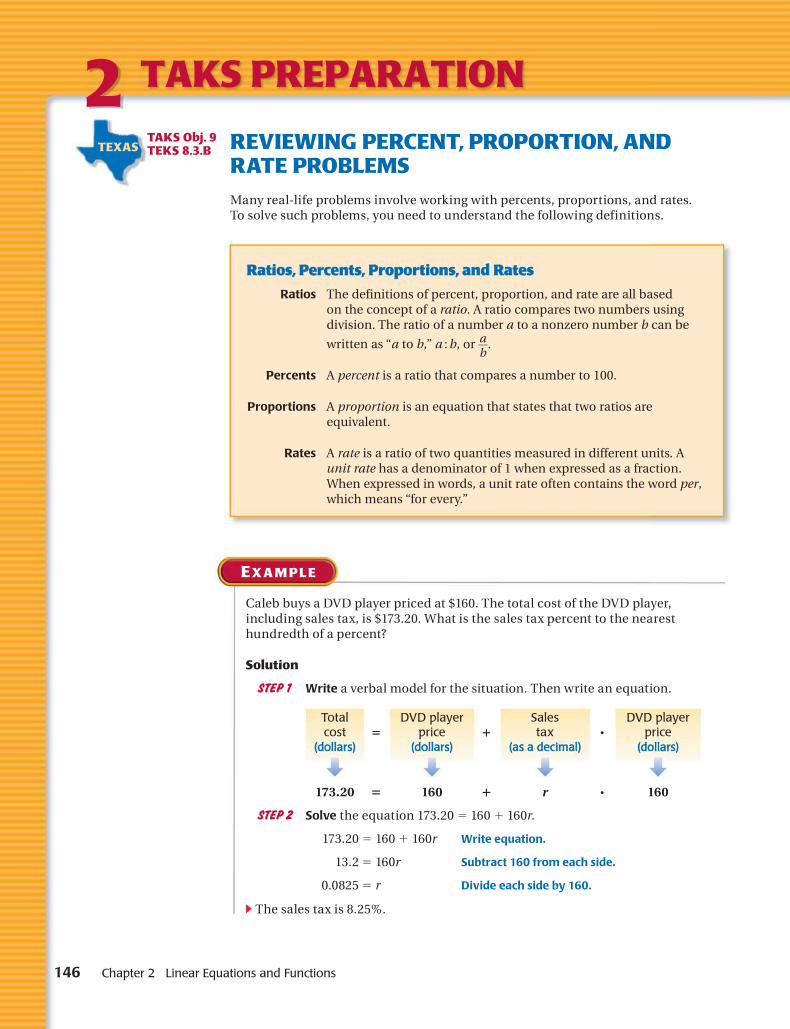
146 Chapter 2 Linear Equations and Functions
2REVIEWING PERCENT, PROPORTION, ANDRATE PROBLEMS
Many real-life problems involve working with percents, proportions, and rates.To solve such problems, you need to understand the following definitions.
Ratios, Percents, Proportions, and Rates
Ratios The definitions of percent, proportion, and rate are all basedon the concept of a ratio. A ratio compares two numbers usingdivision. The ratio of a number a to a nonzero number b can be
written as “a to b,” a : b, or a}b
.
Percents A percent is a ratio that compares a number to 100.
Proportions A proportion is an equation that states that two ratios areequivalent.
Rates A rate is a ratio of two quantities measured in different units. Aunit rate has a denominator of 1 when expressed as a fraction.When expressed in words, a unit rate often contains the word per,which means “for every.”
TAKS PREPARATION
Caleb buys a DVD player priced at $160. The total cost of the DVD player,including sales tax, is $173.20. What is the sales tax percent to the nearesthundredth of a percent?
Solution
STEP 1 Write a verbal model for the situation. Then write an equation.
Totalcost
(dollars)5
DVD playerprice
(dollars)1
Salestax
(as a decimal)p
DVD playerprice
(dollars)
173.20 5 160 1 r p 160
STEP 2 Solve the equation 173.20 5 160 1 160r.
173.20 5 160 1 160r Write equation.
13.2 5 160r Subtract 160 from each side.
0.0825 5 r Divide each side by 160.
c The sales tax is 8.25%.
E X A M P L E
TEXASTAKS Obj. 9TEKS 8.3.B
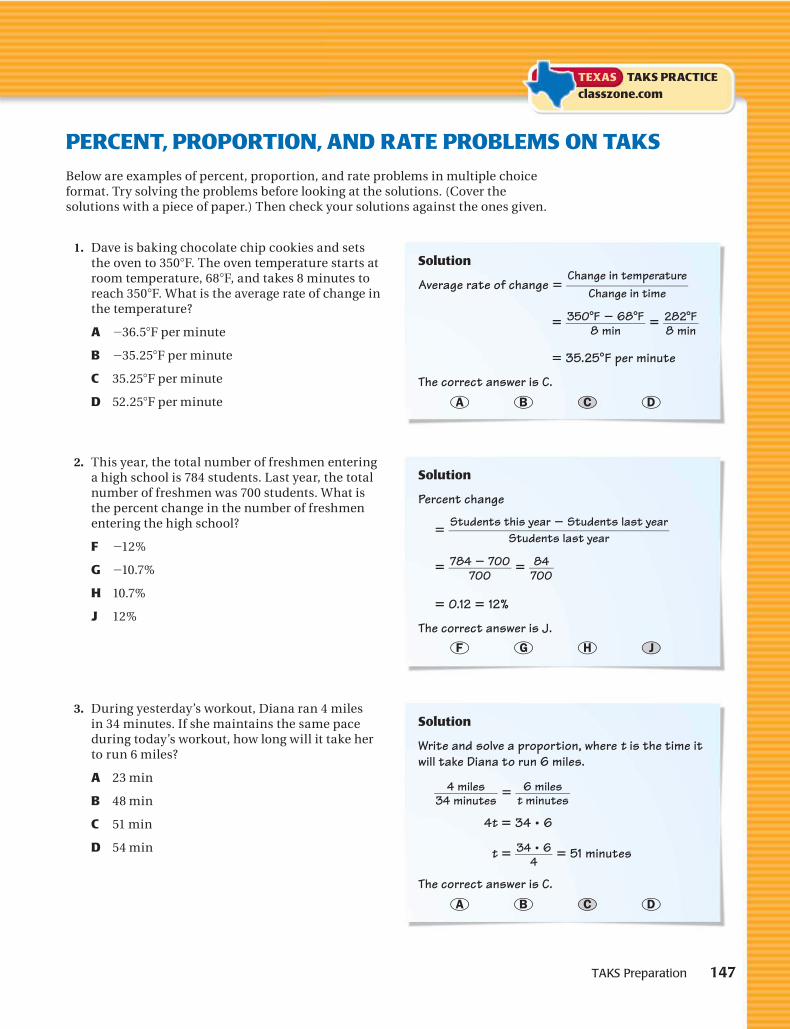
TAKS Preparation 147
PERCENT, PROPORTION, AND RATE PROBLEMS ON TAKS
Below are examples of percent, proportion, and rate problems in multiple choice format. Try solving the problems before looking at the solutions. (Cover the solutions with a piece of paper.) Then check your solutions against the ones given.
1. Dave is baking chocolate chip cookies and sets the oven to 3508F. The oven temperature starts at room temperature, 688F, and takes 8 minutes to reach 3508F. What is the average rate of change in the temperature?
A 236.58F per minute
B 235.258F per minute
C 35.258F per minute
D 52.258F per minute
2. This year, the total number of freshmen entering a high school is 784 students. Last year, the total number of freshmen was 700 students. What is the percent change in the number of freshmen entering the high school?
F 212%
G 210.7%
H 10.7%
J 12%
3. During yesterday’s workout, Diana ran 4 miles in 34 minutes. If she maintains the same pace during today’s workout, how long will it take her to run 6 miles?
A 23 min
B 48 min
C 51 min
D 54 min
Solution
Write and solve a proportion, where t is the time it will take Diana to run 6 miles.
4 miles}}}}}34 minutes
5 6 miles}}}}}t minutes
4t 5 34 p 6
t 5 34 p 6}}}4
5 51 minutes
The correct answer is C.A B C D
Solution
Percent change
5 Students this year 2 Students last year}}}}}}}}}}}}}}}}}Students last year
5 784 2 700}}}}}700
5 84}}700
5 0.12 5 12%
The correct answer is J.F G H J
Solution
Average rate of change 5 Change in temperature}}}}}}}}}}Change in time
5 3508F 2 688F}}}}}}8 min
5 2828F}}}8 min
5 35.258F per minute
The correct answer is C.A B C D
TEXAS TAKS PRACTICE
classzone.com

148 Chapter 2 Linear Equations and Functions
1. Brad is choosing between two brands of graph paper. A pad of 100 sheets of Brand A costs $1.80, and a pad of 100 sheets of Brand B costs $1.53. What percent of the cost of a pad of Brand A did Brad save by buying a pad of Brand B?
A 15%
B 27%
C 73%
D 85%
2. A quality control engineer tested a sample of 130 batteries from a batch of 6500 batteries. The engineer found 3 defective batteries in the sample. About how many defective batteries can the engineer expect in the batch?
F 130
G 150
H 195
J 325
3. Maria has a 4 inch by 6 inch photo. She enlarged the dimensions of the photo by 250% to make a second photo. Then she enlarged the dimensions of the second photo by 250% to make a third photo. What are the dimensions of the third photo?
A 10 in. by 15 in.
B 22.5 in. by 35 in.
C 25 in. by 37.5 in.
D 30 in. by 52.5 in.
4. A math competition requires that at least 2 of every 5 team members be a freshman or sophomore. A school’s team has 20 members. Which of the following is a possible number of team members who are freshmen or sophomores?
F 2
G 3
H 6
J 8
5. The number of women elected to the U.S. House of Representatives has increased nearly every election since 1985. In the 99th Congress beginning in 1985, there were 22 female representatives. In the 109th Congress beginning in 2005, there were 65 female representatives. What was the average rate of change in the number of female members per Congress for the 10 Congresses since 1985?
A 22.15 representatives per session
B 2.15 representatives per session
C 4.3 representatives per session
D 43 representatives per session
6. Rick earns $7 per hour of work plus a 5% commission on his total sales. How much must his total sales be in order for him to earn exactly $115 in 10 hours of work?
F $45
G $330
H $900
J $2300
MIXED TAKS PRACTICE 7. What is the solution of the equation
2(m 2 3) 1 3m 5 9m 1 12? TAKS Obj. 2
A 29}2
B 23
C 6}5
D 9}2
8. The graph of which equation passes through the point (1, 23) and is perpendicular to the line x 1 y 5 10? TAKS Obj. 7
F x 1 y 5 22
G x 2 y 5 22
H x 1 y 5 4
J x 2 y 5 4
PRACTICE FOR TAKS OBJECTIVE 9
TAKS PRACTICE2

TAKS Practice 149
9. Jenny is making candles as gifts for her friends.One of the candle molds she is using is in theshape of a right prism with the dimensionsshown. What is the volume of this candlemold? TAKS Obj. 8
7 in.
4 in.
5 in.
A 35 in.3
B 60 in.3
C 70 in.3
D 140 in.3
10. Julia has $30 to spend on two types of yarn.Cotton yarn costs $3.50 per ball, and woolyarn costs $4.50 per ball. Which inequalityrepresents the possible numbers of balls ofcotton yarn, c, and wool yarn, w, that she canbuy? TAKS Obj. 4
F 3.5c 2 4.5w ≤ 30
G 3.5c 1 4.5w ≤ 30
H 3.5c 2 4.5w ≥ 30
J 3.5c 1 4.5w ≥ 30
11. Angle A and angle B are vertical angles. Themeasure of ∠ A is (5x 1 4)8. The measure of ∠ Bis (3x 1 10)8. What is the value of x? TAKS Obj. 6
A 2
B 3
C 14}}3
D 7
12. What are the coordinates of the x-intercept ofthe line 2y 5 10 1 5x? TAKS Obj. 3
F (22, 0)
G (0, 22)
H (0, 5)
J (5, 0)
13. What is the slope of the line identified by3y 5 26(x 1 2)? TAKS Obj. 3
A 22
B 21}2
C 1}2
D 2
14. Given the line y 5 2.7x 1 32.6, which statementbest describes the effect of decreasing they-intercept by 65.2? TAKS Obj. 3
F The new line is parallel to the original.
G The new line has a lesser rate of change.
H The x-intercept decreases.
J The y-intercept increases.
15. A right circular cone has a volume of 16 cubiccentimeters. The radius and height are eachincreased to two times their original size. Whatis the volume of the new right circular cone?TAKS Obj. 8
A 32 cm3
B 64 cm3
C 128 cm3
D 256 cm3
16. GRIDDED ANSWER An uphill park trail hasbeen improved by building steps from woodentimbers, as shown in the diagram. The widthof each timber is 8 inches. The horizontaldistance between points A and B is 388 inches.What should be the distance x betweentimbers? Round your answer to the nearesttenth of an inch. TAKS Obj. 10
Record your answer and fill in the bubbles onyour answer document. Be sure to use the correctplace value.
MIXED TAKS PRACTICE
TEXAS TAKS PRACTICE
classzone.com
A
B
x8 in.