2nd quarter 2021 executive summary - american institute of
TRANSCRIPT

2Q21 AICPA Business & Industry U.S. Economic Outlook Survey Executive Summary 1
Management Accounting & Finance
The CPA Outlook Index The CPA Outlook Index (CPAOI) is a broad-based indicator of the strength of U.S. business activity and economic direction that reflects the views of CPAs who are AICPA members in Business & Industry holding executive positions in both public and privately-owned organizations of all sizes, and across a broad spectrum of industries.
Economic Outlook Survey 2nd quarter 2021 executive summary
The CPA Outlook Index (CPAOI) improves from 68 to a level of 78.
All major index components improve including U.S. economy optimism, organization optimism, expansion plans and employment.
A reading above 50 indicates a generally positive outlook with increasing activity.
A reading below 50 indicates a generally negative outlook with decreasing activity.
2Q21 AICPA Business & Industry U.S. Economic Outlook Survey Executive Summary 2
CPA Outlook Index
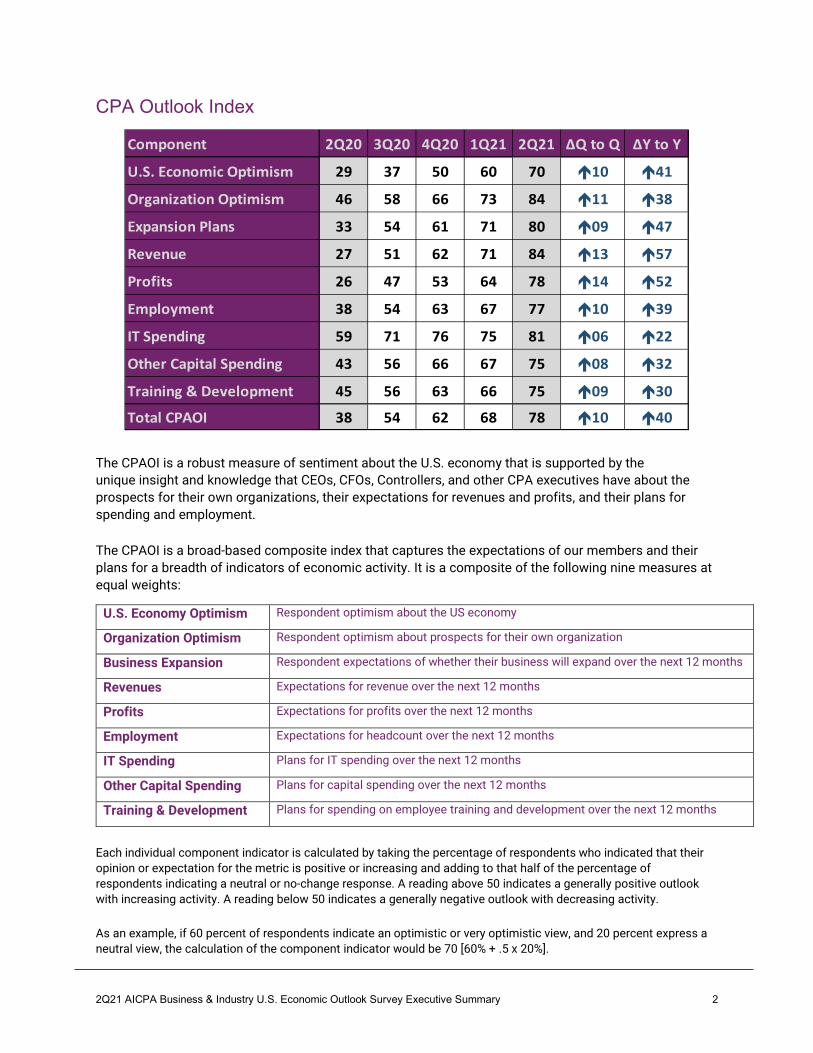
The CPAOI is a robust measure of sentiment about the U.S. economy that is supported by the unique insight and knowledge that CEOs, CFOs, Controllers, and other CPA executives have about the prospects for their own organizations, their expectations for revenues and profits, and their plans for spending and employment.
The CPAOI is a broad-based composite index that captures the expectations of our members and their plans for a breadth of indicators of economic activity. It is a composite of the following nine measures at equal weights:
U.S. Economy Optimism Respondent optimism about the US economy
Organization Optimism Respondent optimism about prospects for their own organization
Business Expansion Respondent expectations of whether their business will expand over the next 12 months
Revenues Expectations for revenue over the next 12 months
Profits Expectations for profits over the next 12 months
Employment Expectations for headcount over the next 12 months
IT Spending Plans for IT spending over the next 12 months
Other Capital Spending Plans for capital spending over the next 12 months
Training & Development Plans for spending on employee training and development over the next 12 months
Each individual component indicator is calculated by taking the percentage of respondents who indicated that their opinion or expectation for the metric is positive or increasing and adding to that half of the percentage of respondents indicating a neutral or no-change response. A reading above 50 indicates a generally positive outlook with increasing activity. A reading below 50 indicates a generally negative outlook with decreasing activity.
As an example, if 60 percent of respondents indicate an optimistic or very optimistic view, and 20 percent express a neutral view, the calculation of the component indicator would be 70 [60% + .5 x 20%].
Component 2Q20 3Q20 4Q20 1Q21 2Q21 ∆Q to Q ∆Y to Y
U.S. Economic Optimism 29 37 50 60 70 10 41
Organization Optimism 46 58 66 73 84 11 38
Expansion Plans 33 54 61 71 80 09 47
Revenue 27 51 62 71 84 13 57
Profits 26 47 53 64 78 14 52
Employment 38 54 63 67 77 10 39
IT Spending 59 71 76 75 81 06 22
Other Capital Spending 43 56 66 67 75 08 32
Training & Development 45 56 63 66 75 09 30
Total CPAOI 38 54 62 68 78 10 40

2Q21 AICPA Business & Industry U.S. Economic Outlook Survey Executive Summary 3
Outlook for the U.S. Economy and Organization
Rebound of optimism about U.S. Economy, organization, and expansion plans continues
Over three quarters (76%) of CPA executives are now optimistic about the prospects for their own organization, improving another 18 points from the levels seen in the first quarter.
Expansion plans also improved another 11 points from the first quarter of 2021 with 69% now having plans to expand their business.
Both optimists and pessimists cite the new administration as part of their rationale. Optimists cite the additional stimulus, vaccine roll-out and pent-up demand in the economy. Concerns included potential policy impacts, especially on small businesses and specific sectors.
Outlook for the U.S. Economy, Organizations & Expansion
As noted last quarter, concern about costs and prices is likely to be an evolving story. This quarter 67% of our respondents are now more concerned about inflation than they are about deflation. Only 2% expressed concern about deflation, while 31% say they are not concerned with either. Reflecting this is an increase in the ability to increase prices charged from 1.8% to 2.7%. There was also corresponding uptick of input prices from 3.1% to 4.4%.
Concern about raw material costs is now the highest-ranking inflation concern for 41% of respondents. Labor cost concerns eased further, now the top concern for 30% of respondents. Energy costs as the greatest concern returned to 11% after ticking up to15% in the first quarter.

2Q21 AICPA Business & Industry U.S. Economic Outlook Survey Executive Summary 4
Key Performance Indicators
Profit projections improve along with revenues; spending plans also reflect improved outlook
Revenues are now projected to increase at a rate of 5.0%, up another 2 points from the first quarter. Profits are now projected to increase at a rate of 4.0%, after showing less robust improvement in the previous two quarters.
Expectations for Revenue and Profits
Reported spending plans are also showing improvement. IT spending increased from 2.8% to 3.5%, returning to the range seen in several quarters prior to the downturn.
Other capital spending is also expected to pick up the pace to 3.0%, up from 1.9% in the first quarter. Similarly, training spend is now projected to increase at 2.1%, up from 1.0%. Marketing spending continues to recover, now at 2.0%, while R&D spending plans ticked up from 1.0% to 1.7%.
Hiring Plans Employment picture also improves with a third of businesses saying they have plans to hire
In this quarter, 45% of all companies say they have the appropriate number of employees. The number that currently say that they have an excess of employees, eased further to 4%.
On the other side of the equation, 47% of our respondents indicated they had too few employees. Only 14% are hesitating because of current conditions, 33% are planning to hire in the near future, continuing to tick up from recent quarters.

2Q21 AICPA Business & Industry U.S. Economic Outlook Survey Executive Summary 5
Staffing Relative to Needs
Employment plans by business size show improvement, relatively consistently across the board:
• For employers with > $1 billion in revenues, only 7% have excess employees, while 50% have too few. Of those with too few employees, 17% remain hesitant while 33% are planning to hire.
• Of those in the $100 million to $1 billion category, 51% say they have too few employees; 10% are hesitant; 41% are hiring.
• In the $10 - $100 million range, 48% now have too few employees; of those with too few, 13% are hesitant; 35% are hiring.
• Of employers with revenues < $10 million 43% have too few employees; 17% are hesitant; 26% are hiring.
Industry, Region and Business Size Outlook Optimism improvement continues across the board, including construction and real estate; hiring now expected to be positive across all major segments
Retail trade optimism improved further from 63% to 75%; retail hiring eased a bit from its first quarter rebound now expected at a rate of 2.9% going forward. Wholesale trade optimism rebounded to 81% in the second quarter, up from only 41% optimistic.
Manufacturing optimism jumped from 58% to 82% this quarter; hiring also improved a full point from 2.4% to 3.4%. Technology optimism rebounded; while a small number responded, 100% expressed optimism. Similarly, construction optimism rebounded to 70%, and hiring improved from an expectation a 2.2% rate of increase to now 2.4%.

2Q21 AICPA Business & Industry U.S. Economic Outlook Survey Executive Summary 6
Industry, Region and Business Size Outlook (cont’d) As noted previously, we have not traditionally reported on the optimism of Hospitality and Food Services, which includes travel and leisure segments; this sector is clearly one that has been hit hard by the pandemic. Fortunately, these executives are now projecting an increase in hiring of 2.9%, up from 2.1% in the first quarter.
Similarly, the first quarter rebound in the extractive industry segment continues, with a projected increase in employment in Mining, Natural Resources and Oil & Gas of 1.9% up from 1.7% in the first quarter.
Expected Employment Change by Industry
Optimism in Professional Services continues to improve, now at 77%; hiring is projected to rise at a rate of 1.4%, Finance and Insurance optimism rebounded to 81% optimistic up from 53% being optimistic in the first quarter; hiring is projected to increase at a rate of 2.2%, up from 1.6% in the first quarter.
Healthcare provider optimism rebounded to 71%, after falling to 39% optimistic in the first quarter. Expected hiring plans are now expected at a 1.4% rate, up a tenth from 1.3% last quarter. Healthcare-other optimism also rebounded from 61% to 82%; hiring is expected to be strong, up a full point from a rate of 2.9% in quarter one, to now 3.9%.
In terms of regional perspective, optimism about the prospects for our executives’ organizations all regions showed further improvement. Northeast optimism improved 26 points to 85%. Optimism in the South improved 20 points from 58% to 78% optimistic. Midwest optimism ticked up from 62% to 69% and the West rebounded from 59% to 80% optimistic.

2Q21 AICPA Business & Industry U.S. Economic Outlook Survey Executive Summary 7
Industry, Region and Business Size Outlook (cont’d) Expectations for expansion plans are similarly showing strength across the size of company spectrum
• Expectations for expansion by businesses with revenues < $10 million improved from 48% to 63%
• Plans for companies in the $10 - $100 million category added 4 points to 69% • Companies in the $100 million to $1 billion range improved 15 points to 73% • Those with revenues in excess of $1 billion gained jumped 19 points, to now 80% having
plans to expand
Expansion Plans by Business Size

2Q21 AICPA Business & Industry U.S. Economic Outlook Survey Executive Summary 8
Top Challenges Availability of skilled personnel top the list followed by materials/supplies/equipment
• Availability of skilled personnel moves up as the #1 challenge
• Materials/supplies/equipment costs move from #6 to #2
• Domestic political leadership moves up 1 spot to #3
• Domestic economic conditions move down 3 spots to #4
• Regulatory requirements dropped 2 spots to #5
• Inflation comes onto the chart at #6
• Employee and benefit costs drop 2 slots to the #7 slot
• Staff turnover moved up 1 slot to #8
• Domestic competition dropped 2 slots to #9
• Cyber security concerns are the 10th position
Top Challenges Facing Organizations 2Q20 3Q20 4Q20 1Q21 2Q21
1 Domestic economic conditions Domestic economic conditions Domestic economic conditions Domestic economic conditions Availability of skilled personnel
2 Stagnant/declining markets Domestic political leadership Domestic political leadership Availability of skilled personnel Materials/supplies/ equipment costs
3 Liquidity Employee and benefits costs Availability of skilled personnel Regulatory requirements/changes Domestic political leadership
4 Global economic conditions Availability of skilled personnel Regulatory requirements/changes Domestic political leadership Domestic economic conditions
5 Regulatory requirements/changes Stagnant/declining markets Stagnant/declining markets Employee and benefits costs Regulatory
requirements/changes
6 Domestic political leadership Regulatory requirements/changes Global economic conditions Materials/supplies/
equipment costs Inflation
7 Financing (access/cost of capital) Global economic conditions Domestic competition Domestic competition Employee and benefits costs
8 Availability of skilled personnel Changing customer preferences
Developing new products/services/markets Stagnant/declining markets Staff Turnover
9 Employee and benefits costs Domestic competition Employee and benefits costs Staff Turnover Domestic competition
10 Changing customer preferences
Materials/supplies/ equipment costs
Materials/supplies/ equipment costs
Developing new products/services/markets Cyber security concerns

2Q21 AICPA Business & Industry U.S. Economic Outlook Survey Executive Summary 9
Survey within the Survey Pandemic Recovery Issues
Our survey-within-the-survey this quarter focused primarily on company travel plans in light of positive developments on to vaccination front.
Vaccination Impact on Travel Restrictions
With vaccinations on the rise, we asked which of the following best describes your organization's plan with respect to business travel restrictions in the second half of 2021? While 9% said they would continue their restrictions on both domestic and global travel, the significant majority indicated at least some easing, with 28% continuing restrictions on global travel for the time being.
. Plans for Easing of Travel Restrictions
Types of Travel Activities We also followed up with a question about types of travel activities allowed, providing the opportunity to check all that apply. Naturally, two-thirds (66%) of companies have prioritized sales or client meetings, followed by other events, summarized as follows:
• Sales or client meetings • Industry conferences, trade shows, exhibitions • Internal business meetings • Company training programs
66% 55% 52% 37%

2Q21 AICPA Business & Industry U.S. Economic Outlook Survey Executive Summary 10
Survey within the Survey (cont’d) Return of Travel to Pre-pandemic Levels We also wanted to get a gauge on when or whether companies expected their travel to return to pre-pandemic levels. While nearly two-thirds (63%) have either already returned to pre-pandemic levels or plan to within the next twelve months, 20% indicate it will be more than a year, and another 10% say they do not expect their travel to return to pre-pandemic levels.
Timing of Return to Pre-pandemic Levels
The following comments were provided as rationale for companies possibly not expecting a return to pre-pandemic levels of travel:
• Employee safety • Customer restrictions / Customer preferences • We are waiting to see the full results of the vaccinations • Increased unease with public health, coupled with real estate 'bubble'
exacerbated by the pandemic • Fewer locations - had to close/sell some locations • More scrutiny on travel needs • Travel will be restricted to higher value more mission critical instances • The cost savings are immense to not have people travelling as much. This has
been a big plus for our business
63%

2Q21 AICPA Business & Industry U.S. Economic Outlook Survey Executive Summary 11
Survey Background The survey was conducted of AICPA Business & Industry members between April 27 – May 24, 2021 and had 770 qualified respondents.
CFOs comprised 43% of the respondents, 19% were Controllers, 15% were Presidents, CEOs, or other C-suite titles; 6% were VP/SVPs, 13% were accounting, audit, tax, technology directors or managers; the remainder were other executives.
Sixty-nine percent of respondents came from privately owned entities, 12% from publicly listed companies, and 17% from not-for-profits.
Thirteen percent came from organizations with annual revenues of $1 billion or more, 22% from organizations with $100 million to under $1 billion in annual revenues, 43% from organizations with $10 million to $100 million and 22% from organizations with under $10 million in revenues.
aicpa.org/
© 2021 Association of International Certified Professional Accountants. All rights reserved. AICPA and American Institute of CPAs are trademarks of the American Institute of Certified Public Accountants and are registered in the United States, European Union and other countries. The design mark is a trademark of the Association of International Certified