2q 2011 results presentation - bp.com · 2q 2011 results presentation 26 july 2011. 2 ......
TRANSCRIPT
2Q 2011 Results Presentation26 July 2011

2
Cautionary statementForward-looking statements - cautionary statementThis presentation and the associated slides and discussion contains forward-looking statements particularly those regarding: expected increases in investment in upstream production; anticipated improvements in operating cash flow and margins; divestment plans; reductions in certain costs associated with the suspension of drilling in the Gulf of Mexico; the quarterly dividend payment; the expected total effective tax rate for 2011; expected full-year 2011 organic capital expenditure; the timing of surveys of shoreline impacted by the Gulf of Mexico oil spill; the segregation of an additional $500 million of the Trust balance to cover costs associated with projects that will restore injured natural resources in the Gulf; the issuance of further Requests for Proposals pursuant to the Gulf of Mexico Research Initiative and the master research agreement thereunder; expectations regarding the impacts on costs of rig standby costs and of turnaround and related maintenance expenditures; the timing for completion of the Whiting refinery upgrade; the projection of cash generation from the Whiting refinery and corresponding impacts on BP’s US Fuels Value Chain position; the expected impact on third-quarter production of the divestment programme, ongoing seasonal turnaround activity across BP’s portfolio, and the ongoing decline of production in the Gulf of Mexico; expected full-year 2011 production, and the impact of acquisitions and divestments and PSA entitlement on full-year 2011 production; expectations for improvements in underlying replacement cost profit; the number of exploration wells to be drilled in 2012; timing of new upstream projects coming on line; the expectation of up to 1mmboed of production by end of 2016 from new projects; the magnitude and timing of remaining remediation costs related to the Gulf of Mexico oil spill; the factors that could affect the magnitude of BP’s ultimate exposure and the cost to BP in relation to the spill and any potential mitigation resulting from BP’s partners or others involved in the spill; the potential liabilities resulting from pending and future legal proceedings and potential investigations and civil or criminal actions that US state and/or local governments could seek to take against BP as a result of the spill; the timing of claims and litigation outcomes and of payment of legal costs; the anticipated timing for completion of and final proceeds from the disposition of certain BP assets; timing for and value of completion of certain acquisitions and strategic alliances; the expectation that more Gulf of Mexico permits will be issued in due course; contributions to and payments from the Trust Fund and the setting aside of assets while the fund is building; expectations for the upstream margin mix; expectations on reduction of net debt; expectations for third-quarter refining margins; expectations for operations at the Texas City refinery; expected improvements in petrochemicals production volumes; anticipated planned turnaround activity in the second half of 2011; the anticipated delivery of material and sustainable earnings growth and cash flows with returns well above cost of capital from refining and marketing; the anticipated timing for the receipt of regulatory approvals and closing of the acquisition from Reliance Industries; expected increases in demand for gas in India; expected improvements in BP’s average unit operating cash margin over the next five years; expected growth in absolute volume of assets held by BP; the schedule of projects due to commence operation in 2012 and 2013; intentions to increase the number of wells drilled in future years; exploration activity in four deepwater offshore blocks off of Australia; the timing for publication of investigation reports; the impact of BP’s potential liabilities relating to the Gulf of Mexico oil spill on the group, including its business, results and financial condition; the increase of investment that will deliver sustainable growth; expectations at getting back to work in Gulf of Mexico through 2012 and 2013; the increase of operating cash flow faster than production volumes; reshaping downstream for improved returns and growth; potential increase of distributions to shareholders. By their nature, forward-looking statements involve risk and uncertainty because they relate to events and depend on circumstances that will or may occur in the future. Actual results may differ from those expressed in such statements, depending on a variety of factors including the timing of bringing new fields onstream; future levels of industry product supply; demand and pricing; OPEC quota restrictions; PSA effects; operational problems; general economic conditions; political stability and economic growth in relevant areas of the world; changes in laws and governmental regulations; changes in taxation; regulatory or legal actions including the types of enforcement action pursued and the nature of remedies sought; the impact on our reputation following the Gulf of Mexico oil spill; exchange rate fluctuations; development and use of new technology; the success or otherwise of partnering; the successful completion of certain disposals; the actions of competitors, trading partners, creditors, rating agencies and others; natural disasters and adverse weather conditions; changes in public expectations and other changes to business conditions; wars and acts of terrorism or sabotage; and other factors discussed under “Risk factors” in our Annual Report and Form 20-F 2010 as filed with the US Securities and Exchange Commission (SEC).
Reconciliations to GAAP - This presentation also contains financial information which is not presented in accordance with generally accepted accounting principles (GAAP). A quantitative reconciliation of this information to the most directly comparable financial measure calculated and presented in accordance with GAAP can be found on our website at www.bp.com.
Cautionary note to US investors - We use certain terms in this presentation, such as “resources”, “non-proved resources” and references to projections in relation to such that the SEC’s rules prohibit us from including in our filings with the SEC. U.S. investors are urged to consider closely the disclosures in our Form 20-F, SEC File No. 1-06262. This form is available on our website at www.bp.com. You can also obtain this form from the SEC by calling 1-800-SEC-0330 or by logging on to their website at www.sec.gov. Tables and projections in this presentation are BP projections unless otherwise stated.
July 2011

3
Bob DudleyGroup Chief Executive

4
Agenda
Moving BP forward Bob Dudley
2Q 2011 results Byron Grote
Delivering shareholder value Bob Dudley
Q&A Bob Dudley Group Chief ExecutiveByron Grote Chief Financial OfficerIain Conn Refining & MarketingMark Bly Safety & Operational RiskMike Daly ExplorationBernard Looney DevelopmentsBob Fryar ProductionLamar McKay BP America
5
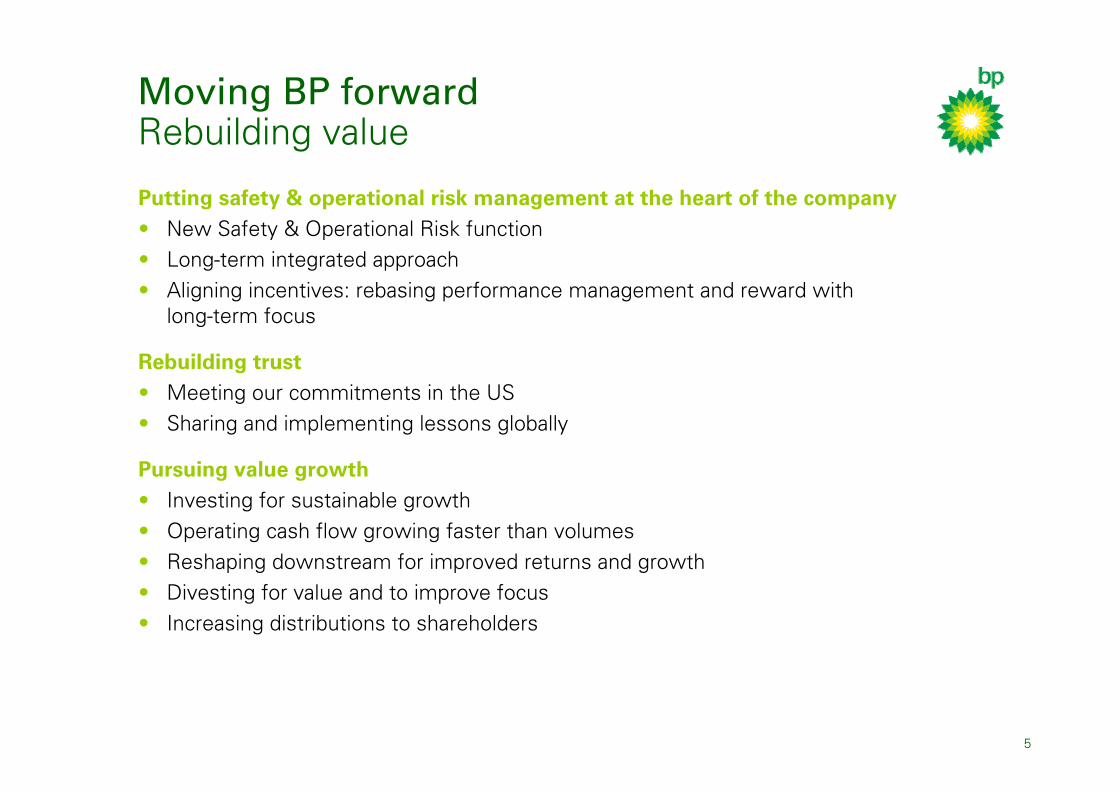
Putting safety & operational risk management at the heart of the company• New Safety & Operational Risk function• Long-term integrated approach• Aligning incentives: rebasing performance management and reward with
long-term focus
Rebuilding trust• Meeting our commitments in the US• Sharing and implementing lessons globally
Pursuing value growth• Investing for sustainable growth• Operating cash flow growing faster than volumes• Reshaping downstream for improved returns and growth• Divesting for value and to improve focus• Increasing distributions to shareholders
Moving BP forward Rebuilding value

6
Moving BP ForwardStrategic progress 1H 2011
Putting safety & operational risk management at the heart of the company• New Safety & Operational Risk organization in place: stronger checks and balances• Increased investment in integrity and capability• Implementing lessons from the Gulf of Mexico oil spill
Rebuilding trust• $6.8bn of US claims and government payments*• Settlements with Mitsui and Weatherford• New voluntary enhanced drilling standards in the Gulf of Mexico• Sharing lessons with governments and partners globally
Pursuing value growth• 2011 new upstream opportunities:
− New exploration access – Trinidad, Australia, Azerbaijan, UK, Indonesia and South China Sea
− Brazil – acquisition of Devon assets complete− India – alliance with Reliance Industries**
• Refining & Marketing: refocusing and earnings momentum• Divesting to add value and focus: $25bn announced 2010/11• 2Q dividend 7c/share
* As at the end of 2Q. Includes $5.1bn paid out of the Trust Fund** Remains subject to final regulatory approvals and completion

7
Byron GroteChief Financial Officer

8
Trading environment
0
20
40
60
80
100
120
1Q 2Q 3Q 4Q 1Q 2Q2010 2011
0
2
4
6
8
10
12
14
1Q 2Q 3Q 4Q 1Q 2Q2010 2011
0
4
8
12
16
20
1Q 2Q 3Q 4Q 1Q 2Q2010 2011
$/b
bl
$/b
bl
$/m
cf
Gas realizationLiquids realization
Refining marker marginChange vs 2010
Average realizations 2Q YTD
Liquids $/bbl
Natural gas $/mcf
Total hydrocarbons $/boe
Refining marker margin $/bbl
47% 38%
21% 9%
34% 27%
26% 24%
9
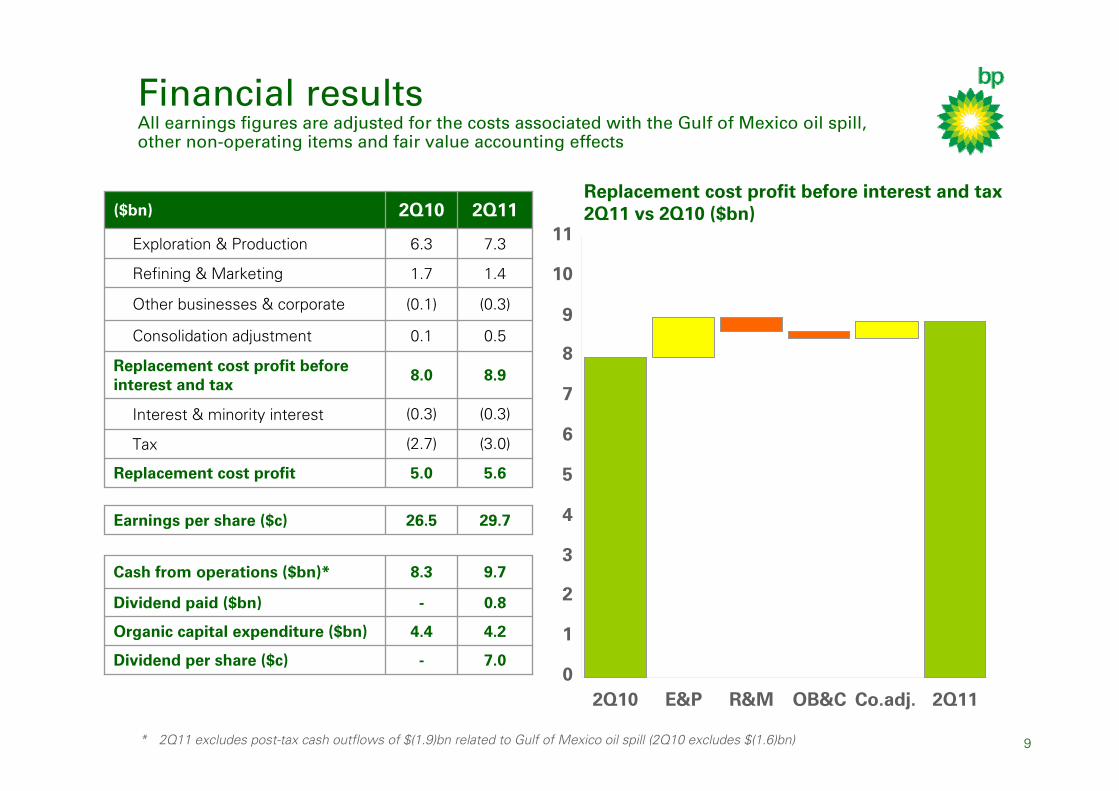
Financial resultsAll earnings figures are adjusted for the costs associated with the Gulf of Mexico oil spill, other non-operating items and fair value accounting effects
0
1
2
3
4
5
6
7
8
9
10
11
2Q10 E&P R&M OB&C Co.adj. 2Q11
Replacement cost profit before interest and tax 2Q11 vs 2Q10 ($bn)
4.24.4Organic capital expenditure ($bn)
-
-
8.3
26.5
5.0
(2.7)
(0.3)
8.0
0.1
(0.1)
1.7
6.3
2Q10
(3.0)Tax
8.9Replacement cost profit before interest and tax
0.5Consolidation adjustment
(0.3)Interest & minority interest
9.7Cash from operations ($bn)*
0.8Dividend paid ($bn)
7.0Dividend per share ($c)
1.4Refining & Marketing
7.3Exploration & Production
29.7Earnings per share ($c)
5.6Replacement cost profit
(0.3)Other businesses & corporate
2Q11($bn)
* 2Q11 excludes post-tax cash outflows of $(1.9)bn related to Gulf of Mexico oil spill (2Q10 excludes $(1.6)bn)
10
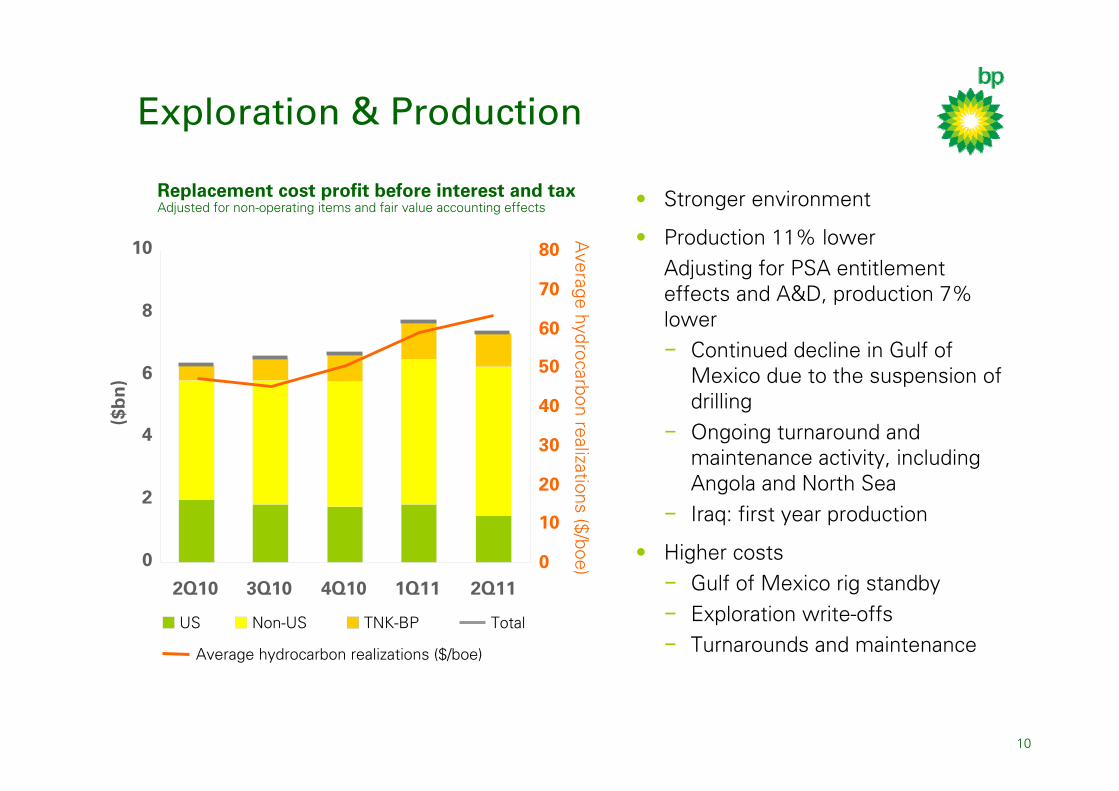
Exploration & Production
• Stronger environment
• Production 11% lowerAdjusting for PSA entitlement effects and A&D, production 7% lower − Continued decline in Gulf of
Mexico due to the suspension of drilling
− Ongoing turnaround and maintenance activity, including Angola and North Sea
− Iraq: first year production
• Higher costs − Gulf of Mexico rig standby− Exploration write-offs− Turnarounds and maintenance
0
2
4
6
8
10
2Q10 3Q10 4Q10 1Q11 2Q110
10
20
30
40
50
60
70
80
($b
n)
Average hydrocarbon realizations ($/boe)
Average hydrocarbon realizations ($/boe)
US Non-US TotalTNK-BP
Adjusted for non-operating items and fair value accounting effectsReplacement cost profit before interest and tax
11
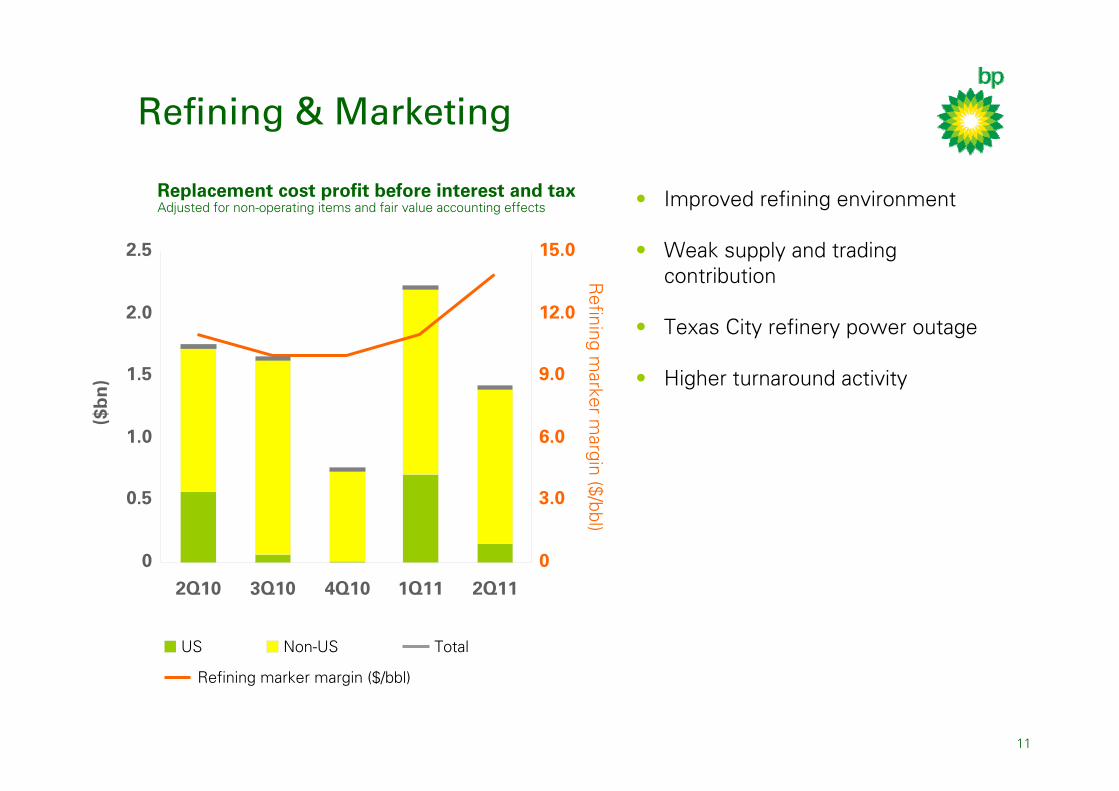
Refining & Marketing
• Improved refining environment
• Weak supply and trading contribution
• Texas City refinery power outage
• Higher turnaround activity
0
0.5
1.0
1.5
2.0
2.5
2Q10 3Q10 4Q10 1Q11 2Q11
0
3.0
6.0
9.0
12.0
15.0
($b
n)
US Non-US
Refining marker margin ($/bbl)
Total
Refining m
arker margin ($/bbl)
Adjusted for non-operating items and fair value accounting effectsReplacement cost profit before interest and tax
12
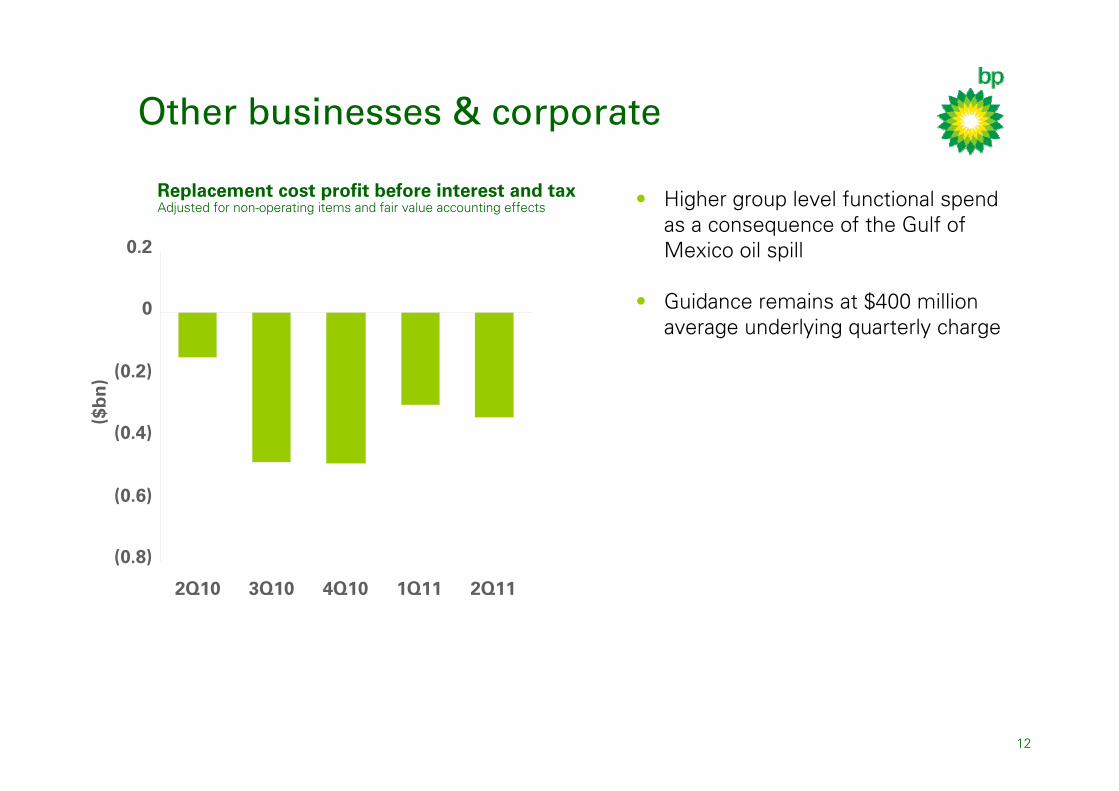
Other businesses & corporate
• Higher group level functional spend as a consequence of the Gulf of Mexico oil spill
• Guidance remains at $400 million average underlying quarterly charge
(0.8)
(0.6)
(0.4)
(0.2)
0
0.2
2Q10 3Q10 4Q10 1Q11 2Q11
($b
n)
Adjusted for non-operating items and fair value accounting effectsReplacement cost profit before interest and tax
13
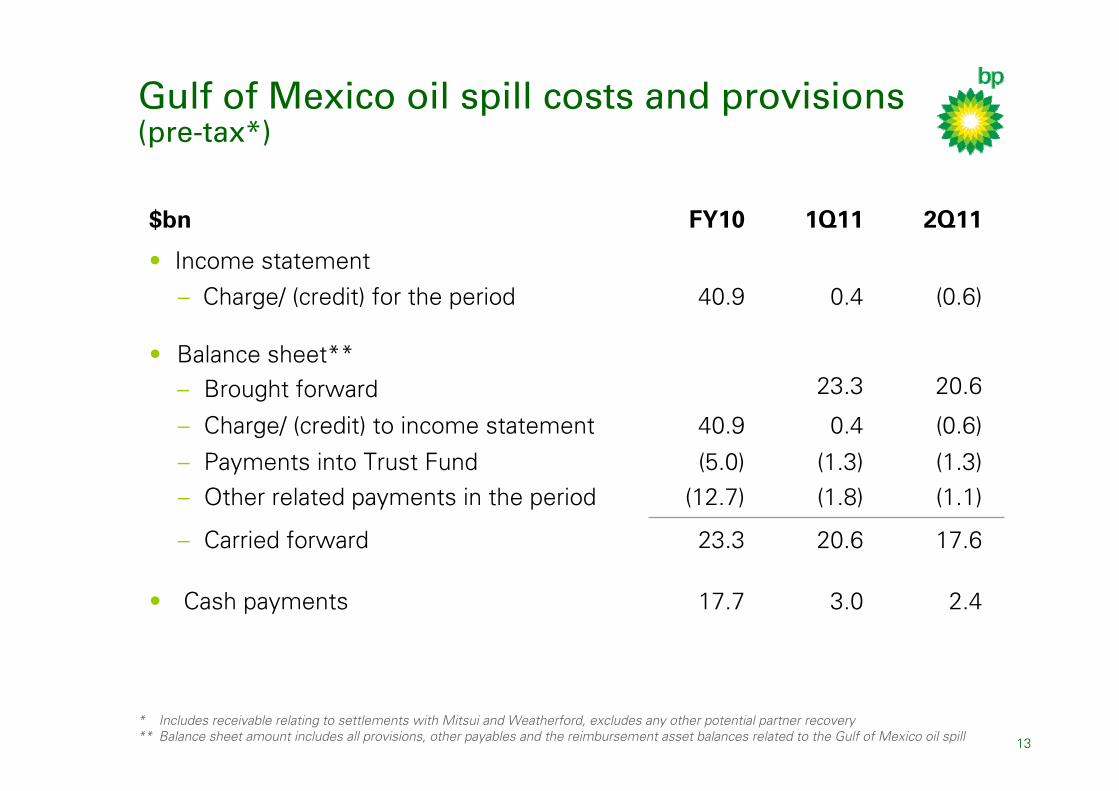
Gulf of Mexico oil spill costs and provisions(pre-tax*)
3.0
20.6
(1.8)(1.3)
0.4
23.3
0.4
1Q11
2.4
17.6
(1.1)(1.3)
(0.6)
20.6
(0.6)
2Q11
17.7
23.3
(12.7)(5.0)
40.9
40.9
FY10
• Cash payments
– Payments into Trust Fund– Other related payments in the period
– Carried forward
– Charge/ (credit) to income statement
• Balance sheet**– Brought forward
– Charge/ (credit) for the period• Income statement
$bn
* Includes receivable relating to settlements with Mitsui and Weatherford, excludes any other potential partner recovery** Balance sheet amount includes all provisions, other payables and the reimbursement asset balances related to the Gulf of Mexico oil spill
14
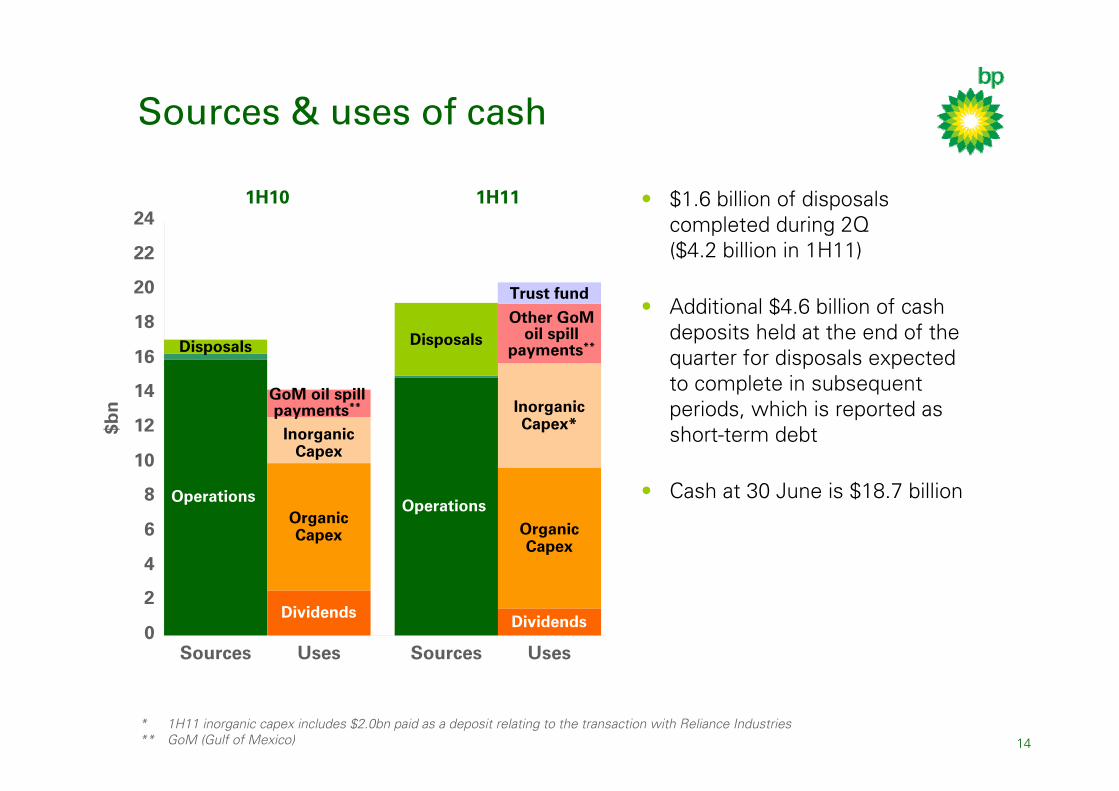
Sources & uses of cash
• $1.6 billion of disposals completed during 2Q ($4.2 billion in 1H11)
• Additional $4.6 billion of cash deposits held at the end of the quarter for disposals expected to complete in subsequent periods, which is reported as short-term debt
• Cash at 30 June is $18.7 billion
1H10 1H11
DividendsDividends
Operations Operations
Disposals Disposals
0
2
4
6
8
10
12
14
16
18
20
22
24
Sources Uses Sources Uses
$bn
OrganicCapex
InorganicCapex
OrganicCapex
InorganicCapex*
Trust fund
Other GoMoil spill
payments**
GoM oil spill payments**
* 1H11 inorganic capex includes $2.0bn paid as a deposit relating to the transaction with Reliance Industries** GoM (Gulf of Mexico)

15
Net debt ratio
%10 to 20%
20 to 30%
0
5
10
15
20
25
30
35
2008 2009 2010 2011 2012
Net debt ratio = net debt / (net debt + equity)Net debt includes the fair value of associated derivative financial instruments used to hedge finance debtCash of $4.6bn received as deposits for disposals completing after period-end is reported as short-term debt at 30 June 2011
16
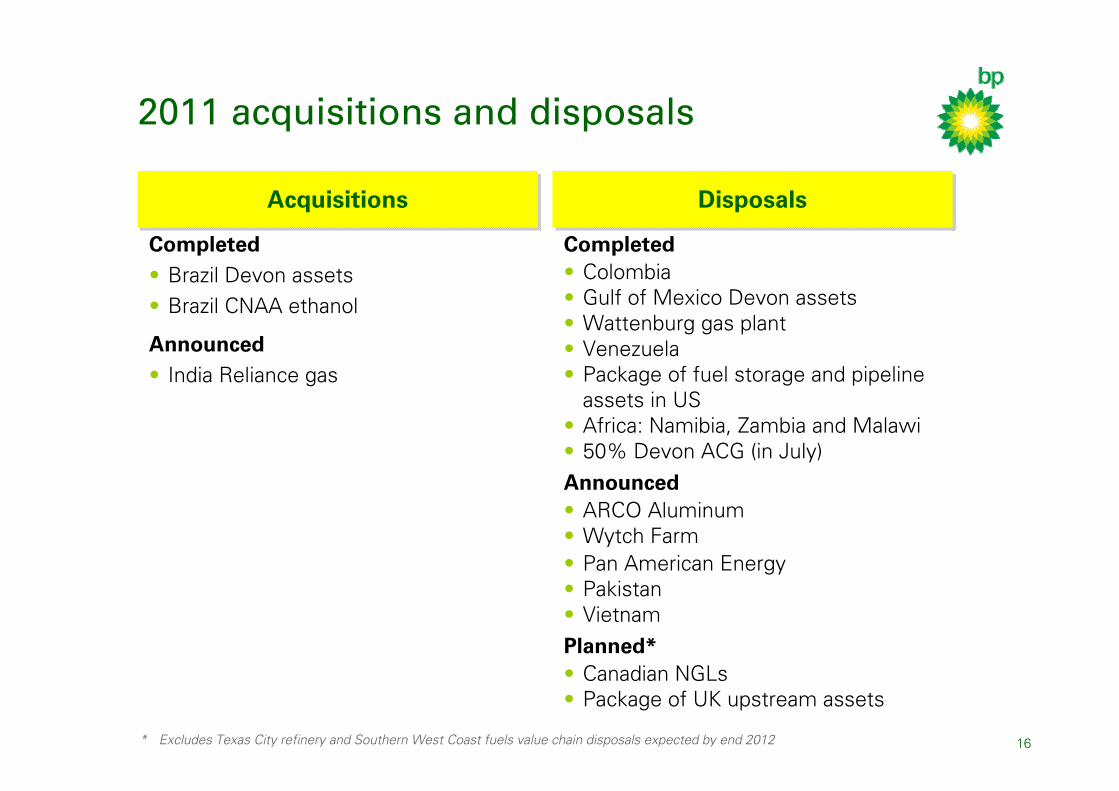
2011 acquisitions and disposals
AcquisitionsAcquisitions DisposalsDisposals
Completed• Brazil Devon assets• Brazil CNAA ethanol
Announced• India Reliance gas
Completed• Colombia• Gulf of Mexico Devon assets• Wattenburg gas plant• Venezuela• Package of fuel storage and pipeline
assets in US• Africa: Namibia, Zambia and Malawi• 50% Devon ACG (in July)Announced• ARCO Aluminum• Wytch Farm• Pan American Energy• Pakistan • VietnamPlanned*• Canadian NGLs• Package of UK upstream assets
* Excludes Texas City refinery and Southern West Coast fuels value chain disposals expected by end 2012
17
Bob DudleyGroup Chief Executive

18
Putting safety and operational risk management at the heart of BP
Safety & Operational Risk (S&OR) organization in place and in action
• S&OR professionals deployed into operating businesses
• New authorities and accountabilities established
• Expanded audit oversight and capacity
• Building competence and capability for the long term
Implementing lessons from Gulf of Mexico oil spill
• Bly report recommendations under implementation
• Global Wells framework and standards

19
Rebuilding trust
Meeting our commitments in the US
• Completing the response− Majority of shoreline clean-up complete
• Gulf Coast showing promising signs of recovery− Strong signs of improvement for tourism and seafood during 1H 2011− All federal commercial fishing areas open
• Funding economic and environmental restoration of the Gulf− $6.8bn in claims and government payments*− $1bn committed to early natural resource restoration projects − $8.6bn paid into Trust Fund
• New voluntary enhanced drilling standards in the Gulf of Mexico
Sharing and implementing lessons globally
• Sharing lessons with industry, regulators, and government
* As at end of 2Q. Includes $5.1bn paid out of the Trust Fund

20
Indicated dates*
Key investigations
• Presidential Commission final report 11 January 2011
• US Coast Guard preliminary report 22 April 2011
• Marine Board investigation final report To be determined
• Chemical Safety Board report To be determined
• National Academy of Engineers final report Autumn 2011
Department of Justice inquiry continues
Multi District Litigation trials
• Limitation & Liability trial February 2012
Gulf of Mexico liabilities: timeline and milestones
* Dates expected as at July 2011
21
Upstream value growth
• Risk reduction
• Active portfolio management
• Growing operating cash faster than production
• Increased investment with a focus on exploration
• Growth engines
− Deepwater
− Gas value chains
− Giant fields
22
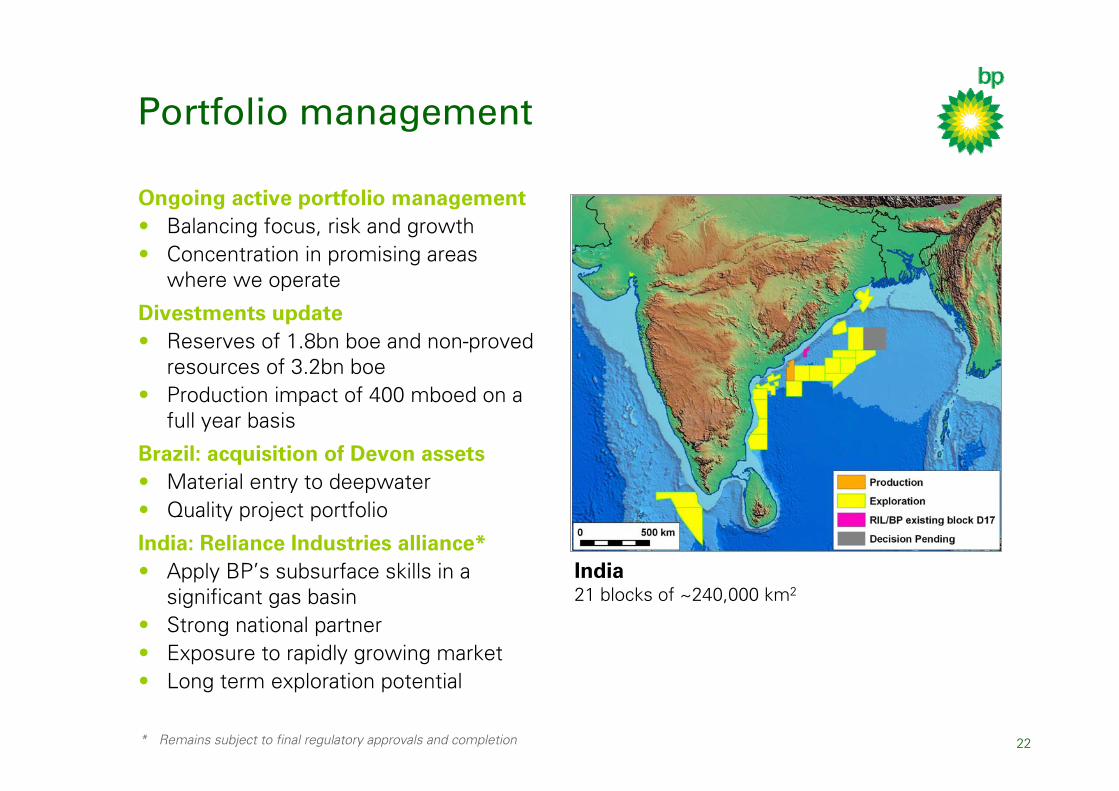
Portfolio management
Ongoing active portfolio management• Balancing focus, risk and growth• Concentration in promising areas
where we operate
Divestments update• Reserves of 1.8bn boe and non-proved
resources of 3.2bn boe• Production impact of 400 mboed on a
full year basis
Brazil: acquisition of Devon assets• Material entry to deepwater• Quality project portfolio
India: Reliance Industries alliance*• Apply BP’s subsurface skills in a
significant gas basin• Strong national partner• Exposure to rapidly growing market • Long term exploration potential
India21 blocks of ~240,000 km2
* Remains subject to final regulatory approvals and completion

23
Operating cash growth
Potential to grow operating cash flow
• Unit operating cash margin growth
• Production growth
Near term milestones
• Greater Plutonio now online following turnaround
• Re-starting drilling operations in the Gulf of Mexico
• Nine major projects online by end of 2013
• Cash flow from Iraq investment
• Improving margin mix in 2012: Angola, Gulf of Mexico
• Approval of Indian Reliance Industries deal

24
Growth 2012–2013
Angola North SeaGulf of Mexico
Location Project Type Gross capacityAngola Angola LNG 14 5 mtpa
Block 31 PSVM* 27 150 mboed
Clochas-Mavacola 27 100 mboed
Oil
Asia Pacific North Rankin 2 17 1,800 mmscfd
Gas
Gulf of Mexico Galapagos* 47-67 60 mboed
* BP Operated
North Sea Devenick* 89 200 mmscfdKinnoull* 77 50 mboed
Russia (TNK-BP) Uvat Central Expansion 50 110 mboed
Verkhnechonskoye Full Field Development
34 145 mboed
2012/2013 Major Project start-ups
BP workinginterest %

25
Increased investment for growth
• Up to 1 mmboed of production by end 2016 from new projects
• Increasing organic capital reinvestment for longer-term growth
• Half of capital over the next five years focused on growth post 2016
• Capital efficiency is critical: competitive returns on capital invested
26
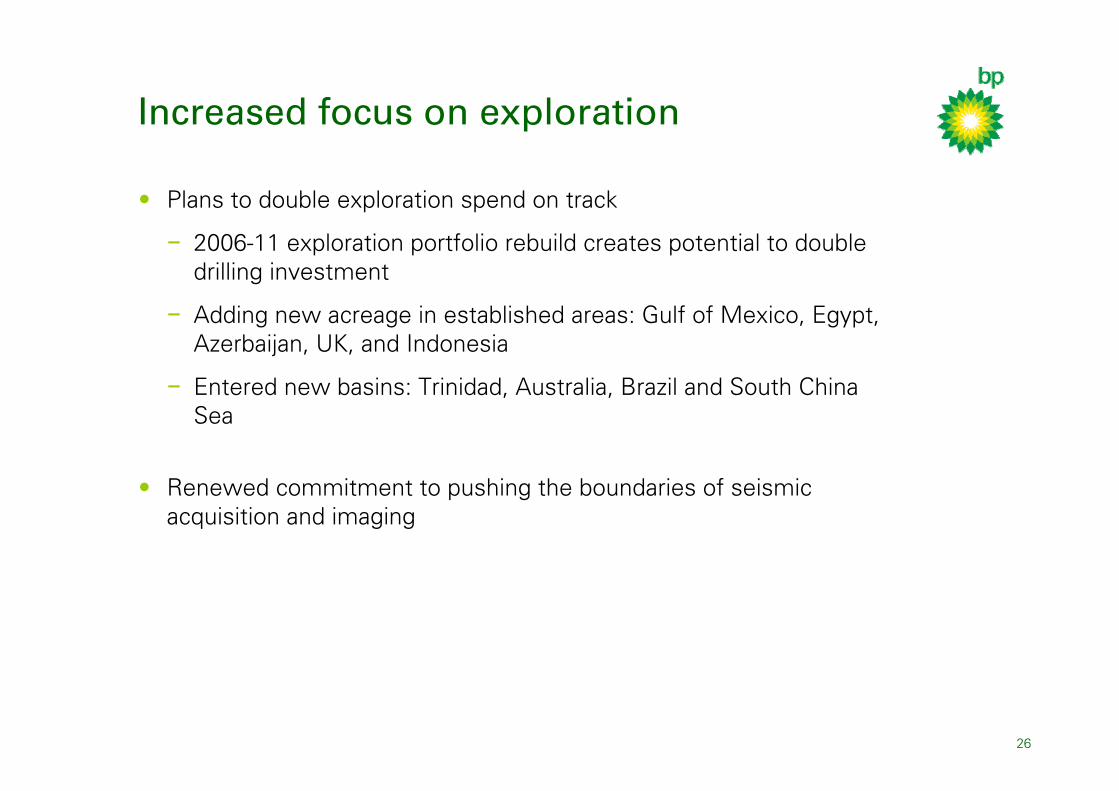
Increased focus on exploration
• Plans to double exploration spend on track
− 2006-11 exploration portfolio rebuild creates potential to double drilling investment
− Adding new acreage in established areas: Gulf of Mexico, Egypt, Azerbaijan, UK, and Indonesia
− Entered new basins: Trinidad, Australia, Brazil and South China Sea
• Renewed commitment to pushing the boundaries of seismic acquisition and imaging

27
Brazil10 blocks of ~10,000km2
New access
Australia100% interest in 4 blocks of ~24,500km2
Adelaide
Trinidad 100% interest in 2 blocks of ~3,500 km2
28
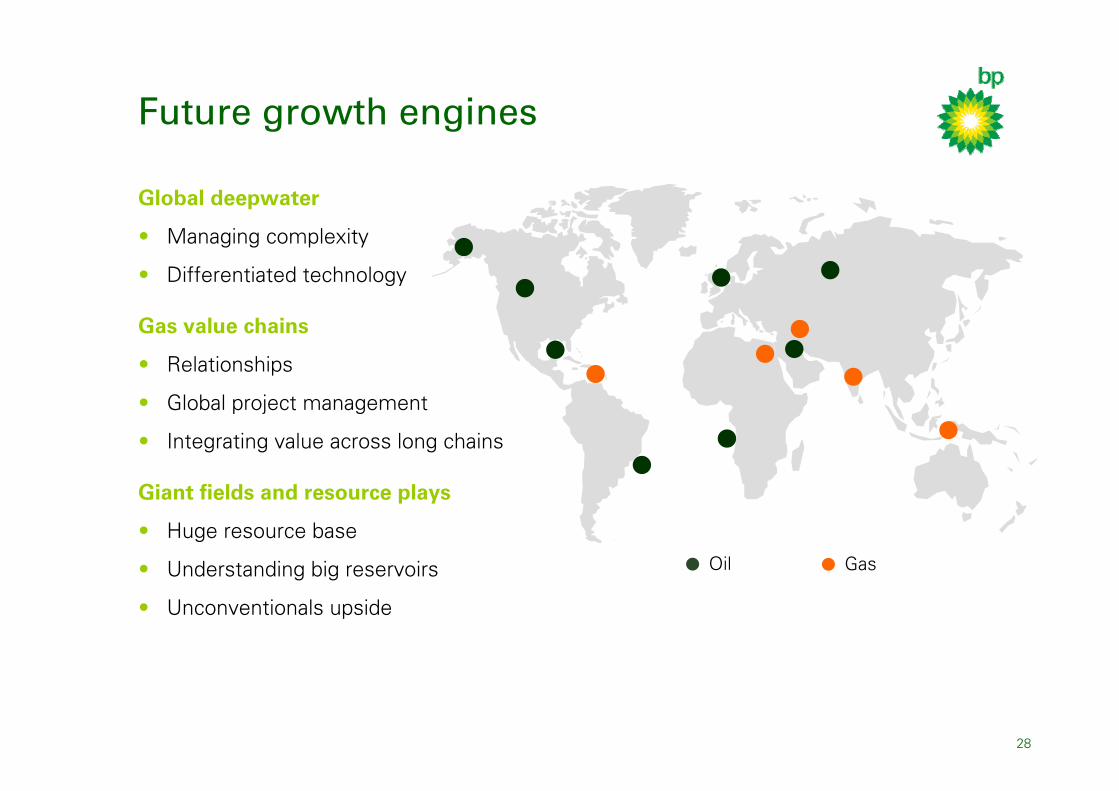
Future growth engines
Global deepwater
• Managing complexity
• Differentiated technology
Gas value chains
• Relationships
• Global project management
• Integrating value across long chains
Giant fields and resource plays
• Huge resource base
• Understanding big reservoirs
• Unconventionals upside
Oil Gas
29
Refining & Marketing value growth
Safety and trust
• Safe and reliable operations remain the number one priority
• Focus on process safety risk management and Operating Management System
Earnings momentum
• On track to deliver in excess of $2bn p.a. underlying RC profit improvement by end 2012 versus 2009
• Total underlying RC profit improvement 2012 versus 2007 forecast to be ~$7bn p.a.
Portfolio focus
• Strengthen Fuels Value Chains− Reposition US− Grow and improve returns in rest of world
• Growth in International Businesses
Growth and returns
• Capable of enduring growth within disciplined financial framework
• Delivery of attractive returns and strong free cash flow
30
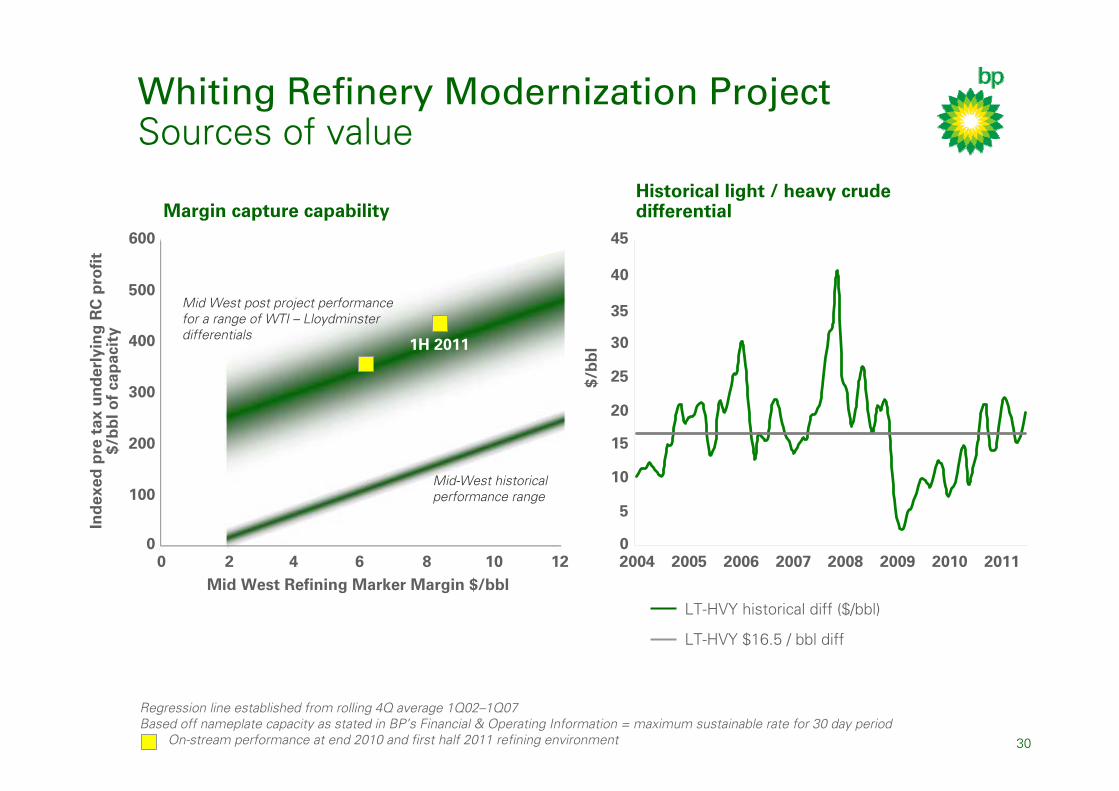
Whiting Refinery Modernization ProjectSources of value
Historical light / heavy crude differential
Regression line established from rolling 4Q average 1Q02–1Q07Based off nameplate capacity as stated in BP’s Financial & Operating Information = maximum sustainable rate for 30 day period
On-stream performance at end 2010 and first half 2011 refining environment
Mid-West historical performance range
Mid West post project performance for a range of WTI – Lloydminster differentials
1H 2011
Ind
exed
pre
tax
un
der
lyin
g R
C p
rofi
t $/
bb
l of
cap
acit
y
Mid West Refining Marker Margin $/bbl0 2 4 6 8 10 12
0
100
200
300
400
500
600
$/b
bl
LT-HVY historical diff ($/bbl)
LT-HVY $16.5 / bbl diff
2004 2005 2006 2007 2008 2009 2010 20110
45
40
35
30
25
20
15
10
5
Margin capture capability
31
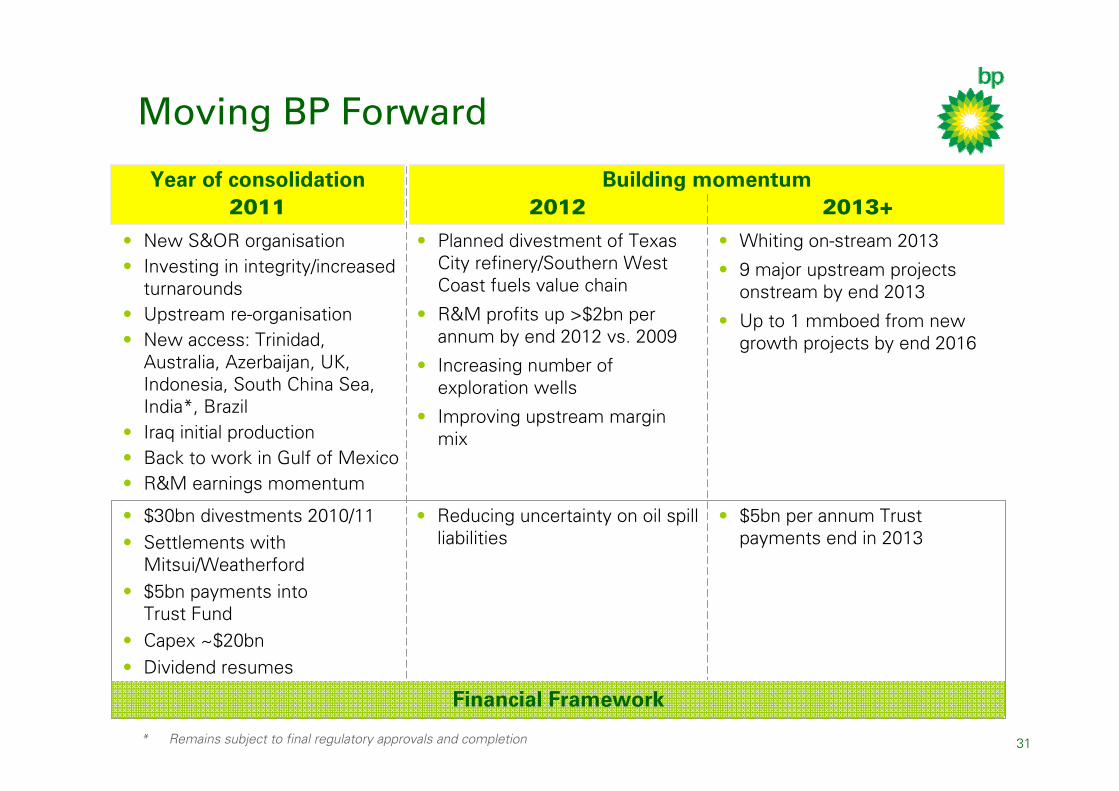
Year of consolidation
Moving BP Forward
• New S&OR organisation• Investing in integrity/increased
turnarounds • Upstream re-organisation• New access: Trinidad,
Australia, Azerbaijan, UK, Indonesia, South China Sea, India*, Brazil
• Iraq initial production• Back to work in Gulf of Mexico• R&M earnings momentum
• $30bn divestments 2010/11• Settlements with
Mitsui/Weatherford• $5bn payments into
Trust Fund• Capex ~$20bn• Dividend resumes
• Reducing uncertainty on oil spill liabilities
• Planned divestment of Texas City refinery/Southern West Coast fuels value chain
• R&M profits up >$2bn per annum by end 2012 vs. 2009
• Increasing number of exploration wells
• Improving upstream margin mix
• Whiting on-stream 2013
• 9 major upstream projects onstream by end 2013
• Up to 1 mmboed from new growth projects by end 2016
• $5bn per annum Trust payments end in 2013
Building momentum2012 2013+2011
Financial Framework
* Remains subject to final regulatory approvals and completion
32
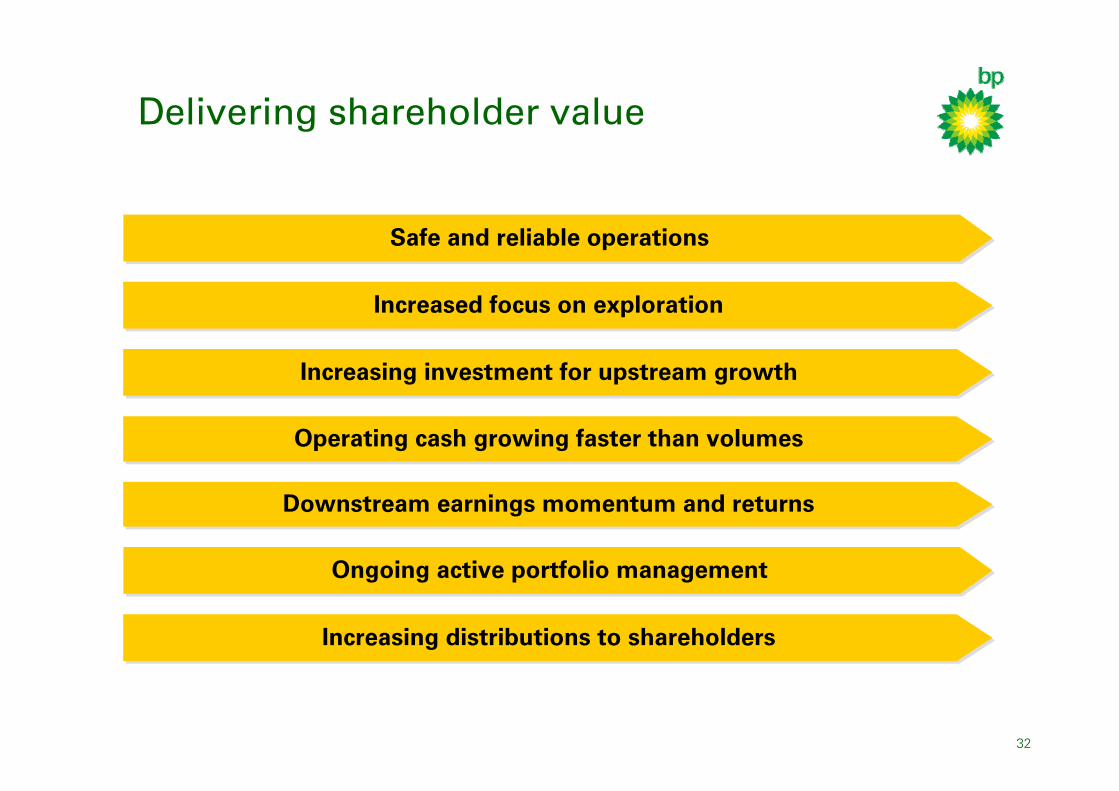
Delivering shareholder value
Increased focus on explorationIncreased focus on exploration
Operating cash growing faster than volumesOperating cash growing faster than volumes
Increasing investment for upstream growthIncreasing investment for upstream growth
Increasing distributions to shareholdersIncreasing distributions to shareholders
Safe and reliable operationsSafe and reliable operations
Ongoing active portfolio managementOngoing active portfolio management
Downstream earnings momentum and returnsDownstream earnings momentum and returns
33
Q&A
Mark Bly
Executive Vice President, Safety & Operational Risk
Byron Grote
Chief Financial Officer
Bob Dudley
Group Chief Executive
Mike Daly
Executive Vice President, Exploration
Bernard Looney
Executive Vice President, Developments
Bob Fryar
Executive Vice President, Production
Iain Conn
Chief Executive Refining & Marketing
Lamar McKay
Chairman and President, BP America