2q 2021 financial summary - slworld.com
TRANSCRIPT

SL Corporation
2Q 2021
Financial Summary

Company History
1954
Founded(Samlip)
1954
Founded
1986
R&D CenterEstablished
2004
CI Changed to SL
2013GM Overdrive Award
(First in Asia)
2019
2021Present
Hyundai-KiaSupplier of the Year Grand Prize
GM SOYAwarded (24th)
Listed on the Korea Exchange
1988
Page ◦ 1
Page ◦ 2
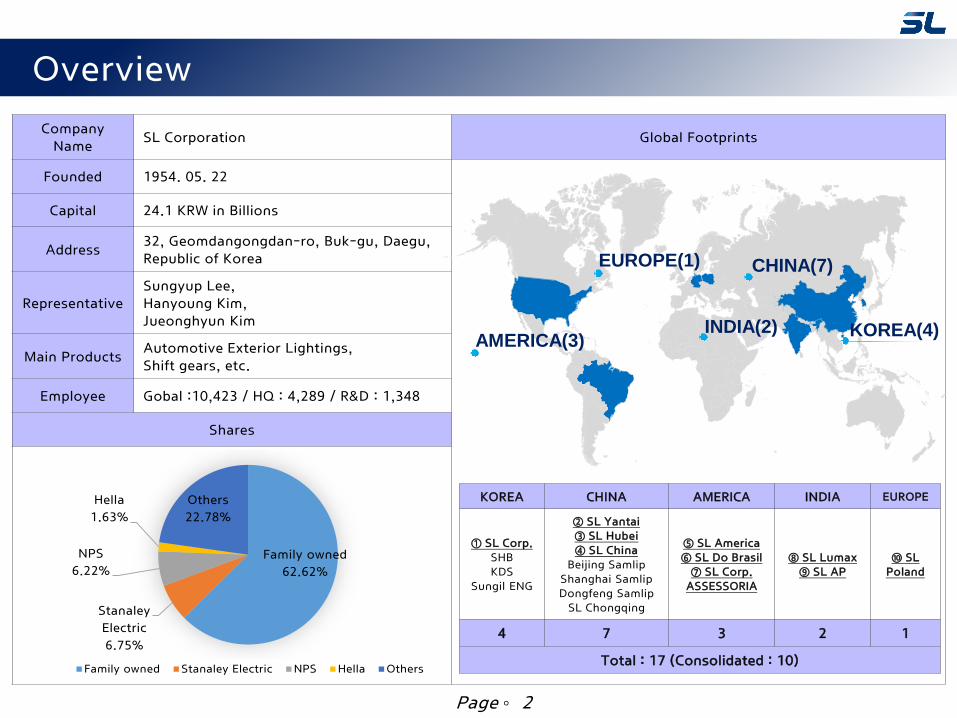
Overview
Company Name
SL Corporation Global Footprints
Founded 1954. 05. 22
Capital 24.1 KRW in Billions
Address32, Geomdangongdan-ro, Buk-gu, Daegu, Republic of Korea
RepresentativeSungyup Lee, Hanyoung Kim,Jueonghyun Kim
Main ProductsAutomotive Exterior Lightings, Shift gears, etc.
Employee Gobal :10,423 / HQ : 4,289 / R&D : 1,348
Shares
Family owned
62.62%
Stanaley
Electric
6.75%
NPS
6.22%
Hella
1.63%
Others
22.78%
Family owned Stanaley Electric NPS Hella Others
AMERICA(3)
EUROPE(1) CHINA(7)
INDIA(2) KOREA(4)
KOREA CHINA AMERICA INDIA EUROPE
① SL Corp.SHBKDS
Sungil ENG
② SL Yantai③ SL Hubei④ SL China
Beijing SamlipShanghai SamlipDongfeng Samlip
SL Chongqing
⑤ SL America⑥ SL Do Brasil⑦ SL Corp.
ASSESSORIA
⑧ SL Lumax⑨ SL AP
⑩ SL Poland
4 7 3 2 1
Total : 17 (Consolidated : 10)

Corporate Governance
SHB
50.0
KDS
47.0
SLAMERICA
100
SL LUMAX
78.7
SL AP
100
SL CHINA
100
DONGFENGSAMLIP
50.0
SL POLAND
100
SL DO BRASIL
100
BEIJINGSAMLIP
51.0
SLCHONGQING
50.0
SLHUBEI
50.0
SLALABAMA
SL TENNESSEE
Asia PacificHolding
100
SL YANTAI
SHANGHAISAMLIP
60.0
WUHANSAMLIP
AMERICA INDIA CHINA POLAND BRAZILKOREA
SL CORPOATION
SL Mirrotech
-
(SL Direct/Indirect75% shares)
Consolidated
Family owned company
Page ◦ 3
SL Corp,ASSESSORIA
100
Sungil ENG
45.0

Company Introduction
Page ◦ 4
(KRW in Billions)
Country Company Name Products City CustomersRevenue(FY2020)
Shares
Korea
SL
CHASSIS Gyeongsan HKMC
1,739.4 Family Owned 62.6%LAMP
Daegu HMCAnsan KMC
Chunan GM, HKMC
SHB FEMUlsan, Seosan,
HwasungHKMC 701.2 SL 50% HBPO 50%
KDS DOOR LATCH Gyeongsan SL 68.8 SL 47% Inteva 53%
China
Shanghai Samlip CHASSIS Shanghai BHMC 142.6 SL 60%Shanghai Huizhong
40%
Beijing Samlip LAMP Beijing BHMC 107.0 SL 51% HELLA/BHAP 24.5%
Dongfeng Samlip LAMP ShiyanDongfeng
Group49.6 SL 50% Dongfeng 50%
Samlip Yantai LAMP Yantai SGM 128.3 SL 100%
SL Choongqing LAMP ChongqingJiangLin/
CHANGAN52.8 SL 50%
Chongqing QinchuanIndustry Group 50%
SL Hubei LAMP HubeiDongfend/
Gleey18.1 SL 50% Dongfend Samlip 50%
SL China R&D Shanghai - 11.0 SL 100%
America
SL Alabama LAMP,CHASSIS AlexanderHMMA
572.9 SL 100%KMMG
SL Tennessee LAMP,CHASSIS Clinton GM
SL DO BRASIL LAMP Gravatai GM 208.3 SL 100%
IndiaSL LUMAX LAMP,CHASSIS
KancheepuramDist.
HMI 80.9 SL 79% Lumax 21%
SL AP LAMP Guntur KMI 39.3 SL 100%
Poland SL PolandCHASSIS, MIRROR
Zory, Poland HMMC/KMS 25.4 SL 100%

432.0
762.7
193.0 204.1 124.1
292.0
164.7
393.5 235.6
98.3
105.0
161.6
46.9
101.5
57.5
57.0
4.6
40.7
34.4
10.9
2.6
1.4
-
200.0
400.0
600.0
800.0
1,000.0
1,200.0
2017 2018 2019 2020 2021
Others
FORD
China OEM
GM
HKMC
697.4
935.1
429.8 396.5 245.4
199.6
158.5
224.0 160.8
70.3
27.2
-
-
200.0
400.0
600.0
800.0
1,000.0
1,200.0
2017 2018 2019 2020 2021
Electronics
Chassis
Lamp
Yearly Order (End of July) 42% achieved
897.0KRW in Billions
PRODUCT
CUSTOMER
비고
Page ◦ 5FY2021 Target
754.9 KRW in Billions
Section 1,093.6KRW in Billions
653.8KRW in Billions
584.5KRW in Billions
315.4KRW in Billions

Page ◦ 6
Financial Results
(Unit : KRW in Billions)
Classification 2Q21 2Q20 YoY% 1Q21 QoQ%
REVENUE 719.9 420.4 71.2% 740.4 -2.8%
COGS -640.0 -403.0 58.8% -641.3 -0.2%
% out of Revenue -88.9% -95.9% 7.0%p -86.6% -2.3%p
SG&A -43.3 -31.4 38.2% -42.2 2.6%
% out of Revenue -6.0% -7.5% 1.4%p -5.7% -0.3%p
Operating Income 3.7 -1.4 -361.9% 5.7 -35.6%
% out of Revenue 0.5% -0.3% 0.8%p 0.8% -0.3%p
Profit before tax 48.9 -7.4 -760.7% 71.5 -31.5%
% out of Revenue 6.8% -1.8% 8.6%p 9.7% -2.9%p
Net Income 37.4 -5.6 -771.5% 53.4 -30.0%
% out of Revenue 5.2% -1.3% 6.5%p 7.2% -2.0%p
Profit or Loss Summary

Page ◦ 7
Financial ResultsBalanced Sheet Summary
(Unit : KRW in Billions)
Classification 2Q21 4Q20 Variance
Asset 2,467.5 2,339.0 128.6
Cash 212.1 133.1 79.0
Liability 955.5 913.8 41.7
Debt 346.0 303.4 42.6
Equity 1,512.0 1,425.2 86.8
Capital 24.1 24.1 0.0
L/E ration 63.2% 64.1% -0.9%p
D/E Ratio 22.9% 21.3% 1.6%p
Net D/E Ratio 8.9% 12.0% -3.1%p

Page ◦ 8
Financial Results
(KRW in Billions)
413.5 392.2
319.7
-
50.0
100.0
150.0
200.0
250.0
300.0
350.0
400.0
450.0
2Q21 1Q21 2Q20
Korea
156.6
176.8
35.9
-
50.0
100.0
150.0
200.0
2Q21 1Q21 2Q20
North America
40.4
47.1 41.1
-
10.0
20.0
30.0
40.0
50.0
2Q21 1Q21 2Q20
China
94.4 104.5
16.5
-
20.0
40.0
60.0
80.0
100.0
120.0
2Q21 1Q21 2Q20
India
YoY21.35.4%
QoQ93.8
29.3%
YoY-20.2
-11.4%
QoQ120.7
335.6%
YoY-6.6
-14.1%
QoQ-0.7
-1.7%
YoY-10.1-9.6%
QoQ77.9
472.1%
Regional Sales

Financial Results
Page ◦ 9
(Unit : KRW in Billions)
1Q21 2Q21 FY2021 1Q20 2Q20 3Q20 4Q20 FY2020
Revenue 598.9 605.9 1,204.8 475.5 359.6 569.1 600.8 2,005.0
OperatingIncome 45.1 26.3 71.4 36.4 -1.1 34.1 14.0 83.3
% 7.5% 4.3% 5.9% 7.6% -0.3% 6.0% 2.3% 4.2%
Revenue 94.8 83.3 178.1 86.9 48.0 88.8 101.9 325.6
OperatingIncome 5.3 -2.1 3.2 0.0 -9.2 8.1 -1.4 -2.5
% 5.6% -2.5% 1.8% 0.0% -19.2% 9.2% -1.3% -0.8%
Revenue 46.7 30.7 77.4 50.5 12.8 24.4 86.6 174.4
OperatingIncome 6.4 12.3 18.7 -5.7 -3.7 1.8 19.9 12.3
% 13.6% 40.1% 24.1% -11.2% -28.6% 7.2% 23.0% 7.1%
740.4 719.9 1,460.3 612.9 420.4 682.3 789.4 2,505.0
Classification
Lamp
Chassis
Others
Total
Divisional profit or loss Summary

Financial Results
Page ◦ 10
(Unit : KRW in Billions)
CompanyFY2021
TOTALFY2020
TOTAL1Q21 2Q21 1Q20 2Q20 3Q20 4Q20
SL Corp.
Revenue 491.6 493.9 985.5 408.5 342.4 442.2 546.2 1,739.4
Net Income54.7 44.1 98.8 29.6 17.3 26.6 18.2 91.7
11.1% 8.9% 10.0% 7.3% 5.1% 6.0% 3.3% 5.3%
SL America
Revenue 177.3 171.6 348.9 152.3 42.3 171.1 207.2 572.9
Net Income1.7 -8.0 -6.3 -1.5 -17.7 -4.3 4.9 -18.5
1.0% -4.7% -1.8% -1.0% -42.0% -2.5% 2.4% -3.2%
SL Lumax
Revenue 76.0 70.1 146.1 54.6 13.6 63.7 76.5 208.3
Net Income1.7 -1.4 0.3 1.2 -4.8 3.1 2.1 1.5
2.2% -2.0% 0.2% 2.1% -35.3% 4.9% 2.7% 0.7%
SL Yantai
Revenue 36.7 29.8 66.5 20.7 32.1 34.4 41.1 128.3
Net Income-0.8 -0.4 -1.2 -1.9 0.1 -0.5 2.5 0.2
-2.2% -1.3% -1.8% -9.2% 0.2% -1.4% 6.2% 0.2%
SL China
Revenue 2.9 1.1 4.1 0.8 2.2 4.3 3.6 11.0
Net Income0.6 0.6 1.2 -1.4 -0.5 2.0 0.6 0.6
20.1% 52.3% 29.0% -170.5% -24.0% 45.5% 15.6% 5.7%
SL Poland
Revenue 11.1 10.0 21.1 13.1 5.7 9.2 11.3 39.3
Net Income0.5 0.9 1.4 -0.0 0.5 -0.7 0.5 0.3
4.6% 8.8% 6.6% -0.1% 8.1% -7.2% 4.4% 0.7%
SL Do Brasil
Revenue 6.1 1.8 7.9 7.5 1.2 8.3 8.4 25.4
Net Income-2.6 3.4 0.9 -9.6 -2.4 0.8 5.0 -6.2
-41.8% 192.1% 11.1% -127.3% -200.2% 9.5% 59.6% -24.6%
SL AP
Revenue 28.4 25.2 53.6 21.7 4.9 24.8 29.5 80.9
Net Income3.6 -0.4 3.1 -2.2 -3.4 0.4 1.2 -4.0
12.6% -1.7% 5.9% -10.4% -69.1% 1.7% 4.1% -5.0%
SL Hubei
Revenue 2.8 5.0 7.7 1.7 4.2 5.2 7.0 18.1
Net Income-0.9 -0.2 -1.1 -0.5 -0.7 -1.5 -0.9 -3.6
-33.1% -3.4% -14.0% -30.4% -15.8% -29.2% -12.8% -19.9%
SL & Subsidiaries profit or loss summary
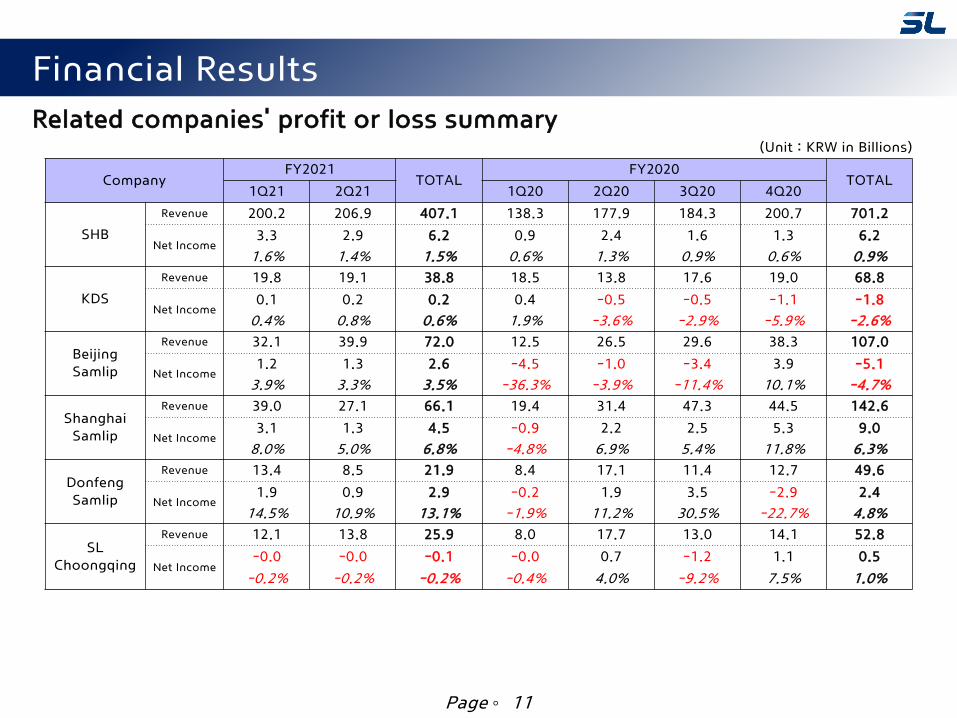
Financial Results
Page ◦ 11
(Unit : KRW in Billions)
CompanyFY2021
TOTALFY2020
TOTAL1Q21 2Q21 1Q20 2Q20 3Q20 4Q20
SHB
Revenue 200.2 206.9 407.1 138.3 177.9 184.3 200.7 701.2
Net Income3.3 2.9 6.2 0.9 2.4 1.6 1.3 6.2
1.6% 1.4% 1.5% 0.6% 1.3% 0.9% 0.6% 0.9%
KDS
Revenue 19.8 19.1 38.8 18.5 13.8 17.6 19.0 68.8
Net Income0.1 0.2 0.2 0.4 -0.5 -0.5 -1.1 -1.8
0.4% 0.8% 0.6% 1.9% -3.6% -2.9% -5.9% -2.6%
Beijing Samlip
Revenue 32.1 39.9 72.0 12.5 26.5 29.6 38.3 107.0
Net Income1.2 1.3 2.6 -4.5 -1.0 -3.4 3.9 -5.1
3.9% 3.3% 3.5% -36.3% -3.9% -11.4% 10.1% -4.7%
Shanghai Samlip
Revenue 39.0 27.1 66.1 19.4 31.4 47.3 44.5 142.6
Net Income3.1 1.3 4.5 -0.9 2.2 2.5 5.3 9.0
8.0% 5.0% 6.8% -4.8% 6.9% 5.4% 11.8% 6.3%
Donfeng Samlip
Revenue 13.4 8.5 21.9 8.4 17.1 11.4 12.7 49.6
Net Income1.9 0.9 2.9 -0.2 1.9 3.5 -2.9 2.4
14.5% 10.9% 13.1% -1.9% 11.2% 30.5% -22.7% 4.8%
SL Choongqing
Revenue 12.1 13.8 25.9 8.0 17.7 13.0 14.1 52.8
Net Income-0.0 -0.0 -0.1 -0.0 0.7 -1.2 1.1 0.5
-0.2% -0.2% -0.2% -0.4% 4.0% -9.2% 7.5% 1.0%
Related companies' profit or loss summary

Thank You