investor presentation 2q-2021 - franklin electric
TRANSCRIPT

Investor Presentation 2Q-2021Gregg Sengstack, Chairperson and CEO
John J. Haines, VP – Chief Financial Officer
April 2021
2
SAFE HARBOR STATEMENT:
"Safe Harbor” Statement under the Private Securities Litigation Reform Act of 1995. Any forward-looking statementscontained herein, including those relating to market conditions or the Company’s financial results, costs, expenses orexpense reductions, profit margins, inventory levels, foreign currency translation rates, liquidity expectations,business goals and sales growth, involve risks and uncertainties, including but not limited to, risks and uncertaintieswith respect to general economic and currency conditions, various conditions specific to the Company’s business andindustry, weather conditions, new housing starts, market demand, competitive factors, changes in distributionchannels, supply constraints, effect of price increases, raw material costs, technology factors, integration ofacquisitions, litigation, government and regulatory actions, the Company’s accounting policies, future trends,epidemics and pandemics, and other risks which are detailed in the Company’s Securities and Exchange Commissionfilings, included in Item 1A of Part I of the Company’s Annual Report on Form 10-K for the fiscal year endingDecember 31, 2020, Exhibit 99.1 attached thereto and in Item 1A of Part II of the Company’s Quarterly Reports onForm 10-Q. These risks and uncertainties may cause actual results to differ materially from those indicated by theforward-looking statements. All forward-looking statements made herein are based on information currentlyavailable, and the Company assumes no obligation to update any forward-looking statements.
3
STRATEGIC FOCUS:
To grow as a global provider of water and fuel
systems, through geographic expansion and product
line extensions, leveraging our global platform
and competency in system design.

Investment Highlights
Leading market position in groundwater pumping systems
Track record of consistent organic growth across segments
Advantageous global footprint to extend leadership and capture revenue in developing markets
Proven cash flow generation with FCF growth CAGR of 23% since 2016 (5 yr. CAGR)
Strong balance sheet with net debt-to-EBITDA < 0.2x and opportunity for investment
History of returning capital to shareholders; Dividends paid CAGR of 12% since 1993
Corporate strategy aligned with ESG principles; Focus on increasing transparency
4
5
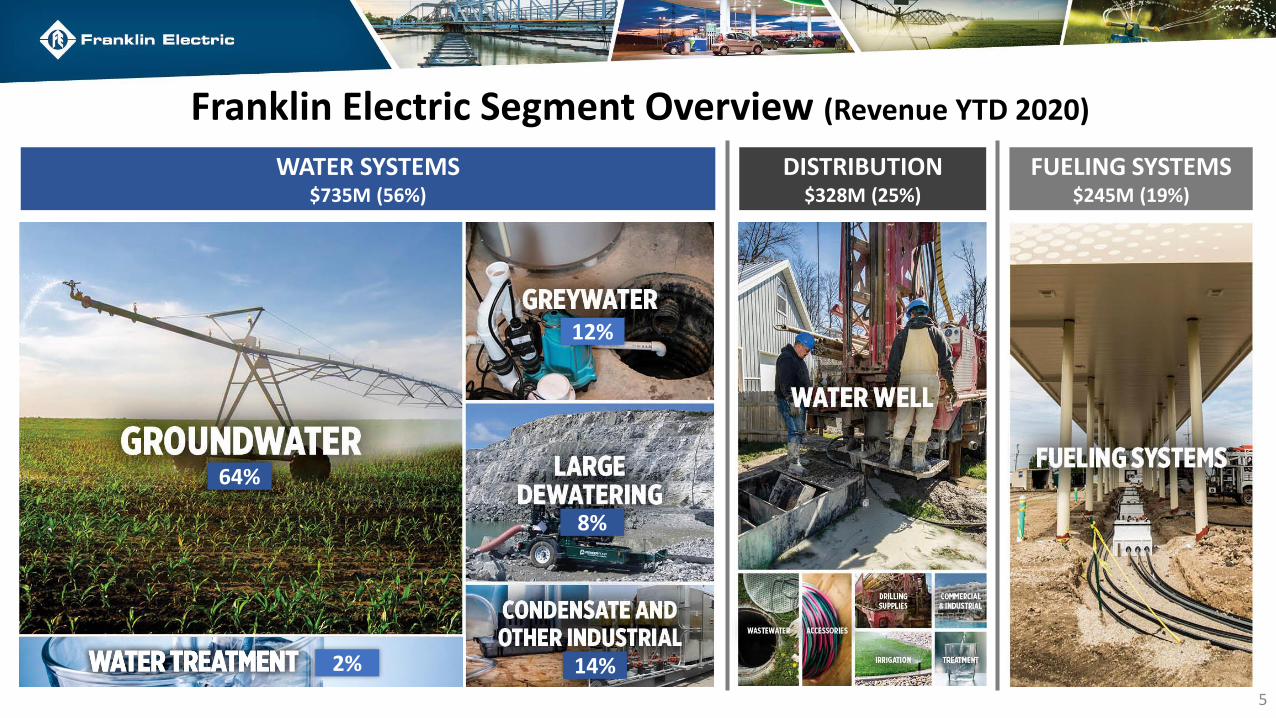
WATER SYSTEMS$735M (56%)
FUELING SYSTEMS$245M (19%)
DISTRIBUTION$328M (25%)
Franklin Electric Segment Overview (Revenue YTD 2020)
14%
8%
12%
64%
2%
6
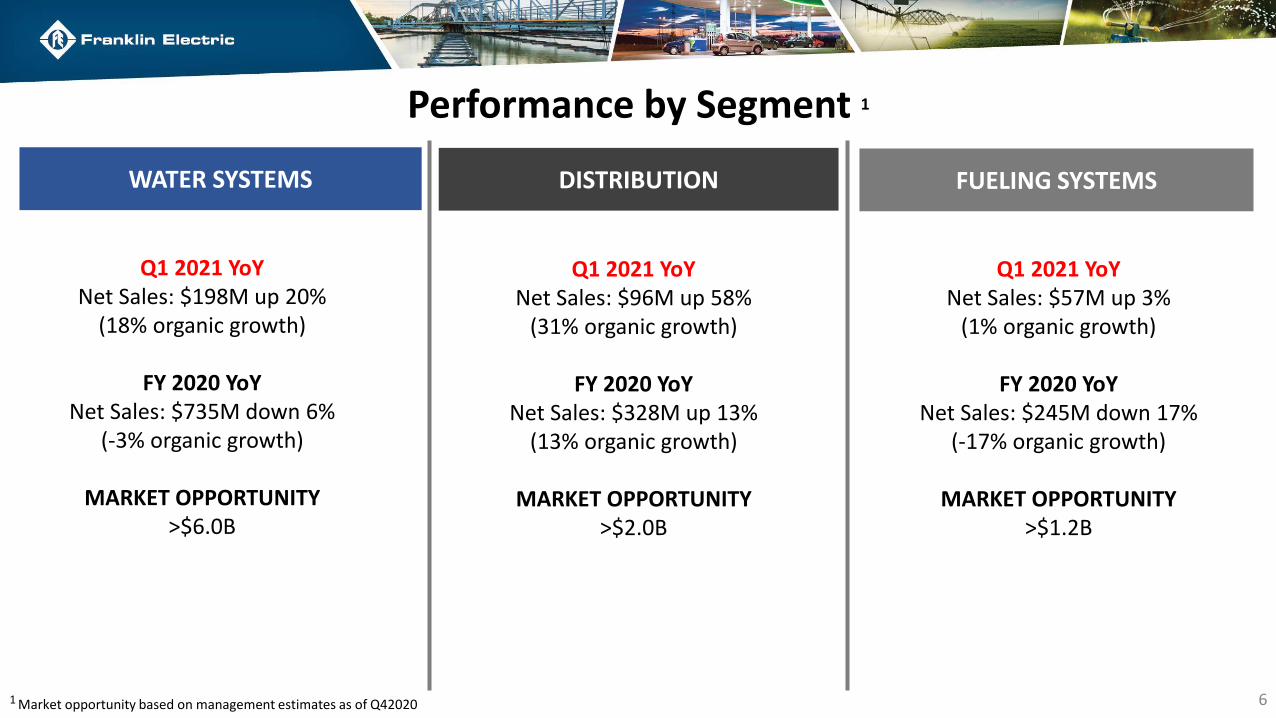
WATER SYSTEMS FUELING SYSTEMSDISTRIBUTION
Q1 2021 YoYNet Sales: $198M up 20%
(18% organic growth)
FY 2020 YoY Net Sales: $735M down 6%
(-3% organic growth)
MARKET OPPORTUNITY>$6.0B
Q1 2021 YoYNet Sales: $57M up 3%
(1% organic growth)
FY 2020 YoYNet Sales: $245M down 17%
(-17% organic growth)
MARKET OPPORTUNITY>$1.2B
Q1 2021 YoYNet Sales: $96M up 58%
(31% organic growth)
FY 2020 YoYNet Sales: $328M up 13%
(13% organic growth)
MARKET OPPORTUNITY>$2.0B
1 Market opportunity based on management estimates as of Q42020
Performance by Segment 1

Water Systems Evolution
2000MOTORS & CONTROLS
2020PUMPING SYSTEMS
7
Franklin has evolved its portfolio and established itself as a leading supplier ofgroundwater pumping systems, and forward integrating in the U.S.

Headwater Distribution Companies
• Extend our position in groundwater
• Move closer to contractor
• Optimize supply chain
• Opportunities to move into adjacencies:
• Filtration
• Treatment
• Irrigation
• Commercial
• Gicon Pump & Equipment acquired December 2020
8

Fueling Evolution
2000PUMPS & CONTROLS
2020TOTAL SYSTEMS
9
Proven growth from listening to and serving our customers
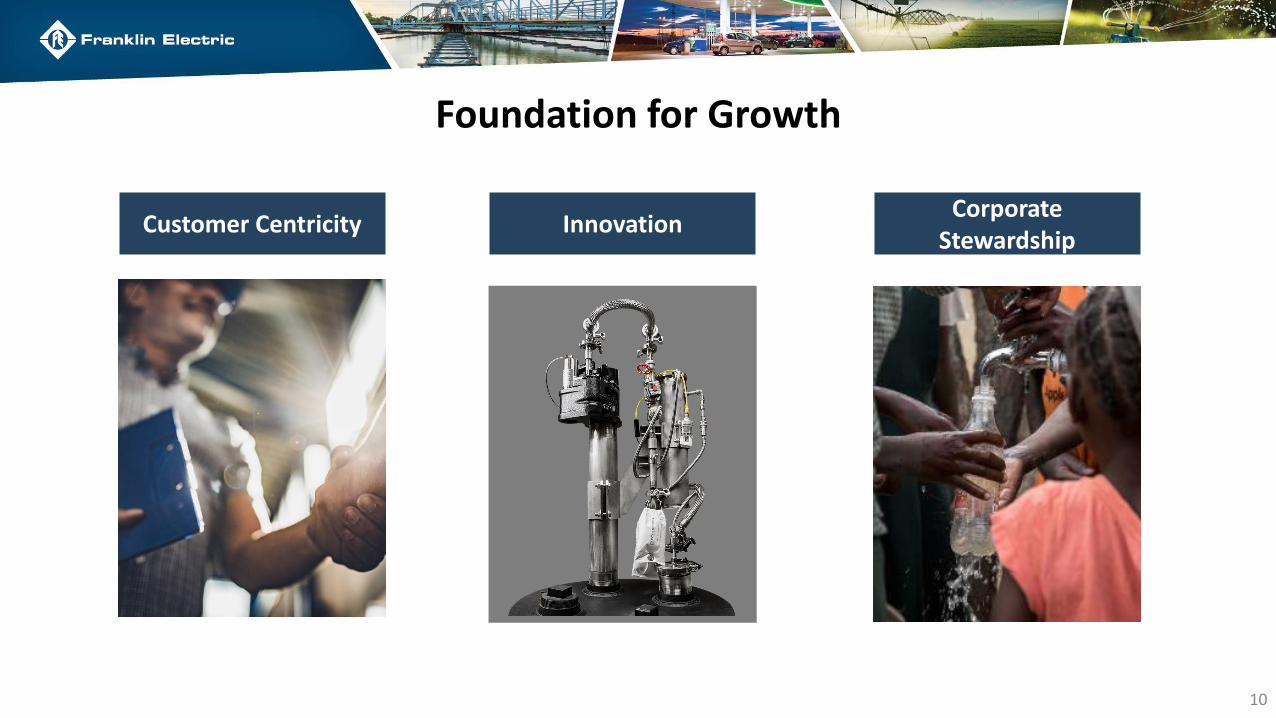
Foundation for Growth
InnovationCustomer CentricityCorporate
Stewardship
10

11
Customer Centricity
Continue driving productivity & building a competitive advantage by closely connecting the value chain to the customer.
Functional focus areas
1. Order Management, Distribution & Logistics– Customer centric fulfillment to achieve service level agreement (SLA)
2. Central Planning – Inventory optimization to support SLA & address network complexity
3. Manufacturing – Demand driven execution & lean focus to drive productivity & responsiveness
4. Sourcing – Supply chain risk mitigation & continued MCOS reduction focus

Innovations in Water Systems
High-Efficiency Permanent Magnet Motors
4 & 6 inch encapsulatedsubmersible motors with
lower operating costs.
Variable Frequency Driveswith Bluetooth-Enabled Mobile Apps
Residential/Commercial HVAC, Cooling Tower, & Pumping
Applications
Patent-pending design configurations exceed
U.S. Dept of Energy regulations
High-EfficiencySubmersible Pumps
Inline Delta Pressure Booster
High-Rise Buildings & LightIndustrial Applications
Quiet modular design withbuilt-in proprietary protection features.
12
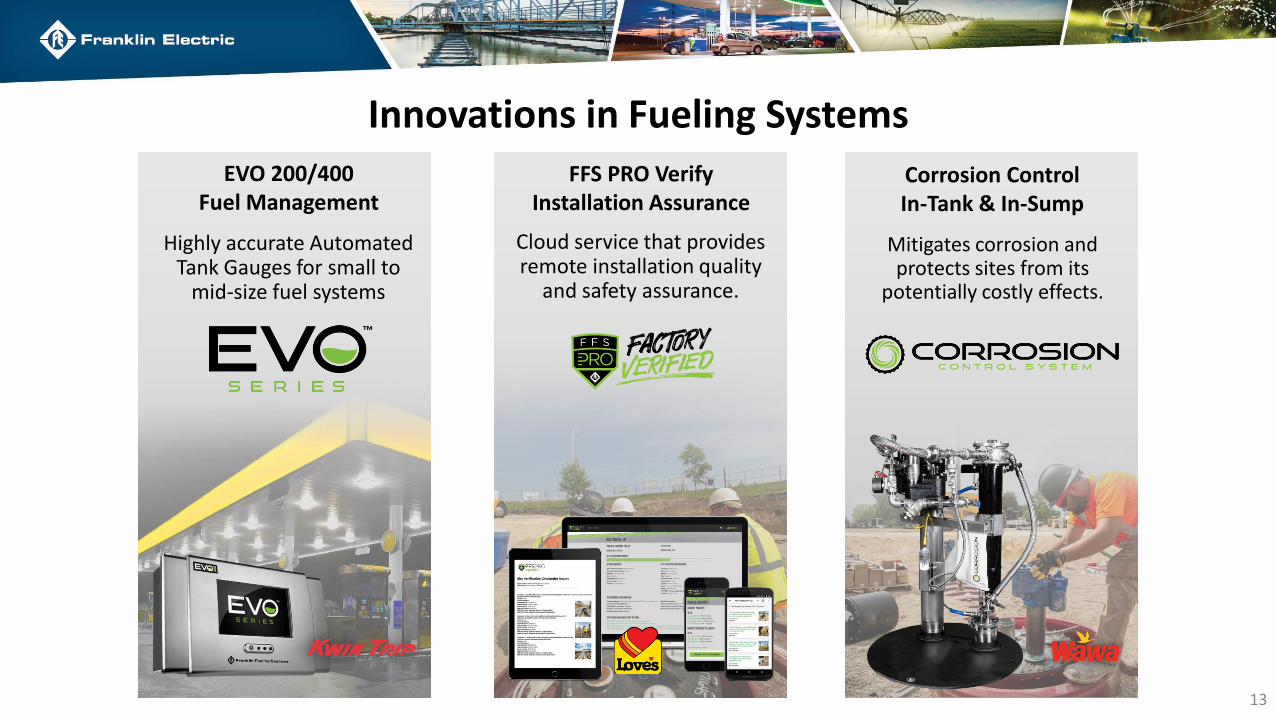
Innovations in Fueling Systems
FFS PRO VerifyInstallation Assurance
Cloud service that provides remote installation quality
and safety assurance.
Corrosion Control In-Tank & In-Sump
Mitigates corrosion and protects sites from its
potentially costly effects.
EVO 200/400Fuel Management
Highly accurate Automated Tank Gauges for small to
mid-size fuel systems
13

14
Corporate Stewardship
Corporate strategy aligned with ESG principles; Focus on increasing transparency
• Engagement across all levels • Prioritize employee health and
wellness• Actively monitor progress 1
• TRR down 33% in 2020• LTR down 17% in 2020
• Senior Management Reviews at least monthly
• Decouple growth from negative environmental impacts
• Promote diversity and inclusion initiatives
• Highlight culture of continuous training and improvement
• Hold employees and suppliers to high standards
• Continue to improve supply chain transparency
• Establish transparency around ESG measures
• Integrate ESG into Long Range Planning process
1 TRR = Total Recordable Rate of work-related injury or illness; LTR = Lost Time Rate for work-related injury or illness
Commitment to SafetyPromote a culture of continuous health and safety training
Continuous ImprovementMeasure ESG impact & drive improvement
Operational IntegrityEnsuring proper practices and ethics throughout our business and relationships
Board-Level OversightExecutive-led ESG committee focused on sustainability initiatives and driving improvement of metrics against targets

Strategic Priorities
Franklin Electric is well positioned to drive long-term shareholder returns
3 Identify opportunities for inorganic growth
• Pursue strategic and accretive acquisitions
• Priorities: Water Treatment, Grid Solutions, Distribution
2Maintain competitive
advantages that lead to operational efficiencies
• Extend leadership position via quality, availability and cost
• Optimize distribution network and manufacturing footprint
• Become global DCX leader for customers
1 Continue to drive organic growth
• Customer-focused innovation• Enhance position in industrial channel• 10 year Developing Region Growth CAGR of 8%• Drive synergies through the entire U.S. Groundwater Pro
channel
15

16
Capital Allocation Performance & Priorities
2006 – 2020 FCF Deployment
CAPEX27%
Acquisitions35%
Dividends23%
Share Repurchases
15%
Priorities for Cash Deployment
1 Opportunistic approach to acquisitions with >$640M in deal capacity (a)
2 Reinvestment in business to drive organic growth
3 Dividends paid CAGR of 8% (2006 to 2020)
4 Opportunistic share repurchases
(a) At 3/31/21
17
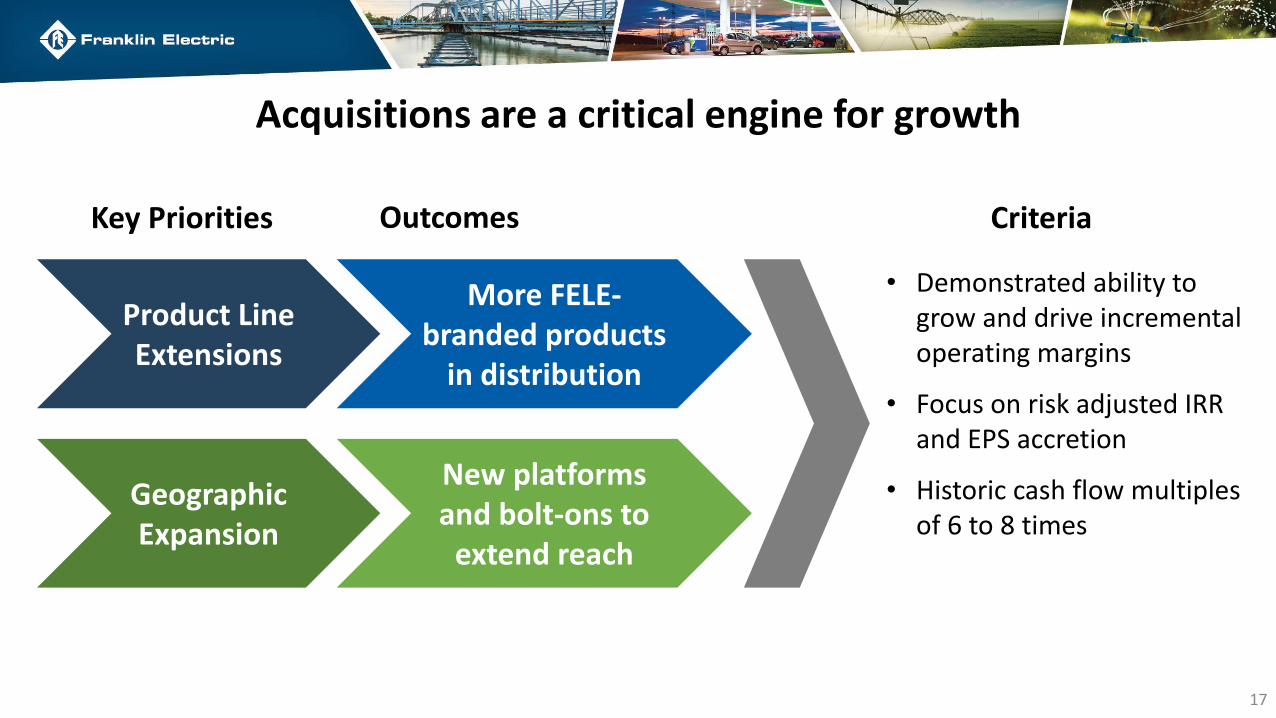
Acquisitions are a critical engine for growth
Product Line Extensions
Geographic Expansion
Key Priorities
More FELE-branded products
in distribution
New platforms and bolt-ons to
extend reach
• Demonstrated ability to grow and drive incremental operating margins
• Focus on risk adjusted IRR and EPS accretion
• Historic cash flow multiples of 6 to 8 times
CriteriaOutcomes
Financial Performance Summary
18

19
Financial Performance Summary
23%FREE CASH FLOW1
CAGRFY2016-2020
16.2%ROIC2
YTD 2020
7%EPS
(BEFORE RESTRUCT.)CAGR
FY2016-2020
7%NET REVENUE
CAGRFY2016-2020
$950 $1,125
$1,298 $1,315 $1,247
$-
$200
$400
$600
$800
$1,000
$1,200
$1,400
2016 2017 2018 2019 2020
Consolidated Sales
$1.64 $1.92
$2.26 $2.07 $2.18
$-
$0.50
$1.00
$1.50
$2.00
$2.50
2016 2017 2018 2019 2020
EPS (before restructuring)
1FCF = Cash Flow from Operations less net CAPEX2ROIC based on pre-tax calculation
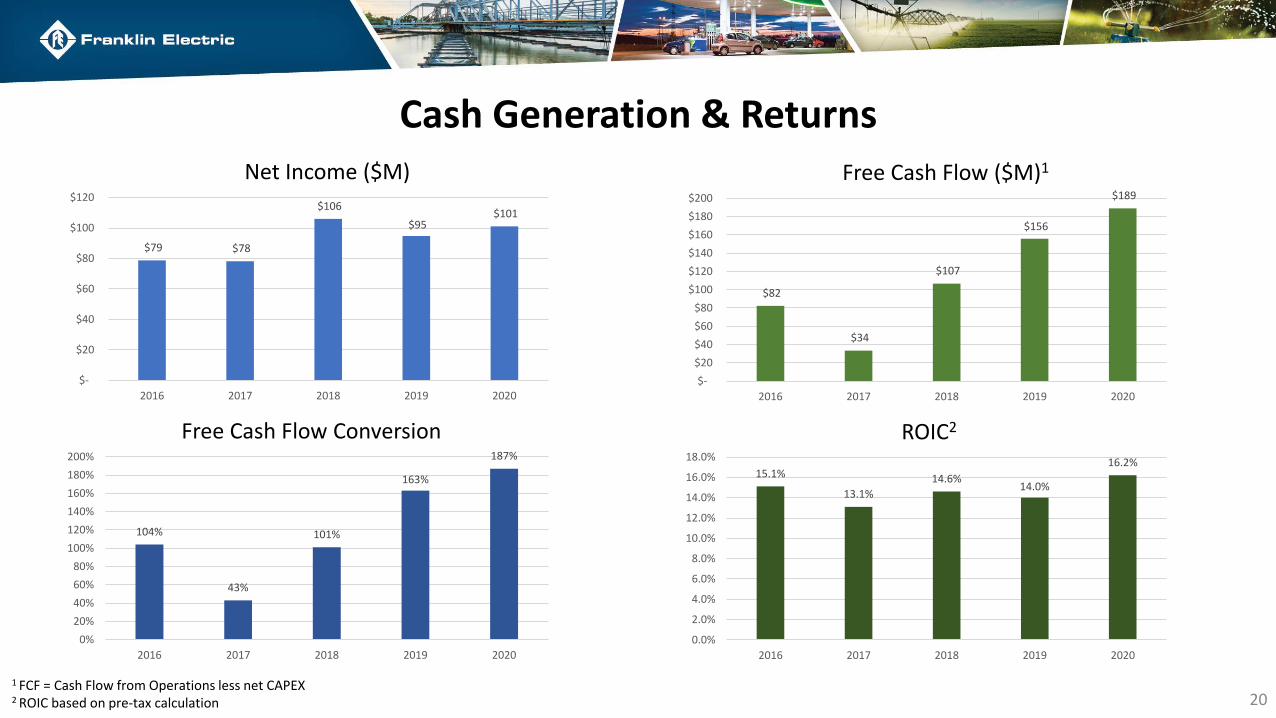
Cash Generation & Returns
$79 $78
$106
$95 $101
$-
$20
$40
$60
$80
$100
$120
2016 2017 2018 2019 2020
Net Income ($M)
Free Cash Flow Conversion
104%
43%
101%
163%
187%
0%
20%
40%
60%
80%
100%
120%
140%
160%
180%
200%
2016 2017 2018 2019 2020
ROIC2
15.1%
13.1%
14.6%14.0%
16.2%
0.0%
2.0%
4.0%
6.0%
8.0%
10.0%
12.0%
14.0%
16.0%
18.0%
2016 2017 2018 2019 2020
$82
$34
$107
$156
$189
$-
$20
$40
$60
$80
$100
$120
$140
$160
$180
$200
2016 2017 2018 2019 2020
Free Cash Flow ($M)1
1 FCF = Cash Flow from Operations less net CAPEX2 ROIC based on pre-tax calculation 20

1 Distribution first measured in 2018. Excludes acquisitions for one year and impact of Foreign Currency translation. *2020 Total Water organic sales excluding Pioneer dewatering equipment was +4.1%.*2020 Total Fueling Systems organic sales excluding China sales was (8.5)%.
Organic Sales Growth 1
21
2.5%
8.1%
-0.1%
-2.5%
18.3%
8.2%
15.0%
3.5%
-16.7%
1.3%
3.1%
0.1%
12.5%
31.5%
-20.0%
-10.0%
0.0%
10.0%
20.0%
30.0%
40.0%
2017 2018 2019 2020 2021 YTD
Water Systems Fueling Systems Distribution
Investment Highlights
Leading market position in groundwater pumping systems
Track record of consistent organic growth across segments
Advantageous global footprint to extend leadership and capture revenue in developing markets
Proven cash flow generation with FCF growth CAGR of 23% since 2016 (5 yr. CAGR)
Strong balance sheet with net debt-to-EBITDA < 0.2x and opportunity for investment
History of returning capital to shareholders; Dividends paid CAGR of 12% since 1993
Corporate strategy aligned with ESG principles; Focus on increasing transparency
22

For More Information:
John J. Haines, VP – CFO, Franklin Electric Co. Inc.
[email protected]. 260-827-5442
23