2q18 at-a-glances3.amazonaws.com/assets.highwoods.com/content/investors/...2q18 at-a-glance bye...
TRANSCRIPT
RISING
CASH
FLOWs
INTEREST RATES
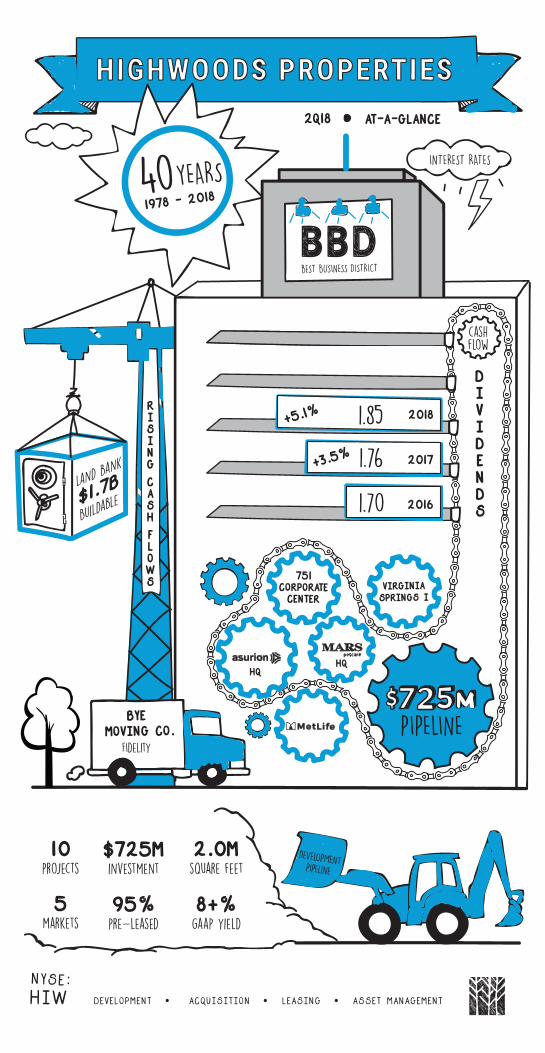
40YEARS1978 - 2018
NYSE:HIW DEVELOPMENT ACQUISITION LEASING ASSET MANAGEMENT
cashflow
BEST BUSINESS DISTRICT
Land Ban
k
$1.7BBuild
able
AT-A-GLANCE2q18
BYE MOVING CO.
FIdelity
DIVIDENDs
PIPELINE
HQ
751 CORPORATE CENTER
VirginIA SPRINGS I
20181.85+5.1%
1.76+3.5% 2017
1.70 2016
HQ
10projects
$725minvestment
2.0msquare feet
5markets
95%pre-leased
8+%gaap yield
DEVELOPMENTPIPELINE

FINANCIAL PERFORMANCE
Market Under Construction (SF 000) Projects % of Stock Pre-leased (%)
Nashville 2,974 15 8.8 16.9
Raleigh 1,261 7 2.4 57.3
Atlanta 1,183 3 1.0 85.7
Orlando 289 2 1.3 95.8
Tampa 250 1 0.9 64.0
Richmond, Greensboro, Pittsburgh, Memphis
Nothing Under Construction
2014
DEVELOPMENT PIPELINE 2 3
Development Announcement Timeline
Competitive Construction
Mars Petcare U.S. Headquarters
Asurion Headquarters
224K SF
219K SF
$96MINVESTMENT
$65MINVESTMENT
100%PRE-LEASED
100%PRE-LEASED
MetLife Global Technology Campus
METLIFE I
METLIFE II
Pro Forma Development Cash Rent Commencement
2013 2015 2016 2017
International Paper
$56M
MetLife I & II Campus
$110M
GlenLake V
$37M
11800 Weston
$15M
Seven Springs West
$59M
Laser Spine Institute
$56M
Bridgestone Tower
$200M
Riverwood 200
$107M
Seven Springs II
$38M
5000 CentreGreen
$41M
Virginia Urology
$29M
Mars Petcare U.S. HQ
$96M
751 Corporate Center
$22M
MetLife III
$65M
METLIFE III
AcquisitionsDispositions Development
DividendsCAD
ASSET RECYCLYNG
0
100
200
300
400
500
600
700
800
$M
$M
$B
0
1
3
5
2
4
6
2005 2006 2007 2008 2009 2010 2011 2012 2013 2014 2015 2016 2017 2018
GUIDANCEMIDPOINT
gross book value
Based on new office construction in BBD locations. Excludes BTS and owner occupied projects where existing user buildings are not competitive to HIW product.
Bridgestone TowerNashville
Riverwood 200Atlanta
2017 DELIVERIES
10PROJ
ECTS
$725MINVE
STME
NT2.0M
SQUA
RE FEET
5MARK
ETS
95%PRE-
LEAS
ED
8+%GAAP
YIE
LD
4
100
125
150
175
200
225
200
150
1002014 20162015 2017 2018 E
551KSF
4q21DELIVERY
$285MINVESTMENT
79.4 93.6 106.5Average Shares (M)
101.1 105.6
$394M
1.2MSQUARE FEET
93%LEASED
Asurion HQ
$285M
2018
1q22
20132012
89.2 97.2
Current Pipeline Invst ($M)
SF(000)
Pre-leased(%)
Proforma Stabilized 2Q18 3Q18 4Q18 1Q19 2Q19 3Q19 4Q19 1Q20 2Q203Q20
Riverwood 200 107 299 90 2Q19
Seven Springs II 38 135 73 3Q18
5000 CentreGreen 41 167 87 3Q19
Enterprise IV (Industrial) 8 128 100 4Q18
Virginia Urology 29 87 100 3Q18
751 Corporate Center 22 90 89 4Q20
Mars Petcare U.S. HQ 96 224 100 3Q19
MetLife III 65 219 100 2Q21
Virginia Springs I 34 109 100 3Q20
Asurion HQ 285 551 98 1Q22
Totals $725 2,009 SF 95%
Completed & Stablized Invst ($M)
SF(000)
Leased(%)
Proforma Stabilized 2Q18 3Q18 4Q18 1Q19 2Q19 3Q19 4Q19 1Q20 2Q203Q20
Bridgestone Tower 200 514 100 2Q17
%
0-5 5-10 10-25 25-50 50-75 75-100 >100
0
10
20
30
40
SF (000)
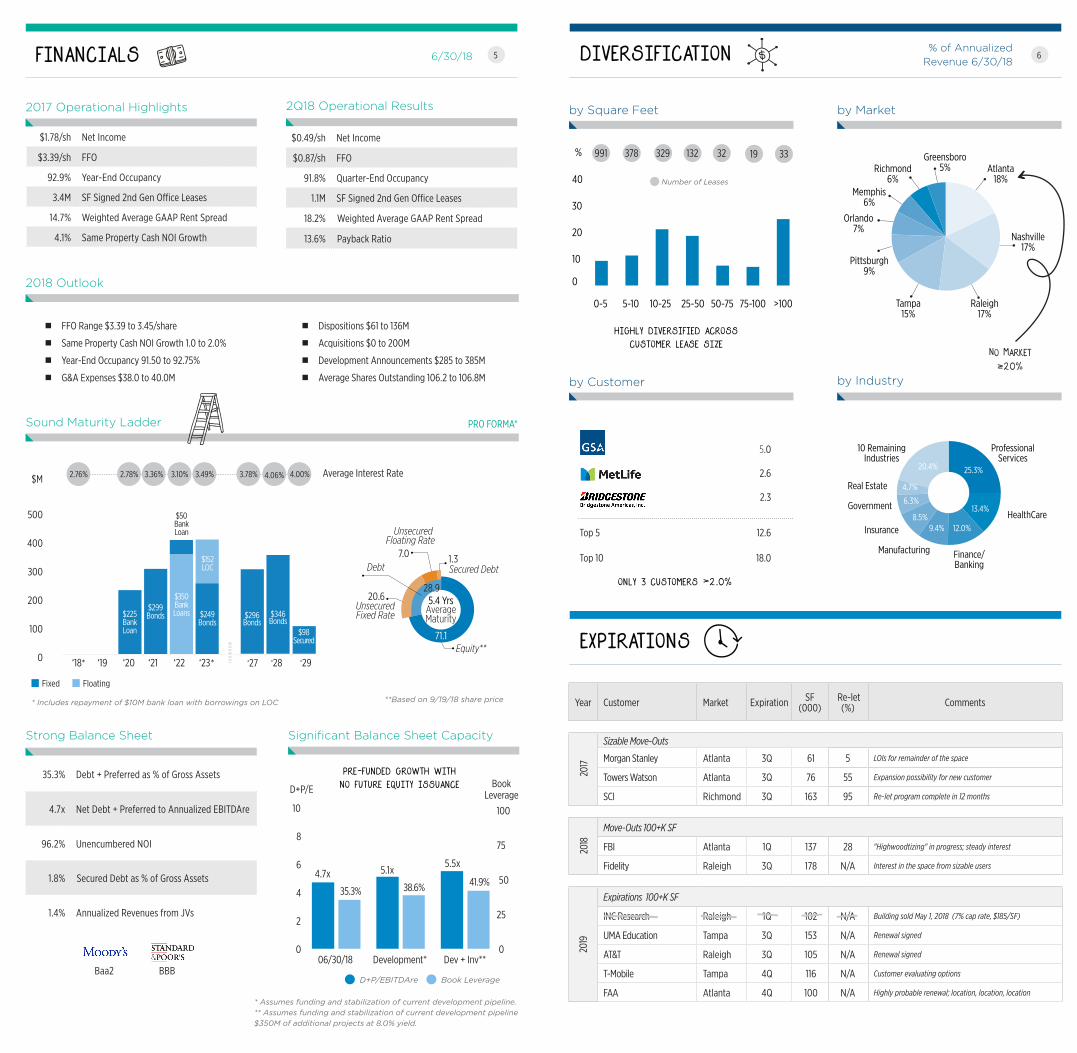
FINANCIALS
$1.78/sh Net Income
$3.39/sh FFO
92.9% Year-End Occupancy
3.4M SF Signed 2nd Gen Office Leases
14.7% Weighted Average GAAP Rent Spread
4.1% Same Property Cash NOI Growth
6/30/18
Fixed Floating
FFO Range $3.39 to 3.45/share
Same Property Cash NOI Growth 1.0 to 2.0%
Year-End Occupancy 91.50 to 92.75%
G&A Expenses $38.0 to 40.0M
Dispositions $61 to 136M
Acquisitions $0 to 200M
Development Announcements $285 to 385M
Average Shares Outstanding 106.2 to 106.8M
1.3
71.1
7.0
20.6AverageMaturity
5.4 Yrs
Equity**
Secured Debt
28.9
Debt
Unsecured Floating Rate
UnsecuredFixed Rate
0
100
400
500
300
200
$M
‘18 ‘19 ‘20 ‘21 ‘22 ‘23 ‘29
$299Bonds$225
BankLoan
$350BankLoans
$50Bank Loan
‘27
2.76% 2.78% 3.36% 3.10% 3.49% 4.00% Average Interest Rate3.78%
$152LOC
PRO FORMA*
4.06%
‘28
**Based on 9/19/18 share price
$249Bonds
$98Secured
$296Bonds
$346Bonds
2017 Operational Highlights
2018 Outlook
Sound Maturity Ladder
35.3% Debt + Preferred as % of Gross Assets
4.7x Net Debt + Preferred to Annualized EBITDAre
96.2% Unencumbered NOI
1.8% Secured Debt as % of Gross Assets
1.4% Annualized Revenues from JVs
Baa2 BBB
Strong Balance Sheet
DIVERSIFICATION
EXPIRATIONS
% of Annualized Revenue 6/30/18
ProfessionalServices
10 RemainingIndustries
Real Estate
Government
Manufacturing
Insurance
HealthCare
Finance/Banking
13.4%
25.3%20.4%
4.7%
6.3%
8.5%9.4% 12.0%
by Market
Raleigh17%
Atlanta18%
Nashville17%
Tampa15%
Memphis6%
Pittsburgh9%
Richmond6%
Greensboro5%
Orlando7%
No Market ≥20%
by Square Feet
Number of Leases
HIGHLY DIVERSIFIED ACROSS CUSTOMER LEASE SIZE
378 329 132 32 19 33991
by Customer
5.0
2.6
2.3
Top 5 12.6
Top 10 18.0
by Industry
ONLY 3 CUSTOMERS >2.0%
* *
5 6
Year Customer Market Expiration SF (000)
Re-let (%) Comments
Sizable Move-Outs
Morgan Stanley Atlanta 3Q 61 5 LOIs for remainder of the space
Towers Watson Atlanta 3Q 76 55 Expansion possibility for new customer
SCI Richmond 3Q 163 95 Re-let program complete in 12 months
Move-Outs 100+K SF
FBI Atlanta 1Q 137 28 "Highwoodtizing" in progress; steady interest
Fidelity Raleigh 3Q 178 N/A Interest in the space from sizable users
Expirations 100+K SF
INC Research Raleigh 1Q 102 N/A Building sold May 1, 2018 (7% cap rate, $185/SF)
UMA Education Tampa 3Q 153 N/A Renewal signed
AT&T Raleigh 3Q 105 N/A Renewal signed
T-Mobile Tampa 4Q 116 N/A Customer evaluating options
FAA Atlanta 4Q 100 N/A Highly probable renewal; location, location, location
2017
2018
2019
* Includes repayment of $10M bank loan with borrowings on LOC
0
2
4
6
8
10
0
25
50
75
100
D+P/EBITDAre Book Leverage
4.7x 5.1x5.5x
35.3% 38.6% 41.9%
D+P/E BookLeverage
06/30/18 Development* Dev + Inv**
* Assumes funding and stabilization of current development pipeline. ** Assumes funding and stabilization of current development pipeline$350M of additional projects at 8.0% yield.
PRE-FUNDED GROWTH WITH NO FUTURE EQUITY ISSUANCE
Significant Balance Sheet Capacity
$0.49/sh Net Income
$0.87/sh FFO
91.8% Quarter-End Occupancy
1.1M SF Signed 2nd Gen Office Leases
18.2% Weighted Average GAAP Rent Spread
13.6% Payback Ratio
2Q18 Operational Results