2q18 results presentation - rns-pdf.londonstockexchange.com
TRANSCRIPT

2Q18 Results July 27th 2018 / 1
2Q18 Results July 27th, 2018

2Q18 Results July 27th 2018 / 2
Disclaimer
This document is only provided for information purposes and does not constitute, nor should it be interpreted as, an offer to sell or exchange or acquire, or an invitation for offers to buy securities issued by any of the aforementioned companies. Any decision to buy or invest in securities in relation to a specific issue must be made solely and exclusively on the basis of the information set out in the pertinent prospectus filed by the company in relation to such specific issue. No one who becomes aware of the information contained in this report should regard it as definitive, because it is subject to changes and modifications.
This document contains or may contain forward looking statements (in the usual meaning and within the meaning of the US Private Securities Litigation Reform Act of 1995) regarding intentions, expectations or projections of BBVA or of its management on the date thereof, that refer to or incorporate various assumptions and projections, including projections about the future earnings of the business. The statements contained herein are based on our current projections, but the actual results may be substantially modified in the future by various risks and other factors that may cause the results or final decisions to differ from such intentions, projections or estimates. These factors include, without limitation, (1) the market situation, macroeconomic factors, regulatory, political or government guidelines, (2) domestic and international stock market movements, exchange rates and interest rates, (3) competitive pressures, (4) technological changes, (5) alterations in the financial situation, creditworthiness or solvency of our customers, debtors or counterparts. These factors could cause or result in actual events differing from the information and intentions stated, projected or forecast in this document or in other past or future documents. BBVA does not undertake to publicly revise the contents of this or any other document, either if the events are not as described herein, or if such events lead to changes in the information contained in this document.
This document may contain summarised information or information that has not been audited, and its recipients are invited to consult the documentation and public information filed by BBVA with stock market supervisory bodies, in particular, the prospectuses and periodical information filed with the Spanish Securities Exchange Commission (CNMV) and the Annual Report on Form 20-F and information on Form 6-K that are filed with the US Securities and Exchange Commission.
Distribution of this document in other jurisdictions may be prohibited, and recipients into whose possession this document comes shall be solely responsible for informing themselves about, and observing any such restrictions. By accepting this document you agree to be bound by the foregoing restrictions.
2Q18 Results July 27th 2018 / 3
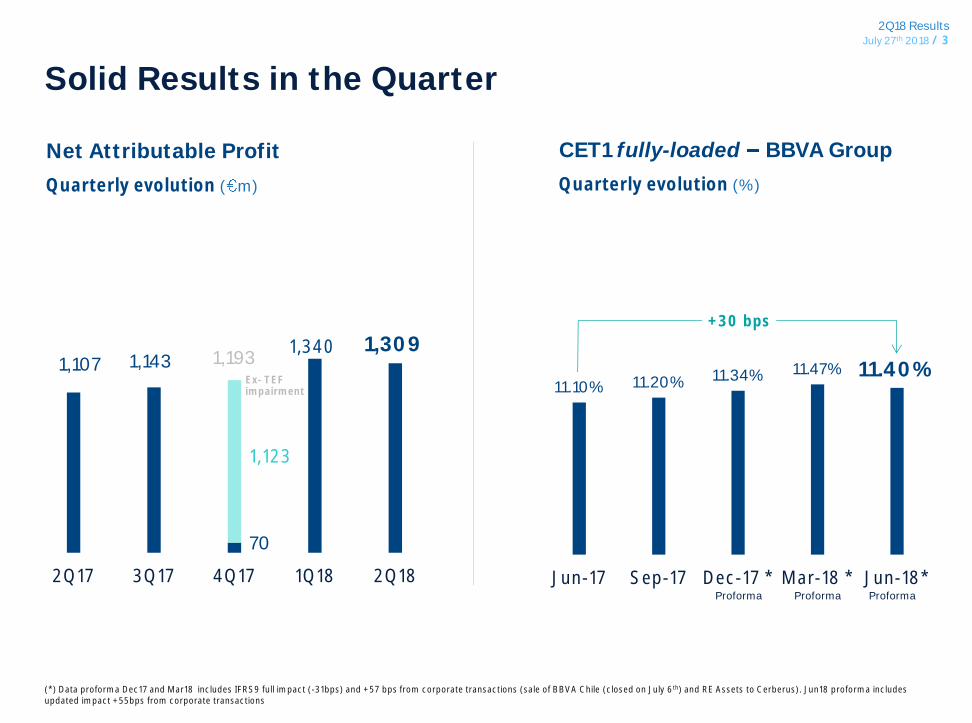
1,107 1,143
70
1,340 1,309
1,123
2Q17 3Q17 4Q17 1Q18 2Q18
Quarterly evolution (%)
CET1 fully-loaded BBVA Group
Solid Results in the Quarter
Quarterly evolution ( m)
Net Attributable Profit
11.10% 11.20% 11.34% 11.47% 11.40%
Jun-17 Sep-17 Dec-17 * Mar-18 * Jun-18*
+30 bps
(*) Data proforma Dec17 and Mar18 includes IFRS9 full impact (-31bps) and +57 bps from corporate transactions (sale of BBVA Chile (closed on July 6th) and RE Assets to Cerberus). Jun18 proforma includes updated impact +55bps from corporate transactions
Ex- TEF impairment
Proforma Proforma
1,193
Proforma

2Q18 Results July 27th 2018 / 4
5.58 5.63
0.15 0.15
5.55
5.73 5.78
1 Jan-18 Mar-18 Jun-18
2Q18 Highlights
01 Strong core revenue growth
02 Efficiency improvement
04 Sound risk indicators
05 Strong capital position, above target
06 Focus on shareholder value
Efficiency 49.2% -82 bps vs. 12M17 (constant)
CoR 0.82%
-11 bps vs. 1H17
NPL ratio
4.4%
CET 1 FL (Proforma)
11.40% -7 bps vs. 1Q18
NII + Fees ( constant)
+10.4% vs. 2Q17
TBV/Share + Shareholders remuneration
(1) % of total sales YtD, # of transactions
Mobile customers
20.7m +43% Jun-18 vs. Jun-17
03 Positive trend in digital sales and customers
Digital Sales (units)
39% Jun-18(1)
Coverage ratio
71% +19 bps vs. 2Q17
ROE
11.7% Jun-18
ROTE
14.3% Jun-18
Dividends
-47 bps vs. 2Q17
+4.2 %

2Q18 Results July 27th 2018 / 5
2Q18 Profit & Loss
BBVA Group 2Q18 % % constant
Net Interest Income 4,355 -2.8 9.6
Net Fees and Commissions 1,256 1.8 13.1
Net Trading Income 297 -21.3 -14.0
Other Income & Expenses 69 -71.9 -68.6
Gross Income 5,977 -5.7 5.8
Operating Expenses -2,963 -6.7 2.7
Operating Income 3,014 -4.7 9.0
Impairment on Financial Assets -788 -20.9 -12.2
Provisions and Other Gains and Losses -19 -90.2 -90.5
Income Before Tax 2,207 12.1 31.5
Income Tax -602 10.2 26.1
Net Income 1,604 12.8 33.6
Non-controlling Interest -295 -6.2 18.4
Net Attributable Profit 1,309 18.2 37.7
Change
2Q18/2Q17

2Q18 Results July 27th 2018 / 6
1H18 Profit & Loss
BBVA Group 1H18 % % constant
Net Interest Income 8,643 -1.8 9.4
Net Fees and Commissions 2,492 1.5 11.3
Net Trading Income 708 -33.8 -30.4
Other Income & Expenses 231 -40.8 -36.0
Gross Income 12,074 -5.1 4.8
Operating Expenses -5,942 -5.8 2.9
Operating Income 6,131 -4.3 6.8
Impairment on Financial Assets -1,611 -17.0 -9.0
Provisions and Other Gains and Losses -77 -82.2 -82.0
Income Before Tax 4,443 10.2 25.5
Income Tax -1,213 8.3 21.5
Net Income 3,230 10.9 27.0
Non-controlling Interest -581 -4.3 17.0
Net Attributable Profit 2,649 14.9 29.5
1H18/1H17
Change

2Q18 Results July 27th 2018 / 7
Positive trend, growing vs. previous quarter
Strong Core Revenue Growth
Net Interest Income ( m constant)
Net Fees and Commissions ( m constant)
Net Trading Income ( m constant)
Gross Income ( m constant)
4,010 4,085 4,354 4,247
4,396
2Q17 3Q17 4Q17 1Q18 2Q18
1,120 1,171 1,175 1,226 1,266
2Q17 3Q17 4Q17 1Q18 2Q18
+3.3%
349 331
540 408
300
2Q17 3Q17 4Q17 1Q18 2Q18
5,705 5,769 6,101 6,040 6,034
2Q17 3Q17 4Q17 1Q18 2Q18
+9.6% +13.1%
+5.8%
Good trend maintained, driven by Spain, Turkey and Mexico
Lower ALCO sales & Global Markets results
Core revenue growth offset by SRF contribution in 2Q18
-0.1%
+3.5 %

2Q18 Results July 27th 2018 / 8
Efficiency Improvement
Positive jaws & efficiency improvement
Group Operating Jaws (YtD (%); ( constant))
Operating Expenses
Efficiency Ratio ( constant)
52.9%
50.0%
49.2%
12M16 12M17 6M18
-82 bps
Core Revenues
9,368 10,140
11,135
5,707 5,776 5,942
1H16 1H17 1H18
8.2%
9.8%
1.2% 2.9%

2Q18 Results July 27th 2018 / 9
Positive jaws in all geographies
Operating Jaws Breakdown (YoY (%); ( constant))
Spain*
-4.6%
1.0%
CoreRevenues
Operatingexpenses
USA
9.1% 5.6%
CoreRevenues
Operatingexpenses
Mexico
7.9%
4.4%
CoreRevenues
Operatingexpenses
Turkey South America ex-Vza
20.6%
11.0%
Core Revenues Operatingexpenses
15.1%
10.1%
Core Revenues Operatingexpenses
(*) Spain includes banking and non-core real-estate activities
INFLATION
1.5% Average 12m
INFLATION
2.3% Average 12m
INFLATION
5.7% Average 12m
INFLATION
11.5% Average 12m
INFLATION
7.8% Average 12m

2Q18 Results July 27th 2018 / 10
22.7 32.1
40.6
22.2
33.3
43.1
Jun-16 Jun-17 Jun-18
14.6
22.4
38.6
10.8 17.2
29.1
Jun-16 Jun-17 Jun-18
Outstanding trend of digital sales in all markets (% of total sales YtD, # of transactions and PRV*)
SPAIN USA
14.0
24.9
42.4
8.9 17.4
32.7
Jun-16 Jun-17 Jun-18
MEXICO
10.3 14.4 20.2
14.5
22.9
51.0
Jun-16 Jun-17 Jun-18
18.7 17.9 21.7
11.6 14.7
23.0
Jun-16 Jun-17 Jun-18
TURKEY SOUTH AMERICA
GROUP
Solid growth across markets
9.4
15.5
32.7
5.8 10.8
25.5
Jun-16 Jun-17 Jun-18
PRV
UNITS
PRV
UNITS
UNITS
PRV
PRV
UNITS
UNITS
PRV
UNITS
PRV
Figures have been restated due to the inclusion of some products
(*) Product Relative Value as a proxy of a better economic representation of units sold

2Q18 Results July 27th 2018 / 11
May-18 Jun-18
Evolving our digital value proposition to promote digital sales growth
1H17 1H18
Actively promoting DIY Growing in the Open Market
Advice & Smart Interactions
% of Total Digital Sales 13% 22%
Digital checking accounts opening Mexico (# units)
Digital credit cards sales increased driven by new online scoring tool Peru (# units)
x 3 x 2 24%
using new online scoring tool
BBVA Oneview
Spain
Payroll advance to avoid overdrafts
Garanti App video content
Colombia
BBVA Valora View
Spain Turkey

2Q18 Results July 27th 2018 / 12
Dec-16 Dec-17 May-18
Transactions increasingly migrating to more efficient channels
Transactions by channel (# transactions)
+106%
-8% Branch
App
May-16 May-17 May-18
+110%
Dec-16 Dec-17 May-18
-12%
+62%
-16% Branch
Branch
App App
Spain Turkey Colombia
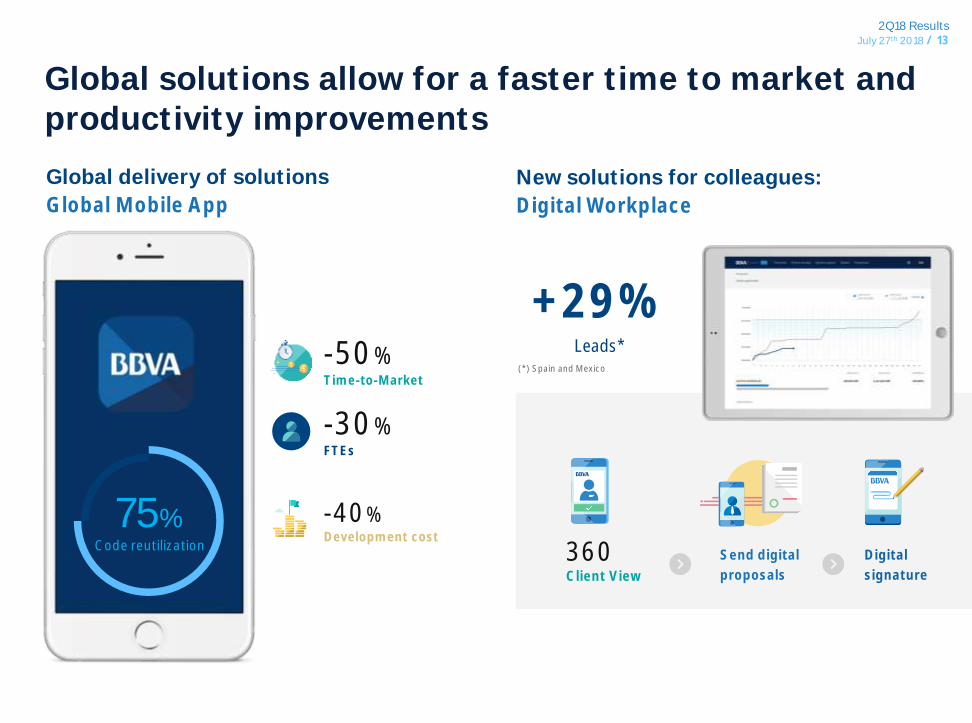
2Q18 Results July 27th 2018 / 13
Global solutions allow for a faster time to market and productivity improvements
New solutions for colleagues:
Digital Workplace
Global delivery of solutions
Global Mobile App
75% -40% Development cost
-50% Time-to-Market
-30% FTEs
Code reutilization 360 Client View
(*) Spain and Mexico
Digital
signature
Send digital
proposals
+29%
Leads*

2Q18 Results July 27th 2018 / 14
16.5
19.9
25.1
Jun-16 Jun-17 Jun-18
10.3 14.5
20.7
Jun-16 Jun-17 Jun-18
+26%
PENETRATION 33% 46%
Growth in digital and mobile customers
Mobile Customers (Mn, % penetration)
PENETRATION
Digital Customers (Mn, % penetration)
Goal: 50% tipping point of digital
customers in 2018 and mobile
customers in 2019
+21%
39%
+40%
+43%
21% 38% 28%
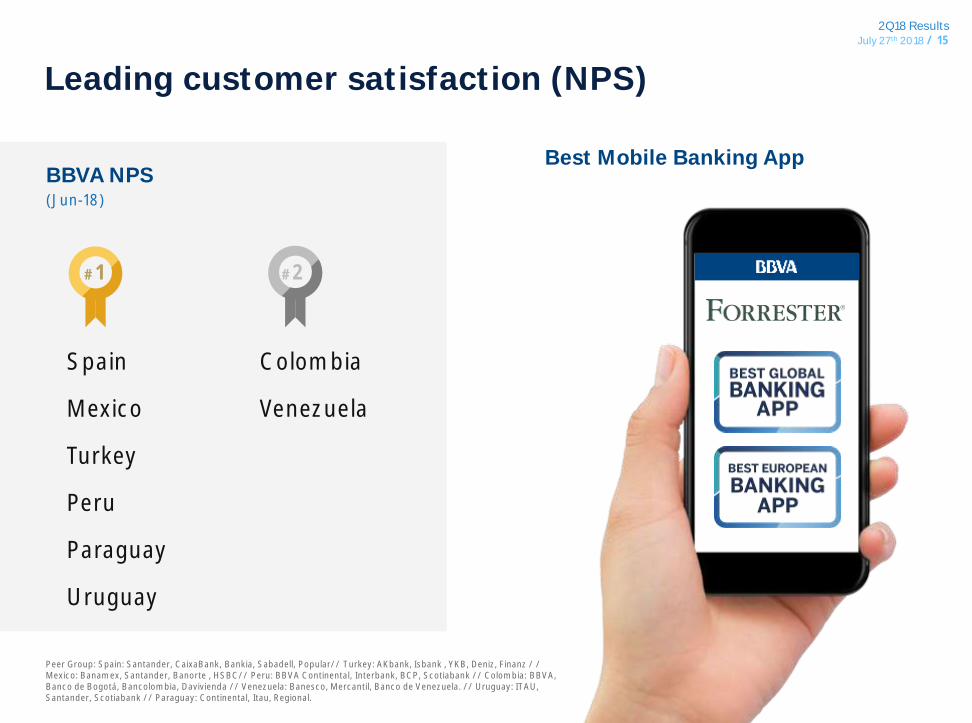
2Q18 Results July 27th 2018 / 15
Leading customer satisfaction (NPS)
BBVA NPS (Jun-18)
Spain
Mexico
Turkey
Peru
Paraguay
Uruguay
Best Mobile Banking App
Colombia
Venezuela
#1 #2
Peer Group: Spain: Santander, CaixaBank, Bankia, Sabadell, Popular// Turkey: AKbank, Isbank , YKB, Deniz, Finanz / / Mexico: Banamex, Santander, Banorte , HSBC// Peru: BBVA Continental, Interbank, BCP, Scotiabank // Colombia: BBVA, Banco de Bogotá, Bancolombia, Davivienda // Venezuela: Banesco, Mercantil, Banco de Venezuela. // Uruguay: ITAU, Santander, Scotiabank // Paraguay: Continental, Itau, Regional.

2Q18 Results July 27th 2018 / 16
Sound risk indicators1
Strong asset quality
Financial Asset Impairments2 ( m constant)
NPLs ( bn)
907 911 750 815
796
2Q17 3Q17 4Q17 1Q18 2Q18
-12.2 %
0.93% 0.94% 0.89% 0.85% 0.82%
2Q17 3Q17 4Q17 1Q18 2Q18
Cost of risk
YtD (%)
NPL & Coverage ratios (%)
- 2.8 bn
71% 72% 65% 73% 71%
4.8% 4.6% 4.6% 4.4% 4.4%
2Q17 3Q17 4Q17 1Q18 2Q18
(1) Data as of 1H18 under IFRS9 standards, 2017 figures under IAS 39
(2) Ex- Telefónica impairment in 4Q17
Cost of risk
NPL
Coverage
-2.3%
22.4 20.9 20.5
19.5 19.7
2Q17 3Q17 4Q17 1Q18 2Q18
+0.1 bn

2Q18 Results July 27th 2018 / 17
Strong capital position CET1 fully-loaded - BBVA Group Evolution (%, bps)
High quality capital Leverage ratio fully-loaded (%)
6.4% 5.0%
European Peer Group Average
#1
AT1 and Tier 2 buckets already covered Jun-18, Fully loaded (%)
AT1 Tier 2
1.66% 2.67%
European Peer Group: BARC, BNPP, CS, CMZ, DB, HSBC, ISP, LBG, RBS, SAN, SG, UBS, UCI, CASA. European Peer Group figures as of March 2018. BBVA figures of June 2018
11.47% 11.40%
+36 bps
-18 bps -5 bps - 18 bps
-2 bps
Mar.18proforma *
NetEarnings
Dividendaccrual and AT1
Coupons
RWAs (In constant )
Others ** CorporateTransactions
Update
Jun.18proforma *
(*) Data proforma Mar18 includes IFRS9 full impact (-31bps) and +57 bps from corporate transactions (sale of BBVA Chile (closed on July 6th) and RE Assets to Cerberus). Jun18 proforma includes the updated impact of Corporate Transactions (+55 bps). (**) Others includes mainly market related impacts (mark to market of the AFS portfolios and FX impact) .
MREL Requirement received
Already complying with MREL (Binding from 2020)
Funding Plan ensures fulfillment of MREL requirement in 2020
Inaugural green bond: 1 Bn SNP in May.18
- 5 bps

2Q18 Results July 27th 2018 / 18
Impacts of BBVA Chile disposal (Closed July 6th)
(1). The sale excludes the auto financing business Grupo Forum, the leading company in the country
Transaction Financials1 Main Impacts
PBV17 2.3x
PE17 20.7x
Capital Gain 640Mn
CET1 FL c.+50bps
$2.2 Bn Total consideration

2Q18 Results July 27th 2018 / 19
Focus on shareholder value
TBV per Share & Shareholder Remuneration ( per Share)
ROE and ROTE1
5.55 5.58 5.63
0.15 0.15
5.55
5.73 5.78
1 Jan-18 Mar-18 Jun-18
Dividends
(1) Ex- Telefónica impairment in 4Q17
+4.2 %
9.70 9.70
11.70
12.10 12.00
14.30
Jun-17 Dec-17 Jun-18
ROTE
ROE

2Q18 Results July 27tH 2018 / 20
Business Areas

2Q18 Results July 27th 2018 / 21
Spain Banking Activity
Loans: Improving trend (+1.6% qoq) . Continued growth in most profitable retail segments.
Core revenue growth (+1.5% yoy in 1H18): sound growth in asset management and retail banking fees
Costs continue to decrease
Asset quality: NPLs - 241 Mn qoq, CoR better than expectations.
(1) Data as of 1H18 under IFRS9 standards, 2017 figures under IAS 39.
(1) Performing loans under management. (2) In 2Q18 , 1.5Bn have been reclassified to Corporates+CIB. (3) Includes mutual funds, pension funds and other off balance sheet funds. Note: Activity excludes repos
63.9
38.6
135.4
Cust. Funds
bn
Demand Deposits
Time Deposits
Off-BS Funds3
YoY
Activity (Jun-18)
6.3 15.9
20.0
23.4
13.2
10.9
76.2
Lending
Mortgages
Very small businesses
Public sector
Other commercial2
Consumer
Corporates + CIB
bn
YoY
1
YtD
YtD
Rest
-0.8% +0.4%
165.9
+8.6%
-9.1%
-3.7%
-12.8%
+42.2%
-0.2%
237.9-1.5%
+8.5%
-36.6%
+17.3%
Profit & Loss
2Q18 vs 2Q17 1H18 vs 1H17
Net Interest Income 916 -1.4 1,836 -1.5
Net Fees and Commissions 438 9.4 850 8.6
Net Trading Income 115 23.9 282 -11.4
Other Income & Expenses -15 n.s. 82 -65.1
Gross Income 1,454 -4.6 3,050 -4.7
Operating Expenses -822 -4.0 -1,644 -4.1
Operating Income 632 -5.2 1,405 -5.3
Impairment on Financial
Assets (net)-104 -24.0 -175 -42.2
Provisions (net) and other
gains (losses)-34 -71.5 -121 -51.1
Income Before Tax 494 19.9 1,110 18.7
Income Tax -138 16.3 -316 17.5
Net Attributable Profit 356 21.5 793 19.2
+9.2%
+1.2%
Key Ratios
2.02 2.01 2.01
1.94 1.94 1.94
0.08 0.07 0.07
2Q17 1Q18 2Q18
Asset Quality ratios1
Customer spread
Yield on loans
Cost of deposits
Coverage
NPL
CoR (YtD)
Customer Spread (%)
5.9%
5.4% 5.2%
53% 57% 57%
0.35%
0.17% 0.21%
2Q17 1Q18 2Q18

2Q18 Results July 27th 2018 / 22
Non Core Real Estate
Net exposure ( bn)
3.3
1.3 1.1
5.5
4.8 4.8
8.8
6.1 5.9
Jun-17 Mar-18 Jun-18
-12.8%
-67.2%
Net attributable profit ( m)
Real Estate owned assets
RE developer loans
2018e Net losses below 100 Mn
-79
-27 -9
2Q17 1Q18 2Q18
-33.2%
-88.5%

2Q18 Results July 27th 2018 / 23
5.3
21.4
8.7
2.4 7.9
11.0
Lending
5.7
15.6
39.5
Cust. Funds
USA
(1) Performing loans under management. Note: Activity excludes repos
bn
Demand Deposits
Time Deposits
Others
YoY
Activity (Jun-18) (constant )
Mortgages
Consumer
SMEs
Public Sector
bn
YoY
1
YtD
NII as the main P&L driver, growing at double digit
Loan growth accelerating. Focus on consumer loans: +18% yoy
Customer spreads benefiting from a better loan mix and higher rates
Positive jaws and efficiency improvement
CoR much better than expected thanks to provision releases
Strengthening our retail franchise
Other commercial
YtD
CIB
-2.8%
60.856.7 +4.1%
+1.9%
-0.9%
+2.2%
+17.8%
-3.7%
+3.4%
+17.4%
-2.6%
Profit & Loss
2Q18 vs 2Q17 1H18 vs 1H17
Net Interest Income 549 9.2 1,082 12.0
Net Fees and Commissions 152 2.3 302 -0.1
Net Trading Income 24 11.4 49 -3.4
Other Income & Expenses 2 n.s. 4 n.s.
Gross Income 726 9.7 1,437 10.7
Operating Expenses -449 4.0 -891 5.6
Operating Income 277 20.4 546 20.2
Impairment on Financial
Assets (net)-42 13.4 -63 -38.1
Provisions (net) and other
gains (losses)4 n.s. 12 n.s.
Income Before Tax 238 24.2 495 42.1
Income Tax -51 0.1 -108 16.9
Net Attributable Profit 188 32.8 387 51.2
+20.8%
+5.9%
+6.0%
Key Ratios
Asset Quality ratios1
Coverage
NPL
CoR (YtD)
104% 98% 93%
NOTE: BTS business has been reclassified from USA to Mexico
(1) Data as of 1H18 under IFRS9 standards, 2017 figures under IAS 39
3.99 4.31 4.51
3.67 3.86 3.97
0.33 0.45 0.54
2Q17 1Q18 2Q18
Customer spread
Yield on loans
Customer Spread (%)
Cost of deposits
1.3% 1.2% 1.2%
0.39% 0.16% 0.23%
2Q17 1Q18 2Q18

2Q18 Results July 27th 2018 / 24
0.5
5.4
20.1
3.4
4.6
6.9
8.7
Lending
2.9
17.9
11.3
36.9
Cust. Funds
Mexico
bn
Demand Deposits
Time Deposits
Others
YoY
Activity (Jun-18) (constant )
Mortgages
Consumer
Other commercial
Rest
Public Sector
Credit cards
bn
YoY
n.s. 1
Off-BS Funds
NII growth at high single digit, in line with expectations
Loan growth accelerates yoy to +8.6%, especially in commercial segments.
Sound growth in fees, thanks to CIB and asset management.
Positive operating jaws and efficiency improvement
CoR significantly better than expected
Bottom line growth above expectations
YtD
YtD
SMEs
(1) Performing loans under management. Note: Activity excludes repos
49.6 +8.6%
+6.1%
+7.1%
+5.8%
+4.9%
+3.7%
+14.6%
-6%
+3.3%
+8.6%
+15%
+11.6%
+1.4%
Profit & Loss
2Q18 vs 2Q17 1H18 vs 1H17
Net Interest Income 1,333 7.4 2,648 7.8
Net Fees and Commissions 308 10.0 589 8.2
Net Trading Income 77 100.0 144 35.4
Other Income & Expenses 39 -13.4 84 -23.5
Gross Income 1,757 9.5 3,465 7.7
Operating Expenses -578 4.1 -1,144 4.4
Operating Income 1,179 12.3 2,321 9.4
Impairment on Financial
Assets (net)-332 -12.4 -708 -6.5
Provisions (net) and other
gains (losses)33 n.s. 54 n.s.
Income Before Tax 880 32.0 1,667 22.9
Income Tax -242 36.5 -458 27.4
Net Attributable Profit 638 30.3 1,208 21.2
69.0 +10.0%
Key Ratios
Coverage
NPL
CoR (YtD)
NOTE: BTS business has been reclassified from USA to Mexico
(1) Data as of 1H18 under IFRS9 standards, 2017 figures under IAS 39
3.29% 3.18% 2.93%
2Q17 1Q18 2Q18
12.30 12.65 12.66
10.86 10.88 10.73
1.45 1.77 1.93
2Q17 1Q18 2Q18
Customer spread
Yield on loans
Customer Spread (%)
Cost of deposits
Asset Quality ratios1
2.3% 2.1% 2.0%
126% 153% 155%

2Q18 Results July 27th 2018 / 25
Turkey
3.4
28.6
13.7
Cust. Funds0.6 0.1
32.5
4.0
6.3
4.4
Lending
bn
Demand Deposits
Time Deposits
YoY
Activity (Jun-18) (constant )
Mortgages
Consumer
Business Banking
Rest Public Sector
Credit cards
bn
YoY
n.s. 1
Off-BS Funds2
YtD
YtD
Loans: TL loan portfolio growing at double digits (+15.5% yoy) and FC loan -8.4% yoy
Customer spread: excellent price management in a higher funding costs environment
Solid Core revenue growth: +21% yoy in 1H18
Opex growing below inflation
Asset quality impacted by IFSR9 negative macro adjustment and large tickets in the commercial portfolio
(1) Performing loans under management. (2) Includes mutual and pension funds. Note: Activity excludes repos
47.8
+20.3%
+18.4%
+9.2%
+14.9%
+13.9%
-26.2%
+5.4%
45.7
+10.9%
+27.9%
+17%
+16.9%
Profit & Loss
2Q18 vs 2Q17 1H18 vs 1H17
Net Interest Income 797 25.5 1,510 17.9
Net Fees and Commissions 181 26.1 371 32.8
Net Trading Income -15 n.s. 4 -42.7
Other Income & Expenses 17 23.6 39 87.1
Gross Income 981 20.8 1,924 21.2
Operating Expenses -342 13.4 -677 11.0
Operating Income 639 25.2 1,247 27.5
Impairment on Financial
Assets (net)-173 84.5 -315 66.3
Provisions (net) and other
gains (losses)7 361.5 34 141.2
Income Before Tax 474 13.1 966 20.4
Income Tax -103 37.2 -210 32.1
Net Attributable Profit 183 7.6 373 25.6
+20.1%
Key Ratios
Coverage
NPL
CoR (YtD)
135%
86% 76%
2.5%
3.7% 4.5%
(1) Data as of 1H18 under IFRS9 standards, 2017 figures under IAS 39
0.84% 1.17% 1.23%
2Q17 1Q18 2Q18
10.63 11.73
12.11
5.79 5.88 6.14
4.85
5.85 5.97
2Q17 1Q18 2Q18
Customer Spread (%)
Cost of deposits
Customer spread
Yield on loans
Asset Quality ratios1

2Q18 Results July 27th 2018 / 26
South America
NOTE: Venezuela 2Q18 figures in current
(1) Data as of 1H18 under IFRS9 standards, 2017 figures under IAS 39
Core revenues growing at mid-teens.
Lending growth at double digits, with retail segments as main driver.
Customer spreads growing qoq across the board
Positive jaws and improving efficiency
CoR better than expected
3.0
4.9
14.7
12.7
13.2
Lending
12.0
7.1
10.9
14.6
13.8
Cust. Funds
bn
YoY
Activity (Jun-18) (constant )
bn
YoY
1
Chile
Argentina
Colombia
Peru
Others
Chile
Argentina
Colombia
Peru
Others
YtD
YtD
(1) Performing loans under management. Note: Activity excludes repos
48.5 +11.2%
+3.8% +3.4%
+6.2%
+6.6%
+8.9%
+77.5%
+5.2%
+5%
+2.7%
+10.1%
+3%
+53.6%
58.3
Profit & Loss
2Q18 vs 2Q17 1H18 vs 1H17
Net Interest Income 821 15.8 1,606 15.0
Net Fees and Commissions 171 15.2 333 12.7
Net Trading Income 122 6.0 231 9.5
Other Income & Expenses 16 -24.5 27 34.8
Gross Income 1,130 13.7 2,197 14.3
Operating Expenses -469 8.8 -945 8.9
Operating Income 661 17.5 1,252 18.7
Impairment on Financial
Assets (net)-158 -9.6 -326 -4.0
Provisions (net) and other
gains (losses)-25 1.6 -35 -11.2
Income Before Tax 478 31.6 891 31.8
Income Tax -126 21.8 -252 29.2
Net Attributable Profit 244 28.7 452 30.6
+9.5%
Key Ratios
94% 93% 91%
3.5% 3.6% 3.7%
Customer Spread (%) 14.72
12.70 13.29
4.16 4.01 4.09
6.52 6.72 6.79
6.91 6.75 6.75
2Q17 1Q18 2Q18
1.52% 1.37% 1.30%
2Q17 1Q18 2Q18
Coverage
NPL
CoR (YtD)
Asset Quality ratios1
2Q18 Results July 27th 2018 / 27
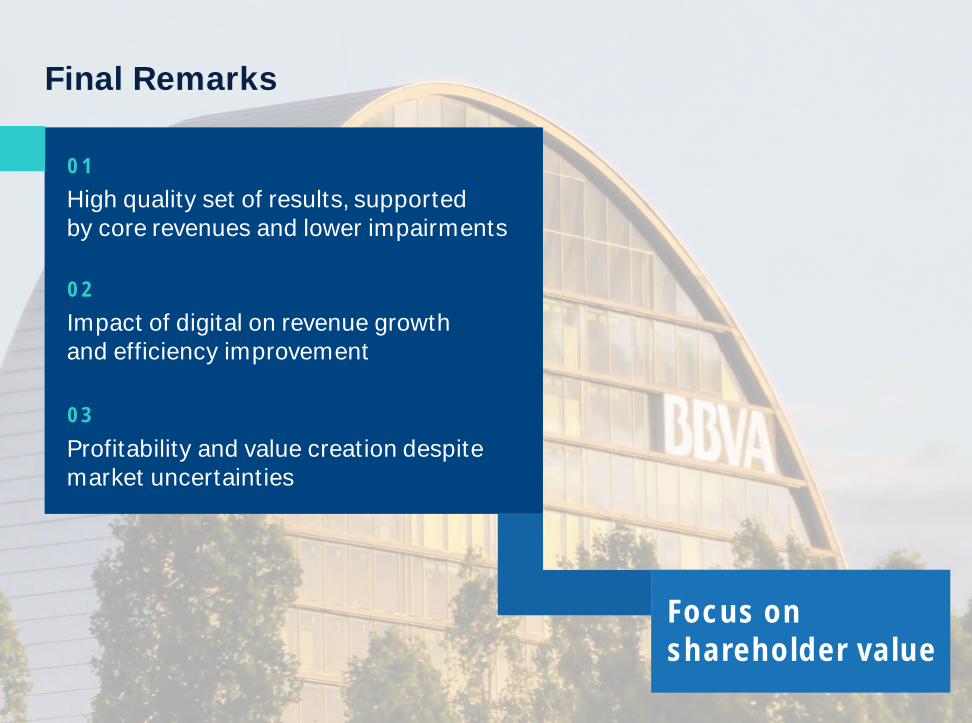
Final Remarks
01
High quality set of results, supported by core revenues and lower impairments
02
Impact of digital on revenue growth and efficiency improvement
03
Profitability and value creation despite market uncertainties
Focus on shareholder value

2Q18 Results July 27tH 2018 / 28
Customer Spread by Country
Gross Income Breakdown
Net Attributable Profit Evolution
P&L Accounts by Business Unit
ALCO Portfolio and Liquidity Coverage Ratios (LCRs)
Garanti: wholesale funding
Capital and RWA
TBV per Share and Dividends evolution
Book Value of the Main Subsidiaries
Annex 01
04
07 02
03
06
05
08
09

2Q18 Results July 27th 2018 / 29
Customer Spread by Country
01

2Q18 Results July 27th 2018 / 30
Customer Spreads: Quarterly Evolution
(1) Foreign currency
Note: USA ex NY Business Activity
Average
2Q17 3Q17 4Q17 1Q18 2Q18
Spain 1.94% 1.93% 1.93% 1.94% 1.94%
Yield on Loans 2.02% 2.00% 2.00% 2.01% 2.01%
Cost of Deposits -0.08% -0.08% -0.07% -0.07% -0.07%
USA 3.67% 3.76% 3.75% 3.86% 3.97%
Yield on Loans 3.99% 4.12% 4.16% 4.31% 4.51%
Cost of Deposits -0.33% -0.36% -0.41% -0.45% -0.54%
Mexico MXN 12.02% 11.81% 12.05% 12.06% 11.89%
Yield on Loans 13.78% 13.68% 14.02% 14.20% 14.20%
Cost of Deposits -1.77% -1.87% -1.98% -2.14% -2.30%
Mexico FC1 3.62% 3.47% 3.68% 3.93% 4.06%
Yield on Loans 3.66% 3.53% 3.76% 4.02% 4.20%
Cost of Deposits -0.05% -0.07% -0.08% -0.09% -0.14%
Turkey TL 5.24% 4.89% 4.90% 4.94% 5.18%
Yield on Loans 13.48% 13.75% 14.06% 14.55% 15.14%
Cost of Deposits -8.25% -8.86% -9.16% -9.62% -9.96%
2Q17 3Q17 4Q17 1Q18 2Q18
Turkey FC1 3.74% 3.88% 4.04% 4.16% 4.44%
Yield on Loans 5.76% 5.95% 6.14% 6.45% 6.79%
Cost of Deposits -2.02% -2.07% -2.10% -2.29% -2.35%
Argentina 14.72% 13.47% 13.11% 12.70% 13.29%
Yield on Loans 19.97% 18.63% 18.77% 19.29% 20.72%
Cost of Deposits -5.24% -5.16% -5.65% -6.59% -7.43%
Chile 4.16% 3.31% 3.93% 4.01% 4.09%
Yield on Loans 6.71% 5.47% 6.27% 6.41% 6.49%
Cost of Deposits -2.55% -2.15% -2.34% -2.40% -2.40%
Colombia 6.52% 6.78% 6.60% 6.72% 6.79%
Yield on Loans 11.94% 11.62% 11.37% 11.31% 11.22%
Cost of Deposits -5.42% -4.84% -4.77% -4.60% -4.43%
Peru 6.91% 6.80% 6.57% 6.75% 6.75%
Yield on Loans 8.32% 8.17% 7.90% 7.92% 7.84%
Cost of Deposits -1.41% -1.37% -1.33% -1.17% -1.09%

2Q18 Results July 27th 2018 / 31
Customer Spreads: YTD Evolution
(1) Foreign currency
Note: USA ex NY Business Activity
YTD Average
Customer Spreads (*)(Percentage)
1H17 1H18 1H17 1H18
Spain 1.93% 1.94% South America 6.30% 6.53%
Yield on Loans 2.03% 2.01% Yield on Loans 9.66% 9.80%
Cost of Deposits -0.10% -0.07% Cost of Deposits -3.36% -3.27%
USA 3.59% 3.92% Argentina 15.21% 13.01%
Yield on Loans 3.94% 4.41% Yield on Loans 20.56% 20.04%
Cost of Deposits -0.35% -0.49% Cost of Deposits -5.35% -7.03%
Mexico MXN 12.06% 11.97% Chile 3.96% 4.05%
Yield on Loans 13.74% 14.20% Yield on Loans 6.57% 6.45%
Cost of Deposits -1.68% -2.22% Cost of Deposits -2.61% -2.40%
Mexico FC 1 3.53% 4.00% Colombia 6.42% 6.75%
Yield on Loans 3.57% 4.11% Yield on Loans 12.01% 11.26%
Cost of Deposits -0.04% -0.11% Cost of Deposits -5.59% -4.51%
Turkey TL 5.37% 5.06% Peru 6.91% 6.77%
Yield on Loans 13.33% 14.86% Yield on Loans 8.27% 7.90%
Cost of Deposits -7.95% -9.80% Cost of Deposits -1.37% -1.13%
Turkey FC 1 3.73% 4.31%
Yield on Loans 5.70% 6.63%
Cost of Deposits -1.96% -2.32%

2Q18 Results July 27th 2018 / 32
Gross Income Breakdown
02

2Q18 Results July 27th 2018 / 33
25%
12%
16%
28%
18%
2%
6M18
Note: Spain includes Banking activity in Spain and Non Core Real Estate. Figures exclude Corporate Center
Spain 3,031 m
USA 1,437 m
Turkey 1,924 m
Mexico 3,465 m
South America 2,197 m
Rest of Eurasia 216 m
Gross Income - Breakdown

2Q18 Results July 27th 2018 / 34
Net Attributable Profit Evolution
03

2Q18 Results July 27th 2018 / 35
Group Net Attributable Profit
( m)
2,306
-260
127 150
131 212
76
-15
106
-185
2,649
6M17 m FXEffect
BankingactivitySpain
Non core RE USA Mexico Turkey Rest ofEurasia
SouthAmerica
Corp. Center 6M18 m
YoY (%) (constant )
19.2 -80.8 51.2 21.2 25.6 -20.5 30.6 45.9
BUSINESSES +343 m

2Q18 Results July 27th 2018 / 36
04 Total Spain: Banking Activity + Non Core Real Estate
Non Core Real Estate
Rest of Eurasia
Corporate Center
P&L Accounts by Business Unit

2Q18 Results July 27th 2018 / 37
Total Spain Profit & Loss
Change (%)
Total Spain 2Q18 2Q18 vs 2Q17 1H2018 1H18 vs 1H17
Net Interest Income 929 -2.4 1,856 -2.1
Net Fees and Commissions 439 9.3 851 8.4
Net Trading Income 115 24.1 282 -11.2
Other Income & Expenses -44 n.s. 42 -78.4
Gross Income 1,439 -6.5 3,031 -5.1
Operating Expenses -841 -4.4 -1,684 -4.6
Operating Income 598 -9.2 1,347 -5.7
Impairment on Financial Assets (net) -88 -60.3 -213 -45.5
Provisions (net) and other gains (losses) -25 -79.3 -65 -80.6
Income Before Tax 485 53.3 1,069 52.2
Income Tax -137 33.1 -310 39.7
Net Attributable Profit 347 62.3 757 57.8
Change (%)

2Q18 Results July 27th 2018 / 38
Non Core Real Estate - Profit & Loss
Change (%)
Non Core Real Estate 2Q18 2Q18 vs 2Q17 1H2018 1H18 vs 1H17
Net Interest Income 13 -41.9 20 -37.7
Net Fees and Commissions 0 -49.6 1 -67.6
Net Trading Income 0 2,362.0 1 12,029.0
Other Income & Expenses -28 292.3 -40 0.2
Gross Income -15 n.s. -19 200.8
Operating Expenses -19 -18.9 -39 -20.1
Operating Income -34 309.7 -58 4.6
Impairment on Financial Assets (net) 16 n.s. -39 -56.5
Provisions (net) and other gains (losses) 9 n.s. 56 n.s.
Income Before Tax -10 -89.9 -41 -82.3
Income Tax 1 -96.7 6 -88.0
Net Attributable Profit -9 -88.5 -36 -80.8
Change (%)

2Q18 Results July 27th 2018 / 39
Rest of Eurasia - Profit & Loss
Change (%)
Rest of Eurasia 2Q18 2Q18 vs 2Q17 1H2018 1H18 vs 1H17
Net Interest Income 39 -20.2 82 -13.8
Net Fees and Commissions 41 -1.6 79 -3.4
Net Trading Income 11 -64.2 55 -31.1
Other Income & Expenses -1 -28.9 0 -91.5
Gross Income 90 -25.2 216 -15.8
Operating Expenses -69 -6.7 -142 -7.9
Operating Income 21 -55.0 74 -27.6
Impairment on Financial Assets (net) -3 n.s. 14 52.5
Provisions (net) and other gains (losses) 3 n.s. 2 n.s.
Income Before Tax 21 -54.3 90 -13.4
Income Tax -10 -19.8 -32 2.5
Net Attributable Profit 11 -67.5 58 -20.3
Change (%)

2Q18 Results July 27th 2018 / 40
Corporate Center - Profit & Loss
Change (%)
Corporate Center 2Q18 2Q18 vs 2Q17 1H2018 1H18 vs 1H17
Net Interest Income -72 -9.1 -140 -26.2
Net Fees and Commissions -25 -41.2 -32 -31.7
Net Trading Income -34 n.s. -58 n.s.
Other Income & Expenses 41 -35.5 35 -5.6
Gross Income -90 233.5 -196 n.s.
Operating Expenses -235 1.2 -460 4.1
Operating Income -325 25.3 -655 64.5
Impairment on Financial Assets (net) 0 n.s. 0 -89.9
Provisions (net) and other gains (losses) -15 -63.1 -79 62.3
Income Before Tax -341 12.6 -734 64.0
Income Tax 60 53.8 158 160.3
Net Attributable Profit -291 4.0 -586 45.9
Change (%)

2Q18 Results July 27th 2018 / 41
ALCO Portfolio and Liquidity Coverage Ratios (LCRs)
05

2Q18 Results July 27th 2018 / 42
ALCO Portfolio & Liquidity Coverage Ratios (LCRs)
25.9
10.6
9.3
4.6 3.5
Mar-18
25.5
10.9
10.3
5.6 3.3
Jun-17
28.4
11.2
8.6
5.1 3.5
Jun-18
53.9
USA
Turkey
Mexico South America
Euro1
USA
Turkey
Mexico South America
55.6
ALCO Portfolio breakdown by region ( bn)
56.8
USA
Turkey
Mexico South America
(1) Figures excludes SAREB bonds ( 5.2bn as of Jun-17, 5bn as of Mar-18 and 4.8bn as of Jun-18).
BBVA Group and Subsidiaries LCR Significantly above the 100% requirement
Euro1 Euro1
BBVA Group Euroz.1 USA2 Mexico Turkey S. Amer.
LCR 127% 153% 142% 136% 133% well >100%
(1) Perimeter: Spain + Portugal + Rest of Eurasia (2) Compass LCR calculated according to local regulation (Fed Modified LCR)
Jun-18

2Q18 Results July 27th 2018 / 43
Garanti: wholesale funding
06

2Q18 Results July 27th 2018 / 44
Turkey Liquidity & Funding Sources
Ample liquidity buffers and limited wholesale funding maturities, USD 1.5 Bn in 2H18, including syndications
LTD ratio of 112%, 3.2 pp improvement YTD, mainly due to Foreign Currency LTD, improving 2.3 pp YTD to 70%. Stable deposit base: 77% of TRY deposits in Retail and SMEs.
Liquidity Coverage Ratio (EBA): 133% vs. 100% required for 2018
Foreign Currency loans c.USD17 Bn, -6% YTD, representing 22% of total assets
Limited Foreign Currency wholesale funding needs: USD 13.1 Bn
FC Liquidity Buffers FC Wholesale Funding Maturities (USD Bn)
2H18 2019 2020 >=2021
Covered Bond Subdebt Syndication Securitization Senior
1.5
3.3
0.5
5.6
Note: All figures are Bank-only, as of June 2018
USD 10.8 Bn including syndications
In 1H18
1.1 Bn syndicated loan rolled: c.100% rollover ratio and 10% in new 2 yr tranche.
USD75 Mn 6 yr Gender Bond
(2)
(2) Not including USD 2.3 Bn, mainly bilateral loans and other ST funding
c.USD 10 Bn liquidity buffer
Short Term Swaps
Unencumbered FC securities
FC Reserves under ROM
Money Market Placements
(1) ROM: Reserve Option Mechanism
(1)

2Q18 Results July 27th 2018 / 45
Capital and RWA
07 Capital Base
Risk-Weighted Assets by Business Area
2Q18 Results July 27th 2018 / 46
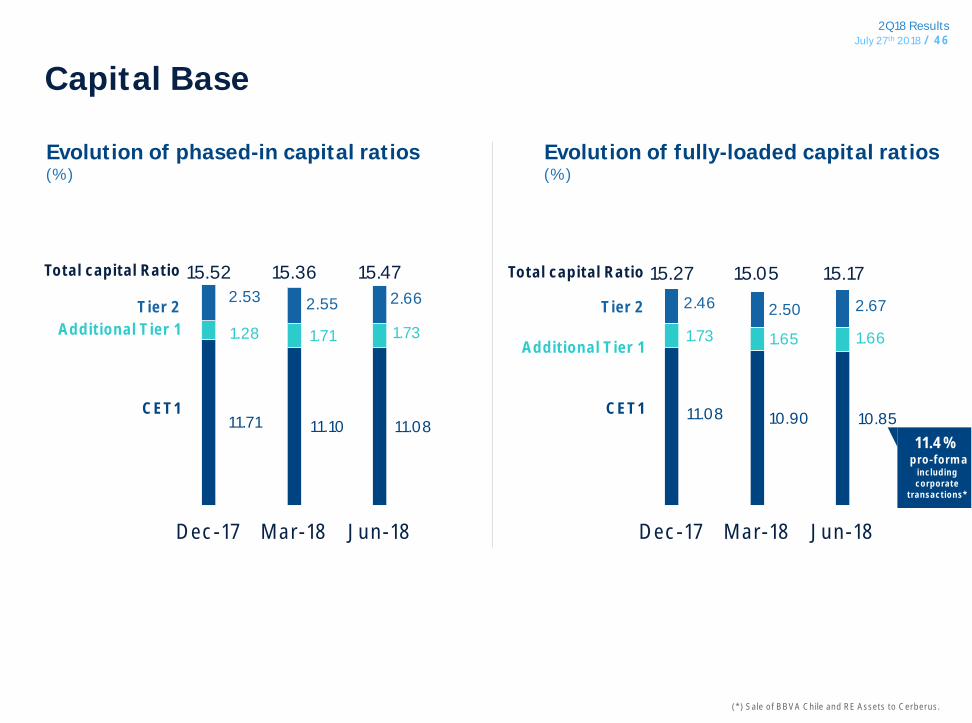
Evolution of phased-in capital ratios (%)
11.71 11.10 11.08
1.28 1.71 1.73
2.53 2.55 2.66
Dec-17 Mar-18 Jun-18
CET1
Tier 2
Additional Tier 1
15.36 15.47
11.08 10.90 10.85
1.73 1.65 1.66
2.46 2.50 2.67
Dec-17 Mar-18 Jun-18
Evolution of fully-loaded capital ratios (%)
15.05 15.17
Capital Base
15.52 15.27
CET1
Tier 2
Additional Tier 1
Total capital Ratio Total capital Ratio
11.4%
pro-forma including corporate
transactions*
(*) Sale of BBVA Chile and RE Assets to Cerberus.

2Q18 Results July 27th 2018 / 47
Risk-Weighted Assets by Business Area
Breakdown by business area and main countries Dec-17 Mar-18 Jun-18
Banking activity in Spain 108,141 103,229 101,633
Non core Real Estate Activity 9,692 9,272 7,547
United States 58,688 57,262 61,473
Mexico 44,941 47,769 50,630
Turkey 62,768 60,936 58,770
South America 55,975 55,718 55,151
Argentina 9,364 8,679 7,914
Chile 14,431 14,730 14,861
Colombia 12,299 12,921 12,983
Peru 14,879 14,634 15,360
Venezuela 1,516 1,436 572
Rest of South America 3,485 3,319 3,460
Rest of Eurasia 15,150 14,907 15,002
Corporate Center 6,332 7,753 6,999
BBVA Group 361,686 356,847 357,205
Fully-Loaded RWA

2Q18 Results July 27th 2018 / 48
Capital YtD Evolution
CET1 fully-loaded BBVA Group YtD Evolution (%, bps)
11.34% 11.40%
+73 bps
-35 bps
- 30 bps -2 bps
Dec.17proforma *
NetEarnings
Dividend accrual &AT1 Coupons
Others** CorporateTransactions
Impact Update
Jun.18proforma *
+ 8 bps
(*) Data proforma Dec17 includes IFRS9 full impact (-31bps) and +57 bps from corporate transactions (sale of BBVA Chile (closed on July 6th) and RE Assets to Cerberus). Jun18 proforma includes the updated impact of Corporate Transactions (+55 bps). (**) Includes mainly market related impacts (mark to market of the HTC&S portfolios and FX impact) and RWAs ex FX, among others.

2Q18 Results July 27th 2018 / 49
TBV per Share and Dividends Evolution
08

2Q18 Results July 27th 2018 / 50
TBV per Share & Shareholder Remuneration ( per Share)
5.82 5.79 5.69 5.58 5.63
0.09 0.09 0.24 0.24 0.14 0.14
5.82 5.88 5.78 5.96 6.01
Jun-17 Sep-17 Dec-17 Mar-18 Jun-18
TBV per share Cummulative dividend per share IFRS9 Impact per share

2Q18 Results July 27th 2018 / 51
Book Value of the Main Subsidiaries
09

2Q18 Results July 27th 2018 / 52 Book Value of the Main Subsidiaries1,2
(1) Includes adjustments. The Goodwill associate to each subsidiary has been deducted from its Book Value.
(2) Turkey includes the Garanti Group.
9.2
6.8
4.4
1.2
0.9
0.7
0.1
Mexico
USA
Turkey
Colombia
Peru
Argentina
Venezuela
Bn Jun18

2Q18 Results July 27th 2018 / 53
2Q18 Results July 27th, 2018