appendix 1 - rns-pdf.londonstockexchange.com
TRANSCRIPT

Great Portland Estates
Appendix 1
0
8
4
6
2
Central London office potential completions20
04
2005
2006
2007
2008
2009
2010
2011
2012
2013
2014
2015
2016
2017
Million sq ft
Completed GPE projections West End West End core
0
120
40
60
80
20
Headline rents£ per sq ft
2003 2005 2007 2009 2011 2013 2015 2017
100
PMA Prime West End PMA Prime City
GPE current office passing rent
£38.10 per sq ft
PMA forecasts
Source: PMA
London equity demand and asset supply
Nov 2012 May 2013 % change
Equity demand £20.5bn £22.5bn +9.8%
Asset supply
City £2.1bn £1.8bn –14.3%
West End £2.6bn £0.8bn –69.2%
£4.7bn £2.6bn –44.7%
Demand multiple 4.4x 8.7x
Source: CBRE/GPE
0
80
30
40
50
60
20
London market balance(months supply)
1991
10
1994 1997 2000 2003 2006 2009 2012
70
City West End Rental equilibrium
Source: PMA

Great Portland Estates
Appendix 1
Lead indicatorsSelected lead indicators Trends in year
Property capital values
Equity prices
Bond prices
Real yield spread (West End property)1
Volume of new property lending by major UK and European banks
Transaction volumes in central London direct real estate investment markets
Direction of pricing on IPD based derivative contracts
Rental values
Forecast UK GDP growth
Forecast London GVA growth
West End retail sales
Business confidence levels in the central London economy
UK output from the financial and business services sector
Employment levels in London’s finance and business services sectors
Central London office market balance2
1. West End property yields over ten year gilt yields adjusted for inflation.
2. Amount of space available to let given current rates of take-up expressed in terms of months.

Great Portland Estates
Appendix 2
Portfolio performanceWholly-owned
£m
Joint ventures
£mTotal £m
Proportion of portfolio
%
Valuation movement
%
North of Oxford Street Office 826.1 57.6 883.7 37.9 7.9
Retail 86.2 92.1 178.3 7.7 6.3
Rest of West End Office 322.5 15.2 337.7 14.5 6.5
Retail 109.0 21.4 130.4 5.6 13.3
Total West End 1,343.8 186.3 1,530.1 65.7 7.8
City, Midtown and Southwark Office 172.4 122.2 294.6 12.7 2.1
Retail 14.6 – 14.6 0.6 5.1
Total City, Midtown and Southwark 187.0 122.2 309.2 13.3 2.3
Investment property portfolio 1,530.8 308.5 1,839.3 79.0 6.9
Development property 46.9 146.1 193.0 8.3 20.1
Total properties held throughout the year 1,577.7 454.6 2,032.3 87.3 8.0
Acquisitions 281.4 15.0 296.4 12.7 5.4
Total property portfolio 1,859.1 469.6 2,328.7 100.0 7.6
Portfolio characteristics
Investment properties
£m
Development properties
£m
Total property portfolio
£mOffice
£mRetail
£mTotal £m
Net internal area sq ft
000’s
North of Oxford Street 1,099.4 123.8 1,223.2 998.0 225.2 1,223.2 1,528
Rest of West End 650.5 – 650.5 439.3 211.2 650.5 670
Total West End 1,749.9 123.8 1,873.7 1,437.3 436.4 1,873.7 2,198
City, Midtown and Southwark 385.8 69.2 455.0 439.7 15.3 455.0 1,366
Total 2,135.7 193.0 2,328.7 1,877.0 451.7 2,328.7 3,564
By use: Office 1,706.0 171.0 1,877.0
Retail 429.7 22.0 451.7
Total 2,135.7 193.0 2,328.7
Net internal area sq ft 000’s 3,015 549 3,564
Our portfolio – 100% central London
North of Oxford Street £1,223.2mLocations
Rest of West End £650.5mSouthwark £171.4m
Midtown £130.8m
Office £1,877.0mBusiness mix
Retail £451.7m
City £152.8m
53%
28%
6%
7%
6%
19%
81%
Great Portland Estates
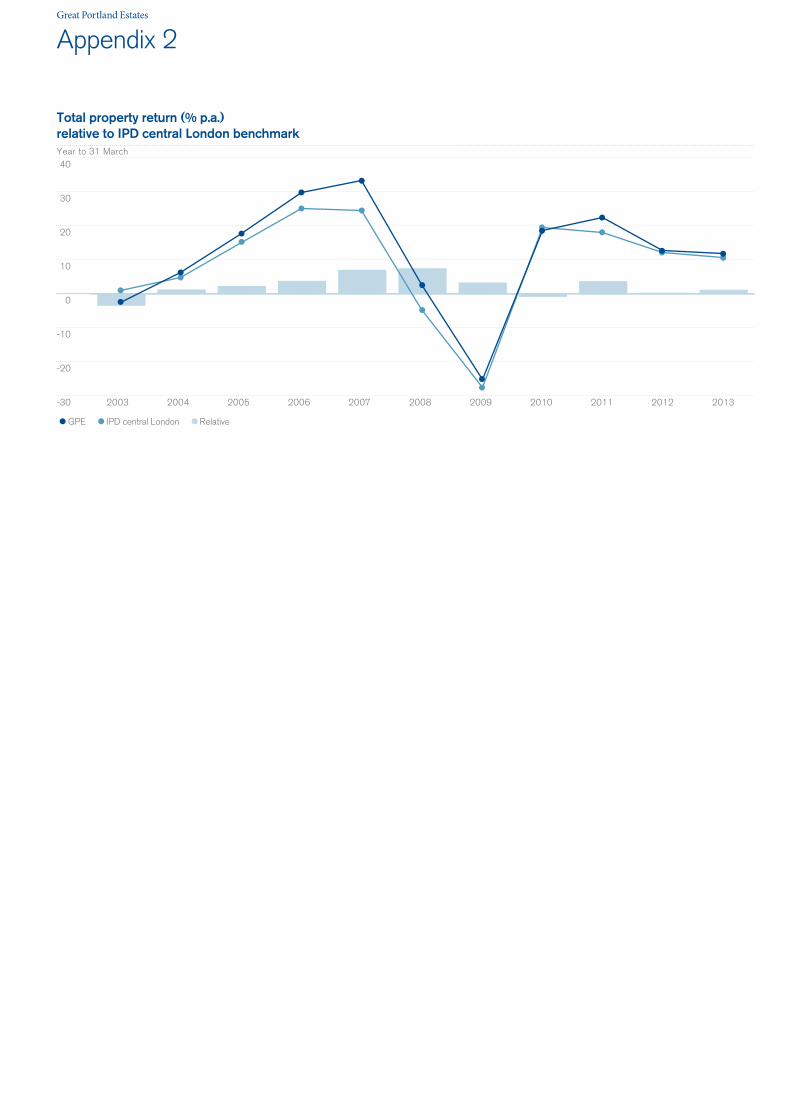
GPE IPD central London Relative
-30
40
0
10
20
30
-10
Year to 31 March
2003
-20
2005 2006 2007 2008 2009 2010 2011 2012 2013
Total property return (% p.a.)relative to IPD central London benchmark
2004
Appendix 2

Great Portland Estates
Appendix 3
Purchases for the year to 31 March 2013
DescriptionPrice
£mNet initial
yield Net internal
area sq ft£ per sq ft
French Railways House and 50 Jermyn Street, SW1 39.0 5.1% 49,900 782
Jermyn Street Estate, SW1 120.0 3.7% 133,000 902
Minerva House, SE1 60.0 5.4% 103,700 579
Orchard Court, W1 37.0 4.6% 47,800 775
148 Old Street1, EC1 15.0 6.9% 97,800 307
Total 271.0 4.7% 432,200 662
Note 1 Our share.
Sales for the year to 31 March 2013
DescriptionPrice
£mNet initial
yield£ per sq ft
Premium to book value
Buchanan House, WC2 20.5 2.1% 319 2.5%
Jermyn Street Estate1, SW1 60.0 3.7% 902 3.9%
Regent Arcade House1, W1 24.0 5.5% 741 6.5%
100 Regent Street1, W1 32.3 3.7% 1,218 9.5%
100 Bishopsgate2, EC2 47.4 0.4% n/a 0.0%
Total 184.2 2.8% 721 4.0%
1. Our share.
2. 37.5% interest sold.
Wholly-owned and joint venture property values at 31 March 2013
Wholly-owned £1,859.1mAccess to new properties £319.6mRisk sharing £150.0m
80%
14%
6%
Net investment in joint ventures as at 31 March 2013 £mAccess to new properties
48.2
63.0
89.6
38.9
Risk sharing
108.6
Total 348.3
Great Portland Estates
Appendix 3
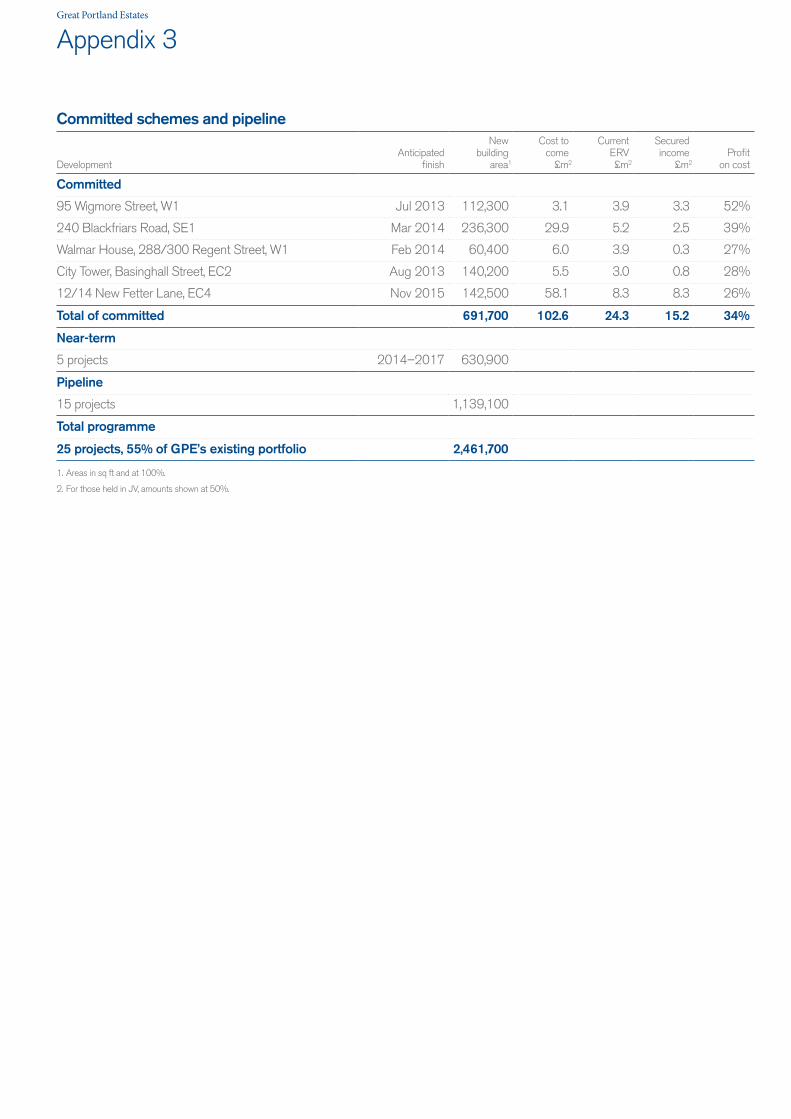
Committed schemes and pipeline
DevelopmentAnticipated
finish
New building
area1
Cost to come
£m2
Current ERV £m2
Secured income
£m2Profit
on cost
Committed
95 Wigmore Street, W1 Jul 2013 112,300 3.1 3.9 3.3 52%
240 Blackfriars Road, SE1 Mar 2014 236,300 29.9 5.2 2.5 39%
Walmar House, 288/300 Regent Street, W1 Feb 2014 60,400 6.0 3.9 0.3 27%
City Tower, Basinghall Street, EC2 Aug 2013 140,200 5.5 3.0 0.8 28%
12/14 New Fetter Lane, EC4 Nov 2015 142,500 58.1 8.3 8.3 26%
Total of committed 691,700 102.6 24.3 15.2 34%
Near-term
5 projects 2014–2017 630,900
Pipeline
15 projects 1,139,100
Total programme
25 projects, 55% of GPE’s existing portfolio 2,461,700
1. Areas in sq ft and at 100%.
2. For those held in JV, amounts shown at 50%.
Great Portland Estates
Appendix 3
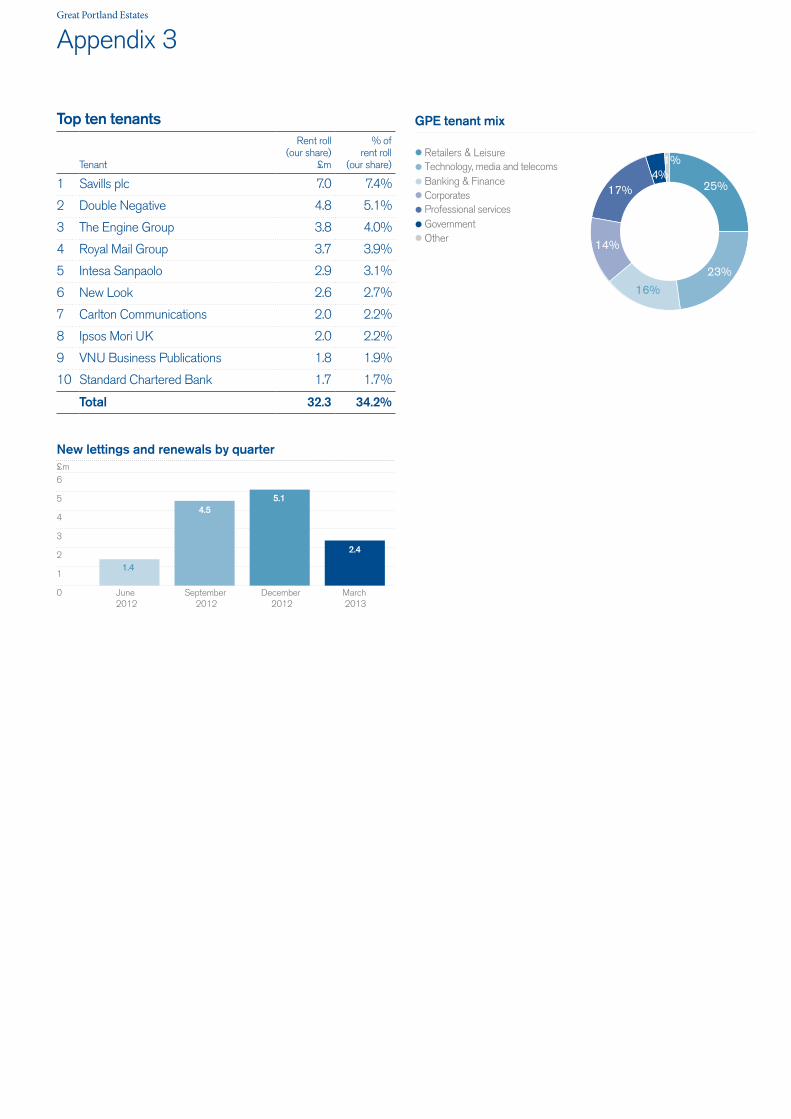
Top ten tenants
Tenant
Rent roll (our share)
£m
% of rent roll
(our share)
1 Savills plc 7.0 7.4%
2 Double Negative 4.8 5.1%
3 The Engine Group 3.8 4.0%
4 Royal Mail Group 3.7 3.9%
5 Intesa Sanpaolo 2.9 3.1%
6 New Look 2.6 2.7%
7 Carlton Communications 2.0 2.2%
8 Ipsos Mori UK 2.0 2.2%
9 VNU Business Publications 1.8 1.9%
10 Standard Chartered Bank 1.7 1.7%
Total 32.3 34.2%
GPE tenant mix
Retailers & LeisureTechnology, media and telecomsBanking & FinanceCorporates
25%
16%
17%4%
Professional servicesGovernmentOther
14%
23%
1%
0
6
2
3
4
1
New lettings and renewals by quarter
June 2012
September 2012
December 2012
March 2013
5
1.4
4.55.1
2.4
£m

Great Portland Estates
Appendix 3
Interest cover (X)
0
70
30
40
50
60
20
Net gearing and interest coverNet gearing (%)
2006
10
2007 2008 2009 2010 2011 2012 2013
44.6
36.0
40.3
65.1
26.4
31.4
42.840.3
2.01.8
2.0 2.0
3.84.0
2.4
2.0
Diversified sources of debt funding1
JV debt (our share)Private placement Group bank debtDebenture
15%
30% 37%
18%
1. Based on drawn position at 31 March 2013.
0
400
200
250
300
350
Debt maturity profile1
£m
50
2015 2016 2017 2018 2019 2020 2021 202920222014
39
350
150
111
37
102
4826
40
143150
100
Group debt JV debt (our share)
1. Based on committed facilities at 31 March 2013.

Great Portland Estates
Appendix 4
360
460
400
420
440
380
EPRA net assets per share1
Pence
403
287
9 27
-8 -2446
March-12 Wholly-owned
properties
Revaluations
Joint venture
properties
Development properties
Profit on
disposals
EPRAEPS
Total Dividend
Other March-13
1. Adjusted per EPRA guidance.
0
35
10
20
30
5
EPRA profit before tax1
£m
March-12 Rental income and JV fees
JV profits Property costs
Admin costs
Net interest
March-13
1. Adjusted per EPRA guidance.
17.4
11.21.5
-0.2-2.9
-4.822.2
15
25
Debt analysis
March 2013
March 2012
Net debt excluding JVs (£m) 658.9 499.1
Net gearing 42.8% 40.3%
Total net debt including 50% JV non-recourse debt (£m) 761.1 686.9
Loan-to-property value 32.7% 34.2%
Total net gearing 49.5% 55.5%
Interest cover 2.4x 2.0x
Weighted average interest rate 3.7% 4.1%
Weighted average cost of debt 4.3% 4.5%
% of debt fixed/hedged 71% 69%
Cash and undrawn facilities (£m) 282 329

Great Portland Estates
Appendix 5
Rental incomeWholly-owned Share of joint ventures
Rent roll £m
Reversionary potential
£m
Rental values
£mRent roll
£m
Reversionary potential
£m
Rental values
£m
Total rental values
£m
London North of Oxford Street Office 36.3 2.7 39.0 2.7 0.1 2.8 41.8 Retail 5.0 0.3 5.3 5.1 0.7 5.8 11.1
Rest of West End Office 14.0 3.5 17.5 0.5 0.5 1.0 18.5 Retail 7.4 1.8 9.2 1.2 0.4 1.6 10.8
Total West End 62.7 8.3 71.0 9.5 1.7 11.2 82.2 City, Midtown and Southwark Office 12.0 0.5 12.5 9.7 1.3 11.0 23.5
Retail 0.8 (0.1) 0.7 – – – 0.7 Total City, Midtown and Southwark 12.8 0.4 13.2 9.7 1.3 11.0 24.2
Total let portfolio 75.5 8.7 84.2 19.2 3.0 22.2 106.4 Voids 2.1 0.8 2.9 Premises under refurbishment 9.7 10.3 20.0 Total let portfolio 96.0 33.3 129.3
Rent roll security, lease lengths and voidsWholly-owned Joint ventures
Rent roll secure for five years
%
Weighted average
lease length Years
Voids %
Rent roll secure for five years
%
Weighted average
lease length Years
Voids %
London North of Oxford Street Office 55.5 9.9 0.3 71.2 11.4 12.1 Retail 48.9 5.6 – 86.9 8.8 –
Rest of West End Office 6.1 2.3 8.1 50.4 6.0 9.5 Retail 35.1 4.9 0.5 100.0 14.0 –
Total West End 41.4 7.4 2.6 82.7 9.9 5.0 City, Midtown and Southwark Office 78.0 7.9 – 40.2 5.2 0.4
Retail 98.1 10.5 – – – – Total City, Midtown and Southwark 79.3 8.0 0.1 40.2 5.2 0.4
Total let portfolio 48.0 7.5 2.2 61.0 7.1 2.4
Rental values and yieldsWholly-owned Joint ventures Wholly-owned Joint ventures
Average rent £psf
Average ERV £psf
Average rent £psf
Average ERV £psf
Initial yield
%
True equivalent
yield %
Initial yield
%
True equivalent
yield %
London North of Oxford Street Office 41 45 46 49 2.6 5.0 3.5 4.6Retail 31 37 102 105 4.4 5.0 5.2 5.0
Rest of West End Office 39 52 14 29 2.4 4.9 2.1 5.1Retail 57 70 46 61 2.3 4.4 4.0 4.9
Total West End 41 47 57 60 2.6 4.9 4.5 4.9City, Midtown and Southwark Office 35 37 33 40 4.6 5.8 6.0 6.7
Retail 55 48 – 45 5.5 5.3 – –Total City, Midtown and Southwark 36 36 40 44 4.7 5.8 6.0 6.7
Total let portfolio 40 45 47 50 2.9 5.0 5.2 5.8
Great Portland Estates
Appendix 6
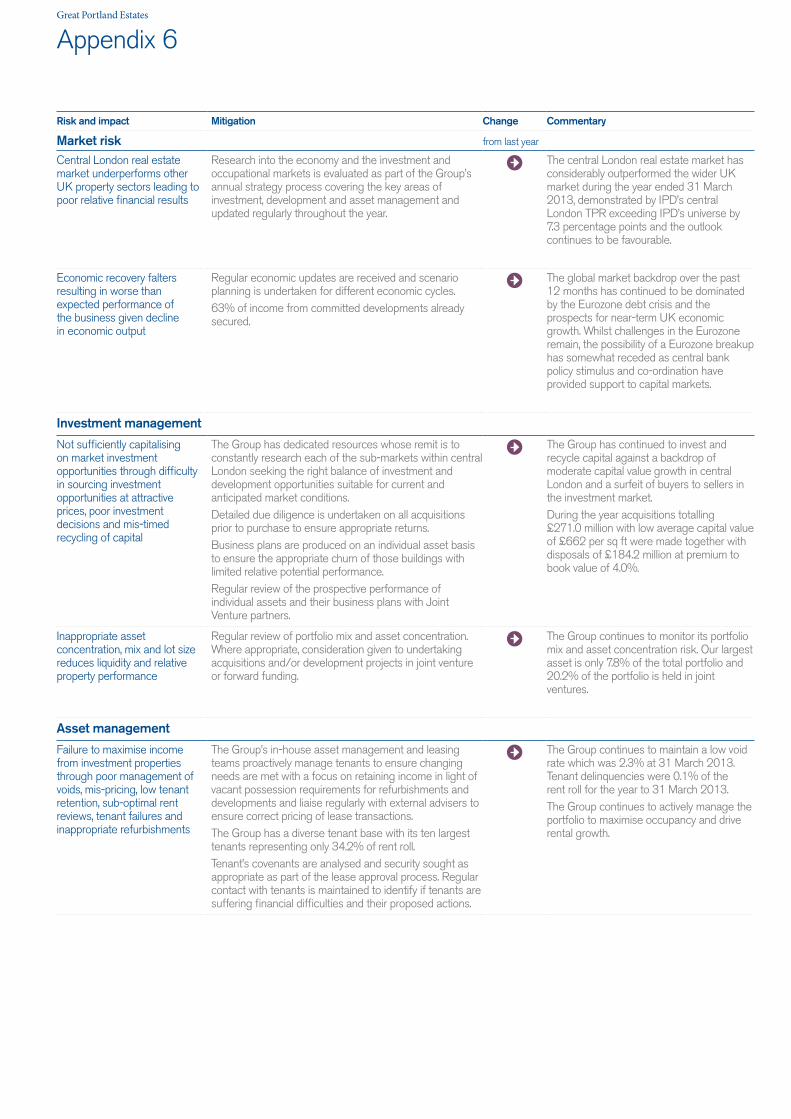
Risk and impact Mitigation Change Commentary
Market risk from last year
Central London real estate market underperforms other UK property sectors leading to poor relative financial results
Research into the economy and the investment and occupational markets is evaluated as part of the Group’s annual strategy process covering the key areas of investment, development and asset management and updated regularly throughout the year.
The central London real estate market has considerably outperformed the wider UK market during the year ended 31 March 2013, demonstrated by IPD’s central London TPR exceeding IPD’s universe by 7.3 percentage points and the outlook continues to be favourable.
Economic recovery falters resulting in worse than expected performance of the business given decline in economic output
Regular economic updates are received and scenario planning is undertaken for different economic cycles.63% of income from committed developments already secured.
The global market backdrop over the past 12 months has continued to be dominated by the Eurozone debt crisis and the prospects for near-term UK economic growth. Whilst challenges in the Eurozone remain, the possibility of a Eurozone breakup has somewhat receded as central bank policy stimulus and co-ordination have provided support to capital markets.
Investment management
Not sufficiently capitalising on market investment opportunities through difficulty in sourcing investment opportunities at attractive prices, poor investment decisions and mis-timed recycling of capital
The Group has dedicated resources whose remit is to constantly research each of the sub-markets within central London seeking the right balance of investment and development opportunities suitable for current and anticipated market conditions.Detailed due diligence is undertaken on all acquisitions prior to purchase to ensure appropriate returns.Business plans are produced on an individual asset basis to ensure the appropriate churn of those buildings with limited relative potential performance.Regular review of the prospective performance of individual assets and their business plans with Joint Venture partners.
The Group has continued to invest and recycle capital against a backdrop of moderate capital value growth in central London and a surfeit of buyers to sellers in the investment market.During the year acquisitions totalling £271.0 million with low average capital value of £662 per sq ft were made together with disposals of £184.2 million at premium to book value of 4.0%.
Inappropriate asset concentration, mix and lot size reduces liquidity and relative property performance
Regular review of portfolio mix and asset concentration. Where appropriate, consideration given to undertaking acquisitions and/or development projects in joint venture or forward funding.
The Group continues to monitor its portfolio mix and asset concentration risk. Our largest asset is only 7.8% of the total portfolio and 20.2% of the portfolio is held in joint ventures.
Asset management
Failure to maximise income from investment properties through poor management of voids, mis-pricing, low tenant retention, sub-optimal rent reviews, tenant failures and inappropriate refurbishments
The Group’s in-house asset management and leasing teams proactively manage tenants to ensure changing needs are met with a focus on retaining income in light of vacant possession requirements for refurbishments and developments and liaise regularly with external advisers to ensure correct pricing of lease transactions.The Group has a diverse tenant base with its ten largest tenants representing only 34.2% of rent roll.Tenant’s covenants are analysed and security sought as appropriate as part of the lease approval process. Regular contact with tenants is maintained to identify if tenants are suffering financial difficulties and their proposed actions.
The Group continues to maintain a low void rate which was 2.3% at 31 March 2013. Tenant delinquencies were 0.1% of the rent roll for the year to 31 March 2013.The Group continues to actively manage the portfolio to maximise occupancy and drive rental growth.

Great Portland Estates
Appendix 6
Risk and impact Mitigation Change Commentary
Development management from last year
Poor development returns relating to:
— incorrect reading of the property cycle;
— inappropriate location; — failure to gain viable planning consents;
— level of speculative development;
— contractor availability and insolvency risk;
— a building being inappropriate to tenant demand;
— quality and benchmarks of the completed buildings;
— construction and procurement delays;
— ineffective marketing to prospective tenants; and
— poor development management.
See market risk above.Prior to committing to a development the Group conducts a detailed Financial and Operational appraisal process which evaluates the expected returns from a development in light of likely risks. During the course of a development, the actual costs and estimated returns are regularly monitored to signpost prompt decisions on project management, leasing and ownership.63% of income from committed developments already secured.Due diligence is undertaken of the financial stability of demolition and main contractors prior to awarding of contracts.Working with agents, potential occupiers’ needs and aspirations are identified during the planning application and design stages.All our major developments are subject to BREEAM ratings with a target to achieve a rating of ‘Very Good’ on major refurbishments and ‘Excellent’ on new build properties.Pro-active liaison with existing tenants before and during the development process.Selection of contractors and suppliers based on track record of delivery and credit worthiness.In-house Leasing team liaise with external advisors on a regular basis and marketing timetables designed in accordance with leasing objectives.In-house Project Management team closely monitor construction and manage contractors to ensure adequate resourcing to meet programme.Regular review of the prospective performance of individual assets and their business plans with Joint Venture partners.Post completion reviews undertaken on all developments to identify best practice and areas for improvement.
The Group’s development programme of high quality core central London projects continues to attract quality tenants with £14.0 million of pre-lets secured since 1 April 2012.
Level of development undertaken as a percentage of the portfolio leads to underperformance against KPIs
Regular review of the level of development undertaken as a percentage of portfolio, including the impact on the Group’s income profile and financial gearing, amongst other metrics.Developments only committed when pre-lets obtained and/or market supply considered to be sufficiently constrained.
With forecasted supply of central London office space expected to be scarce in the near to medium-term, the Group has continued its near-term development programme to capitalise on the expected resulting rental growth.
Financial risks
Limited availability of further capital constrains the growth of the business
Cash flow and funding needs are regularly monitored to ensure sufficient undrawn facilities are in place.Funding maturities are managed across the short, medium and long-term.The Group’s funding measures are diversified across a range of bank and bond markets. Strict counterparty limits are operated on deposits.
Since 31 March 2012, the Group has continued to diversify and enhance the maturity ladder of its debt financing.In November 2012, the Company raised £138 million through a share placing to finance acquisitions of properties with asset management angles to exploit.Cash and undrawn credit facilities are £282 million.

Great Portland Estates
Appendix 6
Risk and impact Mitigation Change Commentary
Financial risks continued from last year
Adverse market movements negatively impact on debt covenants through increased interest rates or a fall in capital values
Regular review of current and forecast debt levels and financing ratios.Formal policy to manage interest rate exposure by having a high proportion of debt with fixed or capped interest rates through derivatives.Significant headroom over all financial covenants at 31 March 2013.We estimate that values could fall by 38% from their 31 March 2013 levels before group debt covenants could be endangered.
The slow forecast recovery of the UK economy is expected to result in a continued low interest rate environment in the near term. Central London property values are expected to benefit from rental value growth and continued strong investment demand.
Inappropriate capital structure results in sub-optimal NAV per share growth
Regular review of current and forecast debt and gearing levels and financing ratios.
The Group’s existing capital structure is well placed to take advantage of opportunities as they arise and to deliver our near-term development programme.
People
Correct level, mix and retention of people to execute our Business Plan. Strategic priorities not achieved because of inability to attract, develop, motivate and retain talented employees
Regular review is undertaken of the Group’s resource requirements and succession planning.The Company has a remuneration system that is strongly linked to performance and a formal appraisal system to provide regular assessment of individual performance and identification of training needs.
New Head of Development role created in March 2013.Other senior managers remain unchanged.
Regulatory
Adverse regulatory risk including tax, planning, environmental legislation and EU directives increases cost base, reduces flexibility and may influence potential investor and occupier interest in buildings.
Senior Group representatives spend considerable time using experienced advisers as appropriate, to ensure compliance with current and potential future regulations.Lobbying property industry matters is undertaken by active participation of the Executive Directors through relevant industry bodies.Environmental Policy Committee meets at least quarterly to consider strategy in respect of environmental legislation.
During 2013 new Building Regulations will come into effect requiring further reductions on carbon emissions whilst the risk to the Group from increasing regulation having unforeseen consequences and the impact of certain EU directives including the AIFM directive continues to be uncertain.
Health and Safety incidents Loss of or injury to employees, contractors or tenants and resultant reputational damage
The Group has dedicated Health and Safety personnel to oversee the Group’s management systems which include regular risk assessments and annual audits to proactively address key Health and Safety areas including employee, contractor and tenant safety.On developments, the Group operates a pre-qualification process to ensure selection of competent consultants and contractors which includes a health and safety assessment.Contractors’ responses to accidents and near misses are actively monitored and followed up by our Project Managers and Head of Sustainability.
The Group had two reportable accidents during the year each resulting in a contractor requiring three days off work.There were no other incidents across the Group’s investment or development portfolio.