2q2020 repsol financial report€¦ · property, plant and equipment 4.1.2 22,971 23,145 investment...
TRANSCRIPT

Official Notice
Repsol International Finance B.V. Koninginnegracht 19
2514 AB The Hague
The Netherlands
Tel. 31 703141611
www.repsolinternationalfinancebv.com
The Hague, July 23, 2020
In accordance with Law of 23 December 2016, on market abuse, Repsol International Finance
B.V. (the “Company”) is filing the attached Interim Condensed Consolidated Financial
Statements of Repsol, S.A. and investees composing the Repsol Group for the first half of
2020, including the Limited Review Report and the Interim Management Report (the
“Interim Consolidated Financial Report June 2020”).
The Interim Consolidated Financial Report June 2020 has been filed today by Repsol, S.A.
(Guarantor of the Company´s Euro 10,000,000,000 Guaranteed Euro Medium Term Note
Programme) with the Spanish Securities Market Commission (Comisión Nacional del
Mercado de Valores).
* * *


Translation of a report originally issued in Spanish.In the event of a discrepancy, the Spanish language version prevails
2020 Interim consolidatedfinancial statementsFirst Half
REPSOL Group

Repsol, S.A. and Investees comprising the Repsol Group
Balance sheet at June 30, 2020 and December 31, 2019
€ Million
ASSETS Note 06 /30/2020 12/31/2019
Intangible assets 4.1.1 3,951 4,470
Property, plant and equipment 4.1.2 22,971 23,145
Investment property 65 66
Investments accounted for using the equity method 4.1.3 6,345 7,237
Non-current financial assets 4.1.6 922 1,125
Deferred tax assets 4,083 4,050
Other non-current assets 738 1,315
NON-CURRENT ASSETS 39,075 41,408
Non-current assets held for sale 4 5
Inventories 4.1.8 3,246 4,597
Trade and other receivables 4.1.8 4,022 5,911
Other current assets 4.1.8 734 195
Other current financial assets 4.1.6 1,227 2,800
Cash and cash equivalents 4.1.6 5,285 2,979
CURRENT ASSETS 14,518 16 ,48 7
TOTAL ASSETS 53,593 57,8 95
€ Million
EQUITY AND LIABILITIES Note 06 /30/2020 12/31/2019
Share capital 1,626 1,566
Share premium and reserves 22,564 26,731
Treasury shares and own equity investments (1,326) (1,170)
Profit for the period attributable to the parent (2,484) (3,816)
Other equity instruments 1,912 1,024
SHAREHOLDERS’ EQUITY 4.1.4 22,292 24,335
Equity instruments with changes through other comprehensive income 24 24
Hedging transactions (145) (109)
Translation differences 521 678
OTHER CUMULATIVE COMPREHENSIVE INCOME 400 593
NON-CONTROLLING INTERESTS 248 281
EQUITY 22,940 25,209
Non-current provisions 3,876 3,912
Non-current financial liabilities 4.1.5 12,734 10,929
Deferred tax liabilities and other tax items 2,121 2,375
Other non-current liabilities 452 385
NON-CURRENT LIABILITIES 19,18 3 17,6 01
Current provisions 674 865
Current financial liabilities 4.1.5 5,418 6,538
Trade and other payables 4.1.8 5,378 7,682
CURRENT LIABILITIES 11,470 15,08 5
TOTAL EQUITY AND LIABILITIES 53,593 57,8 95
Notes 1 to 8 are an integral part of the balance sheet.
Translation of a report originally issued in Spanish In the event of a discrepancy, the Spanish language version prevails.
2

Repsol, S.A. and Investees comprising the Repsol Group
Income statement corresponding to the interim periods ending June 30, 2020 and 2019
€ Million
Note 06 /30/2020 06 /30/2019
Sales 16,488 24,783
Income from services rendered and other income 175 150
Changes in inventories of finished goods and work in progress (500) 335
Other operating income 279 404
Procurements (12,863) (19,178)
Amortization of non-current assets (1,146) (1,146)
(Provision for)/Reversal of impairment provisions 4.2.2 (577) 13
Personnel expenses (935) (969)
Transport and freights (757) (613)
Supplies (203) (231)
Gains/(Losses) on disposal of assets 69 81
Other operating expenses (1,700) (1,997)
OPERATING INCOME 4.2.1 (1,6 70) 1,6 32
Net interest (127) (124)
Change in fair value of financial instruments 128 80
Exchange gains (losses) (24) (21)
Impairment of financial instruments (25) 14
Other financial income and expenses (117) (118)
FINANCIAL RESULT 4.2.3 (16 5) (16 9)
NET INCOME FROM INVESTMENTS ACCOUNTED FOR USING THE EQUITY METHOD (1) 4.1.3 (978) 237
NET INCOME BEFORE TAX (2,8 13) 1,700
Income tax 4.2.4 296 (555)
NET INCOME (2,517) 1,145
NET INCOME ATTRIBUTABLE TO NON-CONTROLLING INTERESTS 33 (12)
NET INCOME ATTRIBUTABLE TO THE PARENT 3 (2,48 4) 1,133
EARNINGS PER SHARE ATTRIBUTABLE TO THE PARENT 4.2.5 Euros / share
Basic (1.63) 0,68
Diluted (1.63) 0,68(1) Net of taxes.
Notes 1 to 8 are an integral part of the consolidated income statement.
Translation of a report originally issued in Spanish In the event of a discrepancy, the Spanish language version prevails.
3

Repsol S.A. and Investees comprising the Repsol Group
Statement of recognized income and expense corresponding to the interim periods ending June 30, 2020 and 2019
€ Million
30/06 /2020 30/06 /2019
CONSOLIDATED NET INCOME FOR THE PERIOD (2,517) 1,145
Due to actuarial gains and losses (6) (7)
Investments in joint ventures and associates (14) (6)
Equity instruments with changes through other comprehensive income — (3)
Tax effect — 2
OTHER COMPREHENSIVE INCOME. ITEMS NOT RECLASSIFIABLE TO INCOME (20) (14)
Cash flow hedging: (38 ) (27)
Valuation gains / (losses) 3 (36)
Amounts transferred to the income statement (41) 9
Translation differences: (191) 108
Valuation gains / (losses) (154) 128
Amounts transferred to the income statement (37) (20)
Tax effect 36 9
OTHER COMPREHENSIVE INCOME. ITEMS RECLASSIFIABLE TO INCOME (193) 90
TOTAL OTHER COMPREHENSIVE INCOME (213) 76
TOTAL COMPREHENSIVE INCOME FOR THE PERIOD (2,730) 1,221
a) Attributable to the parent (2,697) 1,208
b) Attributable to non-controlling interests (33) 13
Notes 1 to 8 are an integral part of the consolidated statement of recognized income and expense.
Translation of a report originally issued in Spanish In the event of a discrepancy, the Spanish language version prevails.
4

Repsol S.A. and Investees comprising the Repsol Group
Statement of changes in equity for the interim periods ending June 30, 2020 and 2019
Equity attributable to the parent and other equity instrument holders
Shareholders’ equity
€ MillionSharecapital
Sharepremium
andreserves
Treasuryshares andown equityinvestments
Profit forthe year
attributableto theparent
Otherequity
instruments
Othercumulative
comprehensiveincome
Non-controllinginterests Equity
Closing balance at 12/31/2018 1,559 25,8 94 (350) 2,341 1,024 16 0 28 6 30,914
Impact of new standards — (162) — — — — — (162)
Adjusted opening balance 1,559 25,732 (350) 2,341 1,024 16 0 28 6 30,752
Total recognized income/(expenses) — (11) — 1,133 — 8 6 13 1,221
Transactions with partners or owners
Share capital increase/(reduction) 40 (40) — — — — — —
Dividends and shareholder remuneration — (223) — — — — (1) (224)
Transactions with treasury shares and ownequity investments (net) — 20 (811) — — — — (791)
Increases/(reductions) due to changes in scope — 21 — — — 4 (25) —
Other equity variations
Transfers between equity-line items — 2,341 — (2,341) — — — —
Subordinated perpetual obligations — (15) — — (19) — — (34)
Other variations — 7 — — — (3) (1) 3
Closing balance at 06 /30/2019 1,599 27,8 32 (1,16 1) 1,133 1,005 247 272 30,927
Total recognized income/(expenses) — 4 — (4,949) — 346 15 (4,58 4)
Transactions with partners or owners
Share capital increase/(reduction) 38 (38) — — — — — —
Dividends and shareholder remuneration — (107) — — — — (6) (113)
Transactions with treasury shares and ownequity investments (net) (71) (952) (9) — — — — (1,032)
Increases/(reductions) due to changes in scope — — — — — — — —
Other transactions with partners and owners — — — — — — — —
Other equity variations
Transfers between equity-line items — — — — — — — —
Subordinated perpetual obligations — (14) — — 19 — — 5
Other variations — 6 — — — — — 6
Closing balance at 12/31/2019 1,56 6 26 ,731 (1,170) (3,8 16 ) 1,024 593 28 1 25,209
Total recognized income/(expenses) — (20) — (2,48 4) — (193) (33) (2,730)
Transactions with partners or owners —
Share capital increase/(reduction) 60 (60) — — — — — —
Dividends and shareholder remuneration — (236) — — — — — (236)
Transactions with treasury shares and ownequity investments (net) — (5) (156) — — — — (161)
Other equity variations
Transfers between equity-line items — (3,816) — 3,816 — — — —
Subordinated perpetual obligations — (25) — — 884 — — 859
Other variations — (5) — — 4 — — (1)
Closing balance at 06 /30/2020 1,6 26 22,56 4 (1,326 ) (2,48 4) 1,912 400 248 22,940
Notes 1 to 8 are an integral part of the consolidated statement of changes in equity.
Translation of a report originally issued in Spanish In the event of a discrepancy, the Spanish language version prevails.
5

Repsol S.A. and Investees comprising the Repsol Group
Statement of cash flows for the interim periods ending June 30, 2020 and 2019
€ Million
06 /30/2020 06 /30/2019
Income before tax (2,8 13) 1,700
Adjustments to income: 2,904 1,06 7
Amortization of non-current assets 1,146 1,146
Other (net) 1,758 (79)
Changes in working capital 6 6 5 (58 0)
Other cash flows from operating activities: (139) (315)
Dividends received 56 164
Income tax refunded/(paid) (9) (416)
Other proceeds from/(payments for) operating activities (186) (63)
CASH FLOWS FROM OPERATING ACTIVITIES 6 17 1,8 72
Payments for investments: (2,073) (2,172)
Group companies and associates (56) (71)
Property, plant and equipment, intangible assets and investment property (944) (1,133)
Other financial assets (1,073) (968)
Proceeds from divestments: 3,149 1,06 0
Group companies and associates 469 2
Property, plant and equipment, intangible assets and investment property 17 51
Other financial assets 2,663 1,007
Other cash flows 40 47
CASH FLOWS FROM INVESTMENT ACTIVITIES 1,116 (1,06 5)
Proceeds from and (payments for) equity instruments: 736 (729)
Issuance 1,491 —
Repayment and redemption (605) —
Acquisition (156) (791)
Disposal 6 62
Proceeds from and (payments for) financial liability instruments: 243 (206 )
Issuance 6,000 7,842
Return and amortization (5,757) (8,048)
Payments on shareholder remuneration and other equity instruments (128 ) (201)
Other cash flows from financing activities: (26 4) (177)
Interest payments (230) (267)
Other proceeds from/(payments for) financing activities (34) 90
CASH FLOWS FROM FINANCING ACTIVITIES 58 7 (1,313)
EXCHANGE RATE FLUCTUATIONS EFFECT (14) 22
NET INCREASE/(DECREASE) IN CASH AND CASH EQUIVALENTS 2,306 (48 4)
CASH AND CASH EQUIVALENTS AT BEGINNING OF PERIOD 2,979 4,78 6
CASH AND CASH EQUIVALENTS AT END OF PERIOD: 5,28 5 4,302
Cash and banks 2,411 3,006
Other financial assets 2,874 1,296
Notes 1 to 8 are an integral part of the consolidated statement of cash flows.
Translation of a report originally issued in Spanish In the event of a discrepancy, the Spanish language version prevails.
6
EXPLANATORY NOTES TO THE FINANCIAL STATEMENTS
Note No. Section Page
1 GENERAL INFORMATION ..................................................................................................................................
1.1 About this report............................................................................................................................................... 8
1.2 About the Repsol Group.................................................................................................................................... 8
1.3 Main new developments in the period ............................................................................................................. 8
2 BASIS OF PRESENTATION ..................................................................................................................................
2.1 General principles ............................................................................................................................................. 10
2.2 Accounting estimates and judgments ............................................................................................................... 10
2.3 Comparative information .................................................................................................................................. 11
2.3.1 Application of new accounting standards.................................................................................... 11
2.3.2 Earnings per share ....................................................................................................................... 11
2.4 Information by business segments ................................................................................................................... 11
3 INCOME AND OTHER FIGURES BY SEGMENT ................................................................................................... 12
4 MAIN CHANGES IN THE FINANCIAL STATEMENTS ...........................................................................................
4.1 Balance Sheet.................................................................................................................................................... 13
4.1.1 Intangible assets .......................................................................................................................... 13
4.1.2 Property, plant and equipment.................................................................................................... 13
4.1.3 Investments accounted for using the equity method .................................................................. 13
4.1.4 Equity ........................................................................................................................................... 14
4.1.5 Financial resources ...................................................................................................................... 16
4.1.6 Financial assets ............................................................................................................................ 17
4.1.7 Financial risks............................................................................................................................... 17
4.1.8 Current assets and liabilities ........................................................................................................ 18
4.2 Income Statement............................................................................................................................................. 18
4.2.1 Operating net income .................................................................................................................. 19
4.2.2 Asset impairment......................................................................................................................... 19
4.2.3 Financial results ........................................................................................................................... 21
4.2.4 Income tax ................................................................................................................................... 21
4.2.5 Earnings per share ....................................................................................................................... 21
4.3 Cash Flows......................................................................................................................................................... 21
5 RISKS .................................................................................................................................................................
5.1 Disputes ............................................................................................................................................................ 22
5.2 Government and legal proceedings with tax implications ................................................................................ 23
5.3 Geopolitical risks ............................................................................................................................................... 23
6 OTHER INFORMATION ...................................................................................................................................... 24
7 SUBSEQUENT EVENTS 24
8 EXPLANATION ADDED FOR THE TRANSLATION INTO ENGLISH ....................................................................... 24
APPENDICES: ......................................................................................................................................................................................
APPENDIX I. CHANGES IN THE COMPOSITION OF THE GROUP ........................................................................................................ 25
APPENDIX II. OTHER DETAILED INFORMATION................................................................................................................................. 27
APPENDIX III. RECONCILIATION OF REPSOL´S REPORTING MODEL FIGURES TO IFRS-EU................................................................ 33
7

(1) GENERAL INFORMATION
Translation of a report originally issued in Spanish In the event of a discrepancy, the Spanish language version prevails.
8
1.1 About this report
The accompanying interim consolidated financial statements of Repsol, S.A. and its investees, comprising the Repsol Group(hereinafter, “Repsol,” “Repsol Group” or “Group”), present fairly the Group’s equity and financial position at June 30, 2020, aswell as the Group’s earnings performance, the changes in the consolidated equity and the consolidated cash flows for the six-month period ending on the above date.
These interim financial statements were approved by the Board of Directors of Repsol, S.A. at its meeting of July 22, 2020 andare available at www.repsol.com.
1.2 About the Repsol Group
Repsol is a group of companies with a presence worldwide that, with a vision of being a multi-energy efficient, sustainable andcompetitive company, performs activities in the hydrocarbon sector throughout its entire value chain (exploration, developmentand production of crude oil and natural gas, refining, production, transportation and sale of a wide range of oil and petrochemicalproducts, oil derivatives and natural gas), as well as activities for the generation and sale of electricity1.
The activities of Repsol, S.A. and its subsidiaries are subject to extensive regulation, as described in Appendix III to theconsolidated financial statements for 2019.
The Group operates in several business segments. The definition of the business segments was revised in the period: Upstream,Industrial and Commercial and Renewables (see Note 2.4), the main metrics of which are summarized below.
€ Million
Revenue(1)
Operating income Adjusted net income Capital employed
30/6 /2020 30/6 /2019 30/6 /2020 30/6 /2019 30/6 /2020 30/6 /2019 30/6 /2020 30/6 /2019
Upstream 1,520 2,527 (4) 1,174 (51) 646 15,844 22,531
Industrial 8,164 12,169 409 59 296 448 10,037 11,115
Commercial and Renewables 7,828 11,605 218 362 163 265 3,746 3,464
Corporate and other 1 — (129) (124) (219) (244) 1,336 1,281
TOTAL 17,513 26 ,301 494 1,471 18 9 1,115 30,96 3 38 ,391
NOTE: Figures calculated in accordance with the Group's reporting model, as described in Note 4 to the 2019 consolidated financial statements.(1) Corresponds to the sum of the “Sales” and “Services rendered and other income.”
The Repsol Group prepares its interim financial statements including investments in all its subsidiaries, joint arrangements andassociates.
Appendix IA of the consolidated financial statements for 2019 details the main companies that form part of the Repsol Groupand that formed part of its scope of consolidation at that date. Appendix I of these interim financial statements contains thechanges in the composition of the Group that have taken place during the first six months of 2020.
1.3 Main new developments in the period
COVID-19 and 2020 Resilience Plan
On March 11, 2020, the World Health Organization raised to the status of global pandemic the public health emergency causedby SARSCoV-2 virus (commonly known as coronavirus, while COVID-19 denotes the disease caused by the virus). The rapidspread of COVID-19, on an international scale, has triggered into an unprecedented healthcare, social and economic crisis thatcontinues to evolve.
1 For further information, see section 2.1 Value chain and business segments of the 2019 Management Report, available at www.repsol.com.

The economic impact of the pandemic, combined with pre-existing complications on the supply and demand side, has resultedin an exceptionally challenging pricing environment for oil and gas. At the beginning of the year, most analysts expected to seean oil market with a tighter balance between supply and demand than in 2019. However, the pandemic has triggered an abruptdrop in the global consumption of oil, gas and other energy products following the mobility restrictions deployed around theworld to contain the spread of the disease and its impact on the economy. In early March 2020, OPEC+ members failed to reachan agreement to make further cuts in oil production to counteract the decline in demand. In these circumstances, there cameabout the largest collapse in decades in crude oil and gas prices, which fell as low as USD 20/bbl Brent and USD 1.7/MBtu HenryHub. However, throughout the second quarter the health crisis was slowly surmounted and economic activity graduallyrecovered - in different countries and to different degrees. Coupled with the agreements finally reached by producing countriesto limit oil output, this rebalanced supply and demand in the market and aided a recovery of oil prices. For further informationon the performance of oil and gas prices and their expected future development, see sections 3 and 7, Management Reportfor the first half of 2020.
Even amid these difficult circumstances, Repsol has sustained the safe operation of its businesses, most of which are officiallyconsidered essential or strategic activities in the countries where we are present.
The overall decline in business volume and the deterioration of economic conditions as a result of the pandemic have affectedthe activities and results of the Company’s businesses, as explained in detail in sections 2.1. “Impact of the COVID-19 crisis”and 4.1. “Results” of the Management Report for the first half of 2020.
The Board of Directors of Repsol has assessed the context and the foreseeable evolution of the economic situation, particularlythe global impact of COVID-19, the downturn in oil and gas market prices and their impact on the Company’s business andactivities. The Board adopted the “2020 Resilience Plan", taking into account a very demanding macroeconomic environmentfor the rest of the year and planning the following initiatives:
– Reductions of more than €350 million in Opex (4% of the initial budget) and more than €1 billion in Capex (26%), alongwith optimizations of around €800 million in working capital, compared with the metrics in our initial budget.
– The Company's financial goal is to preserve a robust balance sheet and investment grade credit rating and not increasenet debt in 2020 compared to year-end 2019.
– The shareholder remuneration commitment for the fiscal year 2020 under the current Strategic Plan will be maintained.Also, as planned, the Company will reduce the total number of issued shares to avoid share dilution as a result of thescrip dividend formula. However, no proposed resolution will be laid before the shareholders at a General Meeting toreduce share capital by 5%.
For further information on the 2020 Resilience Plan see section 2.2 of the Management Report for the first half of 2020.
Against this background, the oil and gas price expectations used to calculate the recoverable amount of assets were reviseddownward. This impacted their carrying amount of €-1,289 million after tax in the Upstream segment (see Note 4.2.2), with noimpact on the Industrial or the Commercial and Renewables segments.
It is difficult to predict to what extent and for how long the impact of the pandemic will affect Repsol’s businesses in the future.The lower global demand for crude oil, gas and oil products as a consequence of the reduction in economic activity and, inparticular, restrictions to mobility, may have a negative impact on prices and production and sales volumes; the deteriorationof global financial conditions may affect the cost of capital, liquidity or solvency of our clients and partners in joint operations,and so on. The pandemic’s evolution as well as the control measures that health authorities may take and the policies to mitigateeconomic and social impact might influence both the scope and the length of both the crisis and its subsequent recovery.
Other events in the period
– In June, Repsol signed an agreement with PetroVietnam to transfer its 51,75% stake in Block 07/03 PSC and 40% inBlocks 135-136/03 PSC in Vietnam (see Note 5.3). The transaction, which is subject to government authorizations, isexpected to close over the course of this year with no material impact on Repsol's financial statements.
– In February, we acquired a seventh renewable project (Delta 2), to develop wind farms in Aragon, in the provinces ofHuesca, Zaragoza and Teruel, where Repsol is also developing the Delta 1 wind project. The wind farm, to be developedover the next three years, will be built and operated by Repsol. For further information see Note 4.3.
9

– During the first half of the year, the Group strengthened its financial and liquidity position by issuing two senior bondsfor a total amount of €1,500 million in April (see Note 4.1.5), perpetual subordinated bonds for an amount of €1,500million in June (see Note 4.1.4) and a further increase of €1,605 million in unused committed structural credit lines(see Note 4.1.7). In addition, a bond issued in 2013 for a nominal amount of €1,200 million was redeemed at maturityand €594 million of the perpetual subordinated bond issued in 2015 was repurchased at a price of 101,2% (see Note4.1.4).
– In line with the commitment made under the Resilience Plan on shareholder remuneration, in the first half of 2020the Company paid remuneration equivalent to 0.424 euros per share. In July, it paid additional remuneration equivalentto 0.492 euros per share. Both payouts were made through the "scrip dividend" scheme. To offset the dilutive effect,at a general meeting the shareholders approved a capital reduction through redemption of treasury shares as needed.For further information, see Note 4.1.4.
– In the first half, Standard & Poor’s, Moody’s and Fitch confirmed Repsol’s investment grade rating. For furtherinformation, see section 4.3. "Financial position" of the Interim Management Report.
10
(2) BASIS OF PRESENTATION
2.1 General principles
These interim financial statements have been prepared using the accounting records of the investee companies within theGroup under the International Financial Reporting Standards adopted by the European Union (IFRS-EU) as of June 30, 2020,and, specifically, pursuant to the requirements set out in International Accounting Standard (IAS) 34 "Interim Financial
Reporting,” in addition to the other provisions of the applicable regulatory framework.
In accordance with the provisions of IAS 34, these interim financial statements are prepared exclusively to update the contentof the most recent annual consolidated financial statements published, placing an emphasis on new activities, events andcircumstances that have taken place during the first six months of the year, without duplicating the information published inthe annual consolidated financial statements for the preceding year. To facilitate the correct understanding of informationcontained in these interim financial statements and given that they do not contain information required by comprehensivefinancial statements prepared pursuant to IFRS-EU, they must be read in conjunction with the Repsol Group's 2019 consolidatedfinancial statements, which were approved at the Annual General Meeting of Repsol, S.A. on May 8, 2020 and are available atwww.repsol.com.
These interim financial statements are presented in millions of euros (unless otherwise indicated) and the exchange rate againstthe euro of the main currency used by the Group companies at June 30, 2020 and December 31, 2019 was:
June 30, 2020 December 31, 2019
Closing rate Accumulated averagerate
Closing rate Accumulated averagerate
Dollar 1.12 1.10 1.12 1.12
2.2 Accounting estimates and judgments
The preparation of interim financial statements calls for estimates and judgments to be made that affect the measurement ofrecognized assets and liabilities, the presentation of contingent assets and liabilities, and income and expense recognized overthe period. The results may be significantly affected depending on the estimates made.
These estimates are made on the basis of the best information available, as described in Note 3.5 “Accounting estimates and
judgments” to the consolidated financial statements for 2019. During the first half of 2020, in the context of the COVID-19 crisisand the market situation for hydrocarbon prices, significant estimates and judgments were revised, as described in annualreporting, with the following key updates: (i) revision of the background assumptions, and, especially, price paths used tocalculate the recoverable amount of assets in the Upstream segment (see Note 4.2.2) and (ii) review of the expected loss modelto measure financial instruments (see Note 4.1.7).
2.3 Comparative information2
11
2.3.1 Application of new accounting standards
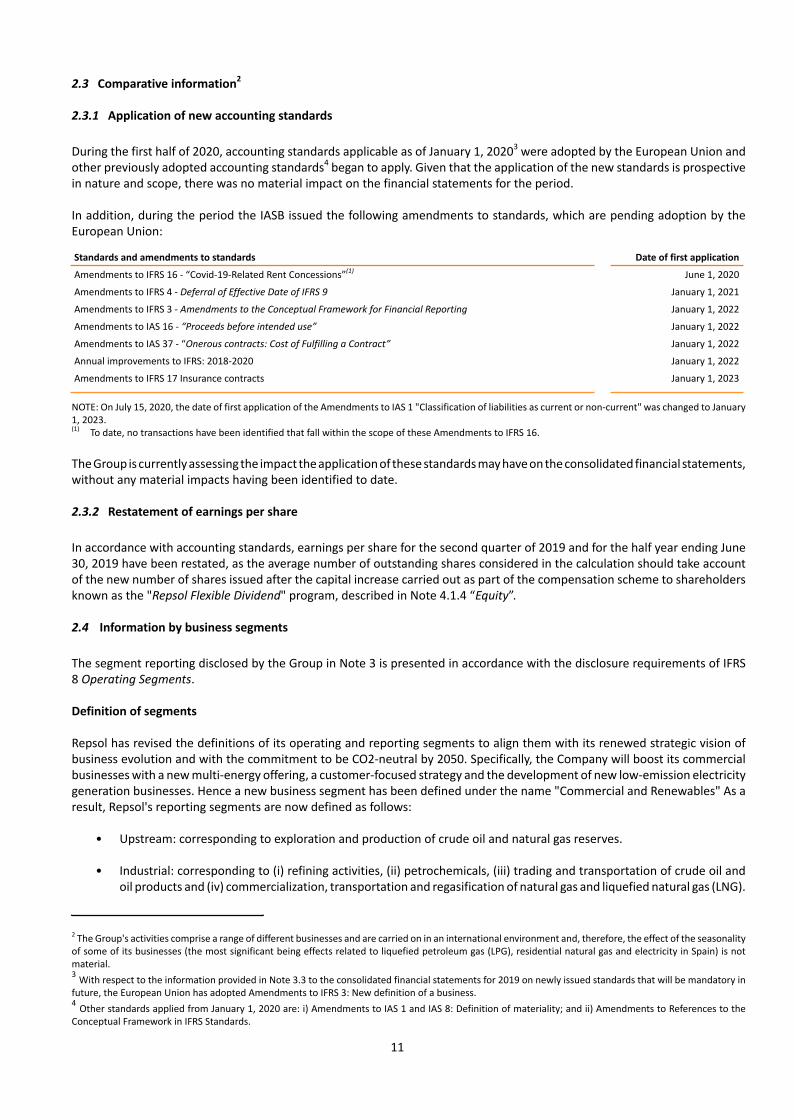
During the first half of 2020, accounting standards applicable as of January 1, 20203 were adopted by the European Union andother previously adopted accounting standards4 began to apply. Given that the application of the new standards is prospectivein nature and scope, there was no material impact on the financial statements for the period.
In addition, during the period the IASB issued the following amendments to standards, which are pending adoption by theEuropean Union:
Standards and amendments to standards Date of first application
Amendments to IFRS 16 - “Covid-19-Related Rent Concessions”(1) June 1, 2020
Amendments to IFRS 4 - Deferral of Effective Date of IFRS 9 January 1, 2021
Amendments to IFRS 3 - Amendments to the Conceptual Framework for Financial Reporting January 1, 2022
Amendments to IAS 16 - “Proceeds before intended use” January 1, 2022
Amendments to IAS 37 - “Onerous contracts: Cost of Fulfilling a Contract” January 1, 2022
Annual improvements to IFRS: 2018-2020 January 1, 2022
Amendments to IFRS 17 Insurance contracts January 1, 2023
NOTE: On July 15, 2020, the date of first application of the Amendments to IAS 1 "Classification of liabilities as current or non-current" was changed to January1, 2023.(1) To date, no transactions have been identified that fall within the scope of these Amendments to IFRS 16.
The Group is currently assessing the impact the application of these standards may have on the consolidated financial statements,without any material impacts having been identified to date.
2.3.2 Restatement of earnings per share
In accordance with accounting standards, earnings per share for the second quarter of 2019 and for the half year ending June30, 2019 have been restated, as the average number of outstanding shares considered in the calculation should take accountof the new number of shares issued after the capital increase carried out as part of the compensation scheme to shareholdersknown as the "Repsol Flexible Dividend" program, described in Note 4.1.4 “Equity”.
2.4 Information by business segments
The segment reporting disclosed by the Group in Note 3 is presented in accordance with the disclosure requirements of IFRS8 Operating Segments.
Definition of segments
Repsol has revised the definitions of its operating and reporting segments to align them with its renewed strategic vision ofbusiness evolution and with the commitment to be CO2-neutral by 2050. Specifically, the Company will boost its commercialbusinesses with a new multi-energy offering, a customer-focused strategy and the development of new low-emission electricitygeneration businesses. Hence a new business segment has been defined under the name "Commercial and Renewables" As aresult, Repsol's reporting segments are now defined as follows:
• Upstream: corresponding to exploration and production of crude oil and natural gas reserves.
• Industrial: corresponding to (i) refining activities, (ii) petrochemicals, (iii) trading and transportation of crude oil andoil products and (iv) commercialization, transportation and regasification of natural gas and liquefied natural gas (LNG).
2 The Group's activities comprise a range of different businesses and are carried on in an international environment and, therefore, the effect of the seasonalityof some of its businesses (the most significant being effects related to liquefied petroleum gas (LPG), residential natural gas and electricity in Spain) is notmaterial.3 With respect to the information provided in Note 3.3 to the consolidated financial statements for 2019 on newly issued standards that will be mandatory infuture, the European Union has adopted Amendments to IFRS 3: New definition of a business.4 Other standards applied from January 1, 2020 are: i) Amendments to IAS 1 and IAS 8: Definition of materiality; and ii) Amendments to References to theConceptual Framework in IFRS Standards.

• Commercial and Renewables: corresponding to (i) low carbon power generation and renewable sources, (ii) gas andpower commercialization, (iii) mobility and commercialization of oil products and (iv) LPG.
On the other hand, "Corporate and other" includes (i) Corporation running expenses and, specifically, those expenses relatedto managing the Group that have not been invoiced to the business divisions as a service, (ii) the financial result and (iii)intersegment consolidation adjustments.
Financial reporting for the first half of 2020 is presented under this new scheme, and financial reporting for the same periodin 2019 has been restated to enable comparative analysis.
Group reporting model
With regard to the Repsol Group’s reporting model, see About this report and Appendix II of the Management Report for thefirst half of 2020 (www.repsol.com).
12
(3) INCOME AND OTHER FIGURES BY SEGMENT5
Adjusted net profit and net profit
€ Million
Income/(loss) for the period 30/06 /2020 30/06 /2019
Upstream (51) 646
Industrial 296 448
Commercial and Renewables 163 265
Corporate and other (219) (244)
ADJUSTED NET INCOME 18 9 1,115
Inventory effect (1,088) 63
Special items (1,585) (45)
NET INCOME (2,48 4) 1,133
The Group’s interim Management Report for the first half of 2020, available at www.repsol.com, contains information by segmenton results, cash flow and financial position.
Other figures
Operating income Operating cash flow Free cash flow Operating investments Capital employed
€ Million 30/06 /2020 30/06 /2019 30/06 /2020 30/06 /2019 30/06 /2020 30/06 /2019 30/06 /2020 30/06 /2019 30/06 /2020 30/06 /2019
Upstream (4) 1,174 684 1,605 (2) 649 603 961 15,843 22,531
Industrial 409 590 90 723 (141) 418 227 306 10,038 11,115
Commercial and Renewables 218 362 125 370 (124) 202 259 176 3,742 3,464
Corporate and other (129) (124) (35) (168) 439 (176) 24 25 1,343 1,281
TOTAL 494 2,002 8 6 4 2,530 172 1,093 1,113 1,46 8 30,96 6 38 ,391
NOTE: To reconcile these figures to IFRS-EU figures, see Appendix III of these interim financial statements and Appendix II of the Interim Management Reportcorresponding to the first half of 2020.
5 All information provided in this Note, unless stated otherwise, has been prepared pursuant to the Group's reporting model (see Note 2.4) and has beenreconciled with the IFRS-EU Financial Statements in Appendix III. Some of the figures are classified as Alternative Performance Measures (APMs) inaccordance with European Securities and Markets Authority (ESMA) guidelines (for further information, see Appendix II of the Interim ManagementReport corresponding to the first half of 2020 and go to www.repsol.com).

(4) MAIN CHANGES IN THE FINANCIAL STATEMENTS
This section outlines the most significant changes affecting the balance sheet and income statement headings in the period.
Translation of a report originally issued in Spanish In the event of a discrepancy, the Spanish language version prevails.
13
4.1 Balance Sheet
4.1.1 Intangible assets
The decrease in the recoverable amount of the assets in the Upstream segment (see Note 4.2.2) gave rise to an impairment ofgoodwill arising from the acquisition of Repsol Oil & Gas Canada, Inc. (ROGCI) for €-362 million. Unfavorable changes in the keyassumptions that determine the recoverable amount of Upstream assets, mainly the decline in oil and gas prices, sales volume(production) and increases in the discount rate, would result in additional impairment of the goodwill at ROGCI at year-end(the balance at June 30, 2020 was €1,289 million).
4.1.2 Property, plant and equipment
The decrease in the balance of property, plant and equipment is due to the impairment losses recognized on hydrocarbonexploration and production assets (see Note 2.2), which were partly offset by expenditure in the first half, especially in theNorth American and Norwegian areas in Upstream, and expenditure to maintain and optimize the industrial complexes in theIndustrial segment. Expenditure was less than in the first half of 2019 due to implementation of the Resilience Plan (see Note1.3).
4.1.3 Investments accounted for using the equity method
Repsol accounts for investments in joint ventures and associates in which it has a stake using the equity method. Note 14 tothe consolidated financial statements for 2019 describes the Group's most significant investments. The breakdown of the balanceat June 30 is as follows:
€ Million
Carrying amount of investment
06 /30/2020 12/31/2019
Joint ventures 6,236 7,126
Associates (1) 109 111
TOTAL 6 ,345 — 7,237
(1) Includes mainly the stake in Petrocarabobo, S.A. and Oleoducto de Crudos Pesados (OCP) Ltd.
The changes in this heading during the period were as follows:
€ Million
06 /30/2020 06 /30/2019
Balance at December 31 7,237 7,144
Net investments 9 1
Changes in scope of consolidation (1) — 25
Net income from investments accounted for using the equity method (2) (978) 237
Dividends paid out (56) (157)
Translation differences (1) 60
Reclassifications and other movements (3) 134 45
Balance at June 30 6 ,345 7,355
(1) Does not include Other comprehensive income amounting to €-17 million at June 30, 2020 (€-18 million for joint ventures and €1 millionfor associates)and €54 million at June 30, 2019 for joint ventures.
(2) In 2020 mainly Repsol Sinopec Brasil (RSB) and Dynasol and in 2019 mainly RSB.(3) Mainly reflects reclassification to provisions of negative equity at Petroquiriquire and Cardón IV.
The decrease in "Net income from investments accounted for using the equity method" is due mainly to lower profit frominvestments in joint ventures whose business was affected by the price environment resulting from the international crisis(see Note 1.3) and impairments recognized in the recoverable amount of these investments, mainly in Trinidad and Tobagoand United Kingdom (see Note 2.2).

4.1.4 Equity
€ Million
06 /30/2020 12/31/2019
Shareholders' equity:
22,292 24,335
Share capital 1,626 1,566
Share premium and reserves: 22,564 26,731
Share premium 4,218 6,278
Legal reserve 312 312
Retained earnings and other reserves (1) 18,034 20,248
Dividends and remuneration on account — (107)
Treasury shares and own equity investments (1,326) (1,170)
Profit for the year attributable to the parent (2,484) (3,816)
Other equity instruments 1,912 1,024
Other cumulative comprehensive income 400 593
Non-controlling interests 248 28 1
TOTAL EQUITY 22,940 25,209
(1) This heading includes the transfer from income for the year attributable to the Parent for 2019 and “Other reserves” includes the impact of the first-timeapplication of IFRS 16 and IFRIC 23 in 2019 (see Note 3.2.1 to the consolidated financial statements for 2019).
Capital
On May 8, 2020, at the Annual General Meeting, shareholders approved two paid-up capital increases for the purpose ofimplementing the “Repsol Flexible Dividend” shareholder remuneration program, which replaces the final dividend for 2019and the interim dividend for 2020. This allows shareholders to choose between taking the dividend in cash (by selling their freeallocation rights to the Company or in the market) or in Company shares. The first of these paid-up capital increases took placein June and July, when 30.65% of the free allocation rights holders accepted Repsol’s irrevocable commitment to purchase suchrights6.
After the capital increase, the share capital of Repsol, S.A. registered at June 30 stood at €1,626,379,018, fully subscribed forand paid up, comprising 1,626,379,018 shares, each of a par value of €1.
In accordance with the most recent information available, Repsol, S.A.'s significant shareholders are as follows:
Significant shareholders
% of voting rights attributed to shares % of voting rightsthrough financial
instruments% of total voting rights
Direct Indirect
Sacyr, S.A.(1) — 7.545 — 7.545
BlackRock, Inc. (2) — 4.762 0.236 4.998
JP Morgan Chase & Co (3) — 0.585 6.270 6.855
(1) Sacyr, S.A. holds its interest through Sacyr Securities, S.A.U., Sacyr Investments S.A.U. and Sacyr Investments II, S.A.U.(2) BlackRock, Inc. holds its interest through several controlled entities. The information relating to BlackRock, Inc. is based on the statement submitted by
this company to the CNMV on December 10, 2019, on the share capital amount of 1,527,396,053 shares.(3) JP Morgan Chase & Co holds its stake through a number of controlled entities. The information relating to JP Morgan Chase & Co. is based on the statement
submitted by that entity to the CNMV on March 19, 2020 on the share capital amount of 1,566,043,878 shares.
14
6 Repsol has waived its free allocation rights acquired under the purchase commitment and hence its rights to the corresponding new shares. The balancesheet at June 30, 2020 includes a reduction under the heading of “Share premium” and a payment obligation to those shareholders who accepted Repsol’sbinding purchase commitment.

Shareholder remuneration
The following table breaks down the remuneration received by Repsol, S.A.’s shareholders during the six-month period endingon June 30, 2020, carried out under the “Repsol Flexible Dividend” program:
No. free allocationrights sold to Repsol
Price of purchasecommitment (€/
right)Cash payout
(millions of euros) New shares issued
Remuneration inshares
(millions of euros)
December 2019/January 2020 252,017,771 0.424 107 38,647,825 541
June/July 2020 480,011,345 0.492 236 60,335,140 534
At the Annual General Meeting, held on May 8, the shareholders approved a capital reduction7 through the cancellation oftreasury shares up to a maximum amount equal to the number of shares issued in the paid-up capital increases carried out in2020 shown in the table above, so as to offset the dilutive effect. The Board of Directors decided not to list on the agenda ofthe Annual General Meeting of shareholders the proposed 5% reduction of the share capital figure resolved upon in July 2019due to the state of the markets and supervening circumstances arising from COVID-19.
Treasury shares and own equity investments
The main transactions undertaken by the Repsol Group involving treasury shares8 were as follows:
No. of shares Amount (€M) % capital
Balance at 12/31/2019 8 0,76 8 ,905 1,170 5.16 %
Market purchases (1) 24,831,072 329 1,53%
Market sales (1) (12,196,174) (173) 0,76%
Repsol Flexible Dividend (2) 79,906 — —%
Balance at 06 /30/2020 93,48 3,709 1,326 5,75%
(1) Includes any shares purchased and delivered under the Share Purchase Plan and the Plans for share purchases by the beneficiaries of the multiyear variableremuneration programs (in 2020, 711,530 shares have been delivered in accordance with the provisions of each of the plans (see Note 29.4 of theconsolidated financial statements for 2019), and other transactions within the framework of discretionary treasury share trading as described in the RepsolGroup's Internal Code of Conduct in the area of the securities market. Also includes book entries to recognize/de-recognize treasury shares resulting fromderivatives transactions.
(2) New shares received in the bonus share capital increases under the “Repsol Flexible Dividend” program, corresponding to treasury shares.
As of June 30, 2020, the balance of treasury shares included a position of 92 million shares in the form of equity swaps. Throughthese derivatives, Repsol finances most of its treasury share position. Specifically, Repsol sells a certain volume of treasuryshares and simultaneously enters into equity swaps with the same counterparties for an equivalent notional amount. Derivativesprovide for physical settlement in a number of cases and transfer the economic rights in and over the shares to Repsol. As aresult, Repsol continues to be substantially exposed to the risks and rewards of ownership of the shares and, therefore, thefunds received are recorded as a financing transaction under "Current financial liabilities". As of June 30 the amount recognizedas a liability was €821 million.
15
7 This capital reduction has been carried out through the retirement of 1,400,000 treasury shares and the shares acquired through a share buy-back programmeand, where applicable, through the settlement of derivatives arranged prior to March 25, 2020. (The maximum number of shares that may be acquiredthrough the settlement of derivatives shall not exceed 96,950,000).
8 The shareholders, at their annual meetings of March 28, 2014 and May 11, 2018, authorized the Board of Directors to carry out the derivative acquisition ofRepsol shares, directly or through subsidiaries, up to a maximum number of shares such that the sum of those acquired plus treasury shares already heldby Repsol and any of its subsidiaries does not exceed 10% of the Company’s capital, insofar as the price or value of the consideration delivered is not lessthan the par value of the shares or more than their quoted price on the stock exchange. The current authorization (conferred at the shareholder annualmeeting of May 11, 2018) was granted for five years running from the date of the meeting, and nullified the equivalent resolution ratified at the shareholderannual meeting of March 28, 2014, in relation to any unused portion.

Other equity instruments
On June 2, 2020, Repsol International Finance, B.V. (“RIF”), a wholly owned subsidiary of the Repsol Group, finalized the termsof RIF's issuance of two series of perpetual subordinated bonds guaranteed by Repsol, S.A. for a total amount of €1.500 million.The bonds were placed with accredited investors and are listed on the Luxembourg Stock Exchange. Their main characteristicsare as follows:
Series 1 Series 2
ISIN XS2185997884 XS2186001314
Amount €750 million €750 million
First option to redeem(1) 11/03/2026 11/09/2028
Interest (payable annually)3.750% until June 11, 2026. Thereafter a 5-yearswap rate applies plus an additional spreadaccording to the terms and conditions of the bonds.
4.247% until December 11, 2028. Thereafter a 5-year swap rate applies plus an additional spreadaccording to the terms and conditions of the bonds.
(1) There are also options to redeem at the request of the issuer in certain cases specified in the terms and conditions.
The bonds bear no maturity date and the issuer can defer the coupon payments without triggering an event of default. Thecoupons thus deferred will be cumulative and must be paid in certain cases specified in the terms and conditions of the issue(for further information, see the issue prospectus, available at www.repsol.com).
The bonds were recognized in “Other equity instruments” on the view that they do not satisfy the conditions to be treated foraccounting purposes as a financial liability, since redemption and coupon payments are within the discretion of Repsol.
On that same day (June 2), Repsol, S.A. and RIF launched a cash repurchase offer for the perpetual subordinated bond€1,000,000,000 6 Year Non-Call Perpetual Securities (ISIN: XS1207054666) issued by RIF in March 2015. The price of therepurchase offer was 101.2% of the nominal amount, plus the accrued coupon. Holders of bonds of a total nominal amount of€594 million subscribed for the offer, which resulted in RIF acquiring and subsequently redeeming 59.37% of the issue. In total,RIF paid acceptors of the repurchase offer a total of €606 million in cash. The repurchased and canceled bonds were removedfrom the balance sheet.
16
4.1.5 Financial resources
€ Million
06 /30/2020 12/31/2019
Non-current financial liabilities:
Non-current financial liabilities (1) 12,734 10,929
Non-current trade operation derivatives (2) 9 11
Current financial liabilities:
Current financial liabilities (1) 5,418 6,538
Current trade operation derivatives (3) 388 350
Total financial liabilities 18 ,549 17,8 28
(1) This change is due mainly to the bond issues described in this section, which were partially offset by the cancellation of a bond upon maturity.(2) Recognized under “Other non-current liabilities” on the balance sheet. (3) Recognized under “Trade and other payables” on the balance sheet.
Key issues, repurchases and redemptions in the first half of 2020
▪ In April 2020, RIF completed two bond issues under the EMTN Program for a total amount of €1,500 million: i) €750 millionat a price of 99.967% and a fixed annual coupon of 2%, maturing in December 2025; and ii) €750 million at a price of99.896% and a fixed annual coupon of 2.625%, maturing in April 2030.
▪ In May 2020, a bond issued by RIF in May 2013 under the EMTN Program, which had been paying a fixed annual couponof 2.625%, was redeemed at maturity for the nominal amount of €1,200 million.
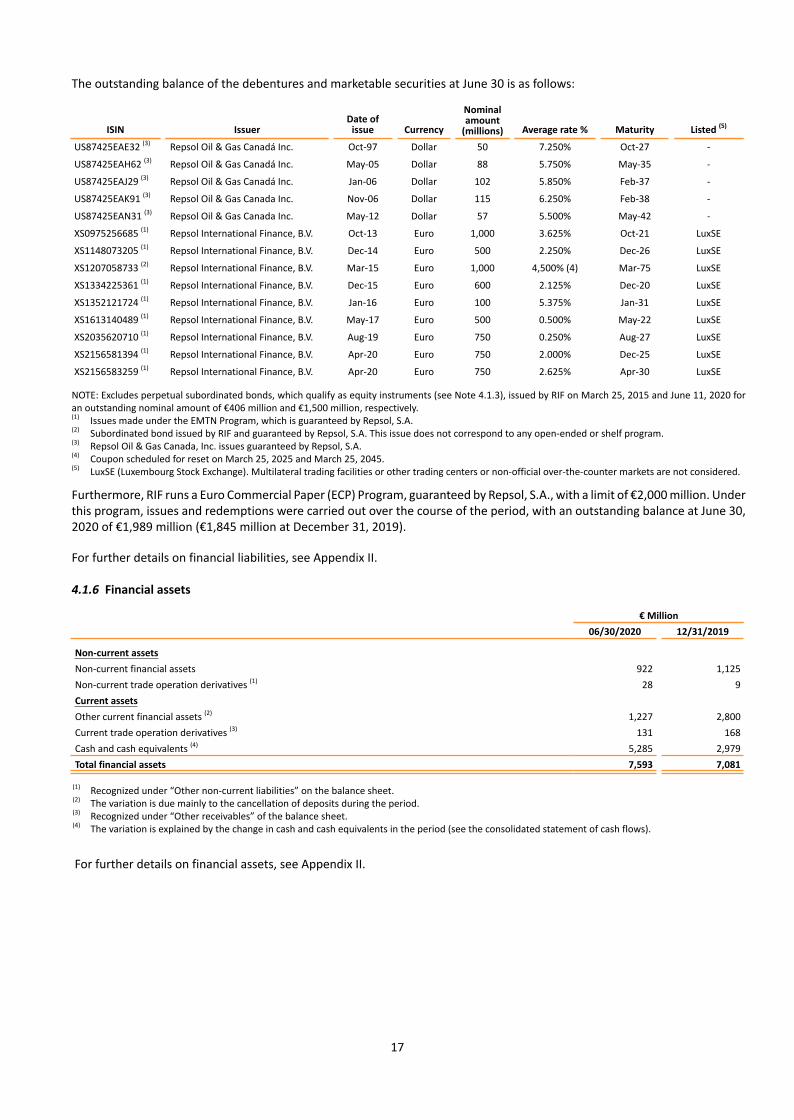
The outstanding balance of the debentures and marketable securities at June 30 is as follows:
ISIN IssuerDate of
issue Currency
Nominalamount
(millions) Average rate % Maturity Listed (5)
US87425EAE32 (3) Repsol Oil & Gas Canadá Inc. Oct-97 Dollar 50 7.250% Oct-27 -
US87425EAH62 (3) Repsol Oil & Gas Canadá Inc. May-05 Dollar 88 5.750% May-35 -
US87425EAJ29 (3) Repsol Oil & Gas Canadá Inc. Jan-06 Dollar 102 5.850% Feb-37 -
US87425EAK91 (3) Repsol Oil & Gas Canada Inc. Nov-06 Dollar 115 6.250% Feb-38 -
US87425EAN31 (3) Repsol Oil & Gas Canada Inc. May-12 Dollar 57 5.500% May-42 -
XS0975256685 (1) Repsol International Finance, B.V. Oct-13 Euro 1,000 3.625% Oct-21 LuxSE
XS1148073205 (1) Repsol International Finance, B.V. Dec-14 Euro 500 2.250% Dec-26 LuxSE
XS1207058733 (2) Repsol International Finance, B.V. Mar-15 Euro 1,000 4,500% (4) Mar-75 LuxSE
XS1334225361 (1) Repsol International Finance, B.V. Dec-15 Euro 600 2.125% Dec-20 LuxSE
XS1352121724 (1) Repsol International Finance, B.V. Jan-16 Euro 100 5.375% Jan-31 LuxSE
XS1613140489 (1) Repsol International Finance, B.V. May-17 Euro 500 0.500% May-22 LuxSE
XS2035620710 (1) Repsol International Finance, B.V. Aug-19 Euro 750 0.250% Aug-27 LuxSE
XS2156581394 (1) Repsol International Finance, B.V. Apr-20 Euro 750 2.000% Dec-25 LuxSE
XS2156583259 (1) Repsol International Finance, B.V. Apr-20 Euro 750 2.625% Apr-30 LuxSE
NOTE: Excludes perpetual subordinated bonds, which qualify as equity instruments (see Note 4.1.3), issued by RIF on March 25, 2015 and June 11, 2020 foran outstanding nominal amount of €406 million and €1,500 million, respectively.(1) Issues made under the EMTN Program, which is guaranteed by Repsol, S.A.(2) Subordinated bond issued by RIF and guaranteed by Repsol, S.A. This issue does not correspond to any open-ended or shelf program.(3) Repsol Oil & Gas Canada, Inc. issues guaranteed by Repsol, S.A.(4) Coupon scheduled for reset on March 25, 2025 and March 25, 2045.(5) LuxSE (Luxembourg Stock Exchange). Multilateral trading facilities or other trading centers or non-official over-the-counter markets are not considered.
Furthermore, RIF runs a Euro Commercial Paper (ECP) Program, guaranteed by Repsol, S.A., with a limit of €2,000 million. Underthis program, issues and redemptions were carried out over the course of the period, with an outstanding balance at June 30,2020 of €1,989 million (€1,845 million at December 31, 2019).
For further details on financial liabilities, see Appendix II.
17
4.1.6 Financial assets
€ Million
06 /30/2020 12/31/2019
Non-current assets
Non-current financial assets 922 1,125
Non-current trade operation derivatives (1) 28 9
Current assets
Other current financial assets (2) 1,227 2,800
Current trade operation derivatives (3) 131 168
Cash and cash equivalents (4) 5,285 2,979
Total financial assets 7,593 7,08 1
(1) Recognized under “Other non-current liabilities” on the balance sheet.(2) The variation is due mainly to the cancellation of deposits during the period.(3) Recognized under “Other receivables” of the balance sheet.(4) The variation is explained by the change in cash and cash equivalents in the period (see the consolidated statement of cash flows).
For further details on financial assets, see Appendix II.

4.1.7 Financial risks
As described in Note 11 to the 2019 consolidated financial statements, the Group's own activities are exposed to several typesof financial risk: market risk, liquidity risk and credit risk. The main updates are highlighted below:
Market risk
Interest rate risk
In connection with the process of transition to new benchmark interest rates currently under way in several jurisdictionsworldwide, the Group is continuing a review of its inventory of contracts in accordance with the reform timetable. The maincontracts identified to date, under which interbank interest rates are a key benchmark, are of a financial nature: mainly loansand credit facilities.
As to the hedging relations pegged to LIBOR/EURIBOR according to the "Interest Rate Benchmark Reform - Amendments toIFRS 9 and IAS 39", which we applied early in 2019, we believe that the cash flows of the hedging instrument and the hedgeditem will not be altered as a result of the reform. The notional amount of the dollar cash flow hedge related to the financing ofthe investment in the Canaport (Canada) LNG project, in the form of interest rate swaps, was increased to €393 million (€289million at December 31, 2019). For further information, see Note 10.1 to the 2019 consolidated financial statements, availableat www.repsol.com.
In addition, the Group is monitoring regulatory and market developments for an orderly transition. Whenever feasible, newcontracts are pegged to risk-free rates, and specific clauses are included to govern permanent cessation events. In relation toexisting contracts that will continue to be in force after the reform, the mechanisms for determining substitute benchmarksand market alternatives (i.e. ISDA 2020 IBOR, Fallbacks Protocol) are being reviewed to resolve permanent cessation events.
Liquidity risk
In the present international context, severely impacted by COVID-19, and within the framework of the Group's financial policy,Repsol has ensured the availability of funds to meet its obligations and implement its business plans, while maintaining at alltimes an optimal level of liquidity and seeking greater efficiency in the management of financial resources.
At June 30, 2020, cash and other liquid financial instruments9 and credit lines were sufficient to cover short-term debt maturities2.0 times (1.2 times at December 31, 2019). There were also undrawn credit lines for an amount of €3,411 million (€1,808million at December 31, 2019). At the end of the period, liquidity stood at €9,521 million (including undrawn committed creditfacilities).
Credit risk
The Company updated its customer management model using economic forecasts for the main countries where it operates.No material impact on the Group's financial statements will arise from a change in the payment behavior of debtors.
For credit risk arising from financial instruments relating to operations in Venezuela, see Note 5.3.
18
4.1.8 Current assets and liabilities
"Other current assets" includes assets within the scope of the agreement with PetroVietnam described in Note 5.3.
The lower balances under "Inventories" are explained by lower crude oil prices. "Trade and other receivables" declined due tolessened activity in all businesses (lower sales).
"Trade and other payables" decreased due to lessened activity (lower purchases).
9 Includes immediately available time deposits recorded under "Other current financial assets" amounting to €825 million.
4.2 Income Statement
On the same date as these interim financial statements, Repsol published its interim Management Report for the first half of2020, which contains a detailed explanation of these results and other performance figures, available at www.repsol.com.
19
4.2.1 Operating net income
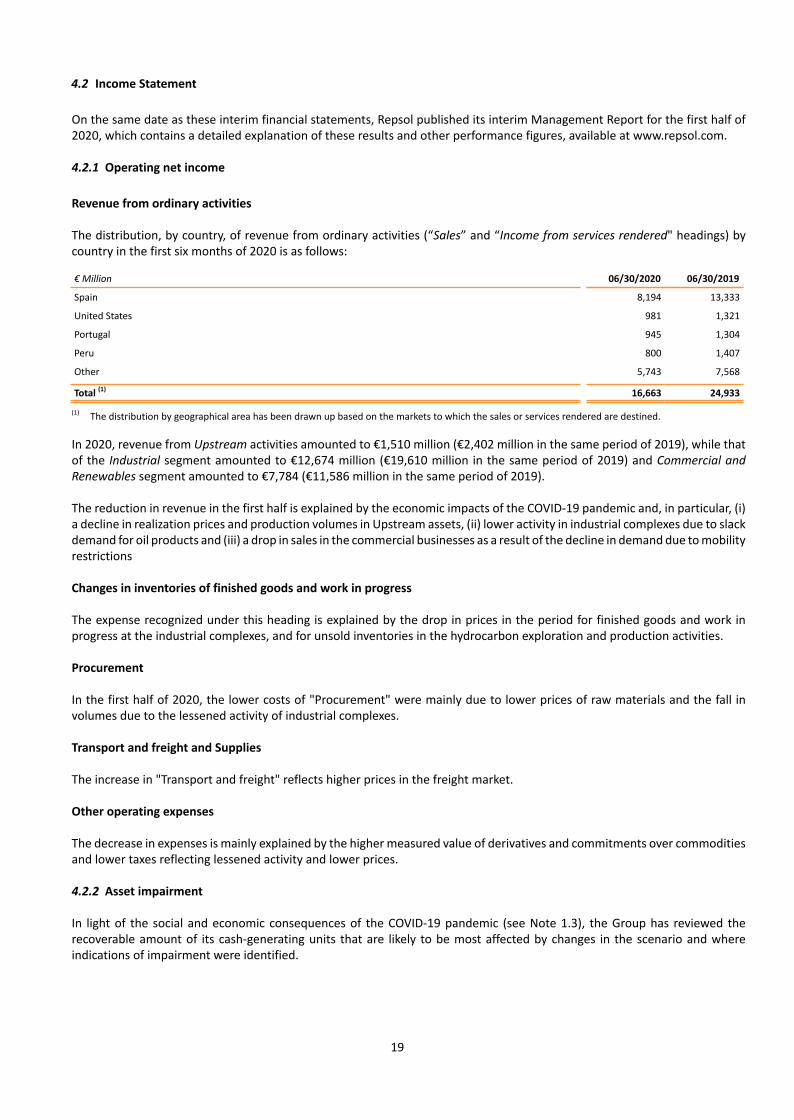
Revenue from ordinary activities
The distribution, by country, of revenue from ordinary activities (“Sales” and “Income from services rendered" headings) bycountry in the first six months of 2020 is as follows:
€ Million 06 /30/2020 06 /30/2019
Spain 8,194 13,333
United States 981 1,321
Portugal 945 1,304
Peru 800 1,407
Other 5,743 7,568
Total (1)
16 ,6 6 3 24,933
(1) The distribution by geographical area has been drawn up based on the markets to which the sales or services rendered are destined.
In 2020, revenue from Upstream activities amounted to €1,510 million (€2,402 million in the same period of 2019), while thatof the Industrial segment amounted to €12,674 million (€19,610 million in the same period of 2019) and Commercial and
Renewables segment amounted to €7,784 (€11,586 million in the same period of 2019).
The reduction in revenue in the first half is explained by the economic impacts of the COVID-19 pandemic and, in particular, (i)a decline in realization prices and production volumes in Upstream assets, (ii) lower activity in industrial complexes due to slackdemand for oil products and (iii) a drop in sales in the commercial businesses as a result of the decline in demand due to mobilityrestrictions
Changes in inventories of finished goods and work in progress
The expense recognized under this heading is explained by the drop in prices in the period for finished goods and work inprogress at the industrial complexes, and for unsold inventories in the hydrocarbon exploration and production activities.
Procurement
In the first half of 2020, the lower costs of "Procurement" were mainly due to lower prices of raw materials and the fall involumes due to the lessened activity of industrial complexes.
Transport and freight and Supplies
The increase in "Transport and freight" reflects higher prices in the freight market.
Other operating expenses
The decrease in expenses is mainly explained by the higher measured value of derivatives and commitments over commoditiesand lower taxes reflecting lessened activity and lower prices.
4.2.2 Asset impairment
In light of the social and economic consequences of the COVID-19 pandemic (see Note 1.3), the Group has reviewed therecoverable amount of its cash-generating units that are likely to be most affected by changes in the scenario and whereindications of impairment were identified.
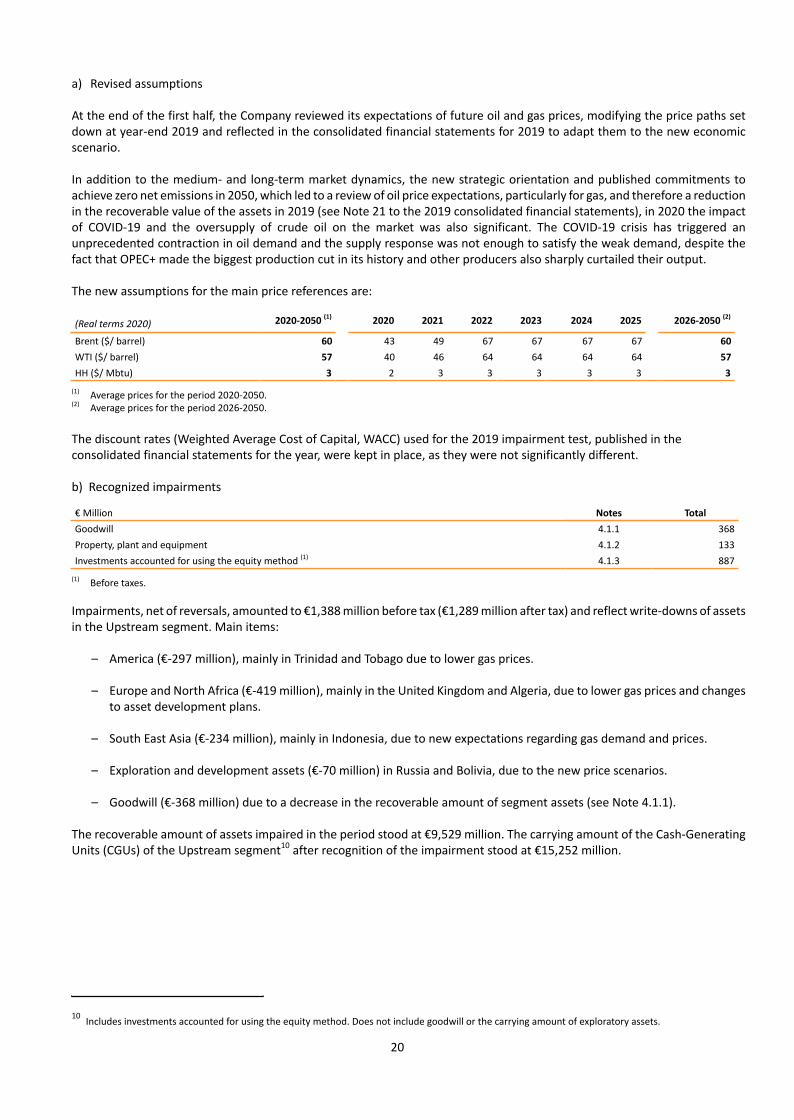
a) Revised assumptions
At the end of the first half, the Company reviewed its expectations of future oil and gas prices, modifying the price paths setdown at year-end 2019 and reflected in the consolidated financial statements for 2019 to adapt them to the new economicscenario.
In addition to the medium- and long-term market dynamics, the new strategic orientation and published commitments toachieve zero net emissions in 2050, which led to a review of oil price expectations, particularly for gas, and therefore a reductionin the recoverable value of the assets in 2019 (see Note 21 to the 2019 consolidated financial statements), in 2020 the impactof COVID-19 and the oversupply of crude oil on the market was also significant. The COVID-19 crisis has triggered anunprecedented contraction in oil demand and the supply response was not enough to satisfy the weak demand, despite thefact that OPEC+ made the biggest production cut in its history and other producers also sharply curtailed their output.
The new assumptions for the main price references are:
(Real terms 2020) 2020-2050 (1)
2020 2021 2022 2023 2024 2025 2026 -2050 (2)
Brent ($/ barrel) 6 0 43 49 67 67 67 67 6 0
WTI ($/ barrel) 57 40 46 64 64 64 64 57
HH ($/ Mbtu) 3 2 3 3 3 3 3 3
(1) Average prices for the period 2020-2050.(2) Average prices for the period 2026-2050.
The discount rates (Weighted Average Cost of Capital, WACC) used for the 2019 impairment test, published in theconsolidated financial statements for the year, were kept in place, as they were not significantly different.
b) Recognized impairments
€ Million Notes Total
Goodwill 4.1.1 368
Property, plant and equipment 4.1.2 133
Investments accounted for using the equity method (1) 4.1.3 887
(1) Before taxes.
Impairments, net of reversals, amounted to €1,388 million before tax (€1,289 million after tax) and reflect write-downs of assetsin the Upstream segment. Main items:
– America (€-297 million), mainly in Trinidad and Tobago due to lower gas prices.
– Europe and North Africa (€-419 million), mainly in the United Kingdom and Algeria, due to lower gas prices and changesto asset development plans.
– South East Asia (€-234 million), mainly in Indonesia, due to new expectations regarding gas demand and prices.
– Exploration and development assets (€-70 million) in Russia and Bolivia, due to the new price scenarios.
– Goodwill (€-368 million) due to a decrease in the recoverable amount of segment assets (see Note 4.1.1).
The recoverable amount of assets impaired in the period stood at €9,529 million. The carrying amount of the Cash-GeneratingUnits (CGUs) of the Upstream segment10 after recognition of the impairment stood at €15,252 million.
20
10 Includes investments accounted for using the equity method. Does not include goodwill or the carrying amount of exploratory assets.

c) Sensitivities
Changes in the estimated future price curves or in the discount rates used would affect the value of the Group's assets andcould lead to the reversal, in whole or in part, of existing impairment losses or to the recognition of additional provisions. Thekey sensitivities to these variations in the Cash-Generating Units in the Upstream segment, disregarding any rebalancing ofrelated variables or any adaptations of operating plans that might mitigate the adverse impact of these variations, are indicatedbelow:
Increase (+)/ decrease (-)
€ Million (1)
Operating net income (1)
Net income
Variation in hydrocarbon prices +10% 1,728 1,538
-10% (2,163) (1,853)
Variation in hydrocarbon output +5% 912 807
-5% (1,121) (963)
Variation in hydrocarbon output and prices +10% (prices) / +5% (output) 2,716 2,416
-10% (prices) / -5% (output) (3,266) (2,785)
Variation in discount rate+100 p.b. (745) (627)
-100 p.b. 745 639
(1) Includes impact on investments accounted for using the equity method.
21
4.2.3 Financial results
The financial result improved compared to the first half of 2019 due to better results from specific exchange rate positions andlower interest on debt.
4.2.4 Income tax
The effective tax rate11 applicable to the loss before taxes and before the results of entities accounted for using the equitymethod was 16% (income tax refund of €297 million). In 2019, the effective tax rate on the result - which was a profit - was-38% (income tax expense of €554 million). The change in tax rates is mainly due to the mix of results at different nominal ratesand the absence of tax effects on some of the assets impaired in 2020 (see Note 4.2.2).
4.2.5 Earnings per share
Earnings per share in the first six months of 2020 and 2019 are detailed below:
EARNINGS PER SHARE 06 /30/2020 06 /30/2019
Profit attributable to the parent (€ million) (2,484) 1,133
Adjustment for perpetual subordinated bond (€ million) (1) (25) (15)
Weighted average number of shares outstanding on June 30 (millions of shares) (2) 1,540 1,644
Basic and diluted earnings per share (euros/share) (1.6 3) 0.6 8
(1) At June 30, 2020, this item reflects the costs of partial repurchase of the perpetual bond issued in March 2015 (see section in Note 4.1.4).(2) The share capital recognized at June 30, 2019 comprised 1.598.791.040 shares, although the weighted average number of outstanding shares for the
purposes of calculating earnings per share includes the effect of the capital increases undertaken as part of the “Repsol Flexible Dividend” shareholderpayment system, as per the applicable accounting regulations (see Note 2.3 “Comparative information”).
11 To estimate the income tax accrued for interim periods, the estimated annual effective tax rate is applied. However, the tax effects resulting from one-offevents of transactions in the period are considered as an integral part thereof.

4.3 Cash Flows
In the first half of 2020, cash flow from operating activities amounted €617 million, compared to €1,872 million in the first halfof 2019. The decrease was due mainly to lower crude oil prices and lower demand for products, and therefore to lower volumein many of the Group’s businesses as a result of the international crisis triggered by COVID-19 (see Note 1.3). This was partlyoffset by the effect on working capital of the lower cost of inventories (price of inventories in the industrial businesses) and bylower tax payments.
In the first half of 2020, net cash flow from investing activities resulted in a net receipt of €1,116 million. "Payments for/receiptsfrom investments in property, plant and equipment, intangible assets and investment property” (€-922 million) decreased withrespect to the comparative period in line with reduction targets under the Resilience Plan, due to lower expenditure on assetsin the Upstream segment and the Industrial segment; capital expenditure increased, however, in the new electricity businessesand renewable projects in the Commercial and Renewables segment. “Payments for/receipts from investments in other financial
instruments” reflected net disposals of €+1,591 million through termination of time deposits in the period. “Proceeds of
disposals” includes the refund of the tax (corporate income tax prepayment) attributed to the disposal of an interest in Naturgyin May 2018. For further information, see sections 4.1, 5.1 and 5.2 of the consolidated Management Report.
During the first half of 2020, net cash flow from financing activities resulted in a net receipt of €587 million compared to a netpayment of €-1,313 million in 2019, due to the net issuance of equity (see Note 4.1.4) and debt (see Note 4.1.5) instrumentsin 2020, lower purchases of own shares, lower cash payments to shareholders (who mostly chose to receive shares), and lowerinterest payments (lower borrowing costs) than in the first half of 2019.
In short, Cash and cash equivalents increased by €2,305 million compared to December 31, 2019 to reach €5,285 million. Thestrong cash position, a part of the Group’s liquidity (see Note 4.1.7), enables us to cope with an adverse international environmentaffected by COVID-19 in the second half of the year.
22
(5) RISKS
5.1 Disputes
The information provided in this section updates the following disputes set out in Note 14.2 to the consolidated financialstatements for 2019:
United Kingdom
Addax arbitration in relation to the purchase of Talisman Energy UK Limited (TSEUK)
On January 29, 2020, the Arbitral Tribunal issued a Partial Award on one aspect of the five matters to be determined in theliability phase and, although Repsol had considered the claims to be without merit -supported by external advice-, and stilldoes, the Tribunal has decided that ROGCI and TCHL are liable to Sinopec and Addax in respect of that aspect of the claim.
As indicated, the partial Award issued addresses one of the five claims regarding liability. The Court has indicated that it willdecide the result of the remaining ones in due time, through subsequent awards, although the time at which they will be issuedis currently unknown. In principle, once all of them have been decided, a new procedural phase will be necessary to determinethe amounts, whose schedule has not yet been established. It is likely that this calendar should include deadlines for newallegation briefs, evidence, additional expert statements and a new oral hearing. It is estimated that the phase related to thedetermination of the amount, without taking into account any challenges to the awards, will not be resolved before the firstquarter of 2022.
On April 28, 2020, as already reported, Repsol challenged the partial arbitral award of January 29, 2020 in the Singapore courts.
Although the amount of compensation (if any) is not known with certainty, given that the dispute still has a long way to go andnumerous decisions are pending, in light of the partial award Repsol prudently estimated the economic impacts of the disputeas a whole, and accordingly recognized a provision of $940 million in its financial statements of December 31, 2019 (no changesin the first half).
Additionally, on November 30, 2017 Repsol, S.A. commenced an arbitration against China Petroleum Corporation and TipTopLuxembourg S.A.R.L seeking relief from any adverse ruling on the arbitration mentioned above together with other damages

yet unquantified. This procedure is based on their conduct towards Repsol during the months leading up to its acquisition ofthe Talisman Group.
23
5.2 Government and legal proceedings with tax implications
No material events have occurred that should be reported in addition to the information provided in Note 23.4 to the consolidatedfinancial statements for 2019.
5.3 Geopolitical risks
The information in this section updates the content of Note 21.3 to the consolidated financial statements for 2019.
Venezuela
In 2020, the political instability, economic recession and inflation remain. There was a significant devaluation of the Venezuelancurrency against the euro (€229,622/BsS compared to €52,231/BsS at December 31, 2019)], with no significant impact on theGroup's financial statements, since the functional currency of its subsidiaries in the country is mainly the US dollar.
With regard to international sanctions affecting the Venezuelan government, PDVSA and its affiliates, on April 22, 2020 the USGovernment announced, through the Office of Foreign Assets Control (OFAC), that it extends until December 1, the GeneralLicense (GL 8F) to the oil company Chevron and four other US companies in the hydrocarbon sector so that they can continueto operate in Venezuela, despite the sanctions imposed more than a year ago to the state-owned oil company (PDVSA) and itsaffiliates, even though it has further limited their activity. These companies may continue to have a relationship with PDVSA orits affiliates, but they may not extract, sell or transport Venezuelan-origin petroleum, contract for additional personnel or payany dividends to PDVSA or its affiliates. This authorization from OFAC will allow these companies to carry out "essentialmaintenance of operations."
In June 2020, the US Department of the Treasury sanctioned several shipping companies for transporting Venezuelan crude oilin February and April 2020 in violation of OFAC restrictions on doing business with the Venezuelan government, PDVSA or itsaffiliates. In addition, there were several designations of entities, individuals and vessels on OFAC's "Specially DesignatedNationals And Blocked Persons List" (SDN List) in connection with activities intended to evade US sanctions against Venezuela.However, also in June, the OFAC removed some of these shipowners and vessels from the SDN List since, after their initialdesignation, these companies undertook to improve their sanctions compliance programs.
Repsol continues to take the necessary measures to maintain its activity in Venezuela in full compliance with internationalsanctions laws, and is constantly monitoring the state of affairs, and, therefore, the possible effects on its activities. Thismonitoring discloses no significant impact for the Group, although changes in US policies could affect future crude oil lifting.
Repsol's total equity exposure to Venezuela at June 30, 2020 amounted to €224 million (€239 million at December 31, 2019),mainly comprising the financing extended to the Venezuelan affiliates.
Libya
Uncertainty over Libya's political future continues following the withdrawal of Marshal Haftar's Libyan National Army from theTripoli center of operations and the advance of troops loyal to the Government officially established in Tripoli and supportedby the United Nations and Turkey (GNA) toward Sirte and Al Jufrah. Although diplomatic efforts are ongoing on several fronts,fighting continues. Despite the progress made by the GNA, Marshal Haftar's forces retain formal control of the production fields,which remain closed down (the El Sharara field reopened for a few hours in early June). The deterioration in the security situationcontinues to affect the prospects of Libya's oil industry.
As a consequence of the security situation brought about by the war, production was halted from January 19 until the end ofthe first half.
Repsol's equity exposure in Libya at June 30, 2020 totaled around €344 million (mainly property, plant and equipment at thatdate).

Algeria
Following the electoral victory of Tebboune in December 2019, Algeria has started a process of political and economic reformagainst a background of mass protests and economic crisis resulting from low commodity prices. Hence the rules are constantlyevolving and changing."
The Group's equity exposure in the country at June 30, 2020 totaled around €520 million (mainly property, plant and equipmentat that date).
Vietnam
In June 2020, Repsol signed an agreement with PetroVietnam whereby it will transfer its 51.75% stake in Block 07/03 and 40%stake in Blocks 135 and 136/03. The corresponding assets are on the Group's balance sheet, classified to "Other current assets".The transaction, which is aligned to Repsol's Strategic Plan objectives and subject to government authorizations, is expectedto close over the course of this year with no material impact on Repsol's financial statements.
24
(6 ) OTHER INFORMATION
New industrial projects
In June, two cutting-edge industrial decarbonization projects were presented, which the Company will implement alongsidemajor Spanish and international partners. The facilities, which as a first option will be located in the port of Bilbao and itsenvirons, will involve an initial outlay of approximately €80 million.
The first project, in which €60 million will be invested initially, consists of the construction of a plant to produce synthetic fuelswith zero net emissions using green hydrogen generated with renewable energy. The main characteristic of these innovativefuels is that they are produced with water -for the production of green hydrogen- and CO2 as the only raw materials. They canbe used in combustion engines such as those currently installed in cars, in aircraft and trucks, and in other applications. Thefacility will be fully operational within four years.
The second project, to be located next to the first, will involve an initial investment of €20 million, led by Petronor. It will consistof an urban waste-fueled gas generation plant. The gas will replace some of the conventional fuel consumed by the Petronorrefinery in Bilbao, one of the largest in Spain. This second initiative is in line with Repsol's strategy of promoting the circulareconomy, which we apply in many phases of the Company's production cycle through technology and innovation.
New international renewable projects
The Board of Directors of Repsol, S.A. approved in July the creation of a joint venture with the Ibereólica Group, which hasextensive experience in the renewable energy sector in Chile, to develop a portfolio of projects in that country, both wind andsolar, at various stages of progress, totaling 2.6 GW. The investment initially planned by Repsol comes to around $192 million. Thistransaction helps implement Repsol's objectives in low-carbon generation.
New Strategic Plan
The Company plans to update the scenarios for the development of its activities and develop a new Strategic Plan for the period2021-2025, which will be published in November 2020.
(7) SUBSEQUENT EVENTS
There have been no material events after the interim reporting date.
(8 ) EXPLANATION ADDED FOR THE TRANSLATION INTO ENGLISH
These interim consolidated financial statements are prepared on the basis of the IFRS, as endorsed by the European Union, andArticle 12 of Royal Decree 1362/2007. Consequently, certain accounting principles applied by the Group may not conform toother generally accepted accounting principles in other countries.

APPENDIX I. CHANGES IN THE COMPOSITION OF THE GROUP
The companies that comprise the Repsol Group are set out in Appendix I of the 2019 consolidated financial statements. Themain changes in the composition of the Group during the first six months of 2020 are as follows:
a) Business combinations, other acquisitions and increased interests in subsidiaries, joint ventures and/or associates:
Registered name Item Date
06 /30/2020
Country Parent
Method of
consolidation
(1)
% votingrights
acquired
% total votingrights in entity
followingacquisition
(2)
LGA – Logística Global de Aviação,LDA. Portugal
Repsol Portuguesa,S.A Acquisition January 2020 E.M. 20,00% 20,00%
Aragonesa de InfraestructurasEnergéticas Renovables, S.L.U Spain
Repsol Renovables,S.L.U Acquisition February 2020 F.C. 100,00% 100,00%
Boalar Energías, S.L.U SpainRepsol Renovables,S.L.U Acquisition February 2020 F.C. 100,00% 100,00%
Desarrollos Eólicos El Saladar,S.L.U Spain
Repsol Renovables,S.L.U Acquisition February 2020 F.C. 100,00% 100,00%
Desarrollo Eólico Las Majas VIII,S.L. Spain
Repsol Renovables,S.L.U Acquisition February 2020 F.C. 100,00% 100,00%
Desarrollo Eólico Las Majas XIV,S.L. Spain
Repsol Renovables,S.L.U Acquisition February 2020 F.C. 100,00% 100,00%
Desarrollo Eólico Las Majas XV, S.L. SpainRepsol Renovables,S.L.U Acquisition February 2020 F.C. 100,00% 100,00%
Desarrollo Eólico Las Majas XXVII,S.L.U Spain
Repsol Renovables,S.L.U Acquisition February 2020 F.C. 100,00% 100,00%
Desarrollo Eólico Las Majas XXXI,S.L.U Spain
Repsol Renovables,S.L.U Acquisition February 2020 F.C. 100,00% 100,00%
Energías Renovables de Cilene,S.L.U Spain
Repsol Renovables,S.L.U Acquisition February 2020 F.C. 100,00% 100,00%
Energías Renovables de Gladiateur18, S.L.U Spain
Repsol Renovables,S.L.U Acquisition February 2020 F.C. 100,00% 100,00%
Energías Renovables de Hidra,S.L.U Spain
Repsol Renovables,S.L.U Acquisition February 2020 F.C. 100,00% 100,00%
Energías Renovables de Kore, S.L.U SpainRepsol Renovables,S.L.U Acquisition February 2020 F.C. 100,00% 100,00%
Fuerzas Energéticas del Sur deEuropa XIII, S.L.U Spain
Repsol Renovables,S.L.U Acquisition February 2020 F.C. 100,00% 100,00%
Fuerzas Energéticas del Sur deEuropa XIV, S.L.U Spain
Repsol Renovables,S.L.U Acquisition February 2020 F.C. 100,00% 100,00%
Fuerzas Energéticas del Sur deEuropa XVIII, S.L.U Spain
Repsol Renovables,S.L.U Acquisition February 2020 F.C. 100,00% 100,00%
Fuerzas Energéticas del Sur deEuropa XX, S.L.U Spain
Repsol Renovables,S.L.U Acquisition February 2020 F.C. 100,00% 100,00%
Generación y Suministro deEnergía, S.L.U Spain
Repsol Renovables,S.L.U Acquisition February 2020 F.C. 100,00% 100,00%
Hispánica de DesarrollosEnergéticos Sostenibles, S.L.U Spain
Repsol Renovables,S.L.U Acquisition February 2020 F.C. 100,00% 100,00%
Natural Power Development, S.L.U SpainRepsol Renovables,S.L.U Acquisition February 2020 F.C. 100,00% 100,00%
Soluciones Tecnológicas deEnergías Verdes, S.L.U Spain
Repsol Renovables,S.L.U Acquisition February 2020 F.C. 100,00% 100,00%
Finboot Ltd.UnitedKingdom
Repsol EnergyVentures, S.A. Share increase March 2020 E.M. 0,07% 8,41%
Klikin Deals Spain, S.L. SpainRepsol Comercial deProductos Share increase April 2020 E.M. 0,73% 70,73%
Energia Distribuida del Norte, S.A. SpainPetróleos del Norte,S.A. Incorporation April 2020 F.C. 100,00% 100,00%
Rocsole OY FinlandRepsol EnergyVentures S.A. Share increase May 2020 E.M. 1,43% 13,93%
Energías Renovables de Dione,S.L.U Spain
Repsol Renovables,S.L.U Acquisition June 2020 F.C. 100,00% 100,00%
Energías Renovables de Lisitea,S.L.U Spain
Repsol Renovables,S.L.U Acquisition June 2020 F.C. 100,00% 100,00%
Energías Renovables de Polux,S.L.U, Spain
Repsol Renovables,S.L.U Acquisition June 2020 F.C. 100,00% 100,00%
(1) Method of consolidation:F.C.: Full consolidation.E.M.: Equity method. Joint ventures are identified as “JV”.
(2) Corresponds to the percentage of equity in the acquired company.
Translation of a report originally issued in Spanish In the event of a discrepancy, the Spanish language version prevails.
25
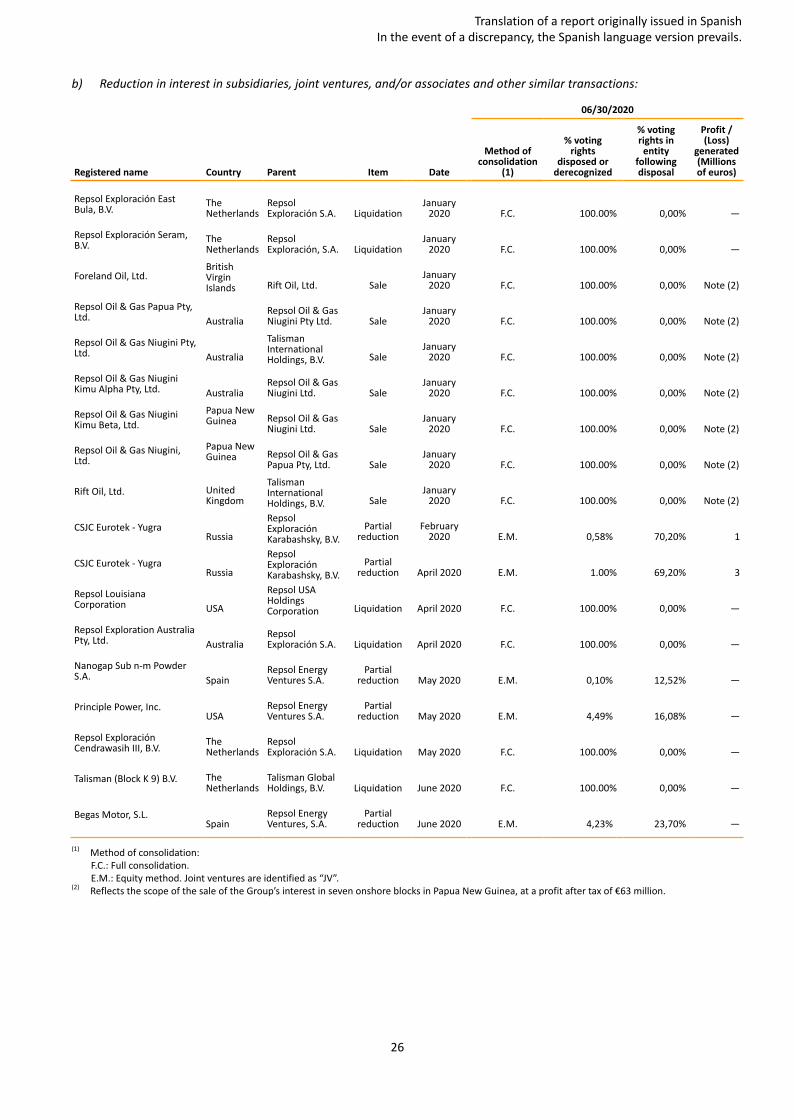
b) Reduction in interest in subsidiaries, joint ventures, and/or associates and other similar transactions:
06 /30/2020
Registered name Country Parent Item Date
Method ofconsolidation
(1)
% votingrights
disposed orderecognized
% votingrights in
entityfollowingdisposal
Profit /(Loss)
generated(Millionsof euros)
Repsol Exploración EastBula, B.V.
TheNetherlands
RepsolExploración S.A. Liquidation
January2020 F.C. 100.00% 0,00% —
Repsol Exploración Seram,B.V.
TheNetherlands
RepsolExploración, S.A. Liquidation
January2020 F.C. 100.00% 0,00% —
Foreland Oil, Ltd.BritishVirginIslands Rift Oil, Ltd. Sale
January2020 F.C. 100.00% 0,00% Note (2)
Repsol Oil & Gas Papua Pty,Ltd. Australia
Repsol Oil & GasNiugini Pty Ltd. Sale
January2020 F.C. 100.00% 0,00% Note (2)
Repsol Oil & Gas Niugini Pty,Ltd. Australia
TalismanInternationalHoldings, B.V. Sale
January2020 F.C. 100.00% 0,00% Note (2)
Repsol Oil & Gas NiuginiKimu Alpha Pty, Ltd. Australia
Repsol Oil & GasNiugini Ltd. Sale
January2020 F.C. 100.00% 0,00% Note (2)
Repsol Oil & Gas NiuginiKimu Beta, Ltd.
Papua NewGuinea Repsol Oil & Gas
Niugini Ltd. SaleJanuary
2020 F.C. 100.00% 0,00% Note (2)
Repsol Oil & Gas Niugini,Ltd.
Papua NewGuinea Repsol Oil & Gas
Papua Pty, Ltd. SaleJanuary
2020 F.C. 100.00% 0,00% Note (2)
Rift Oil, Ltd. UnitedKingdom
TalismanInternationalHoldings, B.V. Sale
January2020 F.C. 100.00% 0,00% Note (2)
CSJC Eurotek - YugraRussia
RepsolExploraciónKarabashsky, B.V.
Partialreduction
February2020 E.M. 0,58% 70,20% 1
CSJC Eurotek - YugraRussia
RepsolExploraciónKarabashsky, B.V.
Partialreduction April 2020 E.M. 1.00% 69,20% 3
Repsol LouisianaCorporation USA
Repsol USAHoldingsCorporation Liquidation April 2020 F.C. 100.00% 0,00% —
Repsol Exploration AustraliaPty, Ltd. Australia
RepsolExploración S.A. Liquidation April 2020 F.C. 100.00% 0,00% —
Nanogap Sub n-m PowderS.A. Spain
Repsol EnergyVentures S.A.
Partialreduction May 2020 E.M. 0,10% 12,52% —
Principle Power, Inc.USA
Repsol EnergyVentures S.A.
Partialreduction May 2020 E.M. 4,49% 16,08% —
Repsol ExploraciónCendrawasih III, B.V.
TheNetherlands
RepsolExploración S.A. Liquidation May 2020 F.C. 100.00% 0,00% —
Talisman (Block K 9) B.V. TheNetherlands
Talisman GlobalHoldings, B.V. Liquidation June 2020 F.C. 100.00% 0,00% —
Begas Motor, S.L.Spain
Repsol EnergyVentures, S.A.
Partialreduction June 2020 E.M. 4,23% 23,70% —
(1) Method of consolidation: F.C.: Full consolidation. E.M.: Equity method. Joint ventures are identified as “JV”.(2) Reflects the scope of the sale of the Group’s interest in seven onshore blocks in Papua New Guinea, at a profit after tax of €63 million.
Translation of a report originally issued in Spanish In the event of a discrepancy, the Spanish language version prevails.
26

APPENDIX II. OTHER DETAILED INFORMATION
Financial instruments
Financial assets
The breakdown of the Group's financial assets, categorized by asset type, is as follows:
June 30, 2020 and December 31, 2019
At fair value throughincome statement
At fair value throughother comprehensive
income At amortized cost (4)
Total
€ Million 2020 2019 2020 2019 2020 2019 2020 2019
Equity instruments (1) 36 29 117 122 — — 153 151
Derivatives (2) 28 9 — — — — 28 9
Loans — — — — 718 759 718 759
Time deposits — — — — — 150 — 150
Other financial assets 31 43 — — 20 22 51 65
—Non-current 95 8 1 117 122 738 931 950 1,134
Derivatives (2) 202 238 19 40 — — 221 278
Loans — — — — 215 203 215 203
Time deposits — — — — 914 2,481 914 2,481
Cash and cash equivalents 8 8 — — 5,277 2,971 5,285 2,979
Other financial assets — — — 8 6 8 6
Current 210 246 19 40 6 ,414 5,6 6 1 6 ,6 43 5,947
TOTAL (3)
305 327 136 16 2 7,152 6 ,592 7,593 7,08 1
(1) Includes non-controlling financial investments in certain companies over which it does not have management influence.(2) Includes non-current hedging derivatives amounting to €28 million (€40 million in 2019).(3) Does not include "Other non-current assets" and "Trade and other receivables" in the consolidated balance sheet, which at June 30, 2020 and December
31, 2019 amounted to € 710 million and €1,306 million classified as non-current and €3,892 million and €5,743 million classified as current, respectively,corresponding to trade receivables not included in the previous table net of the corresponding provisions for impairment.
(4) Items that do not bear explicit interest are recognized at their nominal value whenever the effect of not discounting the related cash flows is not significant.
Financial liabilities
The breakdown of the Group's financial liabilities, categorized by liability type, is as follows:
June 30, 2020 and December 31, 2019
At fair value (2)
At amortized cost Total Fair value
€ Million 2020 2019 2020 2019 2020 2019 2020 2019
Bonds and obligations — — 5,696 4,199 5,696 4,199 — 4,551
Loans — — 3,042 2,946 3,042 2,946 — 2,946
Lease liabilities — — 2,861 2,709 2,861 2,709 n/a n/a
Bank borrowings — — 958 917 958 917 — 934
Derivatives (1) 104 82 — — 104 82 — 82
Other financial liabilities — 82 88 82 88 — 88
Non-current 104 8 2 12,6 39 10,8 59 12,743 10,941 — 8 ,6 01
Bonds and obligations — — 2,655 3,721 2,655 3,721 — 3,748
Loans — — 934 970 934 970 — 970
Lease liabilities — — 504 424 504 424 n/a n/a
Bank borrowings — — 1,166 1,328 1,166 1,328 — 1,328
Derivatives (1) 501 397 — — 501 397 — 397
Other financial liabilities — — 46 48 46 48 — 48
Current 501 397 5,305 6 ,491 5,8 06 6 ,8 8 8 — 6 ,491
TOTAL 6 05 479 17,944 17,350 18 ,549 17,8 29 — 15,092
(1) In 2020, includes non-current and current hedging derivatives amounting to €95 million and €9 million, respectively (€72 million and €7 million in 2019).(2) “Fair value of financial instruments” in this appendix sets out the classification of financial instruments according to their level in the fair value hierarchy.
Translation of a report originally issued in Spanish In the event of a discrepancy, the Spanish language version prevails.
27

Fair value of financial instruments
The classification of the financial instruments recognized in the interim financial statements at their fair value at June 30, 2020and December 31, 2019, is as follows:
June 30, 2020 and December 31, 2019
€ Million
Level 1 Level 2 Level 3 Total
Financial assets 2020 2019 2020 2019 2020 2019 2020 2019
At fair value through profit or loss 130 121 158 175 28 29 316 325
At fair value through other comprehensive income — 2 — 40 125 122 125 164
Total 130 123 158 215 153 151 441 48 9
Level 1 Level 2 Level 3 Total
Financial liabilities 2020 2019 2020 2019 2020 2019 2020 2019
At fair value 336 319 269 160 — — 605 479
Total 336 319 26 9 16 0 — — 6 05 479
For further details of the calculation methodology and the fair value hierarchy, see Notes 3 and 8 of the 2019 consolidatedfinancial statements.
Translation of a report originally issued in Spanish In the event of a discrepancy, the Spanish language version prevails.
28
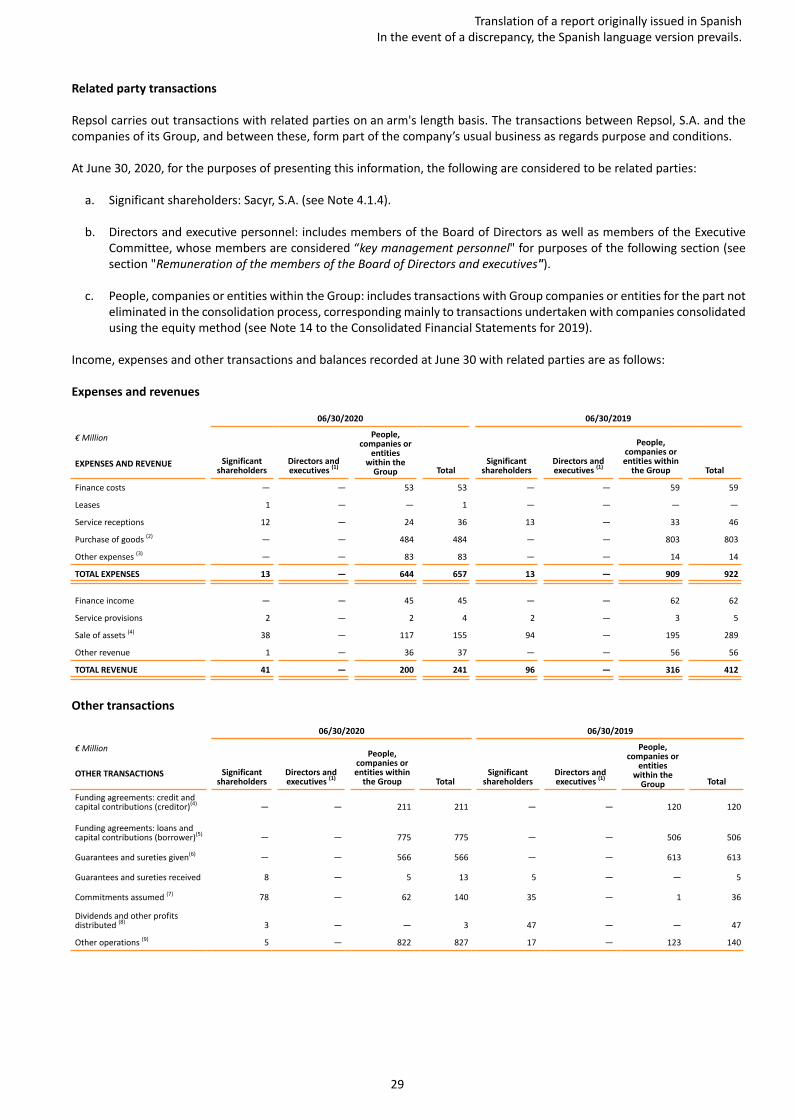
Related party transactions
Repsol carries out transactions with related parties on an arm's length basis. The transactions between Repsol, S.A. and thecompanies of its Group, and between these, form part of the company’s usual business as regards purpose and conditions.
At June 30, 2020, for the purposes of presenting this information, the following are considered to be related parties:
a. Significant shareholders: Sacyr, S.A. (see Note 4.1.4).
b. Directors and executive personnel: includes members of the Board of Directors as well as members of the ExecutiveCommittee, whose members are considered “key management personnel" for purposes of the following section (seesection "Remuneration of the members of the Board of Directors and executives").
c. People, companies or entities within the Group: includes transactions with Group companies or entities for the part noteliminated in the consolidation process, corresponding mainly to transactions undertaken with companies consolidatedusing the equity method (see Note 14 to the Consolidated Financial Statements for 2019).
Income, expenses and other transactions and balances recorded at June 30 with related parties are as follows:
Expenses and revenues
06 /30/2020 06 /30/2019
€ Million
Significantshareholders
Directors andexecutives
(1)
People,companies or
entitieswithin the
Group TotalSignificant
shareholdersDirectors andexecutives
(1)
People,companies orentities within
the Group TotalEXPENSES AND REVENUE
Finance costs — — 53 53 — — 59 59
Leases 1 — — 1 — — — —
Service receptions 12 — 24 36 13 — 33 46
Purchase of goods (2) — — 484 484 — — 803 803
Other expenses (3) — — 83 83 — — 14 14
TOTAL EXPENSES 13 — 6 44 6 57 13 — 909 922
Finance income — — 45 45 — — 62 62
Service provisions 2 — 2 4 2 — 3 5
Sale of assets (4) 38 — 117 155 94 — 195 289
Other revenue 1 — 36 37 — — 56 56
TOTAL REVENUE 41 — 200 241 96 — 316 412
Other transactions
06 /30/2020 06 /30/2019
€ Million
Significantshareholders
Directors andexecutives
(1)
People,companies orentities within
the Group TotalSignificant
shareholdersDirectors andexecutives
(1)
People,companies or
entitieswithin the
Group TotalOTHER TRANSACTIONS
Funding agreements: credit andcapital contributions (creditor)(4) — — 211 211 — — 120 120
Funding agreements: loans andcapital contributions (borrower)(5) — — 775 775 — — 506 506
Guarantees and sureties given(6) — — 566 566 — — 613 613
Guarantees and sureties received 8 — 5 13 5 — — 5
Commitments assumed (7) 78 — 62 140 35 — 1 36
Dividends and other profitsdistributed (8) 3 — — 3 47 — — 47
Other operations (9) 5 — 822 827 17 — 123 140
Translation of a report originally issued in Spanish In the event of a discrepancy, the Spanish language version prevails.
29
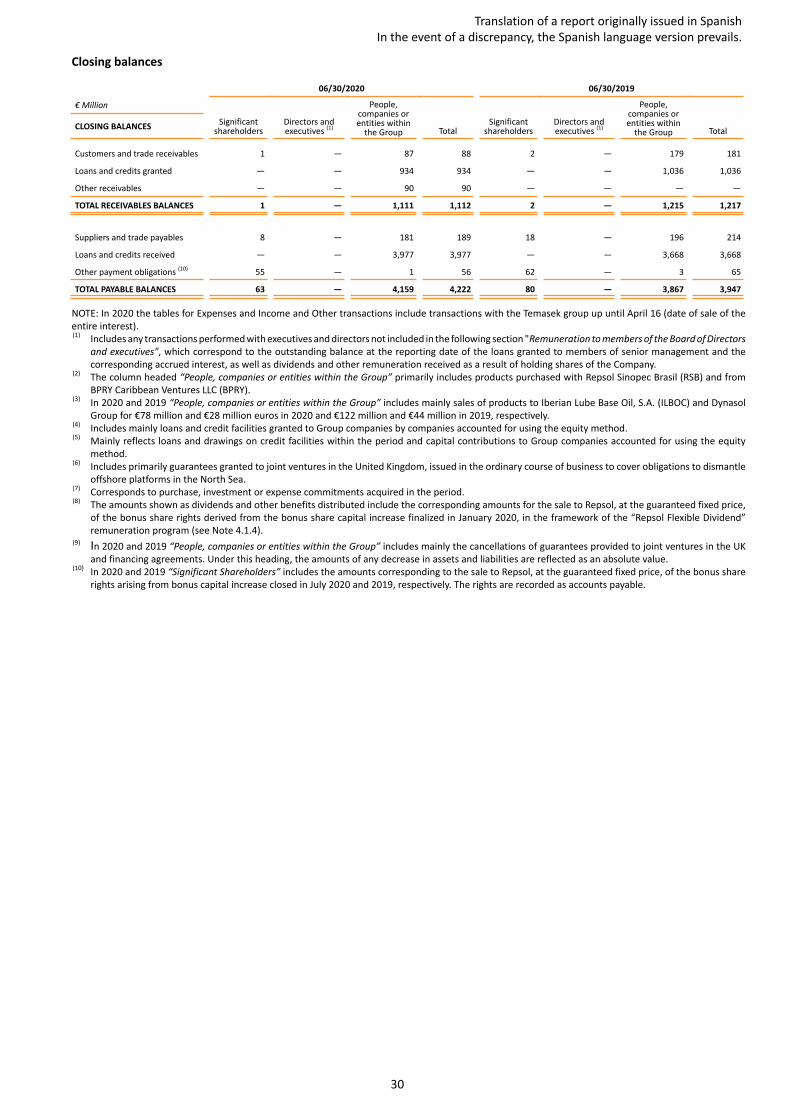
Closing balances
06 /30/2020 06 /30/2019
€ Million
Significantshareholders
Directors andexecutives (1)
People,companies orentities within
the Group TotalSignificant
shareholdersDirectors andexecutives (1)
People,companies orentities within
the Group TotalCLOSING BALANCES
Customers and trade receivables 1 — 87 88 2 — 179 181
Loans and credits granted — — 934 934 — — 1,036 1,036
Other receivables — — 90 90 — — — —
TOTAL RECEIVABLES BALANCES 1 — 1,111 1,112 2 — 1,215 1,217
Suppliers and trade payables 8 — 181 189 18 — 196 214
Loans and credits received — — 3,977 3,977 — — 3,668 3,668
Other payment obligations (10) 55 — 1 56 62 — 3 65
TOTAL PAYABLE BALANCES 6 3 — 4,159 4,222 8 0 — 3,8 6 7 3,947
NOTE: In 2020 the tables for Expenses and Income and Other transactions include transactions with the Temasek group up until April 16 (date of sale of theentire interest).(1) Includes any transactions performed with executives and directors not included in the following section "Remuneration to members of the Board of Directors
and executives", which correspond to the outstanding balance at the reporting date of the loans granted to members of senior management and thecorresponding accrued interest, as well as dividends and other remuneration received as a result of holding shares of the Company.
(2) The column headed “People, companies or entities within the Group” primarily includes products purchased with Repsol Sinopec Brasil (RSB) and fromBPRY Caribbean Ventures LLC (BPRY).
(3) In 2020 and 2019 “People, companies or entities within the Group” includes mainly sales of products to Iberian Lube Base Oil, S.A. (ILBOC) and DynasolGroup for €78 million and €28 million euros in 2020 and €122 million and €44 million in 2019, respectively.
(4) Includes mainly loans and credit facilities granted to Group companies by companies accounted for using the equity method. (5) Mainly reflects loans and drawings on credit facilities within the period and capital contributions to Group companies accounted for using the equity
method.(6) Includes primarily guarantees granted to joint ventures in the United Kingdom, issued in the ordinary course of business to cover obligations to dismantle
offshore platforms in the North Sea.(7) Corresponds to purchase, investment or expense commitments acquired in the period.(8) The amounts shown as dividends and other benefits distributed include the corresponding amounts for the sale to Repsol, at the guaranteed fixed price,
of the bonus share rights derived from the bonus share capital increase finalized in January 2020, in the framework of the “Repsol Flexible Dividend”remuneration program (see Note 4.1.4).
(9) In 2020 and 2019 “People, companies or entities within the Group” includes mainly the cancellations of guarantees provided to joint ventures in the UKand financing agreements. Under this heading, the amounts of any decrease in assets and liabilities are reflected as an absolute value.
(10) In 2020 and 2019 “Significant Shareholders” includes the amounts corresponding to the sale to Repsol, at the guaranteed fixed price, of the bonus sharerights arising from bonus capital increase closed in July 2020 and 2019, respectively. The rights are recorded as accounts payable.
Translation of a report originally issued in Spanish In the event of a discrepancy, the Spanish language version prevails.
30
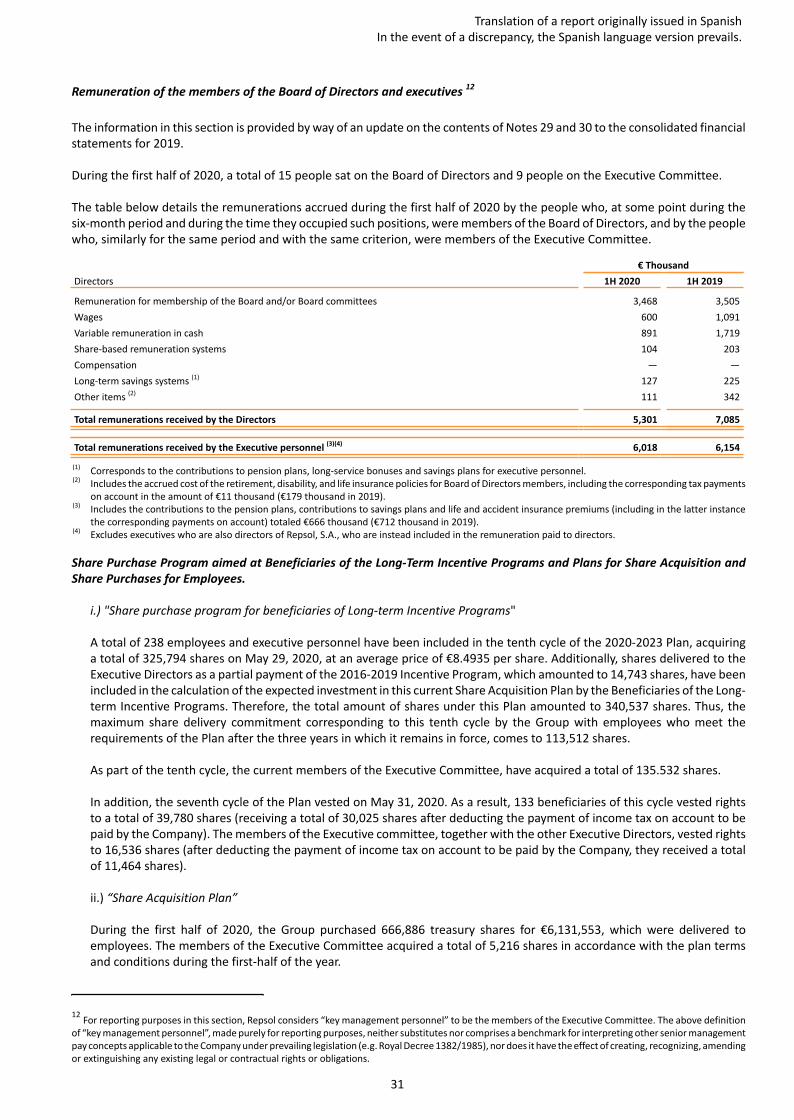
Remuneration of the members of the Board of Directors and executives 12
The information in this section is provided by way of an update on the contents of Notes 29 and 30 to the consolidated financialstatements for 2019.
During the first half of 2020, a total of 15 people sat on the Board of Directors and 9 people on the Executive Committee.
The table below details the remunerations accrued during the first half of 2020 by the people who, at some point during thesix-month period and during the time they occupied such positions, were members of the Board of Directors, and by the peoplewho, similarly for the same period and with the same criterion, were members of the Executive Committee.
€ Thousand
Directors 1H 2020 1H 2019
Remuneration for membership of the Board and/or Board committees 3,468 3,505
Wages 600 1,091
Variable remuneration in cash 891 1,719
Share-based remuneration systems 104 203
Compensation — —
Long-term savings systems (1) 127 225
Other items (2) 111 342
Total remunerations received by the Directors 5,301 7,08 5
Total remunerations received by the Executive personnel (3)(4)
6 ,018 6 ,154
(1) Corresponds to the contributions to pension plans, long-service bonuses and savings plans for executive personnel.(2) Includes the accrued cost of the retirement, disability, and life insurance policies for Board of Directors members, including the corresponding tax payments
on account in the amount of €11 thousand (€179 thousand in 2019).(3) Includes the contributions to the pension plans, contributions to savings plans and life and accident insurance premiums (including in the latter instance
the corresponding payments on account) totaled €666 thousand (€712 thousand in 2019).(4) Excludes executives who are also directors of Repsol, S.A., who are instead included in the remuneration paid to directors.
Share Purchase Program aimed at Beneficiaries of the Long-Term Incentive Programs and Plans for Share Acquisition and
Share Purchases for Employees.
i.) "Share purchase program for beneficiaries of Long-term Incentive Programs"
A total of 238 employees and executive personnel have been included in the tenth cycle of the 2020-2023 Plan, acquiringa total of 325,794 shares on May 29, 2020, at an average price of €8.4935 per share. Additionally, shares delivered to theExecutive Directors as a partial payment of the 2016-2019 Incentive Program, which amounted to 14,743 shares, have beenincluded in the calculation of the expected investment in this current Share Acquisition Plan by the Beneficiaries of the Long-term Incentive Programs. Therefore, the total amount of shares under this Plan amounted to 340,537 shares. Thus, themaximum share delivery commitment corresponding to this tenth cycle by the Group with employees who meet therequirements of the Plan after the three years in which it remains in force, comes to 113,512 shares.
As part of the tenth cycle, the current members of the Executive Committee, have acquired a total of 135.532 shares.
In addition, the seventh cycle of the Plan vested on May 31, 2020. As a result, 133 beneficiaries of this cycle vested rightsto a total of 39,780 shares (receiving a total of 30,025 shares after deducting the payment of income tax on account to bepaid by the Company). The members of the Executive committee, together with the other Executive Directors, vested rightsto 16,536 shares (after deducting the payment of income tax on account to be paid by the Company, they received a totalof 11,464 shares).
ii.) “Share Acquisition Plan”
During the first half of 2020, the Group purchased 666,886 treasury shares for €6,131,553, which were delivered toemployees. The members of the Executive Committee acquired a total of 5,216 shares in accordance with the plan termsand conditions during the first-half of the year.
Translation of a report originally issued in Spanish In the event of a discrepancy, the Spanish language version prevails.
31
12 For reporting purposes in this section, Repsol considers “key management personnel” to be the members of the Executive Committee. The above definitionof “key management personnel”, made purely for reporting purposes, neither substitutes nor comprises a benchmark for interpreting other senior managementpay concepts applicable to the Company under prevailing legislation (e.g. Royal Decree 1382/1985), nor does it have the effect of creating, recognizing, amendingor extinguishing any existing legal or contractual rights or obligations.

iii.) “Global Share Purchase Plan to reward employees: TU REPSOL”
In the first half of 2020, a total of 4,158 Group employees purchased 355.379 shares at an average price of 8,5806 euro pershare. Thus, the maximum commitment to deliver shares to employees who, after the two years corresponding to the vestingperiod, have satisfied the requirements of the Plan, comes to 177.689 shares.
The current members of the Executive Committee, and the other Executive Directors, participate in the Plan with a total of696 shares.
The shares to be delivered in plans i), ii) and iii) may be taken from Repsol's direct or indirect treasury shares, newly issuedshares or via third parties with whom agreements are entered into to ensure the satisfaction of commitments assumed.
Average headcount
The average headcount at June 30, 2020 and 2019 can be seen below:
06 /30/2020 06 /30/2019
Men 15,190 15,413
Women 9,077 9,171
Average headcount 24,26 7 24,58 4
Translation of a report originally issued in Spanish In the event of a discrepancy, the Spanish language version prevails.
32

APPENDIX III. RECONCILIATION OF REPSOL´S REPORTING MODEL FIGURES TO IFRS-EU
The reconciliation of adjusted net income/(loss) to IFRS-EU net income/(loss) for the first half of 2020 and 2019 is as follows:
First half
ADJUSTMENTS
Adjusted incomeReclassification
of jointventures
Special itemsInventoryeffect
(2)Total
adjustmentsIFRS-EU income
€ Million 2020 2019 2020 2019 2020 2019 2020 2019 2020 2019 2020 2019
Operating net income 494⁽¹⁾ 2,002⁽¹⁾ 843 (478) (1,500) 18 (1,507) 90 (2,164) (370) (1,670) 1,632
Financial result (136) (228) 22 68 (51) (9) — — (29) 59 (165) (169)
Net income from companiesaccounted for using the equitymethod - net of tax 7 17 (986) 220 1 — — — (985) 220 (978) 237
Income before tax 36 5 1,791 (121) (190) (1,550) 9 (1,507) 90 (3,178 ) (91) (2,8 13) 1,700
Income tax (172) (668) 121 190 (36) (54) 383 (23) 468 113 296 (555)
Net income193 1,123 — — (1,58 6 ) (45) (1,124) 6 7 (2,710) 22 (2,517) 1,145
Profit attributable to non-controllinginterests (4) (8) — — 1 — 36 (4) 37 (4) 33 (12)
Net income attributable to theparent 18 9 1,115 — — (1,58 5) (45) (1,08 8 ) 6 3 (2,6 73) 18 (2,48 4) 1,133
(1) Profit from continuing operations at current cost of supply (CCS).(2) The inventory effect represents an adjustment to “Procurement” and “Changes in inventory of finished goods” on the IFRS-EU income statement.
Revenue from ordinary activities by segments between customer and inter-segment revenue is displayed below:
€ Million
Customers Inter-segment Total
Segments 06 /30/2020 06 /30/2019 06 /30/2020 06 /30/2019 06 /30/2020 06 /30/2019
Upstream 1,520 2,527 630 987 2,150 3,514
Industrial 8,164 12,169 4,639 7,608 12,803 19,777
Commercial and Renewables 7,828 11,605 38 72 7,866 11,677
Corporate 1 — — — 1 —
(-) Adjustments and eliminations of operatingincome between segments — — (5,307) (8,667) (5,307) (8,667)
TOTAL 17,513 26 ,301 — — 17,513 26 ,301
Translation of a report originally issued in Spanish In the event of a discrepancy, the Spanish language version prevails.
33

The reconciliation of other figures shown in Note 3 to those in IFRS-EU during the first six months of 2020 and 2019 is asfollows:
€ Million
06 /30/2020 06 /30/2019
Revenue from ordinary activities (1)
17,513 26 ,301
Adjustments
Upstream (639) (1,112)
Industrial (129) (167)
Commercial and Renewables (82) (91)
Revenue from ordinary activities IFRS-EU (2) 16 ,6 6 3 24,933
Operating net income (1)
494 2,002
Adjustments
Upstream (593) (389)
Industrial (1,509) 75
Commercial and Renewables (43) (37)
Corporate (19) (19)
Operating net income IFRS-EU (1,6 70) 1,6 32
Capital employed, continuing operations (1)
30,96 6 38 ,391
Adjustments
Upstream 2,728 2,275
Industrial 20 48
Commercial and Renewables 14 14
Capital employed 33,728 40,728
(1) Figures drawn up according to the Group's reporting model described in Note 2.4 “Information by business segment”.(2) Corresponds to the sum of “Sales” and “Income from services rendered and other income” in the income statement (IFRS-EU).
Translation of a report originally issued in Spanish In the event of a discrepancy, the Spanish language version prevails.
34

REPSOL S.A. 2020 Interim Management ReportFirst Half
Translation of a report originally issued in Spanish.In the event of a discrepancy, the Spanish language version prevails

2
The Interim Management Report of the Repsol Group1 must be read together with the 2019 Consolidated
Management Report2. In conjunction with this report, Repsol publishes condensed interim consolidated financial
statements3 for the first half of 2020 (hereinafter, “interim financial statements for the first half of 2020”). The Board
of Directors of Repsol, S.A. approved both reports at its meeting of July 22, 2020.
The financial information contained in this document, unless expressly indicated otherwise, was prepared in
accordance with the Group’s reporting model, which is described below:
Repsol presents its segment results including joint ventures and other companies that are jointly managed in
accordance with the Group’s investment percentage, considering operational and economic indicators within the
same perspective and degree of detail as those for companies consolidated under the full consolidation method.
Thus, the Group considers that the nature of its businesses and the way in which results are analyzed for decision-
making purposes are adequately reflected in this report.
Given the nature of its business and in order to make its disclosures more readily comparable with those of its
peers, the Group relies on Adjusted Net Income when measuring the earnings of each business segment. Adjusted
Net Income means the current cost of supply (CCS), net of taxes and minority interests and excluding certain
specific items of income and expense (“Special items”).
For current cost of supply (CCS) earnings, the cost of volumes sold is calculated on the basis of procurement and
production costs incurred during the period in question and not based on weighted average cost, which is the
accepted methodology under European accounting law and regulations. The difference between CCS earnings and
earnings at weighted average cost is included in the so-called Inventory Effect, which also includes other
adjustments to the valuation of inventories (write-offs, economic hedges, etc.) and is presented net of taxes and
minority interests. This Inventory Effect largely affects the Industrial segment.
Furthermore, Adjusted Net Income does not include Special Items, i.e. certain material items that are presented
separately to provide a more reliable view of the ordinary management of the businesses.
Our reporting model uses Alternative Performance Measures (APMs), meaning measures that are “adjusted” to
those presented under IFRS-EU. The information, breakdowns and reconciliations are included in Appendix I —
Alternative Performance Measures of the 2019 Management Report and are updated with the quarterly
information available on the Repsol website (www.repsol.com).
Repsol has updated the definitions of its operating and reporting segments to bring them in line with the new strategic
vision of the businesses. The following three business segments are therefore envisioned from 2020 onward:
Upstream, Industrial and Commercial and Renewables. For more information, see section 2.3. The financial
information presented for the first half of 2020 already reflects this new business and reporting structure. Information
for the previous year has also been restated so as to provide more reliable monitoring and comparability of the
information disclosed.
The non-financial information corresponding to sustainability indicators contained in this document was calculated
according to corporate rules that specify the criteria and common methods to be applied to each topic.
1 In this report, the names “Repsol,” “Repsol Group” or “the Company” are used interchangeably to refer to the business group consisting
of Repsol, S.A. and its subsidiaries, associates and joint arrangements. 2 This Interim Management Report has been prepared solely for the purpose of updating the consolidated Management Report for 2019. 3 The interim financial statements for the first half of the year have been subject to a limited independent review by the Group’s auditor.

3
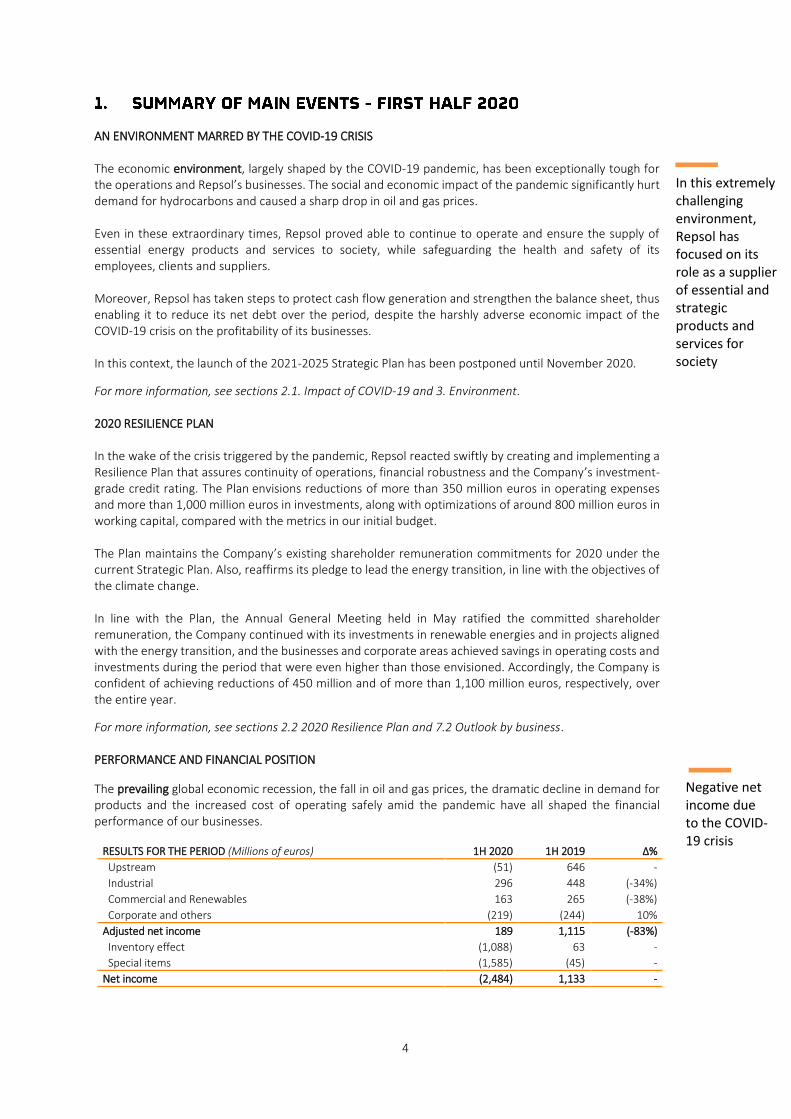
4
In this extremely
challenging
environment,
Repsol has
focused on its
role as a supplier
of essential and
strategic
products and
services for
society
Negative net
income due
to the COVID-
19 crisis
AN ENVIRONMENT MARRED BY THE COVID-19 CRISIS
The economic environment, largely shaped by the COVID-19 pandemic, has been exceptionally tough for
the operations and Repsol’s businesses. The social and economic impact of the pandemic significantly hurt
demand for hydrocarbons and caused a sharp drop in oil and gas prices.
Even in these extraordinary times, Repsol proved able to continue to operate and ensure the supply of
essential energy products and services to society, while safeguarding the health and safety of its
employees, clients and suppliers.
Moreover, Repsol has taken steps to protect cash flow generation and strengthen the balance sheet, thus
enabling it to reduce its net debt over the period, despite the harshly adverse economic impact of the
COVID-19 crisis on the profitability of its businesses.
In this context, the launch of the 2021-2025 Strategic Plan has been postponed until November 2020.
For more information, see sections 2.1. Impact of COVID-19 and 3. Environment.
2020 RESILIENCE PLAN
In the wake of the crisis triggered by the pandemic, Repsol reacted swiftly by creating and implementing a
Resilience Plan that assures continuity of operations, financial robustness and the Company’s investment-
grade credit rating. The Plan envisions reductions of more than 350 million euros in operating expenses
and more than 1,000 million euros in investments, along with optimizations of around 800 million euros in
working capital, compared with the metrics in our initial budget.
The Plan maintains the Company’s existing shareholder remuneration commitments for 2020 under the
current Strategic Plan. Also, reaffirms its pledge to lead the energy transition, in line with the objectives of
the climate change.
In line with the Plan, the Annual General Meeting held in May ratified the committed shareholder
remuneration, the Company continued with its investments in renewable energies and in projects aligned
with the energy transition, and the businesses and corporate areas achieved savings in operating costs and
investments during the period that were even higher than those envisioned. Accordingly, the Company is
confident of achieving reductions of 450 million and of more than 1,100 million euros, respectively, over
the entire year.
For more information, see sections 2.2 2020 Resilience Plan and 7.2 Outlook by business.
PERFORMANCE AND FINANCIAL POSITION
The prevailing global economic recession, the fall in oil and gas prices, the dramatic decline in demand for
products and the increased cost of operating safely amid the pandemic have all shaped the financial
performance of our businesses.
RESULTS FOR THE PERIOD (Millions of euros) 1H 2020 1H 2019 ∆%
Upstream (51) 646 -
Industrial 296 448 (-34%)
Commercial and Renewables 163 265 (-38%)
Corporate and others (219) (244) 10%
Adjusted net income 189 1,115 (-83%)
Inventory effect (1,088) 63 -
Special items (1,585) (45) -
Net income (2,484) 1,133 -

5
Upstream results (-51 million euros) were hit by the dramatic decline in hydrocarbon prices, which has led
to decreased production from some assets. Results at the Industrial segment (296 million euros) were a
product of muted activity at refining and chemicals amid slumping demand and a gradual tightening of
margins during the period. The results of the Commercial and Renewables segment (163 million euros) were
affected by falling sales -especially at service stations and in aviation- due to the mobility restrictions put in
place to combat COVID-19. At Corporate, results saw an improvement following a reduction in finance costs
and corporate overheads, in line with the objectives set out in the Resilience Plan.
As a result, adjusted net income, which shows ordinary earnings obtained from managing the businesses,
amounted to 189 million euros, 83% down on the same period last year. The Company’s integrated
business model, together with its flexibility and the resilience of its assets, was vital in enabling its
businesses to achieve this positive result in such an adverse environment.
The prevailing volatility and the heavy decline in the prices of commodities and international products had
an extraordinary adverse impact on Repsol inventories, giving an inventory effect of -1,088 million euros,
versus 63 million euros in the first half of 2019.
Meanwhile, special items (-1,585 million euros) relate to the extraordinary accounting write-downs of
Upstream assets due to the updating of assumptions on future oil and gas prices as a result of the COVID-
19 crisis.
On balance, net income at the Group was negative (-2,484 million euros), versus 1,133 million euros earned
in the first half of 2019. For more information, see section 4.1 Results.
Despite the reduction in EBITDA due to the impact of COVID-19, cash flow from operations in the first half
amounted to 864 million euros, while free cash flow came to 172 million euros. For more information, see
section 4.2 Cash flows.
The measures put in place under the Resilience Plan to protect the balance sheet have been successful in
reducing net debt1 to 3,987 million euros, with a leverage ratio of 14.7%. The Group strengthened its
financial position by issuing senior Eurobonds in the period (EUR 1.5 billion) and perpetual subordinated
bonds (a further EUR 1.5 billion), while also extending its committed and undrawn credit facilities by a
further 1,602 million euros. Group liquidity at the end of the period came to 9,762 million euros (including
undrawn credit facilities).
During the period, rating agencies Standard & Poor’s, Moody’s and Fitch all confirmed Repsol’s investment
grade. For more information, see section 4.3 Financial position.
Shareholder remuneration in the first half of the year was equivalent to 0.424 euros per share2 under the
“Repsol Flexible Dividend” program, which replaces the interim dividend for 2019. Furthermore, and as a
result of the resolutions carried at the Annual General Meeting held in May, shareholders received
additional remuneration in July equivalent to 0.492 euros per share under the same scrip dividend program
and in lieu of the customary final dividend for 2019. With the aim of offsetting the resulting dilutive effect,
the General Meeting resolved to reduce capital through redemption of treasury shares, up to a maximum
amount equivalent to the number of shares issued under the scrip dividend completed in 2020. For more
information, see section 4.4 Shareholder remuneration.
1 Net debt without leases, which amounted to 4,220 million euros at year-end 2019. 2 As per Repsol’s commitment to purchase from shareholders their right to receive free shares under the scrip dividend (see section
4.4.).
€233 M Reduction in
Net Debt1 vs
Dec-19

6
Committed to
protecting jobs
Successful
exploratory
campaign
Operations
continue
despite the
testing
conditions
Enhanced range
of multi-energy
products and
services
BUSINESS ACTIVITIES
At Upstream, against a backdrop of low crude oil and gas prices, the unit has prioritized value generation
over production volume, in the form of cost reduction plans and by redefining asset operation plans in a
bid to reduce the cash break-even. To help achieve this, facilities have been temporarily shut down in
Canada, the United States and Colombia and pursued profitable growth, with highlights including the
successful exploratory campaign with discoveries in Alaska, Gulf of Mexico and Colombia, the start-up of
new development wells in Marcellus, Norway, Eagle Ford, Russia and Trinidad and Tobago, as well as new
acreage obtained in Indonesia, Norway and Russia. For more information, see section 5.1. Upstream.
At the Industrial segment, against the background of a deep and sharp reduction in demand, production,
logistics and commercial patterns were adjusted to keep utilization levels above international averages.
This effort did not blur our focus on innovation and digitalization. We launched new projects in line with
the Group’s strategy of decarbonization and the circular economy, and took steps to enhance energy
efficiency, environmental impact and operational reliability. For more information, see section 5.2.
Industrial.
At Commercial and Renewables, the mobility restrictions had a negative impact on demand for oil products
and, more specifically, fuel. Nonetheless, Repsol kept up operation of its service stations. Over the first half,
we continued to drive our client-centric multi-energy supply model by developing our Electricity and Gas
businesses (1.07 million customers), launching a new 100% renewable self-consumption service
(“Solmatch”), making further progress on renewable projects (acquisition of Delta 2 in Aragón and start of
construction on Kappa in Ciudad Real and on Valdesolar in Badajoz). For more information, see section 5.3.
Commercial and Renewables.
GOVERNANCE AND SUSTAINABILITY
The Company has made further progress toward the Global Sustainability Plan and released its first SDG
2019 report, which presents Repsol’s contribution toward the 2030 Agenda of the United Nations and its
sustainable development goals. As we witness the energy transition toward a future of low emissions to
mitigate the effects of climate change, the Company remains firmly committed to reducing its Carbon
Intensity Score by 3% in 2020 when compared with 2016. Meanwhile, improvement actions have been put
in place at the Company’s facilities, generating an effective reduction in CO2 of 279 thousand tons over the
first six months of the year. The Company has also delivered on its pledge to invest 500 million euros
through the Green Bond issued in 2017 to support projects aimed at cutting greenhouse gas emissions.
Moving to the personnel accident rate, the Total Frequency Rate (TFR) has fallen when compared with
annual figures for 2019, while the number of Tier 1 + Tier 2 process safety incidents (PSIR) has risen
following an increase in incidents classified as Tier 2 in relation to non-conventional Upstream activity. In
the context of COVID-19, numerous measures have been implemented to safeguard the health and safety
of employees, without this affecting the Company’s operations or the service offered.
Repsol has sought at all times to protect the jobs of its workers, especially in the wake of the COVID-19
health crisis.
For more information, see Section 6 Sustainability.
Repsol is acutely aware of the impact that the health and social crisis resulting from COVID-19 has had on
the communities in which it operates. It has therefore undertaken various actions and initiatives to mitigate
the effects, such as adapting existing equipment and shifting its competition lubricant laboratory toward
the production and free supply of much-needed hydroalcoholic gel for disinfecting hospitals and health
workers. It has also made donations to institutions such as the Red Cross to aid the delivery of basic
necessities and to provide housing for people at risk, support for low-income families, psychological
assistance and telephone social support and guidance for people forced to cope with loneliness.

7
MAIN FIGURES AND INDICATORS
Financial indicators (1) (2) 1H 2020 1H 2019 Our businesses performance (1) 1H 2020 1H 2019
Results
Upstream
EBITDA 589 3,712
Net daily liquids production (kbbl/d) 229 251
Results from operations 494 2,002 Net daily gas production (kboe/d) 446 446
Adjusted net income 189 1,115
Net daily hydrocarbon production (kboe/d) 675 697
Net income (2,484) 1,133
Average crude oil price ($/bbl) 35.8 59.6
Earnings per share (€/share) (1.63) 0.68
Average gas price ($/kscf) 2.2 3.2
ROACE (%) (8.4) 3.8 EBITDA 988 2,213
ROACE with leases (%) (7.3) 3.5
Adjusted net income (51) 646
Investments 1,113 1,468
Cash flows from operations 684 1,605
Cash and liquidity
Investments 603 961
Cash flows from operations 864 2,530
Free cash flow 172 1,093
Cash generated (359) (124)
Industrial
Liquidity 9,762 7,832
Refining capacity (kbbl/d) 1,013 1,013
Debt and available capital Crude oil processed 18.5 22.1
Net Debt (ND) 3,987 3,662
Conversion utilization Spanish refining (%) 91.4 102
Net Debt (ND) (with leases) 8,026 7,464
Distillation utilization Spanish refining (%) 76.1 89.3
Capital employed 27,076 34,697
Refining margin indicator in Spain ($/Bbl) 3.9 4.4
Capital employed (with leases) 30,966 38,391 Sales of petrochemical products (kt) 1,297 1,458
ND / Capital employed (%) 14.7% 10.6%
EBITDA (670) 1,075
ND / Capital employed with leases (%) 25.9% 19.4%
Adjusted net income 296 448
Shareholder remuneration
Cash flow from operations 90 723
Shareholder remuneration (€/share) 0.424 0.411 Investments 227 306
Sustainability indicators (3) 1H 2020 1H 2019
Commercial and Renewables
People
Service stations (number) 4,955 4,875
Number of employees 24,373 25,228
Own marketing sales 8,936 11,867
New employees 664 3,800
LPG sales (kt) 601 699
Safety and the environment Installed capacity - low emissions (MW) 2,952 2,952
Process safety indicator rate (PSIR) (4) 0.82 0.55
Electricity production (GWh) 2,293 2,186
Total recordable incident rate (TRIR) (4) 0.99 1.24
EBITDA 360 502
Reduction in CO2 emissions (Mt) 0.279 0.171
Adjusted net income 163 265
Cash flow from operations 125 370
Macroeconomic context 1H 2020 1H 2019
Investments 259 176
Average Brent price ($/bbl) 40.1 66.0
Sales of oil products (kt) 20,857 24,251
Average WTI price ($/bbl) 36.8 57.4 Average Henry Hub price ($/MBtu) 1.8 2.9
Stock market indicators 1H 2020 1H 2019
Electricity Pool - OMIE (5) (€/MWh) 29.0 51.8
Share price at period-end (€/share) 7.79 13.79
Average exchange rate (€/$) 1.10 1.13 Average share price (€/share) 9.79 14.81
CO2 (€/Tn) 21.7 24.0
Market capitalization at period-end (€ million) 12,193 21,489
(1)
Where applicable, figures shown in million euros. (2)
More information in section 4 and Appendix I — Alternative Performance Measures. (3)
Figures and indicators calculated in accordance with the Group’s management policies and guidelines. For more information, see
section 6 of the 2019 Integrated Management Report. (4)
The figure for 2019 is at year-end. (5) Iberian Energy Market Operator.

8
On March 11, 2020, the World Health Organization upgraded the public health crisis posed by the SARS-
CoV-2 virus (widely known as coronavirus or COVID-19) to international pandemic status. COVID-19 spread
rapidly to many countries and is remains a threat today. The sheer scale and speed of the events across the
globe has sparked an unprecedented health, social and economic crisis.
Even in these difficult times, Repsol has managed to ensure the safe operation of its businesses, most of
which are considered essential or strategic activities in the countries in which it operates. However, the
widespread decline in global economic activity and indicators in the wake of the pandemic has affected the
profitability of the company’s main businesses.
In this context, COVID-19 has had a significant impact on several of the material risks1 to our businesses:
Fluctuations in the reference price of hydrocarbons, derivative products and other commodities:
The economic impact of the COVID-19 pandemic, combined with other pre-existing complications on
the supply and demand side, has resulted in an exceptionally challenging price environment. We have
witnessed a dramatic decline in global consumption of oil, gas and other energy products as a result of
the measures put in place around the world in a bid to halt the spread of the pandemic. Meanwhile, in
early March 2020, OPEC+ members failed to reach an agreement to make further cuts in oil production
to counteract the decline in demand. These events led to the largest collapse in oil prices in decades,
which fell below $20/bbl by the end of March. We even witnessed negative prices for WTI 2 on 20 April,
reaching -$37.63/bbl. In the first half, Brent averaged $40.1/bbl (down 39% on the first half of 2019).
As for gas prices, the impact of COVID-19 has pushed down demand for gas in North America and for
LNG in China, which has led to an increase in inventories of stored gas and from February onward gas
prices converged within a very narrow range of below $2/MMBtu. For more information, see section
3.2 Energy landscape and 7.1 General outlook.
Drop in demand for our products
Demand for oil products in the first half of the year, and especially in the second quarter, saw a
significant downturn in response to the decline in economic activity stemming from COVID-19,
particularly as a result of the mobility restrictions put in place to stem the spread of the pandemic.
We have therefore seen a significant impact on the activity and profitability of our businesses.
Upstream:
The results and activities of Upstream have been heavily affected by the weak demand caused by the
price environment for crude oil and gas (see section 4). To mitigate the negative impacts, we have
throttled our business accordingly, prompting the segment to lower investment and adjusted
operations to protect profitability and asset value.
- The change in investment activity during the period has led to: (i) slower development work
at Akacías in Colombia; (ii) start-up of YME in Norway put back to 2021; and (iii) minimal
drilling activity at non-conventional sides in North America.
1 The information relating to the Group's main risks is set out in this section, which should be read in conjunction with Appendix II of
the 2019 Management Report. Additionally, the information contained in this section is updated and complemented with the
information provided in Note 5.1 —Disputes, Note 5.2 — Administrative tax proceedings and Note 5.3 — Geopolitical risks to the
interim financial statements for the first half of 2020. The risks described in the 2019 Management Report and updated in this
section are subject to change not only in the current financial year but also in future years. However, it is expected that these risks
and uncertainties will persist throughout the second half of 2020. 2
WTI futures with delivery in May 2020.
9
- Production has fallen by just over 22 kboe/d as a result of (i) shrinking demand for gas (Algeria,
Venezuela, Bolivia, Peru and Indonesia); (ii) temporary closures due to low prices to preserve
the value of certain assets (Colombia, Canada and the US Gulf of Mexico); and (iii) production
cuts in certain countries (Algeria and Norway).
Industrial businesses:
At Refining, the drop in global demand has prompted the temporary shut-down of refineries across the
globe, including Europe. Repsol’s refining system has managed to maintain reasonable levels of activity by balancing production, sales and storage capacity, despite a certain throttling of refinery use.
At Chemicals, the gradual recovery of the Chinese economy has been countered by the effective closure
of other major markets. Margins have been solid and demand has remained at reasonable levels. The
increased reliance on propylene oxide and styrene units was somewhat successful in compensating for
the lack of any real market for polyols and polyurethanes destined for the automotive sector.
This price environment has also had a negative impact on the value of inventories, the effect of which
is shown in the inventory effect.
Commercial businesses:
Shrinking demand for fuel in the wake of the mobility restrictions and the general decline in economic
activity has had a significant impact, especially at our network of service stations and aviation supplies.
In Spain, we witnessed an 85% reduction in demand for fuel at service stations at the height of the
containment measures, before recovering to end the period at still 25% below the levels of demand
seen in 2019. Demand for kerosene plummeted in the first six months due to lower domestic
consumption and the absence of an international market for this product. Meanwhile, the confinement
has pushed up demand for heating oil and LPG for domestic use due to increased consumption while
people remained at home.
It is also difficult to predict to what extent and for how long the pandemic will continue to impact Repsol’s businesses as we move forward. The reduced global demand for crude oil, gas and oil products in response
to the slump in economic activity, especially the mobility restrictions in place, may adversely affect prices
and the level of production and sales of our businesses. Meanwhile, the deterioration in global financial
conditions may also affect the cost of financing, available liquidity or the solvency of our clients and
partners under joint ventures, among other possible impacts. The course of the pandemic, the containment
measures rolled out by the health authorities and the policies put in place to mitigate the social and
economic impact of the crisis will all shape the scope and duration of both the crisis and the subsequent
recovery.

10
On March 25, Repsol’s Board of Directors assessed the context and the evolution of the current economic
situation, particularly the global impact of COVID-19, the downturn in oil and gas market prices and their
impact on the Company’s business and activities. This prompted the Company to make the following
decisions:
- Guaranteeing the health and safety of its employees, clients and suppliers in their dealings with
the Company, as well as continuing with its operations, maintaining the supply of essential energy
products and services to society, both critical to sustain key services at the present time.
- Deploying a 2020 Resilience Plan in response to the hugely demanding macroeconomic
environment expected for the rest of the year: factoring in an average price of Brent crude of
$35/Bbl for the period April to December, and Henry Hub price of $1.8/MBtu.
The Resilience Plan also envisions a number of initiatives that imply additional reductions of more
than 350 million euros in operating expenses and more than 1 billion euros in investments, along
with optimizations of around 800 million euros in working capital, compared with the metrics in
our initial budget.
The Company’s financial objective will be to preserve the robustness of its balance sheet and its
investment grade and, despite the current context, avoid any further increase in debt in 2020 with
respect to the figure reported at the end of 2019.
- The Company will maintain its shareholder remuneration commitments in 2020 (charged to 2019
earnings) under the current Strategic Plan (see section 4.4) and it also plans to effect a capital
reduction by redeeming treasury shares so as to counter the dilutive effect of its scrip dividend
issues. Meanwhile, and in response to the current market situation and the COVID-19 crisis, the
Board of Directors decided not to include on the agenda of the Annual General Meeting held on
May 8 a further reduction of 5% of the Company’s share capital at December 31, 2018, as initially
agreed upon in July 2019.
- Repsol has reaffirmed its commitment to lead the energy transition, in line with the objectives of
the Paris objectives and the United Nations´ Sustainable Development Goals, maintaining its
objective of reducing the Carbon Intensity Index by 3% in 2020 compared to 2016, while
significantly increasing renewable generation capacity and reducing CO2 emissions across all
businesses.
Given the extraordinary levels of volatility and market uncertainty, Repsol has decided to postpone the
presentation of its 2021-2025 Strategic Plan until November 2020.
During the first half of the year, the Company aligned its actions with the objectives set out in the Resilience
Plan, as evidenced by the following:
- We guaranteed the continuing supply of our products and services, while keeping our operations
safe. In Spain, for instance, our service stations, direct fuel sales and LPG distribution networks
remained operational even at the peak of the lock-down and production continued at our refining
and chemical industrial complexes.
- We achieved savings in operating costs and investment over and above the level expected,
prompting us to review our annual targets and now estimate that the reductions could reach 450
million euros in operating costs and over 1,100 million euros in investment.
- The main rating agencies all upheld Repsol’s investment grade, which has made its balance sheet
stronger by enhancing its equity (issue of 1.5 billion euros of perpetual subordinated bonds),
reducing its net debt and increasing its liquidity.
Reduced
operating
costs and
investment

11
- Committed levels of shareholder remuneration in 2020 have been honored through the payment,
in January and July, of 0.424 and 0.492 euros per share, under the scrip dividend program to
replace the traditional dividend charged to 2019 earnings.
For more information, see section 7.2 Outlook by business.
Repsol has revised the definition of its operating and reporting segments, attending both to our
commitment to become CO2 emissions neutral by 2050 and to our renewed strategic vision for the business
divisions. In particular, the Company will enhance its commercial businesses with a new multi energy and
customer centric approach, as well as the development of new low carbon electricity generation
businesses, from which a new business segment was created under the “Commercial and Renewables”
nomenclature. Consequently, Repsol’s operating and reporting segments will be defined as follows:
Upstream: corresponding to exploration, development and production of crude oil and natural
gas reserves;
Industrial: corresponding, mainly, to the following activities: (i) refining; (ii) petrochemistry; (iii)
trading and transportation of crude oil and oil products; (iii) commercialization, transportation and
regasification of natural gas and liquefied natural gas (LNG);
Commercial and Renewables: corresponding, mainly, to the following businesses: (i) low-carbon
electricity generation and renewable sources; (ii) gas and electricity commercialization; (iii)
mobility and commercialization of oil products; and (iv) LPG.
Corporate and others includes (i) corporation running expenses and, specifically, those expenses related to
managing the Group that have not been invoiced to the business divisions as a service, (ii) the financial
result and (iii) consolidation intersegment adjustments.
On May 8, Repsol held its Annual General Meeting remotely, without the physical attendance of
shareholders, their proxies or guests. The 2020 Annual General Meeting was an absolute necessity for the
Company to carry on its business normally and accomplish its objectives, in the interests of all its
shareholders and other stakeholders. Even so, Repsol’s Board of Directors made every effort to ensure
strict compliance with the state of the alarm announced by the Spanish government, with the overriding
priority being to protect the health of everyone involved in organizing and staging the meeting.
New
definition for
the operating
and reporting
segments

12
In 2020, the global economy has faced a massive scare in the form of the COVID-19 pandemic, forcing the
authorities to resort to confinement measures to protect public health. The sheer scale and speed of the
collapse in economic activity seen between mid-March and the end of April across many countries has been
unprecedented. It is estimated that most countries will have seen a slump in economic activity of between
20% and 30% during the confinement, and in some sectors the impact has been even greater.
According to the latest forecasts of the International Monetary Fund (IMF, World Economic Outlook June
2020), the world economy will shrink considerably in 2020 (-4.9%), after gaining 2.9% in 2019. Yet there is
much uncertainty surrounding these forecasts. For instance, 75% of countries have been reopening their
economies in late June and in most countries economic activity is recovering faster than expected, and
financial conditions are now relaxing in response to the rapid change in monetary policy. Yet at the same
time the pandemic is intensifying in other countries and the risk of further outbreaks and renewed financial
tensions will persist for as long as there is no treatment or vaccine.
Given this widespread uncertainty and huge demand for liquidity, the dollar strengthened in early 2020 to
reach 1.078 euros/dollar at the start of April. However, since then the reduction in risk aversion has made
interest rate spreads and fundamentals more relevant in shaping the exchange rate. Since the FED has
more room to implement further stimulus measures than the ECB, and because financing needs are greater
in the United States due to its high fiscal and external deficit, the dollar has retreated and the exchange
rate has now stabilized within the range of 1.12-1.13 euros/dollar.
Euro/ Dollar exchange rate (monthly averages)
Source: Bloomberg and Repsol´s Division of Business Studies & Analysis
Brent crude
Brent crude averaged $40.1/bbl in the first half of 2020. Brent crude began the year at around $68/bbl,
before dropping to below $20/bbl in April and then recovering to around $40/bbl by the end of June.
Crude oil prices have been heavily affected by the pandemic. The COVID-19 crisis has caused an
unprecedented contraction in oil consumption. The drastic measures rolled out by governments to control
the spread of the virus by limiting social interaction, imposing significant mobility restrictions and closing
borders and non-essential sectors, have directly impacted the consumption of oil products. The estimated
contraction in global oil consumption for the second quarter of 2020 is around 20 million bbl/d, bringing
demand back to the levels reported in 2002-2003.
On the supply side, the response has fallen short of the mark in rebalancing the market, despite the actions
undertaken by both OPEC and non-OPEC countries. OPEC+ has agreed on the largest and longest
production cut in its history, while in the rest of the countries we have witnessed the natural dynamic
whereby falling prices have triggered a decline in investment and consequently a fall in production; the
-4.9% Forecast
global
growth in
2020
40.1
$/bbl Average
Brent price in
1H

13
main difference being that in the current climate this dynamic has been a more rapid affair than on previous
occasions.
As a result, the balance in the first half of 2020 has been one of oversupply, with an unprecedented build-
up of inventories that has forced prices down.
Average Brent price over time
Source: Bloomberg and Repsol´s Division of Business Studies & Analysis.
Natural Gas - Henry Hub
The price of U.S. Henry Hub natural gas averaged $1.8/MBtu in the first half of 2020, trading 40% below
the same period in 2019. Persistently high production levels and mild winter temperatures continued to
apply pressure on gas prices during the early months of the year. This situation was then aggravated by the
emergence of COVID-19 and the containment measures put in place to stop it from spreading, which have
dampened demand and caused an even greater reduction in prices. Turning to U.S. exports of liquefied
natural gas, loads have been cancelled in the wake of the pandemic, which has placed further pressure on
prices. Coupled with low Henry Hub prices, production has also been affected, showing a 4% year-on-year
drop through to April when compared with 2019.
According to the latest figures released in the United States, and assuming this downward trend in
production continues and demand recovers due to the seasonal effect, a gradual recovery in prices next
winter and throughout 2021 as a result of this improved balance between supply and demand could be
expected.
Average Henry Hub price over time
Source: Bloomberg and Repsol´s Division of Business Studies & Analysis.
For more information on the expected performance of prices in the second half of the year, see section 7.1
General outlook.
1.8
$/MBtu Average
Henry Hub
price in 1H

14
Despite the impact of the COVID-19 crisis on the Group’s income, the measures rolled out under the
Resilience Plan to maximize cash flow and protect the balance sheet enabled us to end the period with net
debt lower than at December 31, 2019.
Results for the first half of 2020 (1H 2020) arose within a context of a global economic recession, largely
caused by the emergence of the COVID-19 pandemic, with low crude oil prices (Brent 40.1 vs 66.0 in 1H
2019) and gas prices (Henry Hub 1.8 vs 2.9 in 1H 2019) and plummeting demand for oil and gas products.
Millions of euros 1H 2020 1H 2019 ∆
Upstream (51) 646 -
Industrial 296 448 (-34%)
Commercial and Renewables 163 265 (-38%)
Corporate and others (219) (244) 10%
Adjusted net income 189 1,115 (-83%)
Inventory effect (1,088) 63 -
Special items (1,585) (45) -
Net income (2,484) 1,133 -
In this extremely challenging environment, there was a significant reduction in EBITDA (589 million euros
vs 3,712 million euros in 1H 2019):
TOTAL
EBITDA (Millions of euros) 1H 2020 1H 2019
Upstream 988 2,213
Industrial (670) 1,075
Commercial and Renewables 360 502
Corporate and others (89) (78)
TOTAL 589 3,712
Adjusted net income:
Adjusted net income, which is intended to reflect the financial result of the ordinary course of the
businesses, was 189 million euros, 83% lower than in the same period of the previous year.
Upstream
Average production in period came to 675 kboe/d, down 3% on the same period of 2019. This decline was
largely a result of production stoppages in Libya and the shutdown or reduction of operations at other
assets owing to slacker demand and prices.
Moving to exploration activity, the drilling of seven exploration wells and one appraisal well were completed
in the first half of the year. Six of them with positive results.
For further information on the activities of the Upstream segment, see section 5.1.
Adjusted net income at Upstream amounted to -51 million euros, down 697 million euros on 1H 2019.
Lower crude oil and gas prices (-40% and -33%, respectively), coupled with lower volumes produced and
sold, had a negative impact, which was partially offset by the reduction in amortization expenses and taxes.
Greater
exploration
success with
less
investment
Lower debt
and
increased
liquidity in
response to
the
challenging
environment

15
Change in adjusted net income at Upstream
(1) Includes costs related to production and the results of investees and non-controlling interests.
Investment in the first half of the year (603 million euros) was down on 1H 2019 (961 million euros) in
response to the Resilience Plan. Investment activity focused on assets in production and/or under
development, mainly in Norway, the United States, Trinidad and Tobago, Brazil and Malaysia. Exploratory
investment took place mainly in the United States (Alaska and Gulf of Mexico) and Mexico (Gulf of Mexico),
and to a lesser extent in Russia, Indonesia and Colombia.
Industrial
Adjusted net income in the first half of 2020 was 296 million euros, compared to 448 million euros in the
first half of 2019.
Change in adjusted net income at Industrial
The change in income is mainly due to the following factors:
- At Refining, the lower result arising from lower margins and decreased sales due to the worsening
international environment were mitigated by production adjustment and plant logistics measures
and by improved margins in Peru through operational optimization.
- At Chemicals, the drop in income was largely down to lower margins and sales, a rise in operating
incidents and maintenance stoppages at the Tarragona and Sines facilities.
- At Trading, improved results across all lines, especially in crudes and light products.
- At Wholesale & Gas Trading, margins fell at the LNG commercialization business, despite improved
margins at the trading gas business in North America.
646
51
1,224
251
102170 1
15
0
490
-1,000
-800
-600
-400
-200
0
200
400
600
800
1H 2019 Price effect Sales volume
effect
Taxes (other
than income tax)
Exploration DD&A Others (1) Exchange rate
effect
Income Tax 1H 2019
million euros
€296 M Adjusted net
income at
Industrial

16
Operating investment at Industrial in the first half of 2020 came to 227 million euros (down 26% on 1H
2019). The investments were aimed at maintaining levels of activity at industrial complexes.
See section 5.2 for more information on the activities of the Industrial segment.
Commercial and Renewables
Adjusted net income in the first half of 2020 was 163 million euros, compared to 265 million euros in the
first half of 2019.
Change in adjusted net income at Commercial and Renewables
The change in income is mainly due to the following factors:
- At Mobility, the decrease in result was largely due to lower demand at Service Stations, Direct Sales
and International Aviation by the COVID-19 impact.
- At LPG, weaker performance reflected lower margins on operations subject to regulated prices and
lower sales due to a relatively mild winter in Spain.
- At Lubricants, the improved performance was due to the increased margins at Asphalts and the
contribution made by the international lubricants businesses (Mexico and Southeast Asia).
- At Electricity and Gas, result was higher than in the first half of 2019, largely due to an improved
performance at the generation business, where higher margins were achieved and production
increased, despite the falling electricity pool prices in Spain. A further highlight was the increase in
the number of customers for electricity and gas commercialization compared with the first half of
2019.
Operating investment in the first half of 2020 amounted to 259 million euros (up 47% on 1H 2019). The
investments were largely aimed at the development/start-up of new renewable energy businesses for
Electricity and Gas.
See section 5.3 for more information on the activities of the Commercial and Renewables segment.
Corporate and others
Results for the first six months amounted to -219 million euros (1H 2019: -244 million euros). Corporation
cost reduction efforts were increased in line with Resilience Plan goals, but kept up our momentum in
digitalization and technology initiatives. The financial result improved in response to higher results from
exchange rate positions and lower net interest expenses.
Investment
in new
renewable
projects

17
Net income:
Adjusted net income was shaped by the following impacts:
- The inventory effect, which was a negative 1,088 million euros, versus a positive 63 million euros
in the first half of 2019, due to the collapse of prices through to April as a consequence of the
rapid progression of the COVID-19 and its subsequent impact on demand, as well as the excess of
crude supply.
- Special items for the first half of 2020 totaled -1,585 million euros. These items corresponds to
accounting recognition of impairments and valuation adjustments to Upstream assets reflecting
the change in economic expectations due to the COVID-19 crisis (see following section), the
adverse impact of exchange rate fluctuations on tax positions in countries where the local currency
is not the Company’s functional currency (mainly Brazil) and credit risk provisions in Venezuela, all
of which were partially offset by the capital gain generated on the sale of assets in Papua New
Guinea.
Millions of euros 1H 2020 1H 2019
Divestments 72 31
Workforce restructuring (41) (29)
Impairment (1,296) (3)
Provisions and others (320) (44)
TOTAL (1,585) (45)
Therefore, the Group’s net income in the first half of 2020 amounted to -2,484 million euros (1,133 million
euros in 1H 2019).
Profitability indicators 1H 2020 1H 2019
ROACE - Return on average capital employed (%) (1) -8.4 3.8
Earnings per share (€/share) -1.63 0.68
(1) ROACE with leases: -7.3%
Asset impairment and write-downs
The COVID-19 pandemic has worsened the environment in which some of our businesses are expected to
operate. The scale and depth of the crisis, and a lack of historical benchmarks, cast a cloud of uncertainty
on forecasts. However, at this time, a strong recovery of the economy and gradual stabilization of oil and
gas markets are already in sight. It can be reasonably expected that the recovery will continue and allow a
return to pre-crisis scenarios in the medium term (see section 7.1).
In this context, Repsol has revised downward its expectations related to the future prices of crude oil and
gas, which has prompted the Company to recognize impairments and write-downs on the carrying amount
of certain Upstream assets, as described below (before taxes):
Millions of euros 1H 2020
Productive assets (956)
Americas (297)
Southeast Asia (234)
Europe and North Africa (419)
Exploration assets (70)
Goodwill (368)
TOTAL (1,388)
For more information on the impairment recognized in the period, see Note 4.2.2 to the interim financial
statements for the first half of 2020.
Write-downs
in response
to the new
market
conditions

18
Free cash flow in 1H 2020 came to 172 million euros, compared to 1,093 million euros in 1H 2019.
CASH FLOWS (Millions of euros) 1H 2020 1H 2019
EBITDA 589 3,712
Changes in working capital 459 (659)
Dividends received 19 17
Income tax receipts/(payments) (10) (463)
Other receipts/(payments) (193) (77)
I. Cash flow from operations 864 2,530
Payments for investments (1,207) (1,503)
Receipts from investments 515 66
II. Cash flow from investing activities (692) (1,437)
FREE CASH FLOW (I + II) 172 1,093
Dividends and other equity instruments (128) (201)
Net interest and leases (253) (287)
Treasury shares (150) (729)
CASH GENERATED (1) (359) (124)
(1) Does not include derivatives on shares of Repsol, S.A. arranged/settled with financial institutions, out of a total notional amount of 21.9 million
shares, which form part of “cash flows from financing activities and other items” (-199 million euros).
Cash flow from operations (864 million euros) was lower on 1H 2019, although the reduction in EBITDA of
the businesses due to the impact of COVID-19 was mitigated by the effect of lower inventory costs on
working capital (price of inventories at the industrial businesses) and a reduction in taxes payable.
Cash flow from investing activities (-692 million euros) was down on the first half of 2019, in line with the
Resilience Plan (Upstream investment down 28% and Industrial investment 24%), although investment in
the new electricity and renewables businesses was maintained. The refund of tax paid in previous years
following the sale of Naturgy is included in Proceeds from divestments.
Free cash flow amounted to 172 million euros, versus 1,093 million euros in the first half of 2019.
As a result of the foregoing, after satisfying financing costs (-253 million euros), shareholder remuneration
(-128 million euros) and acquisition of treasury shares (see section 4.4), cash generated amounted to -359
million euros.
The financial objective envisioned in the 2020 Resilience Plan is to preserve the strength of our balance
sheet and maintain an investment grade credit rating. With this in mind, there will be no increase in debt
in 2020 when compared to the end of 2019.
In line with the policy of financial prudence and commitment to maintaining a high degree of liquidity, the
funds held in cash by the Group at the end of June and available credit facilities were comfortably enough
to meet debt maturities in the short term and beyond, through to 2029, without the need to refinance.
Indebtedness
Net debt (3,987 million euros) with leases (8,026 million euros) is down on 2019. The lower cash flow from
operations as a result of COVID-19 have been offset by a total of 886 million euros in net funds obtained
from issuances and repurchases of equity instruments (perpetual subordinated bonds).
€3,987 M Net Debt
Positive free
cash flow,
but affected
by the
difficult
environment

19
Leverage
ratio:
14.7% Solid
financial
structure
Change in net debt
(1) Net impact of the issuance and partial repurchase described in the section titled “Main funding operations”.
(2) Includes, inter alia, new leases contracts in the period, other receipts/payments from operating activities and the exchange
rate effect.
The leverage ratio (14.7% without leases) remains unchanged on December 2019.
The breakdown and maturity of gross debt ex leases (10,756 million euros) at June 30, 2020 is as follows:
Main funding operations
On April 15, Repsol International Finance, B.V. (RIF) issued two series of Eurobonds (secured by Repsol,
S.A.) worth 1,500 million euros, which are admitted to trading on the Luxembourg Stock Exchange:
(i) 750 million euros at an issue price of 99.967%, paying a fixed annual coupon of 2% and maturing in
December 2025; and
(ii) 750 million euros at an issue price of 99.896%, paying a fixed annual coupon of 2.625% and maturing
in April 2030.
On May 28, a bond issued by RIF in May 2013 under the EMTN Program, which had been paying a fixed
annual coupon of 2.625%, was redeemed at maturity for the nominal amount of 1,200 million euros.
Net Debt with leases
Net debt
8,083 8,026705
589
128
459
10 246 186
886
602
0
1,000
2,000
3,000
4,000
5,000
6,000
7,000
8,000
9,000
Net debt
Dec 31, 2019
EBITDA Net
investment
Shareholder
return
Change
working
capital
Taxes Net interest Treasury
shares
Perpetual
subordinated
bonds
Others Net debt
Jun 30, 2020
(1)
4,220 3,987
LuxSE
0
500
1,000
1,500
2,000
2,500
3,000
3,500
4,000
4,500
5,000
2020 2021 2022 2023 2024 and
following
BONDS ECP BANK LOANS AND CREDIT OTHER

20
On June 11, RIF issued two series of perpetual subordinated bonds (secured by Repsol, S.A.) worth 1,500
million euros, which are admitted to trading on the Luxembourg Stock Exchange:
(i) 750 million euros, paying a fixed coupon of 3.750% through to the first redemption option in March
2026; and
(ii) 750 million euros, paying a fixed coupon of 4.247% through to the first redemption option in September
2028.
On June 12, the Repurchase Offer announced by RIF in relation to the perpetual subordinated bonds issued
in March 2015, as described in Note 4.1.4 to the interim financial statements for the first half of 2020, was
settled, with RIF paying the nominal sum of 594 million euros (59.4% uptake).
Additionally, RIF runs a Euro Commercial Paper (ECP) Program guaranteed by Repsol, S.A., capped at 2,000
million euros; the outstanding balance at June 30, 2020 was 1,989 million euros.
For further information, see Note 4.1.5 to the interim financial statements for the first half of 2020.
Liquidity
Group liquidity at June 30, 2020, including committed and undrawn credit facilities, stood at 9,762 million
euros, which is enough to cover its short-term debt maturities by a multiple of 2.4. Repsol had undrawn
credit facilities amounting to 3,420 million and 1,818 million euros at June 30, 2020 and December 31,
2019, respectively.
Credit rating
At present, the credit ratings assigned to Repsol, S.A. by the rating agencies are as follows:
Treasury shares and own equity investments
At June 30, 2020, the balance of treasury shares stood at 93.4 million shares (including 92.0 million shares
as the underlying of derivative contracts entered into by Repsol, S.A. with financial institutions)
representing 75% of share capital as at that date. For further information, see Note 4.1.4 to the interim
financial statements for the first half of 2020.
Remuneration received by shareholders in the first half of 2020 as part of the “Repsol Flexible Dividend”
program includes the amount of the irrevocable commitment to purchase free allocation rights undertaken
by Repsol as part of the paid-up capital increase closed in January 2020 (0.424 euros, gross, per right). Thus,
in the first half of 2020, Repsol paid out a gross total of 107 million euros to shareholders and distributed
38,647,825 new shares, equivalent to 541 million euros, to shareholders opting to receive new shares of
the Company.
In addition, in July 2020, under the “Repsol Flexible Dividend” program, replacing what would have been
the final dividend of 2019, Repsol paid out 236 million euros in cash (0.492 euros, gross, per right) to
shareholders opting to sell their free allocation rights to the Company and delivered 60,335,140 shares,
equivalent to 534 million euros, to shareholders opting to receive new shares of Repsol, S.A. (holders of
the 69.35% of the free allocation rights).
STANDARD & POOR’S MOODY’S FITCH
TERM Repsol, S.A. Repsol, S.A. Repsol, S.A.
Long-term BBB Baa2 BBB
Short-term A-2 P-2 F-2
Outlook stable negative stable
Most recent change 25/03/2020 02/04/2020 02/04/2020
€9,762 M
Liquidity
Credit rating
maintained

21
At the 2020 Annual General Meeting, the shareholders resolved to reduce capital through redemption of
treasury shares1, up to a maximum amount equivalent to the number of shares issued under the scrip
dividend completed in 2020, as described above, with the aim of offsetting the resulting dilutive effect.
For additional information on the total remuneration received by shareholders and the scrip dividend made
under the “Repsol Flexible Dividend” program, see Note 4.1.4 to the interim financial statements for the
first half of 2020.
Our share price
The Repsol share ended June at well below the price reported at the start of the year, largely as a result of
the impact that COVID-19 has had on the markets since March.
The Group’s main stock market indicators in 2020 and 2019 are detailed below:
MAIN STOCK MARKET INDICATORS 1H 2020 1H 2019
Shareholder remuneration (€/share) (1) 0.424 0.411
Share price at period-end (2) (euros) 7.79 13.79
Period average share price (€) 9.79 14.81
High (€) 14.36 15.52
Low (€) 6.03 13.64
Number of shares outstanding at end of the period (million) 1,566 1,559
Market capitalization at the end of the period (€ millions) (1) 12,193 21,489
(1)
For each period, shareholder remuneration includes dividends paid and the fixed price guaranteed by Repsol for the bonus share
rights awarded under the “Repsol Flexible Dividend” program. (2)
Share price at period-end in the continuous market of the Spanish stock exchanges. (3)
Period-end closing market price per share, times the number of shares outstanding.
1 Through the redemption of 1,400,000 existing treasury shares, as well as the shares acquired under a share repurchase program
and, as the case may be, through the settlement of derivatives arranged prior to March 25, 2020 (the maximum number of shares
that may be acquired through the settlement of derivatives shall not exceed 96,950,000).

22
Main operating figures Our performance in 1H 2020
Millions of euros 1H 2020 1H 2019 ∆
Operating income (4) 1,174 -
Income tax (57) (547) 90%
Investees and non-controlling
interests 10 19 (-47%)
Adjusted net income (51) 646 -
Special items (1,489) 75 -
Net income (1,540) 721 -
Effective tax rate (%) (1) 47 -
EBITDA 988 2,213 (-55%)
Investments 603 961 (-37%)
1H 2020 1H 2019
Net production of liquids (kbbl/d) 229 251
Net production of gas (kboe/d) 446 446
Net production of hydrocarbons (Kboe/d) 675 697
Average crude oil price ($/bbl) 35.8 59.6
Average gas price ($/kscf) 2.2 3.2
Main events in the first half of the year (1/3):
Average production:
Average production in the first half of 2020 came to 675 kboe/d, down 3% on the same period of 2019. This decline
was largely a result of production stoppages (Libya); natural decline at fields (Canada); as well as temporarily shutdowns
in Akacias (Colombia) and Chauvin (Canada) and the reduction of production in Duvernay (Canada) due to low prices;
lower demand for gas (Bolivia, Peru and Indonesia); and the Piedemonte license expiration (Colombia), which has been
partially offset by the acquisition of an additional 63% in Eagle Ford (United States) at the end of 2019, the connection
of new wells, mainly at Marcellus (United States) and the first oil in Buckskin (United States) in June 2019.
Exploration campaign:
Over the first six months of 2020, drilling was completed on seven exploration wells and one appraisal well, six of which
yielded a positive result (three exploration wells in the United States -two in Alaska and one in Gulf of Mexico-, two in
Mexico -Gulf of Mexico- and one in Colombia), one with a negative result in Mexico (Gulf of Mexico) and one under
evaluation (appraisal well in Colombia). At June 30, one exploration well in Bolivia was in progress.
Acreage:
In the first half of 2020, several exploration blocks were acquired in Indonesia (Aru, with a stake of 100%) and Russia
(Sablerskiy, as part of the AROG Joint Venture, with a stake of 49%). In Norway, the Company was awarded development
block PL-055E (Brage field), with a stake of 33.84%.
Impact of COVID-19 and price review:
The COVID-19 pandemic and prevailing prices have had a significant impact on operations at Upstream. Activity has
been reduced, investment limited and operations throttled accordingly (with the resulting drop in production) to
protect profitability and asset value (see section 2.1).
Future price patterns have been reviewed accordingly, as have production schedules for certain assets, prompting
extraordinary write-downs for some of these assets as described in section 4.1 of this report and in Note 4.2.2 to the
interim financial statements for the first half of the year.
(1) N/A. Although profit from operations is negative, there is a tax expense due to
the mix of results at different effective rates in each jurisdiction (income at
high rates and losses at low rates or not capitalized).
23
Main events in the first half of the year (2/3):
NORTH AMERICA
United States: discoveries in the Gulf of Mexico and Alaska and new production wells at Marcellus and Eagle Ford
In January, eight new wells were put into production at the Marcellus non-conventional gas production asset,
located between the states of Pennsylvania and New York.
Between January and February, seven new wells were put into production at the Eagle Ford non-conventional
production asset.
In April, the discovery of oil in the US part of the Gulf of Mexico was announced at the Monument exploration
well, where Repsol holds a 20% stake alongside Equinor (operator) with a 50% stake, and Progress Resources USA
Ltd, with the remaining 30%.
Also in April, two additional exploration discoveries were made at the North Slope project in Alaska, where Repsol
holds a 49% stake, namely the Mitquq-1 and Stirrup-1 wells.
Mexico: significant deepwater discoveries
In May, Repsol announced two important deepwater oil discoveries at two high quality fields with excellent
properties in block 29. Repsol holds a 30% stake in this block and is the operator. The Polok-1 and Chinwol-1
exploration wells are located in the Salina basin and have a net oil pay thickness of 200 meters and 150 meters,
respectively.
LATIN AMERICA - CARIBBEAN
Trinidad and Tobago: new production well at bpTT
In March, the Amherstia well was put into production in the assets of bpTT, where Repsol holds a 30% stake.
Colombia: discovery of an exploration well in the Llanos basin
In March, the Lorito Este-1 exploration well was discovered at the CPO-9 production block in the Llanos basin,
where Repsol holds a 45% stake.
Brazil: resumption of production at two wells in Albacora Leste
In January and February, production was resumed at two wells in the Albacora Leste offshore asset.
Venezuela: complex environment
Political instability and economic recession continued to threaten during the period, as did a raft of new
international sanctions. For further information, see Note 5.3 to the interim financial statements for the first half
of 2020.

24
Main events in the first half of the year (3/3):
ASIA AND OCEANIA
Vietnam: Agreement with PetroVietnam
On June 12, Repsol signed an agreement with PetroVietnam whereby Repsol would transfer its stakes of 51.75%
in Block 07/03 PSC and of 40% in Blocks 135-136/03 PSC to the other company. The deal is subject to
administrative clearance and is expected to be completed in 2020. For further information, see Note 5.3 to the
interim financial statements for the first half of 2020.
Indonesia: sale of 27% of the South East Jambi block and new acreage
In February, the Company announced the sale of 27% of the South East Jambi onshore block to Pertamina Hulu
Energy (subsidiary of state-owned company Pertamina). Following the deal, Repsol will remain the operator of the
block, with a 40% stake.
Repsol has acquired the new Aru exploration block in the Biak offshore basin, with a stake of 100%.
Papua New Guinea: no further activity in the country
Repsol has sold the stake it held in seven onshore blocks in Papua New Guinea to Australian company Arran Energy
Pty Ltd. Following the deal, Repsol has no further activity in the country.
Russia: new production wells at TNO and new acreage
In March and May, two new wells were brought into production at the TNO asset.
The Sablerskiy exploration block has been obtained as part of the AROG Joint Venture, with a 49% stake.
EUROPE
Norway: New production wells in Brage and Gudrun and new acreage
In February and May, two new wells were put into production in Brage, while a further well was commissioned in
April at the Gudrun asset.
In June, the Norwegian authorities granted an extension of production at the Rev field operated by Repsol through
to the end of 2023.
The Company has also been awarded development block PL-055E (Brage field), with a 33.84% stake.
Bulgaria: transfer of the stake in block 1-21 Han Asparuh
In June, it was announced that Repsol had obtained permission to transfer its 30% stake in block 1-21 Han Asparuh,
located on the Bulgarian Black Sea Coast, to its partners Total and OMV.
AFRICA
Libya: complex environment
As a result of existing security threats in Libya, production was halted throughout virtually all of the first half of
2020. For further information, see Note 5.3 to the interim financial statements for the first half of 2020.

25
Main figures Our performance in 1H 2020
1H 2020 1H 2019
Refining capacity (kbbl/d) 1,013 1,013
Europe 896 896
Rest of the world 117 117
Conversion rate in Spain (%) 63 63
Conversion utilization Spanish refining (%) 91 102
Distillation utilization Spanish refining (%) 76.1 89.3
Crude oil processed (millions of t) 18.5 22.1
Europe 17.0 19.8
Rest of the world 1.5 2.3
Refining margin indicator ($/Bbl)
Spain 3.9 4.4
Peru 12.1 6
Petrochemical production capacity (kt)
Basic petrochemicals 2,603 2,603
Derivative petrochemicals 2,235 2,235
Sales of petrochemical products (kt) 1,297 1,458
Gas sales in North America (Tbtu) 351 287
Millions of euros 1H 2020 1H 2019 ∆
Operating income 409 590 (-31%)
Income tax (109) (140) 22%
Investees and non-controlling
interests (4) (2) (-100%)
Adjusted net income 296 448 (-34%)
Inventory effect (1,066) 68 -
Special items (32) (67) 52%
Net income (802) 449 -
Effective tax rate (%) 27 24 3
EBITDA (670) 1,075 -
Investments 227 306 (-26%)
Main events in the first half of the year (1/2):
Refining: lower activity, but maintaining the supply and developing state-of-the-art decarbonization projects.
Amid the COVID-19 crisis, utilization of the refining system has fallen short of the levels reported in 2019 but is above
the world and European average, illustrating its competitive strength. The Company’s refineries have been effective at throttling production to prevailing market needs and have shown great flexibility in terms of logistics and storage,
allowing the continuous supply of essential products to the market.
The slump in demand and low production margins toward the end of the first half prompted the shut-down of the
distillation units at the Tarragona industrial complex, although the refinery’s main conversion unit, the hydrocracker, continued to produce fuel from intermediate products (vacuum gas oil), as did certain other auxiliary units.
Shut-downs at the A Coruña and Puertollano refineries for maintenance work:
- A Coruña shut down its Fluid Catalytic Cracking (FCC) block and the FCC Hydrotreatment unit and projects were
implemented to improve energy efficiency and reduce CO2 emissions.
- At Puertollano, maintenance work was carried out on the FCC block and on the Alkylation and Lubricants units.
Repsol has announced the development of two major greenhouse gas emission reduction projects in Spain. The first
project will involve the construction of one of the world’s largest net-zero emissions fuel production plants, which
will utilize CO2 and green hydrogen to generate renewable energy. The second project is a plant for generating gas
from urban waste, which will replace a part of the traditional fuels used in Petronor’s production process.
Chemicals: Certification for the production of circular polyolefins and further product differentiation.
All of the Group’s petrochemical complexes have been certified to produce circular polyolefins, which are obtained from the chemical recycling of plastic waste. All the facilities have now earned ISCC PLUS certification in 2020,
following the lead of the Puertollano facility, which obtained its certification in 2019. This makes Repsol the first
petrochemical company to have all its complexes certified.
The Repsol’s product range has been extended by developing new materials for 3D printing and further
improvements have been made to our range of polyolefins with high recycling content. Plan 2030 has now been
launched in line with the Company’s pledge to achieve a reduction in its carbon intensity score.

26
Main events in the first half of the year (2/2):
Wholesale and Gas & Trading: increase in volume sold and competitive provisioning to profit from low market prices
• Increase in gas sold in North America to reach 351 TBtu in the first half of the year, up 22% year on year.
• Provisioning ahead of the 2020/2021 winter period through six shipments acquired on the spot market to profit from
competitive market prices, for subsequent sale in North America.
• Amid the COVID-19 crisis, Wholesale and Gas & Trading has sought to offset the drop in demand from Industrial
Complexes in Spain by optimizing the value of its gas and LNG portfolio through swap operations arranged with third
parties, volume cancellations, logistical optimizations and trading in the gas system and in the international market
to expand the portfolio of customers and destinations. A new long-term contract (2034) has also been signed for the
supply of LNG for delivery in Spain.
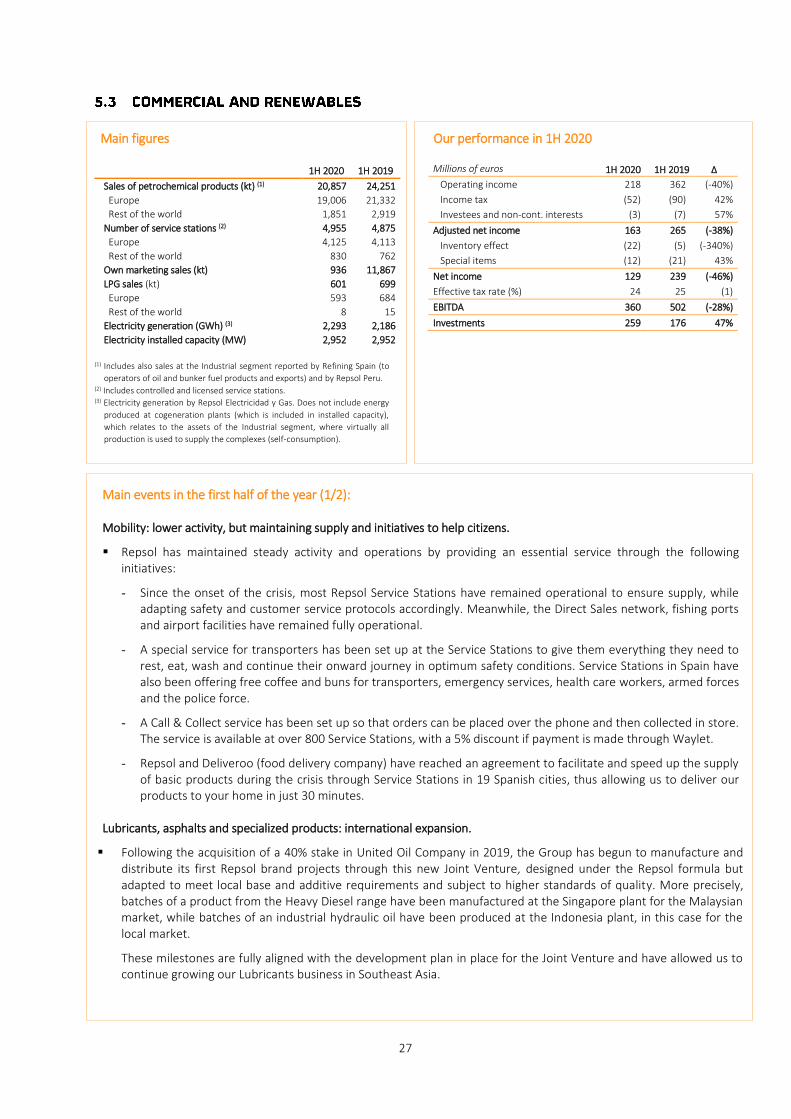
27
Main figures Our performance in 1H 2020
1H 2020 1H 2019
Sales of petrochemical products (kt) (1) 20,857 24,251
Europe 19,006 21,332
Rest of the world 1,851 2,919
Number of service stations (2) 4,955 4,875
Europe 4,125 4,113
Rest of the world 830 762
Own marketing sales (kt) 936 11,867
LPG sales (kt) 601 699
Europe 593 684
Rest of the world 8 15
Electricity generation (GWh) (3) 2,293 2,186
Electricity installed capacity (MW) 2,952 2,952
Millions of euros 1H 2020 1H 2019 ∆
Operating income 218 362 (-40%)
Income tax (52) (90) 42%
Investees and non-cont. interests (3) (7) 57%
Adjusted net income 163 265 (-38%)
Inventory effect (22) (5) (-340%)
Special items (12) (21) 43%
Net income 129 239 (-46%)
Effective tax rate (%) 24 25 (1)
EBITDA 360 502 (-28%)
Investments 259 176 47%
Main events in the first half of the year (1/2):
Mobility: lower activity, but maintaining supply and initiatives to help citizens.
Repsol has maintained steady activity and operations by providing an essential service through the following
initiatives:
- Since the onset of the crisis, most Repsol Service Stations have remained operational to ensure supply, while
adapting safety and customer service protocols accordingly. Meanwhile, the Direct Sales network, fishing ports
and airport facilities have remained fully operational.
- A special service for transporters has been set up at the Service Stations to give them everything they need to
rest, eat, wash and continue their onward journey in optimum safety conditions. Service Stations in Spain have
also been offering free coffee and buns for transporters, emergency services, health care workers, armed forces
and the police force.
- A Call & Collect service has been set up so that orders can be placed over the phone and then collected in store.
The service is available at over 800 Service Stations, with a 5% discount if payment is made through Waylet.
- Repsol and Deliveroo (food delivery company) have reached an agreement to facilitate and speed up the supply
of basic products during the crisis through Service Stations in 19 Spanish cities, thus allowing us to deliver our
products to your home in just 30 minutes.
Lubricants, asphalts and specialized products: international expansion.
Following the acquisition of a 40% stake in United Oil Company in 2019, the Group has begun to manufacture and
distribute its first Repsol brand projects through this new Joint Venture, designed under the Repsol formula but
adapted to meet local base and additive requirements and subject to higher standards of quality. More precisely,
batches of a product from the Heavy Diesel range have been manufactured at the Singapore plant for the Malaysian
market, while batches of an industrial hydraulic oil have been produced at the Indonesia plant, in this case for the
local market.
These milestones are fully aligned with the development plan in place for the Joint Venture and have allowed us to
continue growing our Lubricants business in Southeast Asia.
(1) Includes also sales at the Industrial segment reported by Refining Spain (to
operators of oil and bunker fuel products and exports) and by Repsol Peru. (2) Includes controlled and licensed service stations. (3) Electricity generation by Repsol Electricidad y Gas. Does not include energy
produced at cogeneration plants (which is included in installed capacity),
which relates to the assets of the Industrial segment, where virtually all
production is used to supply the complexes (self-consumption).
28
Main events in the first half of the year (2/2):
LPG: maintenance of supply, integrated solutions and entry into the Canary Islands market.
The following initiatives have been undertaken in the wake of the health crisis:
- Thousands of customers have now enjoyed the benefits of buying butane gas bottles online and new forms of
payment have been introduced (Bizum, as well as conventional cards) to provide a more agile and flexible
relationship.
- The 13 LPG facilities in Spain and Portugal have remained operational with 100% uptime and have even opened
on public holidays to guarantee supply. The Company has also guaranteed home delivery and the availability
of bottled gas at points of sale.
- Both Spain and Portugal have intervened in bottled gas prices. Portugal has decreed a maximum price
(between April 20 and May 2) for traditional bottles of butane (22 euros for the 13 kg bottle) and propane,
except for bottles K-6 and K-11. In Spain, prices for regulated LPG have been limited for three two-month
periods.
In May, the sale of butane cylinders in Tenerife and Gran Canaria became subject to new safety and tracking
requirements.
Electricity and gas: new renewable projects and growing the customer portfolio.
To enhance the customer experience and provide integrated energy solutions, customers have been offered a
solution that combines the supply of electricity, a basic energy management service, the supply of LPG and the
option to install a photovoltaic self-consumption solution. Thanks to these initiatives, the number of customers has
risen even though Repsol Service Stations have reported quieter levels of business from the public.
In February, the Company acquired the Delta 2 renewable energy project with a total installed capacity of 859
megawatts (MW), which will be operated and built by Repsol over the next three years. The new farms will be
located in Aragon, in the provinces of Huesca, Zaragoza and Teruel, where Repsol is also developing its 335 MW
Delta wind farm.
In April, Repsol launched Solmatch, Spain’s first large solar community. With this new service, which is based on a 100% renewable energy model, the Company is championing distributed generation in Spain by bringing energy
generation closer to the point of consumption through the design of solar communities in towns and cities.
In April, Repsol began construction of its first photovoltaic farm, known as Kappa, in Ciudad Real, which will have a
total installed capacity of 126 MW once built. Meanwhile in July, the company began construction of the Valdesolar
photovoltaic farm in Badajoz, with 264 MW.
In May, Repsol earned the “A” badge for low emissions, making it the first of the big electricity and gas marketing companies to earn this accolade and demonstrating Repsol’s commitment to leading the energy transition and becoming a net-zero emissions company by 2050.
In May, the last platform of the WindFloat project (the world’s first semi-submersible floating wind farm) left the
port of Ferrol. The two previous platforms are now fully installed at the wind farm and provide energy to the
Portuguese electricity grid. Once all three platforms have been installed, the wind farm, with its 25 MW of installed
capacity, will be able to generate enough energy to supply the equivalent of 60,000 users per year. WindFloat
Atlantic could save some 1.1 million tons of CO2.
In June, the Environmental Impact Statement (DIA) was obtained, subject to conditions, to increase the total
installed capacity of the existing 340 MW Aguayo hydro facility located in San Miguel de Aguayo (Cantabria). The
project would involve the construction, lasting four to five years, of a second reversible plant (Aguayo II) to harness
the already existing lower and upper reservoirs, with the aim of adding a further four generators, each of 250 MW,
to bring the total installed capacity to 1,340 MW.
The Board of Directors of Repsol, S.A. approved in July the creation of a joint venture with the Ibereólica Group,
which has extensive experience in the renewable energy sector in Chile, to develop a portfolio of projects in that
country, both wind and solar, at various stages of progress, totaling 2.6 GW. The investment initially planned by
Repsol comes to around 192 million US dollars. The arrangement will help to implement Repsol's objective in low-
carbon generation of reaching 7.5 GW in 2025.
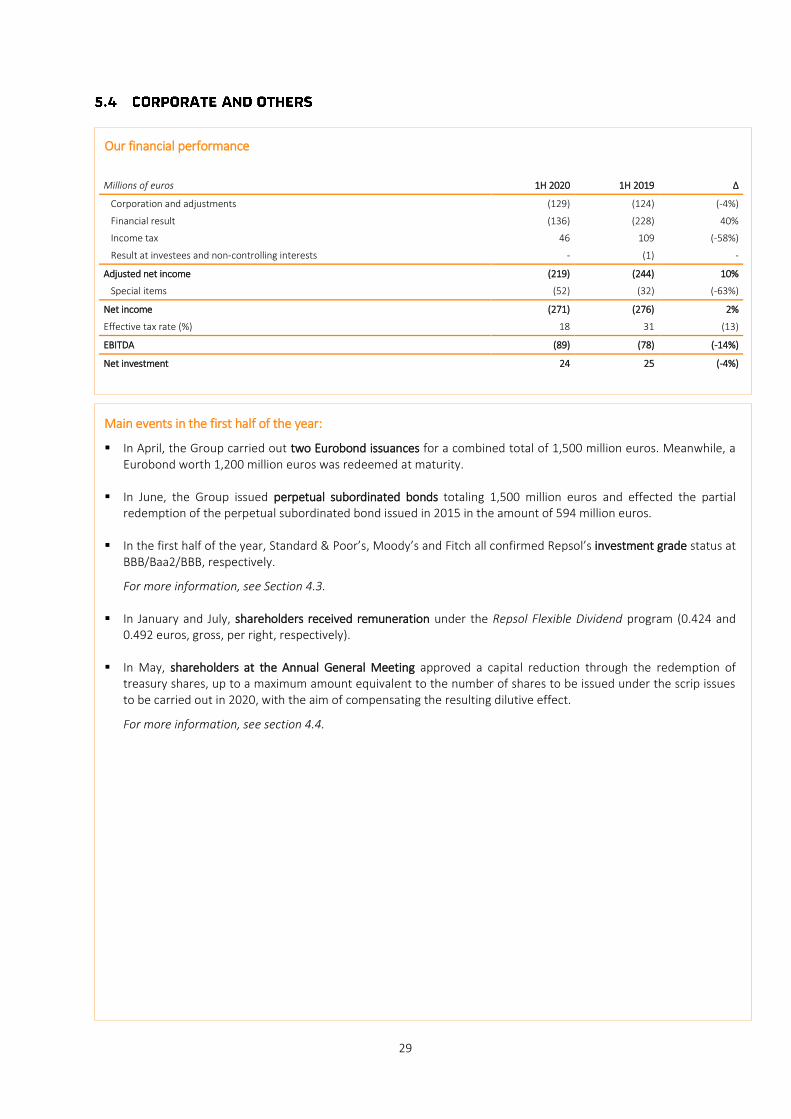
29
Millions of euros 1H 2020 1H 2019 ∆
Corporation and adjustments (129) (124) (-4%)
Financial result (136) (228) 40%
Income tax 46 109 (-58%)
Result at investees and non-controlling interests - (1) -
Adjusted net income (219) (244) 10%
Special items (52) (32) (-63%)
Net income (271) (276) 2%
Effective tax rate (%) 18 31 (13)
EBITDA (89) (78) (-14%)
Net investment 24 25 (-4%)
Main events in the first half of the year:
In April, the Group carried out two Eurobond issuances for a combined total of 1,500 million euros. Meanwhile, a
Eurobond worth 1,200 million euros was redeemed at maturity.
In June, the Group issued perpetual subordinated bonds totaling 1,500 million euros and effected the partial
redemption of the perpetual subordinated bond issued in 2015 in the amount of 594 million euros.
In the first half of the year, Standard & Poor’s, Moody’s and Fitch all confirmed Repsol’s investment grade status at
BBB/Baa2/BBB, respectively.
For more information, see Section 4.3.
In January and July, shareholders received remuneration under the Repsol Flexible Dividend program (0.424 and
0.492 euros, gross, per right, respectively).
In May, shareholders at the Annual General Meeting approved a capital reduction through the redemption of
treasury shares, up to a maximum amount equivalent to the number of shares to be issued under the scrip issues
to be carried out in 2020, with the aim of compensating the resulting dilutive effect.
For more information, see section 4.4.
Our financial performance

30
With regard to the information published in section 6 of the 2019 Management Report, the following
updates on the subject of sustainability deserve to be highlighted:
Global Sustainability Plan. The Executive Committee approved the Global Sustainability Plan 2020 (GSP),
which sets out 39 medium-term objectives built around the six axes of the Sustainability Model, aimed
at the businesses, supply chain, employees and society. These objectives are fully aligned with the 2030
Agenda of the United Nations and its 17 Sustainable Development Goals (SDGs) and include, most
notably, Repsol’s commitment to become a net-zero emissions Company by 2050.
The GSP is then used to devise and launch Local Sustainability Plans, with annual initiatives that pursue
the Company’s objectives and respond to the needs of local stakeholders. Over 20 local plans have now
been deployed in different countries and industrial complexes. Further information on global and local
sustainability plans can be found at www.repsol.com.
Sustainable Development Goals (SDGs). The first SDG report has been published for 2019, presenting
Repsol’s contribution to the 2030 Agenda through more than 30 different indicators, as well as different
challenges and objectives showing the efforts made by the Company at both global and local level (for
more information, see www.repsol.com). This makes Repsol one of the few companies worldwide to
publish this specific type of report.
In June, online training was set up to enable employees to discover what the 2030 Agenda is all about
and to find out how the Company is contributing through different initiatives and projects in the
countries in which it operates. The course has the double objective of raising awareness of the Agenda
and raising the Company’s contribution through its employees.
Climate change. As happens every year, verifications of greenhouse gas (GHG) inventories have been
carried out under ISO14064 at the various industrial centers and assets operated by Repsol. Given the
confinement in response to COVID-19, certain audits have been carried out remotely, though all
verifications have been completed in spite of the restrictions.
In June, the third follow-up report on the green bond issued in May 2017 was released, thus delivering
on the Company’s pledge to invest 500 million euros over the first three years in projects aimed at
preventing and reducing GHG emissions across all activities carried out by the Company.
Repsol has released a report that analyses the Company’s involvement in industry associations and
initiatives to ensure that the commitments of Repsol and the companies it supports are in line with the
climate change policy. The report reveals that only two associations out of the 28 evaluated were
partially aligned, namely the American Petroleum Institute (API) and the Canadian Society for
€500 M
invested in
projects to
curb GHG
emissions

31
Unconventional Resources (CSUR). Constructive dialog will be enabled with both associations on those
points where differences were found to exist.
Digitization: 40% of Repsol’s digital portfolio contributes directly to sustainable development objectives.
New cases with a direct impact on sustainability were launched in the first half of the year, especially in
reducing energy consumption and emissions through initiatives such as the monitoring of Upstream
operations in real time, the transport of raw materials and products at industrial facilities to bring about
a reduction in CO2 emissions, or the launch of a solution for the creation of renewable energy
consumption networks across distributed generation environments (Solmatch). Repsol has also
continued to migrate its applications from data processing centers to the cloud, with the consequent
positive impact on energy efficiency. It has also enhanced technologies to allow for remote and
distributed work, making it possible to relocate during the lock-down period.
Circular economy. In the first half of the year, the Company continued to expand its alliances with
strategic partners, as well as its portfolio of circular economy projects, which a key to accomplishing
the Company’s objectives and to deliver on its pledge that 20% of total polyolefin production will come
from recycled content by 2030, while doubling production of high-quality biofuel from hydrotreated
vegetable oil (HVO) to reach 600,000 tons a year by 2030, half of which will be produced from waste by
2025. In Spain, Repsol will rely on the recently approved Spanish Circular Economy Strategy.
People. Given the exceptional state of affairs resulting from the COVID-19 crisis, Repsol has rolled out a
series of measures to safeguard the health of its employees, without this affecting the continuity of its
operations or levels of service. The COVID-19 Coordination and Monitoring Committee has promoted
various initiatives, notably: (i) adopting new approaches to organizing shift work in industrial activities;
(ii) maintaining service at service stations in strict accordance with the safety and service requirements
prescribed by the competent authorities; (iii) enabling agile teleworking for a large number of
employees, with no impact on their productivity; or (iv) enabling a safe and orderly return to the new
normality at the different work centers, guaranteeing the necessary biocapacity and individual
protection measures.
Protecting the jobs of its workers has remained a key priority for Repsol. In June, the number of
employees with permanent contracts remained stable at 22,698, compared with 22,802 at December
2019. The total number of employees in June 2020 was 24,373.
Respect for Human Rights and Community Relations. In the first half of the year, the new Human Rights
and Community Relations Policy was delivered to employees, contractors and communities (for more
information, see www.repsol.com), and an in-house and external training campaign in human rights
was launched.
Safe operation. Repsol has been working for years on the development of a crisis and emergency
response system, involving working practices, regulations, management tools and specific training, all
of which has helped to ensure a swift response to the COVID-19 health crisis. Major changes have been
made to our approach to work, without this generating any significant operating incidents as we
continue to meet demand for essential products while protecting the health of our workers.
The Total recordable incident rate (TRIR) for accidents was down on the end of 2019, while the number
of Tier 1 + Tier 2 process safety incident rate (PSIR) rose following an increase in incidents classified as
Tier 2 in relation to non-conventional Upstream activity.
Innovation and technology. During the first half of the year, the Company continued to work toward
new sustainable solutions, with highlights including the eco-design of materials so that recycled
material can re-enter the production cycle. Repsol has also been working alongside the company
TactoTek through the Corporate Venturing fund in developing a material printing technology to make
vehicles lighter. The Company has made further progress in developing new materials that incorporate
CO2 as a raw material.
Priority:
protecting
jobs
32
Responsible tax policy. In the first half of 2020, Repsol paid more than 4,433 million euros in taxes and
similar public charges, having filed more than 24,000 tax returns.
As a further show of its commitment to earning public recognition for its integrity and tax transparency,
Repsol has renewed the Responsible Taxation section of the website to include numerous relevant
reports for its stakeholders. The customary report on Repsol’ tax contribution is now joined by the
voluntary publication of the latest Country by Country Report presented to the tax authorities and a
report which discusses any possible presence in tax havens or other territories considered controversial.
For further information, see the Responsible tax policy section at (www.repsol.com).
Ethics and compliance. The Company has continued its internal plan to raise awareness of the Code of
Ethics and Conduct and its compliance communication campaign, thus helping to consolidate and
strengthen a global culture of compliance, specifically on actions related to personal data protection,
crime prevention, anti-corruption, sanctions and embargoes. Meanwhile, courses have been given on
new law and regulations to provide a better understanding of various aspects enshrined in the Code,
such as the treatment of gifts and favors, conflicts of interest and due diligence with third parties.

33
Macroeconomic outlook
The world economy will experience an unprecedented decline in 2020 as a result of the COVID-19 crisis.
The impact on economic activity was at its most severe between March and April, and the subsequent
economic recovery could fall into two distinct phases. The first stage we have already seen, in the form of
a strong though partial rebound from very depressed levels. The subsequent stage will see a slower return
to normality due to the scars that the crisis has inflicted on the business fabric and the impact on confidence
of lingering fears of a possible resurgence of the virus until we are able to come up with a vaccine.
Against this backdrop, forecasts and projections will be fraught with uncertainty. Yet there are some
positives; the policy response, both monetary and fiscal, has been very strong and borrowing conditions
have eased since April, which is essential for avoiding structural damage to the economy.
Macroeconomic outlook - key figures
Real GDP
growth (%) Average inflation (%)
2020 2019 2020 2019
Global economy -4.9 2.9 2.8 3.6
Advanced countries -8.0 1.7 0.3 1.4
Spain -12.9 2.0 -0.3 0.7
Emerging countries -3.0 3.7 4.4 5.1
Source: IMF (World Economic Outlook June 2020) and Repsol´s Division of Business Studies & Analysis.
As a baseline scenario, the IMF projects that global economic activity bottomed out in the second quarter
of 2020 and that after losing 4.9% in 2020, global growth should reach 5.4% in 2021. The recovery could
be particularly strong in certain developed regions, which together would report 4.8% growth in 2021, and
in emerging countries such as China (+8.2%), although less so in other emerging areas such as Latin America
(+3.7%).
Economic activity is expected to decline (increased probability of growth falling short of the baseline
scenario). The risks include a possible resurgence of the pandemic and, perhaps linked to this, a reappraisal
of the valuation of financial assets and tighter borrowing conditions. Other risks include a possible
escalation of trade protectionism and reconfigurations of international supply chains, leading to production
disruption and/or productivity issues.
Energy sector outlook
Short-term energy sector outlook
At the beginning of the year, an oil market with a tighter balance between supply and demand than in 2019
was expected. However, COVID-19 forced to rethink this outlook.
The International Energy Agency (IEA), following its January estimate of an increase in global demand of
+960,000 bbl/d in 2020, downgraded this in June to a decline of -8.11 million bbl/d, thus bringing the
average level of demand in 2020 to 91.72 million bbl/d. Consumption among non-OECD and OECD
countries looks set to shrink by -3.9 million bbl/d and -4.21 million bbl/d, respectively. The IEA expects non-
OPEC countries to report a production drop of -3.09 million barrels per day in 2020, with a sharp decline in
non-conventional US supply. On the OPEC+ side, the market will be watching closely to see if the historic
new production cuts are effectively honored in order to combat the impact of COVID-19 on demand.
Looking ahead to 2021, the IEA expects to see a recovery in global demand of +5.7 million bbl/d to reach a
total of 97.42 million bbl/d, with an increase across both the OECD (+2.67 million bbl/d) and non-OECD
regions (+3.03 million bbl/d). As for the supply side, the IEA estimates that the non-OPEC region will

34
increase its production by only +800,000 bbl/d, while OPEC crude oil demand is likely to increase by 4.9
million bbl/d in 2021.
Global supply/demand balance - 2020 and 2021
Source: International Energy Agency (IEA) and Repsol´s Division of Business Studies & Analysis.
Turning to the Henry Hub natural gas market, oversupply and a warm winter have generated exceedingly
high inventory levels in the United States since early 2020. This situation, coupled with the spread of the
pandemic and the impact it has had on gas demand, has weighed heavily on Henry Hub prices. The social
distancing and lock-down measures put in place in response to COVID-19 have dramatically impacted
domestic demand for gas in the United States. Meanwhile, falling demand and concerns in Asia about a
possible second wave have triggered a decline in exports, as well as cancellations of LNG tanker loads. In
spite of all this, low prices have opened the door to market adjustments that can help counter the fall in
production and possibly bring about a turnaround in gas prices.
In 2021, the Henry Hub price is expected to recover. On the supply side, the decline (already observable)
in gas production in the United States, particularly associated gas, will shore up prices by helping to re-
establish a proper balance more quickly. On the demand side, the expected recovery of domestic demand
linked to seasonal winter factors and the progressive recovery of Asian demand should help exports to
recover.
Long-term energy sector outlook
In a scenario in which the effects of COVID-19 are expected to be concentrated in the short term, the long-
term outlook for the energy sector is unchanged, as described in section 7.1 of the 2019 Management Report.
However, there is a high degree of uncertainty as to how possible surges in demand for oil and gas might affect
global demand, as well as the policies that the various governments might implement to drive the economic
recovery and compliance with the commitments made on the subject of the energy transition.
The Group’s business plans for the second half of 2020 are as envisioned in the Resilience Plan described
in section 2.2, which ultimately pursues the objective of ending the year with debt at below the level
reported at year-end 2019.
At today’s date, Repsol expect to exceed the objectives initially set out in the Resilience Plan by cutting
operating costs by 450 million and investment by upward of 1,100 million euros, while also improving working
capital by some 800 million euros with respect to the initially budgeted metrics.
It is difficult to predict to what extent and for how long the impact of the pandemic will persist. The course
of the pandemic, the control measures rolled out by the health authorities and the policies put in place to
mitigate the social and economic impact of the crisis will all play a part in shaping the scope and duration
of both the crisis and the subsequent recovery. Weaker global demand for oil, gas and petroleum products
in response to the slump in economic activity and, in particular, the mobility restrictions, may adversely
affect prices, along with levels of production and sales.
However, the Company plans to update the scenarios in which it will continue to operate and will prepare a
new Strategic Plan for the 2021-2025 horizon, to be published in November 2020.
OECD
43.4
Non-OECD
48.3
Non-OPEC
62.5
OPEC LNG 5.2
OPEC needs
and inv. var.
24.1
Demand Supply
2020Demand = 91,7 million bl/d
OECD
46.0
Non-OECD
51.4
Non-OPEC
63.3
OPEC LNG 5.3
OPEC needs
and inv. var.
28.9
Demand Supply
2021Demand = 97,4 million bl/d

35
Repsol’s financial information contains indicators and measures prepared in accordance with applicable financial
reporting standards and regulations, as well as other measures prepared in accordance with the Group’s Reporting
Model, defined as Alternative Performance Measures (APMs). APMs are measures that are “adjusted” compared to
those presented in accordance with IFRS-EU or with Supplementary Information on Oil and Gas Upstream Activities,
and the reader should therefore consider them in addition to, but not instead of, the latter.
APMs are useful for users of financial information as they are the measures employed by Repsol’s Management to
evaluate its financial performance, cash flows or financial position when making operational or strategic decisions for
the Group.
For historical quarterly APM information, see www.repsol.com.
1. Financial performance measures
Adjusted net income
Adjusted net income is the key financial performance measure that Management (the Executive Committee) consults
when making decisions.
Repsol presents its segment1 results including joint ventures or other companies which are jointly managed in
accordance with the Group’s investment percentage, considering its operational and economic indicators within the
same perspective and degree of detail as those for companies consolidated under the full consolidation method. Thus,
the Group considers that the nature of its businesses and the way in which results are analyzed for decision-making
purposes is adequately reflected.
Adjusted net income is calculated as Net income from continuing operations at Current Cost of Supply (or CCS) net of
taxes and non-controlling interests. It excludes certain income and expenses (Special items) and the Inventory effect.
Financial income is allocated to the adjusted net income of the “Corporate and others” segment.
Adjusted net income is a useful APM for investors in evaluating the performance of operating segments while enabling
increased comparability with Oil & Gas sector companies that use different inventory measurement methods (see the
following section).
Inventory effect
For current cost of supply (CCS) earnings, the cost of volumes sold is calculated on the basis of procurement and
production costs2 incurred during the period in question and not based on weighted average cost (WAC), which is the
accepted methodology under European accounting law and regulations. The difference between CCS earnings and
WAC earnings is included in the so-called Inventory Effect, which also includes other adjustments to the valuation of
inventories (write-offs, economic hedges, etc.) and is presented net of taxes and minority interests. This Inventory
Effect largely affects the Industrial segment. Repsol management considers that this measurement is useful for
investors, considering the significant variations arising in the prices of inventories between periods.
WAC is a generally accepted European accounting method for measuring inventories. It factors in purchase prices and
historic production costs, valuing inventory at the lower between this cost and its market value.
1
In the first quarter of 2020, Repsol updated the definition of its segments as described in section 2.3. 2 Cost of supplies is calculated on the basis of international quoted prices in the reference markets in which the Company operates. The relevant
average monthly price is applied to each quality of distilled crude. Quoted prices are obtained from daily crude oil publications according to
Platts, while freight rates are estimated by Worldscale (which publishes global reference prices for freight costs from one port to another). All
other production costs (fixed and variable costs) are valued at the cost recognized in the accounts.

36
Special items
Significant items for which separate presentation is considered desirable to facilitate the task of monitoring the
ordinary management of business operations. This heading includes capital gains/losses arising from divestment,
restructuring costs, impairments, provisions for risks and expenses and other major income or expense items outside
the ordinary management of the businesses. Special items are presented net of taxes and minority interests.
Special items for the first half and second quarter of 2020 and 2019 are presented below:
The following is a reconciliation of Adjusted net income under the Group’s reporting model to income as stated under
IFRS-EU: First half
ADJUSTMENTS
Adjusted net
income
Joint venture
reclassification Special items
Inventory
effect(2)
Total
adjustments IFRS-EU income
Million euros 2020 2019 2020 2019 2020 2019 2020 2019 2020 2019 2020 2019
Operating income 494 (1) 2,002 (1) 843 (478) (1,500) 18 (1,507) 90 (2,164) (370) (1,670) 1,632
Financial income (136) (228) 22 68 (51) (9) - - (29) 59 (165) (169)
Net income from entities
accounted for using the
equity method 7 17 (986) 220 1 - - - (985) 220 (978) 237
Net Income before tax 365 1,791 (121) (190) (1,550) 9 (1,507) 90 (3,178) (91) (2,813) 1,700
Income tax (172) (668) 121 190 (36) (54) 383 (23) 468 113 296 (555)
Consolidated net income for
the year 193 1,123 - - (1,586) (45) (1,124) 67 (2,710) 22 (2,517) 1,145
Net income attributed to
non-controlling interests (4) (8) - - 1 - 36 (4) 37 (4) 33 (12)
TOTAL NET INCOME
ATTRIBUTABLE TO THE
PARENT COMPANY 189 1,115 - - (1,585) (45) (1,088) 63 (2,673) 18 (2,484) 1,133
(1) Net income from continuing operations at current cost of supply (CCS). (2) The inventory effect represents an adjustment to “Supplies” and “Changes in inventory of finished goods” in the income statement under IFRS-
EU.
1H 2Q
Million euros 2020 2019 2020 2019
Divestments 72 31 3 1
Workforce restructuring (41) (29) (35) (24)
Impairment (1,296) (3) (1,296) (1)
Provisions and other (320) (44) (113) (8)
TOTAL (1,585) (45) (1,441) (32)

37
Second quarter
ADJUSTMENTS
Adjusted net
income
Joint venture
reclassification Special items
Inventory
effect(2)
Total
adjustments IFRS-EU income
Million euros 2020 2019 2020 2019 2020 2019 2020 2019 2020 2019 2020 2019
Operating income (169) (1) 977 (1) 947 (238) (1,550) 20 (401) 83 (1,004) (135) (1,173) 842
Financial income (125) (131) 28 37 (38) 6 - - 10 43 (135) (88)
Net income from entities
accounted for using the
equity method 2 11 (944) 94 1 - - - (943) 94 (941) 105
Net Income before tax (292) 857 31 (107) (1,587) 26 (401) 83 (1,957) 2 (2,249) 859
Income tax 34 (359) (31) 107 146 (58) 100 (21) 215 28 249 (331)
Consolidated net income
for the year (258) 498 - - (1,441) (32) (301) 62 (1,742) 30 (2,000) 528
Net income attributed to
non-controlling interests - (1) - - - 3 (2) 3 (2) 3 (3)
TOTAL NET INCOME
ATTRIBUTABLE TO THE
PARENT COMPANY (258) 497 - - (1,441) (32) (298) 60 (1,739) 28 (1,997) 525
(1) Net income from continuing operations at current cost of supply (CCS) (2) The inventory effect represents an adjustment to “Supplies” and “Changes in inventory of finished goods” in the income statement under IFRS-
EU.
EBITDA:
EBITDA, or “Earnings Before Interest, Taxes, Depreciation, and Amortization,” is a financial indicator which determines
the operating margin of a company prior to deducting interest, taxes, impairment, restructuring costs, and
amortization. Since it does not include financial and tax indicators or accounting expenses not involving cash outflow,
it is used by Management to evaluate the company’s results over time, for a more straightforward exercise in making
comparisons with peers within the Oil&Gas sector.
EBITDA is calculated as Operating Income + Amortization + Impairment as well as other items which do not represent
cash inflows or outflows from transactions (restructuring, capital gains/losses from divestment, provisions etc.).
Operating income corresponds to the result from continuing operations at weighted average cost (WAC). Where Net
income from continuing operations at Current Cost of Supply (CCS) is used, it is known as CCS EBITDA.
First half
Group Reporting Model
Joint venture reclassification
and others IFRS-EU (1)
2020 2019 2020 2019 2020 2019
Upstream 988 2,213 (488) (918) 500 1,295
Industrial (670) 1,075 (15) (18) (685) 1,057
Commercial and Renewables 360 502 (2) (6) 358 496
Corporate and others (89) (78) 7 (2) (82) (80)
EBITDA 589 3,712 (498) (944) 91 2,768
Inventory effect 1,507 (90) - - - -
CCS EBITDA 2,096 3,622 (498) (944) 91 2,768
(1) Corresponds to “Net income before tax” and “Adjustments to income” in the consolidated Statement of Cash Flows prepared under IFRS-EU.
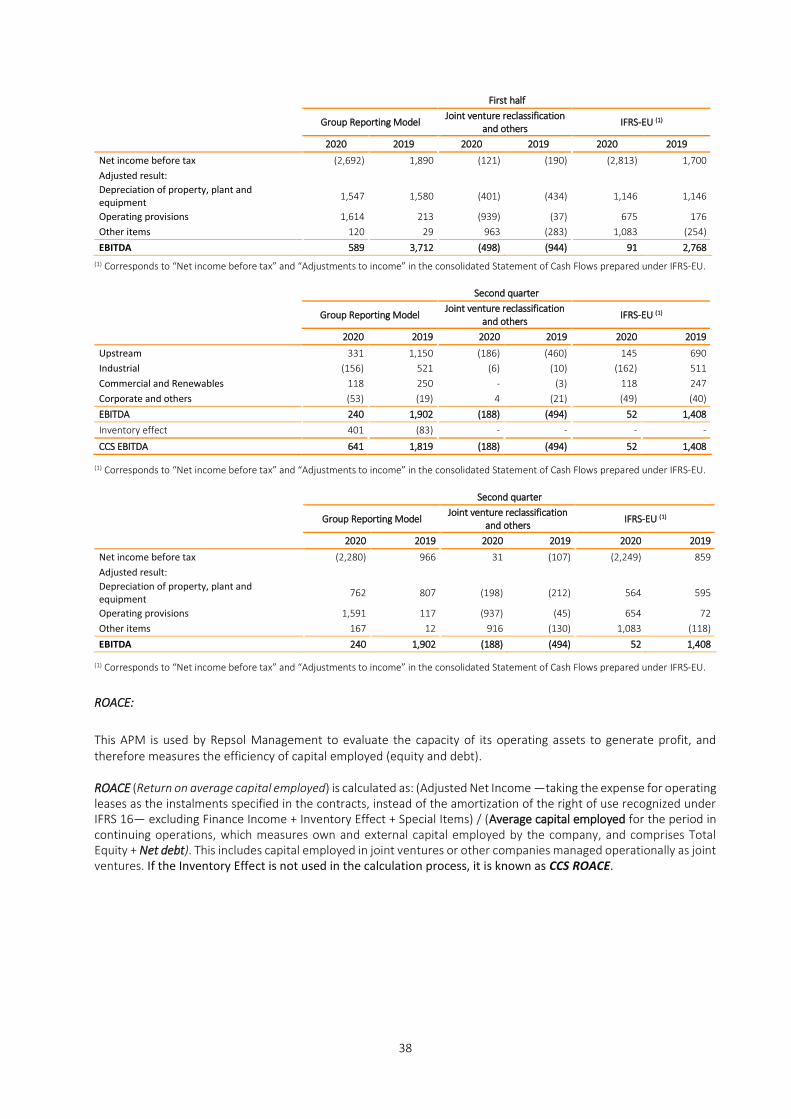
38
First half
Group Reporting Model
Joint venture reclassification
and others IFRS-EU (1)
2020 2019 2020 2019 2020 2019
Net income before tax (2,692) 1,890 (121) (190) (2,813) 1,700
Adjusted result:
Depreciation of property, plant and
equipment 1,547 1,580 (401) (434) 1,146 1,146
Operating provisions 1,614 213 (939) (37) 675 176
Other items 120 29 963 (283) 1,083 (254)
EBITDA 589 3,712 (498) (944) 91 2,768 (1) Corresponds to “Net income before tax” and “Adjustments to income” in the consolidated Statement of Cash Flows prepared under IFRS-EU.
Second quarter
Group Reporting Model
Joint venture reclassification
and others IFRS-EU (1)
2020 2019 2020 2019 2020 2019
Upstream 331 1,150 (186) (460) 145 690
Industrial (156) 521 (6) (10) (162) 511
Commercial and Renewables 118 250 - (3) 118 247
Corporate and others (53) (19) 4 (21) (49) (40)
EBITDA 240 1,902 (188) (494) 52 1,408
Inventory effect 401 (83) - - - -
CCS EBITDA 641 1,819 (188) (494) 52 1,408
(1) Corresponds to “Net income before tax” and “Adjustments to income” in the consolidated Statement of Cash Flows prepared under IFRS-EU.
Second quarter
Group Reporting Model
Joint venture reclassification
and others IFRS-EU (1)
2020 2019 2020 2019 2020 2019
Net income before tax (2,280) 966 31 (107) (2,249) 859
Adjusted result:
Depreciation of property, plant and
equipment 762 807 (198) (212) 564 595
Operating provisions 1,591 117 (937) (45) 654 72
Other items 167 12 916 (130) 1,083 (118)
EBITDA 240 1,902 (188) (494) 52 1,408
(1) Corresponds to “Net income before tax” and “Adjustments to income” in the consolidated Statement of Cash Flows prepared under IFRS-EU.
ROACE:
This APM is used by Repsol Management to evaluate the capacity of its operating assets to generate profit, and
therefore measures the efficiency of capital employed (equity and debt).
ROACE (Return on average capital employed) is calculated as: (Adjusted Net Income —taking the expense for operating
leases as the instalments specified in the contracts, instead of the amortization of the right of use recognized under
IFRS 16— excluding Finance Income + Inventory Effect + Special Items) / (Average capital employed for the period in
continuing operations, which measures own and external capital employed by the company, and comprises Total
Equity + Net debt). This includes capital employed in joint ventures or other companies managed operationally as joint
ventures. If the Inventory Effect is not used in the calculation process, it is known as CCS ROACE.

39
(1)
Does not include income tax corresponding to financial income. (2)
This is the average balance of capital employed in continuing operations at the beginning and end of the period. (3)
ROACE for the six-month period. In previous periods this magnitude was annualized by simply extrapolating the results (with the exception of
special results and earnings). (4)
ROACE on CCS (without taking into account the Inventory Effect) amounts to (3.9)%.
ROACE with leases is calculated as: (Adjusted Net Income, excluding Financial income + Inventory Effect + Special
Items) / (Average capital employed in continuing operations during the period, which equals Total Equity + Net Debt
with leases). It includes the return pertaining to joint ventures or other companies operationally managed as such.
NUMERATOR (Million euros) 1H 2020 1H 2019
Operating income IFRS-EU (1,670) 1,632
Joint Venture reclassification (843) 478
Income tax (1) 150 (802)
Net income from entities accounted for using the equity method, net of taxes 8 17
I. ROACE result at weighted average cost (2,355) 1,325
DENOMINATOR (Million euros) 1H 2020
Total equity 22,940 30,927
Net debt with leases 8,026 7,464
Capital employed at period-end (with leases) 30,966 38,391
II. Average capital employed (2) 32,128 38,158
ROACE with leases (I/II) (3) (7.3)% 3.5%
(1) Does not include income tax corresponding to financial results.
(2) This is the average balance of capital employed in continuing operations at the beginning and end of the period.
(3) ROACE for the six-month period. In previous periods this magnitude was annualized by simply extrapolating the results (with the exception of
special results and earnings).
NUMERATOR (Million euros) 1H 2020 1H 2019
Operating income IFRS-EU (1,670) 1,632
Joint ventures reclassification (843) 478
Income tax (1) 150 (802)
Net income from entities accounted for using the equity method, net of taxes 8 17
IFRS 16 impact (21) (27)
I. ROACE result at weighted average cost (2,376) 1,298
DENOMINATOR (Million euros) 1H 2020 1H 2019
Total equity 23,089 31,035
Net debt 3,987 3,662
Capital employed at period-end 27,076 34,697
II. Average capital employed (2) 28,316 34,525
ROACE (I/II) (3) (4) (8.4)% 3.8%
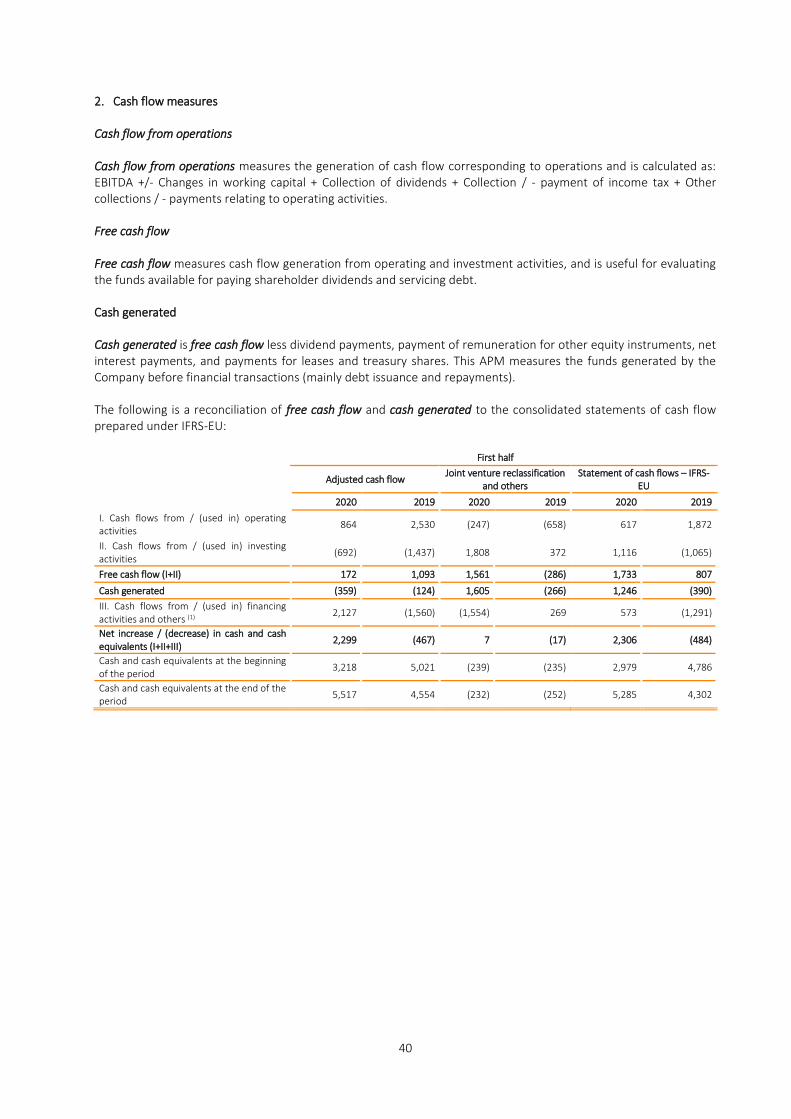
40
2. Cash flow measures
Cash flow from operations
Cash flow from operations measures the generation of cash flow corresponding to operations and is calculated as:
EBITDA +/- Changes in working capital + Collection of dividends + Collection / - payment of income tax + Other
collections / - payments relating to operating activities.
Free cash flow
Free cash flow measures cash flow generation from operating and investment activities, and is useful for evaluating
the funds available for paying shareholder dividends and servicing debt.
Cash generated
Cash generated is free cash flow less dividend payments, payment of remuneration for other equity instruments, net
interest payments, and payments for leases and treasury shares. This APM measures the funds generated by the
Company before financial transactions (mainly debt issuance and repayments).
The following is a reconciliation of free cash flow and cash generated to the consolidated statements of cash flow
prepared under IFRS-EU:
First half
Adjusted cash flow
Joint venture reclassification
and others
Statement of cash flows – IFRS-
EU
2020 2019 2020 2019 2020 2019
I. Cash flows from / (used in) operating
activities 864 2,530 (247) (658) 617 1,872
II. Cash flows from / (used in) investing
activities (692) (1,437) 1,808 372 1,116 (1,065)
Free cash flow (I+II) 172 1,093 1,561 (286) 1,733 807
Cash generated (359) (124) 1,605 (266) 1,246 (390)
III. Cash flows from / (used in) financing
activities and others (1) 2,127 (1,560) (1,554) 269 573 (1,291)
Net increase / (decrease) in cash and cash
equivalents (I+II+III) 2,299 (467) 7 (17) 2,306 (484)
Cash and cash equivalents at the beginning
of the period 3,218 5,021 (239) (235) 2,979 4,786
Cash and cash equivalents at the end of the
period 5,517 4,554 (232) (252) 5,285 4,302

41
Second quarter
Adjusted cash flow
Joint venture reclassification
and others
Statement of cash flows – IFRS-
EU
2020 2019 2020 2019 2020 2019
I. Cash flows from / (used in) operating
activities 268 1,369 35 (258) 303 1,111
II. Cash flows from / (used in) investing
activities (485) (869) 1,053 (105) 568 (974)
Free cash flow (I+II) (217) 500 1,088 (363) 871 137
Cash generated (337) 111 1,121 (342) 784 (231)
III. Cash flows from / (used in) financing
activities and others (1) 2,300 (775) (1,050) 467 1,250 (308)
Net increase / (decrease) in cash and cash
equivalents (I+II+III) 2,083 (275) 38 104 2,121 (171)
Cash and cash equivalents at the beginning
of the period 3,434 4,829 (270) (356) 3,164 4,473
Cash and cash equivalents at the end of the
period 5,517 4,554 (232) (252) 5,285 4,302
(1) Includes dividends paid out and payments on other equity instruments, interest payments, other proceeds from / (payments for) financing
activities, proceeds from / (payments for) equity instruments, proceeds from / (payments for) issuance/(redemption) of financial liabilities and
the effect of exchange rate fluctuations.
The Group measures liquidity as the sum of “Cash and cash equivalents” on-demand cash deposits at financial
institutions, and short and long-term credit facilities that remain undrawn at the end of the period, i.e., credit facilities
granted by financial institutions that may be drawn on by the Company on the terms, in the amount and subject to
the other conditions agreed in the contract.
First half
Group Reporting Model Joint venture
reclassification IFRS-EU
Jun - 2020 Dec - 2019 Jun - 2020 Dec - 2019 Jun - 2020 Dec - 2019
Cash and cash equivalents 5,517 3,218 (232) (239) 5,285 2,979
Undrawn credit facilities 3,420 1,818 (9) (10) 3,411 1,808
On-demand cash deposits (1) 825 2,631 - - 825 2,631
Liquidity 9,762 7,667 (241) (249) 9,521 7,418
(1) Repsol enters into contracts for time deposits that are nonetheless drawable on demand which are recorded in “Other current financial assets”
insofar as they are not classifiable for accounting purposes as cash and cash equivalents.
Operating investments:
Group Management uses this APM to measure each period’s investment effort and allocation by business segment,
reflecting operating investments by the various Group business units. The figure includes joint ventures or other
companies managed operationally as joint ventures.
Investments may be presented as organic (acquisition of projects, assets or companies for the expansion of the
Group’s activities) or inorganic (funds invested in the development or maintenance of the Group’s projects and
assets). This distinction is useful in understanding how the Group’s Management allocates its resources and allows
for a more reliable comparison of investment between periods.
First half
Operating investments Joint venture
reclassification and others IFRS-EU (1)
2020 2019 2020 2019 2020 2019
Upstream 603 961 (99) (253) 504 708
Industrial 227 306 (1) (5) 226 301
Commercial and Renewables 259 176 (13) (11) 246 165
Corporate and others 24 25 - 5 24 30
TOTAL 1,113 1,468 (113) (264) 1,000 1,204
(1) This corresponds to “Payments on investments” in the consolidated statement of cash flows prepared under IFRS-EU, and does not include
items corresponding to “Other financial assets.”
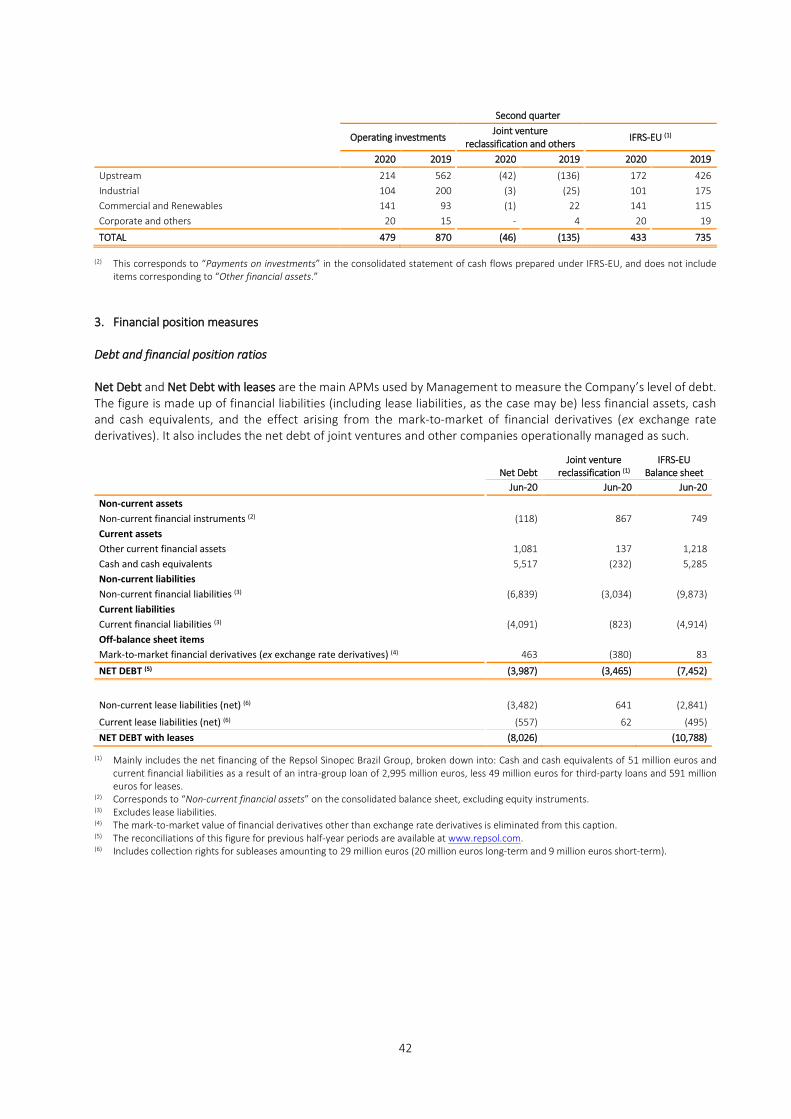
42
Second quarter
Operating investments Joint venture
reclassification and others IFRS-EU (1)
2020 2019 2020 2019 2020 2019
Upstream 214 562 (42) (136) 172 426
Industrial 104 200 (3) (25) 101 175
Commercial and Renewables 141 93 (1) 22 141 115
Corporate and others 20 15 - 4 20 19
TOTAL 479 870 (46) (135) 433 735
(2)
This corresponds to “Payments on investments” in the consolidated statement of cash flows prepared under IFRS-EU, and does not include
items corresponding to “Other financial assets.”
3. Financial position measures
Debt and financial position ratios
Net Debt and Net Debt with leases are the main APMs used by Management to measure the Company’s level of debt.
The figure is made up of financial liabilities (including lease liabilities, as the case may be) less financial assets, cash
and cash equivalents, and the effect arising from the mark-to-market of financial derivatives (ex exchange rate
derivatives). It also includes the net debt of joint ventures and other companies operationally managed as such.
Net Debt
Joint venture
reclassification (1)
IFRS-EU
Balance sheet
Jun-20 Jun-20 Jun-20
Non-current assets
Non-current financial instruments (2) (118) 867 749
Current assets
Other current financial assets 1,081 137 1,218
Cash and cash equivalents 5,517 (232) 5,285
Non-current liabilities
Non-current financial liabilities (3) (6,839) (3,034) (9,873)
Current liabilities
Current financial liabilities (3) (4,091) (823) (4,914)
Off-balance sheet items
Mark-to-market financial derivatives (ex exchange rate derivatives) (4) 463 (380) 83
NET DEBT (5) (3,987) (3,465) (7,452)
Non-current lease liabilities (net) (6) (3,482) 641 (2,841)
Current lease liabilities (net) (6) (557) 62 (495)
NET DEBT with leases (8,026) (10,788)
(1) Mainly includes the net financing of the Repsol Sinopec Brazil Group, broken down into: Cash and cash equivalents of 51 million euros and
current financial liabilities as a result of an intra-group loan of 2,995 million euros, less 49 million euros for third-party loans and 591 million
euros for leases.
(2) Corresponds to “Non-current financial assets” on the consolidated balance sheet, excluding equity instruments.
(3) Excludes lease liabilities.
(4) The mark-to-market value of financial derivatives other than exchange rate derivatives is eliminated from this caption.
(5) The reconciliations of this figure for previous half-year periods are available at www.repsol.com.
(6) Includes collection rights for subleases amounting to 29 million euros (20 million euros long-term and 9 million euros short-term).

43
Gross Debt and Gross Debt with leases are measures used to analyze the Group’s solvency and include financial
liabilities (including lease liabilities as the case may be) and the mark-to-market value of exchange rate derivatives. It
also includes the net debt of joint ventures and other companies operationally managed as such.
Gross Debt
Joint venture
reclassification
IFRS-EU
Balance sheet
Jun-20 Jun-20 Jun-20
Current financial liabilities (1) (3,978) (822) (4,800)
Mark-to-market current exchange rate derivatives (31) 0 (31)
Current gross debt (4,009) (822) (4,831)
Non-current financial liabilities (1) (6,743) (3,035) (9,778)
Mark-to-market of non-current exchange rate derivatives (4) 0 (4)
Non-current gross debt (6,747) (3,035) (9,782)
GROSS DEBT (2) (10,756) (3,856) (14,613)
Current lease liabilities (566) 62 (504)
Non-current lease liabilities (3,510) 649 (2,861)
GROSS DEBT with leases (14,832) (3,146) (17,978)
(1) Lease liabilities not included.
(2) The reconciliations of this figure for previous periods are available at www.repsol.com.
The following ratios are used by Group Management to evaluate leverage ratios and Group solvency.
The leverage ratio is net debt divided by capital employed at the end of the period. This ratio can be used to examine
financial structure and degree of indebtedness in relation to capital contributed by shareholders and financing
entities. Leverage is the chief measure used to evaluate and compare the Company’s financial position with respect
to its peers in the Oil & Gas industry.
First half
Group Reporting Model Joint venture reclassification IFRS - EU Balance sheet
Million euros 2020 2019 2020 2019 2020 2019
Net debt (8,026) (7,464) (2,762) (2,337) (10,788) (9,801)
Capital employed 30,966 38,391 2,762 2,337 33,728 40,728
Leverage with leases 25.9% 19.4% 32.0% 24.0%
First half
Group Reporting Model Joint venture reclassification IFRS - EU Balance sheet
Millones de euros 2020 2019 2020 2019 2020 2019
Net debt (3,987) (3,662) (3,465) (3,098) (7,452) (6,760)
Capital employed 27,076 34,697 3,465 3,098 30,541 37,795
Leverage without leases 14.7% 10.6% 24.4% 17.9%
The solvency ratio is calculated as liquidity (section 2 of this Appendix) divided by Current Gross debt and is used to
determine the number of times the Group may service its current debt using its existing liquidity.
First half
Group Reporting Model Joint venture reclassification IFRS - EU Balance sheet
Million euros Jun - 2020 Dec - 2019 Jun - 2020 Dec - 2019 Jun - 2020 Dec - 2019
Liquidity 9,762 7,667 (241) (249) 9,521 7,418
Current Gross debt 4,009 5,219 822 (10) 4,831 6,022
Solvency 2.4 1.5 2.0 1.2
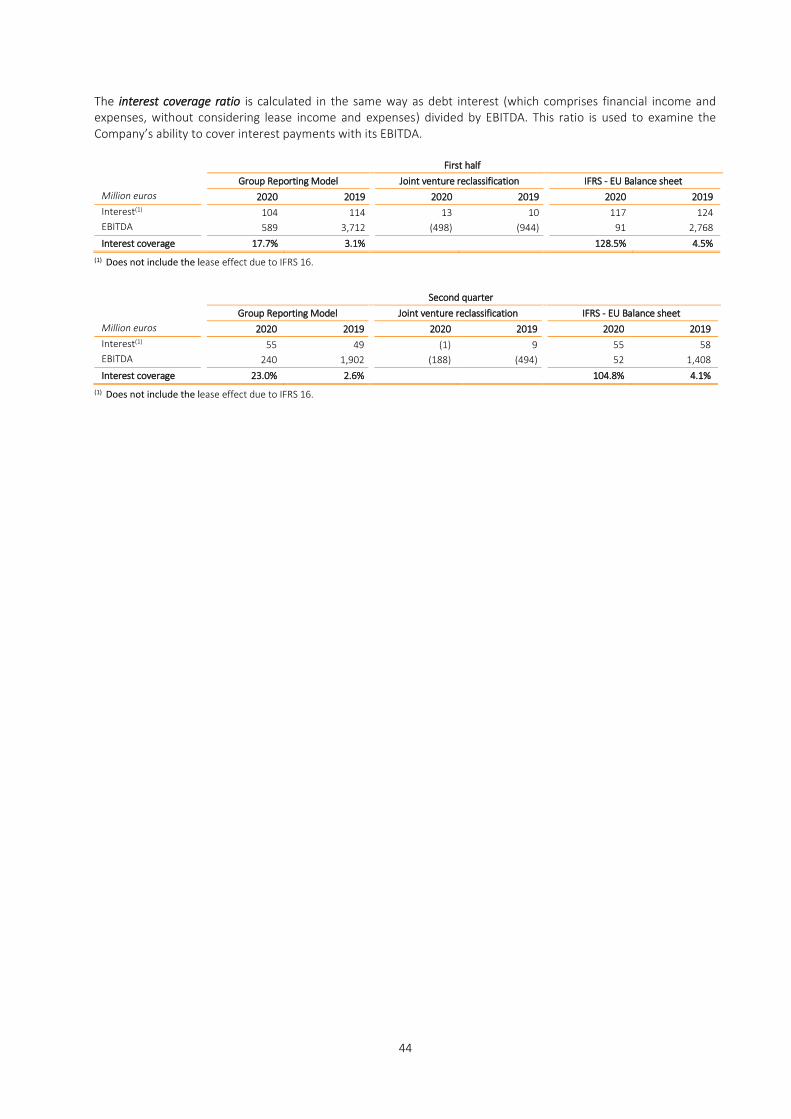
44
The interest coverage ratio is calculated in the same way as debt interest (which comprises financial income and
expenses, without considering lease income and expenses) divided by EBITDA. This ratio is used to examine the
Company’s ability to cover interest payments with its EBITDA.
First half
Group Reporting Model Joint venture reclassification IFRS - EU Balance sheet
Million euros 2020 2019 2020 2019 2020 2019
Interest(1) 104 114 13 10 117 124
EBITDA 589 3,712 (498) (944) 91 2,768
Interest coverage 17.7% 3.1% 128.5% 4.5%
(1) Does not include the lease effect due to IFRS 16.
Second quarter
Group Reporting Model Joint venture reclassification IFRS - EU Balance sheet
Million euros 2020 2019 2020 2019 2020 2019
Interest(1) 55 49 (1) 9 55 58
EBITDA 240 1,902 (188) (494) 52 1,408
Interest coverage 23.0% 2.6% 104.8% 4.1%
(1) Does not include the lease effect due to IFRS 16.

45
(1) Benchmark: 32.35° API and relative density of 0.8636.
Meter Inch Foot Yard
LENGTH Meter m 1 39.37 3.281 1.093
Inch in 0.025 1 0.083 0.028
Foot ft 0.305 12 1 0.333
Yard yd 0.914 36 3 1
Kilogram Pound Ton
MASS Kilogram kg 1 2.2046 0.001
Pound lb 0.45 1 0.00045
Ton t 1,000 22.046 1
Cubic feet Barrel Liter Cubic meter
VOLUME Cubic foot
ft3 1 0.1781 28.32 0.0283
Barrel bbl 5.615 1 158.984 0.1590
Liter l 0.0353 0.0063 1 0.001
Cubic meter m3 35.3147 6.2898 1,000 1
Term Description Term Description Term Description
bbl / bbl/d Barrel/ Barrels per day kbbl Thousand barrels of oil Mm3/d Million cubic meters per day
bcf Billion cubic feet
kbbl/d Thousand barrels per day
Mscf/d Million standard cubic feet per
day
Bm3 Billion cubic meters
kboe Thousand barrels of oil equivalent
kscf/d Thousand standard cubic feet per
day
Boe Barrel of oil equivalent
kboe/d Thousand barrels of oil equivalent
per day MW
Megawatts
Btu/MBtu British thermal unit/
Btu/millions of Btu km2
Square kilometer MWh
Megawatt hour
LPG Liquefied petroleum gas kt/Mt Thousand tons/Million tons Tcf Trillion cubic feet
LNG Liquefied natural gas Mbbl Million barrels toe Tons of oil equivalent
GWh Gigawatts per hour Mboe Million barrels of oil equivalent USD /
Dollar / $ US dollar
OIL GAS ELECTRICITY
Liters Barrels
Cubic
meters toe
Cubic
meters Cubic feet kWh
OIL 1 barrel (1) bbl 158.99 1 0.16 0.14 162.60 5,615 1.7x10³
1 cubic meter (1) m3 1,000 6.29 1 0.86 1,033 36,481 10,691.5
1 ton of oil
equivalent (1)
toe 1,160.49 7.30 1.16 1 1,187 41,911 12,407.4
GAS 1 cubic meter m3 0.98 0.01 0,001 0,001 1 35.32 10.35
1,000 cubic
feet=1.04x10⁶ Btu
ft3 27.64 0.18 0.03 0.02 28.3 1,000 293.1
ELECTRICITY 1 megawatt hour MWh 93.53 0.59 0.10 0.08 96.62 3,412.14 1,000