3. collection of data, classification and tabulation · pdf file3. collection of data,...
TRANSCRIPT
28
3. COLLECTION OF DATA,CLASSIFICATION AND TABULATION
3.1 Introduction:Everybody collects, interprets and uses information, much
of it in a numerical or statistical forms in day-to-day life. It is acommon practice that people receive large quantities of informationeveryday through conversations, televisions, computers, the radios,newspapers, posters, notices and instructions. It is just becausethere is so much information available that people need to be ableto absorb, select and reject it. In everyday life, in business andindustry, certain statistical information is necessary and it isindependent to know where to find it how to collect it. Asconsequences, everybody has to compare prices and quality beforemaking any decision about what goods to buy. As employees ofany firm, people want to compare their salaries and workingconditions, promotion opportunities and so on. In time the firms ontheir part want to control costs and expand their profits.
One of the main functions of statistics is to provideinformation which will help on making decisions. Statisticsprovides the type of information by providing a description of thepresent, a profile of the past and an estimate of the future. Thefollowing are some of the objectives of collecting statisticalinformation.
1. To describe the methods of collecting primary statisticalinformation.
2. To consider the status involved in carrying out a survey.3. To analyse the process involved in observation and
interpreting.4. To define and describe sampling.5. To analyse the basis of sampling.6. To describe a variety of sampling methods.
Statistical investigation is a comprehensive and requiressystematic collection of data about some group of people orobjects, describing and organizing the data, analyzing the data with
29
the help of different statistical method, summarizing the analysisand using these results for making judgements, decisions andpredictions. The validity and accuracy of final judgement is mostcrucial and depends heavily on how well the data was collected inthe first place. The quality of data will greatly affect the conditionsand hence at most importance must be given to this process andevery possible precautions should be taken to ensure accuracywhile collecting the data.
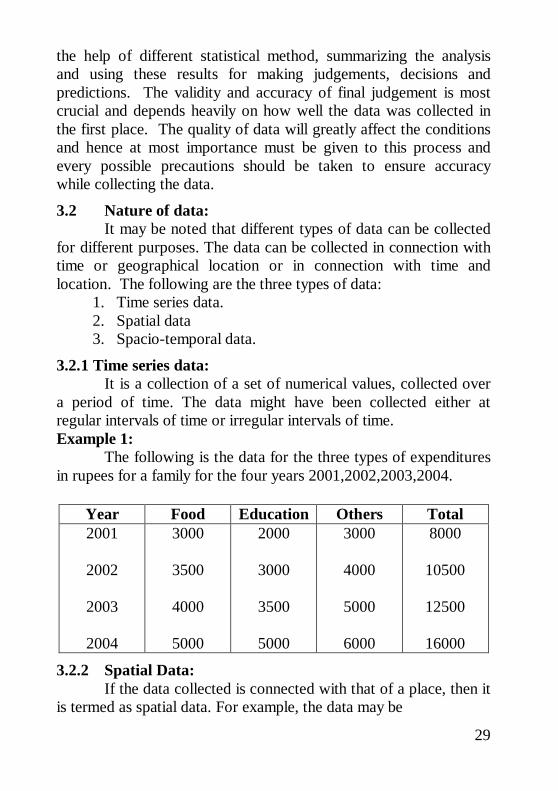
3.2 Nature of data:It may be noted that different types of data can be collected
for different purposes. The data can be collected in connection withtime or geographical location or in connection with time andlocation. The following are the three types of data:
1. Time series data.2. Spatial data3. Spacio-temporal data.
3.2.1 Time series data:It is a collection of a set of numerical values, collected over
a period of time. The data might have been collected either atregular intervals of time or irregular intervals of time.Example 1:
The following is the data for the three types of expendituresin rupees for a family for the four years 2001,2002,2003,2004.
3.2.2 Spatial Data:If the data collected is connected with that of a place, then it
is termed as spatial data. For example, the data may be
Year Food Education Others Total2001
2002
2003
2004
3000
3500
4000
5000
2000
3000
3500
5000
3000
4000
5000
6000
8000
10500
12500
16000
30
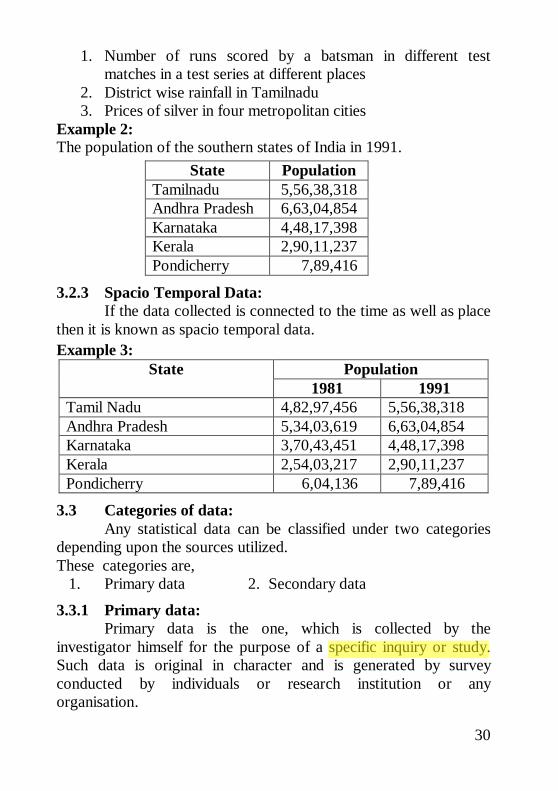
1. Number of runs scored by a batsman in different testmatches in a test series at different places
2. District wise rainfall in Tamilnadu3. Prices of silver in four metropolitan cities
Example 2:The population of the southern states of India in 1991.
State PopulationTamilnadu 5,56,38,318Andhra Pradesh 6,63,04,854Karnataka 4,48,17,398Kerala 2,90,11,237Pondicherry 7,89,416
3.2.3 Spacio Temporal Data:If the data collected is connected to the time as well as place
then it is known as spacio temporal data.Example 3:
PopulationState1981 1991
Tamil Nadu 4,82,97,456 5,56,38,318Andhra Pradesh 5,34,03,619 6,63,04,854Karnataka 3,70,43,451 4,48,17,398Kerala 2,54,03,217 2,90,11,237Pondicherry 6,04,136 7,89,416
3.3 Categories of data:Any statistical data can be classified under two categories
depending upon the sources utilized.These categories are,
1. Primary data 2. Secondary data
3.3.1 Primary data:Primary data is the one, which is collected by the
investigator himself for the purpose of a specific inquiry or study.Such data is original in character and is generated by surveyconducted by individuals or research institution or anyorganisation.
31
Example 4:If a researcher is interested to know the impact of noon-
meal scheme for the school children, he has to undertake a surveyand collect data on the opinion of parents and children by askingrelevant questions. Such a data collected for the purpose is calledprimary data.
The primary data can be collected by the following fivemethods.
1. Direct personal interviews.2. Indirect Oral interviews.3. Information from correspondents.4. Mailed questionnaire method.5. Schedules sent through enumerators.
1. Direct personal interviews:The persons from whom informations are collected are
known as informants. The investigator personally meets them andasks questions to gather the necessary informations. It is thesuitable method for intensive rather than extensive field surveys. Itsuits best for intensive study of the limited field.Merits:
1. People willingly supply informations because they areapproached personally. Hence, more response noticed inthis method than in any other method.
2. The collected informations are likely to be uniform andaccurate. The investigator is there to clear the doubts of theinformants.
3. Supplementary informations on informant’ s personalaspects can be noted. Informations on character andenvironment may help later to interpret some of the results.
4. Answers for questions about which the informant is likelyto be sensitive can be gathered by this method.
5. The wordings in one or more questions can be altered to suitany informant. Explanations may be given in otherlanguages also. Inconvenience and misinterpretations arethereby avoided.
32
Limitations:1. It is very costly and time consuming.2. It is very difficult, when the number of persons to be
interviewed is large and the persons are spread over a widearea.
3. Personal prejudice and bias are greater under this method.
2. Indirect Oral Interviews: Under this method the investigator contacts witnesses orneighbours or friends or some other third parties who are capable ofsupplying the necessary information. This method is preferred ifthe required information is on addiction or cause of fire or theft ormurder etc., If a fire has broken out a certain place, the personsliving in neighbourhood and witnesses are likely to giveinformation on the cause of fire. In some cases, police interrogatedthird parties who are supposed to have knowledge of a theft or amurder and get some clues. Enquiry committees appointed bygovernments generally adopt this method and get people’ s viewsand all possible details of facts relating to the enquiry. This methodis suitable whenever direct sources do not exists or cannot be reliedupon or would be unwilling to part with the information.
The validity of the results depends upon a few factors, suchas the nature of the person whose evidence is being recorded, theability of the interviewer to draw out information from the thirdparties by means of appropriate questions and cross examinations,and the number of persons interviewed. For the success of thismethod one person or one group alone should not be relied upon.
3. Information from correspondents:The investigator appoints local agents or correspondents in
different places and compiles the information sent by them.Informations to Newspapers and some departments of Governmentcome by this method. The advantage of this method is that it ischeap and appropriate for extensive investigations. But it may notensure accurate results because the correspondents are likely to benegligent, prejudiced and biased. This method is adopted in thosecases where informations are to be collected periodically from awide area for a long time.
33
4. Mailed questionnaire method:Under this method a list of questions is prepared and is sent
to all the informants by post. The list of questions is technicallycalled questionnaire. A covering letter accompanying thequestionnaire explains the purpose of the investigation and theimportance of correct informations and request the informants tofill in the blank spaces provided and to return the form within aspecified time. This method is appropriate in those cases where theinformants are literates and are spread over a wide area.Merits:
1. It is relatively cheap.2. It is preferable when the informants are spread over the
wide area.Limitations:
1. The greatest limitation is that the informants should beliterates who are able to understand and reply the questions.
2. It is possible that some of the persons who receive thequestionnaires do not return them.
3. It is difficult to verify the correctness of the informationsfurnished by the respondents.With the view of minimizing non-respondents and
collecting correct information, the questionnaire should becarefully drafted. There is no hard and fast rule. But the followinggeneral principles may be helpful in framing the questionnaire. Acovering letter and a self addressed and stamped envelope shouldaccompany the questionnaire. The covering letter should politelypoint out the purpose of the survey and privilege of the respondentwho is one among the few associated with the investigation. Itshould assure that the informations would be kept confidential andwould never be misused. It may promise a copy of the findings orfree gifts or concessions etc.,
Characteristics of a good questionnaire:1. Number of questions should be minimum.2. Questions should be in logical orders, moving from easy to
more difficult questions.
34
3. Questions should be short and simple. Technical terms andvague expressions capable of different interpretationsshould be avoided.
4. Questions fetching YES or NO answers are preferable.There may be some multiple choice questions requiringlengthy answers are to be avoided.
5. Personal questions and questions which require memorypower and calculations should also be avoided.
6. Question should enable cross check. Deliberate orunconscious mistakes can be detected to an extent.
7. Questions should be carefully framed so as to cover theentire scope of the survey.
8. The wording of the questions should be proper withouthurting the feelings or arousing resentment.
9. As far as possible confidential informations should not besought.
10. Physical appearance should be attractive, sufficient spaceshould be provided for answering each questions.
5. Schedules sent through Enumerators:Under this method enumerators or interviewers take the
schedules, meet the informants and filling their replies. Oftendistinction is made between the schedule and a questionnaire. Aschedule is filled by the interviewers in a face-to-face situation withthe informant. A questionnaire is filled by the informant which hereceives and returns by post. It is suitable for extensive surveys.Merits:
1. It can be adopted even if the informants are illiterates.2. Answers for questions of personal and pecuniary nature can
be collected.3. Non-response is minimum as enumerators go personally
and contact the informants.4. The informations collected are reliable. The enumerators
can be properly trained for the same.5. It is most popular methods.
Limitations:1. It is the costliest method.
35
2. Extensive training is to be given to the enumerators forcollecting correct and uniform informations.
3. Interviewing requires experience. Unskilled investigatorsare likely to fail in their work.Before the actual survey, a pilot survey is conducted. The
questionnaire/Schedule is pre-tested in a pilot survey. A fewamong the people from whom actual information is needed areasked to reply. If they misunderstand a question or find it difficultto answer or do not like its wordings etc., it is to be altered. Furtherit is to be ensured that every questions fetches the desired answer.
Merits and Demerits of primary data:1. The collection of data by the method of personal survey is
possible only if the area covered by the investigator issmall. Collection of data by sending the enumerator isbound to be expensive. Care should be taken twice thatthe enumerator record correct information provided by theinformants.
2. Collection of primary data by framing a schedules ordistributing and collecting questionnaires by post is lessexpensive and can be completed in shorter time.
3. Suppose the questions are embarrassing or of complicatednature or the questions probe into personnel affairs ofindividuals, then the schedules may not be filled withaccurate and correct information and hence this method isunsuitable.
4. The information collected for primary data is merereliable than those collected from the secondary data.
3.3.2 Secondary Data:Secondary data are those data which have been already
collected and analysed by some earlier agency for its own use; andlater the same data are used by a different agency. According toW.A.Neiswanger, ‘ A primary source is a publication in which thedata are published by the same authority which gathered andanalysed them. A secondary source is a publication, reporting thedata which have been gathered by other authorities and for whichothers are responsible’ .

36
Sources of Secondary data:In most of the studies the investigator finds it impracticable
to collect first-hand information on all related issues and as such hemakes use of the data collected by others. There is a vast amountof published information from which statistical studies may bemade and fresh statistics are constantly in a state of production.The sources of secondary data can broadly be classified under twoheads:
1. Published sources, and2. Unpublished sources.
1. Published Sources:The various sources of published data are:
1. Reports and official publications of(i) International bodies such as the International Monetary
Fund, International Finance Corporation and UnitedNations Organisation.
(ii) Central and State Governments such as the Report of theTandon Committee and Pay Commission.
2. Semi-official publication of various local bodies such asMunicipal Corporations and District Boards.
3. Private publications-such as the publications of –(i) Trade and professional bodies such as the Federation of
Indian Chambers of Commerce and Institute ofChartered Accountants.
(ii) Financial and economic journals such as ‘ Commerce’ ,‘ Capital’ and ‘ Indian Finance’ .
(iii) Annual reports of joint stock companies.(iv) Publications brought out by research agencies, research scholars, etc.It should be noted that the publications mentioned above
vary with regard to the periodically of publication. Some arepublished at regular intervals (yearly, monthly, weekly etc.,)whereas others are ad hoc publications, i.e., with no regularityabout periodicity of publications.Note: A lot of secondary data is available in the internet. We canaccess it at any time for the further studies.
37
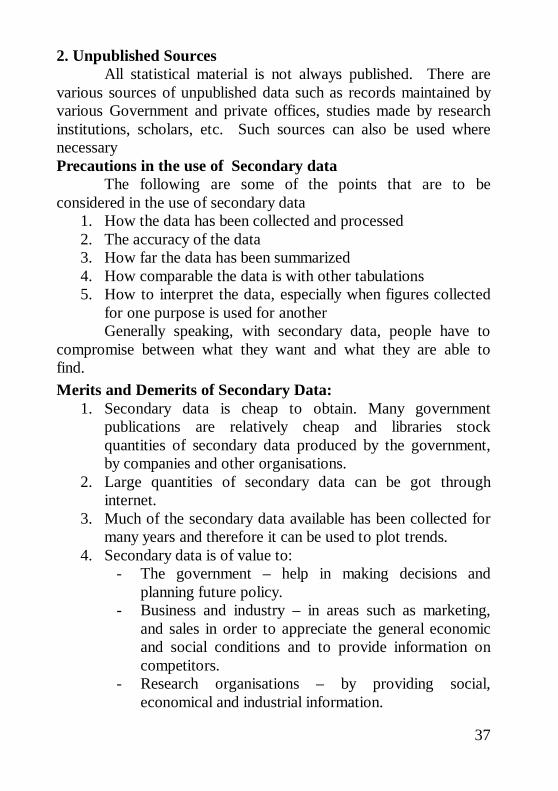
2. Unpublished SourcesAll statistical material is not always published. There are
various sources of unpublished data such as records maintained byvarious Government and private offices, studies made by researchinstitutions, scholars, etc. Such sources can also be used wherenecessaryPrecautions in the use of Secondary data
The following are some of the points that are to beconsidered in the use of secondary data
1. How the data has been collected and processed2. The accuracy of the data3. How far the data has been summarized4. How comparable the data is with other tabulations5. How to interpret the data, especially when figures collected
for one purpose is used for anotherGenerally speaking, with secondary data, people have to
compromise between what they want and what they are able tofind.Merits and Demerits of Secondary Data:
1. Secondary data is cheap to obtain. Many governmentpublications are relatively cheap and libraries stockquantities of secondary data produced by the government,by companies and other organisations.
2. Large quantities of secondary data can be got throughinternet.
3. Much of the secondary data available has been collected formany years and therefore it can be used to plot trends.
4. Secondary data is of value to:- The government – help in making decisions and
planning future policy.- Business and industry – in areas such as marketing,
and sales in order to appreciate the general economicand social conditions and to provide information oncompetitors.
- Research organisations – by providing social,economical and industrial information.
38
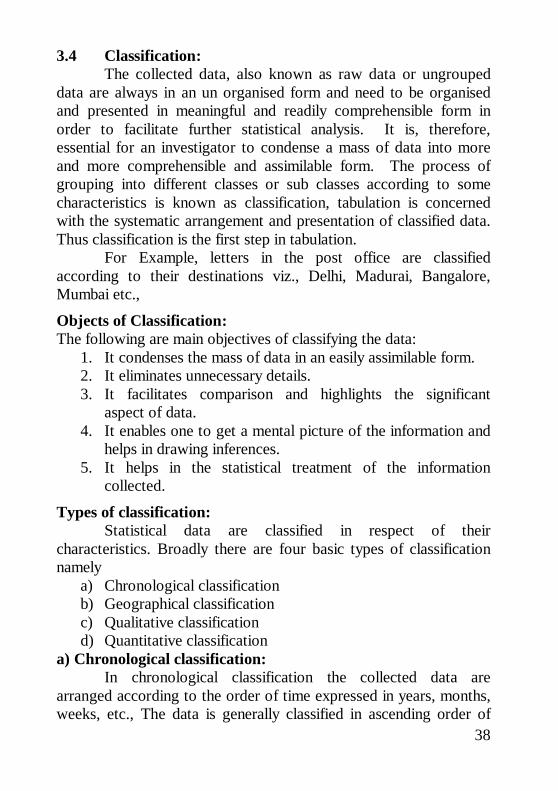
3.4 Classification:The collected data, also known as raw data or ungrouped
data are always in an un organised form and need to be organisedand presented in meaningful and readily comprehensible form inorder to facilitate further statistical analysis. It is, therefore,essential for an investigator to condense a mass of data into moreand more comprehensible and assimilable form. The process ofgrouping into different classes or sub classes according to somecharacteristics is known as classification, tabulation is concernedwith the systematic arrangement and presentation of classified data.Thus classification is the first step in tabulation.
For Example, letters in the post office are classifiedaccording to their destinations viz., Delhi, Madurai, Bangalore,Mumbai etc.,
Objects of Classification:The following are main objectives of classifying the data:
1. It condenses the mass of data in an easily assimilable form.2. It eliminates unnecessary details.3. It facilitates comparison and highlights the significant
aspect of data.4. It enables one to get a mental picture of the information and
helps in drawing inferences.5. It helps in the statistical treatment of the information
collected.
Types of classification:Statistical data are classified in respect of their
characteristics. Broadly there are four basic types of classificationnamely
a) Chronological classificationb) Geographical classificationc) Qualitative classificationd) Quantitative classification
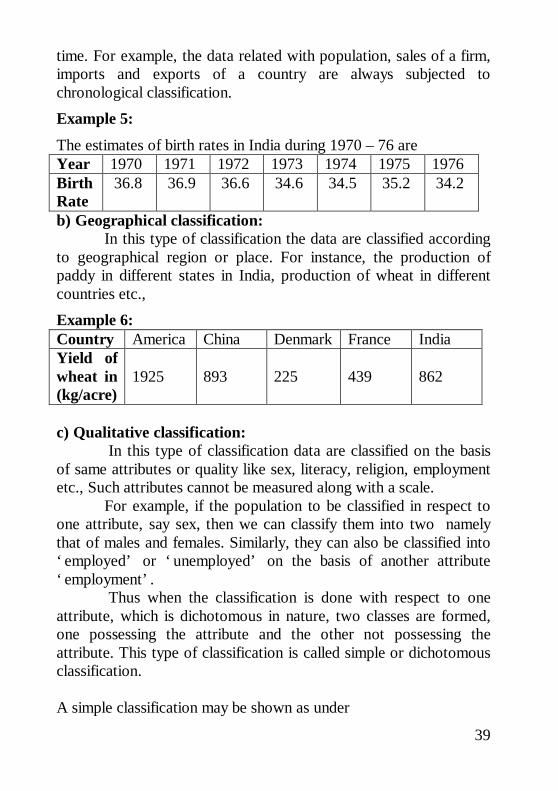
a) Chronological classification:In chronological classification the collected data are
arranged according to the order of time expressed in years, months,weeks, etc., The data is generally classified in ascending order of
39
time. For example, the data related with population, sales of a firm,imports and exports of a country are always subjected tochronological classification.Example 5:
The estimates of birth rates in India during 1970 – 76 areYear 1970 1971 1972 1973 1974 1975 1976BirthRate
36.8 36.9 36.6 34.6 34.5 35.2 34.2
b) Geographical classification:In this type of classification the data are classified according
to geographical region or place. For instance, the production ofpaddy in different states in India, production of wheat in differentcountries etc.,Example 6:Country America China Denmark France IndiaYield ofwheat in(kg/acre)
1925 893 225 439 862
c) Qualitative classification: In this type of classification data are classified on the basis
of same attributes or quality like sex, literacy, religion, employmentetc., Such attributes cannot be measured along with a scale.
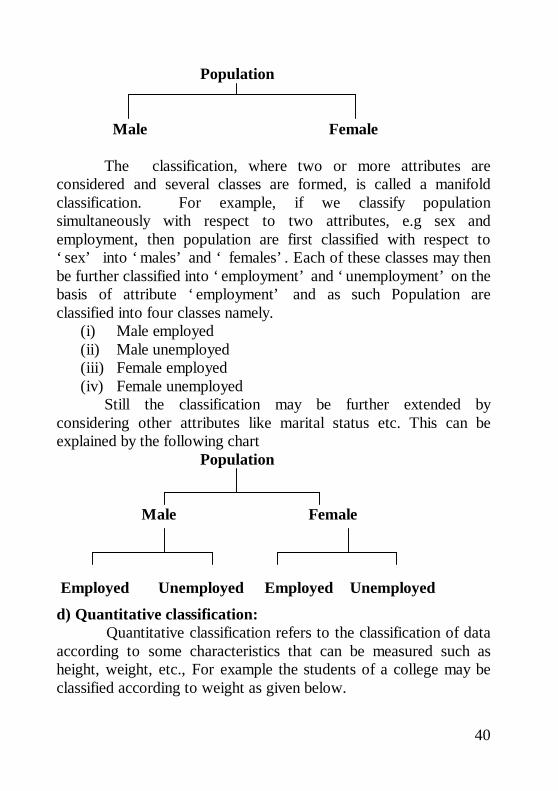
For example, if the population to be classified in respect toone attribute, say sex, then we can classify them into two namelythat of males and females. Similarly, they can also be classified into‘ employed’ or ‘ unemployed’ on the basis of another attribute‘ employment’ .
Thus when the classification is done with respect to oneattribute, which is dichotomous in nature, two classes are formed,one possessing the attribute and the other not possessing theattribute. This type of classification is called simple or dichotomousclassification.
A simple classification may be shown as under
40
Population
Male Female
The classification, where two or more attributes areconsidered and several classes are formed, is called a manifoldclassification. For example, if we classify populationsimultaneously with respect to two attributes, e.g sex andemployment, then population are first classified with respect to‘ sex’ into ‘ males’ and ‘ females’ . Each of these classes may thenbe further classified into ‘ employment’ and ‘ unemployment’ on thebasis of attribute ‘ employment’ and as such Population areclassified into four classes namely.
(i) Male employed(ii) Male unemployed(iii) Female employed(iv) Female unemployed
Still the classification may be further extended byconsidering other attributes like marital status etc. This can beexplained by the following chart
Population
Male Female
Employed Unemployed Employed Unemployed
d) Quantitative classification: Quantitative classification refers to the classification of dataaccording to some characteristics that can be measured such asheight, weight, etc., For example the students of a college may beclassified according to weight as given below.
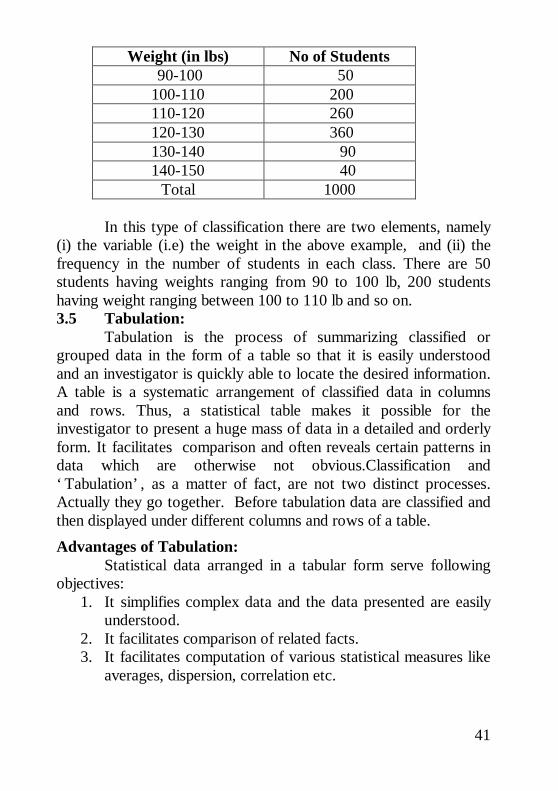
41
Weight (in lbs) No of Students 90-100 50100-110 200110-120 260120-130 360130-140 90140-150 40
Total 1000
In this type of classification there are two elements, namely(i) the variable (i.e) the weight in the above example, and (ii) thefrequency in the number of students in each class. There are 50students having weights ranging from 90 to 100 lb, 200 studentshaving weight ranging between 100 to 110 lb and so on.3.5 Tabulation:
Tabulation is the process of summarizing classified orgrouped data in the form of a table so that it is easily understoodand an investigator is quickly able to locate the desired information.A table is a systematic arrangement of classified data in columnsand rows. Thus, a statistical table makes it possible for theinvestigator to present a huge mass of data in a detailed and orderlyform. It facilitates comparison and often reveals certain patterns indata which are otherwise not obvious.Classification and‘ Tabulation’ , as a matter of fact, are not two distinct processes.Actually they go together. Before tabulation data are classified andthen displayed under different columns and rows of a table.Advantages of Tabulation:
Statistical data arranged in a tabular form serve followingobjectives:
1. It simplifies complex data and the data presented are easilyunderstood.
2. It facilitates comparison of related facts.3. It facilitates computation of various statistical measures like
averages, dispersion, correlation etc.
42
4. It presents facts in minimum possible space andunnecessary repetitions and explanations are avoided.Moreover, the needed information can be easily located.
5. Tabulated data are good for references and they make iteasier to present the information in the form of graphs anddiagrams.
Preparing a Table:The making of a compact table itself an art. This should
contain all the information needed within the smallest possiblespace. What the purpose of tabulation is and how the tabulatedinformation is to be used are the main points to be kept in mindwhile preparing for a statistical table. An ideal table should consistof the following main parts:
1. Table number2. Title of the table3. Captions or column headings4. Stubs or row designation5. Body of the table6. Footnotes
7. Sources of data
Table Number:A table should be numbered for easy reference and
identification. This number, if possible, should be written in thecentre at the top of the table. Sometimes it is also written justbefore the title of the table.Title:
A good table should have a clearly worded, brief butunambiguous title explaining the nature of data contained in thetable. It should also state arrangement of data and the periodcovered. The title should be placed centrally on the top of a tablejust below the table number (or just after table number in the sameline).
Captions or column Headings:Captions in a table stands for brief and self explanatory
headings of vertical columns. Captions may involve headings and
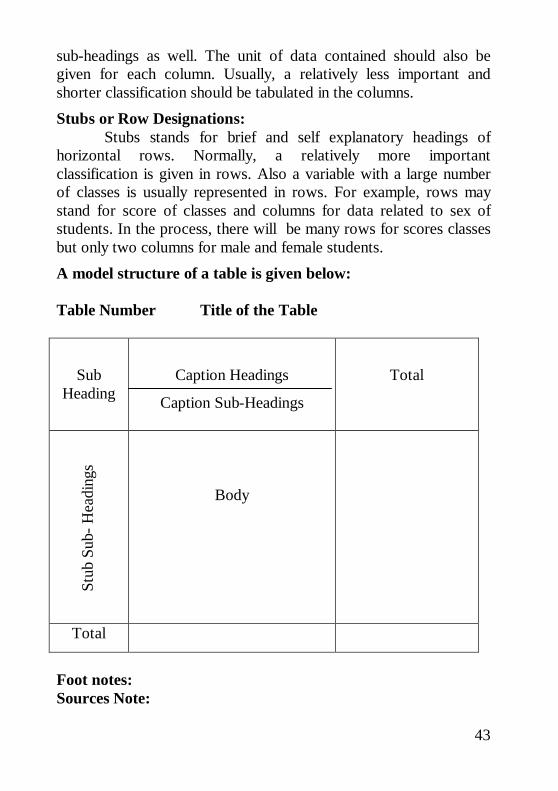
43
sub-headings as well. The unit of data contained should also begiven for each column. Usually, a relatively less important andshorter classification should be tabulated in the columns.Stubs or Row Designations:
Stubs stands for brief and self explanatory headings ofhorizontal rows. Normally, a relatively more importantclassification is given in rows. Also a variable with a large numberof classes is usually represented in rows. For example, rows maystand for score of classes and columns for data related to sex ofstudents. In the process, there will be many rows for scores classesbut only two columns for male and female students.A model structure of a table is given below:
Table Number Title of the Table
SubHeading
Caption Headings
Caption Sub-Headings
Total
Body
Total
Foot notes:Sources Note:
Stub
Sub
- Hea
ding
s
44
Body:The body of the table contains the numerical information of
frequency of observations in the different cells. This arrangementof data is according to the discription of captions and stubs.
Footnotes:Footnotes are given at the foot of the table for explanation
of any fact or information included in the table which needs someexplanation. Thus, they are meant for explaining or providingfurther details about the data, that have not been covered in title,captions and stubs.
Sources of data:Lastly one should also mention the source of information
from which data are taken. This may preferably include the nameof the author, volume, page and the year of publication. This shouldalso state whether the data contained in the table is of ‘ primary orsecondary’ nature.
Requirements of a Good Table:A good statistical table is not merely a careless grouping of
columns and rows but should be such that it summarizes the totalinformation in an easily accessible form in minimum possiblespace. Thus while preparing a table, one must have a clear idea ofthe information to be presented, the facts to be compared and hepoints to be stressed.
Though, there is no hard and fast rule for forming a tableyet a few general point should be kept in mind:
1. A table should be formed in keeping with the objects ofstatistical enquiry.
2. A table should be carefully prepared so that it is easilyunderstandable.
3. A table should be formed so as to suit the size of the paper.But such an adjustment should not be at the cost oflegibility.
4. If the figures in the table are large, they should be suitablyrounded or approximated. The method of approximationand units of measurements too should be specified.
45
5. Rows and columns in a table should be numbered andcertain figures to be stressed may be put in ‘ box’ or ‘ circle’or in bold letters.
6. The arrangements of rows and columns should be in alogical and systematic order. This arrangement may bealphabetical, chronological or according to size.
7. The rows and columns are separated by single, double orthick lines to represent various classes and sub-classes used.The corresponding proportions or percentages should begiven in adjoining rows and columns to enable comparison.A vertical expansion of the table is generally moreconvenient than the horizontal one.
8. The averages or totals of different rows should be given atthe right of the table and that of columns at the bottom ofthe table. Totals for every sub-class too should bementioned.
9. In case it is not possible to accommodate all the informationin a single table, it is better to have two or more relatedtables.
Type of Tables:Tables can be classified according to their purpose, stage of
enquiry, nature of data or number of characteristics used. On thebasis of the number of characteristics, tables may be classified asfollows:
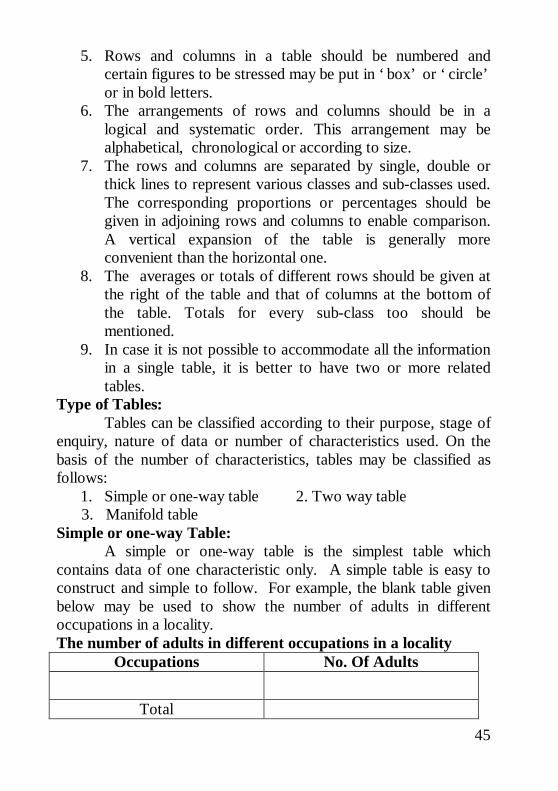
1. Simple or one-way table 2. Two way table 3. Manifold tableSimple or one-way Table:
A simple or one-way table is the simplest table whichcontains data of one characteristic only. A simple table is easy toconstruct and simple to follow. For example, the blank table givenbelow may be used to show the number of adults in differentoccupations in a locality.The number of adults in different occupations in a locality
Occupations No. Of Adults
Total
46
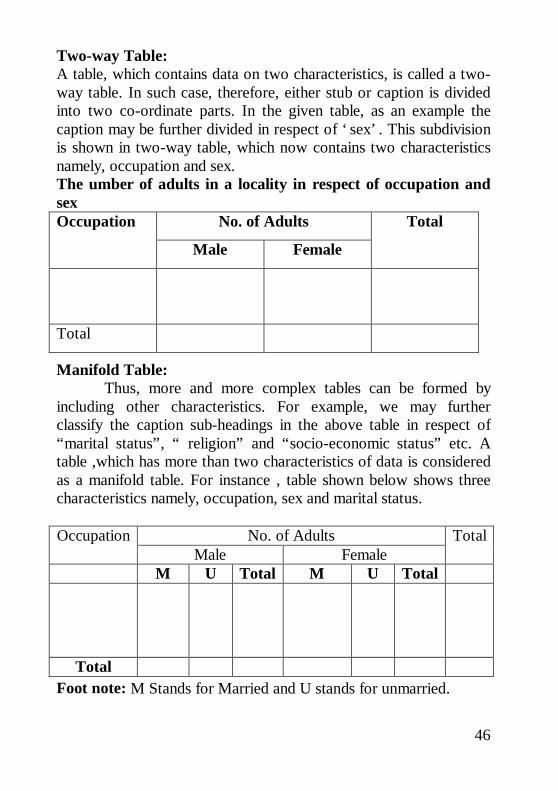
Two-way Table:A table, which contains data on two characteristics, is called a two-way table. In such case, therefore, either stub or caption is dividedinto two co-ordinate parts. In the given table, as an example thecaption may be further divided in respect of ‘ sex’ . This subdivisionis shown in two-way table, which now contains two characteristicsnamely, occupation and sex.The umber of adults in a locality in respect of occupation andsex
No. of AdultsOccupation
Male Female
Total
Total
Manifold Table:Thus, more and more complex tables can be formed by
including other characteristics. For example, we may furtherclassify the caption sub-headings in the above table in respect of“marital status”, “ religion” and “socio-economic status” etc. Atable ,which has more than two characteristics of data is consideredas a manifold table. For instance , table shown below shows threecharacteristics namely, occupation, sex and marital status.
No. of AdultsOccupationMale Female
Total
M U Total M U Total
TotalFoot note: M Stands for Married and U stands for unmarried.
47
Manifold tables, though complex are good in practice asthese enable full information to be incorporated and facilitateanalysis of all related facts. Still, as a normal practice, not morethan four characteristics should be represented in one table to avoidconfusion. Other related tables may be formed to show theremaining characteristics
Exercise - 3I. Choose the best answer:
1.When the collected data is grouped with reference to time, we have
a) Quantitative classification b) Qualitative classification c) Geographical Classification d) Chorological Classification
2. Most quantitative classifications are a) Chronological b) Geographical
c) Frequency Distribution d) None of these 3.Caption stands for
a) A numerical information b) The column headings c) The row headings d) The table headings
4. A simple table contains data on a) Two characteristics b) Several characteristics c) One characteristic d) Three characteristics
5. The headings of the rows given in the first column of a table are called
a) Stubs b) Captionsc) Titles d) Reference notes
II. Fill in the blanks:6. Geographical classification means, classification of data according to _______.7. The data recorded according to standard of education like
illiterate, primary, secondary, graduate, technical etc, willbe known as _______ classification.
8. An arrangement of data into rows and columns is known as_______.
9. Tabulation follows ______.10. In a manifold table we have data on _______.
48
III. Answer the following questions:11. Define three types of data.12. Define primary and secondary data.13. What are the points that are to be considered in the use of
secondary data?14. What are the sources of secondary data?15. Give the merits and demerits of primary data.16. State the characteristics of a good questionnaire.17. Define classification.18. What are the main objects of classification?19. Write a detail note on the types of classification.20. Define tabulation.21. Give the advantages of tabulation.22. What are the main parts of an ideal table? Explain.23. What are the essential characteristics of a good table?24. Define one-way and two-way table.25. Explain manifold table with example.
IV. Suggested Activities:26. Collect a primary data about the mode of transport of your
school students. Classify the data and tabulate it.27. Collect the important and relevant tables from various
sources and include these in your album note book.
Answers:1. (d) 2. (c) 3. (b) 4. ( c) 5. (a)6. Place7. Qualitative8. Tabulation9. Classification10. More than two characteristics
68
5. DIAGRAMATIC AND GRAPHICALREPRESENTATION
5.1 Introduction:In the previous chapter, we have discussed the techniques of
classification and tabulation that help in summarising the collecteddata and presenting them in a systematic manner. However, theseforms of presentation do not always prove to be interesting to thecommon man. One of the most convincing and appealing ways inwhich statistical results may be presented is through diagrams andgraphs. Just one diagram is enough to represent a given data moreeffectively than thousand words.
Moreover even a layman who has nothing to do withnumbers can also understands diagrams. Evidence of this can befound in newspapers, magazines, journals, advertisement, etc. Anattempt is made in this chapter to illustrate some of the major typesof diagrams and graphs frequently used in presenting statisticaldata.5.2 Diagrams:
A diagram is a visual form for presentation of statisticaldata, highlighting their basic facts and relationship. If we drawdiagrams on the basis of the data collected they will easily beunderstood and appreciated by all. It is readily intelligible and savea considerable amount of time and energy.5.3 Significance of Diagrams and Graphs:
Diagrams and graphs are extremely useful because of thefollowing reasons.
1. They are attractive and impressive.2. They make data simple and intelligible.3. They make comparison possible4. They save time and labour.5. They have universal utility.6. They give more information.7. They have a great memorizing effect.
69
5.4 General rules for constructing diagrams:The construction of diagrams is an art, which can be acquired
through practice. However, observance of some general guidelinescan help in making them more attractive and effective. Thediagrammatic presentation of statistical facts will be advantageousprovided the following rules are observed in drawing diagrams.
1. A diagram should be neatly drawn and attractive.2. The measurements of geometrical figures used in diagram
should be accurate and proportional.3. The size of the diagrams should match the size of the paper.4. Every diagram must have a suitable but short heading.5. The scale should be mentioned in the diagram.6. Diagrams should be neatly as well as accurately drawn with
the help of drawing instruments.7. Index must be given for identification so that the reader can
easily make out the meaning of the diagram.8. Footnote must be given at the bottom of the diagram.9. Economy in cost and energy should be exercised in drawing
diagram.5.5 Types of diagrams:
In practice, a very large variety of diagrams are in use andnew ones are constantly being added. For the sake of convenienceand simplicity, they may be divided under the following heads:
1. One-dimensional diagrams2. Two-dimensional diagrams3. Three-dimensional diagrams4. Pictograms and Cartograms
5.5.1 One-dimensional diagrams:In such diagrams, only one-dimensional measurement, i.e
height is used and the width is not considered. These diagrams arein the form of bar or line charts and can be classified as
1. Line Diagram2. Simple Diagram3. Multiple Bar Diagram4. Sub-divided Bar Diagram5. Percentage Bar Diagram
70
Line Diagram:Line diagram is used in case where there are many items to be
shown and there is not much of difference in their values. Suchdiagram is prepared by drawing a vertical line for each itemaccording to the scale. The distance between lines is kept uniform.Line diagram makes comparison easy, but it is less attractive.Example 1:Show the following data by a line chart:No. of children 0 1 2 3 4 5Frequency 10 14 9 6 4 2
Line Diagram
02468
10121416
0 1 2 3 4 5 6
No. of Children
Freq
uenc
y
Simple Bar Diagram:Simple bar diagram can be drawn either on horizontal or
vertical base, but bars on horizontal base more common. Bars mustbe uniform width and intervening space between bars must beequal.While constructing a simple bar diagram, the scale isdetermined on the basis of the highest value in the series.
To make the diagram attractive, the bars can be coloured.Bar diagram are used in business and economics. However, animportant limitation of such diagrams is that they can present onlyone classification or one category of data. For example, whilepresenting the population for the last five decades, one can onlydepict the total population in the simple bar diagrams, and not itssex-wise distribution.
71
Example 2:Represent the following data by a bar diagram.
YearProduction(in tones)
1991 451992 401993 421994 551995 50
Solution:
0
10
20
30
40
50
60
Prod
uctio
n (i
n to
nnes
)
1991 1992 1993 1994 1995
Year
Simple Bar Diagram
Multiple Bar Diagram:Multiple bar diagram is used for comparing two or more
sets of statistical data. Bars are constructed side by side torepresent the set of values for comparison. In order to distinguishbars, they may be either differently coloured or there should bedifferent types of crossings or dotting, etc. An index is alsoprepared to identify the meaning of different colours or dottings.
72
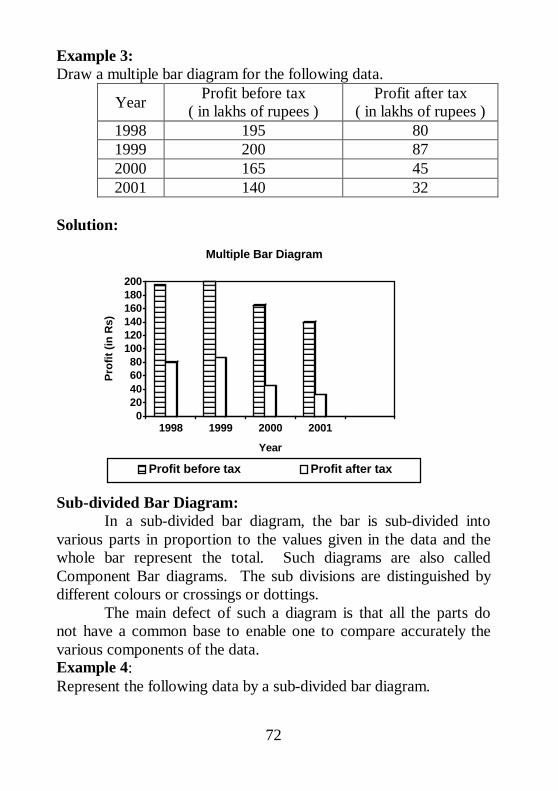
Example 3:Draw a multiple bar diagram for the following data.
Year Profit before tax( in lakhs of rupees )
Profit after tax( in lakhs of rupees )
1998 195 801999 200 872000 165 452001 140 32
Solution:
020406080
100120140160180200
Prof
it (in
Rs)
1998 1999 2000 2001
Year
Multiple Bar Diagram
Profit before tax Profit after tax
Sub-divided Bar Diagram:In a sub-divided bar diagram, the bar is sub-divided into
various parts in proportion to the values given in the data and thewhole bar represent the total. Such diagrams are also calledComponent Bar diagrams. The sub divisions are distinguished bydifferent colours or crossings or dottings.
The main defect of such a diagram is that all the parts donot have a common base to enable one to compare accurately thevarious components of the data.Example 4:Represent the following data by a sub-divided bar diagram.
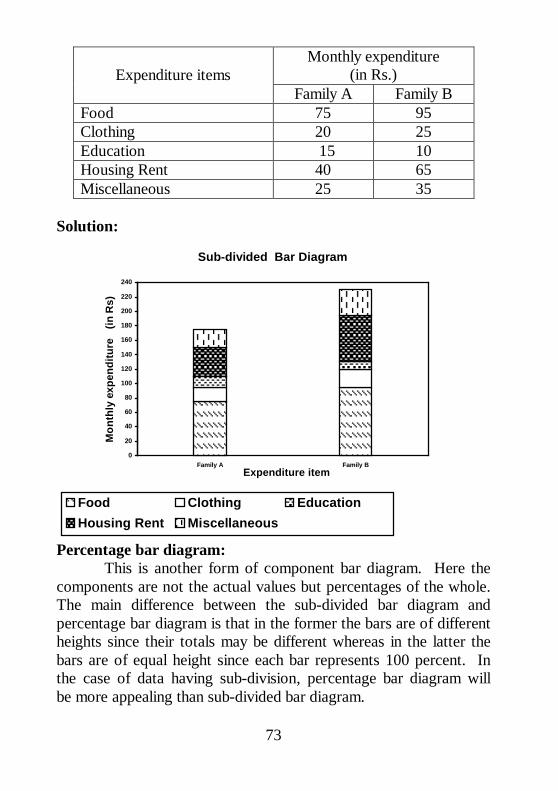
73
Monthly expenditure(in Rs.)Expenditure items
Family A Family BFood 75 95Clothing 20 25Education 15 10Housing Rent 40 65Miscellaneous 25 35
Solution:
Sub-divided Bar Diagram
0
20
40
60
80
100
120
140
160
180
200
220
240
Family A Family BExpenditure item
Mon
thly
exp
endi
ture
(in
Rs)
Food Clothing EducationHousing Rent Miscellaneous
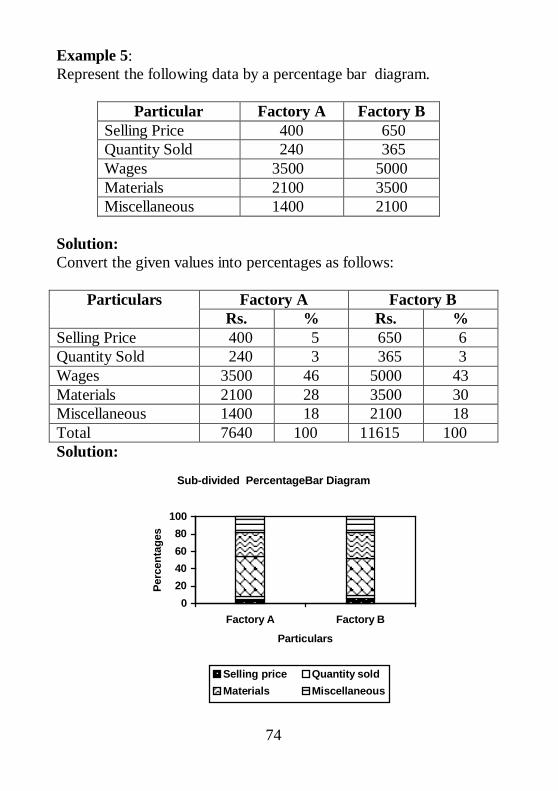
Percentage bar diagram:This is another form of component bar diagram. Here the
components are not the actual values but percentages of the whole.The main difference between the sub-divided bar diagram andpercentage bar diagram is that in the former the bars are of differentheights since their totals may be different whereas in the latter thebars are of equal height since each bar represents 100 percent. Inthe case of data having sub-division, percentage bar diagram willbe more appealing than sub-divided bar diagram.
74
Example 5:Represent the following data by a percentage bar diagram.
Particular Factory A Factory BSelling Price 400 650Quantity Sold 240 365Wages 3500 5000Materials 2100 3500Miscellaneous 1400 2100
Solution:Convert the given values into percentages as follows:
Factory A Factory BParticularsRs. % Rs. %
Selling Price 400 5 650 6Quantity Sold 240 3 365 3Wages 3500 46 5000 43Materials 2100 28 3500 30Miscellaneous 1400 18 2100 18Total 7640 100 11615 100Solution:
Sub-divided PercentageBar Diagram
020406080
100
Factory A Factory BParticulars
Perc
enta
ges
Selling price Quantity soldMaterials Miscellaneous
75
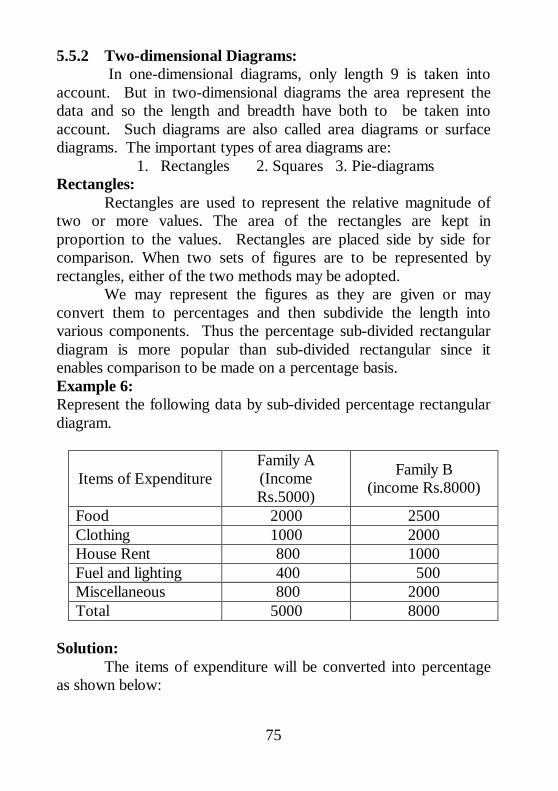
5.5.2 Two-dimensional Diagrams:In one-dimensional diagrams, only length 9 is taken into
account. But in two-dimensional diagrams the area represent thedata and so the length and breadth have both to be taken intoaccount. Such diagrams are also called area diagrams or surfacediagrams. The important types of area diagrams are:
1. Rectangles 2. Squares 3. Pie-diagramsRectangles:
Rectangles are used to represent the relative magnitude oftwo or more values. The area of the rectangles are kept inproportion to the values. Rectangles are placed side by side forcomparison. When two sets of figures are to be represented byrectangles, either of the two methods may be adopted.
We may represent the figures as they are given or mayconvert them to percentages and then subdivide the length intovarious components. Thus the percentage sub-divided rectangulardiagram is more popular than sub-divided rectangular since itenables comparison to be made on a percentage basis.Example 6:Represent the following data by sub-divided percentage rectangulardiagram.
Items of ExpenditureFamily A(IncomeRs.5000)
Family B(income Rs.8000)
Food 2000 2500Clothing 1000 2000House Rent 800 1000Fuel and lighting 400 500Miscellaneous 800 2000Total 5000 8000
Solution:The items of expenditure will be converted into percentage
as shown below:
76
Family A Family BItems of Expenditure Rs. Y Rs. YFood 2000 40 2500 31Clothing 1000 20 2000 25House Rent 800 16 1000 13Fuel and Lighting 400 8 500 6Miscellaneous 800 16 2000 25Total 5000 100 8000 100
SUBDIVIDED PERCENTAGE RECTANGULAR DIAGRAM
0
20
40
60
80
100
120
Family A (0-5000) Family B (0-8000)
Perc
enta
ge
Food Clothing House Rent Fuel and Lighting Miscellaneous
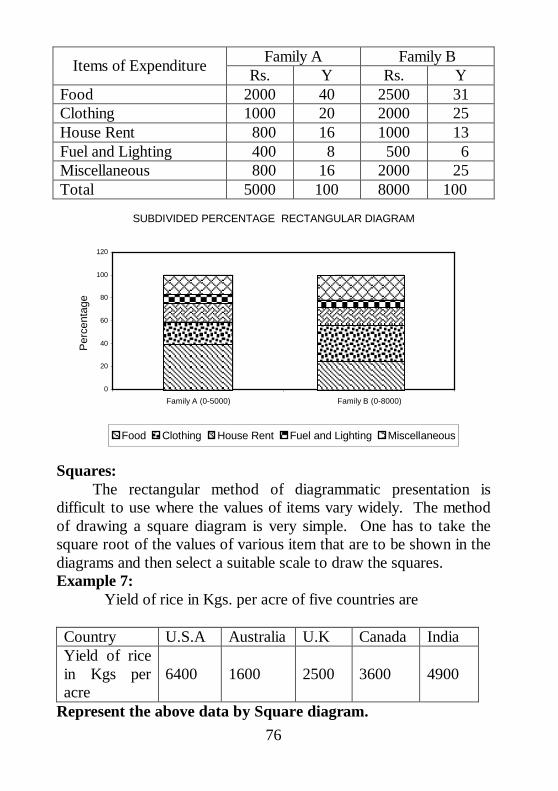
Squares:The rectangular method of diagrammatic presentation is
difficult to use where the values of items vary widely. The methodof drawing a square diagram is very simple. One has to take thesquare root of the values of various item that are to be shown in thediagrams and then select a suitable scale to draw the squares.Example 7:
Yield of rice in Kgs. per acre of five countries are
Country U.S.A Australia U.K Canada IndiaYield of ricein Kgs peracre
6400 1600 2500 3600 4900
Represent the above data by Square diagram.
77
Solution: To draw the square diagram we calculate as follows:Country Yield Square root Side of the
square in cmU.S.A 6400 80 4Australia 1600 40 2U.K. 2500 50 2.5Canada 3600 60 3India 4900 70 3.5
USA AUST UK CANADA INDIA
Pie Diagram or Circular Diagram:Another way of preparing a two-dimensional diagram is in
the form of circles. In such diagrams, both the total and thecomponent parts or sectors can be shown. The area of a circle isproportional to the square of its radius.
While making comparisons, pie diagrams should be used on apercentage basis and not on an absolute basis. In constructing a piediagram the first step is to prepare the data so that variouscomponents values can be transposed into corresponding degreeson the circle.
The second step is to draw a circle of appropriate size with acompass. The size of the radius depends upon the available spaceand other factors of presentation. The third step is to measurepoints on the circle and representing the size of each sector with thehelp of a protractor.
Example 8:Draw a Pie diagram for the following data of production of sugar inquintals of various countries.
4 cm 3.5 cm3 cm2.5 cm2cm
78
Country Production ofSugar (in quintals)
Cuba 62Australia 47India 35Japan 16Egypt 6
Solution:The values are expressed in terms of degree as follows.
Production of Sugar
Country InQuintals In Degrees
Cuba 62 134Australia 47 102India 35 76Japan 16 35Egypt 6 13Total 166 360
Pie Diagram
CubaAustraliaIndiaJapanEgypt
5.5.3 Three-dimensional diagrams:Three-dimensional diagrams, also known as volume diagram,
consist of cubes, cylinders, spheres, etc. In such diagrams threethings, namely length, width and height have to be taken intoaccount. Of all the figures, making of cubes is easy. Side of a cubeis drawn in proportion to the cube root of the magnitude of data.
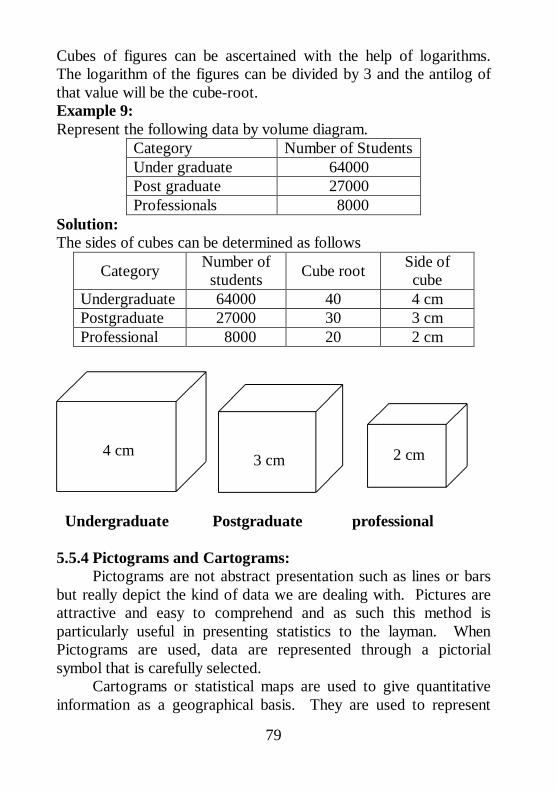
79
Cubes of figures can be ascertained with the help of logarithms.The logarithm of the figures can be divided by 3 and the antilog ofthat value will be the cube-root.Example 9:Represent the following data by volume diagram.
Category Number of StudentsUnder graduate 64000Post graduate 27000Professionals 8000
Solution:The sides of cubes can be determined as follows
Category Number ofstudents Cube root Side of
cubeUndergraduate 64000 40 4 cmPostgraduate 27000 30 3 cmProfessional 8000 20 2 cm
Undergraduate Postgraduate professional
5.5.4 Pictograms and Cartograms:Pictograms are not abstract presentation such as lines or bars
but really depict the kind of data we are dealing with. Pictures areattractive and easy to comprehend and as such this method isparticularly useful in presenting statistics to the layman. WhenPictograms are used, data are represented through a pictorialsymbol that is carefully selected.
Cartograms or statistical maps are used to give quantitativeinformation as a geographical basis. They are used to represent
4 cm 3 cm 2 cm
80
spatial distributions. The quantities on the map can be shown inmany ways such as through shades or colours or dots or placingpictogram in each geographical unit.5.6 Graphs:
A graph is a visual form of presentation of statistical data.A graph is more attractive than a table of figure. Even a commonman can understand the message of data from the graph.Comparisons can be made between two or more phenomena veryeasily with the help of a graph.
However here we shall discuss only some important types ofgraphs which are more popular and they are
1.Histogram 2. Frequency Polygon3.Frequency Curve 4. Ogive 5. Lorenz Curve
5.6.1 Histogram:A histogram is a bar chart or graph showing the frequency of
occurrence of each value of the variable being analysed. Inhistogram, data are plotted as a series of rectangles. Classintervals are shown on the ‘ X-axis’ and the frequencies on the‘ Y-axis’ .
The height of each rectangle represents the frequency of theclass interval. Each rectangle is formed with the other so as to givea continuous picture. Such a graph is also called staircase or blockdiagram.
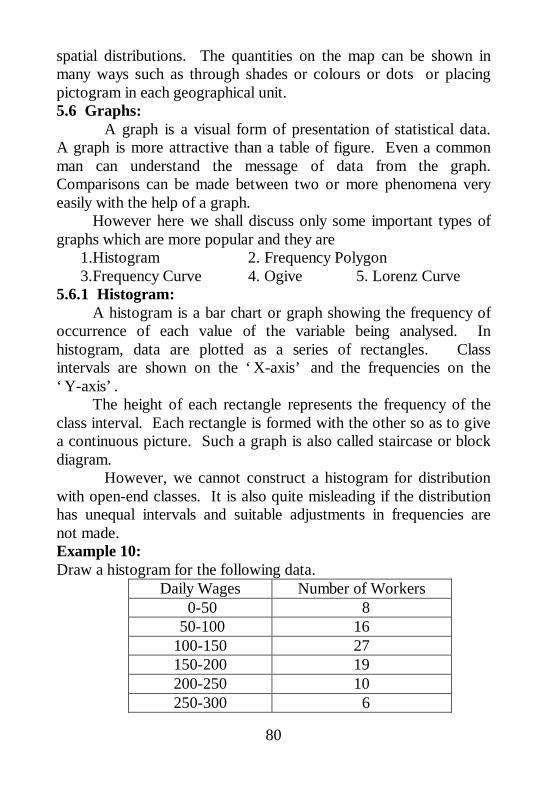
However, we cannot construct a histogram for distributionwith open-end classes. It is also quite misleading if the distributionhas unequal intervals and suitable adjustments in frequencies arenot made.Example 10:Draw a histogram for the following data.
Daily Wages Number of Workers 0-50 8
50-100 16100-150 27150-200 19200-250 10250-300 6
81
Solution:
HISTOGRAM
0
5
10
15
20
25
30
Daily Wages (in Rs.)
Num
ber o
f Wor
kers
50 150 200 250 100
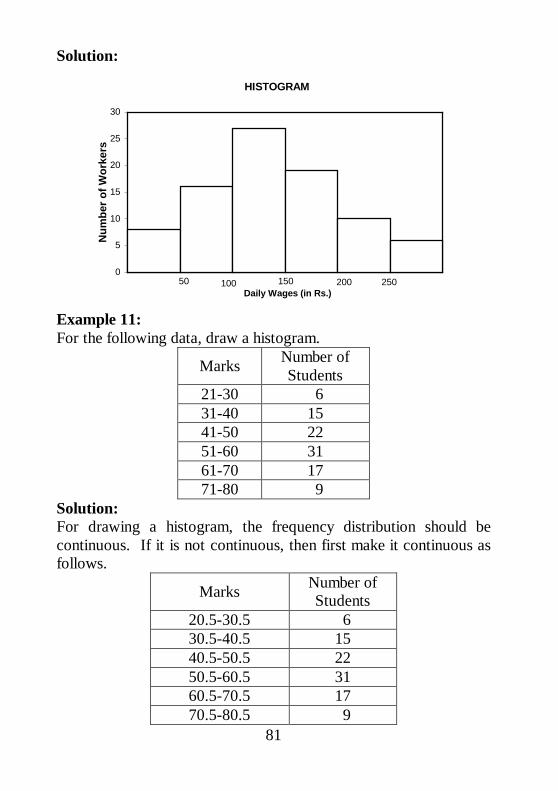
Example 11:For the following data, draw a histogram.
Marks Number ofStudents
21-30 631-40 1541-50 2251-60 3161-70 1771-80 9
Solution:For drawing a histogram, the frequency distribution should becontinuous. If it is not continuous, then first make it continuous asfollows.
Marks Number ofStudents
20.5-30.5 630.5-40.5 1540.5-50.5 2250.5-60.5 3160.5-70.5 1770.5-80.5 9
82
HISTOGRAM
0
5
10
15
20
25
30
35
Marks
Num
ber o
f Stu
dent
s
20.5 30.5 40.5 50.5 60.5 70.5 80.5
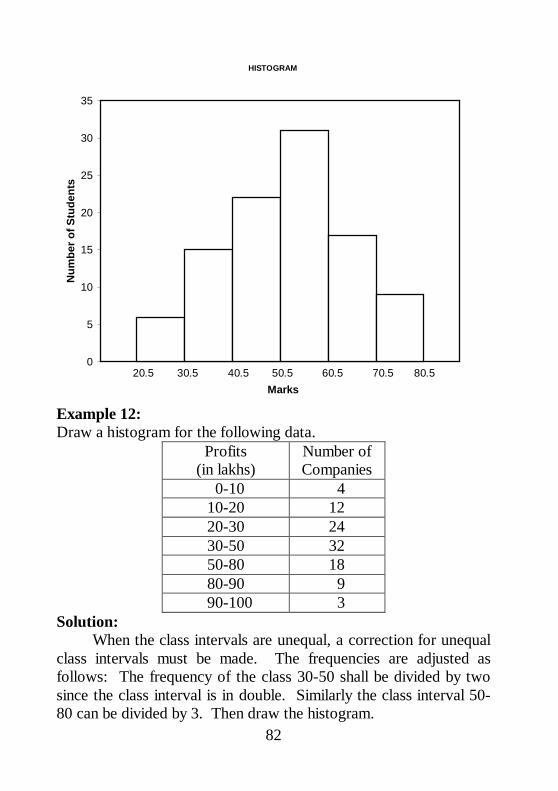
Example 12:Draw a histogram for the following data.
Profits(in lakhs)
Number ofCompanies
0-10 410-20 1220-30 2430-50 3250-80 1880-90 9
90-100 3Solution:
When the class intervals are unequal, a correction for unequalclass intervals must be made. The frequencies are adjusted asfollows: The frequency of the class 30-50 shall be divided by twosince the class interval is in double. Similarly the class interval 50-80 can be divided by 3. Then draw the histogram.
83
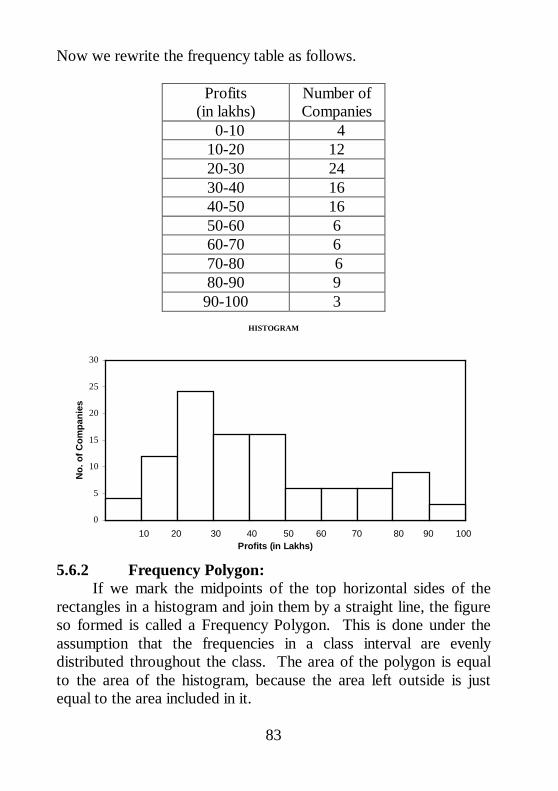
Now we rewrite the frequency table as follows.
Profits(in lakhs)
Number ofCompanies
0-10 410-20 1220-30 2430-40 1640-50 1650-60 660-70 670-80 680-90 9
90-100 3HISTOGRAM
0
5
10
15
20
25
30
Profits (in Lakhs)
No.
of C
ompa
nies
10 20 30 40 50 60 70 80 90 100
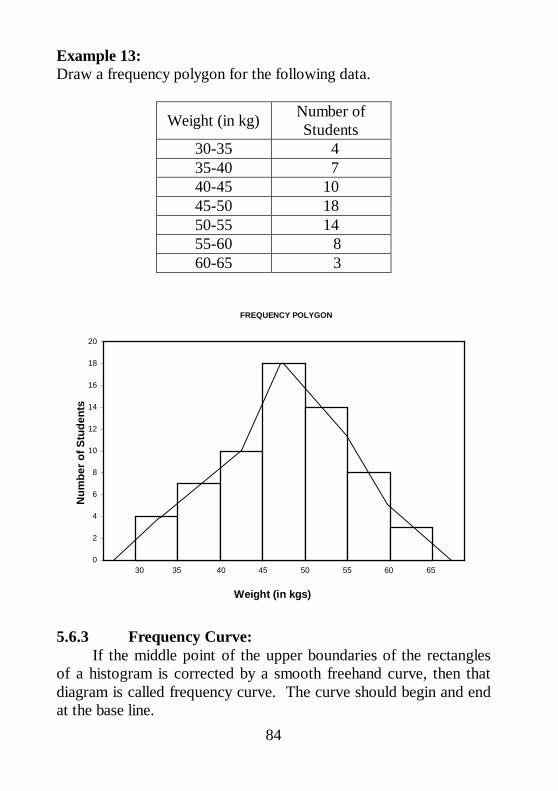
5.6.2 Frequency Polygon:If we mark the midpoints of the top horizontal sides of the
rectangles in a histogram and join them by a straight line, the figureso formed is called a Frequency Polygon. This is done under theassumption that the frequencies in a class interval are evenlydistributed throughout the class. The area of the polygon is equalto the area of the histogram, because the area left outside is justequal to the area included in it.
84
Example 13:Draw a frequency polygon for the following data.
Weight (in kg) Number ofStudents
30-35 435-40 740-45 1045-50 1850-55 1455-60 860-65 3
FREQUENCY POLYGON
0
2
4
6
8
10
12
14
16
18
20
Weight (in kgs)
Num
ber o
f Stu
dent
s
35 40 45 50 55 60 6530
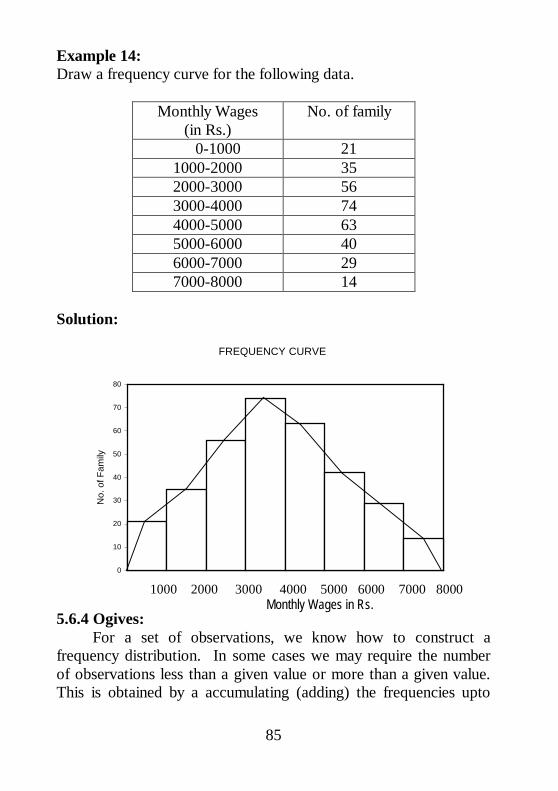
5.6.3 Frequency Curve:If the middle point of the upper boundaries of the rectangles
of a histogram is corrected by a smooth freehand curve, then thatdiagram is called frequency curve. The curve should begin and endat the base line.
85
Example 14:Draw a frequency curve for the following data.
Monthly Wages(in Rs.)
No. of family
0-1000 211000-2000 352000-3000 563000-4000 744000-5000 635000-6000 406000-7000 297000-8000 14
Solution:
FREQUENCY CURVE
0
10
20
30
40
50
60
70
80
Monthly Wages (in Rs.)
No.
of F
amily
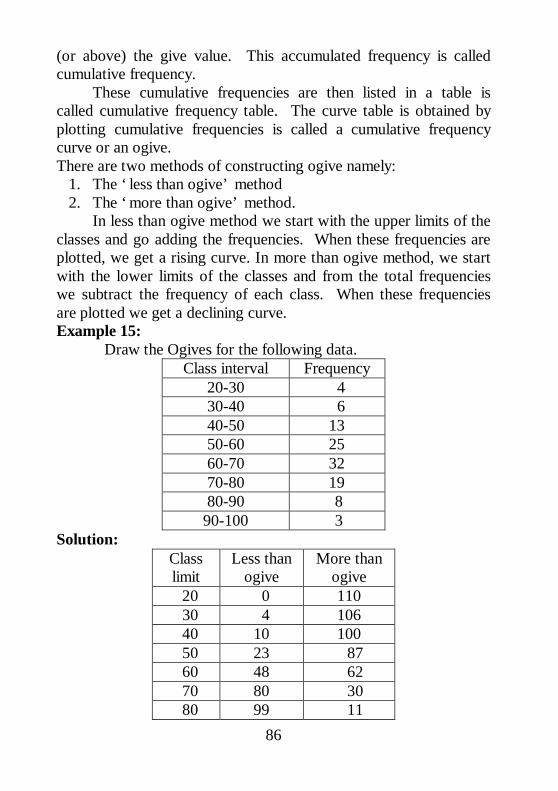
5.6.4 Ogives:For a set of observations, we know how to construct a
frequency distribution. In some cases we may require the numberof observations less than a given value or more than a given value.This is obtained by a accumulating (adding) the frequencies upto
1000 2000 3000 4000 5000 6000 7000 8000Monthly Wages in Rs.
86
(or above) the give value. This accumulated frequency is calledcumulative frequency.
These cumulative frequencies are then listed in a table iscalled cumulative frequency table. The curve table is obtained byplotting cumulative frequencies is called a cumulative frequencycurve or an ogive.There are two methods of constructing ogive namely:
1. The ‘ less than ogive’ method2. The ‘ more than ogive’ method.
In less than ogive method we start with the upper limits of theclasses and go adding the frequencies. When these frequencies areplotted, we get a rising curve. In more than ogive method, we startwith the lower limits of the classes and from the total frequencieswe subtract the frequency of each class. When these frequenciesare plotted we get a declining curve.Example 15:
Draw the Ogives for the following data.Class interval Frequency
20-30 430-40 640-50 1350-60 2560-70 3270-80 1980-90 8
90-100 3Solution:
Classlimit
Less thanogive
More thanogive
20 0 110 30 4 106 40 10 100 50 23 87 60 48 62 70 80 30 80 99 11
87
90 107 3100 110 0
Ogives
0102030405060708090
100110120
20 30 40 50 60 70 80 90 100
Class limit
Cum
ulat
ive
freq
uenc
y
Y
X
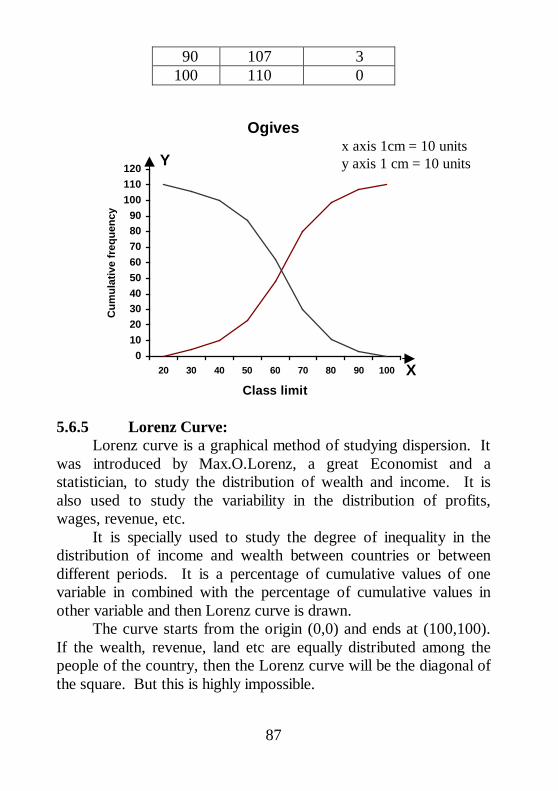
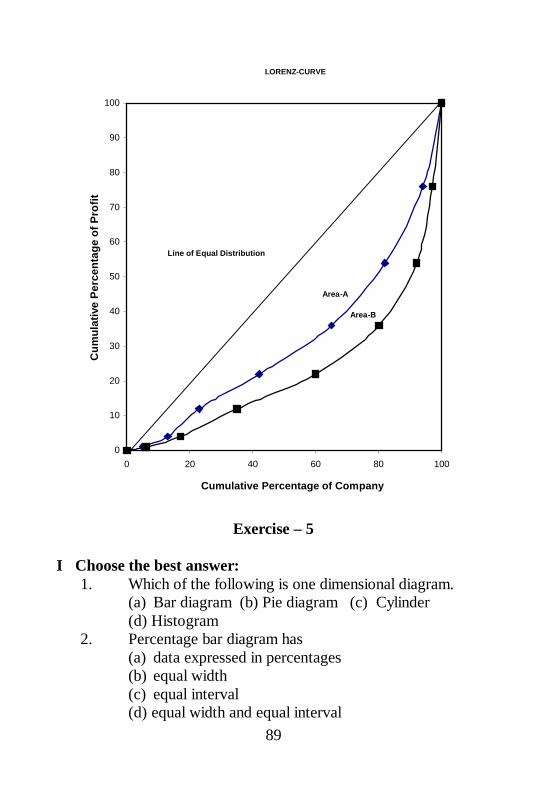
5.6.5 Lorenz Curve:Lorenz curve is a graphical method of studying dispersion. It
was introduced by Max.O.Lorenz, a great Economist and astatistician, to study the distribution of wealth and income. It isalso used to study the variability in the distribution of profits,wages, revenue, etc.
It is specially used to study the degree of inequality in thedistribution of income and wealth between countries or betweendifferent periods. It is a percentage of cumulative values of onevariable in combined with the percentage of cumulative values inother variable and then Lorenz curve is drawn.
The curve starts from the origin (0,0) and ends at (100,100).If the wealth, revenue, land etc are equally distributed among thepeople of the country, then the Lorenz curve will be the diagonal ofthe square. But this is highly impossible.
x axis 1cm = 10 unitsy axis 1 cm = 10 units
88
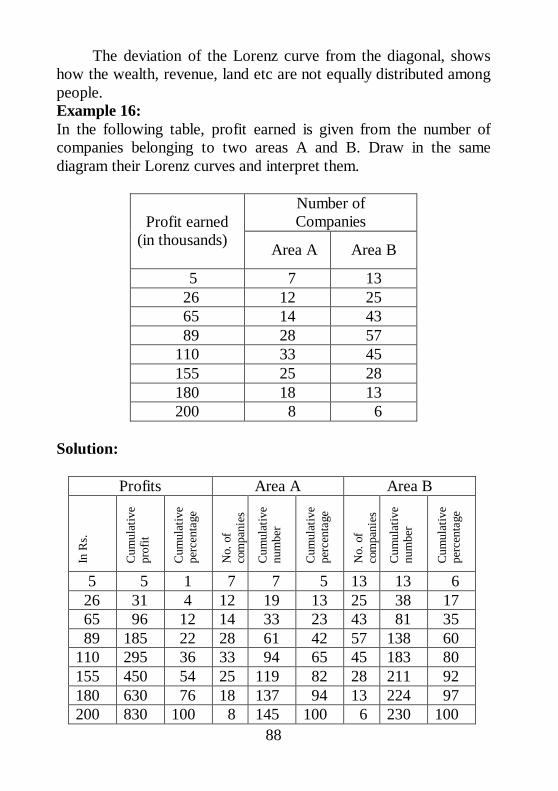
The deviation of the Lorenz curve from the diagonal, showshow the wealth, revenue, land etc are not equally distributed amongpeople.Example 16:In the following table, profit earned is given from the number ofcompanies belonging to two areas A and B. Draw in the samediagram their Lorenz curves and interpret them.
Number ofCompaniesProfit earned
(in thousands) Area A Area B
5 7 13 26 12 25 65 14 43 89 28 57110 33 45155 25 28180 18 13200 8 6
Solution:
Profits Area A Area B
In R
s.
Cum
ulat
ive
prof
it
Cum
ulat
ive
perc
enta
ge
No.
of
com
pani
es
Cum
ulat
ive
num
ber
Cum
ulat
ive
perc
enta
ge
No.
of
com
pani
es
Cum
ulat
ive
num
ber
Cum
ulat
ive
perc
enta
ge
5 5 1 7 7 5 13 13 6 26 31 4 12 19 13 25 38 17 65 96 12 14 33 23 43 81 35 89 185 22 28 61 42 57 138 60110 295 36 33 94 65 45 183 80155 450 54 25 119 82 28 211 92180 630 76 18 137 94 13 224 97200 830 100 8 145 100 6 230 100
89
LORENZ-CURVE
0
10
20
30
40
50
60
70
80
90
100
0 20 40 60 80 100
Cumulative Percentage of Company
Cum
ulat
ive
Perc
enta
ge o
f Pro
fit
Line of Equal Distribution
Area-A
Area-B
Exercise – 5
I Choose the best answer:1. Which of the following is one dimensional diagram.
(a) Bar diagram (b) Pie diagram (c) Cylinder(d) Histogram
2. Percentage bar diagram has(a) data expressed in percentages(b) equal width(c) equal interval(d) equal width and equal interval
90
3. Frequency curve(a) begins at the origin (b) passes through the origin(c) begins at the horizontal line.(d) begins and ends at the base line.
4. With the help of histogram we can draw(a) frequency polygon (b) frequency curve(c) frequency distribution(d) all the above
5. Ogives for more than type and less than typedistribution intersect at(a) mean (b) median(c) mode (d) origin
II Fill in the blanks:1. Sub-divided bar diagram are also called _____ diagram.2. In rectangular diagram, comparison is based on _____ of
the rectangles.3. Squares are ______ dimensional diagrams.4. Ogives for more than type and less than type distribution
intersects at ______.5. _________ Curve is graphical method of studying
dispersion.III. Answer the following:
1. What is diagram?2. How diagrams are useful in representing statistical data3. What are the significance of diagrams?4. What are the rules for making a diagram?5. What are the various types of diagrams6. Write short notes on (a) Bar diagram
(b) Sub divided bar diagram.7. What is a pie diagram?8. Write short notes on
a) Histogram b) Frequency Polygonc) Frequency curve d) Ogive
9. What are less than ogive and more than ogive? What purposedo they serve?
10. What is Lorenz curve? Mention its important.
91
11. Represent the following data by a bar diagram.
Year Profit (inthousands)
1995 21996 61997 111998 151999 202000 27
12. Represent the following data by a multiple bar diagram.
WorkersFactory Male FemaleA 125 100B 210 165C 276 212
13. Represent the following data by means of percentage sub-divided bar diagram.Food crops Area A
(in 000,000 acres)Area B(in 000,000 acres)
Rice 18 10Wheat 12 14Barley 10 8Maize 7 6Others 12 15
14. Draw a Pie diagram to exhibit the causes of death in thecountry.
Causes of Death NumbersDiarrhoea andenteritis
60
Prematurity andatrophy
170
Bronchitis andpneumonia
90
92
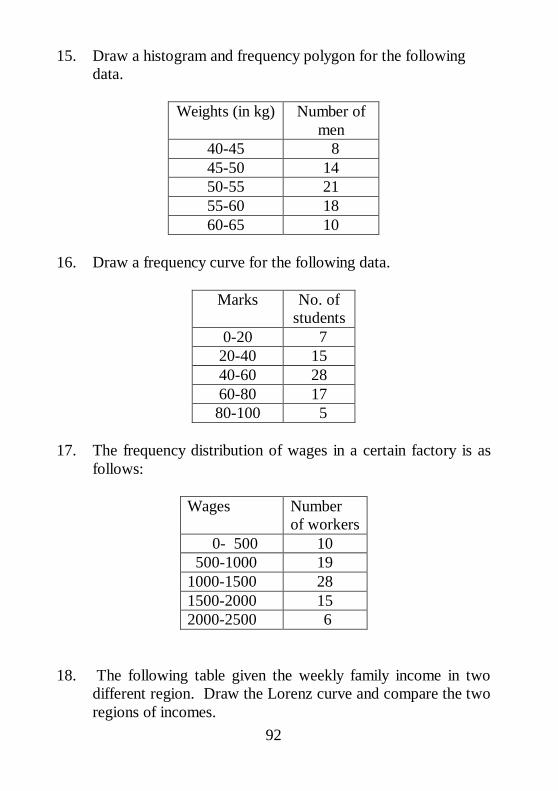
15. Draw a histogram and frequency polygon for the followingdata.
Weights (in kg) Number ofmen
40-45 845-50 1450-55 2155-60 1860-65 10
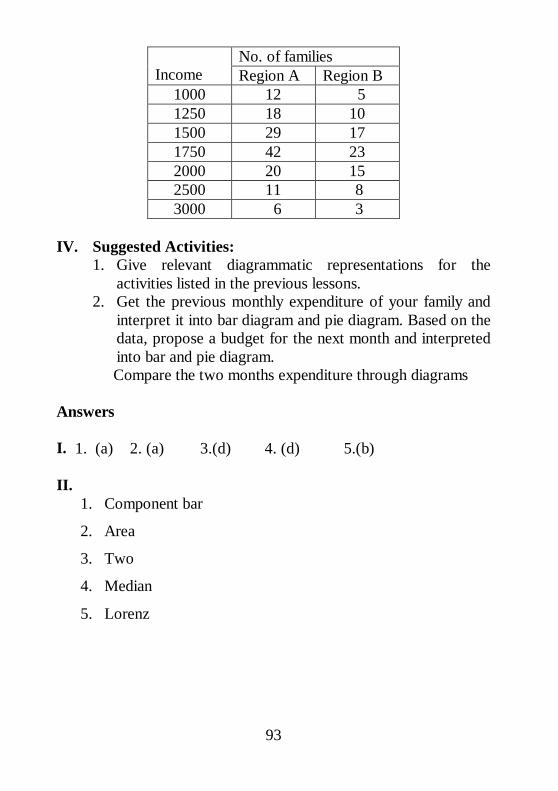
16. Draw a frequency curve for the following data.
Marks No. ofstudents
0-20 720-40 1540-60 2860-80 1780-100 5
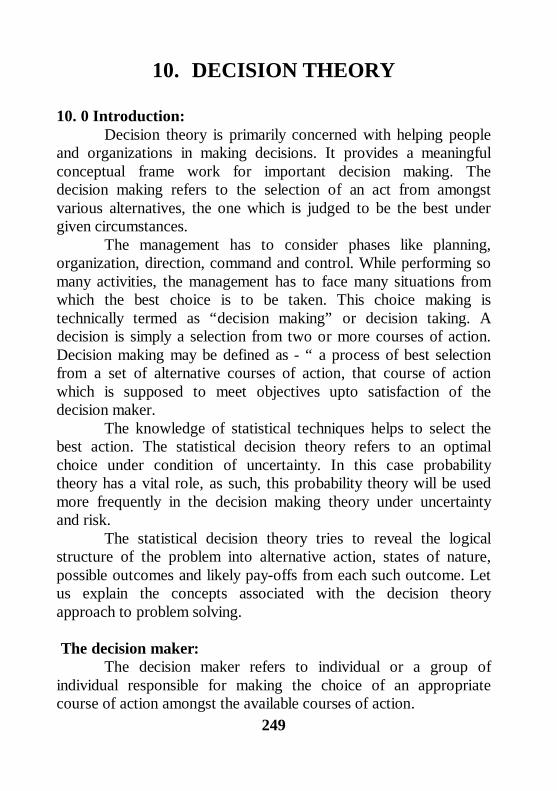
17. The frequency distribution of wages in a certain factory is asfollows:
Wages Numberof workers
0- 500 10 500-1000 191000-1500 281500-2000 152000-2500 6
18. The following table given the weekly family income in twodifferent region. Draw the Lorenz curve and compare the tworegions of incomes.
93
No. of familiesIncome Region A Region B
1000 12 51250 18 101500 29 171750 42 232000 20 152500 11 83000 6 3
IV. Suggested Activities:1. Give relevant diagrammatic representations for the
activities listed in the previous lessons.2. Get the previous monthly expenditure of your family and
interpret it into bar diagram and pie diagram. Based on thedata, propose a budget for the next month and interpretedinto bar and pie diagram.
Compare the two months expenditure through diagrams
Answers
I. 1. (a) 2. (a) 3.(d) 4. (d) 5.(b)
II.1. Component bar
2. Area
3. Two
4. Median
5. Lorenz
249
10. DECISION THEORY
10. 0 Introduction:Decision theory is primarily concerned with helping people
and organizations in making decisions. It provides a meaningfulconceptual frame work for important decision making. Thedecision making refers to the selection of an act from amongstvarious alternatives, the one which is judged to be the best undergiven circumstances.
The management has to consider phases like planning,organization, direction, command and control. While performing somany activities, the management has to face many situations fromwhich the best choice is to be taken. This choice making istechnically termed as “decision making” or decision taking. Adecision is simply a selection from two or more courses of action.Decision making may be defined as - “ a process of best selectionfrom a set of alternative courses of action, that course of actionwhich is supposed to meet objectives upto satisfaction of thedecision maker.
The knowledge of statistical techniques helps to select thebest action. The statistical decision theory refers to an optimalchoice under condition of uncertainty. In this case probabilitytheory has a vital role, as such, this probability theory will be usedmore frequently in the decision making theory under uncertaintyand risk.
The statistical decision theory tries to reveal the logicalstructure of the problem into alternative action, states of nature,possible outcomes and likely pay-offs from each such outcome. Letus explain the concepts associated with the decision theoryapproach to problem solving.
The decision maker:The decision maker refers to individual or a group of
individual responsible for making the choice of an appropriatecourse of action amongst the available courses of action.
250
Acts (or courses of action):Decision making problems deals with the selection of a
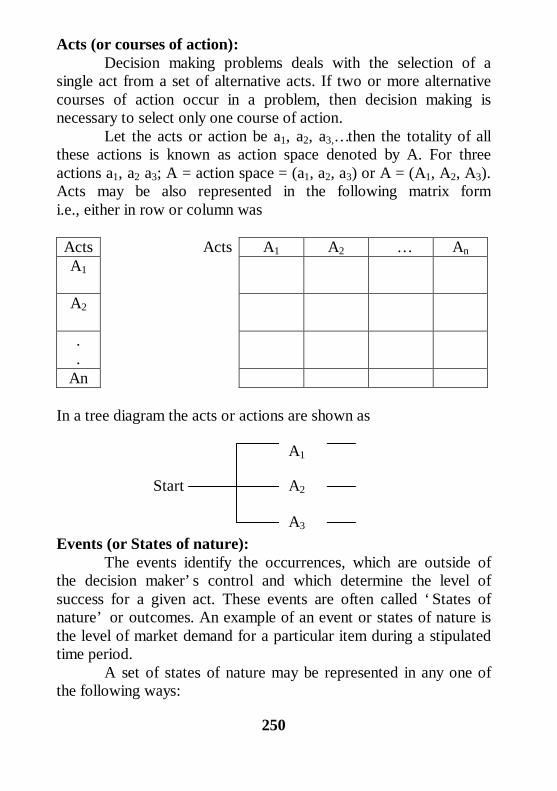
single act from a set of alternative acts. If two or more alternativecourses of action occur in a problem, then decision making isnecessary to select only one course of action.
Let the acts or action be a1, a2, a3,… then the totality of allthese actions is known as action space denoted by A. For threeactions a1, a2 a3; A = action space = (a1, a2, a3) or A = (A1, A2, A3).Acts may be also represented in the following matrix formi.e., either in row or column was
Acts Acts A1 A2 … AnA1
A2
.
.An
In a tree diagram the acts or actions are shown as
Events (or States of nature):The events identify the occurrences, which are outside of
the decision maker’ s control and which determine the level ofsuccess for a given act. These events are often called ‘ States ofnature’ or outcomes. An example of an event or states of nature isthe level of market demand for a particular item during a stipulatedtime period.
A set of states of nature may be represented in any one ofthe following ways:
A1
A2
A3
Start
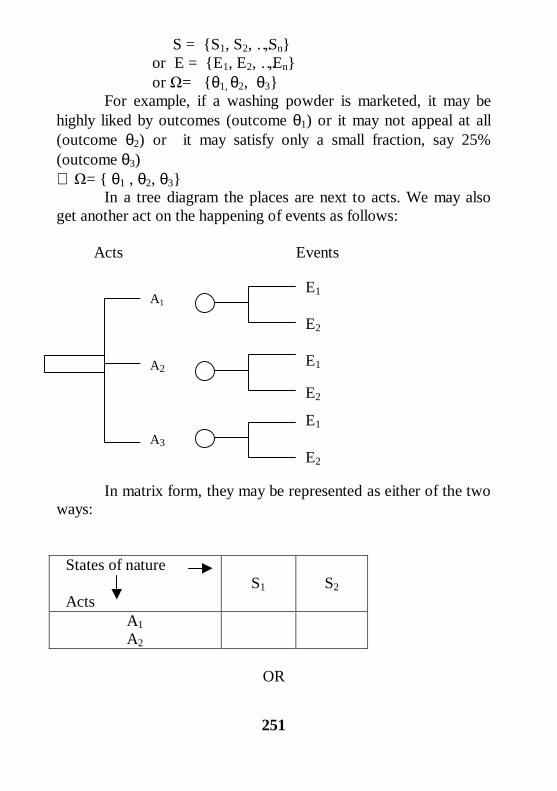
251
S = {S1, S2, …,Sn}or E = {E1, E2, …,En}or = {θ1, θ2, θ3}
For example, if a washing powder is marketed, it may behighly liked by outcomes (outcome θ1) or it may not appeal at all(outcome θ2) or it may satisfy only a small fraction, say 25%(outcome θ3)∴ = { θ1 , θ2, θ3}
In a tree diagram the places are next to acts. We may alsoget another act on the happening of events as follows:
Acts Events
In matrix form, they may be represented as either of the twoways:
States of nature
ActsS1 S2
A1A2
OR
E1
E2
E1
E2
E1
E2
A1
A2
A3
252
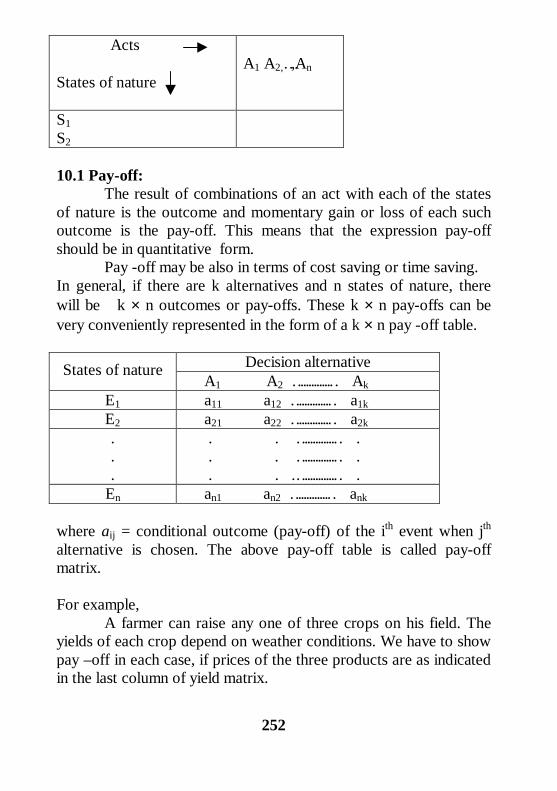
Acts
States of natureA1 A2,…,An
S1S2
10.1 Pay-off:The result of combinations of an act with each of the states
of nature is the outcome and momentary gain or loss of each suchoutcome is the pay-off. This means that the expression pay-offshould be in quantitative form.
Pay -off may be also in terms of cost saving or time saving.In general, if there are k alternatives and n states of nature, therewill be k × n outcomes or pay-offs. These k × n pay-offs can bevery conveniently represented in the form of a k × n pay -off table.
Decision alternativeStates of nature A1 A2 …………… Ak
E1 a11 a12 …………… a1kE2 a21 a22 …………… a2k...
. . …………… . . . …………… . . . .…………… .
En an1 an2 …………… ank
where aij = conditional outcome (pay-off) of the ith event when jthalternative is chosen. The above pay-off table is called pay-offmatrix.
For example,A farmer can raise any one of three crops on his field. The
yields of each crop depend on weather conditions. We have to showpay –off in each case, if prices of the three products are as indicatedin the last column of yield matrix.
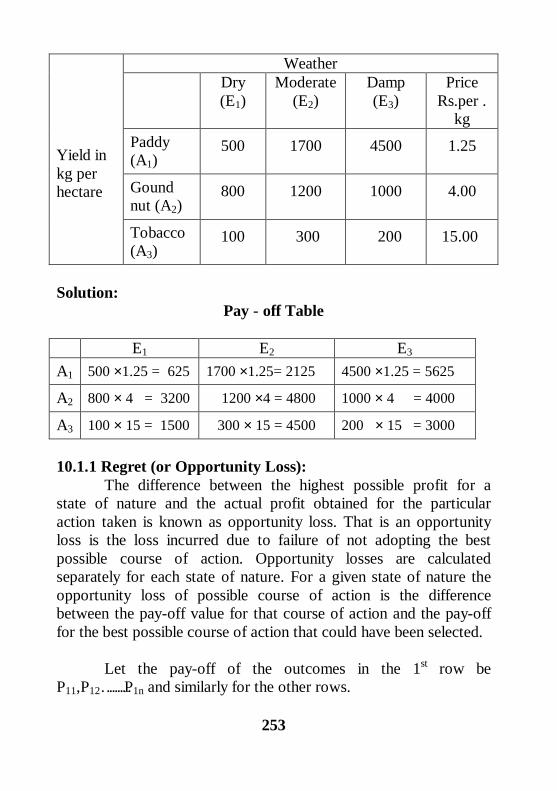
253
WeatherDry(E1)
Moderate(E2)
Damp(E3)
PriceRs.per .
kgPaddy(A1)
500 1700 4500 1.25
Goundnut (A2)
800 1200 1000 4.00
Yield inkg perhectare
Tobacco(A3)
100 300 200 15.00
Solution:Pay - off Table
E1 E2 E3
A1 500 ×1.25 = 625 1700 ×1.25= 2125 4500 ×1.25 = 5625
A2 800 × 4 = 3200 1200 ×4 = 4800 1000 × 4 = 4000
A3 100 × 15 = 1500 300 × 15 = 4500 200 × 15 = 3000
10.1.1 Regret (or Opportunity Loss):The difference between the highest possible profit for a
state of nature and the actual profit obtained for the particularaction taken is known as opportunity loss. That is an opportunityloss is the loss incurred due to failure of not adopting the bestpossible course of action. Opportunity losses are calculatedseparately for each state of nature. For a given state of nature theopportunity loss of possible course of action is the differencebetween the pay-off value for that course of action and the pay-offfor the best possible course of action that could have been selected.
Let the pay-off of the outcomes in the 1st row beP11,P12………P1n and similarly for the other rows.
254
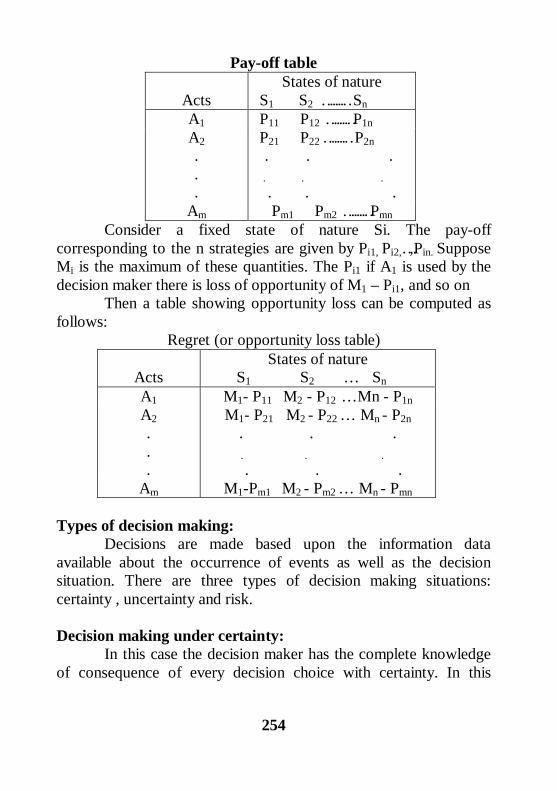
Pay-off table
ActsStates of nature
S1 S2 ……… SnA1 P11 P12 ……… P1nA2...
P21 P22 ……… P2n . . .
. . . . . .
Am Pm1 Pm2 ……… PmnConsider a fixed state of nature Si. The pay-off
corresponding to the n strategies are given by Pi1, Pi2,…,Pin. SupposeMi is the maximum of these quantities. The Pi1 if A1 is used by thedecision maker there is loss of opportunity of M1 – Pi1, and so on
Then a table showing opportunity loss can be computed asfollows:
Regret (or opportunity loss table)
ActsStates of nature
S1 S2 … SnA1 M1- P11 M2 - P12 … Mn - P1nA2...
M1- P21 M2 - P22 … Mn - P2n. . .
. . . . . .
Am M1-Pm1 M2 - Pm2 … Mn - Pmn
Types of decision making:Decisions are made based upon the information data
available about the occurrence of events as well as the decisionsituation. There are three types of decision making situations:certainty , uncertainty and risk.
Decision making under certainty:In this case the decision maker has the complete knowledge
of consequence of every decision choice with certainty. In this
255
decision model, assumed certainty means that only one possiblestate of nature exists.
Example 1:A canteen prepares a food at a total average cost of Rs. 4
per plate and sells it at a price of Rs 6. The food is prepared in themorning and is sold during the same day. Unsold food during thesame day is spoiled and is to be thrown away. According to the pastsale, number of plates prepared is not less than 50 or greater than53. You are to formulate the (i) action space (ii) states of naturespace (iii) pay-off table (iv) loss table
Solution:(i) The canteen will not prepare less than 50 plates or more than 53plates. Thus the acts or courses of action open to him area1 = prepare 50 platesa2 = prepare 51 platesa3 = prepare 52 platesa4 = prepare 53 platesThus the action space is
A = {a1, a2 , a3, a4}
(ii) The state of nature is daily demand for food plates. Then arefour possible state of nature ieS1 = demand is 50 platesS2 = demand is 51 platesS3 = demand is 52 platesS4 = demand is 53 platesHence the state of nature space, S= {S1, S2, S3, S4}
iii) The uncertainty element in the given problem is the dailydemand. The profit of the canteen is subject to the daily demand.Let n = quantity demanded
m = quantity producedFor n ≥ m, profit = (Cost price – Selling price) x m
= (6 – 4) x m = 2mFor m > n,
256
profit ={(Cost price – Selling price) x n}- {Cost price x (m-n) }= 2n – 4 (m-n) = 6n – 4m
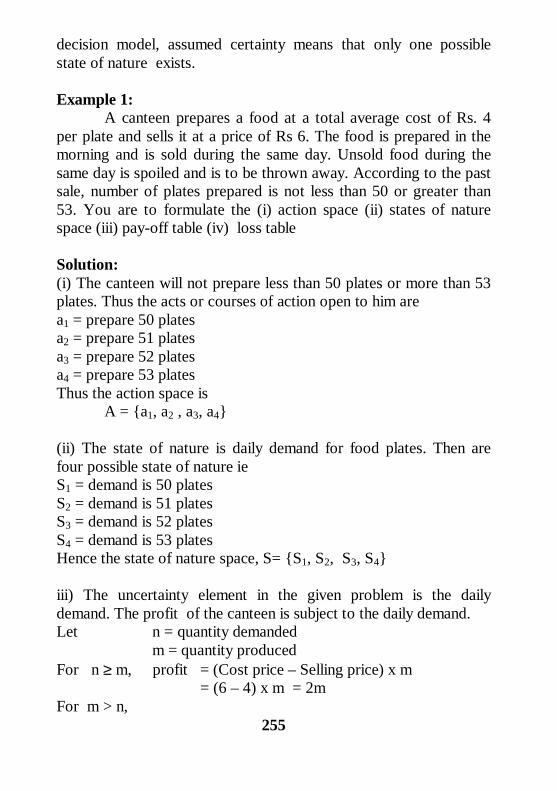
Pay-off table
Supply (m) Demand (n)(S1) (S2) (S3) (S4) 50 51 52 53
(a1) 50 100 100 100 100 (a2) 51 96 102 102 102 (a3) 52 92 98 104 104 (a4) 53 88 94 100 106
(iv) To calculate the opportunity loss we first determine themaximum pay-off in each state of nature. In this state First maximum pay-off = 100
Second maximum pay-off = 102 Third maximum pay-off = 104
Fourth maximum pay-off = 106Loss table corresponding to the above pay-off table
Supply(m)
Demand (n) (S1) (S2) (S3) (S4) 50 51 52 53
(a1) 50 100 -100 = 0 102-100 = 2 104-100 = 4 106 -100 = 6
(a2) 51 100 - 96 = 4 102-102 = 0 104-102 = 2 106 -102 = 4
(a3) 52 100 - 92 = 8 102 - 98 = 4 104-104 = 0 106 -104 = 2
(a4) 53 100 - 88 =12 102 - 94 = 8 104-100 = 4 106 -106 = 0
10.2 Decision making under uncertainty (without probability):Under conditions of uncertainty, only pay-offs are known
and nothing is known about the lilkelihood of each state of nature.Such situations arise when a new product is introduced in the
257
market or a new plant is set up. The number of different decisioncriteria available under the condition of uncertainty is given below.
Certain of optimism (Maximax ):The maximax criterion finds the course of action or
alternative strategy that maximizes the maximum pay-off. Sincethis decision criterion locates the alternative with the highestpossible gain, it has also been called an optimistic decisioncriterion. The working method is(i) Determine the best outcome for each alternative.(ii) Select the alternative associated with the best of these.
Expected Monetary value (EMV):The expected monetary value is widely used to evaluate the
alternative course of action (or act). The EMV for given course ofaction is just sum of possible pay-off of the alternative eachweighted by the probability of that pay-off occurring.The criteria of pessimism or Maximin:
This criterion is the decision to take the course of actionwhich maximizes the minimum possible pay-off. Since thisdecision criterion locates the alternative strategy that has the leastpossible loss, it is also known as a pessimistic decision criterion.The working method is:
1) Determine the lowest outcome for each alternative.2) Choose the alternative associated with the best of these.
Minimax Regret Criterion (Savage Criterion):This criterion is also known as opportunity loss decision
criterion because decision maker feels regret after adopting a wrongcourse of action (or alternative) resulting in an opportunity loss ofpay-off. Thus he always intends to minimize this regret. Theworking method is
(a) Form the given pay-off matrix, develop an opportunity loss(or regret) matrix.
(i) find the best pay-off corresponding to each stateof nature and
(ii) subtract all other entries (pay-off values) in thatrow from this value.
258
(b) Identify the maximum opportunity loss for eachalternatives.
(c) Select the alternative associated with the lowest of these.
Equally likely decision (Baye’ s or Laplace)Criterion:Since the probabilities of states of nature are not known, it
is assumed that all states of nature will occur with equalprobability. ie., each state of nature is assigned an equal probability.As states of nature are mutually exclusive and collectivelyexhaustive, so the probability of each these must be 1 /(number ofstates of nature). The working method is
(a) Assign equal probability value to each state of nature byusing the formula:1/(number of states of nature)
(b) Compute the expected (or average) value for eachalternative by multiplying each outcome by its probabilityand then summing.
(c) Select the best expected pay-off value (maximum for profitand minimum for loss)
This criterion is also known as the criterion of insufficient reasonbecause, expect in a few cases, some information of the likelihoodof occurrence of states of nature is available.
Criterion of Realism (Hurwicz Criterion):This criterion is a compromise between an optimistic and
pessimistic decision criterion. To start with a co-efficient ofoptimism α (0 ≤ α ≤ 1) is selected.
When α is close to one, the decision maker is optimisticabout the future and when α is close to zero, the decision maker ispessimistic about the future.
According to Hurwicz , select strategy which maximizesH = α (maximum pay-off in row) + (1 - α) minimum pay-off inrow.
Example 2:Consider the following pay-off (profit) matrix
259
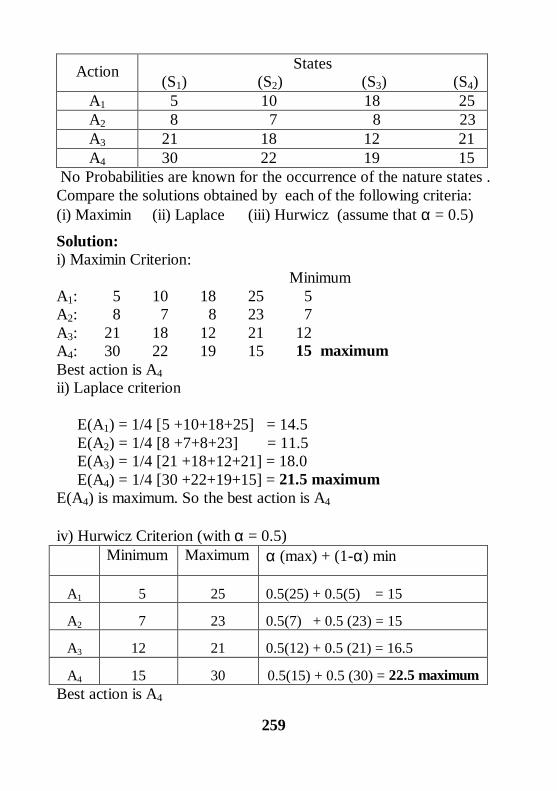
Action States (S1) (S2) (S3) (S4)
A1 5 10 18 25A2 8 7 8 23A3 21 18 12 21A4 30 22 19 15
No Probabilities are known for the occurrence of the nature states .Compare the solutions obtained by each of the following criteria:(i) Maximin (ii) Laplace (iii) Hurwicz (assume that α = 0.5)
Solution:i) Maximin Criterion:
MinimumA1: 5 10 18 25 5A2: 8 7 8 23 7A3: 21 18 12 21 12A4: 30 22 19 15 15 maximumBest action is A4ii) Laplace criterion
E(A1) = 1/4 [5 +10+18+25] = 14.5 E(A2) = 1/4 [8 +7+8+23] = 11.5
E(A3) = 1/4 [21 +18+12+21] = 18.0 E(A4) = 1/4 [30 +22+19+15] = 21.5 maximumE(A4) is maximum. So the best action is A4
iv) Hurwicz Criterion (with α = 0.5)Minimum Maximum α (max) + (1-α) min
A1 5 25 0.5(25) + 0.5(5) = 15
A2 7 23 0.5(7) + 0.5 (23) = 15
A3 12 21 0.5(12) + 0.5 (21) = 16.5
A4 15 30 0.5(15) + 0.5 (30) = 22.5 maximumBest action is A4
260
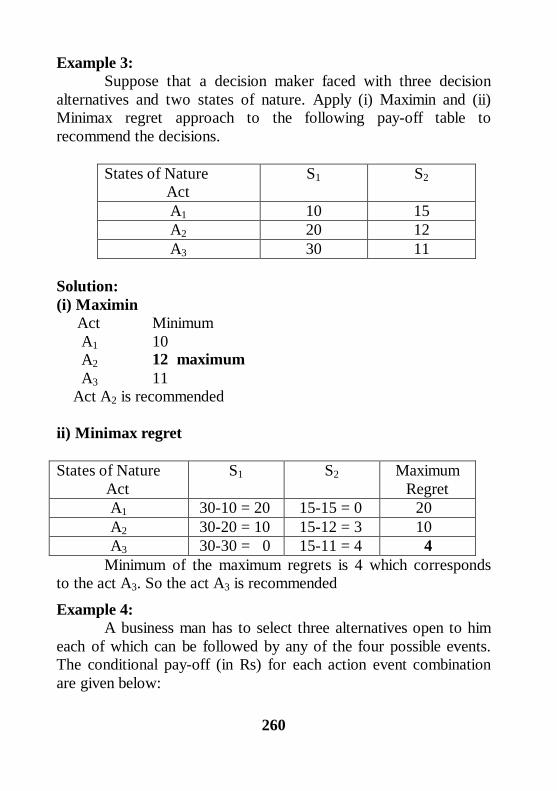
Example 3:Suppose that a decision maker faced with three decision
alternatives and two states of nature. Apply (i) Maximin and (ii)Minimax regret approach to the following pay-off table torecommend the decisions.
States of Nature Act
S1 S2
A1 10 15A2 20 12A3 30 11
Solution:(i) Maximin Act Minimum A1 10 A2 12 maximum A3 11 Act A2 is recommended
ii) Minimax regret
States of Nature Act
S1 S2 MaximumRegret
A1 30-10 = 20 15-15 = 0 20A2 30-20 = 10 15-12 = 3 10A3 30-30 = 0 15-11 = 4 4
Minimum of the maximum regrets is 4 which correspondsto the act A3. So the act A3 is recommended
Example 4:A business man has to select three alternatives open to him
each of which can be followed by any of the four possible events.The conditional pay-off (in Rs) for each action event combinationare given below:
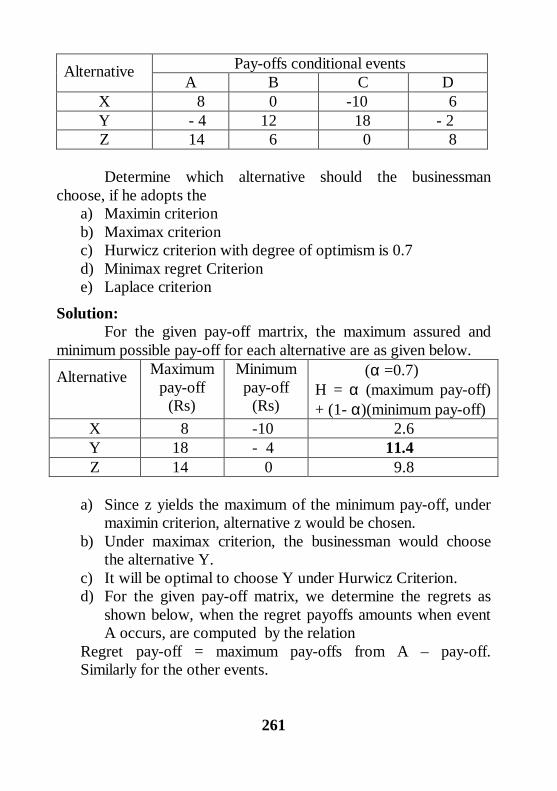
261
Pay-offs conditional eventsAlternativeA B C D
X 8 0 -10 6Y - 4 12 18 - 2Z 14 6 0 8
Determine which alternative should the businessmanchoose, if he adopts the
a) Maximin criterionb) Maximax criterionc) Hurwicz criterion with degree of optimism is 0.7d) Minimax regret Criterione) Laplace criterion
Solution:For the given pay-off martrix, the maximum assured and
minimum possible pay-off for each alternative are as given below.
Alternative Maximumpay-off
(Rs)
Minimumpay-off
(Rs)
(α =0.7)H = α (maximum pay-off)+ (1- α)(minimum pay-off)
X 8 -10 2.6Y 18 - 4 11.4Z 14 0 9.8
a) Since z yields the maximum of the minimum pay-off, undermaximin criterion, alternative z would be chosen.
b) Under maximax criterion, the businessman would choosethe alternative Y.
c) It will be optimal to choose Y under Hurwicz Criterion.d) For the given pay-off matrix, we determine the regrets as
shown below, when the regret payoffs amounts when eventA occurs, are computed by the relation
Regret pay-off = maximum pay-offs from A – pay-off.Similarly for the other events.
262
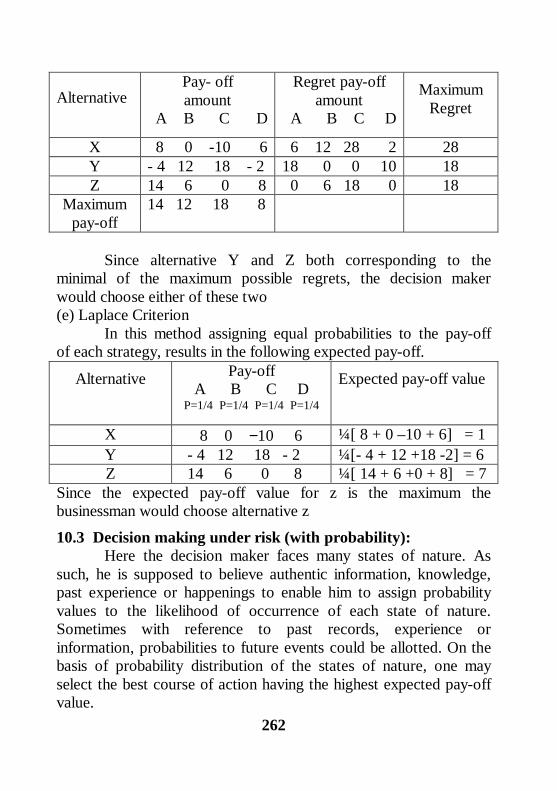
AlternativePay- offamount
A B C D
Regret pay-offamount
A B C D
MaximumRegret
X 8 0 -10 6 6 12 28 2 28Y - 4 12 18 - 2 18 0 0 10 18Z 14 6 0 8 0 6 18 0 18
Maximumpay-off
14 12 18 8
Since alternative Y and Z both corresponding to theminimal of the maximum possible regrets, the decision makerwould choose either of these two(e) Laplace Criterion
In this method assigning equal probabilities to the pay-offof each strategy, results in the following expected pay-off.
Alternative Pay-offA B C D
P=1/4 P=1/4 P=1/4 P=1/4
Expected pay-off value
X 8 0 −10 6 ¼ [ 8 + 0 –10 + 6] = 1Y - 4 12 18 - 2 ¼ [- 4 + 12 +18 -2] = 6Z 14 6 0 8 ¼ [ 14 + 6 +0 + 8] = 7
Since the expected pay-off value for z is the maximum thebusinessman would choose alternative z
10.3 Decision making under risk (with probability):Here the decision maker faces many states of nature. As
such, he is supposed to believe authentic information, knowledge,past experience or happenings to enable him to assign probabilityvalues to the likelihood of occurrence of each state of nature.Sometimes with reference to past records, experience orinformation, probabilities to future events could be allotted. On thebasis of probability distribution of the states of nature, one mayselect the best course of action having the highest expected pay-offvalue.
263
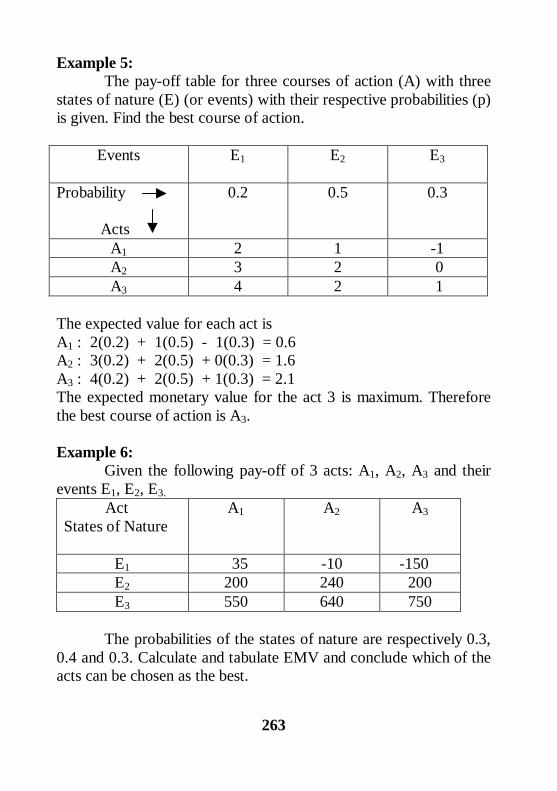
Example 5:The pay-off table for three courses of action (A) with three
states of nature (E) (or events) with their respective probabilities (p)is given. Find the best course of action.
Events E1 E2 E3
Probability
Acts
0.2 0.5 0.3
A1 2 1 -1A2 3 2 0A3 4 2 1
The expected value for each act isA1 : 2(0.2) + 1(0.5) - 1(0.3) = 0.6A2 : 3(0.2) + 2(0.5) + 0(0.3) = 1.6A3 : 4(0.2) + 2(0.5) + 1(0.3) = 2.1The expected monetary value for the act 3 is maximum. Thereforethe best course of action is A3.
Example 6:Given the following pay-off of 3 acts: A1, A2, A3 and their
events E1, E2, E3. ActStates of Nature
A1 A2 A3
E1 35 -10 -150E2 200 240 200E3 550 640 750
The probabilities of the states of nature are respectively 0.3,0.4 and 0.3. Calculate and tabulate EMV and conclude which of theacts can be chosen as the best.
264
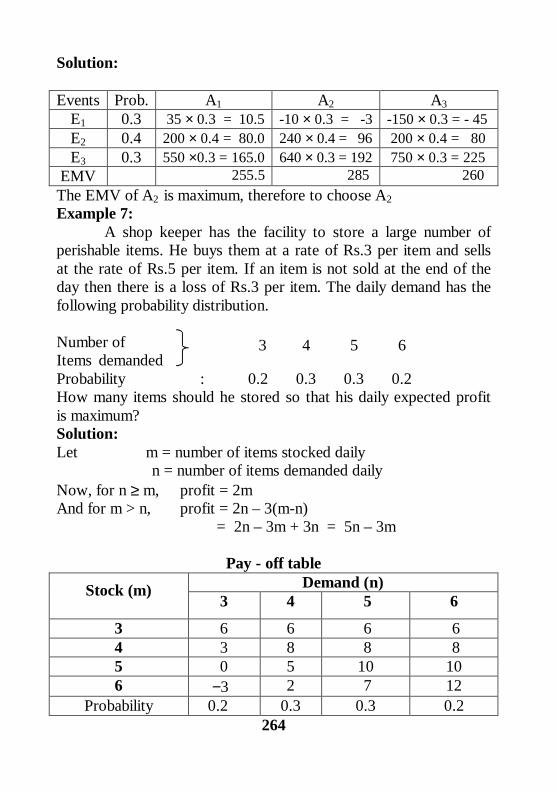
Solution:
Events Prob. A1 A2 A3E1 0.3 35 × 0.3 = 10.5 -10 × 0.3 = -3 -150 × 0.3 = - 45E2 0.4 200 × 0.4 = 80.0 240 × 0.4 = 96 200 × 0.4 = 80E3 0.3 550 ×0.3 = 165.0 640 × 0.3 = 192 750 × 0.3 = 225
EMV 255.5 285 260The EMV of A2 is maximum, therefore to choose A2Example 7:
A shop keeper has the facility to store a large number ofperishable items. He buys them at a rate of Rs.3 per item and sellsat the rate of Rs.5 per item. If an item is not sold at the end of theday then there is a loss of Rs.3 per item. The daily demand has thefollowing probability distribution.
Number ofItems demandedProbability : 0.2 0.3 0.3 0.2How many items should he stored so that his daily expected profitis maximum?Solution:Let m = number of items stocked daily n = number of items demanded dailyNow, for n ≥ m, profit = 2mAnd for m > n, profit = 2n – 3(m-n)
= 2n – 3m + 3n = 5n – 3m
Pay - off tableDemand (n)Stock (m)
3 4 5 6
3 6 6 6 64 3 8 8 85 0 5 10 106 −3 2 7 12
Probability 0.2 0.3 0.3 0.2
3 4 5 6
265
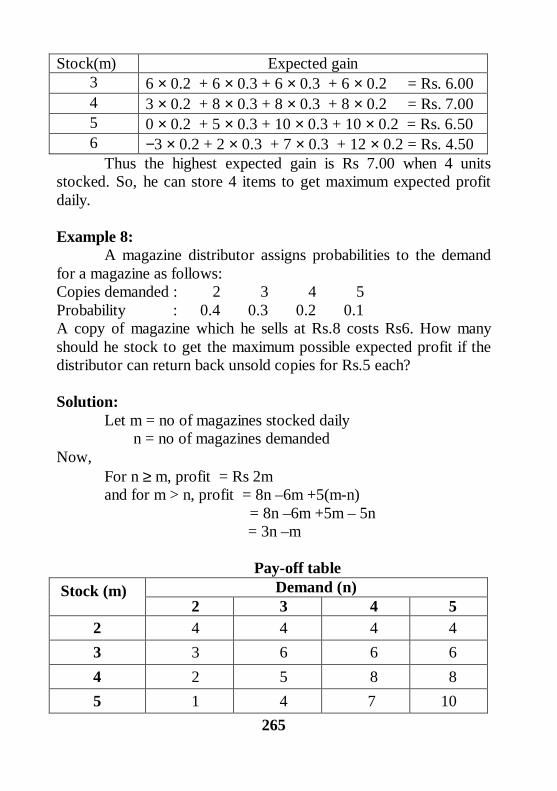
Stock(m) Expected gain3 6 × 0.2 + 6 × 0.3 + 6 × 0.3 + 6 × 0.2 = Rs. 6.004 3 × 0.2 + 8 × 0.3 + 8 × 0.3 + 8 × 0.2 = Rs. 7.005 0 × 0.2 + 5 × 0.3 + 10 × 0.3 + 10 × 0.2 = Rs. 6.506 −3 × 0.2 + 2 × 0.3 + 7 × 0.3 + 12 × 0.2 = Rs. 4.50
Thus the highest expected gain is Rs 7.00 when 4 unitsstocked. So, he can store 4 items to get maximum expected profitdaily.
Example 8:A magazine distributor assigns probabilities to the demand
for a magazine as follows:Copies demanded : 2 3 4 5Probability : 0.4 0.3 0.2 0.1A copy of magazine which he sells at Rs.8 costs Rs6. How manyshould he stock to get the maximum possible expected profit if thedistributor can return back unsold copies for Rs.5 each?
Solution:Let m = no of magazines stocked daily n = no of magazines demanded
Now,For n ≥ m, profit = Rs 2mand for m > n, profit = 8n –6m +5(m-n)
= 8n –6m +5m – 5n= 3n –m
Pay-off tableDemand (n) Stock (m)
2 3 4 52 4 4 4 43 3 6 6 64 2 5 8 85 1 4 7 10
266
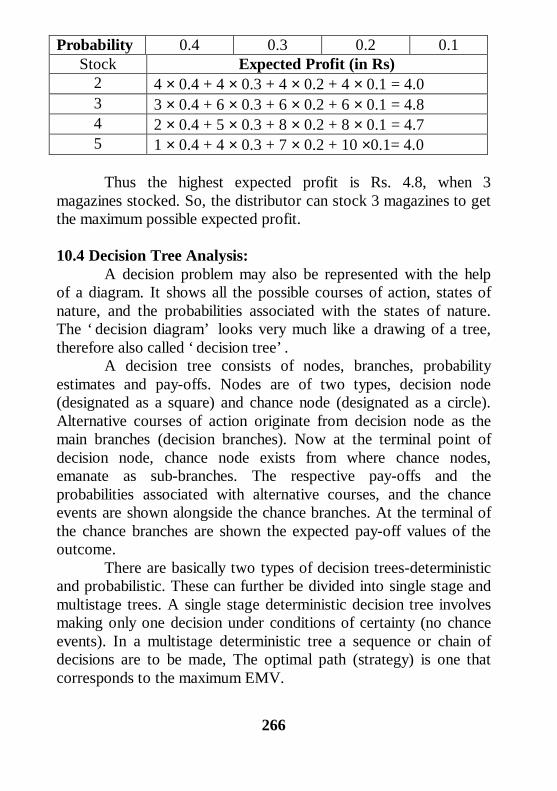
Probability 0.4 0.3 0.2 0.1Stock Expected Profit (in Rs)
2 4 × 0.4 + 4 × 0.3 + 4 × 0.2 + 4 × 0.1 = 4.03 3 × 0.4 + 6 × 0.3 + 6 × 0.2 + 6 × 0.1 = 4.84 2 × 0.4 + 5 × 0.3 + 8 × 0.2 + 8 × 0.1 = 4.75 1 × 0.4 + 4 × 0.3 + 7 × 0.2 + 10 ×0.1= 4.0
Thus the highest expected profit is Rs. 4.8, when 3magazines stocked. So, the distributor can stock 3 magazines to getthe maximum possible expected profit.
10.4 Decision Tree Analysis:A decision problem may also be represented with the help
of a diagram. It shows all the possible courses of action, states ofnature, and the probabilities associated with the states of nature.The ‘ decision diagram’ looks very much like a drawing of a tree,therefore also called ‘ decision tree’ .
A decision tree consists of nodes, branches, probabilityestimates and pay-offs. Nodes are of two types, decision node(designated as a square) and chance node (designated as a circle).Alternative courses of action originate from decision node as themain branches (decision branches). Now at the terminal point ofdecision node, chance node exists from where chance nodes,emanate as sub-branches. The respective pay-offs and theprobabilities associated with alternative courses, and the chanceevents are shown alongside the chance branches. At the terminal ofthe chance branches are shown the expected pay-off values of theoutcome.
There are basically two types of decision trees-deterministicand probabilistic. These can further be divided into single stage andmultistage trees. A single stage deterministic decision tree involvesmaking only one decision under conditions of certainty (no chanceevents). In a multistage deterministic tree a sequence or chain ofdecisions are to be made, The optimal path (strategy) is one thatcorresponds to the maximum EMV.
267
In drawing a decision tree, one must follow certain basic rules andconventions as stated below:
1. Identify all decisions (and their alternatives) to be made andthe order in which they must be made.
2. Identify the chance events or state of nature that mightoccur as a result of each decision alternative.
3. Develop a tree diagram showing the sequence of decisionsand chance events. The tree is constructed starting from leftand moving towards right. The square box denotes adecision point at which the available courses of action areconsidered. The circle O represents the chance node orevent, the various states of nature or outcomes emanatefrom this chance event.
4. Estimate probabilities that possible events or states of naturewill occur as a result of the decision alternatives.
5. Obtain outcomes (usually expressed in economic terms) ofthe possible interactions among decision alternatives andevents.
6. Calculate the expected value of all possible decisionalternatives.
7. Select the decision alternative (or course of action) offeringthe most attractive expected value
Advantages of decision tree:1. By drawing of decision tree, the decision maker will be in a
position to visualise the entire complex of the problem.2. Enable the decision - maker to see the various elements of
his problem in content and in a systematic way.3. Multi-dimensional decision sequences can be strung on a
decision tree without conceptual difficulties.4. Decision tree model can be applied in various fields such as
introduction of a new product, marketing strategy etc…
Example 9:A manufacturing company has to select one of the two
products A or B for manufacturing. Product A requires investment
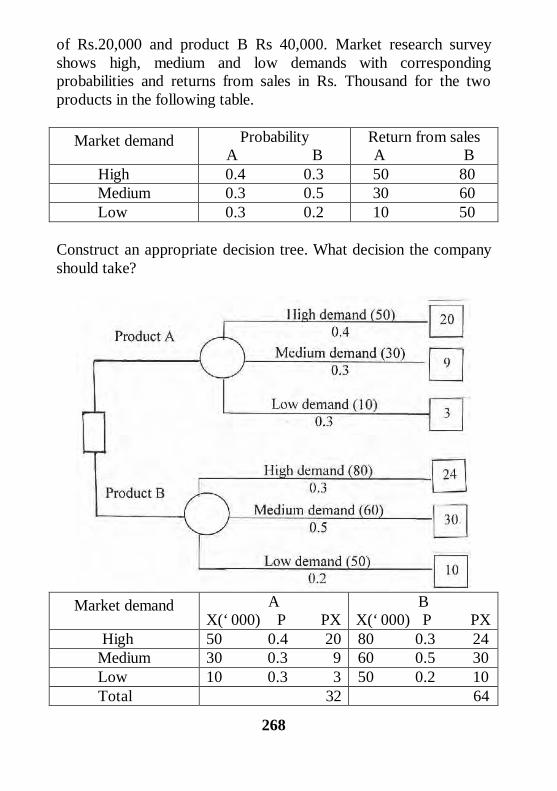
268
of Rs.20,000 and product B Rs 40,000. Market research surveyshows high, medium and low demands with correspondingprobabilities and returns from sales in Rs. Thousand for the twoproducts in the following table.
Market demand ProbabilityA B
Return from salesA B
High 0.4 0.3 50 80Medium 0.3 0.5 30 60
Low 0.3 0.2 10 50
Construct an appropriate decision tree. What decision the companyshould take?
Market demand AX(‘ 000) P PX
BX(‘ 000) P PX
High 50 0.4 20 80 0.3 24Medium 30 0.3 9 60 0.5 30
Low 10 0.3 3 50 0.2 10 Total 32 64
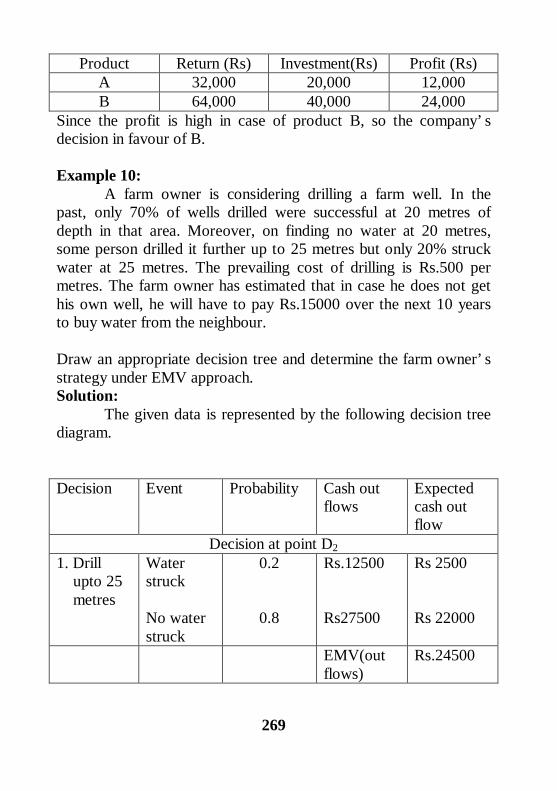
269
Product Return (Rs) Investment(Rs) Profit (Rs)A 32,000 20,000 12,000B 64,000 40,000 24,000
Since the profit is high in case of product B, so the company’ sdecision in favour of B.
Example 10:A farm owner is considering drilling a farm well. In the
past, only 70% of wells drilled were successful at 20 metres ofdepth in that area. Moreover, on finding no water at 20 metres,some person drilled it further up to 25 metres but only 20% struckwater at 25 metres. The prevailing cost of drilling is Rs.500 permetres. The farm owner has estimated that in case he does not gethis own well, he will have to pay Rs.15000 over the next 10 yearsto buy water from the neighbour.
Draw an appropriate decision tree and determine the farm owner’ sstrategy under EMV approach.Solution:
The given data is represented by the following decision treediagram.
Decision Event Probability Cash outflows
Expectedcash outflow
Decision at point D21. Drill upto 25 metres
Waterstruck
No waterstruck
0.2
0.8
Rs.12500
Rs27500
Rs 2500
Rs 22000
EMV(outflows)
Rs.24500
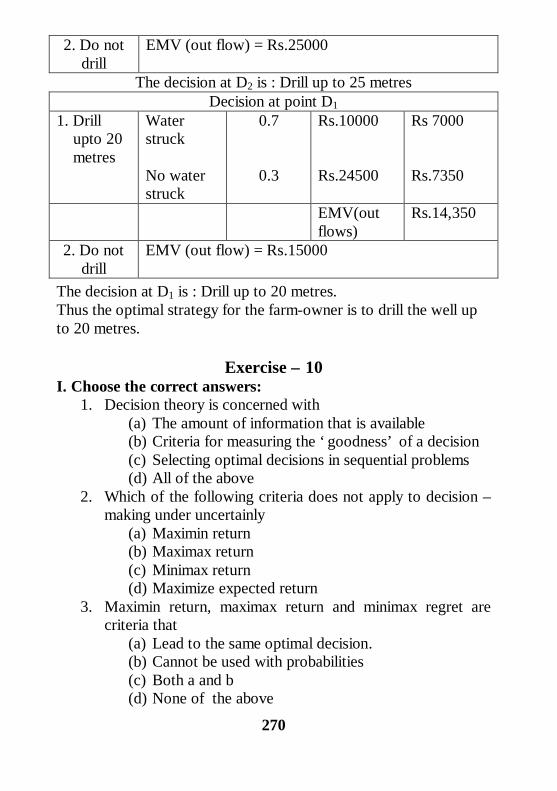
270
2. Do notdrill
EMV (out flow) = Rs.25000
The decision at D2 is : Drill up to 25 metresDecision at point D1
1. Drill upto 20 metres
Waterstruck
No waterstruck
0.7
0.3
Rs.10000
Rs.24500
Rs 7000
Rs.7350
EMV(outflows)
Rs.14,350
2. Do notdrill
EMV (out flow) = Rs.15000
The decision at D1 is : Drill up to 20 metres.Thus the optimal strategy for the farm-owner is to drill the well upto 20 metres.
Exercise – 10I. Choose the correct answers:
1. Decision theory is concerned with(a) The amount of information that is available(b) Criteria for measuring the ‘ goodness’ of a decision(c) Selecting optimal decisions in sequential problems(d) All of the above
2. Which of the following criteria does not apply to decision –making under uncertainly
(a) Maximin return(b) Maximax return(c) Minimax return(d) Maximize expected return
3. Maximin return, maximax return and minimax regret arecriteria that
(a) Lead to the same optimal decision.(b) Cannot be used with probabilities(c) Both a and b(d) None of the above
271
4. Which of the following does not apply to a decision tree?(a) A square node is a point at which a decision must be
made.(b) A circular node represents an encounter with
uncertainty.(c) One chooses a sequence of decisions which have the
greatest probability of success.(d) One attempts to maximize expected return.
5. The criterion which selects the action for which maximumpay-off is lowest is known as
(a) Max-min criterion(b) Min-max criterion(c) Max –max criterion(d) None of these
II. Fill in the blanks:6. Decision trees involve ____________ of decisions and
random outcomes.7. One way to deal with decision making in the ‘ uncertainity’
context is to treat all states of nature as ___________ andmaximize expected return.
8. Maximizing expected net rupee return always yields thesame optimal policy as ___________ expected regret.
9. The different criteria for making decisions under riskalways yields the same _________ choice.
10. In decision under uncertainty, the Laplace criterion is theleast conservative while the ___________ criterion is themost conservative.
III. Answer the following:11. Explain the meaning of ‘ statistical decision theory’12. What techniques are used to solve decision making
problems under uncertainty?13. Write a note on decision tree.14. What is a pay-off matrix?15. Describe how you would determine the best decision using
the EMV criterion with a decision tree.
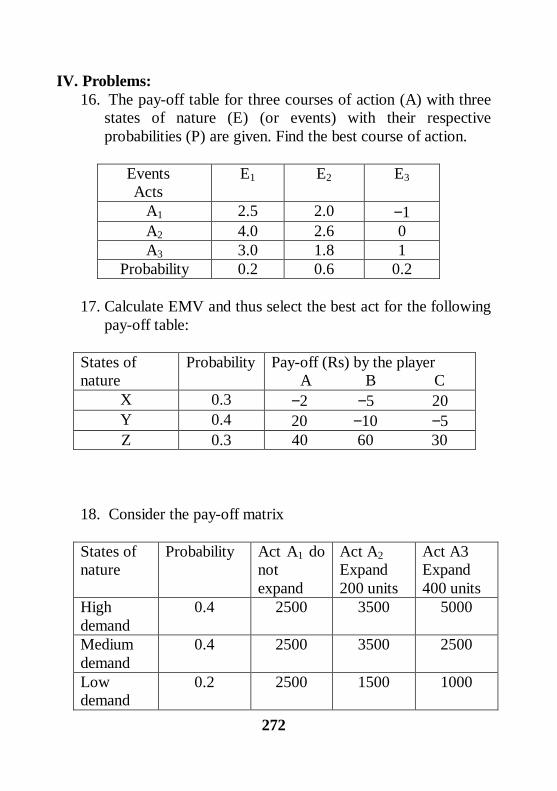
272
IV. Problems:16. The pay-off table for three courses of action (A) with three
states of nature (E) (or events) with their respectiveprobabilities (P) are given. Find the best course of action.
EventsActs
E1 E2 E3
A1 2.5 2.0 −1A2 4.0 2.6 0A3 3.0 1.8 1
Probability 0.2 0.6 0.2
17. Calculate EMV and thus select the best act for the followingpay-off table:
States ofnature
Probability Pay-off (Rs) by the player A B C
X 0.3 −2 −5 20Y 0.4 20 −10 −5Z 0.3 40 60 30
18. Consider the pay-off matrix
States ofnature
Probability Act A1 donotexpand
Act A2Expand200 units
Act A3Expand400 units
Highdemand
0.4 2500 3500 5000
Mediumdemand
0.4 2500 3500 2500
Lowdemand
0.2 2500 1500 1000
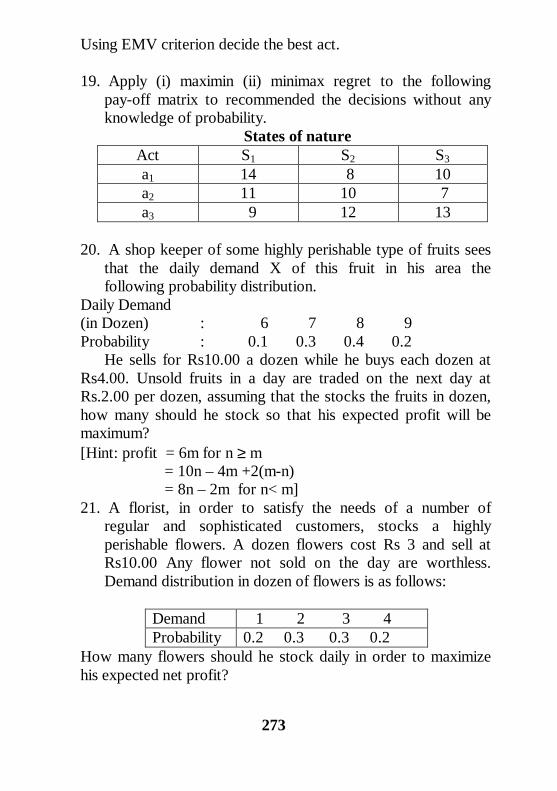
273
Using EMV criterion decide the best act.
19. Apply (i) maximin (ii) minimax regret to the followingpay-off matrix to recommended the decisions without anyknowledge of probability.
States of natureAct S1 S2 S3a1 14 8 10a2 11 10 7a3 9 12 13
20. A shop keeper of some highly perishable type of fruits seesthat the daily demand X of this fruit in his area thefollowing probability distribution.
Daily Demand(in Dozen) : 6 7 8 9Probability : 0.1 0.3 0.4 0.2
He sells for Rs10.00 a dozen while he buys each dozen atRs4.00. Unsold fruits in a day are traded on the next day atRs.2.00 per dozen, assuming that the stocks the fruits in dozen,how many should he stock so that his expected profit will bemaximum?[Hint: profit = 6m for n ≥ m
= 10n – 4m +2(m-n) = 8n – 2m for n< m]
21. A florist, in order to satisfy the needs of a number ofregular and sophisticated customers, stocks a highlyperishable flowers. A dozen flowers cost Rs 3 and sell atRs10.00 Any flower not sold on the day are worthless.Demand distribution in dozen of flowers is as follows:
Demand 1 2 3 4Probability 0.2 0.3 0.3 0.2
How many flowers should he stock daily in order to maximizehis expected net profit?
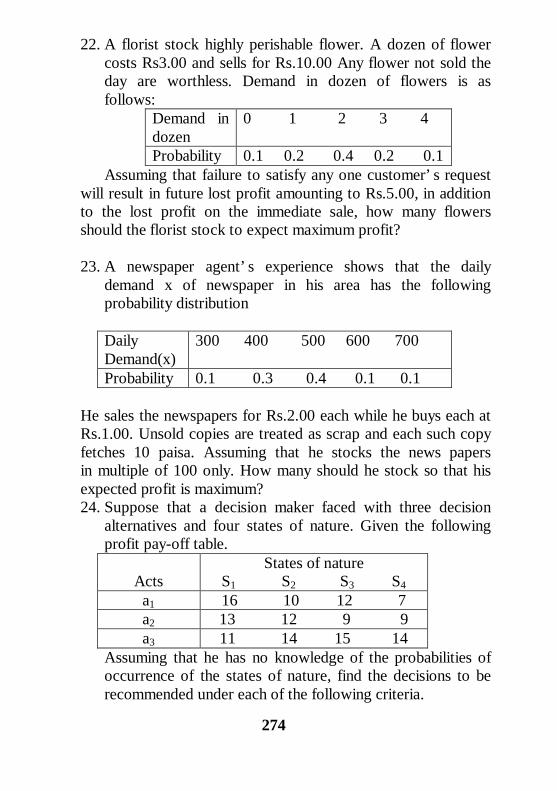
274
22. A florist stock highly perishable flower. A dozen of flowercosts Rs3.00 and sells for Rs.10.00 Any flower not sold theday are worthless. Demand in dozen of flowers is asfollows:
Demand indozen
0 1 2 3 4
Probability 0.1 0.2 0.4 0.2 0.1Assuming that failure to satisfy any one customer’ s request
will result in future lost profit amounting to Rs.5.00, in additionto the lost profit on the immediate sale, how many flowersshould the florist stock to expect maximum profit?
23. A newspaper agent’ s experience shows that the dailydemand x of newspaper in his area has the followingprobability distribution
DailyDemand(x)
300 400 500 600 700
Probability 0.1 0.3 0.4 0.1 0.1
He sales the newspapers for Rs.2.00 each while he buys each atRs.1.00. Unsold copies are treated as scrap and each such copyfetches 10 paisa. Assuming that he stocks the news papersin multiple of 100 only. How many should he stock so that hisexpected profit is maximum?24. Suppose that a decision maker faced with three decision
alternatives and four states of nature. Given the followingprofit pay-off table.
ActsStates of nature
S1 S2 S3 S4a1 16 10 12 7a2 13 12 9 9a3 11 14 15 14
Assuming that he has no knowledge of the probabilities ofoccurrence of the states of nature, find the decisions to berecommended under each of the following criteria.
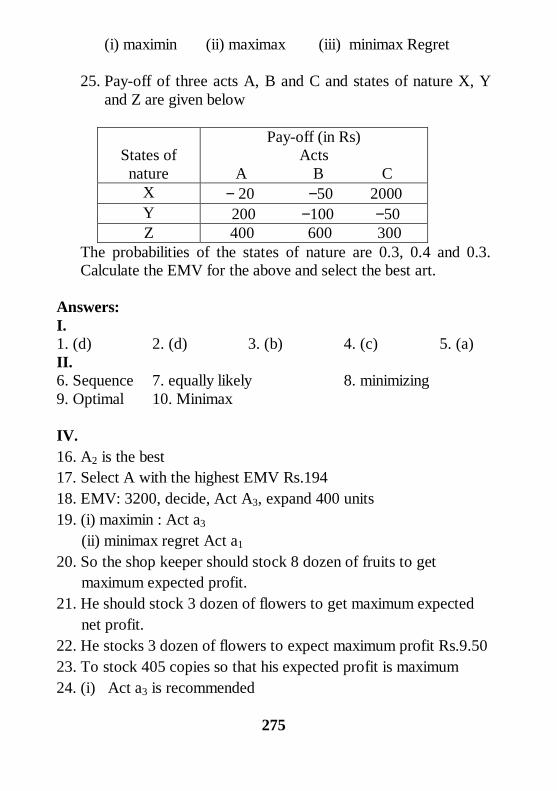
275
(i) maximin (ii) maximax (iii) minimax Regret
25. Pay-off of three acts A, B and C and states of nature X, Yand Z are given below
States ofnature
Pay-off (in Rs)Acts
A B CX − 20 −50 2000Y 200 −100 −50Z 400 600 300
The probabilities of the states of nature are 0.3, 0.4 and 0.3.Calculate the EMV for the above and select the best art.
Answers:I.1. (d) 2. (d) 3. (b) 4. (c) 5. (a)II.6. Sequence 7. equally likely 8. minimizing9. Optimal 10. Minimax
IV.16. A2 is the best17. Select A with the highest EMV Rs.19418. EMV: 3200, decide, Act A3, expand 400 units19. (i) maximin : Act a3
(ii) minimax regret Act a1
20. So the shop keeper should stock 8 dozen of fruits to get maximum expected profit.21. He should stock 3 dozen of flowers to get maximum expected net profit.22. He stocks 3 dozen of flowers to expect maximum profit Rs.9.5023. To stock 405 copies so that his expected profit is maximum24. (i) Act a3 is recommended