3-in-1 technique applied to mixed ch4:co2 gas hydrates
TRANSCRIPT

3-in-1 technique applied to mixed CH4:CO2 gas hydrates
Nathalia Ortiz Torres
An undergraduate thesis submitted to Universidad de los Andes (Colombia) and Royal Military College of Canada in partial fulfillment of the requirements of thedegree of Chemical and Environmental Engineer at Universidad de los Andes
Abstract
The 3-in-1 method [20] was used to study hydrate morphology, kinetics and phase equilibria of hydrates formed in gas-dominatedsystems containing pure CH4, pure CO2, and two CH4:CO2 mixtures (80:20 and 30:70 on a molar basis). This technique offeredhigh resolution imaging and a tight control of pressure and temperature. The same experimental temperatures were used for all gascompositions. Different pressures allowed to match subcoolings across mixtures, in the range of ∆Tsub = 0.5 K to ∆Tsub = 4.5. Inaddition, multiple driving forces were studied in a single experiment using temperature gradients across a single sample. Crystalmorphology was found to be highly dependent on the CH4:CO2 molar ratio, and a higher dependence on the ∆Tsub was observed formethane-rich hydrate morphology. The measured hydrate film growth rate increased with increasing CO2 content and increasing∆Tsub. Hydrate growth beyond the original droplet boundary (’halo’) was observed for pure CO2 and the two mixtures, and it wasfound to be dependent on the CH4:CO2 molar ratio and ∆Tsub. A stepwise dissociation was used to measured the H-L-V equilibriumtemperature (THLV). The dissociation was carried out by setting a gradient along the slide, which allowed a close control of theH-L-V interface position.
Keywords:Mixed methane-carbon dioxide hydrate, Equilibrium, Growth rate, Morphology
1. Introduction
Gas hydrates are nonstoichiometric, crystalline solids com-posed of hydrogen bonded water cages enclosing volatile guestmolecules [1]. Hydrates generally form at temperatures below300 K and high pressure with non-polar guest molecules andwater [2]. They have three common crystal structures: structureI, structure II, and structure H. The size of the guest moleculehas a direct correlation with the structure formed. Some smallsingle guests that form structure I will form structure II in mix-tures. Methane and ethane mixtures have been broadly stud-ied for this phenomenon [3]. However, carbon dioxide andmethane form structure I only as single guests, and as a mix-ture [4]. Each structure has different cage types, 512 cavityis the building block of all three structures; the nomenclatureindicates it contains twelve pentagonal faces. Structure I unitcrystal is composed of two 512 cages, six 51262 cages and 46water molecules.
There is a growing interest in using natural gas hydrate de-posits as an energy resource. It is estimated that natural hydratedeposits represent twice as much as the total fossil fuel reserves[5]. Most of the deposits contain methane as the major gas hy-drate compound. In addition, CO2 disposal as a hydrate in thebottom of the ocean has been proposed as a method for reduc-ing CO2 atmospheric concentrations [6]. Moreover, the injec-tion of CO2 into CH4 hydrate-bearing sediments could be usedto enhance the recovery of methane from gas hydrate reservoirs[7]. Nonetheless, the temperature rise on the oceans due to cli-mate change could cause the decomposition of hydrates, which
would contribute to global warming causing a runaway green-house effect[1]. Research about hydrates is necessary in orderto design new technologies for the advantageous use and han-dling of gas hydrates and to further understand hydrate proper-ties and their impact on the environment.
Unruh and Katz [8] reported the first equilibrium data forCH4 and CO2 mixed gas hydrates. Later, several researchersmeasured phase equilibrium for this system ([9, 10, 11, 12, 13]).Applying the Gibbs phase rule [14], there are two degrees offreedom under a three phase equilibrium, which means two in-tensive variables must be controlled in order to find a uniqueequilibrium point. For example, Ohgaki et al. [13] measuredthe isothermal equilibrium conditions at 280 K by varying thegas composition and reporting the pressure and gas composi-tion at the equilibrium point.
According to previous studies on growth rates of CO2 andCH4 hydrate films [15, 16, 17, 18], hydrate-film-growth veloc-ity is strongly dependent on the degree of subcooling (∆Tsub =
THLV−Texp). Moreover, it has been shown that at fixed subcool-ing, growth rate increases with increasing experimental temper-ature [16]. Consequently, in order to compare the growth ratesof different hydrate systems, it is necessary to set the same driv-ing force (∆Tsub) under the same equilibrium and experimentaltemperatures. In addition, the growth rate under the same ∆Tsubis dependent on the guest molecule. Peng et al. [16] reportedthat CO2 hydrate-film-growth rate is higher than that of the CH4hydrates. This was attributed to the higher solubility of CO2in water. Likewise, Daniel-David et al. [19] reported that thegrowth rate was more rapid at higher molar ratios of CO2 in the
1

CH4:CO2 gas mixture.Hydrate morphology has also been reported as highly de-
pendent on the degree of subcooling for both pure and mixedsystems. At high ∆Tsub, the surface morphology for CO2 andCH4 guest molecules is smoother and more uniform due to adecrease in the size of the crystals [20, 21, 19, 22]. However,there are some discrepancies among the studies on CH4:CO2crystal morphology. Ueno et al. [23] concluded that the crys-tal shape changed from polygons to dendrites with increasing∆Tsub, but the difference in composition of the mixed gas hadlittle influence on crystal morphology. These results were at-tributed to the higher solubility of CO2 in water, indicating thatthe crystal morphology may be controlled by the guest compo-sition in the liquid phase and not by the feed gas composition.Nevertheless, according to Daniel-David et al. [19], at simi-lar ∆Tsub, methane-rich hydrates have a smooth crystal mor-phology, whereas carbon dioxide-rich hydrate crusts show well-defined crystalline facets. Also, Peng et al. [16] reported thatCO2-hydrate crusts were rougher and thicker than CH4-hydratecrusts.
As seen, the morphology and growth rate may be affectedby the solubility of the guest molecule, the composition of themixed gas and the degree of subcooling. In general, previousstudies agree on the dependence of the growth rate on the gascomposition: the growth rate increases with increasing CO2molar ratio. However, the dependence of crystal morphologyon the gas composition is not yet clear.
The objective of this work was to evaluate, observe and com-pare gas hydrate morphology, kinetics and phase equilibria ofhydrates formed with CH4 and CO2 gas mixtures with differentmolar ratios using the 3-in-1 technique. This technique allowsthe compilation of high quality images and a precise control ofpressure and temperature, providing reliable data and compara-ble results [20].
2. Experimental
2.1. Apparatus
For the present work, a high-pressure vessel designed toallow the assessment of phase equilibrium, morphology andapparent kinetics of gas hydrates was used. This reactor al-lows precise temperature control and stationary observation ofa hydrate-liquid-vapor interface at pressures up to 20 MPa [20].The vessel fitted with sapphire sight windows and wrapped ina coolant jacket contains a bilateral temperature control stage(High-Pressure Bilateral Temperature Control Stage or HP-BTCS). The HP-BTCS allows to independently control tem-perature on opposite sides of the stage using two thermoelectriccoolers (TEC) (see Figure 1). Temperatures at both sides of thestage were measured by thermistor elements (TE Technology,MI, USA) with an instrumental uncertainty of uthermistor = 0.01K. A sapphire slide is used to hold the water sample and bridgethe two ends of the stage.
Sample’s images were acquired with a PCO.edge 5.5 sCMOScamera (Optikon, ON, Canada). For low magnification images,a Nikon AF-Micro-Nikkor 60 mm lens (Optikon, ON, Canada)
Figure 1: Schematic of the High-Pressure Bilateral Temperature Control Stage.(A) Thermoelectric cooler module. (B) Copper plate. (C) Sapphire substrate.(D) Water droplet. (E) Heat sink [20].
is used, and an Infinity KC microscope and IF series objectives(Optikon, ON, Canada) is used for high magnification images.The pressure in the cell is measured by a Rosemount 3051spressure transmitter (Laurentide Controls, QC, Canada) withan instrumental uncertainty of uP = 0.005 MPa, and the bulktemperature is measured with a platinum RTD probe (OmegaEngineering, QC, Canada) with an instrumental uncertainty ofuRTD = 0.32 K. Figure 2 shows a simplified schematic of thegas hydrate crystallizer.
Figure 2: Apparatus Schematic (A) 316 stainless steel pressure vessel. (B)Sapphire sight windows. (C) Video camera. (D) Cold light source. (E) Coolantjacket. (F) Refrigerated circulator. (G) Bi-polar PID temperature controllers[20].
With this apparatus, the initial gas composition can be as-sumed to be the same as the experimental molar fraction sinceit is a gas-dominated system and changes in composition arenegligible. To prove this, the change in composition was cal-culated using the maximum conversion possible to gas hydrate.The total volume of the vapor phase in the reactor was approx-imately 255 cm3. The change in gas composition using a watersample of 20 µL and the 80:20 mixture under 3.25 MPa and277.5 K was estimated to be less than 0.05%.
2.2. Methods
In this work, two types of temperature profiles were used:uniform surface temperature and constant temperature gradi-ent (see Figure 3). Uniform surface temperature experiments
2

were used to observe crystal morphology and growth rate un-der a specific degree of subcooling (∆Tsub) defined as the differ-ence between the equilibrium temperature (THLV) and the ex-perimental temperature (Texp). Three ∆Tsub were used: high(∆Tsub=4 K, Texp = 273.5 K), medium (∆Tsub= 2 K, Texp =
275.5 K) and low (∆Tsub= 1 K, Texp = 276.5 K) subcooling.On the other hand, constant gradient experiments allowed the
observation of hydrate growth subject to several driving forcesduring a single experiment. Also, hydrate dissociation underconstant temperature gradient was used to determine the equi-librium temperature (at the system pressure) corresponding tothe solid-liquid interface position for each experiment. For this,the hot end was first set slightly above THLV while the otherTEC is set to achieve a 4 K difference along the slide. The tem-perature of both TECs was increased simultaneously in 0.2 Ksteps.
Figure 3: Temperature profiles used in this work (a) Constant temperature gra-dient (TL < THLV < TH) (b) Uniform surface temperature (TL=TH < THLV).
Before setting the stage at experimental conditions, the re-actor was purged with nitrogen and then purged with a differ-ent gas depending on the system to be evaluated. In this work,pure methane, pure CO2 and two CH4:CO2 mixtures (80:20 and30:70) were used. Table 1 shows the exact gas composition asprovided by the supplier (Air Liquide, ON, Canada). The ex-perimental procedure for the pretreatment of the sample is illus-trated in Figure 4. In each experiment, the water sample of 20µL was pretreated by forming ice at atmospheric pressure as amethod to reduce the nucleation time in forming hydrates. Onceice was formed, the pressure was increased to the experimen-tal pressure and the temperature was raised slightly above thefreezing point to form the first hydrate, which then was disso-ciated by increasing the temperature above the Hydrate-Liquid-Vapor equilibrium temperature. After a few minutes, the tem-perature is lowered again to form a hydrate under a specifictemperature profile.
2.3. Experimental conditions
Table 1 shows the conditions used in this work. Experi-mental pressures were set to have identical hydrate-liquid-vaporequilibrium temperatures, independent of the gas mixture. The
Figure 4: Experimental procedure for the pretreatment of the water sample. (1)P = 0.1 MPa, the slide temperature is decreased to 253.2 K to form ice. (2)Pressure is increased to experimental pressure. (3) Temperature is increasedto 274.2 K to form the first hydrate from ice. (4) The first hydrate is disso-ciated by increasing the temperature above the THLV. The dotted line showsthe ice boundary separating the Hydrate-Ice-Vapor equilibrium (H-I-V) and theHydrate-Liquid-Vapor equilibrium (H-L-V)
102 yCH4 102 yCO2 P/MPa THLV/K99.99 - 4.03 277.580.00 20.00 3.25 277.529.94 70.06 2.35 277.5
- 99.90 2.10 277.5
Table 1: Experimental conditions in this work. The H-L-V equilibrium temper-ature (THLV) was matched in all systems by varying the pressure according toeach system.
equilibrium temperature was set according to the conditionsfound for pure CH4 hydrate formation in a previous study pre-formed with the same crystallizer [20]. For the binary hydrates,the pressure was calculated with the Hydrate Prediction Pro-gram (HYDOFF) [24]. For the single guest hydrates, the pres-sure was calculated using literature data as compiled by Sloan[24].
3. Results and Discussion
3.1. Hydrate Morphology
Figure 5 shows the crystal morphology for hydrates formedunder uniform surface temperature profile. Two factors wereevaluated: subcooling and CH4:CO2 molar ratio.
An increasing number of dendrites appeared either by in-creasing CO2 content or by increasing the subcooling. For puremethane and the methane rich mixture (CH4:CO2 80:20), thesurface became smoother with increasing ∆Tsub. As expected[20], pure methane hydrates exhibited a faceted morphology atlow subcooling, medium subcooling showed granular crystalsand the crystal habit changed to spherulites under high subcool-ing. On the other hand, crystal habit of the CO2 rich mixture(CH4:CO2 30:70) appeared to be insensitive to changes in sub-cooling. Pure CO2 hydrates had feather-like crystals under all
3

the evaluated subcoolings, which became more closely packedwith lower temperatures. The latter has been shown by San-doval [25].
Figure 6 shows magnified pictures for the crystal morphol-ogy of binary hydrates formed under a uniform temperatureprofile. Crystals became more closely packed with increasingsubcooling resulting in a smoother surface for both 80:20 and30:70 mixtures. The effect of subcooling was more evident for80:20 hydrates which transformed from quasi-faceted, to gran-ular, to smooth. Even though smoothing was evident with in-creased subcooling, a whiskery morphology characterized the30:70 mix at all subcoolings.
Methane hydrates have a transition in morphology fromfaceted crystals to granular morphology at ∆Tsub ' 1.3 K (seeFigure 2 in [20]), whereas the effect of subcooling on crystalmorphology is less evident for CO2 hydrates. Figures 7 and 8show binary hydrates formed under a constant temperature gra-dient profile. According to these images, 80:20 hydrates havea transition in crystal morphology at around ∆Tsub ' 1 K, thecrystal habit changes from large dendritic crystals to a moregranular crystal habit. The 30:70 mixture also shows a tran-sition at approximately 1 K subcooling. However, it is muchless pronounced that of the 80:20. CO2-hydrate crystal habithas been shown to be less sensitive to changes in subcooling[25], so gas mixtures with higher CO2 concentrations would beexpected to behave this way.
3.2. Hydrate Film Growth Rate and Driving ForceThe driving force in this work was varied using two fac-
tors: ∆Tsub and CH4:CO2 molar ratio. A higher CO2 contentincreases the overall solubility of the gas in the liquid phasesince CO2 solubility is approximately 20 times higher than CH4[26, 27]. The increase in gas solubility increases the drivingforce due to mass transfer. Likewise, the increase in ∆Tsub in-creases the guest solubility and the heat transfer, which trans-lates into a higher driving force.
As expected, the measured growth rates (see Figure 9 and10) increased with increasing CO2 content and ∆Tsub, whichagrees with previous works ([15, 16, 17, 18, 19]). Figure 9shows the growth rate of CH4 single hydrates and 80:20 binaryhydrates under several subcoolings. A clear dependency of thegrowth rate on the driving force was observed, and the 80:20growth rate was approximately 50% higher than pure methane.Figure 10 shows the growth rate of the 4 different CH4:CO2molar ratios used in this work. The 30:70 growth rate was moreaffected by the CO2 content compared to 80:20 hydrates, whichproves that the growth rate is controlled not only by the degreeof subcooling, but also by mass transfer.
The measured growth rate for the 30:70 hydrates is approxi-mately one order of magnitude higher than the velocity reportedon a previous work for hydrates with approximately the samecomposition and under similar pressure and temperature [23].This difference is ascribed to the system setup, as the mea-surements in this work were done from axial views. Furthercomparison with literature is not practical due to the limitedavailable data from previous work on hydrate growth rate forCH4:CO2 binary hydrates.
Kishimoto and Ohmura [28] proposed a correlation betweenthe growth rate and the concentration difference (∆xg) as thedriving force, based on the idea that the hydrate-film-growthvelocity is controlled by mass transfer limitations. Solubilityunder HL equilibrium is a strong function of temperature but avery weak function of pressure, whereas under L-V equilibriumis a strong function of both temperature and pressure [29].
For CH4:CO2 mixed hydrate systems, as experimental condi-tions approach the individual H-L-V equilibrium curves of thepure CO2 or CH4 systems, the solubility approaches that of therespective simple hydrate system [27]. According to the datareported by Bruusgaard et al [27], CH4 solubility under H-L-V equilibrium for the binary hydrate increases with increasingpressures and decreasing temperatures. On the contrary, CO2solubility increases with decreasing pressures and increasingtemperatures.
The two factors affecting driving force (∆xg and ∆Tsub) areillustrated in Figure 11. In this Figure, the arrows indicate thechange in solubility compared to the pure system. This changeis higher for CO2 than CH4, which explains why a more sig-nificant shift in the hydrate growth rate was observed in theCO2-rich binary hydrates respect to the closest single hydratesystem (Figure 10). Another factor to consider is the concentra-tion difference for both guests (∆xg). This difference is higherfor CO2 than for CH4, which produces a higher driving forcedue to mass transfer for the CO2 rich hydrates. Under a fixedTHLV, the solubility of both guests decreases under the mixturepressure. However, the overall ∆xg is in between pure CO2 (topboundary) and CH4 (bottom boundary).
Table 2 shows the velocity and morphology of hydratesformed with gas of different CH4:CO2 molar ratios and different∆Tsub. Although morphology was found to depend on growthvelocity (∆Tsub) for the same gas mixture, crystal habit was alsofound to depend greatly on gas composition. For example, en-tries (c) and (i) and entries (d) and (g) have very similar veloci-ties, yet fundamentally different morphologies.
3.3. Growth mechanism
Figure 12 shows growth sequences of hydrates formed underlow subcooling (∆Tsub ' 1 K). Pure methane hydrate grew as anirregular front produced by large faceted crystals. In addition,large methane hydrate crystals grew ahead of growing crystalfront and later attached later to it. The crystal growth frontprogressed from polygonal to almost perfectly circular with in-creasing CO2 concentration. More initial growth points wereobserved for methane-rich hydrates. Initial growth points ap-peared in the periphery and moved toward the to the center ofthe droplet (Figure 12).
The growing hydrate film rotated with respect to its cen-troid when the initial growing point moved toward the centerof the droplet. Methane-rich hydrates rotated more and rotationceased in every case as as soon as the hydrate film reached thedroplet boundary. For pure methane hydrates, the film rotationincreased with increasing driving force.
Ridges formed when two or more initial points collided (seeFigure 12g and 12k). Due to the low solubility of CH4 in liquid
4

Figure 5: Hydrates formed using an uniform surface temperature profile. (a)-(d) T = 276.5 K, low subcooling (∆Tsub ' 1 K). (e)-(h) T = 275.5 K, mediumsubcooling (∆Tsub ' 2 K). (i)-(l) T = 273.5 K, high subcooling (∆Tsub ' 4 K). (a), (e), (i) CH4 hydrates, P = 4.03 MPa. (b), (f), (j) CH4:CO2 80:20 hydrates, P =
3.25 MPa. (c), (g), (k) CH4:CO2 70:30 hydrates, P = 2.35 MPa. (d), (h), (l) CO2 hydrates, P = 2.10 MPa.
Figure 6: CH4:CO2 binary hydrates morphology under magnified pictures. (a)-(c) CH4:CO2 80:20 hydrates, P = 3.25 MPa. (d)-(f) CH4:CO2 70:30 hydrates, P =
2.35 MPa.
5

Table 2: Velocity and morphology of hydrates formed with different CH4:CO2 molar ratios and under high, medium and low subcooling. (a)-(d) T = 276.5 K, lowsubcooling (∆Tsub ' 1 K). (e)-(h) T = 275.5 K, medium subcooling (∆Tsub ' 2 K). (i)-(l) T = 273.5 K, high subcooling (∆Tsub ' 4 K). (a), (e), (i) CH4 hydrates, P= 4.03 MPa. (b), (f), (j) CH4:CO2 80:20 hydrates, P = 3.25 MPa. (c), (g), (k) CH4:CO2 70:30 hydrates, P = 2.35 MPa. (d), (h), (l) CO2 hydrates, P = 2.10 MPa.A higher growth rate was obtained with increasing CO2 content (from left to right) and increasing ∆Tsub (from top to bottom). Crystal habit is not solely related tothe hydrate film growth rate because at approximately the same velocity ((c) and (i), (d) and (g)), a different morphology was obtained. Uncertainty is measured asone standard deviation.
Figure 7: CH4:CO2 80:20 hydrate formed using a constant gradient profile witha difference of 4 K along the slide. TH = 278.5 K (top). TL = 274.5 K (bottom).P = 3.25 MPa. (a) ∆Tsub ' 0.6 K. Large dendrites and gas bubbles appear asblack dots. (b) ∆Tsub ' 0.9 K. Transition in morphology from large dendritesto grains (c) ∆Tsub ' 1.2 K. Smaller grains with a smoother surface. Hydrategrowth beyond the original droplet boundary (halo) can be seen at the colderside of the slide.
water, some bubbles remained in the droplet as a result of thedissociation of the first hydrate formed from ice. These bub-bles appeared more frequently in 30:70 experiments (Figure 5),
Figure 8: CH4:CO2 70:30 hydrate formed using a constant gradient profile witha difference of 4 K along the slide. TH = 278.8 K (top). TL = 274.8 K (bottom).P = 2.35 MPa. (a) ∆Tsub ' 0.7 K. Whiskery morphology. (b) ∆Tsub ' 0.9K. More closely packed whiskers. (c) ∆Tsub ' 1.4 K. Ridge formed by theinterception of two growing hydrate fronts, crystals are more closely packed.A significant amount of hydrate growing beyond the initial droplet boundary(halo) can be observed all around the droplet.
which is attributed to the lower solubility of methane at decreas-ing pressures [27].
Figure 13 shows the growth front of hydrates under differ-
6
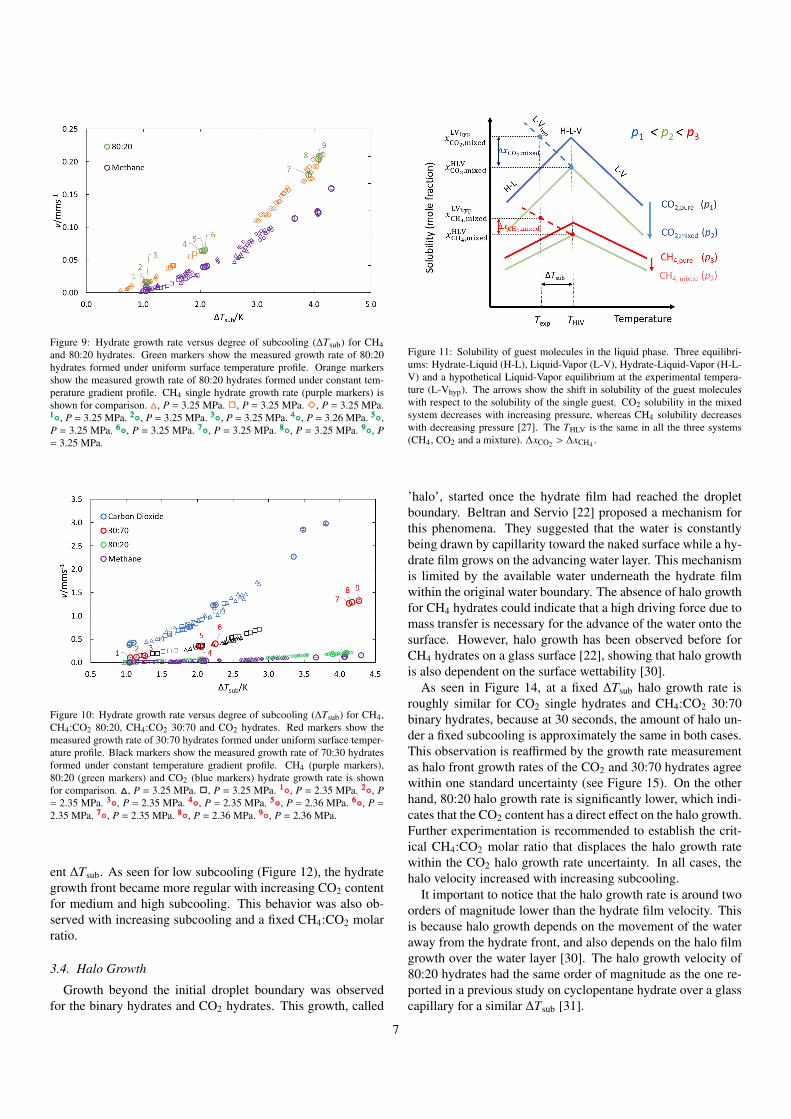
Figure 9: Hydrate growth rate versus degree of subcooling (∆Tsub) for CH4and 80:20 hydrates. Green markers show the measured growth rate of 80:20hydrates formed under uniform surface temperature profile. Orange markersshow the measured growth rate of 80:20 hydrates formed under constant tem-perature gradient profile. CH4 single hydrate growth rate (purple markers) isshown for comparison. 444, P = 3.25 MPa. 222, P = 3.25 MPa. 333, P = 3.25 MPa.1◦1◦1◦, P = 3.25 MPa. 2◦2◦2◦, P = 3.25 MPa. 3◦3◦3◦, P = 3.25 MPa. 4◦4◦4◦, P = 3.26 MPa. 5◦5◦5◦,P = 3.25 MPa. 6◦6◦6◦, P = 3.25 MPa. 7◦7◦7◦, P = 3.25 MPa. 8◦8◦8◦, P = 3.25 MPa. 9◦9◦9◦, P= 3.25 MPa.
Figure 10: Hydrate growth rate versus degree of subcooling (∆Tsub) for CH4,CH4:CO2 80:20, CH4:CO2 30:70 and CO2 hydrates. Red markers show themeasured growth rate of 30:70 hydrates formed under uniform surface temper-ature profile. Black markers show the measured growth rate of 70:30 hydratesformed under constant temperature gradient profile. CH4 (purple markers),80:20 (green markers) and CO2 (blue markers) hydrate growth rate is shownfor comparison. 444, P = 3.25 MPa. 222, P = 3.25 MPa. 1◦1◦1◦, P = 2.35 MPa. 2◦2◦2◦, P= 2.35 MPa. 3◦3◦3◦, P = 2.35 MPa. 4◦4◦4◦, P = 2.35 MPa. 5◦5◦5◦, P = 2.36 MPa. 6◦6◦6◦, P =
2.35 MPa. 7◦7◦7◦, P = 2.35 MPa. 8◦8◦8◦, P = 2.36 MPa. 9◦9◦9◦, P = 2.36 MPa.
ent ∆Tsub. As seen for low subcooling (Figure 12), the hydrategrowth front became more regular with increasing CO2 contentfor medium and high subcooling. This behavior was also ob-served with increasing subcooling and a fixed CH4:CO2 molarratio.
3.4. Halo Growth
Growth beyond the initial droplet boundary was observedfor the binary hydrates and CO2 hydrates. This growth, called
Figure 11: Solubility of guest molecules in the liquid phase. Three equilibri-ums: Hydrate-Liquid (H-L), Liquid-Vapor (L-V), Hydrate-Liquid-Vapor (H-L-V) and a hypothetical Liquid-Vapor equilibrium at the experimental tempera-ture (L-Vhyp). The arrows show the shift in solubility of the guest moleculeswith respect to the solubility of the single guest. CO2 solubility in the mixedsystem decreases with increasing pressure, whereas CH4 solubility decreaseswith decreasing pressure [27]. The THLV is the same in all the three systems(CH4, CO2 and a mixture). ∆xCO2 > ∆xCH4 .
’halo’, started once the hydrate film had reached the dropletboundary. Beltran and Servio [22] proposed a mechanism forthis phenomena. They suggested that the water is constantlybeing drawn by capillarity toward the naked surface while a hy-drate film grows on the advancing water layer. This mechanismis limited by the available water underneath the hydrate filmwithin the original water boundary. The absence of halo growthfor CH4 hydrates could indicate that a high driving force due tomass transfer is necessary for the advance of the water onto thesurface. However, halo growth has been observed before forCH4 hydrates on a glass surface [22], showing that halo growthis also dependent on the surface wettability [30].
As seen in Figure 14, at a fixed ∆Tsub halo growth rate isroughly similar for CO2 single hydrates and CH4:CO2 30:70binary hydrates, because at 30 seconds, the amount of halo un-der a fixed subcooling is approximately the same in both cases.This observation is reaffirmed by the growth rate measurementas halo front growth rates of the CO2 and 30:70 hydrates agreewithin one standard uncertainty (see Figure 15). On the otherhand, 80:20 halo growth rate is significantly lower, which indi-cates that the CO2 content has a direct effect on the halo growth.Further experimentation is recommended to establish the crit-ical CH4:CO2 molar ratio that displaces the halo growth ratewithin the CO2 halo growth rate uncertainty. In all cases, thehalo velocity increased with increasing subcooling.
It important to notice that the halo growth rate is around twoorders of magnitude lower than the hydrate film velocity. Thisis because halo growth depends on the movement of the wateraway from the hydrate front, and also depends on the halo filmgrowth over the water layer [30]. The halo growth velocity of80:20 hydrates had the same order of magnitude as the one re-ported in a previous study on cyclopentane hydrate over a glasscapillary for a similar ∆Tsub [31].
7

Figure 12: Growth sequences for hydrates formed under low subcooling (∆Tsub ' 1 K). (a)-(d) CH4 hydrate growth sequence, P = 4.03 MPa, (a) initial growingpoint that originated from the droplet periphery and moved to the center, (b) large crystals can be seen growing ahead of the hydrate film, (c) the large crystals arenow attached to the growing film, (d) more hydrate growth with an irregular hydrate front. (e)-(h) CH4:CO2 80:20 hydrate growth sequence, P = 3.25 MPa, (e)initial growing point at the periphery of the droplet that later moved to the center (f) nucleation at the droplet boundary, (g) formation of a bridge where the twogrowing fronts collided, (h) the hydrate covered almost all the water droplet. (i)-(l) CH4:CO2 70:30 hydrate growth sequence, P = 2.35 MPa, (i) initial growing pointat the periphery of the droplet, (j) the initial growing point is moving to the center while other growing points originate at the center of the droplet, (k) formationof ridges where the growing points collided, (l) the hydrate covered almost all the water droplet. (m)-(p) CO2 hydrate growth sequence, P = 2.10 MPa, (m) Initialgrowing point that originated from the droplet periphery and moved to the center, (n) radial growth of the hydrate film, (o) the hydrate continues to grow, (p) thehydrate covered almost all the water droplet.
8

Figure 13: Hydrate growth front under low, medium and high subcooling.(a)-(d) T = 276.5 K, low subcooling (∆Tsub ' 1 K). (e)-(h) T = 275.5 K, mediumsubcooling (∆Tsub ' 2 K). (i)-(l) T = 273.5 K, high subcooling (∆Tsub ' 4 K). The hydrate growth front becomes more uniform with increasing subcooling (fromtop to bottom) and increasing CO2 content (form left to right)
Figure 16 offers a detailed view of the halo film obtained forthe binary hydrates. At low subcooling, the halo front is ir-regular (Figure 16a and 16b) but grows uniformly around thedroplet. More halo growth was observed toward the side wherethe hydrate film touched the droplet boundary first. The halofilm front became more regular and translucent with increasingsubcooling. The change in transparency could be caused by theincreasing growing rate of the halo with increasing subcooling(Figure 15): a higher growing rate produces a thinner halo film.This result was also observed in a previous study on cyclopen-tane hydrates, where the halo formed over a thinner water layerat higher subcooling [31].
3.5. Hydrate Dissociation and Phase Equilibria
To measure the equilibrium temperature, a stepwise dissoci-ation was used by setting a gradient of 4 K along the slide andsimultaneously increasing the temperature at both sides of thestage in steps of 0.2 K. The temperature at the hot side of thestage was first set slightly above the THLV. The equilibrium tem-perature corresponds to the temperature at the interface betweenthe liquid and hydrate phase. Each dissociation step moved theinterface toward the cold side of the stage.
Figures 17 and 18 show the interface morphologies obtainedfor the 80:20 hydrates. A band formed in each dissociationstep for 80:20 hydrates that were formed under high subcooling(∆Tsub ' 4 K, Figure 18), whereas a single line was observed
for hydrates formed under lower subcooling (∆Tsub ' 4 K, Fig-ure 17). The difference in the interface morphology shows thatthe hydrate dissociation is dependent on the original hydratemorphology, in other words, the degree of subcooling at whichit was formed.
Figure 21 shows two dissociation steps for a 30:70 binaryhydrate. A band was present in all the 30:70 hydrate dissocia-tion experiments. For the 30:70 hydrates, the water retreated ineach dissociation step toward the cold side of the stage simul-taneously with halo growth which dragged the water out of theinitial droplet boundary.
The band formation starts with the partial dissociation ofthe hydrate close to the H-L-V interface, forming a line whichmoves back from the interface and stops at approximately 1 mmfrom it. This line then darkens because of the reformation ofhydrate crystals, forming a solid band at the interface. The pro-cess of the band formation can be seen in Figure 19. The partialdissociation and later band formation could be caused by the de-creasing thickness of the hydrate film. Film thickness is knownto decrease with increasing driving force from previous workson methane hydrates ([16, 32, 33]). For the 80:20 hydrates, theband formation only occurred with the stepwise dissociation ofhydrates formed under high subcooling (∆Tsub ' 4 K), showingthat more dissociation is present with a thinner hydrate film.
Figure 20 shows the measured equilibrium temperatures inthis work. Using this method, the uncertainty is as low as the in-strumental uncertainty (uthermistor = 0.01K), demonstrating the
9

Figure 14: Halo growth on hydrates formed using an uniform surface temperature profile. (a)-(c) CO2 hydrates, P = 2.10 MPa. (d)-(f) CH4:CO2 30:70, P = 3.25MPa. (g)-(i) CH4:CO2 80:20, P = 3.25 MPa. More halo is obtained with increasing subcooling. The amount of halo at 30 seconds and a fixed subcooling isapproximately the same for CO2 and 30:70 hydrates. It took close to 10 minutes for the 80:20 halo to reach the same amount of growth as for the other two systemsat 30 seconds.
Figure 15: Halo growth rate versus degree of subcooling (∆Tsub) for CO2,CH4:CO2 30:70 and CH4:CO2 80:20 hydrates. The halo growth increases withincreasing subcooling. 30:70 halo growth velocity is approximately the sameas CO2 because they agree within uncertainty (calculated as one standard de-viation). 80:20 halo growth velocity is significantly lower than the other twosystems.
high precision of this technique. The band formation did nothave a significant effect on the calculations because the uncer-tainty was approximately the same for all the measurements re-gardless the type of interface formed. A trend line connectingthe data obtained in this study and literature data with approx-imately the same molar ratios as the ones used in this work,indicate agreement across research groups.
Hydrate-Liquid-Equilibrium for 30:70 mixtures present pres-sures and temperatures close to those of pure CO2, but the80:20 equilibrium conditions occur at significantly lower pres-sure than pure methane. Seo and Lee [12] explained this phe-nomenon by the occupancy of structure I cages: methane fitsinto both large and small cages, whereas CO2 preferably fits inthe large cages. Since there are three times as many large cagesas small ones in structure I, the large cage guest molecule has agreater dominance on the structure.
3.6. Hydrate Aging
Two binary hydrates formed under low subcooling (∆Tsub '
1 K) were observed in the reactor for six hours after formation(see Figure 22). A clear change in morphology can be seenfor both binary hydrates. In the case of the 80:20 hydrate, thesurface became smoother and darker with time. In addition, the
10

Figure 16: Halo morphology of binary hydrates. (a)-(c) CH4:CO2 80:20, P = 3.25 MPa. (a) a ridge can be seen and the halo grows irregularly, (b) halo grows moreuniformly around the initial droplet boundary (c) halo morphology seems to change with increasing driving force.(d)-(f) CH4:CO2 30:70, P = 2.35 MPa. (d) halogrowth front is not uniform, (e) halo growth front becomes more regular (f) smoother halo surface, the darker crystals correspond to the initial growing point.
Figure 17: CH4:CO2 80:20 hydrate dissociation under constant temperaturegradient. The hydrate was formed under medium driving force (∆Tsub ' 2 K).The interface formed between the liquid and hydrate phase is a straight line. (a)First dissociation step, (b) Halo growing from the cold side of the stage.
halo had an irregular growth front around the droplet. The halogrowth caused a decrease in the droplet volume as it dragged thewater out of the initial droplet boundary. In the case of the 30:70hydrate, there was a more significant decrease in the dropletvolume, caused by the higher growth rate of the halo, whichcovered the whole slide within one hour from formation. The30:70 hydrate morphology changed to that of the halo within 6hours from formation. Some hydrate dissociation was observedclose to the initial water boundary.
Neglecting the effect of light variation from experiment toexperiment, the difference in color aspect could be attributed toa different thickness of the hydrate film. At lower growth rateof the halo front, crystals have more time to grow within thewater boundary producing a thicker film, which is the case ofthe 80:20 hydrate.
Figure 18: CH4:CO2 80:20 hydrate dissociation under constant temperaturegradient. The hydrate was formed under high driving force (∆Tsub ' 4 K). Aband forms at the H-L-V interface in each dissociation step. (a) First dissocia-tion step, (b) deformation of the water droplet due to the halo growth at the coldside of the stage.
The change of morphology to a smoother surface has beenreported in previous studies for CO2 hydrates [18] and CH4hydrates [22]. This change could be attributed to two pos-sible mechanisms: there is a surface energy minimization bythe growth of bigger crystals that cover the original crystalboundaries reducing the system’s energy [34], or there was ini-tially concentration differentials in the liquid phase that then de-creased after the formation of the hydrate film, causing a changein morphology toward an uniform guest concentration [22].
11

Figure 19: CH4:CO2 30:70 hydrate dissociation under constant temperaturegradient. A band forms at the H-L-V interface in each dissociation step asthe water retreats toward the cold side of the stage due to capillarity. (a) Firstdissociation step (b) darker marks toward the cold side of the stage correspondto the halo growing from below the sapphire slide.
Figure 20: Phase diagram for CH4:CO2 binary hydrates. Solid lines correspondto the best fit to literature data as compiled by Sloan and Koh [24] for H-L-Vequilibrium of CH4 and CO2 single hydrates. Black markers are literature datafor the mixed systems with approximately the same CH4:CO2 molar ratio asthe ones used in this work. Labels on literature data for the CH4:CO2 mixcorrespond to the methane mole fraction.
Figure 21: Band formation sequence for a 80:20 binary hydrate originallyformed under high driving force. P = 3.25 MPa. TH = 279.6 K. TL = 275.6 K.(a) Start of the dissociation step (b) formation of a secondary line close to theinterface (c) the line moves back toward the cold side of the stage (c)-(d) theline continues to move back (f) the line has stopped and starts to darken (g)-(h)the line continues to darken
Figure 22: Binary hydrate aging sequence. Hydrates were formed under lowsubcooling (∆Tsub ' 1 K). (a)-(c) Aging sequence for a 80:20 hydrate, P =
3.25 MPa. (a) the hydrate covered the whole droplet (b) the hydrate surfacebecomes smoother and there is some halo growth around the droplet (c) thehalo thickened as well as the hydrate surface. (d)-(f) Aging sequence for a 30:70hydrate, P = 2.35 MPa.(d) the hydrate covered the whole droplet (e) the hydratesurface becomes smoother and the halo had covered the whole slide within 1hour from formation, there is a significant decrease in the droplet volume dueto the halo growth (f) the hydrate morphology changed to that of the halo andthe folds within the droplet darkened, there was some dissociation close to theinitial droplet boundary.
4. Conclusions
Crystal morphology, kinetics and phase equilibria was stud-ied for hydrates formed with mixed CH4:CO2 gas with differentmolar ratios using the 3-in-1 technique. Three ∆Tsub were eval-uated using an uniform surface temperature profile in order toobserve the effect of the driving force on crystal morphologyand growth rate. Constant temperature gradient experiments al-lowed the observation of crystal morphology and kinetics underseveral ∆Tsub in a single experiment and the measurement of theH-L-V equilibrium temperature with a stepwise dissociation.
Crystal morphology was observed to be highly sensitive onthe CH4:CO2 molar ratio. The degree of subcooling (∆Tsub) hada more evident effect on the methane-rich hydrate morphology.A dendritic trend was observed either by increasing the sub-cooling or the CO2 content. CH4 single hydrates were foundto have three different crystal habits depending on the drivingforce: large faceted crystals under low driving force (∆Tsub ' 1
12

K), granular crystlas under medium subcooling (∆Tsub ' 2 K),and spherulites under high subcooling (∆Tsub ' 4 K). CO2 sin-gle hydrates had feather-like crystals under all the subcooling.CH4:CO2 binary hydrate morphology was seen as a transitionbetween the two pure systems. 80:20 hydrates had a spheruliticstructure, whereas 30:70 hydrates had whiskery crystals, whichgives as a result a clear difference in crystal habit according tothe CH4:CO2 molar ratio. The 80:20 mixture transformed fromquasi-faceted, to granular, to smooth with increasing subcool-ing, whereas a whiskery morphology characterized the 30:70mix at all subcoolings.
Hydrate film growth rate increased with increasing subcool-ing (∆Tsub) and increasing CO2 content. Also, a more signif-icant change in the hydrate growth rate was observed in theCO2-rich binary hydrates respect to the closest single hydratesystem. This phenomena was attributed to the higher change insolubility of CO2 in the mixture with respect to the pure guest.Hydrates that grew with approximately the same velocity butdifferent CH4:CO2 molar ratios had a different crystal habit.
Hydrate growth beyond the initial droplet boundary was ob-served for hydrates with CO2 guest molecules. This growth,called ’halo’, was found to be dependent on the driving forceas the growth rate increased with increasing subcooling andCO2 content. However, CO2 and 30:70 binary hydrates had ap-proximately the same halo growth rate. The halo morphologyseemed to be dependent on the ∆Tsub as the halo surface wassmoother and thinner with increasing subcooling. Further ex-perimentation is encouraged to study the effect of the CH4:CO2molar ratio and ∆Tsub on halo growth velocity and morphology.
Hydrate-Liquid-Vapor (H-L-V) interface obtained using astepwise dissociation under a temperature gradient allowed themeasurement of the H-L-V equilibrium temperature (THLV)with an uncertainty of up to 0.02 K. The interface morphol-ogy was dependent on the hydrate morphology in the case ofthe 80:20 hydrates, but this did not have an effect on the accu-racy of the HLV results. A band formed in each dissociationstep for 80:20 hydrates that were formed under high subcooling(∆Tsub ' 4 K), whereas a single line was observed for hydratesformed under lower subcoolings. This indicates that the hydratefilm thickness was thinner with increasing subcooling, whichcaused more partial dissociation to happen. Hydrate-Liquid-Vapor equilibrium pressures for the 80:20 mixtures were higherthan the 30:70 mixtures. The 80:20 equilibrium conditions,however, occurred at significantly lower pressure than puremethane and 30:70 mixtures had pressures and temperaturesclose to those of pure CO2.
5. Acknowledgments
I would like to thank Dr. J. Beltran for his guidance andadvice through the development of this work, and SebastianOvalle for all his help and support in the laboratory. I wouldalso like to thank the Universidad de Los Andes (Colombia)for allowing me to complete my undergraduate thesis work inCanada at RMCC, and to the Chemistry and Chemical Engi-neering Department at RMCC for welcoming me in their fa-cilities and for clerical and technical support. Financial sup-
port was provided by the Natural Sciences and Engineering Re-search Council of Canada, The Canadian Foundation for Inno-vation and RMCC.
References
[1] P. Englezos, “Clathrate hydrates,” American Chemical Society, vol. 32,pp. 1251–1274, 1993.
[2] E. D. Sloan, “Introductory overview: Hydrate knowledge development,”American Mineralogist, vol. 89, pp. 1155–1161, 2004.
[3] E. D. Sloan, “Fundamental principles and applications of natural gas hy-drates,” NATURE, vol. 426, 2003.
[4] T. Uchida, I. Y. Ikeda, S. Takeya, Y. Kamata, R. Ohmura, J. Nagao, O. Y.Zatsepina, and B. A. Buffett, “Kinetics and stability of CH4-CO2 mixedgas hydrates during formation and long-term storage,” ChemPhysChem,vol. 6, pp. 646–654, apr 2005.
[5] C. A. Koh, E. D. Sloan, A. K. Sum, and D. T. Wu, “Fundamentals and ap-plications of gas hydrates,” Annual Review of Chemical and BiomolecularEngineering, vol. 2, pp. 237–257, jul 2011.
[6] P. G. Brewer, “Gas hydrates and global climate change,” Annals of theNew York Academy of Sciences, vol. 912, pp. 195–199, jan 2006.
[7] B. P. McGrail, H. T. Schaef, M. D. White, T. Zhu, A. S. Kulkami, R. B. H.adn S. L. Patil, A. T. Owen, and P. F. Martin, Using Carbon Dioxideto Enhance Recovery of Methane from Gas Hydrate Reservoirs: FinalSummary Report. U.S. Department of Energy, 2007.
[8] C. H. Unruh and D. L. Katz, “Gas hydrates of carbon dioxide-methanemixtures,” Journal of Petroleum Technology, vol. 1, pp. 83–86, apr 1949.
[9] V. Belandria, A. H. Mohammadi, and D. Richon, “Phase equilibria ofclathrate hydrates of methane+carbon dioxide: New experimental dataand predictions,” Fluid Phase Equilibria, vol. 296, pp. 60–65, sep 2010.
[10] V. Belandria, A. Eslamimanesh, A. H. Mohammadi, P. Theveneau,H. Legendre, and D. Richon, “Compositional analysis and hydrate dis-sociation conditions measurements for carbon dioxide + methane +wa-ter system,” Industrial & Engineering Chemistry Research, vol. 50,pp. 5783–5794, may 2011.
[11] S. Adisasmito, R. J. Frank, and E. D. Sloan, “Hydrates of carbon diox-ide and methane mixtures,” Journal of Chemical & Engineering Data,vol. 36, pp. 68–71, jan 1991.
[12] Y.-T. Seo and H. Lee, “Multiple-phase hydrate equilibria of the ternarycarbon dioxide, methane, and water mixtures,” American Chemical Soci-ety, 2001.
[13] K. Ohgaki, K. Takano, H. Sangawa, T. Matsubara, and S. Nakano,“Methane exploitation by carbon dioxide from gas hydrates-phase equi-libria for co2-ch4 mixed hydrate system,” Journal of Chemical Engineer-ing of Japan, vol. 29, no. 3, pp. 478–483, 1996.
[14] J. G. Beltran, H. Bruusgaard, and P. Servio, “Gas hydrate phase equilibriameasurement techniques and phase rule considerations,” The Journal ofChemical Thermodynamics, vol. 44, pp. 1–4, jan 2012.
[15] E. M. Freer, M. S. Selim, and E. D. Sloan, “Methane hydrate film growthkinetics,” Fluid Phase Equilibria, vol. 185, pp. 65–75, jul 2001.
[16] B. Z. Peng, A. Dandekar, C. Y. Sun, H. Luo, Q. L. Ma, W. X. Pang, andG. J. Chen, “Hydrate film growth on the surface of a gas bubble suspendedin water,” The Journal of Physical Chemistry B, vol. 111, pp. 12485–12493, nov 2007.
[17] M. Kitamura and Y. H. Mori, “Clathrate-hydrate film growth along wa-ter/methane phase boundaries-an observational study,” Crystal Researchand Technology, vol. 48, pp. 511–519, jul 2013.
[18] T. Uchida, T. Ebinuma, J. Kawabata, and H. Narita, “Microscopic obser-vations of formation processes of clathrate-hydrate films at an interfacebetween water and carbon dioxide,” Journal of Crystal Growth, vol. 204,pp. 348–356, jul 1999.
[19] D. Daniel-David, F. Guerton, C. Dicharry, J.-P. Torre, and D. Broseta,“Hydrate growth at the interface between water and pure or mixedCO2/CH4 gases: Influence of pressure, temperature, gas compositionand water-soluble surfactants,” Chemical Engineering Science, vol. 132,pp. 118–127, aug 2015.
[20] J. R. DuQuesnay, M. C. D. Posada, and J. G. Beltran, “Novel gas hydratereactor design: 3-in-1 assessment of phase equilibria, morphology andkinetics,” Fluid Phase Equilibria, vol. 413, pp. 148–157, apr 2016.
13

[21] R. Tanaka, R. Sakemoto, and R. Ohmura, “Crystal growth of clathratehydrates formed at the interface of liquid water and gaseous methane,ethane, or propane: Variations in crystal morphology,” Crystal Growth &Design, vol. 9, pp. 2529–2536, may 2009.
[22] J. G. Beltran and P. Servio, “Morphological investigations of methane-hydrate films formed on a glass surface,” Crystal Growth & Design,vol. 10, pp. 4339–4347, oct 2010.
[23] H. Ueno, H. Akiba, S. Akatsu, and R. Ohmura, “Crystal growth ofclathrate hydrates formed with methane + carbon dioxide mixed gas atthe gas/liquid interface and in liquid water,” New Journal of Chemistry,vol. 39, no. 11, pp. 8254–8262, 2015.
[24] E. D. Sloan and C. A. Koh, Clathrate Hydrates of Natural Gases. Chem-ical Industries, CRC Press, 3rd ed., 2008.
[25] J. F. Sandoval, S. Ovalle, and J. G. Beltran, “Differences in morphologyand growth mechanism of methane and carbon dioxide hydrates,” Depart-ment of Chemistry and Chemical Engineering, Royal Military College ofCanada, 2016.
[26] S. Hashemi, A. Macchi, S. Bergeron, and P. Servio, “Prediction ofmethane and carbon dioxide solubility in water in the presence of hy-drate,” Fluid Phase Equilibria, vol. 246, pp. 131–136, aug 2006.
[27] H. Bruusgaard, J. G. Beltran, and P. Servio, “Solubility measurements forthe CH4 +CO2+H2O system under hydrate–liquid–vapor equilibrium,”Fluid Phase Equilibria, vol. 296, pp. 106–109, sep 2010.
[28] M. Kishimoto and R. Ohmura, “Correlation of the growth rate of the hy-drate layer at a guest/liquid-water interface to mass transfer resistance,”Energies, vol. 5, pp. 92–100, jan 2012.
[29] A. H. Mohammadi and D. Richon, “Development of predictive techniquesfor estimating liquid water-hydrate equilibrium of water-hydrocarbon sys-tem,” Journal of Thermodynamics, vol. 2009, pp. 1–12, 2009.
[30] S. Esmail and J. G. Beltran, “Methane hydrate propagation on surfacesof varying wettability,” Journal of Natural Gas Science and Engineering,vol. 35, pp. 1535–1543, sep 2016.
[31] A. Touil, D. Broseta, N. Hobeika, and R. Brown, “Roles of wettability andsupercooling in the spreading of cyclopentane hydrate over a substrate,”Langmuir, vol. 33, pp. 10965–10977, oct 2017.
[32] S.-L. Li, C.-Y. Sun, B. Liu, X.-J. Feng, F.-G. Li, L.-T. Chen, and G.-J.Chen, “Initial thickness measurements and insights into crystal growth ofmethane hydrate film,” AIChE Journal, vol. 59, pp. 2145–2154, jan 2013.
[33] Z. Liu, H. Li, L. Chen, and B. Sun, “A new model of and insight intohydrate film lateral growth along the gas–liquid interface considering nat-ural convection heat transfer,” Energy & Fuels, vol. 32, pp. 2053–2063,jan 2018.
[34] J. W. Mullin, Crystallization. Elsevier Science, 2001.
14