31st infofish governing council meeting 20-23 …€¦ · global seafood market trends 31st...
TRANSCRIPT
Global Seafood Market Trends
31st INFOFISH Governing Council Meeting 20-23 December 2016
Kuala Lumpur, Malaysia
Trends in International Fishery Trade
• Sustained by a strong world consumer demand, global total production of fishery products is forecast to reach 175 million MT in 2016, 2.3%, or 4 million MT, more than in 2015.
• The result of 5% growth in aquaculture production at 81.4 million MT
• Development is very much linked with growth in aquaculture - freshwater fish …carps, tilapia and catfish.
• Latest forecasts, international trade in fish and fishery products would remain steady, in terms of volumes in 2016 and value following moderate increase in international fish prices
• The global seafood trade and markets have taken to the new directions.
• Major developed markets still suffering from economic slowdown
• Demand is growing and tremendous potential to benefit developing countries, whose share of global exports stand at approx– 54% in value and 61% in quantity
• The EMERGING MARKETS in Asia have considerable growth in fish consumption due to the rising consumer demand and better price
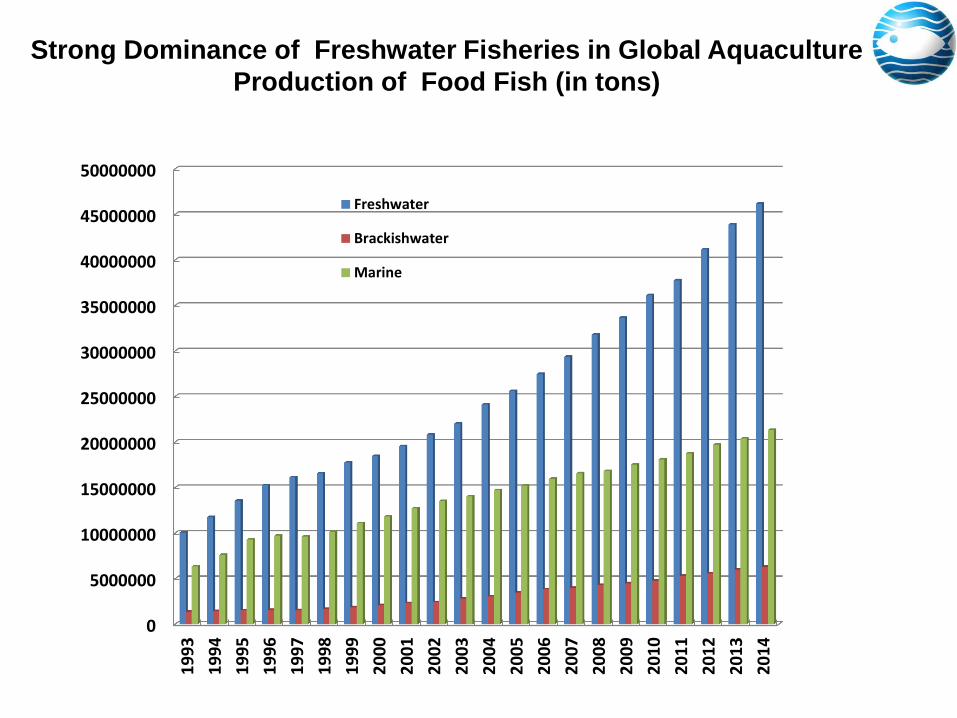
Strong Dominance of Freshwater Fisheries in Global Aquaculture
Production of Food Fish (in tons)
0
5000000
10000000
15000000
20000000
25000000
30000000
35000000
40000000
45000000
500000001
99
3
19
94
19
95
19
96
19
97
19
98
19
99
20
00
20
01
20
02
20
03
20
04
20
05
20
06
20
07
20
08
20
09
20
10
20
11
20
12
20
13
20
14
Freshwater
Brackishwater
Marine
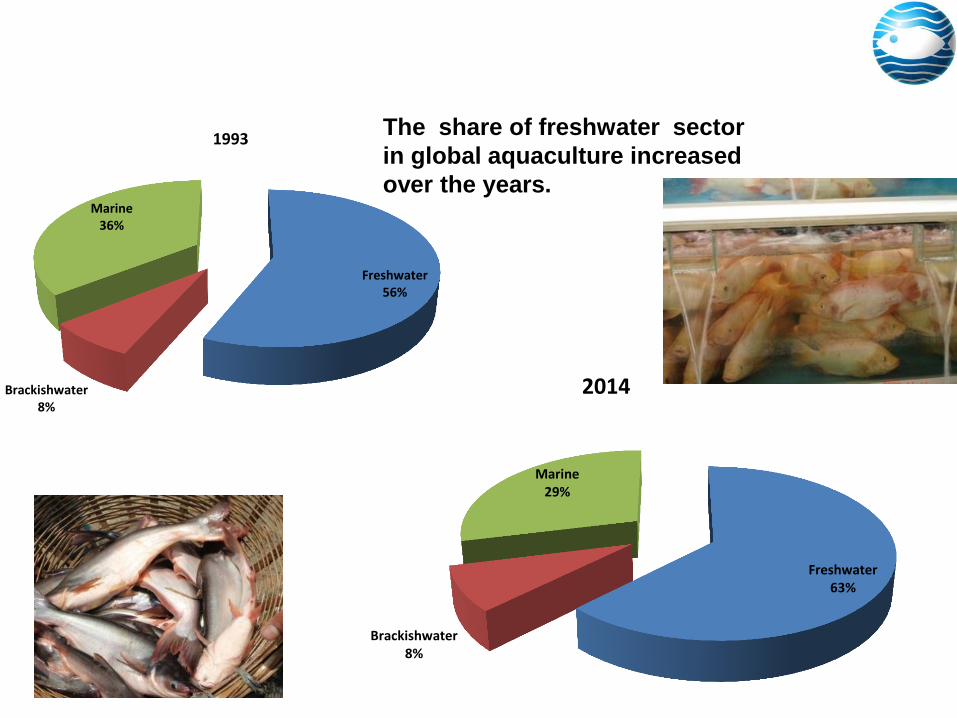
Global Aquaculture Production
The share of freshwater sector
in global aquaculture increased
over the years.
Freshwater 56%
Brackishwater 8%
Marine 36%
1993
Freshwater 63%
Brackishwater 8%
Marine 29%
2014
0
1000000
2000000
3000000
4000000
5000000
6000000
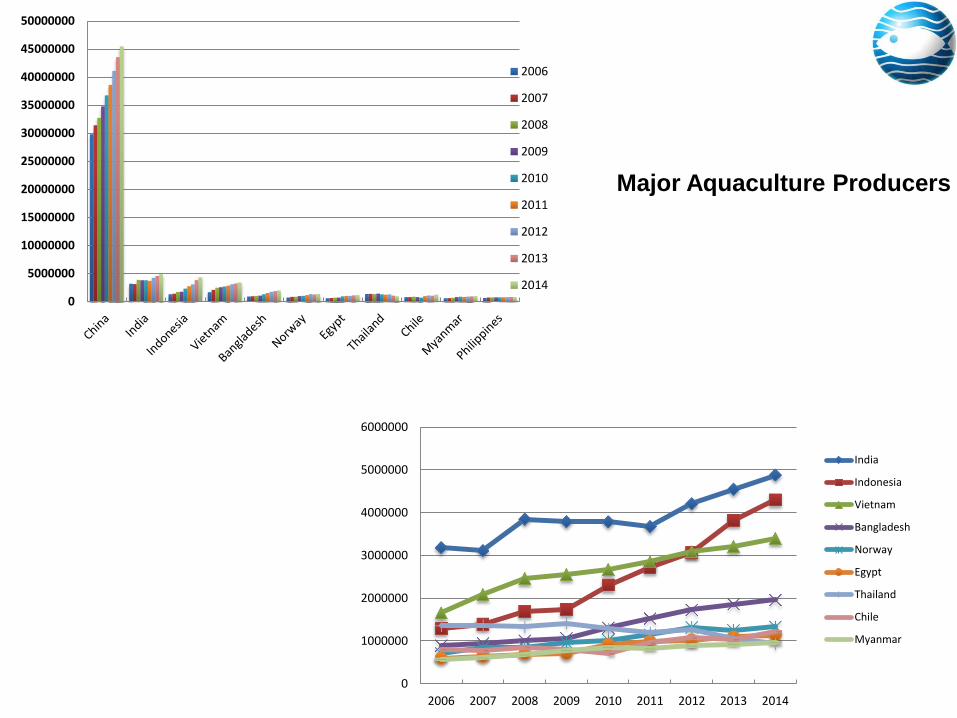
2006 2007 2008 2009 2010 2011 2012 2013 2014
India
Indonesia
Vietnam
Bangladesh
Norway
Egypt
Thailand
Chile
Myanmar
0
5000000
10000000
15000000
20000000
25000000
30000000
35000000
40000000
45000000
50000000
2006
2007
2008
2009
2010
2011
2012
2013
2014
Major Aquaculture Producers
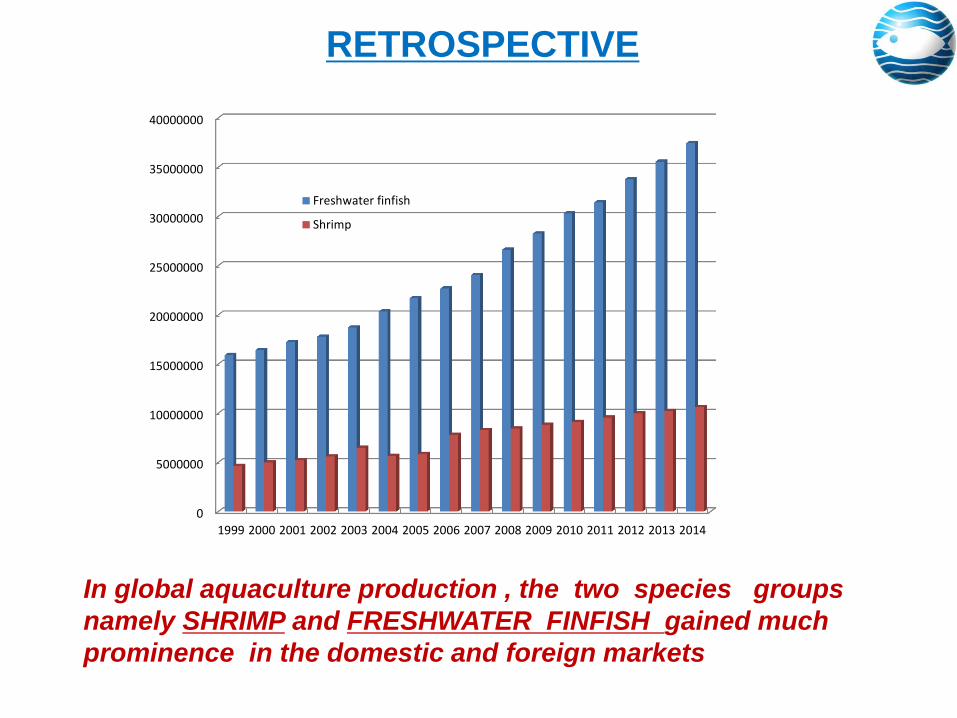
In global aquaculture production , the two species groups
namely SHRIMP and FRESHWATER FINFISH gained much
prominence in the domestic and foreign markets
RETROSPECTIVE
0
5000000
10000000
15000000
20000000
25000000
30000000
35000000
40000000
1999 2000 2001 2002 2003 2004 2005 2006 2007 2008 2009 2010 2011 2012 2013 2014
Freshwater finfish
Shrimp

FARMED SHRIMP remains one of the popular high value species, dominated by primarily vannamei supplies from Asia
0
500000
1000000
1500000
2000000
2500000
3000000
3500000
4000000
1999 2000 2001 2002 2003 2004 2005 2006 2007 2008 2009 2010 2011 2012 2013 2014
Whiteleg shrimp
Giant tiger prawn
Giant river prawn
Penaeus shrimps nei
Kuruma prawn
Argentine red shrimp
Indian white prawn
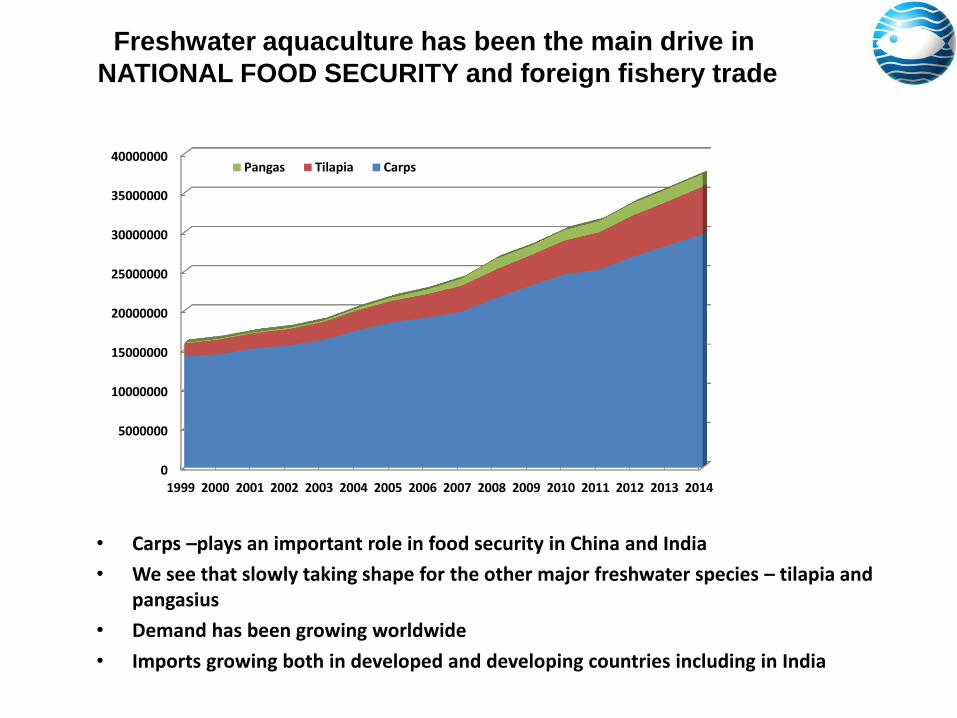
• Carps –plays an important role in food security in China and India
• We see that slowly taking shape for the other major freshwater species – tilapia and pangasius
• Demand has been growing worldwide
• Imports growing both in developed and developing countries including in Indian
Freshwater aquaculture has been the main drive in
NATIONAL FOOD SECURITY and foreign fishery trade
0
5000000
10000000
15000000
20000000
25000000
30000000
35000000
40000000
1999 2000 2001 2002 2003 2004 2005 2006 2007 2008 2009 2010 2011 2012 2013 2014
Pangas Tilapia Carps

Leading Shrimp Exporters
0
50000
100000
150000
200000
250000
300000
350000
400000
450000
2007 2008 2009 2010 2011 2012 2013 2014 2015
India
Ecuador
China
Indonesia
Thailand
Argentina
Canada
Denmark
Netherlands
Honduras
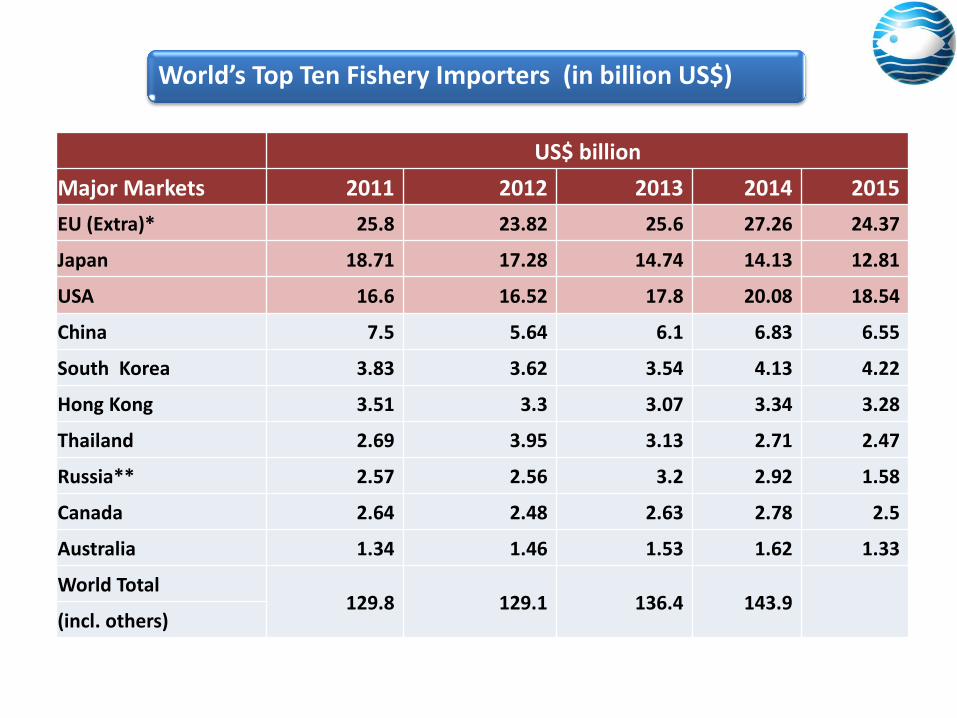
US$ billion
Major Markets 2011 2012 2013 2014 2015
EU (Extra)* 25.8 23.82 25.6 27.26 24.37
Japan 18.71 17.28 14.74 14.13 12.81
USA 16.6 16.52 17.8 20.08 18.54
China 7.5 5.64 6.1 6.83 6.55
South Korea 3.83 3.62 3.54 4.13 4.22
Hong Kong 3.51 3.3 3.07 3.34 3.28
Thailand 2.69 3.95 3.13 2.71 2.47
Russia** 2.57 2.56 3.2 2.92 1.58
Canada 2.64 2.48 2.63 2.78 2.5
Australia 1.34 1.46 1.53 1.62 1.33
World Total 129.8 129.1 136.4 143.9
(incl. others)
World’s Top Ten Fishery Importers (in billion US$)

World’s Top Ten Fishery Exporters (in billion US$)
China
Thailand
Country 2011 2012 2013 2014 2015
China 16.97 18.01 19.19 20.58 19.38
Norway 9.23 8.74 10.14 10.56 8.84
Vietnam 6.11 6.13 6.72 7.80 na
Thailand 8.42 7.97 6.81 6.33 5.38
USA 5.12 5.45 5.56 5.73 5.54
India 3.25 3.35 4.54 5.50 4.76
Chile 4.41 3.78 4.36 5.22 4.31
Canada 4.14 4.14 4.25 4.47 4.64
Indonesia 3.18 3.58 3.82 4.23 3.29
Denmark 3.87 3.59 4.03 4.16 3.70
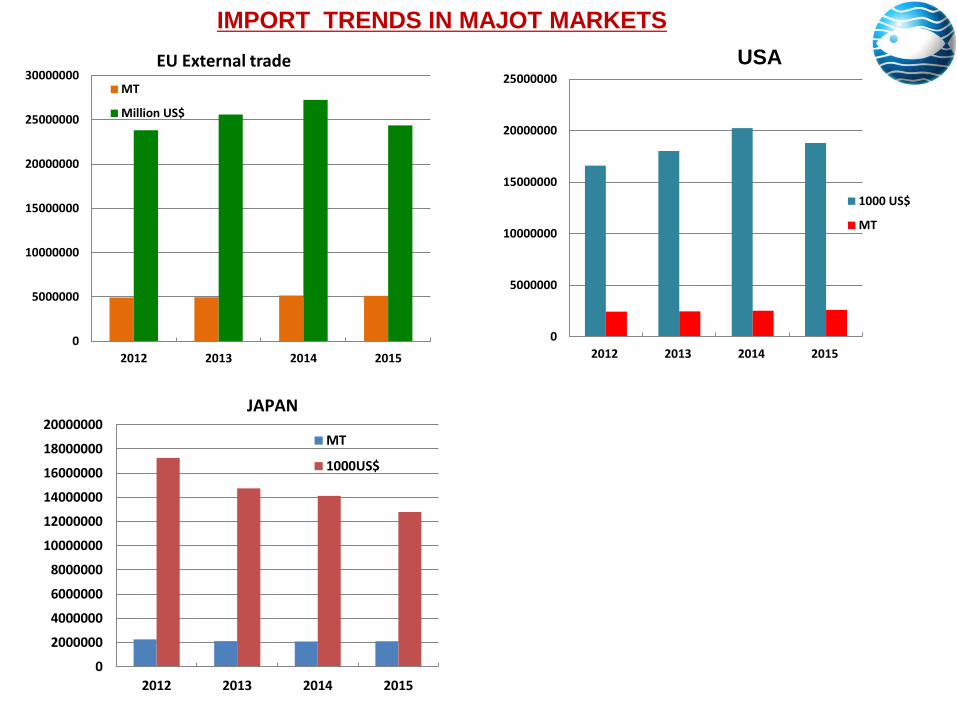
EU External trade
IMPORT TRENDS IN MAJOT MARKETS
0
2000000
4000000
6000000
8000000
10000000
12000000
14000000
16000000
18000000
20000000
2012 2013 2014 2015
MT
1000US$
JAPAN
0
5000000
10000000
15000000
20000000
25000000
2012 2013 2014 2015
1000 US$
MT
USA
0
5000000
10000000
15000000
20000000
25000000
30000000
2012 2013 2014 2015
MT
Million US$
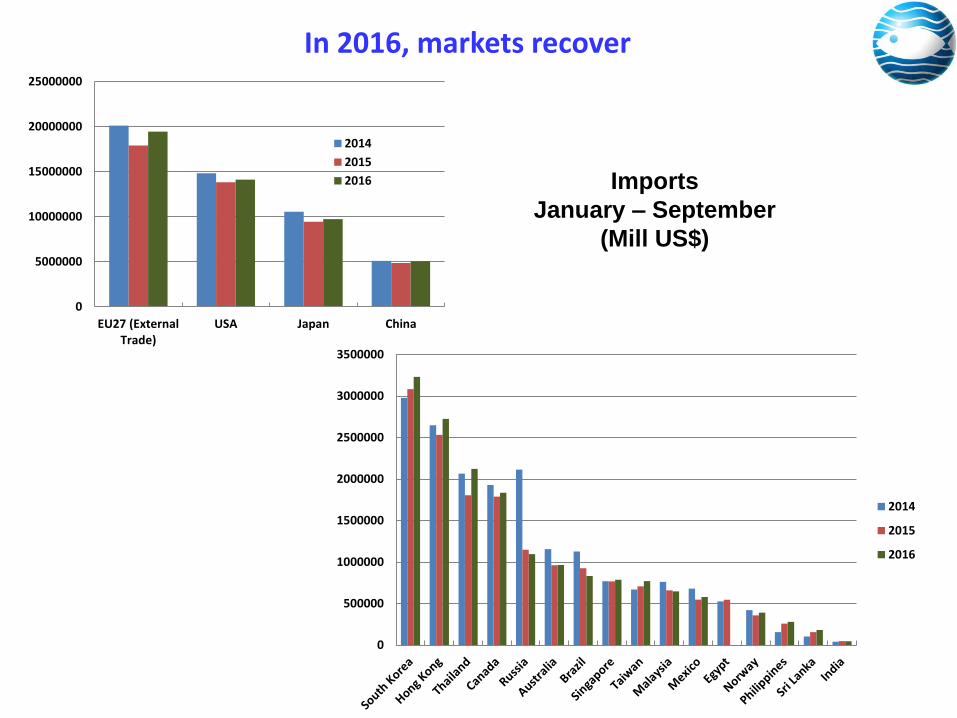
In 2016, markets recover
0
5000000
10000000
15000000
20000000
25000000
EU27 (ExternalTrade)
USA Japan China
2014
2015
2016
0
500000
1000000
1500000
2000000
2500000
3000000
3500000
2014
2015
2016
Imports
January – September
(Mill US$)
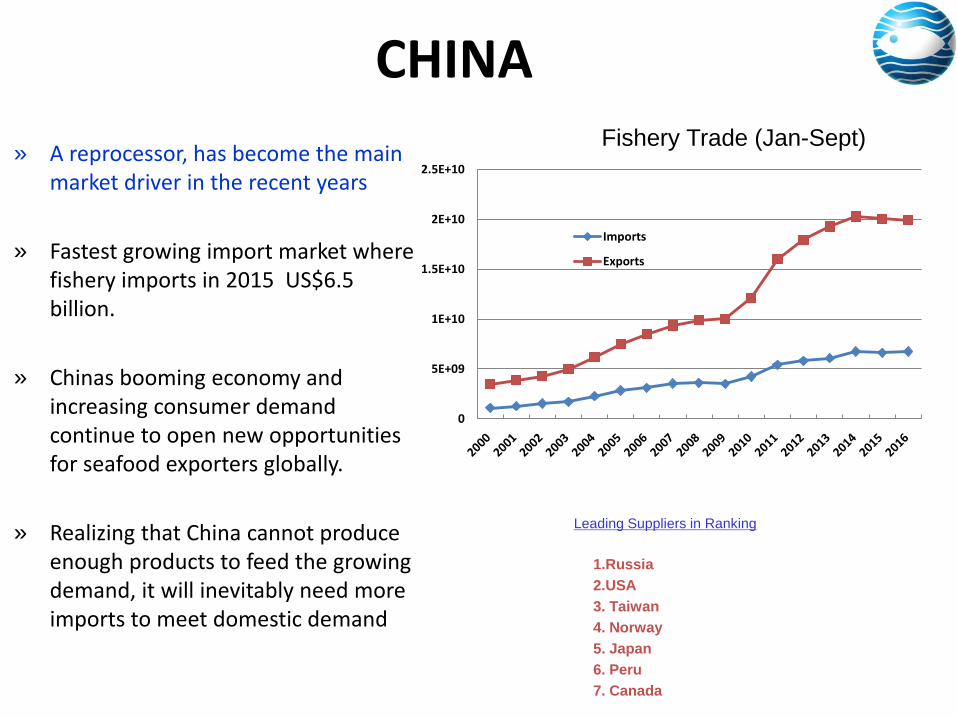
CHINA
» A reprocessor, has become the main market driver in the recent years
» Fastest growing import market where fishery imports in 2015 US$6.5 billion.
» Chinas booming economy and increasing consumer demand continue to open new opportunities for seafood exporters globally.
» Realizing that China cannot produce enough products to feed the growing demand, it will inevitably need more imports to meet domestic demand
Leading Suppliers in Ranking
1.Russia
2.USA
3. Taiwan
4. Norway
5. Japan
6. Peru
7. Canada
0
5E+09
1E+10
1.5E+10
2E+10
2.5E+10
Imports
Exports
Fishery Trade (Jan-Sept)
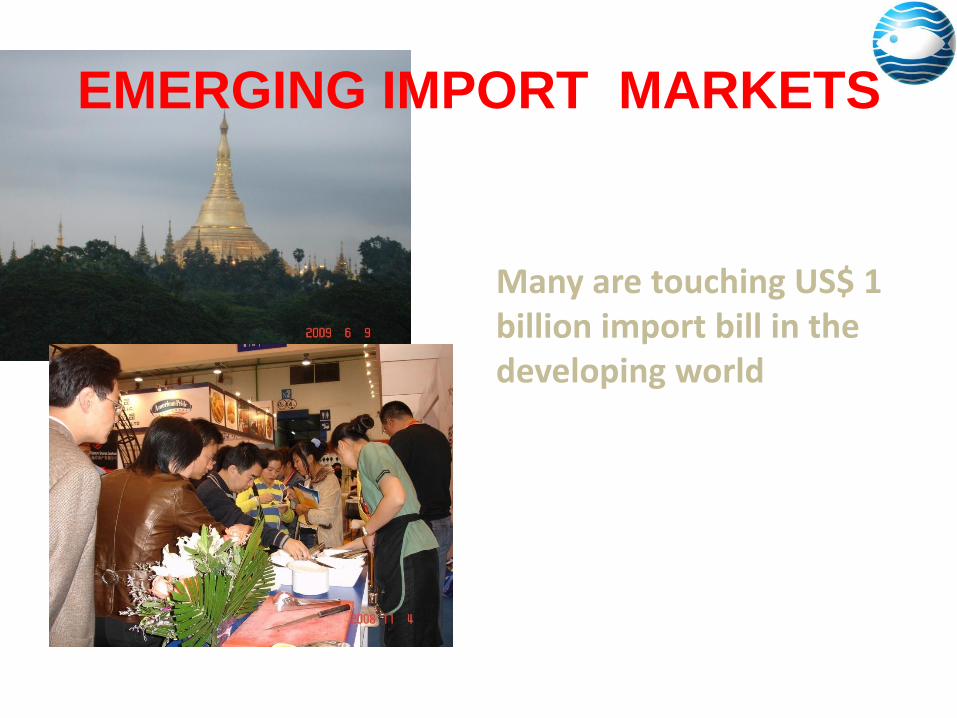
EMERGING IMPORT MARKETS
Many are touching US$ 1 billion import bill in the developing world
SOUTH KOREA
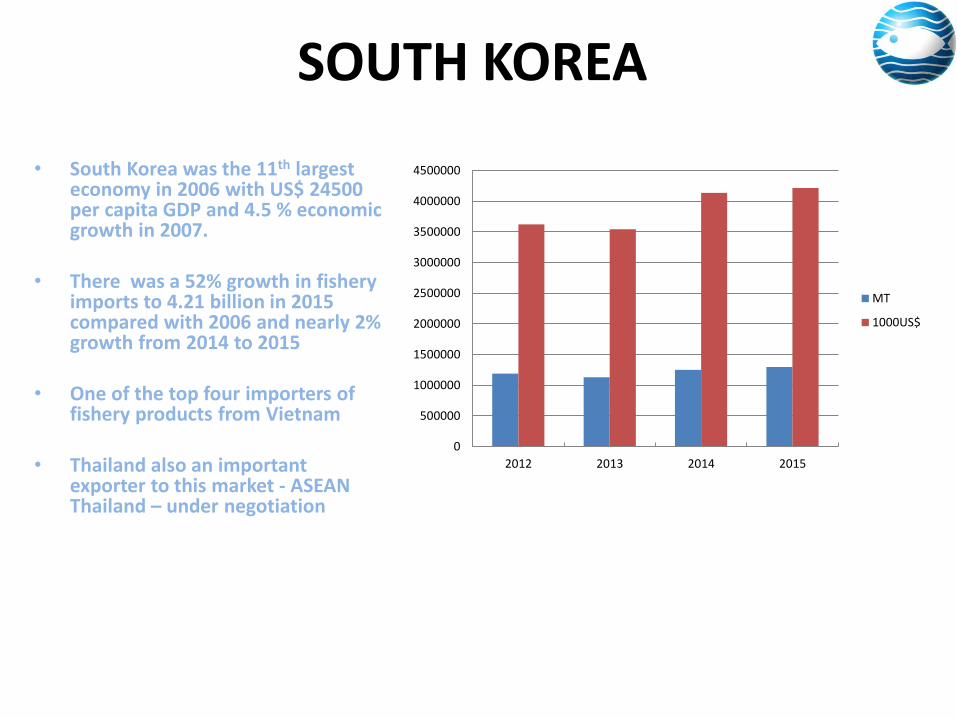
• South Korea was the 11th largest economy in 2006 with US$ 24500 per capita GDP and 4.5 % economic growth in 2007.
• There was a 52% growth in fishery imports to 4.21 billion in 2015 compared with 2006 and nearly 2% growth from 2014 to 2015
• One of the top four importers of fishery products from Vietnam
• Thailand also an important exporter to this market - ASEAN Thailand – under negotiation
0
500000
1000000
1500000
2000000
2500000
3000000
3500000
4000000
4500000
2012 2013 2014 2015
MT
1000US$

Emerging Markets in Latin America
•Fishery imports in Brazil
stands at US$ 1.5 billion in
2010
•Mexican food fish imports
are also growing @US$
925 million in 2014
Significant increases
freshwater fish namely
tilapia and pangasius
China and Vietnam the
leading producers
0
200000000
400000000
600000000
800000000
1E+09
1.2E+09
1.4E+09
1.6E+09
2007 2008 2009 2010 2011 2012 2013 2014 2015
Brazil
Mexico
Colombia
Latin America
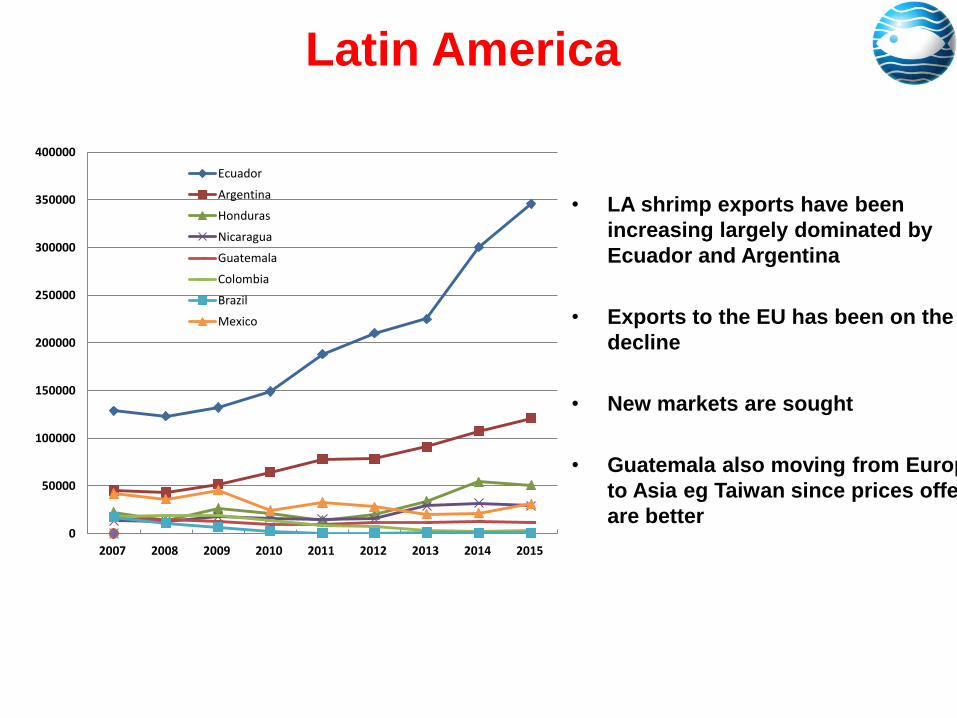
• LA shrimp exports have been
increasing largely dominated by
Ecuador and Argentina
• Exports to the EU has been on the
decline
• New markets are sought
• Guatemala also moving from Europe
to Asia eg Taiwan since prices offered
are better
0
50000
100000
150000
200000
250000
300000
350000
400000
2007 2008 2009 2010 2011 2012 2013 2014 2015
Ecuador
Argentina
Honduras
Nicaragua
Guatemala
Colombia
Brazil
Mexico
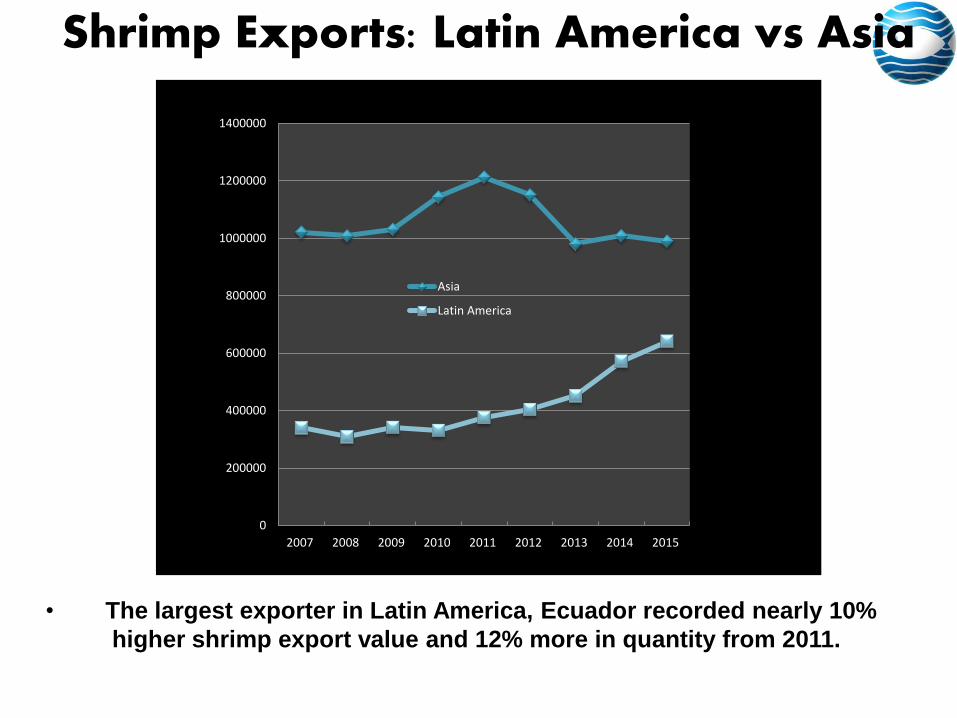
• The largest exporter in Latin America, Ecuador recorded nearly 10%
higher shrimp export value and 12% more in quantity from 2011.
Shrimp Exports: Latin America vs Asia
0
200000
400000
600000
800000
1000000
1200000
1400000
2007 2008 2009 2010 2011 2012 2013 2014 2015
Asia
Latin America
Latin America benefits from the Asian
dilemma…..
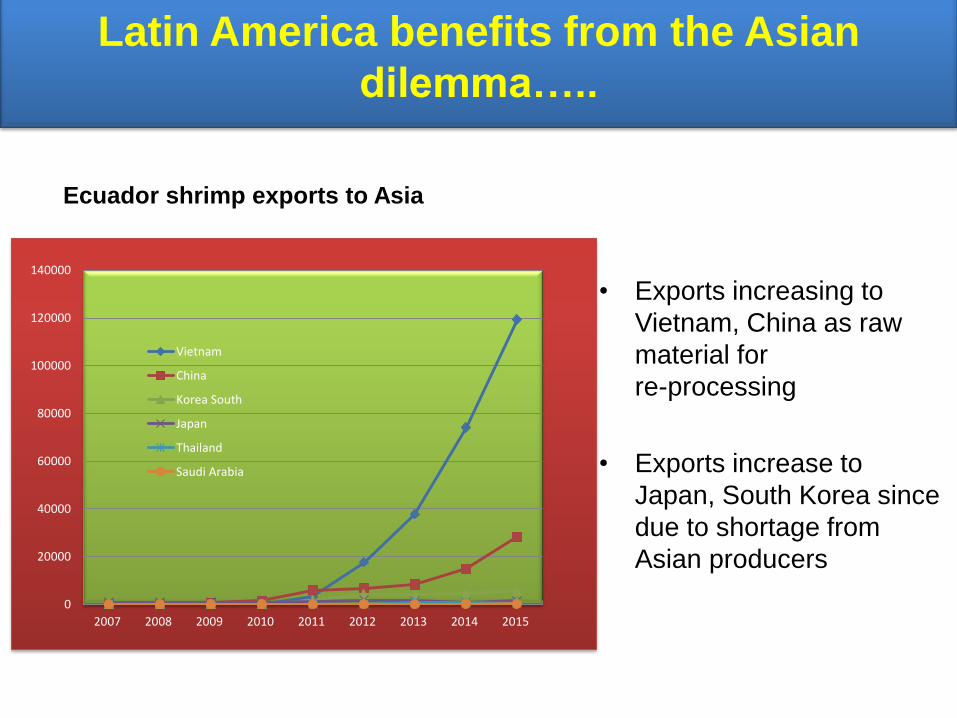
• Exports increasing to
Vietnam, China as raw
material for
re-processing
• Exports increase to
Japan, South Korea since
due to shortage from
Asian producers
Ecuador shrimp exports to Asia
0
20000
40000
60000
80000
100000
120000
140000
2007 2008 2009 2010 2011 2012 2013 2014 2015
Vietnam
China
Korea South
Japan
Thailand
Saudi Arabia
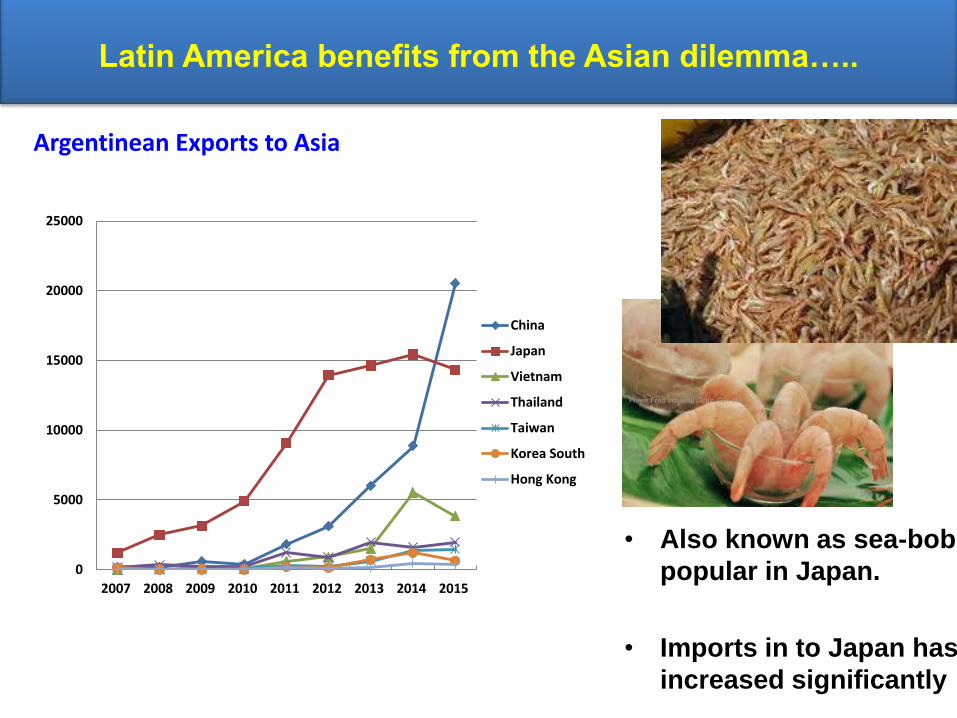
Argentinean Exports to Asia
• Also known as sea-bob
popular in Japan.
• Imports in to Japan has
increased significantly
Argentinean seabob shrimp
(Xiphopenaeus kroyeri)
Latin America benefits from the Asian dilemma…..
0
5000
10000
15000
20000
25000
2007 2008 2009 2010 2011 2012 2013 2014 2015
China
Japan
Vietnam
Thailand
Taiwan
Korea South
Hong Kong
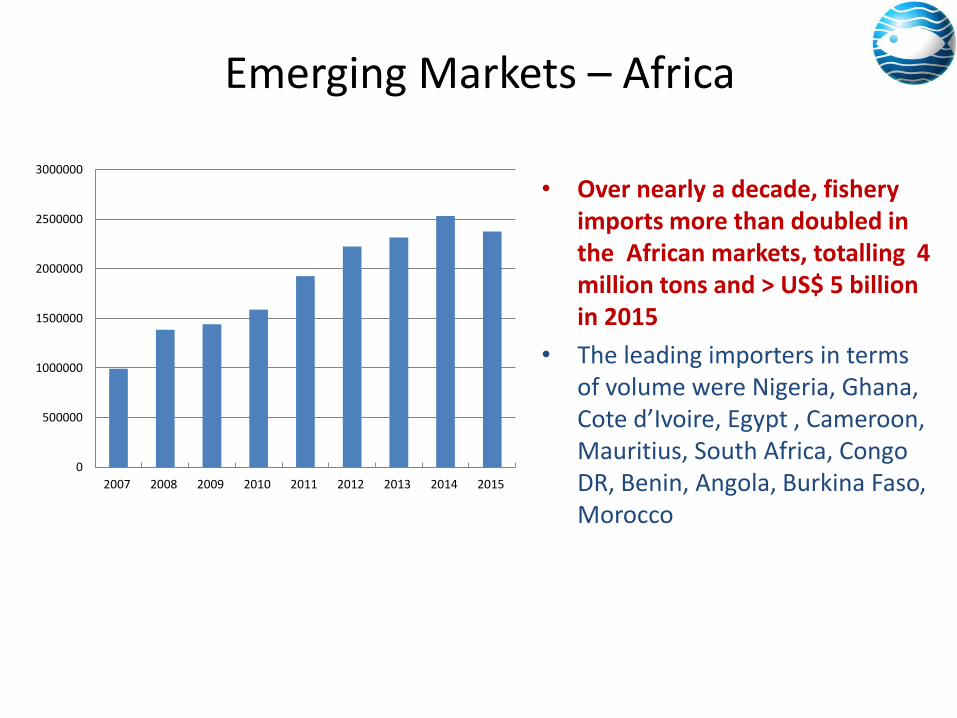
• Over nearly a decade, fishery imports more than doubled in the African markets, totalling 4 million tons and > US$ 5 billion in 2015
• The leading importers in terms of volume were Nigeria, Ghana, Cote d’Ivoire, Egypt , Cameroon, Mauritius, South Africa, Congo DR, Benin, Angola, Burkina Faso, Morocco
Emerging Markets – Africa
0
500000
1000000
1500000
2000000
2500000
3000000
2007 2008 2009 2010 2011 2012 2013 2014 2015
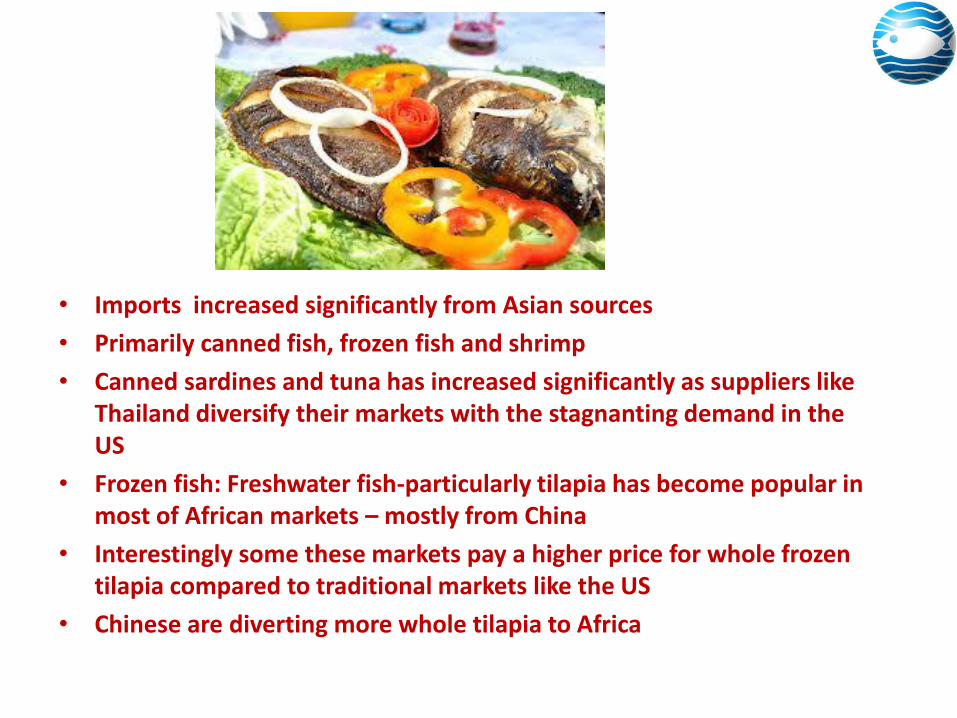
• Imports increased significantly from Asian sources
• Primarily canned fish, frozen fish and shrimp
• Canned sardines and tuna has increased significantly as suppliers like Thailand diversify their markets with the stagnanting demand in the US
• Frozen fish: Freshwater fish-particularly tilapia has become popular in most of African markets – mostly from China
• Interestingly some these markets pay a higher price for whole frozen tilapia compared to traditional markets like the US
• Chinese are diverting more whole tilapia to Africa
Opportunities: Middle East…
• The Gulf Cooperative Council (GCC) - some of the fastest growing economies in the world with more than 37 million residents located in Saudi Arabia, the United Arab Emirates (UAE), Oman, Bahrain, Qatar and Kuwait.
• The GCC imported US$995.5 million worth of fish and seafood products from the world in 2014, an increase of 21.4% from 2013.
• Supply of fish and seafood products is diverse and is imported from over 50 countries.
• The top suppliers in 2014 were India with a 30.6% market share, Thailand (22.7%), and Indonesia (7.0%).
• Main seafood imports are canned tuna, shrimp, frozen fish, snapper, lobsters
0
20000
40000
60000
80000
100000
120000
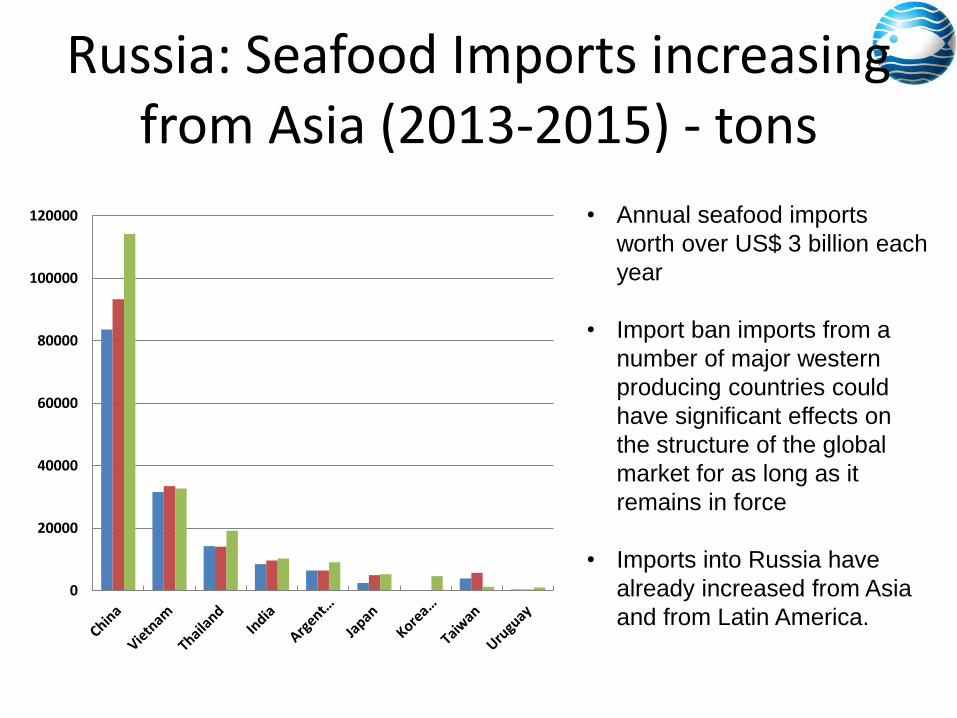
Russia: Seafood Imports increasing from Asia (2013-2015) - tons
• Annual seafood imports
worth over US$ 3 billion each
year
• Import ban imports from a
number of major western
producing countries could
have significant effects on
the structure of the global
market for as long as it
remains in force
• Imports into Russia have
already increased from Asia
and from Latin America.
ASIA –Hub of Emerging Markets
• Asia now has become a hub of emerging markets.
• Many of these markets have developed as lucrative to seafood marketers in the US and Europe including for high value products.
• Over the last few years, demand for foodfish including imports showed steady growth in these markets, when in many traditional western markets the growth rates were negative.
• Demand is also rising in many medium and small scale import markets such as in India which is traditionally not considered a fish eating nation.
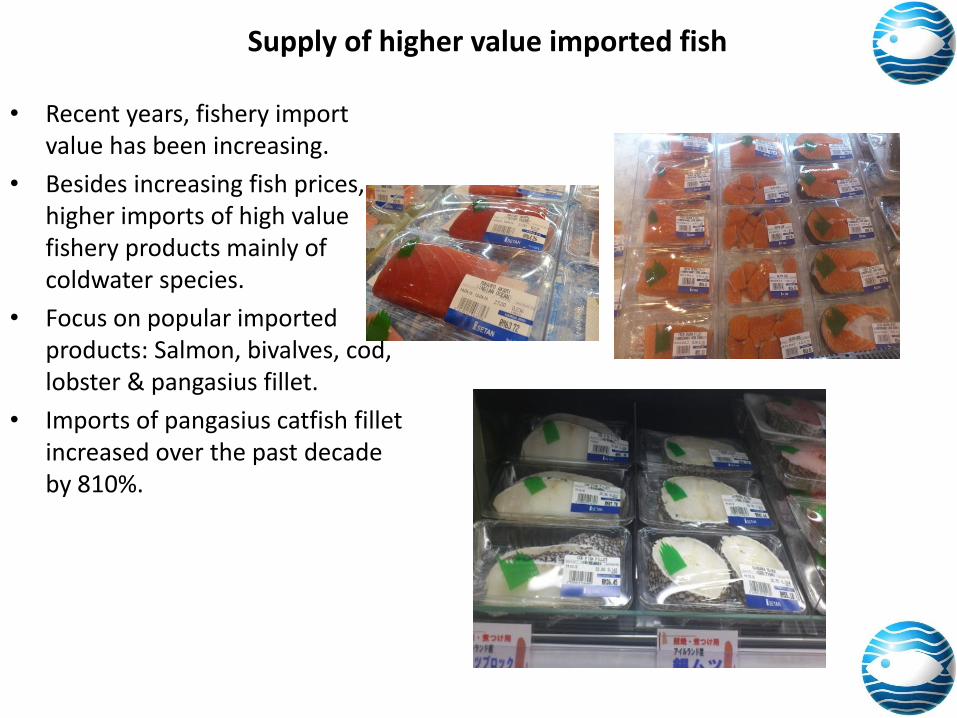
Supply of higher value imported fish
• Recent years, fishery import value has been increasing.
• Besides increasing fish prices, higher imports of high value fishery products mainly of coldwater species.
• Focus on popular imported products: Salmon, bivalves, cod, lobster & pangasius fillet.
• Imports of pangasius catfish fillet increased over the past decade by 810%.
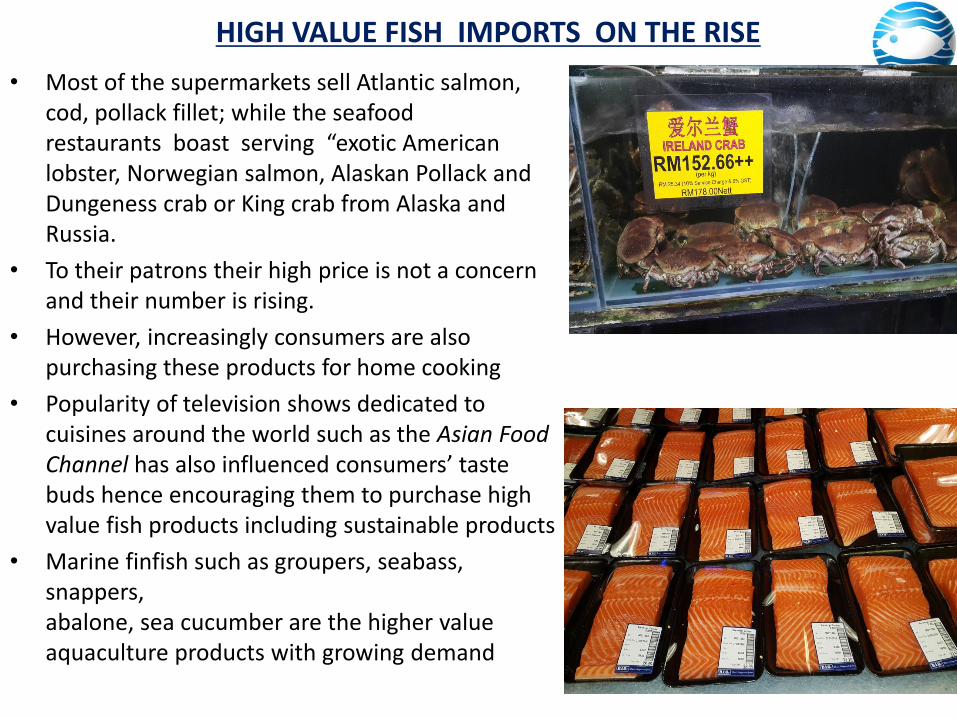
HIGH VALUE FISH IMPORTS ON THE RISE
• Most of the supermarkets sell Atlantic salmon, cod, pollack fillet; while the seafood restaurants boast serving “exotic American lobster, Norwegian salmon, Alaskan Pollack and Dungeness crab or King crab from Alaska and Russia.
• To their patrons their high price is not a concern and their number is rising.
• However, increasingly consumers are also purchasing these products for home cooking
• Popularity of television shows dedicated to cuisines around the world such as the Asian Food Channel has also influenced consumers’ taste buds hence encouraging them to purchase high value fish products including sustainable products
• Marine finfish such as groupers, seabass, snappers, abalone, sea cucumber are the higher value aquaculture products with growing demand
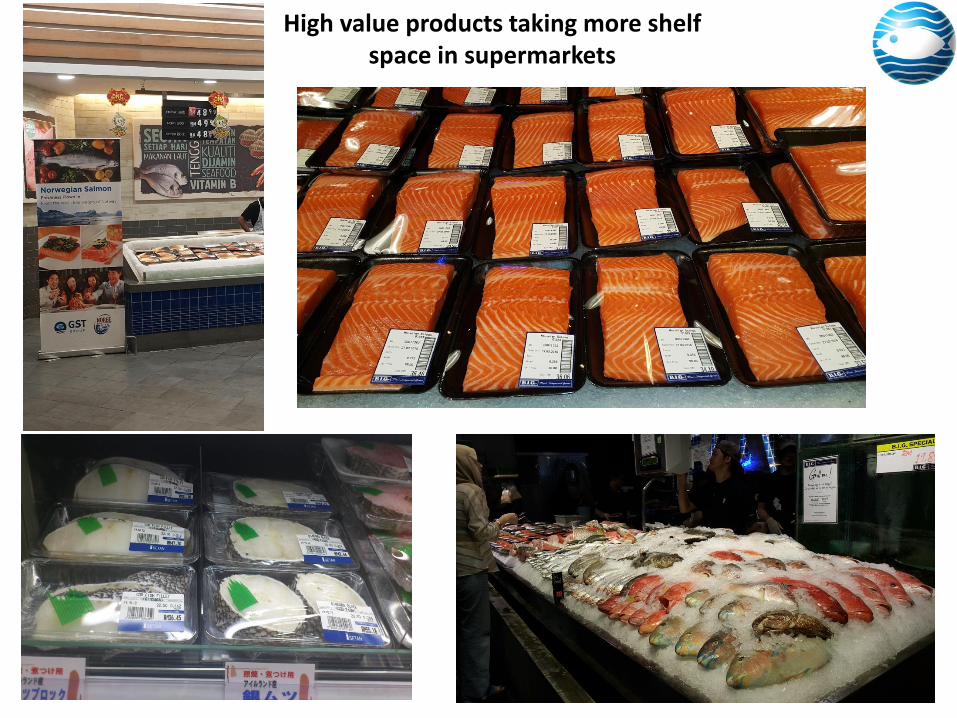
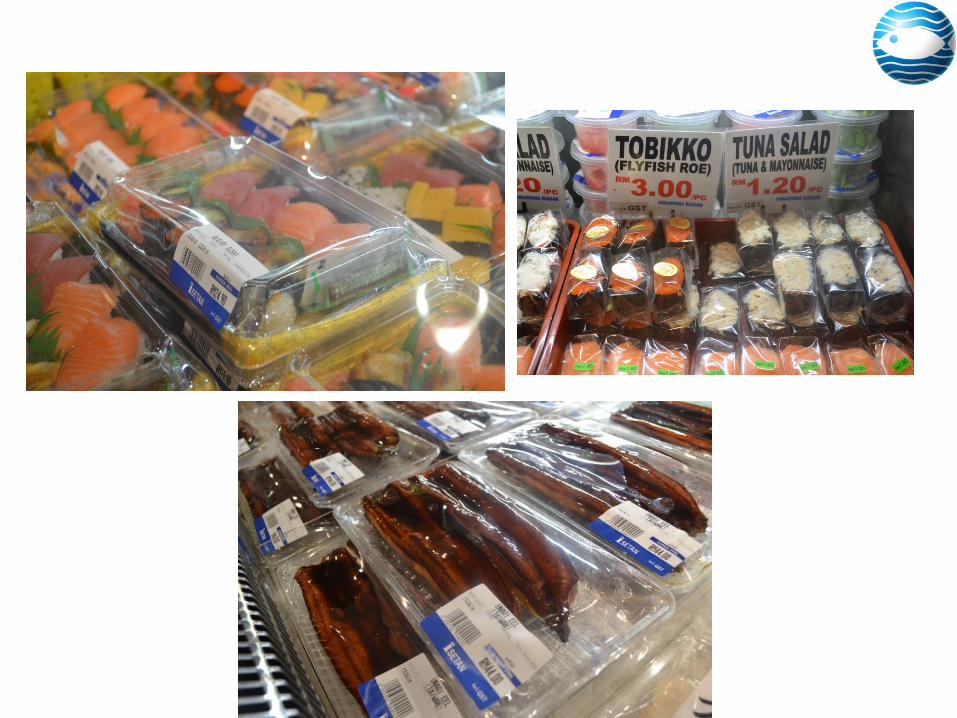
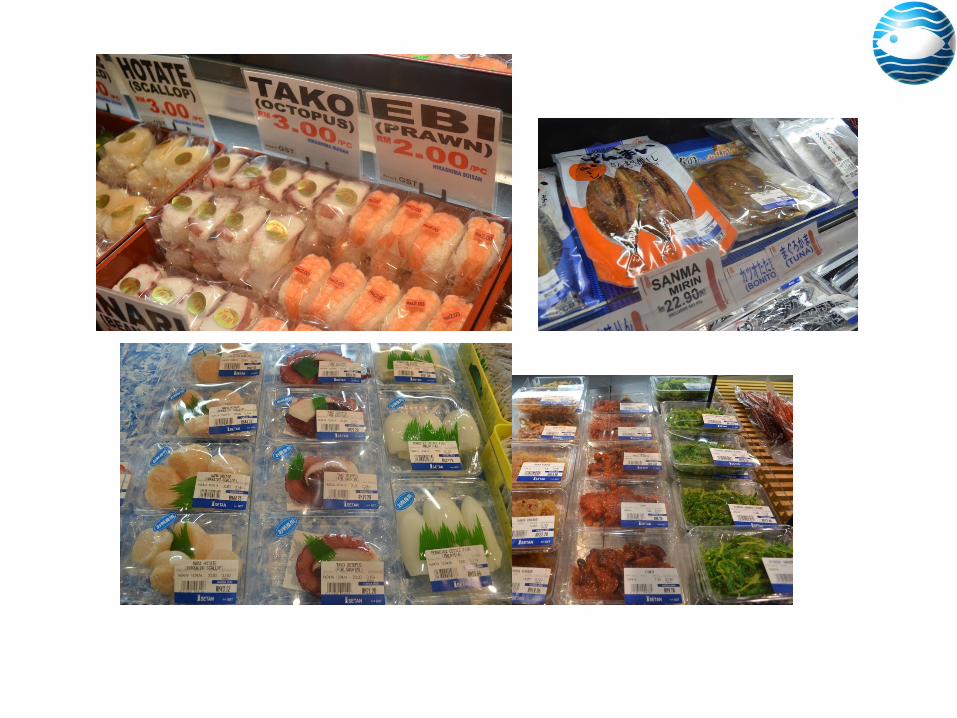
High value products taking more shelf space in supermarkets

----Atlantic mackerel sells at higher price but import demand is growing due to the ‘Omega 3’ factor
Asian mackerel Atlantic mackerel
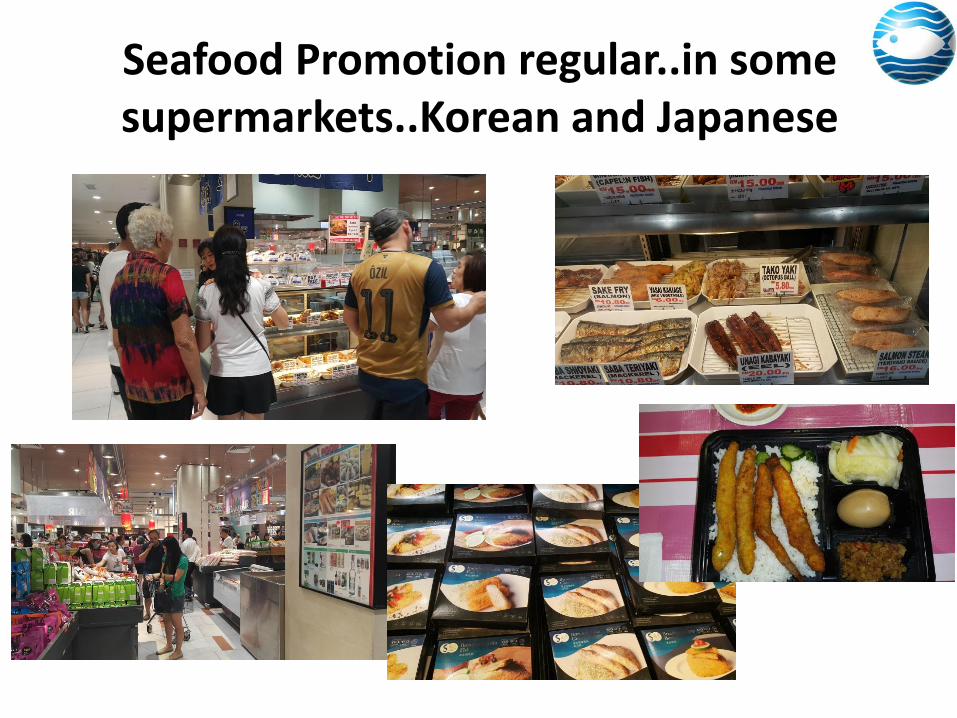
Seafood Promotion regular..in some supermarkets..Korean and Japanese

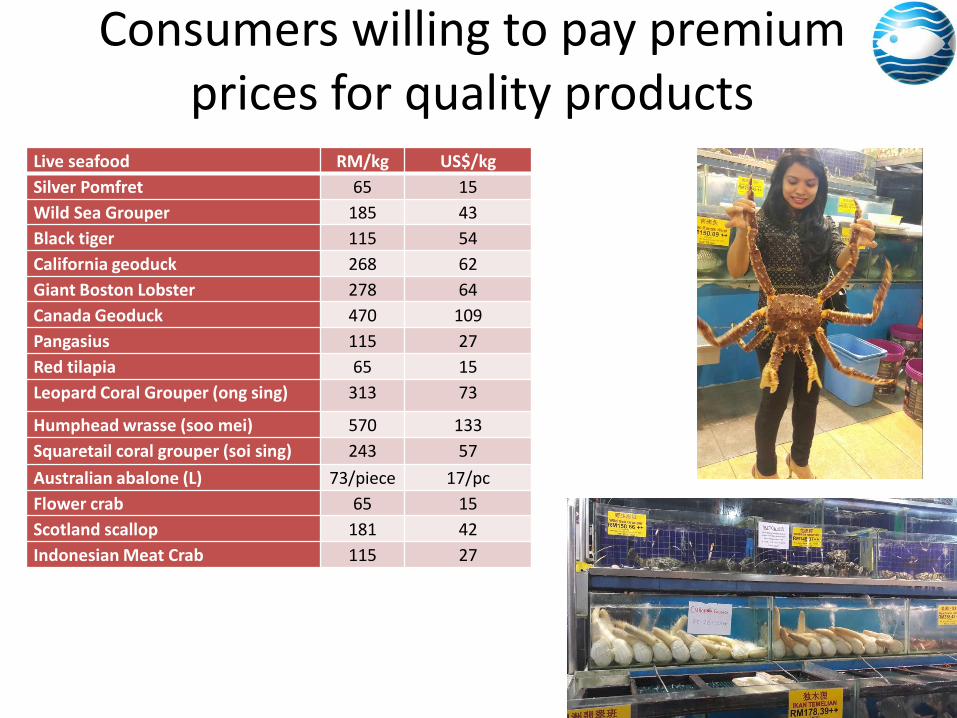
Consumers willing to pay premium prices for quality products
Live seafood RM/kg US$/kg
Silver Pomfret 65 15
Wild Sea Grouper 185 43
Black tiger 115 54
California geoduck 268 62
Giant Boston Lobster 278 64
Canada Geoduck 470 109
Pangasius 115 27
Red tilapia 65 15
Leopard Coral Grouper (ong sing) 313 73
Humphead wrasse (soo mei) 570 133
Squaretail coral grouper (soi sing) 243 57
Australian abalone (L) 73/piece 17/pc
Flower crab 65 15
Scotland scallop 181 42
Indonesian Meat Crab 115 27
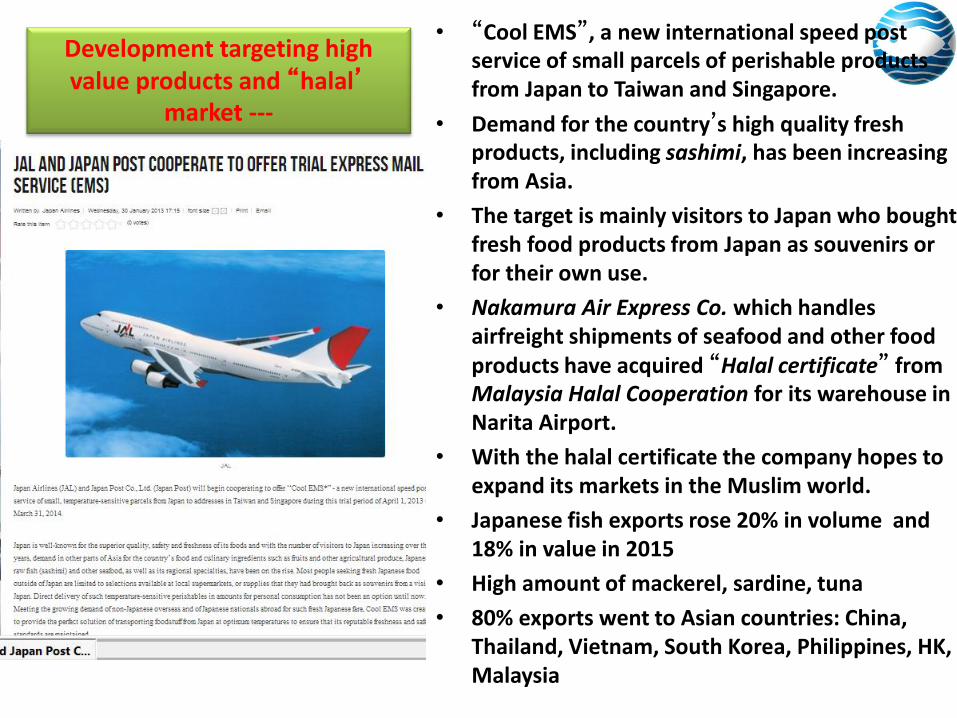
• “Cool EMS”, a new international speed post service of small parcels of perishable products from Japan to Taiwan and Singapore.
• Demand for the country’s high quality fresh products, including sashimi, has been increasing from Asia.
• The target is mainly visitors to Japan who bought fresh food products from Japan as souvenirs or for their own use.
• Nakamura Air Express Co. which handles airfreight shipments of seafood and other food products have acquired “Halal certificate” from Malaysia Halal Cooperation for its warehouse in Narita Airport.
• With the halal certificate the company hopes to expand its markets in the Muslim world.
• Japanese fish exports rose 20% in volume and 18% in value in 2015
• High amount of mackerel, sardine, tuna
• 80% exports went to Asian countries: China, Thailand, Vietnam, South Korea, Philippines, HK, Malaysia
Development targeting high value products and “halal’
market ---
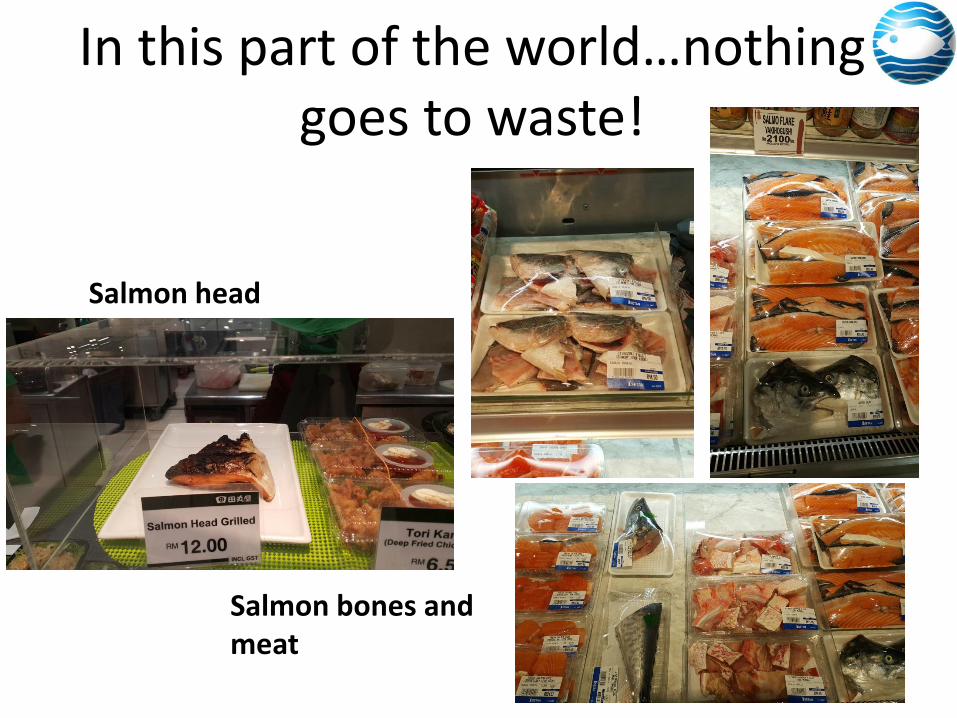
In this part of the world…nothing goes to waste!
Salmon head
Salmon bones and meat
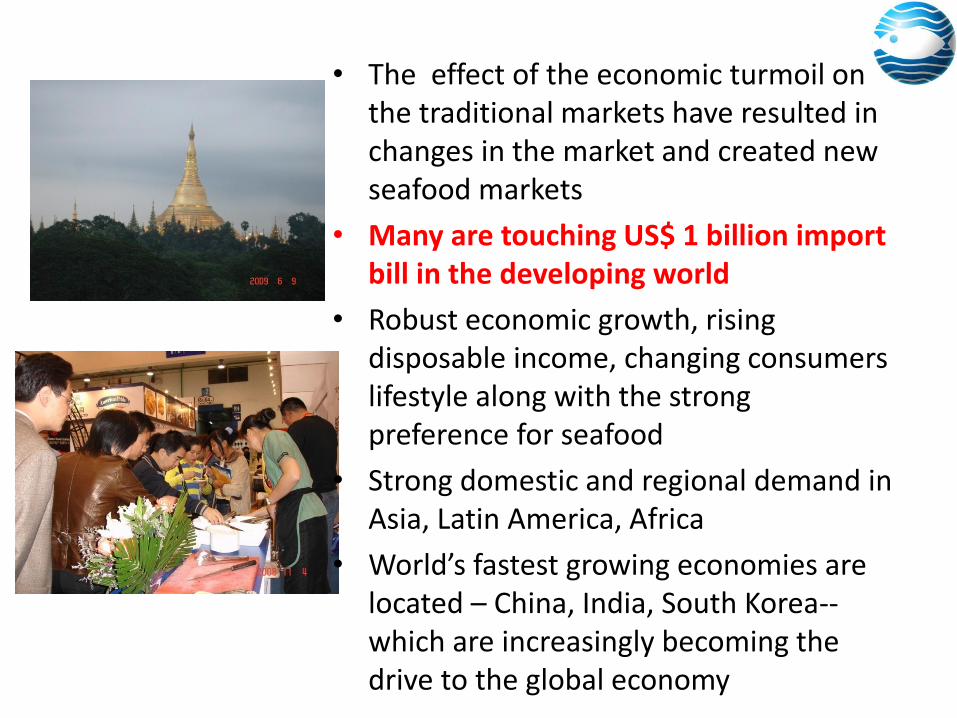
EMERGING IMPORT MARKETS • The effect of the economic turmoil on
the traditional markets have resulted in changes in the market and created new seafood markets
• Many are touching US$ 1 billion import bill in the developing world
• Robust economic growth, rising disposable income, changing consumers lifestyle along with the strong preference for seafood
• Strong domestic and regional demand in Asia, Latin America, Africa
• World’s fastest growing economies are located – China, India, South Korea-- which are increasingly becoming the drive to the global economy
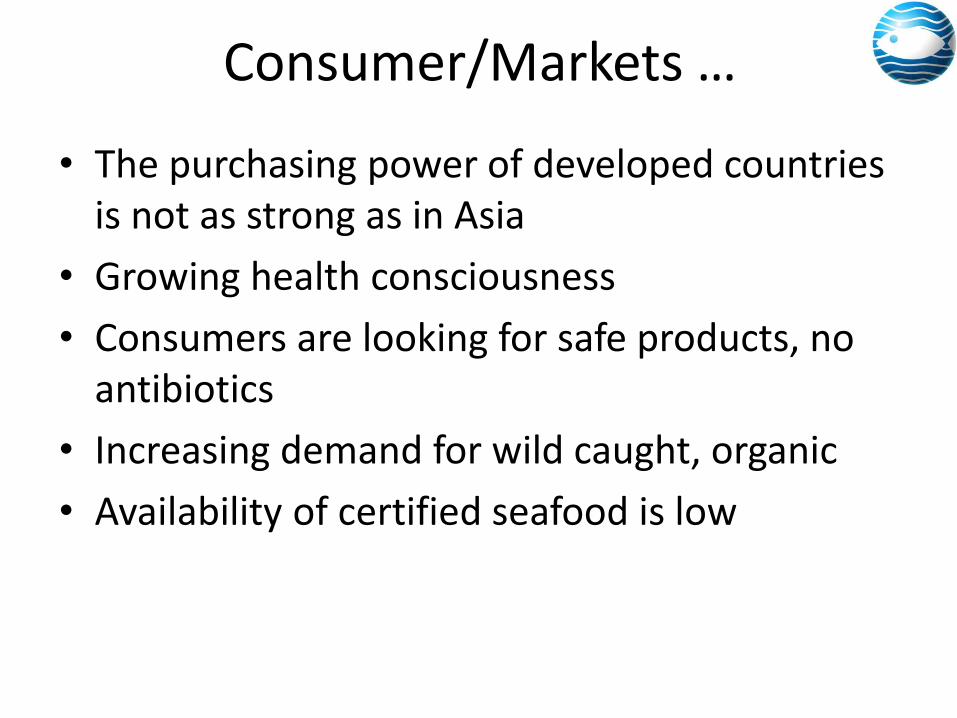
Consumer/Markets …
• The purchasing power of developed countries is not as strong as in Asia
• Growing health consciousness
• Consumers are looking for safe products, no antibiotics
• Increasing demand for wild caught, organic
• Availability of certified seafood is low
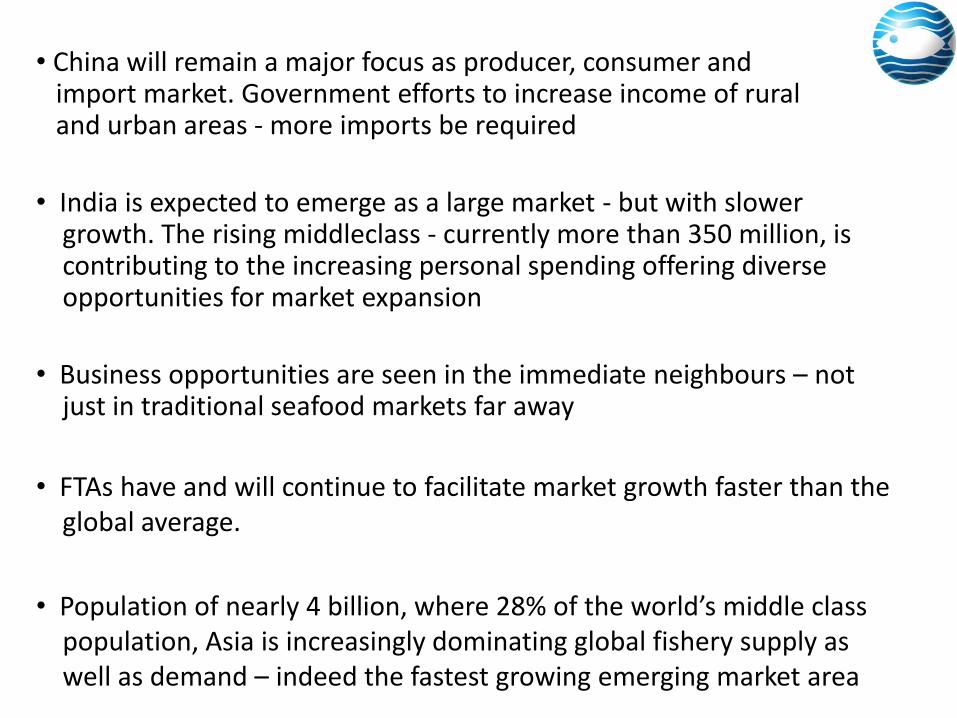
• China will remain a major focus as producer, consumer and import market. Government efforts to increase income of rural and urban areas - more imports be required
• India is expected to emerge as a large market - but with slower growth. The rising middleclass - currently more than 350 million, is contributing to the increasing personal spending offering diverse opportunities for market expansion
• Business opportunities are seen in the immediate neighbours – not just in traditional seafood markets far away
• FTAs have and will continue to facilitate market growth faster than the global average.
• Population of nearly 4 billion, where 28% of the world’s middle class population, Asia is increasingly dominating global fishery supply as well as demand – indeed the fastest growing emerging market area
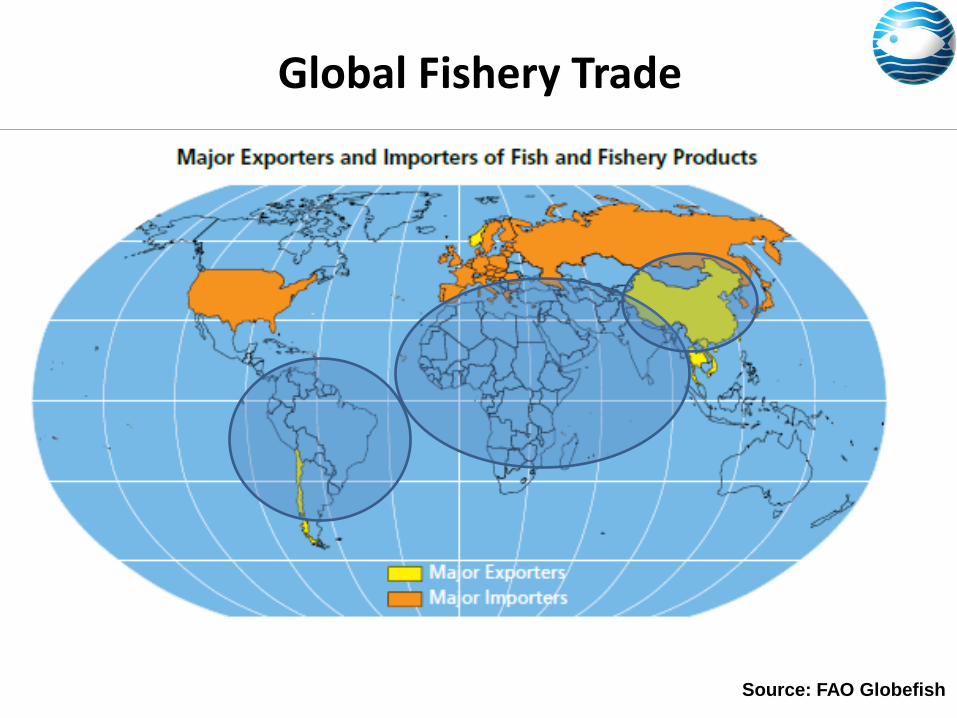
Global Fishery Trade
Source: FAO Globefish