noosa river bass - infofish...
TRANSCRIPT
Noosa River BassSuntag Tagging and Recaptures
1983-2009

page 2
Noosa River BassSuntag Tagging and Recaptures
1983-2009
Bill Sawynok
Infofish Services PO Box 9793 Frenchville Qld 4701
Published May 2009
Cover photographs: (Top) Noosa River in the early morning (Bottom) Patrick Murphy with a large Noosa
River Bass which is likely to be in excess of 20 years old (Patrick Murphy photographs)
Information in this publication is provided as general advice only. For application to specific circumstances,
professional advice should be sought.
Infofish Services has taken all steps to ensure the information contained in this publication is accurate at
the time of publication. Readers should ensure that they make the appropriate enquiries to determine
whether new information is available on a particular subject matter.
Report No: ST-2009-06
Infofish Services
All rights reserved. No part of this publication may be reprinted, reproduced, stored in a retrieval system ortransmitted, in any form or by any means, without prior permission from Infofish Services.

page 3
Table of Contents
Acknowledgements ........................................................................................ 4
Summary ........................................................................................................ 5
1. Introduction ............................................................................................ 6
2. Aims......................................................................................................... 6
3. Methods................................................................................................... 7
4. Noosa River Tagging Area....................................................................... 9
5. Results................................................................................................... 10
6. Discussion ............................................................................................. 17
List of Figures
Figure 1: Tagging of a Noosa River Bass in 1996.......................................................................... 7Figure 2: Suntag grid map of Upper Noosa River where Australian Bass were tagged ....................... 9Figure 3: Numbers of Bass tagged each year from 1985-86 to 2008-09........................................ 10Figure 4: Tagging of fish each year and the recapture rate for fish tagged in that year ................... 10Figure 5: Days between tagging and recapture for Noosa River ................................................... 11Figure 6: Recapture rates showing a logarithmic trendline for fish tagged each year....................... 12Figure 7: Growth rates of fish based on total length when tagged ................................................ 12Figure 8: Growth curve of Bass in Noosa River........................................................................... 13Figure 9: Distance Bass moved in the Noosa River compared with days out .................................. 13Figure 10: Cumulative size range of Bass each year ................................................................... 14Figure 11: Lengths of Bass tagged and recaptured from 1983 to 2009.......................................... 15Figure 12: Locations where Bass were tagged and recaptured in the Upper Noosa River ................. 16

page 4
Acknowledgements
This report covers a time span of 26 years and there are many groups and individualsthat have contributed in some way to the generation of information contained in thisreport. It is not possible to acknowledge the contributions of everyone involvedhowever it is important to provide acknowledgement to the greatest contributors.
The support for the Suntag program by Queensland Primary Industries and Fisheries(QPI&F) of the Department of Employment, Economic Development and Innovation, isacknowledged. The QPI&F has provided funding for Suntag over that period.
The support of the Australian National Sportfishing Association Queensland Branch(ANSA Qld) is also acknowledged. ANSA Qld has been responsible for the Suntagprogram over the past 23 years while it has contracted the delivery of the program toInfofish Services since 1996. The continued support of the ANSA Qld state executiveand ANSA Qld sportfishing clubs is acknowledged.
Acknowledged is the contribution of all ANSA Qld members that have tagged AustralianBass in the Noosa River and made this report possible.
Thanks to Patrick Murphy of the Brisbane Valley Anglers for the photographs on thefront cover of this report.

page 5
Summary
Tagging of Australian Bass (Macquaria novemaculeata) commenced in the Noosa Riverin the early 1970s. This tagging was carried out by members of the BrisbaneSportfishing Club and other clubs joined in over the next few years.
From 1970-71 to 1984-85 it is recorded that 405 Bass were tagged in the Noosa Riverand 14 recaptured however the records for these fish are no longer available. RossCobb of the Brisbane Sportfishing Club recalls that he tagged around 1,500 Bass in thelate 1970s and early 1980s however these records have not been able to be located.
From 1985-86 to 2008-09 (January 2009) there was a total of 1,656 Bass tagged inthe Noosa River. A further 6 fish were recorded in the database which were fishrecaptured after 1985-86 but tagged prior to that time between 1982-83 and 1984-85.
Of these fish there have been 151 (9.1%) individual fish recaptured. Of the fishrecaptured there were 7 that were recaptured a second time.
Tagging effort was mostly within the Cooloola National Park from the top end of LakeCootharaba to National Park camp 15 some 30km upstream and also in the first 6kmof Kin Kin Creek. The greatest numbers of fish were tagged in the 9km reach fromHarry’s Hut upstream to camp 5.
Of the recaptures there were 115 (72.8%) fish that were recaptured where they wereat liberty for greater than 365 days (1 year). There were 7 fish that were at liberty forover 2,822 days (8 years) with the longest time being 4,004 days (almost 11 years).
Recapture rates range from a low of 1.0% for fish tagged in 1988-89 to a high of22.2% for fish tagged in 2003-04 (however the number of fish tagged that year werevery low). A more comparable high was 20.0% for fish tagged in 2001-02. Recapturerates for fish tagged between 1985-86 and 1988-89 were lower than the overall rate.These were for tags that did not have the 1800 (or earlier 008) toll free number toreport tags so the rate of reporting was generally lower. The recapture rates for fishtagged in the last few years are expected to increase over the next few years as moreof these fish are recaptured.
The average annual growth rate was 14.2mm + 16.6mm. Growth rates were around20mm per year for fish 200mm long dropping to around 10mm per year for fisharound 400mm. It is likely that fish around 400mm could be up to 20-25 years old.
The overall average size of fish tagged was 250-299mm. Lengths of fish tagged eachyear shows that the average length of fish tagged went from around 250mm in themid 1980s to around 300mm in the early 1990s and has remained much the samesince then.
Of the recaptures 59 (45.7%) were recaptured in the same area as tagged. A further40 (31.0%) fish were recaptured within 5km of where tagged. The greatest distancemoved by a fish was 33km down river to Lake Cooroibah. No fish were recapturedoutside the Noosa River although one fish from the earlier tagging was reported tohave been recaptured in the Maroochy River. Of the 70 fish that moved there were 41(58.6%) that moved upstream and 29 (41.4%) that moved downstream.
Male Bass tend to inhabit the lower estuarine reaches of rivers while females inhabitthe upstream freshwater reaches. From May to August fish move downstream to theestuary to spawn. The movement of fish obtained from the tagging data shows somedownstream movement associated with migration for spawning as the fish caughtdownstream were all caught in autumn and winter when it is expected they would bemoving for spawning.
The Noosa River Bass fishery is primarily a catch and release fishery with very fewadult fish removed from the river, at least in the freshwater reaches. As a result it islikely there is still a healthy population of fish over the minimum legal length of300mm.

page 6
Noosa River BassSuntag Tagging and Recaptures 1983-2009
1. Introduction
Tagging of Australian Bass (Macquaria novemaculeata) commenced in the Noosa Riverin the early 1970s. This tagging was carried out by members of the BrisbaneSportfishing Club and other clubs joined in over the next few years.1 At that time theprogram was called the Recreational Sportfish Tagging program and was managed bythe Queensland Fisheries Service, now Primary Industries and Fisheries (DPI&F) of theDepartment of Employment, Economic Development and Innovation (DEEDI).
In 1986-87 the responsibility for the tagging program was handed over to theAustralian National Sportfishing Association Qld Inc (ANSA Qld) and it eventuallybecame known as Suntag. At the time of taking over the program it was decided thatdata from 1985-86 would be entered into the database and earlier data would not beincluded. This meant that a substantial amount of data on tagging of Australian Bass inthe Noosa River was lost over time.
From 1970-71 to 1984-85 it is recorded that 405 Bass were tagged in the Noosa Riverand 14 recaptured however the records for these fish are no longer available.2 RossCobb of the Brisbane Sportfishing Club recalls that he tagged around 1,500 Bass in thelate 1970s and early 1980s however these records have not been able to be located.3
A small number of fish tagged from 1982-83 to 1984-85 were recaptured and theserecords were entered into the database.
Since 1985-86 there have been fish tagged in the Noosa River on an ongoing basishowever in some years the effort has been low.
The upper Noosa River is within the Cooloola National Park managed by the NationalParks and Wildlife Service (NPWS) and the current management plan was introduced in1987.4 Previous to that plan there were no limits on vessels used for fishing in thepark. Following the introduction of the plan there were a number of restrictionsintroduced. The use of outboards on power boats is limited up to campsite 3 with a 6knot speed limit. Electric motors and non-motorised vessels are permitted pastcampsite 3. This has limited the fishing effort somewhat, especially in the upperreaches of the river above campsite 3.
2. Aims
The aims of this report are to examine tagging and recapture data in relation to:
Numbers of fish tagged and recaptured each year; Time at liberty; Recapture rates and trends; Growth; Movement; Length/frequency; and Location where fish caught.
1 Pers comm. Michael Dohnt and Steve Watson Brisbane Sportfishing Club2 Queensland Fisheries Service Sportfish Tagging Program Summary Report (unpublished 1986)3 Pers comm. Michael Dohnt Brisbane Sportfishing Club4 Pers comm. Mark Gough Department of Environment and Natural Resources

page 7
3. Methods
Tags used to tag fish throughout the period were standard Hallprint TBA (gun oranchor) or PDS (dart or spear) tags. Tagging of a Noosa Bass is shown in figure 1.Tagging was carried out in accordance with the procedures in the Suntag TaggingManual (available at www.info-fish.net).
Fish were captured, measured for total length and fork length. This information alongwith the tag number, date of capture and location where the tagged fish wascaptured was reported to the Infofish central repository using the standard Suntagform and loaded into the Suntag database. The current database that stores the datais Infofish 2006 and is located at http://database.info-fish.net however is onlyaccessible to authorised users that have been allocated a login and password.
Recaptured tagged fish were reported to the Suntag hotline (toll free 1800 077 001).The tag number, length of the fish, the location and date of its capture wererecorded at this time along with details of the person that recaptured the fish.
Locations where fish were tagged and recaptured were recorded using a map andgrid reference from Suntag maps (available at www.info-fish.net). Suntag mapscovering the Noosa River are Upper Noosa River (SC23) and Noosa River (SC22).
Figure 1: Tagging of a Noosa River Bass in 1996
Recapture rates were calculated for fish tagged in each year. This was calculated as:
RR = BRt/BTt
WhereRR = recapture rateBRt = Number of recaptures of fish tagged in any time periodBTt = Number of fish tagged in same time period
Multiple recaptures of the same fish were excluded when calculating the recapturerate.

page 8
Time at liberty was calculated as:
Dr-t = dater - datet
WhereDr-t = time in days between tagging and recapturedater = date of recapturedatet = date of tagging
Tag and recapture data from 1983-2009 were analysed to estimate growth forAustralian Bass in the Noosa River.
Growth rates were calculated using 2 different methods.
a) Annual growth rate
The annual growth rate was calculated as:
AGR = ((TLr – TLt)/ Dr-t)*365
WhereAGR = annual growth rate in millimetersTLr = total length on recaptureTLt = total length on taggingDr-t = time in days between tagging and recapture
Fish with apparent negative growth, where lengths were not recorded and fish thatwere at liberty for less than 30 days were excluded when calculating growth. Fishwith major outlier growth rates were assumed to be erroroneous and excluded.
Linear daily growth rates were calculated and then converted to annual growth rates.
b) Modelling growth equations
Growth of fish was assessed using GROTAG which estimates growth parameters fromtag and recapture data.
GROTAG uses least squares regression techniques to estimate Linf and K byminimising the difference between predicted and observed lengths at recapture.
GROTAG uses a modification of the von Bertalanffy growth equation described byFrancis (1988). This can be described as:
TLr = Linf*(1-exp(-K*(Dr-t)) - (TLt*(1-exp(-K*(Dr-t))
WhereTLr = total length on recaptureLinf = asymptotic lengthK = instantaneous daily growth rateDr-t = time in days between tagging and recapture
This was then used to calculate the size of fish for each year of age and growthcurves were generated from these data.
Movement of Australian Bass was determined by calculating the distance betweentagging and recapture locations to the nearest km calculated using MapInfo GISsoftware. The distance calculated was the shortest distance via water from the tag tothe recapture location.
Length/frequency of fish tagged in any year were assessed based on 5cm intervals oflength. The numbers of fish in each size interval were calculated to determine ifthere has been any change in the size structure over time.

page 9
Locations where fish were tagged and recaptured were assessed based on thenumbers of fish caught in each map grid. This allowed an assessment of where thefish were tagged and recaptured in the river.
4. Noosa River Tagging Area
Tagging of Australian Bass was in the area of the Noosa River upstream from LakeCootharaba and covered by the Suntag grid map Upper Noosa River (SC23) asshown in figure 2. Grids on this map are approximately 1.15km x 1.15km.
One fish was tagged in the lower saltwater reaches of the Noosa River at NoosaSound which is on Suntag grid map Noosa River (SC22).
Figure 2: Suntag grid map of Upper Noosa River where Australian Bass were tagged
EA B HC D F G
UPPER NOOSA RIV SC23
I J NMLK O83
RP Q S T
79
828180
63
60
5859
62
61
64
76
7877
7475
73
575655
52
5453
68
7271
7069
676665
page 10
5. Results
5.1 Fish Tagged and Recaptured
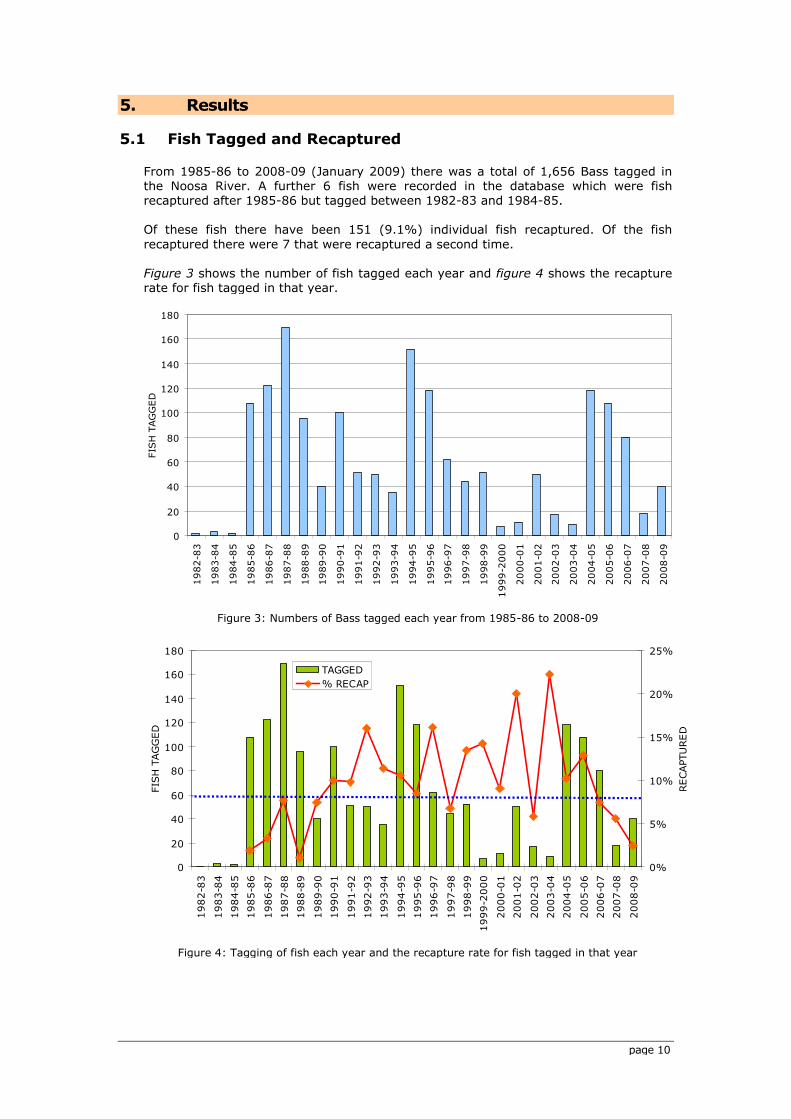
From 1985-86 to 2008-09 (January 2009) there was a total of 1,656 Bass tagged inthe Noosa River. A further 6 fish were recorded in the database which were fishrecaptured after 1985-86 but tagged between 1982-83 and 1984-85.
Of these fish there have been 151 (9.1%) individual fish recaptured. Of the fishrecaptured there were 7 that were recaptured a second time.
Figure 3 shows the number of fish tagged each year and figure 4 shows the recapturerate for fish tagged in that year.
Figure 3: Numbers of Bass tagged each year from 1985-86 to 2008-09
Figure 4: Tagging of fish each year and the recapture rate for fish tagged in that year
0
20
40
60
80
100
120
140
160
180
1982-8
3
1983-8
4
1984-8
5
1985-8
6
1986-8
7
1987-8
8
1988-8
9
1989-9
0
1990-9
1
1991-9
2
1992-9
3
1993-9
4
1994-9
5
1995-9
6
1996-9
7
1997-9
8
1998-9
9
1999-2
000
2000-0
1
2001-0
2
2002-0
3
2003-0
4
2004-0
5
2005-0
6
2006-0
7
2007-0
8
2008-0
9
FIS
HTAG
GED
0
20
40
60
80
100
120
140
160
180
1982-8
3
1983-8
4
1984-8
5
1985-8
6
1986-8
7
1987-8
8
1988-8
9
1989-9
0
1990-9
1
1991-9
2
1992-9
3
1993-9
4
1994-9
5
1995-9
6
1996-9
7
1997-9
8
1998-9
9
1999-2
000
2000-0
1
2001-0
2
2002-0
3
2003-0
4
2004-0
5
2005-0
6
2006-0
7
2007-0
8
2008-0
9
FIS
HTAG
GED
0%
5%
10%
15%
20%
25%
RECAPTU
RED
TAGGED
% RECAP

page 11
5.2 Time at Liberty
Of the recaptures of Bass there were 115 (72.8%) fish that were recaptured wherethey were at liberty for greater than 365 days (1 year). Figure 5 shows the recapturesfrom the shortest to the longest time at liberty.
There were 7 fish that were at liberty for over 2,822 days (8 years) with the longesttime out being 4,004 days (almost 11 years).
Figure 5: Days between tagging and recapture for Noosa River
5.3 Trends in Recapture Rates
Recapture rates ranged from a low of 1.0% for fish tagged in 1988-89 to a high of22.2% for fish tagged in 2003-04 (however the number of fish tagged that year werevery low). A more comparable high was 20.0% for fish tagged in 2001-02. The dottedline on figure 4 shows the overall recapture rate of 8.0% for all Bass in the Suntagprogram.5 Recapture rates for fish tagged between 1985-86 and 1988-89 were lowerthan the overall rate. These were for tags that did not have the 1800 (or earlier 008)toll free number to report tags so the rate of reporting was generally lower. Therecapture rates for fish tagged in the last few years are expected to increase over thenext few years as more of these fish are recaptured.
Figure 6 shows a logarithmic trendline for recapture rates each year showing a steadyincrease in the recapture rates over time. However any interpretation of this needs tobe treated with caution due to the low numbers of fish tagged in some years.
5 W Sawynok (2008): Suntag Research Report 2007/08: available at www.info-fish.net
0
500
1000
1500
2000
2500
3000
3500
4000
4500
1 11 21 31 41 51 61 71 81 91 101 111 121 131 141 151
FISH
DAYS
OU
T

page 12
Figure 6: Recapture rates showing a logarithmic trendline for fish tagged each year
5.4 Growth
Of the 158 recaptures there were 110 fish with sufficient data to calculate growth. Theaverage annual growth rate was 14.2mm + 16.6mm at the 95% confidence level.
Figure 7: Growth rates of fish based on total length when tagged
Figure 7 shows the annual growth rate for fish based on the length at tagging. Thetrendline indicates a growth rate of around 20mm per year for fish 200mm longdropping to around 10mm per year for fish around 400mm.
Figure 8 shows the growth curve for Bass in the Noosa River. This indicates that fisharound 400mm could be up to 20-25 years old.
y = 0.0286Ln(x) + 0.0329
0.0%
5.0%
10.0%
15.0%
20.0%
25.0%
1985-8
6
1986-8
7
1987-8
8
1988-8
9
1989-9
0
1990-9
1
1991-9
2
1992-9
3
1993-9
4
1994-9
5
1995-9
6
1996-9
7
1997-9
8
1998-9
9
1999-2
000
2000-0
1
2001-0
2
2002-0
3
2003-0
4
2004-0
5
2005-0
6
2006-0
7
2007-0
8
2008-0
9
0
20
40
60
80
100
120
0 100 200 300 400 500
TOTAL LENGTH AT TAGGING (MM)
AN
NU
AL
GRO
WTH
(MM
/YEAR)

page 13
Figure 8: Growth curve of Bass in Noosa River
5.5 Movement
A total of 129 fish had sufficient data to determine movement. Of these 59 (45.7%)were recaptured in the same area as tagged. A further 40 (31.0%) fish wererecaptured within 5km of where tagged. The greatest distance moved by a fish was33km down river to Lake Cooroibah. No fish have been recaptured outside the NoosaRiver (see Discussion). Figure 9 shows the comparison of the distance moved and daysout between tagging and recapture.
Figure 9: Distance Bass moved in the Noosa River compared with days out
BASS GROWTH CURVES
0
50
100
150
200
250
300
350
400
450
0 5 10 15 20 25 30
Age (yrs)
Tota
lLength
(mm
)
0
5
10
15
20
25
30
35
40
45
50
0 500 1000 1500 2000 2500 3000 3500
DAYS OUT
DIS
TAN
CE
(KM
)

page 14
Of the 70 fish that moved there were 41 (58.6%) that moved upstream and 29(41.4%) that moved downstream. There were 9 fish that were recaptured downstreamfrom Lake Cootharaba (figure 12). One fish was recaptured in autumn while the restwere caught in winter suggesting that these movements were likely to be associatedwith spawning migration.
5.6 Length/Frequency
Figure 10 shows the length/frequency of tagged Bass cumulative each year. The legalsize limit for Bass is 300mm6 and figure 10 does not show a marked drop off in fishabove that size.
Figure 10: Cumulative size range of Bass each year
Figure 11 shows the length of Bass on the date tagged or recaptured from 1983-2009along with a trendline showing the change in the average length of the fish. Lengths of fishtagged each year indicated that the average length of fish tagged went from around250mm in the mid 1980s to around 300mm in the early 1990s and remained much thesame since then.
6 Recreational fishing rules and regulations for Queensland (March 2009)
0
100
200
300
400
500
600
700
100:
149
150:
199
200:
249
250:
299
300:
349
350:
399
400:
449
450:
499
SIZE RANGE
NU
MBER
OF
FIS
H
2008-09
2007-08
2006-07
2005-06
2004-05
2003-04
2002-03
2001-02
2000-01
1999-2000
1998-99
1997-98
1996-97
1995-96
1994-95
1993-94
1992-93
1991-92
1990-91
1989-90
1988-89
1987-88
1986-87
1985-86

page 15
Figure 11: Lengths of Bass tagged and recaptured from 1983 to 2009
5.7 Locations where Fish Tagged and Recaptured
Figure 12 shows the locations where total numbers of fish have been tagged andrecaptured. Tagging effort in the Noosa River was from the top end of Lake Cootharabato 30km upstream to National Park camp 15 and also in the first 6km of Kin Kin Creek.The greatest numbers of fish were tagged in the 9km reach from Harry’s Hut upstreamto camp 5.
Below where the river flows into Lake Cootharaba all the fish recorded except 1 wererecaptures. These recaptures were likely to be associated with downstream migrationfor spawning.
0
100
200
300
400
500
600
18-Feb-82 11-Aug-87 31-Jan-93 24-Jul-98 14-Jan-04 06-Jul-09
Tota
lle
ngth
Tag length
Recap Length
Poly. (Tag length)

page 16
Figure 12: Locations where Bass were tagged and recaptured in the Upper Noosa River
25-49 FISH
1-9 FISH
50-99 FISH
100-149 FISH
10-24 FISH
150-200 FISH

page 17
6. Discussion
Almost all of the tagging of Bass in the Noosa River has been within the CooloolaNational Park upstream from Lake Cootharaba in the freshwater reaches. This is thearea where most Bass are found. However it also reflects the activities of taggers thattarget Bass in the upper reaches of the river. Only 1 fish was tagged in the saltwaterestuary part of the river.
With 115 (72.8%) fish being recaptured over a year and 7 (4.4%) over 8 years aftertagging it would suggest that there is low rate of tag shedding by Bass. This issupported by fish being recaptured up to 14 years after tagging in someimpoundments.7
Based on the growth rates, time at liberty and movement of fish it indicates that theNoosa River population of Bass is slow growing with fish being long lived and stayingwithin the river system. It is likely that fish over 400mm in length are over 20-25years old. Maximum age of Bass has been recorded at 22+ years.8
Male Bass tend to inhabit the lower estuarine reaches of rivers while females inhabitthe upstream freshwater reaches. From May to August fish move downstream to theestuary to spawn.9 The movement of fish obtained from the tagging data shows somedownstream movement associated with migration for spawning as the fish caughtdownstream from Lake Cootharaba were all caught in autumn and winter when it isexpected they would be moving for spawning.
There were no recaptures of fish outside the Noosa River however it was reported thata Bass tagged during the 1970s was recaptured in the Maroochy River. The recapturewas made after extensive flooding in the Sunshine Coast area and it is possible thatduring that time the rivers were connected through some low lying swamp areasbetween Lake Wyeba and the Maroochy River near Coolum Creek.10
The size/frequency data indicated a normal distribution of fish with an average size offish tagged from 250-299mm. There was a steady increase in the average size of fishtagged from the mid 1980s to the mid 1990s however little change beyond that time.It is possible that there was increased recruitment during the 1980s which is reflectedin the increase in the average fish length from the mid 1980s to the mid 1990s. Fromthe mid 1990s to the present there is little evidence of any substantial boost inrecruitment at any time. This would likely be reflected in a decrease in the averagelength of fish tagged.
The Noosa River Bass fishery is primarily a catch and release fishery with very fewadult fish removed from the river, at least in the freshwater reaches above LakeCootharaba. As a result it is likely that there is still a healthy population of fish overthe minimum legal length of 300mm.
7 W Sawynok and J Platten (2009): Growth, Movement and Survival of Stocked Fish in Impoundmentsand Waterways of Queensland 1987-2008: in press8 Harris JH (1985): Age of Australian Bass Macquaria novemaculeata (Perciformes: Percichthidae) inthe Sydney Basin: Australian Journal of Marine and Freshwater Research 36: 235-2469 GR Allen, SH Midgley, M Allen (2003): Field Guide to Freshwater Fishes of Australia: edition 210 Pers comm. Michael Dohnt Brisbane Sportfishing Club