36 occupa ons
TRANSCRIPT

Occupa on Overview
36 Occupa onsin Chicago-Naperville-Elgin, IL-IN-WI
Emsi Q3 2021 Data Set | www.economicmodeling.com
Occupa on Overview
Emsi Q3 2021 Data Set | www.economicmodeling.com
. . . . . . . . . . . . . . . . . . . . . . . . . . . . . . . . . . . . . . . . . . . . . . . . . . . . . . . . . . . . . . . . . . . . . . . . . . . . . . . . . . . . . . . . . . . . . . . . . . . . . . . . . . . . . . . . . . . . . . . . . . . . . . . . . . . . . . . . . . . . . . . . . . . . . . . . . . . . . . . . . . . . . .1
. . . . . . . . . . . . . . . . . . . . . . . . . . . . . . . . . . . . . . . . . . . . . . . . . . . . . . . . . . . . . . . . . . . . . . . . . . . . . . . . . . . . . . . . . . . . . . . . . . . . . . . . . . . . . . . . . . . . . . . . . . . . . . . . . . . . . . . . . . . . . . . . . . . . . . . . . . . . . . . . . . . . . .2
. . . . . . . . . . . . . . . . . . . . . . . . . . . . . . . . . . . . . . . . . . . . . . . . . . . . . . . . . . . . . . . . . . . . . . . . . . . . . . . . . . . . . . . . . . . . . . . . . . . . . . . . . . . . . . . . . . . . . . . . . . . . . . . . . . . . . . . . . . . . . . . . . . . . . . . . . . . . . . . . . . . . . .3
. . . . . . . . . . . . . . . . . . . . . . . . . . . . . . . . . . . . . . . . . . . . . . . . . . . . . . . . . . . . . . . . . . . . . . . . . . . . . . . . . . . . . . . . . . . . . . . . . . . . . . . . . . . . . . . . . . . . . . . . . . . . . . . . . . . . . . . . . . . . . . . . . . . . . . . . . . . . . . . . . . . . . .4
. . . . . . . . . . . . . . . . . . . . . . . . . . . . . . . . . . . . . . . . . . . . . . . . . . . . . . . . . . . . . . . . . . . . . . . . . . . . . . . . . . . . . . . . . . . . . . . . . . . . . . . . . . . . . . . . . . . . . . . . . . . . . . . . . . . . . . . . . . . . . . . . . . . . . . . . . . . . . . . . . . . . . .6
. . . . . . . . . . . . . . . . . . . . . . . . . . . . . . . . . . . . . . . . . . . . . . . . . . . . . . . . . . . . . . . . . . . . . . . . . . . . . . . . . . . . . . . . . . . . . . . . . . . . . . . . . . . . . . . . . . . . . . . . . . . . . . . . . . . . . . . . . . . . . . . . . . . . . . . . . . . . . . . . . . . . . .7
. . . . . . . . . . . . . . . . . . . . . . . . . . . . . . . . . . . . . . . . . . . . . . . . . . . . . . . . . . . . . . . . . . . . . . . . . . . . . . . . . . . . . . . . . . . . . . . . . . . . . . . . . . . . . . . . . . . . . . . . . . . . . . . . . . . . . . . . . . . . . . . . . . . . . . . . . . . . . . . . . . . . . .12
. . . . . . . . . . . . . . . . . . . . . . . . . . . . . . . . . . . . . . . . . . . . . . . . . . . . . . . . . . . . . . . . . . . . . . . . . . . . . . . . . . . . . . . . . . . . . . . . . . . . . . . . . . . . . . . . . . . . . . . . . . . . . . . . . . . . . . . . . . . . . . . . . . . . . . . . . . . . . . . . . . . . . .14
. . . . . . . . . . . . . . . . . . . . . . . . . . . . . . . . . . . . . . . . . . . . . . . . . . . . . . . . . . . . . . . . . . . . . . . . . . . . . . . . . . . . . . . . . . . . . . . . . . . . . . . . . . . . . . . . . . . . . . . . . . . . . . . . . . . . . . . . . . . . . . . . . . . . . . . . . . . . . . . . . . . . . .16
Contents
What is Emsi Data?
Report Parameters
Execu ve Summary
Jobs
Compensa on
Job Pos ng Ac vity
Demographics
Occupa onal Programs
Appendix A (Occupa ons)
Occupa on Overview
Emsi Q3 2021 Data Set | www.economicmodeling.com

What is Emsi Data?
Emsi data is a hybrid dataset derived from official government sources such as the US Census Bureau, Bureau of
Economic Analysis, and Bureau of Labor Sta s cs. Leveraging the unique strengths of each source, our data
modeling team creates an authorita ve dataset that captures more than 99% of all workers in the United States.
This core offering is then enriched with data from online social profiles, resumés, and job pos ngs to give you a
complete view of the workforce.
Emsi data is frequently cited in major publica ons such as The Atlan c, Forbes, Harvard Business Review, The New
York Times, The Wall Street Journal, and USA Today .
Occupa on Overview
Emsi Q3 2021 Data Set | www.economicmodeling.com 1

36 Occupa ons
1 MSA
Class of Worker
QCEW Employees
The informa on in this report pertains to the chosen occupa ons and geographical area.
Report Parameters
11-1011 Chief Execu ves
11-1021 General and Opera ons Managers
11-3011 Administra ve Services and Facili es
Managers
11-3031 Financial Managers
11-3051 Industrial Produc on Managers
11-3061 Purchasing Managers
11-3111 Compensa on and Benefits Managers
11-3121 Human Resources Managers
11-3131 Training and Development Managers
See Appendix A for all 36 Occupa ons
16980 Chicago-Naperville-Elgin, IL-IN-WI
Occupa on Overview
Emsi Q3 2021 Data Set | www.economicmodeling.com 2
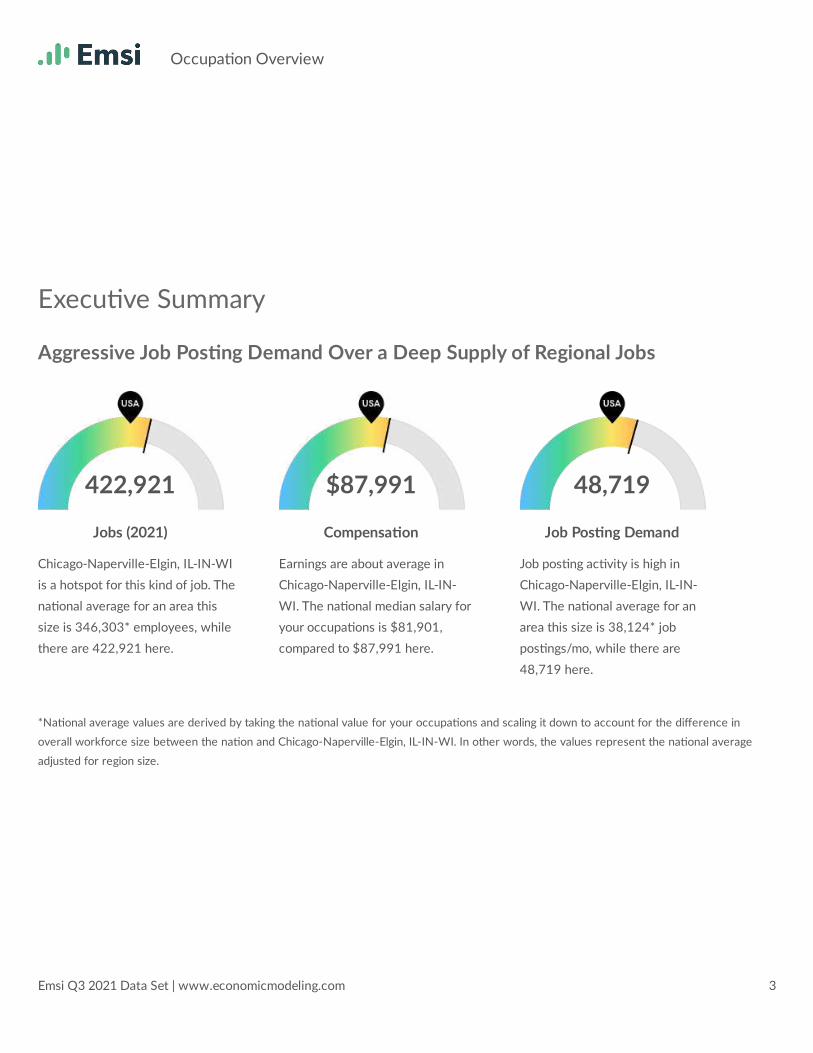
Chicago-Naperville-Elgin, IL-IN-WI
is a hotspot for this kind of job. The
na onal average for an area this
size is 346,303* employees, while
there are 422,921 here.
Earnings are about average in
Chicago-Naperville-Elgin, IL-IN-
WI. The na onal median salary for
your occupa ons is $81,901,
compared to $87,991 here.
Job pos ng ac vity is high in
Chicago-Naperville-Elgin, IL-IN-
WI. The na onal average for an
area this size is 38,124* job
pos ngs/mo, while there are
48,719 here.
Execu ve Summary
Aggressive Job Pos ng Demand Over a Deep Supply of Regional Jobs
*Na onal average values are derived by taking the na onal value for your occupa ons and scaling it down to account for the difference in
overall workforce size between the na on and Chicago-Naperville-Elgin, IL-IN-WI. In other words, the values represent the na onal average
adjusted for region size.
422,921
Jobs (2021)
$87,991
Compensa on
48,719
Job Pos ng Demand
Occupa on Overview
Emsi Q3 2021 Data Set | www.economicmodeling.com 3
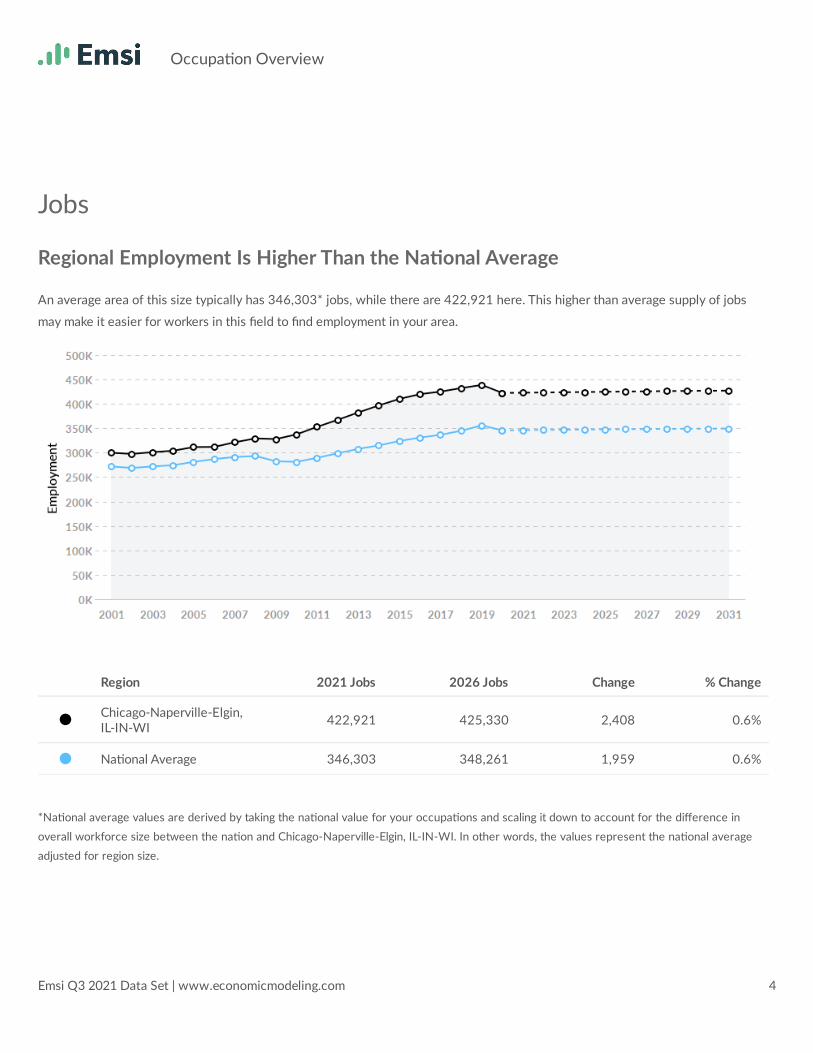
Jobs
Regional Employment Is Higher Than the Na onal Average
An average area of this size typically has 346,303* jobs, while there are 422,921 here. This higher than average supply of jobs
may make it easier for workers in this field to find employment in your area.
*Na onal average values are derived by taking the na onal value for your occupa ons and scaling it down to account for the difference in
overall workforce size between the na on and Chicago-Naperville-Elgin, IL-IN-WI. In other words, the values represent the na onal average
adjusted for region size.
AChicago-Naperville-Elgin,IL-IN-WI
422,921 425,330 2,408 0.6%
A Na onal Average 346,303 348,261 1,959 0.6%
Region 2021 Jobs 2026 Jobs Change % Change
Occupa on Overview
Emsi Q3 2021 Data Set | www.economicmodeling.com 4
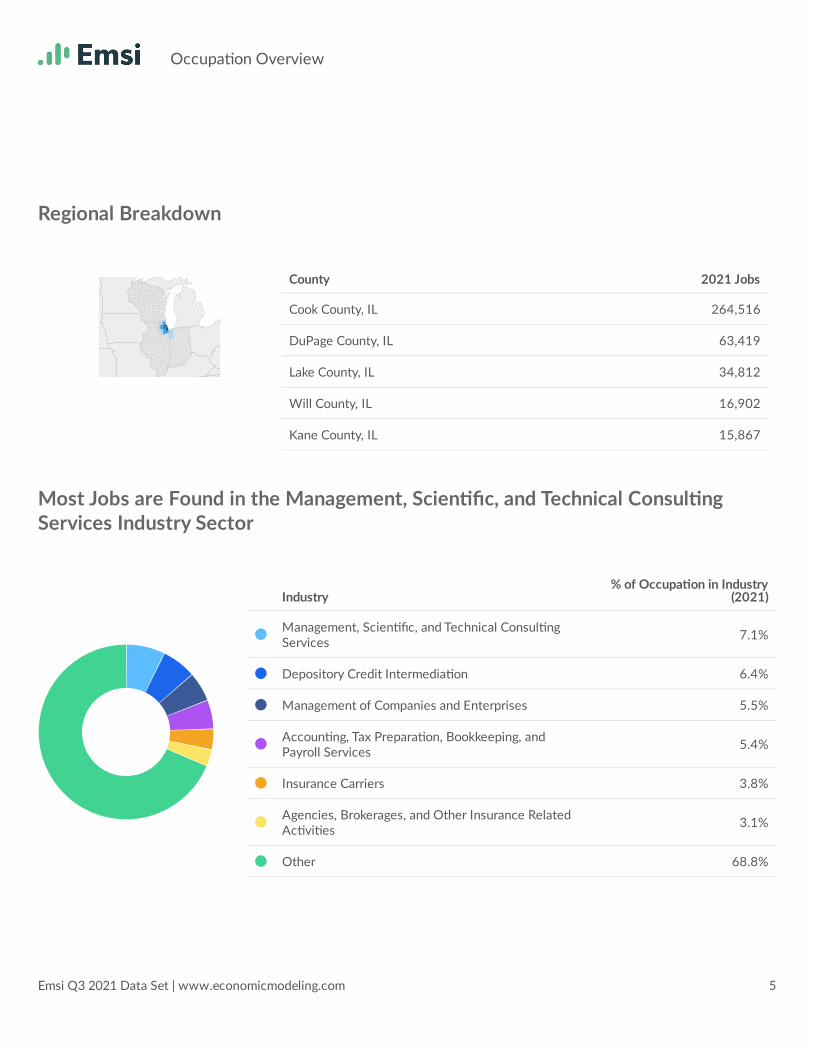
Regional Breakdown
Most Jobs are Found in the Management, Scien fic, and Technical Consul ngServices Industry Sector
Cook County, IL 264,516
DuPage County, IL 63,419
Lake County, IL 34,812
Will County, IL 16,902
Kane County, IL 15,867
County 2021 Jobs
Industry% of Occupa on in Industry
(2021)
AManagement, Scien fic, and Technical Consul ngServices
7.1%
A Depository Credit Intermedia on 6.4%
A Management of Companies and Enterprises 5.5%
AAccoun ng, Tax Prepara on, Bookkeeping, andPayroll Services
5.4%
A Insurance Carriers 3.8%
AAgencies, Brokerages, and Other Insurance RelatedAc vi es
3.1%
A Other 68.8%
Occupa on Overview
Emsi Q3 2021 Data Set | www.economicmodeling.com 5
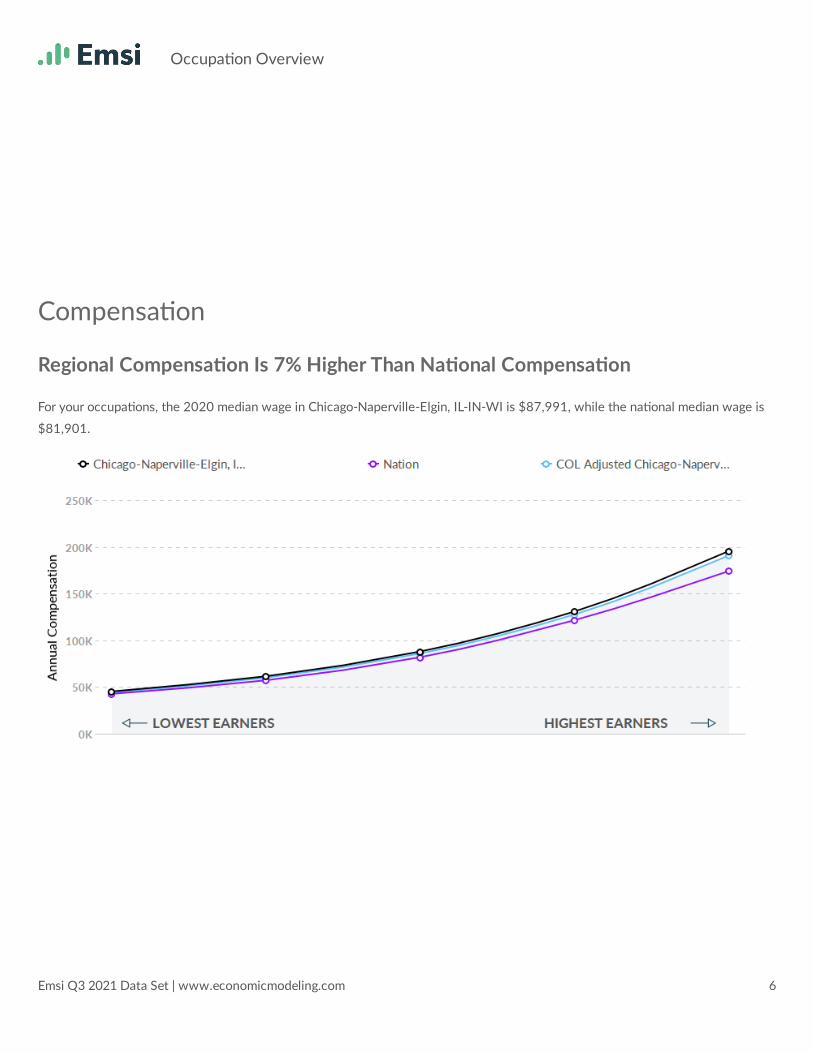
Compensa on
Regional Compensa on Is 7% Higher Than Na onal Compensa on
For your occupa ons, the 2020 median wage in Chicago-Naperville-Elgin, IL-IN-WI is $87,991, while the na onal median wage is
$81,901.
Occupa on Overview
Emsi Q3 2021 Data Set | www.economicmodeling.com 6

Job Pos ng Ac vity
180,248 Unique Job Pos ngs
The number of unique pos ngs for this job
from Jan 2021 to Sep 2021.
14,801 Employers Compe ng
All employers in the region who posted for
this job from Jan 2021 to Sep 2021.
32 Day Median Dura on
Pos ng dura on is 3 days longer than what's
typical in the region.
*A hire is reported by the Quarterly Workforce Indicators when an individual's Social Security Number appears on a company's payroll and was
not there the quarter before. Emsi hires are calculated using a combina on of Emsi jobs data, informa on on separa on rates from the Bureau
of Labor Sta s cs (BLS), and industry-based hires data from the Census Bureau.
Accountants and Auditors 6,063 1,968
Management Analysts 5,116 1,318
Financial Managers 4,586 1,028
Personal Service Managers, All Other; Entertainment and Recrea onManagers, Except Gambling; and Managers, All Other
4,281 542
Occupa onAvg Monthly Pos ngs(Jan 2021 - Sep 2021)
Avg Monthly Hires (Jan2021 - Sep 2021)
Occupa on Overview
Emsi Q3 2021 Data Set | www.economicmodeling.com 7
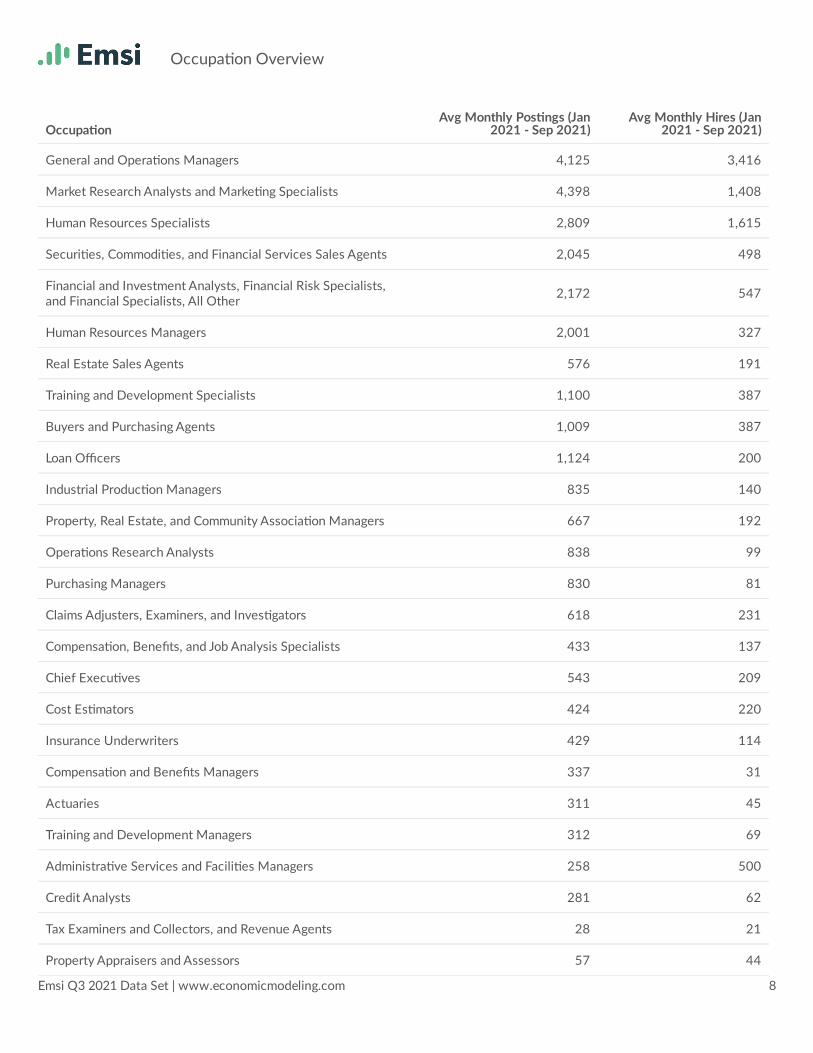
General and Opera ons Managers 4,125 3,416
Market Research Analysts and Marke ng Specialists 4,398 1,408
Human Resources Specialists 2,809 1,615
Securi es, Commodi es, and Financial Services Sales Agents 2,045 498
Financial and Investment Analysts, Financial Risk Specialists,and Financial Specialists, All Other
2,172 547
Human Resources Managers 2,001 327
Real Estate Sales Agents 576 191
Training and Development Specialists 1,100 387
Buyers and Purchasing Agents 1,009 387
Loan Officers 1,124 200
Industrial Produc on Managers 835 140
Property, Real Estate, and Community Associa on Managers 667 192
Opera ons Research Analysts 838 99
Purchasing Managers 830 81
Claims Adjusters, Examiners, and Inves gators 618 231
Compensa on, Benefits, and Job Analysis Specialists 433 137
Chief Execu ves 543 209
Cost Es mators 424 220
Insurance Underwriters 429 114
Compensa on and Benefits Managers 337 31
Actuaries 311 45
Training and Development Managers 312 69
Administra ve Services and Facili es Managers 258 500
Credit Analysts 281 62
Tax Examiners and Collectors, and Revenue Agents 28 21
Property Appraisers and Assessors 57 44
Occupa onAvg Monthly Pos ngs (Jan
2021 - Sep 2021)Avg Monthly Hires (Jan
2021 - Sep 2021)
Occupa on Overview
Emsi Q3 2021 Data Set | www.economicmodeling.com 8

Insurance Appraisers, Auto Damage 15 7
Budget Analysts 26 31
Labor Rela ons Specialists 33 185
Credit Counselors 17 42
Economists 17 11
Informa on and Record Clerks, AllOther
5 104
Occupa onAvg Monthly Pos ngs (Jan 2021 - Sep
2021)Avg Monthly Hires (Jan 2021 - Sep
2021)
Robert Half Interna onal Inc. 4,156
JPMorgan Chase & Co. 3,466
Pricewaterhousecoopers LLP 2,039
Deloi e LLP 1,934
AbbVie Inc. 1,838
Crea ve Financial Staffing LLC 1,682
Oracle Corpora on 1,523
Kpmg LLP 1,518
Accenture PLC 1,433
Allstate Corpora on 1,165
Top Companies Unique Pos ngs
Accountants 2,130
Staff Accountants 1,946
Project Managers 1,776
General Managers 1,635
Financial Analysts 1,333
Human Resources Generalists 1,253
Business Analysts 1,248
Opera ons Managers 1,108
Financial Analysis Managers 1,053
Recruiters 1,037
Top Job Titles Unique Pos ngs
Occupa on Overview
Emsi Q3 2021 Data Set | www.economicmodeling.com 9

Top Hard Skills
Frequency in Job Pos ngs Frequency in Profiles
0% 5% 10% 15% 20%
Finance
Accoun ng
Audi ng
Financial Statements
Forecas ng
Data Analysis
Process Improvement
Budge ng
Strategic Planning
Financial Analysis
Finance 42,991 24% 86,788 9%
Accoun ng 42,818 24% 93,721 9%
Audi ng 27,990 16% 64,781 7%
Financial Statements 17,857 10% 51,551 5%
Forecas ng 16,873 9% 50,884 5%
Data Analysis 15,675 9% 48,730 5%
Process Improvement 15,526 9% 71,766 7%
Budge ng 15,386 9% 52,996 5%
Strategic Planning 14,616 8% 133,414 14%
Financial Analysis 12,872 7% 75,245 8%
Skills Pos ngs % of Total Pos ngs Profiles % of Total Profiles
Occupa on Overview
Emsi Q3 2021 Data Set | www.economicmodeling.com 10

Top Common Skills
Frequency in Job Pos ngs Frequency in Profiles
0% 10% 20% 30% 40%
Communica ons
Management
Leadership
Opera ons
Sales
Microso Excel
Problem Solving
Detail Oriented
Customer Service
Presenta ons
Communica ons 80,585 45% 80,503 8%
Management 74,162 41% 258,973 26%
Leadership 54,725 30% 200,863 20%
Opera ons 46,889 26% 134,176 14%
Sales 43,010 24% 208,875 21%
Microso Excel 37,432 21% 133,885 14%
Problem Solving 36,803 20% 25,028 3%
Detail Oriented 33,188 18% 5,616 1%
Customer Service 32,479 18% 209,952 21%
Presenta ons 32,145 18% 39,636 4%
Skills Pos ngs % of Total Pos ngs Profiles % of Total Profiles
Occupa on Overview
Emsi Q3 2021 Data Set | www.economicmodeling.com 11
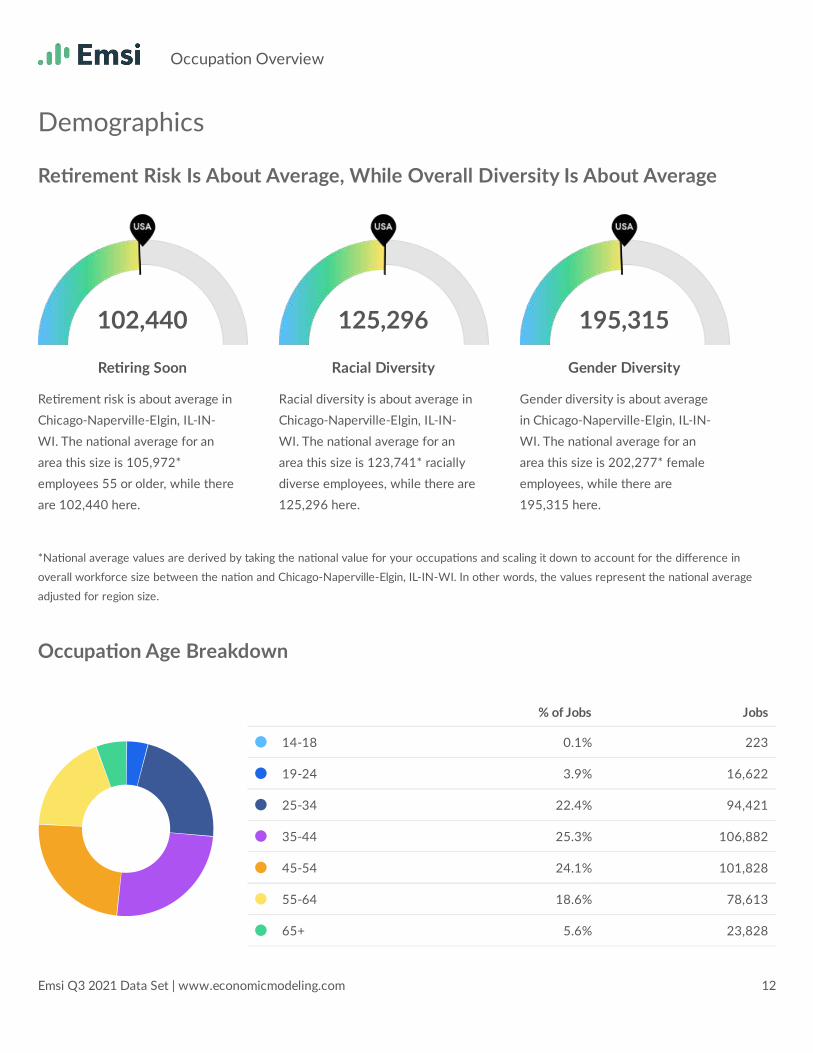
Re rement risk is about average in
Chicago-Naperville-Elgin, IL-IN-
WI. The na onal average for an
area this size is 105,972*
employees 55 or older, while there
are 102,440 here.
Racial diversity is about average in
Chicago-Naperville-Elgin, IL-IN-
WI. The na onal average for an
area this size is 123,741* racially
diverse employees, while there are
125,296 here.
Gender diversity is about average
in Chicago-Naperville-Elgin, IL-IN-
WI. The na onal average for an
area this size is 202,277* female
employees, while there are
195,315 here.
Demographics
Re rement Risk Is About Average, While Overall Diversity Is About Average
*Na onal average values are derived by taking the na onal value for your occupa ons and scaling it down to account for the difference in
overall workforce size between the na on and Chicago-Naperville-Elgin, IL-IN-WI. In other words, the values represent the na onal average
adjusted for region size.
Occupa on Age Breakdown
102,440
Re ring Soon
125,296
Racial Diversity
195,315
Gender Diversity
% of Jobs Jobs
A 14-18 0.1% 223
A 19-24 3.9% 16,622
A 25-34 22.4% 94,421
A 35-44 25.3% 106,882
A 45-54 24.1% 101,828
A 55-64 18.6% 78,613
A 65+ 5.6% 23,828
Occupa on Overview
Emsi Q3 2021 Data Set | www.economicmodeling.com 12

Occupa on Race/Ethnicity Breakdown
Occupa on Gender Breakdown
% of Jobs Jobs
A White 70.3% 297,121
A Hispanic or La no 11.0% 46,416
A Black or African American 8.8% 37,348
A Asian 8.6% 36,243
A Two or More Races 1.1% 4,629
A American Indian or Alaska Na ve 0.1% 431
A Na ve Hawaiian or Other Pacific Islander 0.1% 230
% of Jobs Jobs
A Males 53.8% 227,102
A Females 46.2% 195,315
Occupa on Overview
Emsi Q3 2021 Data Set | www.economicmodeling.com 13

Occupa onal Programs
200 Programs
Of the programs that can train for this job,
200 have produced comple ons in the last 5
years.
60,394 Comple ons (2020)
The comple ons from all regional ins tu ons
for all degree types.
34,723 Openings (2020)
The average number of openings for an
occupa on in the region is 593.
24.0101 Liberal Arts and Sciences/Liberal Studies 15,849
52.0201 Business Administra on and Management, General 6,005
30.0101 Biological and Physical Sciences 3,306
42.0101 Psychology, General 2,796
52.1301 Management Science 2,310
52.0301 Accoun ng 1,972
24.0102 General Studies 1,822
52.0101 Business/Commerce, General 1,775
52.1401 Marke ng/Marke ng Management, General 1,467
52.0801 Finance, General 1,367
CIP Code Top Programs Comple ons (2020)
Occupa on Overview
Emsi Q3 2021 Data Set | www.economicmodeling.com 14

Northwestern University 4,567
University of Chicago 4,023
University of Illinois Chicago 3,201
DeVry University-Illinois 3,116
DePaul University 3,052
William Rainey Harper College 2,519
College of Lake County 2,460
Loyola University Chicago 2,291
Northern Illinois University 2,025
City Colleges of Chicago-Harold Washington College 1,878
Top Schools Comple ons (2020)
Occupa on Overview
Emsi Q3 2021 Data Set | www.economicmodeling.com 15
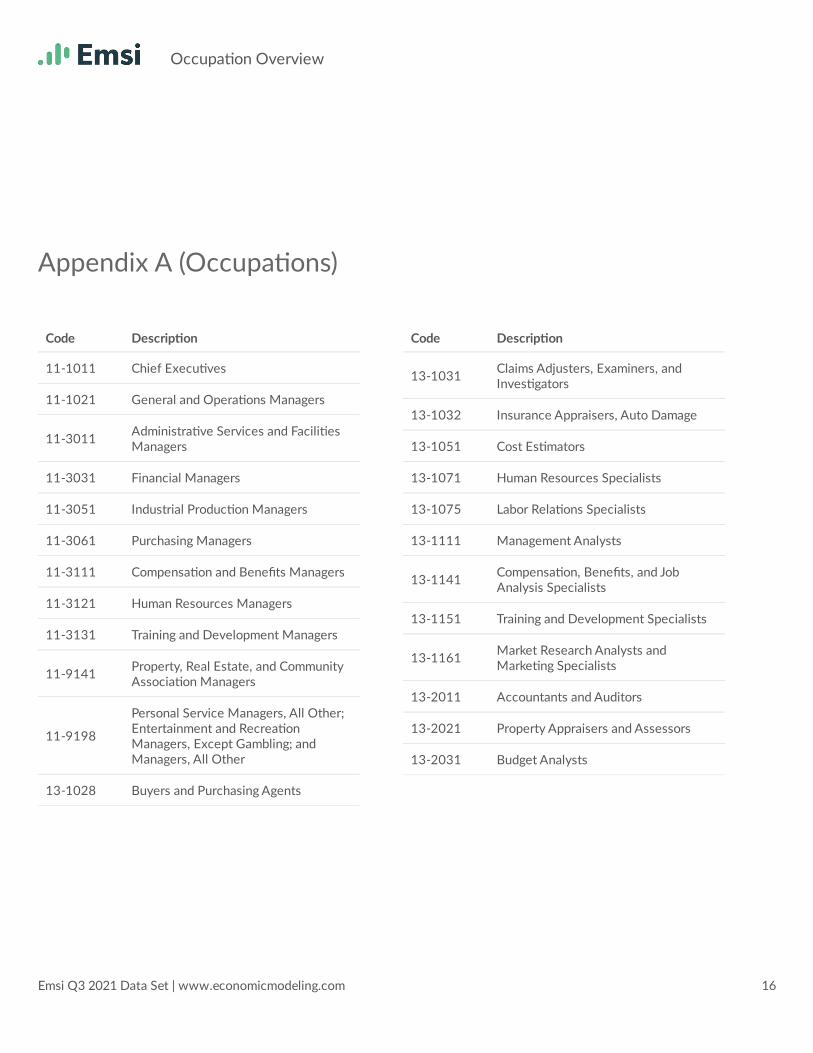
Appendix A (Occupa ons)
11-1011 Chief Execu ves
11-1021 General and Opera ons Managers
11-3011Administra ve Services and Facili esManagers
11-3031 Financial Managers
11-3051 Industrial Produc on Managers
11-3061 Purchasing Managers
11-3111 Compensa on and Benefits Managers
11-3121 Human Resources Managers
11-3131 Training and Development Managers
11-9141Property, Real Estate, and CommunityAssocia on Managers
11-9198
Personal Service Managers, All Other;Entertainment and Recrea onManagers, Except Gambling; andManagers, All Other
13-1028 Buyers and Purchasing Agents
Code Descrip on
13-1031Claims Adjusters, Examiners, andInves gators
13-1032 Insurance Appraisers, Auto Damage
13-1051 Cost Es mators
13-1071 Human Resources Specialists
13-1075 Labor Rela ons Specialists
13-1111 Management Analysts
13-1141Compensa on, Benefits, and JobAnalysis Specialists
13-1151 Training and Development Specialists
13-1161Market Research Analysts andMarke ng Specialists
13-2011 Accountants and Auditors
13-2021 Property Appraisers and Assessors
13-2031 Budget Analysts
Code Descrip on
Occupa on Overview
Emsi Q3 2021 Data Set | www.economicmodeling.com 16

13-2041 Credit Analysts
13-2053 Insurance Underwriters
13-2071 Credit Counselors
13-2072 Loan Officers
13-2081Tax Examiners and Collectors, andRevenue Agents
13-2098Financial and Investment Analysts,Financial Risk Specialists, and FinancialSpecialists, All Other
Code Descrip on
15-2011 Actuaries
15-2031 Opera ons Research Analysts
19-3011 Economists
41-3031Securi es, Commodi es, and FinancialServices Sales Agents
41-9022 Real Estate Sales Agents
43-4199Informa on and Record Clerks, AllOther
Code Descrip on
Occupa on Overview
Emsi Q3 2021 Data Set | www.economicmodeling.com 17