ons retail report
TRANSCRIPT
8/2/2019 Ons Retail Report
http://slidepdf.com/reader/full/ons-retail-report 1/84
Statistical Bulletin
Office for National Statistics | 1
Retail Sales - February 2012
Coverage: GB
Date: 22 March 2012
Geographical Area: GB
Theme: Economy
Retail Sales - February 2012
• Headline: Value of retail sales in February 2012 showed an increase of 3.2 per cent higher than
February 2011.
• Headline: Sales volumes in February 2012 increased 1.0 per cent when compared with February
2011.
• Sales volumes were driven by non-store retailing, predominantly food stores and non-specialised
stores.
• The year on year implied price deflator in February 2012 rose to 2.4 per cent from 2.2 per cent in
January 2012.
• The proportion of retail sales made via the internet is estimated to have been 10.7 per cent of all
retail sales excluding fuel in February 2012.
Key Figures
8/2/2019 Ons Retail Report
http://slidepdf.com/reader/full/ons-retail-report 2/84
Retail Sales - February 2012 | 22 March 2012
Office for National Statistics | 2
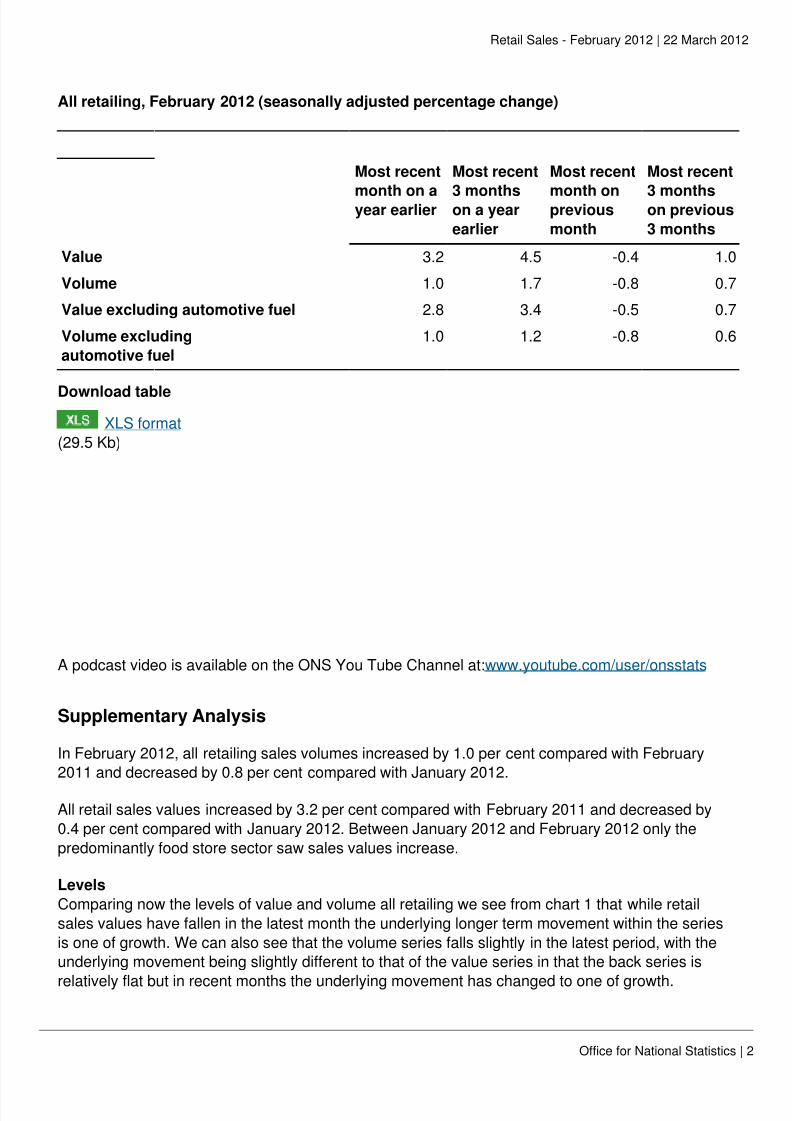
All retailing, February 2012 (seasonally adjusted percentage change)
Most recent
month on ayear earlier
Most recent
3 monthson a year
earlier
Most recent
month onprevious
month
Most recent
3 monthson previous
3 months
Value 3.2 4.5 -0.4 1.0
Volume 1.0 1.7 -0.8 0.7
Value excluding automotive fuel 2.8 3.4 -0.5 0.7
Volume excluding
automotive fuel
1.0 1.2 -0.8 0.6
Download table
XLS format
(29.5 Kb)
A podcast video is available on the ONS You Tube Channel at:www.youtube.com/user/onsstats
Supplementary Analysis
In February 2012, all retailing sales volumes increased by 1.0 per cent compared with February2011 and decreased by 0.8 per cent compared with January 2012.
All retail sales values increased by 3.2 per cent compared with February 2011 and decreased by
0.4 per cent compared with January 2012. Between January 2012 and February 2012 only the
predominantly food store sector saw sales values increase.
Levels
Comparing now the levels of value and volume all retailing we see from chart 1 that while retail
sales values have fallen in the latest month the underlying longer term movement within the series
is one of growth. We can also see that the volume series falls slightly in the latest period, with theunderlying movement being slightly different to that of the value series in that the back series is
relatively flat but in recent months the underlying movement has changed to one of growth.

8/2/2019 Ons Retail Report
http://slidepdf.com/reader/full/ons-retail-report 3/84
Retail Sales - February 2012 | 22 March 2012
Office for National Statistics | 3
Chart 1, All retail sales (seasonally adjusted)
Source: Monthly Business Survey - Retail Sales Inquiry - Office for National Statistics
Download chart
XLS format
(17.5 Kb)
Food stores
Concentrating now on predominantly food stores, in February 2012 sales volumes increased by 1.0
per cent compared with February 2011 and decreased by 0.1 per cent compared with January 2012.
Sales values at predominantly food stores increased by 5.0 per cent compared with February 2012
and by 0.6 per cent compared with January 2012.
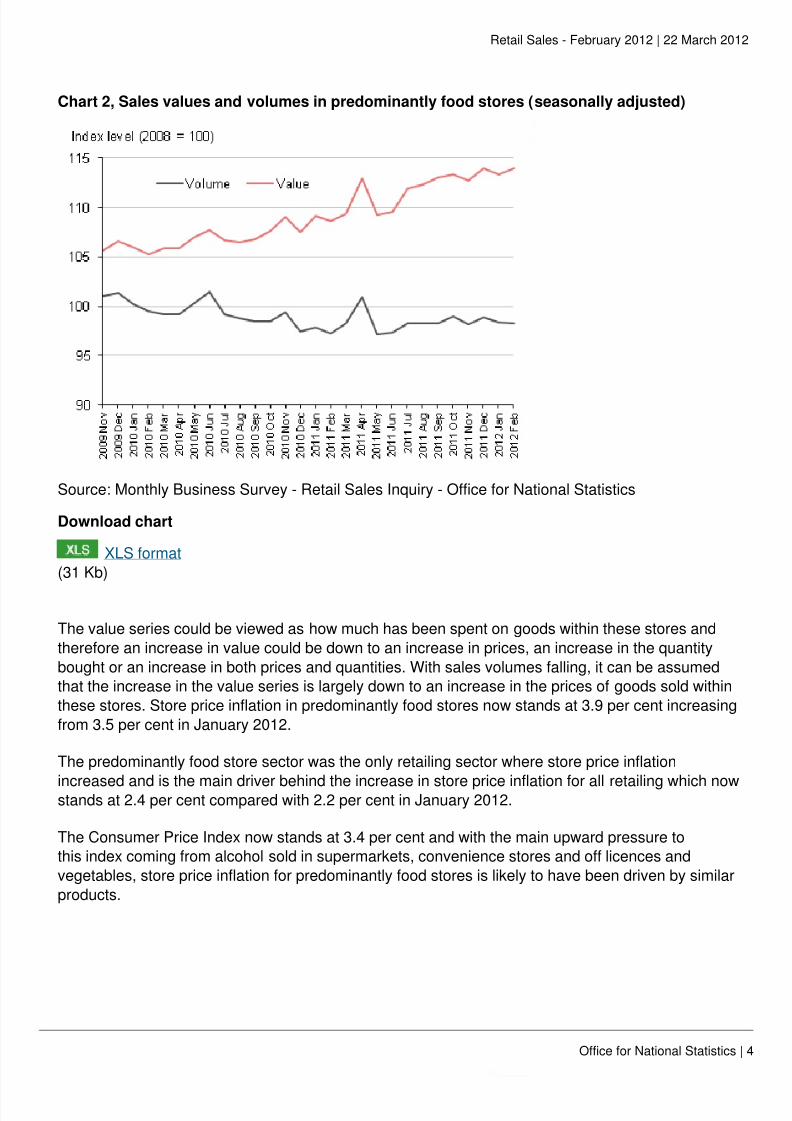
Comparing sales volume and value levels by looking at the index numbers as shown in chart 2, we
see that sales volumes in predominantly food stores have fallen with increases for events such asthe Royal Wedding in April 2011 but sales values have increased at a relatively strong rate.
8/2/2019 Ons Retail Report
http://slidepdf.com/reader/full/ons-retail-report 4/84
Retail Sales - February 2012 | 22 March 2012
Office for National Statistics | 4
Chart 2, Sales values and volumes in predominantly food stores (seasonally adjusted)
Source: Monthly Business Survey - Retail Sales Inquiry - Office for National Statistics
Download chart
XLS format
(31 Kb)
The value series could be viewed as how much has been spent on goods within these stores and
therefore an increase in value could be down to an increase in prices, an increase in the quantity
bought or an increase in both prices and quantities. With sales volumes falling, it can be assumed
that the increase in the value series is largely down to an increase in the prices of goods sold within
these stores. Store price inflation in predominantly food stores now stands at 3.9 per cent increasing
from 3.5 per cent in January 2012.
The predominantly food store sector was the only retailing sector where store price inflationincreased and is the main driver behind the increase in store price inflation for all retailing which now
stands at 2.4 per cent compared with 2.2 per cent in January 2012.
The Consumer Price Index now stands at 3.4 per cent and with the main upward pressure to
this index coming from alcohol sold in supermarkets, convenience stores and off licences and
vegetables, store price inflation for predominantly food stores is likely to have been driven by similar
products.
8/2/2019 Ons Retail Report
http://slidepdf.com/reader/full/ons-retail-report 5/84
Retail Sales - February 2012 | 22 March 2012
Office for National Statistics | 5
Retail Sales in detail
The Retail Sales Index (RSI) measures spending (value) and volume of retail sales in Great Britain.
Figures are adjusted for seasonal variations unless otherwise stated and the reference year for
both value and volume statistics is 2008 = 100. For an explanation of the terms used in this bulletin,
please see the background notes section. Care should be taken when using the month on month
growth rates due to their volatility, an assessment of the quality of the retail statistics is available in
the background notes.
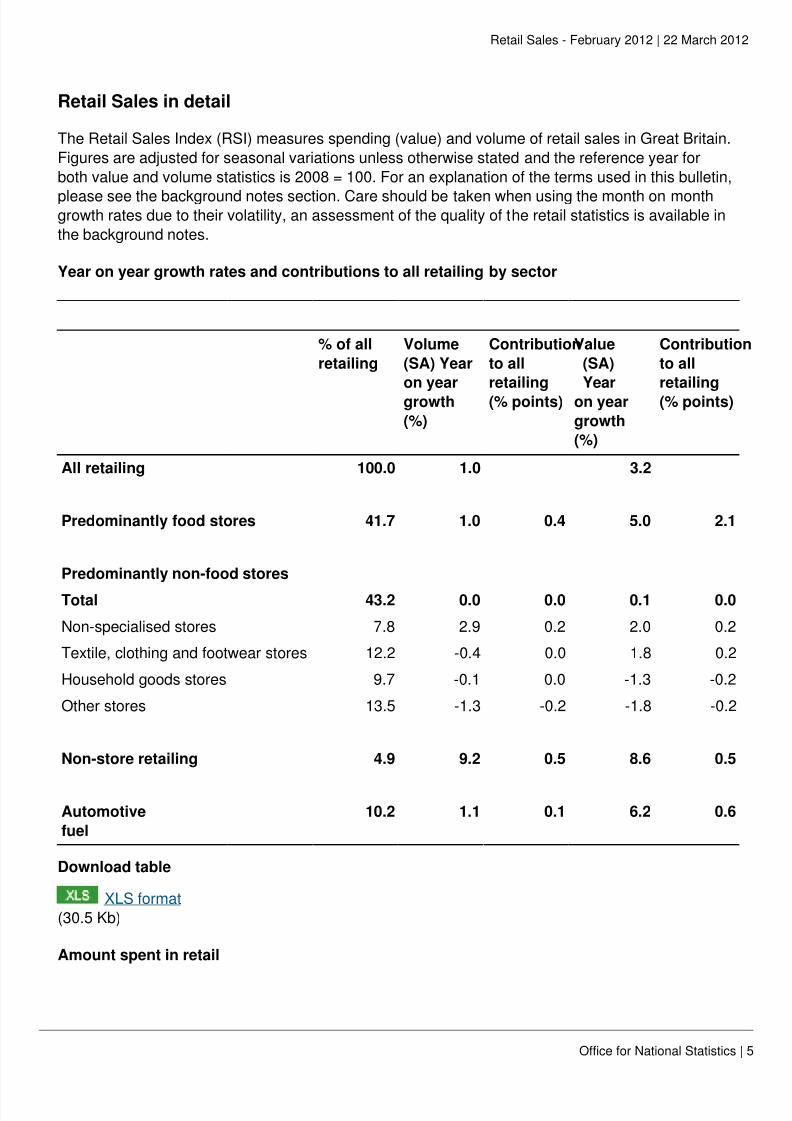
Year on year growth rates and contributions to all retailing by sector
% of all
retailing
Volume
(SA) Year
on yeargrowth
(%)
Contribution
to all
retailing(% points)
Value
(SA)
Yearon year
growth
(%)
Contribution
to all
retailing(% points)
All retailing 100.0 1.0 3.2
Predominantly food stores 41.7 1.0 0.4 5.0 2.1
Predominantly non-food stores
Total 43.2 0.0 0.0 0.1 0.0
Non-specialised stores 7.8 2.9 0.2 2.0 0.2
Textile, clothing and footwear stores 12.2 -0.4 0.0 1.8 0.2
Household goods stores 9.7 -0.1 0.0 -1.3 -0.2
Other stores 13.5 -1.3 -0.2 -1.8 -0.2
Non-store retailing 4.9 9.2 0.5 8.6 0.5
Automotive
fuel
10.2 1.1 0.1 6.2 0.6
Download table
XLS format
(30.5 Kb)
Amount spent in retail
8/2/2019 Ons Retail Report
http://slidepdf.com/reader/full/ons-retail-report 6/84
Retail Sales - February 2012 | 22 March 2012
Office for National Statistics | 6
In February 2012 an estimated £24.6 billion was spent in the retail sector, compared to £24.4 billion
in January 2012 and £23.9 billion in February 2011.
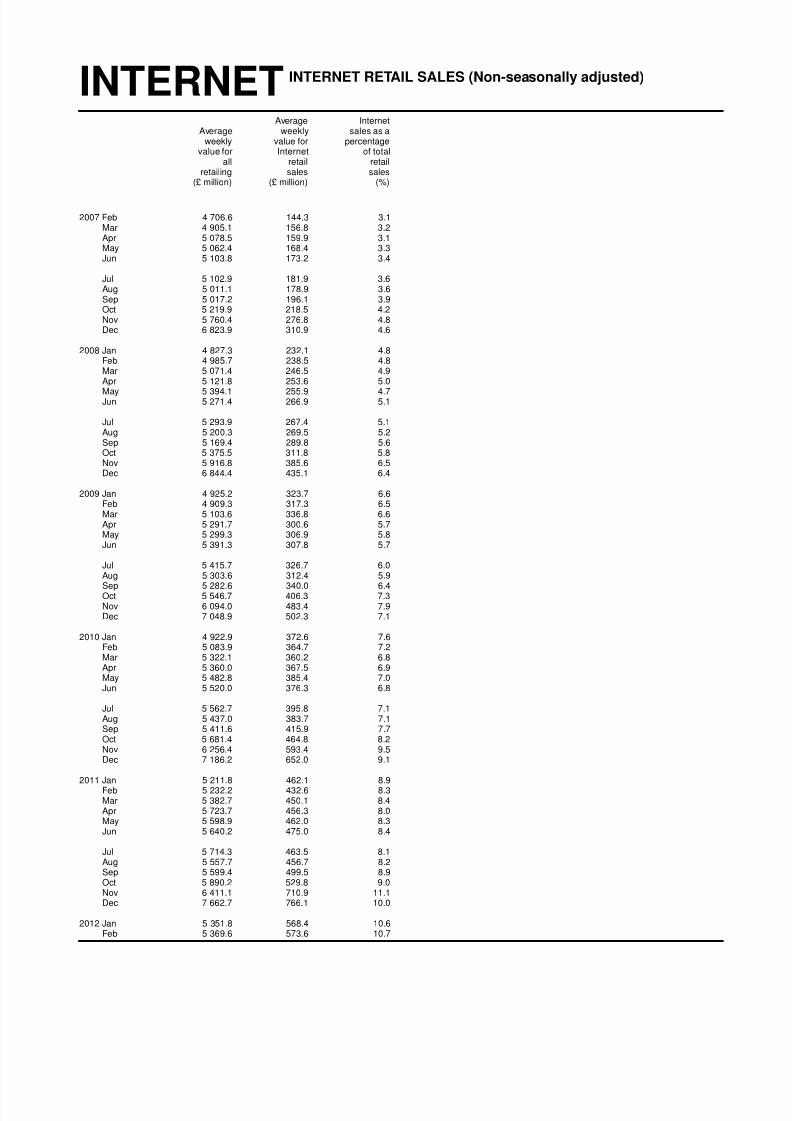
Internet sales
The experimental Internet Sales estimates include sales made over the internet by all retailers
that is they include on-line sales from supermarkets, department stores, clothing stores and
predominantly non-store retailers.
In February 2012 the non-seasonally adjusted average weekly sales value of Internet retail sales
was estimated at £573.6 million which was approximately 10.7 per cent of all retail sales (excluding
automotive fuel). In February 2011 non-seasonally adjusted average weekly sales value of Internet
retail sales was £432.6 million which was approximately 8.3 per cent of retail sales (excluding
automotive fuel).
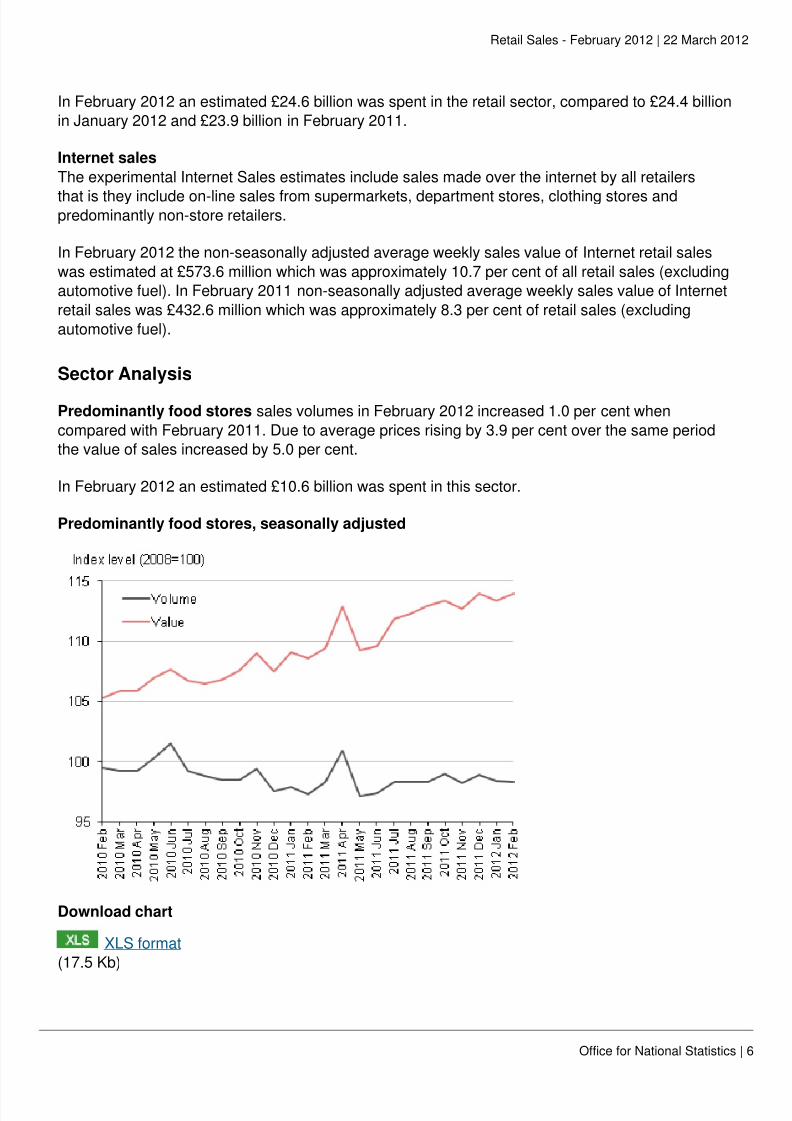
Sector Analysis
Predominantly food stores sales volumes in February 2012 increased 1.0 per cent when
compared with February 2011. Due to average prices rising by 3.9 per cent over the same period
the value of sales increased by 5.0 per cent.
In February 2012 an estimated £10.6 billion was spent in this sector.
Predominantly food stores, seasonally adjusted
Download chart
XLS format(17.5 Kb)
8/2/2019 Ons Retail Report
http://slidepdf.com/reader/full/ons-retail-report 7/84
Retail Sales - February 2012 | 22 March 2012
Office for National Statistics | 7
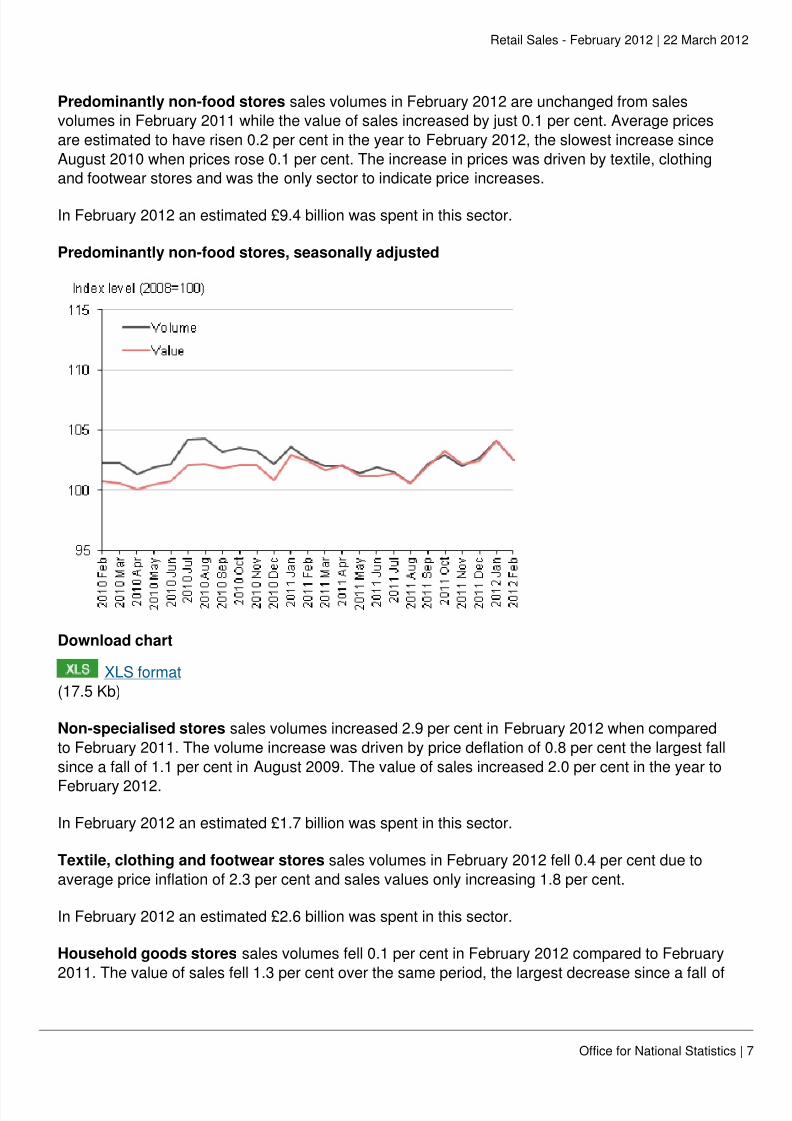
Predominantly non-food stores sales volumes in February 2012 are unchanged from sales
volumes in February 2011 while the value of sales increased by just 0.1 per cent. Average prices
are estimated to have risen 0.2 per cent in the year to February 2012, the slowest increase since
August 2010 when prices rose 0.1 per cent. The increase in prices was driven by textile, clothing
and footwear stores and was the only sector to indicate price increases.
In February 2012 an estimated £9.4 billion was spent in this sector.
Predominantly non-food stores, seasonally adjusted
Download chart
XLS format
(17.5 Kb)
Non-specialised stores sales volumes increased 2.9 per cent in February 2012 when compared
to February 2011. The volume increase was driven by price deflation of 0.8 per cent the largest fall
since a fall of 1.1 per cent in August 2009. The value of sales increased 2.0 per cent in the year to
February 2012.
In February 2012 an estimated £1.7 billion was spent in this sector.
Textile, clothing and footwear stores sales volumes in February 2012 fell 0.4 per cent due to
average price inflation of 2.3 per cent and sales values only increasing 1.8 per cent.
In February 2012 an estimated £2.6 billion was spent in this sector.
Household goods stores sales volumes fell 0.1 per cent in February 2012 compared to February2011. The value of sales fell 1.3 per cent over the same period, the largest decrease since a fall of

8/2/2019 Ons Retail Report
http://slidepdf.com/reader/full/ons-retail-report 8/84
Retail Sales - February 2012 | 22 March 2012
Office for National Statistics | 8
1.8 per cent in September 2011. Average price deflation slowed to 0.8 per cent in February 2012
from 0.9 per cent in January 2012.
In February 2012 an estimated £2.1 billion was spent in this sector.
Other stores sales volumes decreased 1.3 per cent in the year to February 2012. Sales valuesdecreased 1.8 per cent over the same period. Average prices are estimated to have fallen 0.5 per
cent in February 2012 compared with February 2011 the fastest fall since September 2009 (-0.6 per
cent).
In February 2012 an estimated £3.0 billion was spent in this sector.
Non-store retailing sales volumes increased 9.2 per cent in February 2012 compared with
February 2011. Sales values increased 8.6 per cent over the same period the slowest growth since
November 2010 (3.2 per cent). Average price deflation is estimated to be 0.7 per cent in the year to
February 2012 the fastest fall since November 2009 (-1.4 per cent).
In February 2012 an estimated £1.4 billion was spent in this sector.
Non-store retailing, seasonally adjusted
Download chart
XLS format
(17.5 Kb)
Predominantly automotive fuel stores sales volumes increased 1.1 per cent in the year to
February 2012 the lowest growth since December 2010 (-8.4 per cent). Sales values increased 6.2per cent in February 2012 compared to February 2011 the lowest growth since December 2011 (2.8

8/2/2019 Ons Retail Report
http://slidepdf.com/reader/full/ons-retail-report 9/84
Retail Sales - February 2012 | 22 March 2012
Office for National Statistics | 9
per cent). Average prices are estimated to have increased 5.3 per cent in the year to February 2012
the same as the year to January 2012 and lowest increase since October 2009 (-0.8 per cent).
.
In February 2012 an estimated £3.1 billion was spent in this sector.
Predominantly automotive fuel, seasonally adjusted
Download chart
XLS format
(17.5 Kb)
Distribution analysis
The table below illustrates the mix of experiences among different sized retailers. It shows the
distribution of the reported increase in sales values of businesses in the RSI sample, ranked by size
of business (based on number of employment). For example, this shows that the largest retailers,
with 100 or more employment, reported an average increase in sales of 2.5 per cent between
February 2011 and February 2012.

8/2/2019 Ons Retail Report
http://slidepdf.com/reader/full/ons-retail-report 10/84
Retail Sales - February 2012 | 22 March 2012
Office for National Statistics | 10
Increase in reported retail sales values between February 2011 and February 2012 standard
reporting periods (by size and of business)
Number of employment Weights (%) Growth since February 2011
(%)
100+ 78.5 2.5
40-99 2.1 -0.5
10-39 6.3 12.3
0-9 13.1 1.6
Download table
XLS format
(29 Kb)
Analysis of individual returns from businesses
The table below illustrates the extent to which individual businesses experienced actual changes
in their sales between February 2011 and February 2012. The table contains information only from
businesses which reported in both periods. Cells with values less than 10 are suppressed for some
classification categories, this is denoted by n.a. Note that large is defined as 100+ employment and
10-99 employment with annual turnover of more than £60m, while small and medium is defined as
0-99 employment.
See reference table Analysis of individual returns from businesses February 2012.
RFT RSI Analysis of individual returns from businesses February 2012
Background notes
1. What’s new?
On 2 April 2012 ONS will conduct a user engagement seminar. This periodic meeting allows
keys users to be briefed on and influence future developments
Improvements to be introduced next month
Detailed industry level seasonally adjusted data will be published for the first time. Tables 9 and
10 will display data at the lower industry level for value and volume measures, allowing users to
analyse seasonally adjusted data in greater detail.
Following continued development of Internet retail sales ONS remove the experimental tag and
will publish a value non-seasonally adjusted index for internet sales. This paves the way for theintroduction of seasonally adjusted results and sector breakdown in the near future.
8/2/2019 Ons Retail Report
http://slidepdf.com/reader/full/ons-retail-report 11/84
Retail Sales - February 2012 | 22 March 2012
Office for National Statistics | 11
2. Code of Practice for Official Statistics
National Statistics are produced to high professional standards set out in the Code of Practice
for Official Statistics. They undergo regular quality assurance reviews to ensure that they meetcustomer needs. They are produced free from any political interference. © Crown copyright
2012. Further information can be found on the website at:
3. Understanding the data
Quick Guide to the Retail Sales Index
Interpreting the data
The Retail Sales Index (RSI) is derived from a monthly survey of 5,000 businesses in Great
Britain. The sample represents the whole retail sector and includes all large retailers anda representative panel of smaller businesses. Collectively all of these businesses cover
approximately 95 per cent of the retail sector in terms of turnover.
The RSI covers sales only from businesses registered as retailers according to the Standard
Industrial Classification (SIC), an internationally agreed convention for classifying industries.
The retail sector is division 47 of the SIC 2007 and retailing is defined as the sale of goods
to the general public for household consumption. Consequently the RSI includes all internet
businesses whose primary function is retailing and also covers internet sales by other British
retailers, such as online sales by supermarkets, department stores and catalogue companies.
The RSI does not cover household spending on services bought from the retail sector as it isdesigned to only cover goods. Respondents are asked to separate out the non-goods elements
of their sales, e.g. income from cafeterias. Consequently on-line sales of services by retailers,
such as car insurance, would also be excluded.
The monthly survey collects two figures from each sampled business: the total turnover for retail
sales for the standard trading period, and a separate figure for sales made over the internet.
The total turnover will include internet sales. The separation of the internet sales figure allows
an estimate relating to internet sales to be calculated separately.
Definitions and explanations
The value or current price series records the growth since the base period (currently 2008) of
the value of sales ‘through the till’ before any adjustment for the effects of price changes.
The volume or constant price series are constructed by removing the effect of price changes
from the value series. The Consumer Price Index (CPI) is the main source of the information
required on price changes. In brief, a deflator for each type of store (5-digit SIC) is derived by
weighting together the CPI’s for the appropriate commodities, the weights being based on the
pattern of sales in the base year. These deflators are then applied to the value data to produce
volume series.
8/2/2019 Ons Retail Report
http://slidepdf.com/reader/full/ons-retail-report 12/84
Retail Sales - February 2012 | 22 March 2012
Office for National Statistics | 12
The estimated prices of retail sales (sometimes called the implied price deflator) is derived by
comparing the value and volume data non-seasonally adjusted. In general, this implied price
deflator should be quite close to the retail component of the CPI.
Experimental statistics are those which are in the testing phase and are not yet fully developed.
The main reason why the Internet retail sales are designated as experimental is that the
methods and data sources are still being improved. Here is more information on the internet
retail sales strategy.
Use of the data
The value and volume measures of retail sales estimates are widely used in private and public
sector institutions, particularly by the Bank of England and Her Majesty’s Treasury, to assist in
informed decision and policy making.
4. Methods
Information on retail sales methodology is available at: guidance and methodolgy
A video explaining retail sales is available on the ONS YouTube Channel at: ONS YouTube
Channel
Composition of the data
Estimates in the Statistical Bulletin are based on financial data collected through the monthly
Retail Sales Inquiry. The response rates for the current month reflect the response rates at the
time of publication. Late returns for the previous month’s data are included in the results eachmonth. Response rates for historical periods are updated to reflect the current level of response
at the time of this publication.
Overall response rates
Overall response rates
(per cent)
Period Turnover Forms
2012 Feb 94.2 70.3
Jan 96.5 79.7
2011 Dec 96.6 81.0
Nov 96.8 81.0
Download table
XLS format
(29 Kb)
8/2/2019 Ons Retail Report
http://slidepdf.com/reader/full/ons-retail-report 13/84
Retail Sales - February 2012 | 22 March 2012
Office for National Statistics | 13
Seasonal adjustment
Seasonally adjusted estimates are derived by estimating and removing calendar effects
(e.g. Easter moving between March and April) and seasonal effects (e.g. increased spending
in December as a result of Christmas) from the non-seasonally adjusted (NSA) estimates.
Seasonal adjustment is performed each month, and reviewed each year, using the standard,
widely used software, X-12-ARIMA. Before adjusting for seasonality, prior adjustments are
made for calendar effects (where statistically significant) such as: returns that do not comply
with the standard trading period (see section methods, calendar effects), bank holidays, Easter
and the day of the week Christmas occurs.
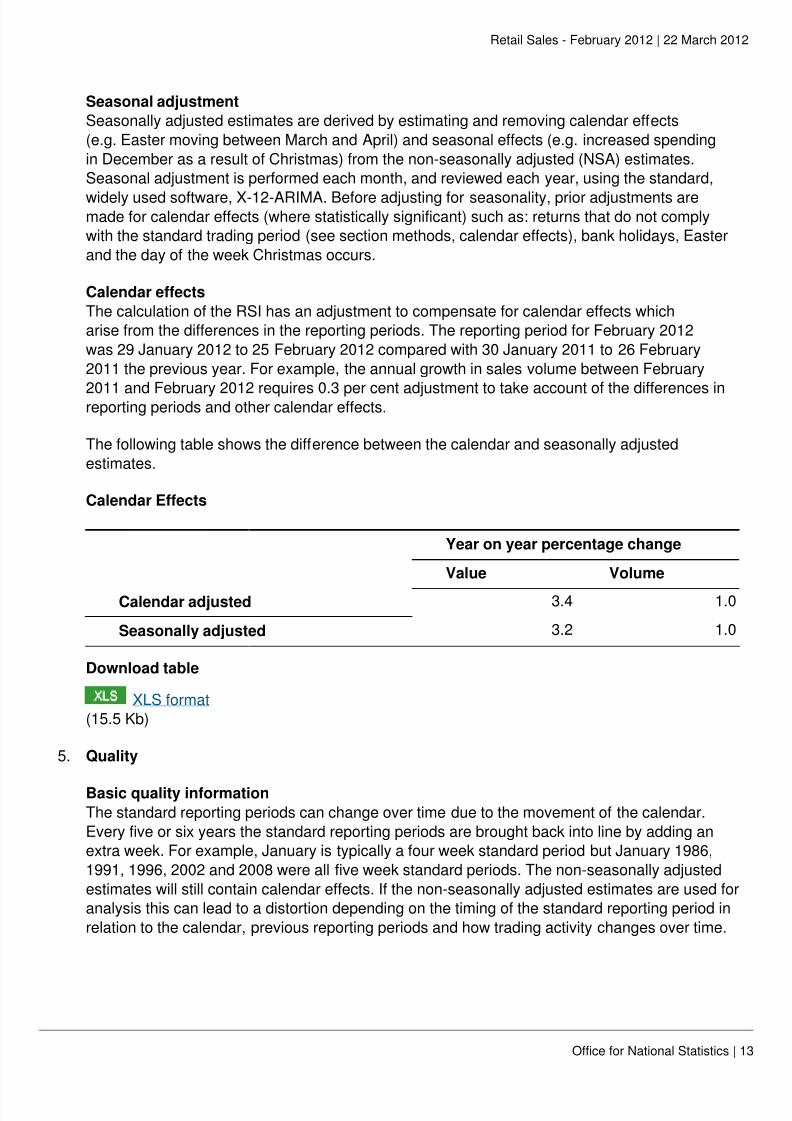
Calendar effects
The calculation of the RSI has an adjustment to compensate for calendar effects which
arise from the differences in the reporting periods. The reporting period for February 2012
was 29 January 2012 to 25 February 2012 compared with 30 January 2011 to 26 February
2011 the previous year. For example, the annual growth in sales volume between February
2011 and February 2012 requires 0.3 per cent adjustment to take account of the differences in
reporting periods and other calendar effects.
The following table shows the difference between the calendar and seasonally adjusted
estimates.
Calendar Effects
Year on year percentage change
Value Volume
Calendar adjusted 3.4 1.0
Seasonally adjusted 3.2 1.0
Download table
XLS format
(15.5 Kb)
5. Quality
Basic quality information
The standard reporting periods can change over time due to the movement of the calendar.
Every five or six years the standard reporting periods are brought back into line by adding an
extra week. For example, January is typically a four week standard period but January 1986,
1991, 1996, 2002 and 2008 were all five week standard periods. The non-seasonally adjusted
estimates will still contain calendar effects. If the non-seasonally adjusted estimates are used for
analysis this can lead to a distortion depending on the timing of the standard reporting period in
relation to the calendar, previous reporting periods and how trading activity changes over time.
8/2/2019 Ons Retail Report
http://slidepdf.com/reader/full/ons-retail-report 14/84
Retail Sales - February 2012 | 22 March 2012
Office for National Statistics | 14
The non-seasonally adjusted series contain elements relating to the impact of the standard
reporting period, moving seasonality and trading day activity. When making comparisons it
is recommended that users focus on the seasonally adjusted estimates as these have the
systematic calendar related component removed. Due to the volatility of the monthly data, it is
recommended that growth rates are calculated using an average of the latest three months of
the seasonally adjusted estimates.
When interpreting the data, consideration should be given to the relative weighted contributions
of the sectors within the all retailing series. Based on SIC 2007 data, Total retail sales consists
of: predominantly food stores 41.7 per cent, predominantly non-food stores 43.2 per cent, non-
store retailing 4.9 per cent and automotive fuel 10.2 per cent.
Standard errors
A measure of the accuracy of the RSI has been produced by estimating the standard errors of
index movements. For more detail see the article by Winton, J and Ralph, J (2011) ‘Measuring
the accuracy of the Retail Sales Index’, Economic & Labour Market Review, February 2011,
available at: Summary quality report
Summary Quality Report
A Summary Quality Report for the RSI can be found on the National Statistics website at:
Summary quality report
This report describes, in detail the intended uses of the statistics presented in this publication,
their general quality and the methods used to produce them.
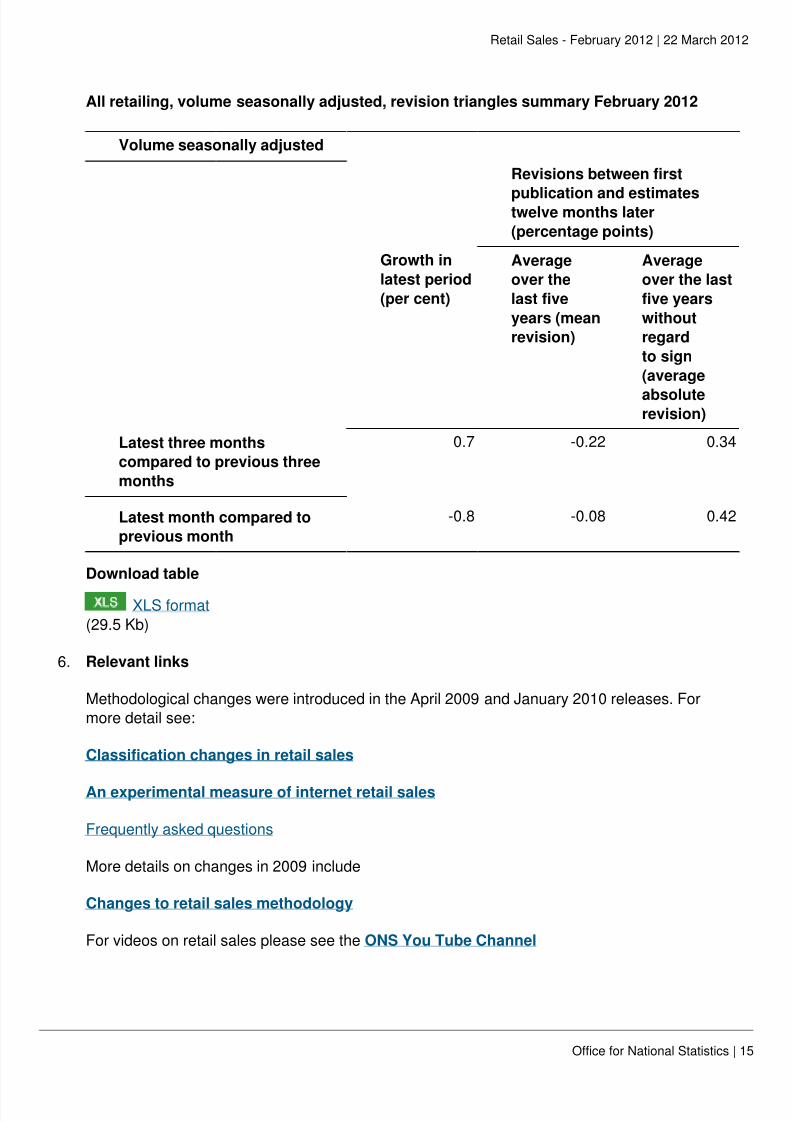
Revision triangles
Revisions to data provide one indication of the reliability of key indicators. The table below
shows summary information on the size and direction of the revisions which have been made
to the volume data covering a five year period. Note that changes in definition and classification
mean that the revision analysis is not conceptually the same over time. A statistical test has
been applied which has shown that the average revision in month to month statistics are not
statistically different from zero.
A spreadsheet giving these estimates and the calculations behind the averages in the table isavailable to download under "data in this release".
8/2/2019 Ons Retail Report
http://slidepdf.com/reader/full/ons-retail-report 15/84
Retail Sales - February 2012 | 22 March 2012
Office for National Statistics | 15
All retailing, volume seasonally adjusted, revision triangles summary February 2012
Volume seasonally adjusted
Revisions between first
publication and estimatestwelve months later
(percentage points)
Growth in
latest period
(per cent)
Average
over the
last five
years (mean
revision)
Average
over the last
five years
without
regard
to sign
(averageabsolute
revision)
Latest three months
compared to previous three
months
0.7 -0.22 0.34
Latest month compared to
previous month
-0.8 -0.08 0.42
Download table
XLS format
(29.5 Kb)
6. Relevant links
Methodological changes were introduced in the April 2009 and January 2010 releases. For
more detail see:
Classification changes in retail sales
An experimental measure of internet retail sales
Frequently asked questions
More details on changes in 2009 include
Changes to retail sales methodology
For videos on retail sales please see the ONS You Tube Channel
8/2/2019 Ons Retail Report
http://slidepdf.com/reader/full/ons-retail-report 16/84
Retail Sales - February 2012 | 22 March 2012
Office for National Statistics | 16
7. Publication policy
Details of the policy governing the release of new data are available from the Media Relations
Office. Also available is a list of the organisations given pre-publication access to the contents
of this bulletin.
8. Accessing data
The complete run of data in the tables of this statistical bulletin is available to view and
download in electronic format using the ONS Time Series Data service. Users can download
the complete bulletin in a choice of zipped formats, or view and download their own sections of
individual series. The Time Series Data can be accessed at: [email protected]
Next Publication Date:20 April 2012
Issuing Body:
Office for National Statistics
Media Contact Details:
Telephone: 0845 604 1858(8.30am-5:30pm Weekdays)
Emergency out of hours (limited service): 07867 906553
Email:

8/2/2019 Ons Retail Report
http://slidepdf.com/reader/full/ons-retail-report 17/84
All retailing 3.2
Predominantly food stores 5.0
Predominantly non-food stores 0.1
Non-specialised stores 2.0
Textile, clothing and footwear stores 1.8
Household goods stores -1.3
Other stores -1.8
Non-store retailing 8.6
Automotive fuel 6.2
All retailing 4.5Predominantly food stores 5.1
Predominantly non-food stores 1.0
Non-specialised stores 1.5
Textile, clothing and footwear stores 5.3
Household goods stores -0.8
Other stores -2.1
Non-store retailing 9.4
Automotive fuel 13.6
All retailing -0.4
Predominantly food stores 0.6
Predominantly non-food stores -1.6
Non-specialised stores -0.4
Textile, clothing and footwear stores -1.0
Household goods stores -1.2
Other stores -3.0
Non-store retailing -0.4
Automotive fuel -0.1
All retailing 1.0
Predominantly food stores 0.7
Predominantly non-food stores 0.5 n/a
Non-specialised stores 1.0
Textile, clothing and footwear stores 2.0
Household goods stores -0.9
Other stores -0.4
Non-store retailing 3.5
Automotive fuel 2.6
Table 1 Summary of statistics for February 2012: Value seasonally adjustedPrevious
Latest Record record
Indicator and publication category month % since growth %
Most recent month on a year earlier
Lowest since December 2010 1.5
No record this month n/a
Lowest, along with November 2011,
since August 2011
-1.5
No record this month n/a
No record this month n/a
No record this month n/a
No record this month n/a
Lowest since November 2010 3.2
Lowest since December 2010 2.8
Most recent 3 months on a year earlier
Lowest since August 2011 4.0No record this month n/a
Highest, along with Jan 2012, Dec 2011
and Jun 2011, since May 2011
1.3
Lowest since June 2009 1.0
No record this month n/a
No record this month n/a
No record this month n/a
Lowest since December 2010 9.3
Lowest since January 2011 10.0
Most recent month on previous month
Lowest since May 2011 -1.5
No record this month n/a
Lowest since January 2010 -5.2
No record this month n/a
No record this month n/a
No record this month n/a
No record this month n/a
Lowest since August 2011 -0.5
No record this month n/a
Most recent 3 months on previous 3 months
No record this month n/a
No record this month n/a
No record this month
No record this month n/a
No record this month n/a
Lowest since January 2011 -2.2
Lowest since August 2011 -2.5
No record this month n/a
No record this month n/a
8/2/2019 Ons Retail Report
http://slidepdf.com/reader/full/ons-retail-report 18/84
All retailing 1.0
Predominantly food stores 1.0
Predominantly non-food stores 0.0
Non-specialised stores 2.9
Textile, clothing and footwear stores -0.4
Household goods stores -0.1
Other stores -1.3
Non-store retailing 9.2
Automotive fuel 1.1
All retailing 1.7
Predominantly food stores 1.0
Predominantly non-food stores 0.3
Non-specialised stores 2.0
Textile, clothing and footwear stores 2.9
Household goods stores -1.4 n/a
Other stores -2.0
Non-store retailing 9.9
Automotive fuel 6.3
All retailing -0.8
Predominantly food stores -0.1
Predominantly non-food stores -1.5
Non-specialised stores 0.0
Textile, clothing and footwear stores -1.2
Household goods stores -1.0
Other stores -3.0
Non-store retailing -0.4
Automotive fuel -1.0
All retailing 0.7
Predominantly food stores 0.1Predominantly non-food stores 0.7
Non-specialised stores 1.3
Textile, clothing and footwear stores 2.0
Household goods stores -1.4
Other stores 0.5
Non-store retailing 3.1
Automotive fuel 2.0
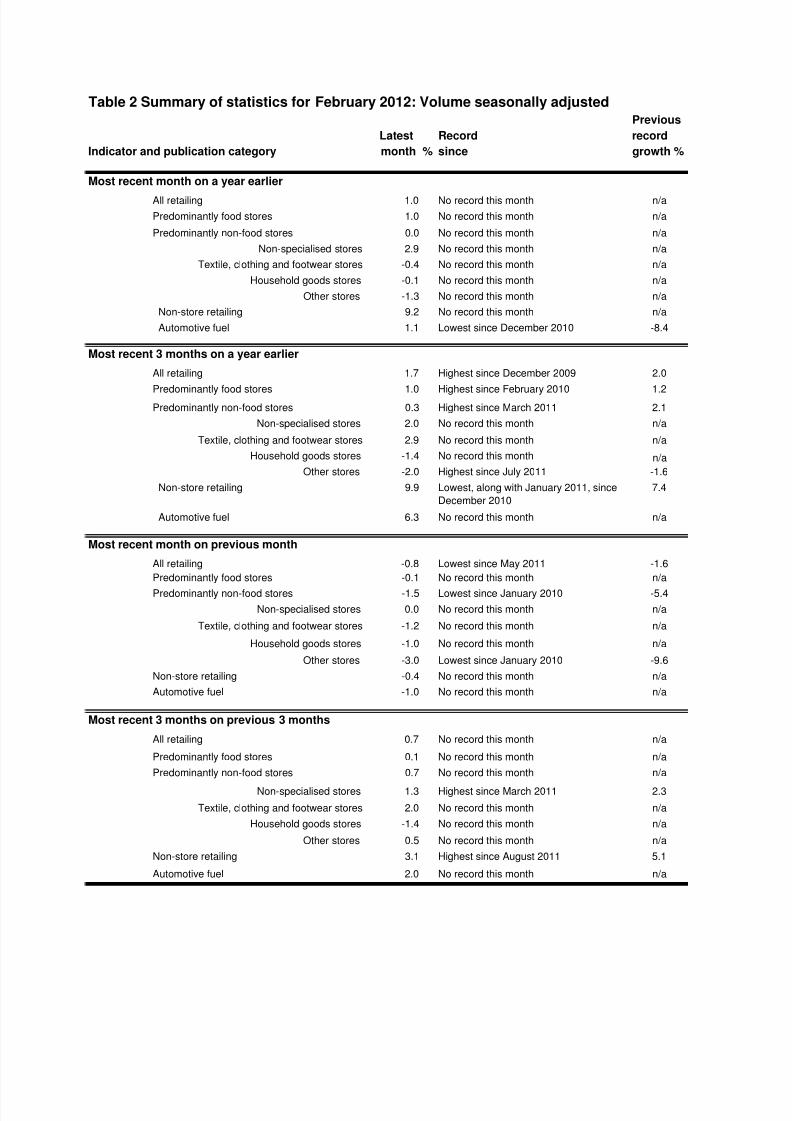
Table 2 Summary of statistics for February 2012: Volume seasonally adjustedPrevious
Latest Record record
Indicator and publication category month % since growth %
Most recent month on a year earlier
No record this month n/a
No record this month n/a
No record this month n/a
No record this month n/a
No record this month n/a
No record this month n/a
No record this month n/a
No record this month n/a
Lowest since December 2010 -8.4
Most recent 3 months on a year earlier
Highest since December 2009 2.0
Highest since February 2010 1.2
Highest since March 2011 2.1
No record this month n/a
No record this month n/a
No record this month
Highest since July 2011 -1.6
Lowest, along with January 2011, since
December 2010
7.4
No record this month n/a
Most recent month on previous month
Lowest since May 2011 -1.6
No record this month n/a
Lowest since January 2010 -5.4
No record this month n/a
No record this month n/a
No record this month n/a
Lowest since January 2010 -9.6
No record this month n/a
No record this month n/a
Most recent 3 months on previous 3 months
No record this month n/a
No record this month n/aNo record this month n/a
Highest since March 2011 2.3
No record this month n/a
No record this month n/a
No record this month n/a
No record this month n/a
Highest since August 2011 5.1
8/2/2019 Ons Retail Report
http://slidepdf.com/reader/full/ons-retail-report 19/84
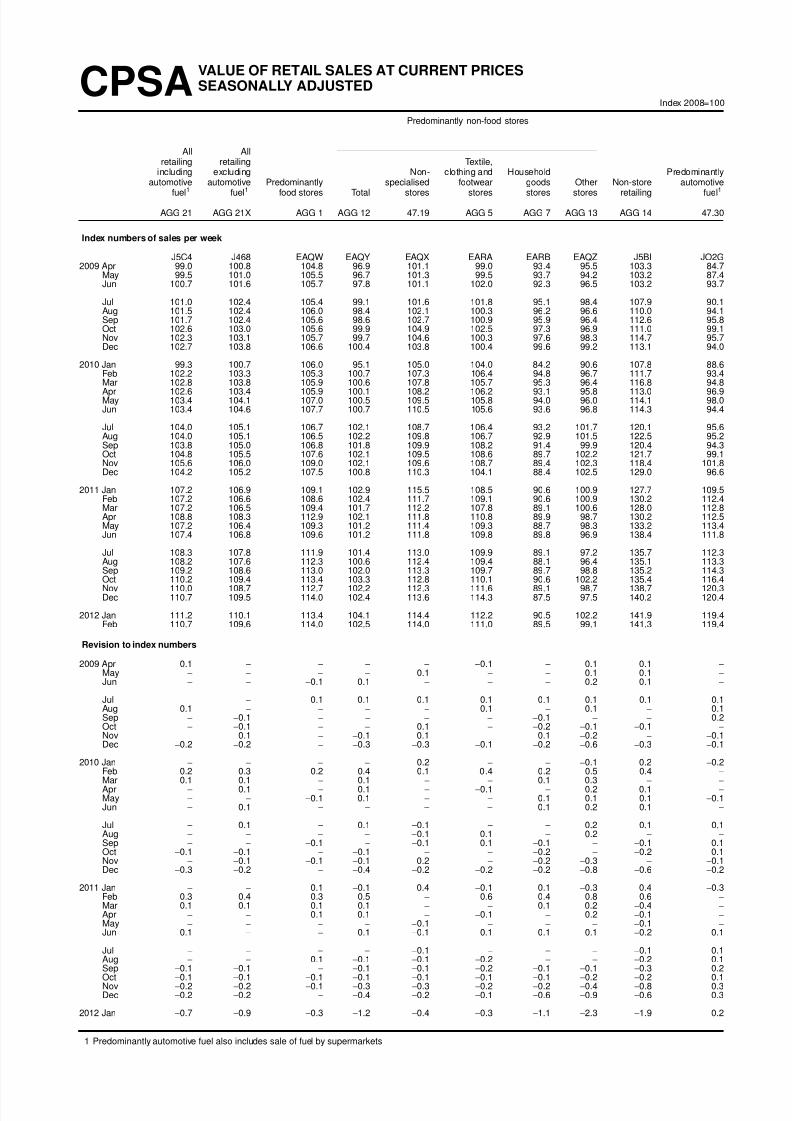
CPSAVALUE OF RETAIL SALES AT CURRENT PRICESSEASONALLY ADJUSTED
Index 2008=100
Predominantly non-food stores
All Allretailing retailing Te xtile,
including excluding Non- clothing and Household Predominantlyautomotive automotive Predominantly specialised footwear goods Other Non-store automotive
fuel1 fuel1 food stores Total stores stores stores stores retailing fuel1
AGG 21 AGG 21X AGG 1 AGG 12 47.19 AGG 5 AGG 7 AGG 13 AGG 14 47.30
Index numbers of sales per week
J5C4 J468 EAQW EAQY EAQX EARA EARB EAQZ J5BI JO2G2009 Apr 99.0 100.8 104.8 96.9 101.1 99.0 93.4 95.5 103.3 84.7
May 99.5 101.0 105.5 96.7 101.3 99.5 93.7 94.2 103.2 87.4Jun 100.7 101.6 105.7 97.8 101.1 102.0 92.3 96.5 103.2 93.7
Jul 101.0 102.4 105.4 99.1 101.6 101.8 95.1 98.4 107.9 90.1Aug 101.5 102.4 106.0 98.4 102.1 100.3 96.2 96.6 110.0 94.1Sep 101.7 102.4 105.6 98.6 102.7 100.9 95.9 96.4 112.6 95.8Oct 102.6 103.0 105.6 99.9 104.9 102.5 97.3 96.9 111.0 99.1Nov 102.3 103.1 105.7 99.7 104.6 100.3 97.6 98.3 114.7 95.7Dec 102.7 103.8 106.6 100.4 103.8 100.4 99.6 99.2 113.1 94.0
2010 Jan 99.3 100.7 106.0 95.1 105.0 104.0 84.2 90.6 107.8 88.6Feb 102.2 103.3 105.3 100.7 107.3 106.4 94.8 96.7 111.7 93.4Mar 102.8 103.8 105.9 100.6 107.8 105.7 95.3 96.4 116.8 94.8Apr 102.6 103.4 105.9 100.1 108.2 106.2 93.1 95.8 113.0 96.9May 103.4 104.1 107.0 100.5 109.5 105.8 94.0 96.0 114.1 98.0Jun 103.4 104.6 107.7 100.7 110.5 105.6 93.6 96.8 114.3 94.4
Jul 104.0 105.1 106.7 102.1 108.7 106.4 93.2 101.7 120.1 95.6Aug 104.0 105.1 106.5 102.2 109.8 106.7 92.9 101.5 122.5 95.2Sep 103.8 105.0 106.8 101.8 109.9 108.2 91.4 99.9 120.4 94.3Oct 104.8 105.5 107.6 102.1 109.5 108.6 89.7 102.2 121.7 99.1Nov 105.6 106.0 109.0 102.1 109.6 108.7 89.4 102.3 118.4 101.8Dec 104.2 105.2 107.5 100.8 110.3 104.1 88.4 102.5 129.0 96.6
2011 Jan 107.2 106.9 109.1 102.9 115.5 108.5 90.6 100.9 127.7 109.5Feb 107.2 106.6 108.6 102.4 111.7 109.1 90.6 100.9 130.2 112.4Mar 107.2 106.5 109.4 101.7 112.2 107.8 89.1 100.6 128.0 112.8Apr 108.8 108.3 112.9 102.1 111.8 110.8 89.9 98.7 130.2 112.5May 107.2 106.4 109.3 101.2 111.4 109.3 88.7 98.3 133.2 113.4Jun 107.4 106.8 109.6 101.2 111.8 109.8 89.8 96.9 138.4 111.8
Jul 108.3 107.8 111.9 101.4 113.0 109.9 89.1 97.2 135.7 112.3Aug 108.2 107.6 112.3 100.6 112.4 109.4 88.1 96.4 135.1 113.3
Sep 109.2 108.6 113.0 102.0 113.3 109.7 89.7 98.8 135.2 114.3Oct 110.2 109.4 113.4 103.3 112.8 110.1 90.6 102.2 135.4 116.4Nov 110.0 108.7 112.7 102.2 112.3 111.6 89.1 98.7 138.7 120.3Dec 110.7 109.5 114.0 102.4 113.6 114.3 87.5 97.5 140.2 120.4
2012 Jan 111.2 110.1 113.4 104.1 114.4 112.2 90.5 102.2 141.9 119.4Feb 110.7 109.6 114.0 102.5 114.0 111.0 89.5 99.1 141.3 119.4
Revision to index numbers
2009 Apr 0.1 − − − − −0.1 − 0.1 0.1 −
May − − − − 0.1 − − 0.1 0.1 −
Jun − − −0.1 0.1 − − − 0.2 0.1 −
Jul − − −0.1 0.1 −0.1 0.1 0.1 0.1 0.1 0.1Aug 0.1 − − − − 0.1 − 0.1 − 0.1Sep − −0.1 − − − − −0.1 − − 0.2Oct − −0.1 − − 0.1 − −0.2 −0.1 −0.1 −
Nov − −0.1 − −0.1 0.1 − −0.1 −0.2 − −0.1Dec −0.2 −0.2 − −0.3 −0.3 −0.1 −0.2 −0.6 −0.3 −0.1
2010 Jan− − − −
0.2− − −
0.1 0.2−0.2
Feb 0.2 0.3 0.2 0.4 0.1 0.4 0.2 0.5 0.4 −
Mar 0.1 0.1 − 0.1 − − 0.1 0.3 − −
Apr − 0.1 − 0.1 − −0.1 − 0.2 0.1 −
May − − −0.1 0.1 − − 0.1 0.1 0.1 −0.1Jun − 0.1 − − − − 0.1 0.2 0.1 −
Jul − 0.1 − 0.1 −0.1 − − 0.2 0.1 0.1Aug − − − − −0.1 0.1 − 0.2 − −
Sep − − −0.1 − −0.1 0.1 −0.1 − −0.1 0.1Oct −0.1 −0.1 − −0.1 − − −0.2 − −0.2 0.1Nov − −0.1 −0.1 −0.1 0.2 − −0.2 −0.3 − −0.1Dec −0.3 −0.2 − −0.4 −0.2 −0.2 −0.2 −0.8 −0.6 −0.2
2011 Jan − − 0.1 −0.1 0.4 −0.1 0.1 −0.3 0.4 −0.3Feb 0.3 0.4 0.3 0.5 − 0.6 0.4 0.8 0.6 −
Mar 0.1 0.1 0.1 0.1 − − 0.1 0.2 −0.4 −
Apr − − 0.1 0.1 − −0.1 − 0.2 −0.1 −
May − − − − −0.1 − − − −0.1 −
Jun 0.1 − − 0.1 −0.1 0.1 0.1 0.1 −0.2 0.1
Jul− − − − −
0.1− − − −
0.1 0.1Aug − − 0.1 −0.1 −0.1 −0.2 − − −0.2 0.1Sep −0.1 −0.1 − −0.1 −0.1 −0.2 −0.1 −0.1 −0.3 0.2Oct −0.1 −0.1 −0.1 −0.1 −0.1 −0.1 −0.1 −0.2 −0.2 0.1Nov −0.2 −0.2 −0.1 −0.3 −0.3 −0.2 −0.2 −0.4 −0.8 0.3Dec −0.2 −0.2 − −0.4 −0.2 −0.1 −0.6 −0.9 −0.6 0.3
2012 Jan −0.7 −0.9 −0.3 −1.2 −0.4 −0.3 −1.1 −2.3 −1.9 0.2
1 Predominantly automotive fuel also includes sale of fuel by super markets
8/2/2019 Ons Retail Report
http://slidepdf.com/reader/full/ons-retail-report 20/84
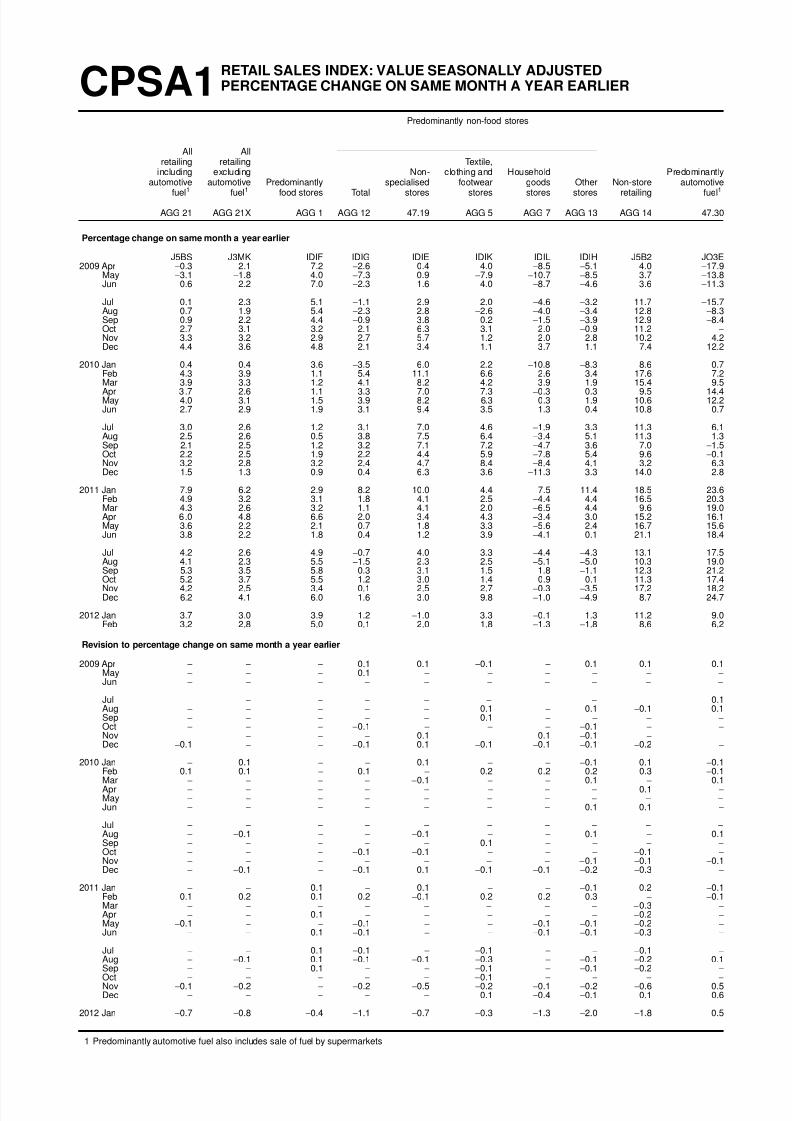
CPSA1RETAIL SALES INDEX: VALUE SEASONALLY ADJUSTEDPERCENTAGE CHANGE ON SAME MONTH A YEAR EARLIER
Predominantly non-food stores
All Allretailing retailing Te xtile,
including excluding Non- clothing and Household Predominantlyautomotive automotive Predominantly specialised footwear goods Other Non-store automotive
fuel1 fuel1 food stores Total stores stores stores stores retailing fuel1
AGG 21 AGG 21X AGG 1 AGG 12 47.19 AGG 5 AGG 7 AGG 13 AGG 14 47.30
Percentage chang e on same month a year earlier
J5BS J3MK IDIF IDIG IDIE IDIK IDIL IDIH J5B2 JO3E2009 Apr −0.3 2.1 7.2 −2.6 0.4 4.0 −8.5 −5.1 4.0 −17.9
May −3.1 −1.8 4.0 −7.3 0.9 −7.9 −10.7 −8.5 3.7 −13.8Jun 0.6 2.2 7.0 −2.3 1.6 4.0 −8.7 −4.6 3.6 −11.3
Jul 0.1 2.3 5.1 −1.1 2.9 2.0 −4.6 −3.2 11.7 −15.7Aug 0.7 1.9 5.4 −2.3 2.8 −2.6 −4.0 −3.4 12.8 −8.3Sep 0.9 2.2 4.4 −0.9 3.8 0.2 −1.5 −3.9 12.9 −8.4Oct 2.7 3.1 3.2 2.1 6.3 3.1 2.0 −0.9 11.2 −
Nov 3.3 3.2 2.9 2.7 5.7 1.2 2.0 2.8 10.2 4.2Dec 4.4 3.6 4.8 2.1 3.4 1.1 3.7 1.1 7.4 12.2
2010 Jan 0.4 0.4 3.6 −3.5 6.0 2.2 −10.8 −8.3 8.6 0.7Feb 4.3 3.9 1.1 5.4 11.1 6.6 2.6 3.4 17.6 7.2Mar 3.9 3.3 1.2 4.1 8.2 4.2 3.9 1.9 15.4 9.5Apr 3.7 2.6 1.1 3.3 7.0 7.3 −0.3 0.3 9.5 14.4May 4.0 3.1 1.5 3.9 8.2 6.3 0.3 1.9 10.6 12.2Jun 2.7 2.9 1.9 3.1 9.4 3.5 1.3 0.4 10.8 0.7
Jul 3.0 2.6 1.2 3.1 7.0 4.6 −1.9 3.3 11.3 6.1Aug 2.5 2.6 0.5 3.8 7.5 6.4 −3.4 5.1 11.3 1.3Sep 2.1 2.5 1.2 3.2 7.1 7.2 −4.7 3.6 7.0 −1.5Oct 2.2 2.5 1.9 2.2 4.4 5.9 −7.8 5.4 9.6 −0.1Nov 3.2 2.8 3.2 2.4 4.7 8.4 −8.4 4.1 3.2 6.3Dec 1.5 1.3 0.9 0.4 6.3 3.6 −11.3 3.3 14.0 2.8
2011 Jan 7.9 6.2 2.9 8.2 10.0 4.4 7.5 11.4 18.5 23.6Feb 4.9 3.2 3.1 1.8 4.1 2.5 −4.4 4.4 16.5 20.3Mar 4.3 2.6 3.2 1.1 4.1 2.0 −6.5 4.4 9.6 19.0Apr 6.0 4.8 6.6 2.0 3.4 4.3 −3.4 3.0 15.2 16.1May 3.6 2.2 2.1 0.7 1.8 3.3 −5.6 2.4 16.7 15.6Jun 3.8 2.2 1.8 0.4 1.2 3.9 −4.1 0.1 21.1 18.4
Jul 4.2 2.6 4.9 −0.7 4.0 3.3 −4.4 −4.3 13.1 17.5Aug 4.1 2.3 5.5 −1.5 2.3 2.5 −5.1 −5.0 10.3 19.0
Sep 5.3 3.5 5.8 0.3 3.1 1.5−1.8
−1.1 12.3 21.2
Oct 5.2 3.7 5.5 1.2 3.0 1.4 0.9 0.1 11.3 17.4Nov 4.2 2.5 3.4 0.1 2.5 2.7 −0.3 −3.5 17.2 18.2Dec 6.2 4.1 6.0 1.6 3.0 9.8 −1.0 −4.9 8.7 24.7
2012 Jan 3.7 3.0 3.9 1.2 −1.0 3.3 −0.1 1.3 11.2 9.0Feb 3.2 2.8 5.0 0.1 2.0 1.8 −1.3 −1.8 8.6 6.2
Revision to percentage change on same month a year earlier
2009 Apr − − − 0.1 0.1 −0.1 − 0.1 0.1 0.1May − − − 0.1 − − − − − −
Jun − − − − − − − − − −
Jul − − − − − − − − − 0.1Aug − − − − − 0.1 − 0.1 −0.1 0.1Sep − − − − − 0.1 − − − −
Oct − − − −0.1 − − − −0.1 − −
Nov − − − − 0.1 − −0.1 −0.1 − −
Dec −0.1 − − −0.1 0.1 −0.1 −0.1 −0.1 −0.2 −
2010 Jan−
0.1− −
0.1− − −
0.1 0.1−0.1
Feb 0.1 0.1 − 0.1 − 0.2 0.2 0.2 0.3 −0.1Mar − − − − −0.1 − − 0.1 − 0.1Apr − − − − − − − − 0.1 −
May − − − − − − − − − −
Jun − − − − − − − 0.1 0.1 −
Jul − − − − − − − − − −
Aug − −0.1 − − −0.1 − − 0.1 − 0.1Sep − − − − − 0.1 − − − −
Oct − − − −0.1 −0.1 − − − −0.1 −
Nov − − − − − − − −0.1 −0.1 −0.1Dec − −0.1 − −0.1 0.1 −0.1 −0.1 −0.2 −0.3 −
2011 Jan − − 0.1 − 0.1 − − −0.1 0.2 −0.1Feb 0.1 0.2 0.1 0.2 −0.1 0.2 0.2 0.3 − −0.1Mar − − − − − − − − −0.3 −
Apr − − 0.1 − − − − − −0.2 −
May −0.1 − − −0.1 − − −0.1 −0.1 −0.2 −
Jun − − 0.1 −0.1 − − −0.1 −0.1 −0.3 −
Jul− −
0.1−0.1
− −0.1
− − −0.1
−Aug − −0.1 0.1 −0.1 −0.1 −0.3 − −0.1 −0.2 0.1Sep − − 0.1 − − −0.1 − −0.1 −0.2 −
Oct − − − − − −0.1 − − − −
Nov −0.1 −0.2 − −0.2 −0.5 −0.2 −0.1 −0.2 −0.6 0.5Dec − − − − − 0.1 −0.4 −0.1 0.1 0.6
2012 Jan −0.7 −0.8 −0.4 −1.1 −0.7 −0.3 −1.3 −2.0 −1.8 0.5
1 Predominantly automotive fuel also includes sale of fuel by super markets

8/2/2019 Ons Retail Report
http://slidepdf.com/reader/full/ons-retail-report 21/84
CPSA2RETAIL SALES INDEX: VALUE SEASONALLY ADJUSTEDPERCENTAGE CHANGE 3 MONTHS ON SAME PERIOD A YEAR EARLIER
Predominantly non-food stores
All Allretailing retailing Te xtile,
including excluding Non- clothing and Household Predominantlyautomotive automotive Predominantly specialised footwear goods Other Non-store automotive
fuel1 fuel1 food stores Total stores stores stores stores retailing fuel1
AGG 21 AGG 21X AGG 1 AGG 12 47.19 AGG 5 AGG 7 AGG 13 AGG 14 47.30
Percentage chang e 3 months on same period a year earlier
J5BY J45L IEAU IEAX IEAR IEBJ IEBM IEBA J5BA JO6B2009 Apr −1.1 0.7 6.7 −4.4 −1.7 1.5 −9.8 −6.7 0.2 −15.1
May −1.2 0.6 6.1 −4.5 0.6 −0.2 −10.1 −6.4 3.3 −15.0Jun −0.8 0.9 6.1 −4.0 1.0 − −9.2 −6.0 3.8 −14.1
Jul −0.7 1.0 5.5 −3.5 1.8 −0.5 −8.1 −5.4 6.1 −13.4Aug 0.5 2.1 5.9 −1.9 2.4 1.3 −6.0 −3.8 8.9 −11.8Sep 0.6 2.1 4.9 −1.4 3.2 −0.2 −3.2 −3.5 12.5 −10.7Oct 1.4 2.4 4.3 −0.4 4.2 0.2 −1.3 −2.8 12.3 −5.9Nov 2.2 2.7 3.6 1.1 5.1 1.4 0.6 −0.9 11.5 −2.2Dec 3.5 3.3 3.7 2.3 5.0 1.7 2.6 1.0 9.4 5.6
2010 Jan 2.8 2.5 3.8 0.5 4.9 1.5 −1.3 −1.3 8.6 6.0Feb 3.1 2.7 3.3 1.4 6.5 3.1 −1.1 −1.2 10.7 7.0Mar 2.9 2.6 1.9 2.1 8.4 4.3
−1.1
−0.9 13.9 6.1
Apr 3.9 3.3 1.1 4.3 8.7 5.9 2.2 1.9 14.1 10.3May 3.9 3.0 1.2 3.8 7.8 5.8 1.5 1.4 12.1 11.8Jun 3.4 2.8 1.5 3.4 8.3 5.5 0.5 0.8 10.3 8.2
Jul 3.1 2.8 1.5 3.3 8.2 4.7 − 1.7 10.9 5.8Aug 2.7 2.7 1.2 3.3 8.1 4.7 −1.2 2.7 11.1 2.5Sep 2.5 2.6 1.0 3.4 7.2 6.1 −3.5 4.0 9.6 1.6Oct 2.2 2.5 1.2 3.1 6.4 6.5 −5.3 4.6 9.1 −0.2Nov 2.4 2.6 2.0 2.7 5.5 7.1 −6.8 4.3 6.6 1.3Dec 2.2 2.1 1.9 1.6 5.2 5.8 −9.4 4.2 9.3 3.0
2011 Jan 3.9 3.3 2.2 3.3 6.9 5.3 −5.2 5.9 11.9 10.0Feb 4.5 3.4 2.2 3.1 6.7 3.5 −3.9 6.0 16.1 14.4Mar 5.6 3.8 3.1 3.4 5.9 2.9 −1.9 6.5 14.3 20.8Apr 5.0 3.4 4.2 1.6 3.9 2.9 −4.9 4.0 13.4 18.5May 4.6 3.1 3.9 1.3 3.1 3.1 −5.3 3.4 13.5 17.0Jun 4.4 3.0 3.3 1.0 2.0 3.8 −4.3 1.7 17.9 16.8
Jul 3.9 2.3 2.8 0.2 2.2 3.5 −4.6 −0.6 17.2 17.2Aug 4.0 2.4 3.9 −0.5 2.4 3.3 −4.5 −2.9 15.2 18.3
Sep 4.6 2.9 5.4−0.6 3.1 2.3
−3.6
−3.3 11.9 19.4
Oct 4.9 3.2 5.6 − 2.8 1.8 −2.0 −1.9 11.4 19.3Nov 4.9 3.3 4.9 0.5 2.9 1.8 −0.5 −1.5 13.5 19.1Dec 5.3 3.5 5.0 1.0 2.9 5.0 −0.2 −3.0 12.0 20.4
2012 Jan 4.8 3.3 4.6 1.0 1.6 5.6 −0.5 −2.6 11.9 17.5Feb 4.5 3.4 5.1 1.0 1.5 5.3 −0.8 −2.1 9.4 13.6
Revision to percentage change 3 months on same period a year earlier
2009 Apr − − 0.1 0.1 − − − 0.1 − −
May − − − − − − − − − −
Jun − − − − − −0.1 − − 0.1 −
Jul − − − − − − − − 0.1 −
Aug − − − − − − − − − −
Sep − − − − − − − − − −
Oct − − − − −0.1 − −0.1 − −0.1 −
Nov − −0.1 − − − − −0.1 − − −
Dec −0.1 − − − 0.1 −0.1 −0.1 −0.1 −0.1 −
2010 Jan− − − −
0.1 0.1− −
0.1−0.1
−0.1
−0.1
Feb − − 0.1 0.1 − − − − − −0.1Mar − 0.1 − − − − 0.1 0.1 0.1 −
Apr − 0.1 − 0.1 − 0.1 0.1 0.2 − −
May − − − − − − − − 0.1 −
Jun − − − − − − − − − −
Jul − −0.1 − − −0.1 − − − − −
Aug − − − − − − − − − −
Sep − − − − − − − − − −
Oct − − − − − − − − −0.1 −
Nov −0.1 − − − − − − −0.1 −0.1 −
Dec −0.1 −0.1 − − − − −0.1 −0.1 −0.2 −
2011 Jan −0.1 − − −0.1 − −0.1 − −0.1 −0.1 −0.1Feb − 0.1 0.1 − − − 0.1 − −0.1 −0.1Mar 0.1 − 0.1 − − 0.1 − 0.1 −0.1 −
Apr − − − − − 0.1 0.1 0.1 −0.2 −
May − − − − −0.1 − − − −0.2 −
Jun − − − − − − − −0.1 −0.3 −
Jul− − − − − − − −
0.1−0.2
−Aug − − 0.1 − − −0.1 − −0.1 −0.2 −
Sep − − − −0.1 − −0.2 − −0.1 −0.2 0.1Oct − − − −0.1 −0.1 −0.2 − − −0.1 −
Nov −0.1 − − −0.1 −0.1 −0.2 − −0.1 −0.2 0.2Dec − − − −0.1 −0.1 − −0.2 −0.2 −0.1 0.4
2012 Jan −0.2 −0.3 −0.1 −0.4 −0.3 − −0.6 −0.7 −0.7 0.5
1 Predominantly automotive fuel also includes sale of fuel by super markets

8/2/2019 Ons Retail Report
http://slidepdf.com/reader/full/ons-retail-report 22/84
CPSA3RETAIL SALES INDEX: VALUE SEASONALLY ADJUSTEDPERCENTAGE CHANGE ON PREVIOUS MONTH
Predominantly non-food stores
All Allretailing retailing Te xtile,
including excluding Non- clothing and Household Predominantlyautomotive automotive Predominantly specialised footwear goods Other Non-store automotive
fuel1 fuel1 food stores Total stores stores stores stores retailing fuel1
AGG 21 AGG 21X AGG 1 AGG 12 47.19 AGG 5 AGG 7 AGG 13 AGG 14 47.30
Percentage chang e on previous month
J5BT J45X IEAS IEAV IEAP IEBH IEBK IEAY J5B3 JO692009 Apr − 0.3 0.1 0.3 1.5 −2.4 1.8 1.0 2.0 −2.2
May 0.5 0.2 0.7 −0.2 0.1 0.5 0.4 −1.4 −0.1 3.1Jun 1.3 0.6 0.2 1.1 −0.2 2.5 −1.5 2.4 − 7.3
Jul 0.3 0.7 −0.3 1.3 0.6 −0.3 3.0 2.0 4.6 −3.9Aug 0.5 − 0.5 −0.6 0.5 −1.5 1.2 −1.9 1.9 4.4Sep 0.2 − −0.3 0.1 0.6 0.6 −0.2 −0.2 2.3 1.8Oct 0.9 0.6 − 1.3 2.1 1.6 1.5 0.6 −1.4 3.5Nov −0.3 0.1 0.1 −0.1 −0.2 −2.2 0.3 1.4 3.3 −3.4Dec 0.4 0.6 0.8 0.7 −0.8 0.1 2.1 0.9 −1.3 −1.9
2010 Jan −3.3 −3.0 −0.5 −5.2 1.2 3.6 −15.5 −8.7 −4.8 −5.7Feb 2.9 2.6 −0.7 5.8 2.1 2.3 12.6 6.7 3.6 5.4Mar 0.6 0.5 0.5
−0.1 0.5
−0.6 0.5
−0.4 4.6 1.5
Apr −0.1 −0.4 − −0.5 0.4 0.5 −2.3 −0.5 −3.2 2.2May 0.8 0.7 1.0 0.4 1.2 −0.4 1.0 0.2 1.0 1.1Jun − 0.4 0.7 0.3 0.9 −0.2 −0.5 0.8 0.1 −3.7
Jul 0.6 0.5 −0.9 1.3 −1.7 0.7 −0.4 5.0 5.1 1.2Aug − 0.1 −0.2 0.1 1.0 0.3 −0.4 −0.2 2.0 −0.4Sep −0.2 −0.1 0.4 −0.4 0.1 1.4 −1.6 −1.6 −1.7 −1.0Oct 1.0 0.5 0.7 0.3 −0.4 0.4 −1.8 2.3 1.1 5.1Nov 0.7 0.5 1.4 − 0.1 0.1 −0.4 0.2 −2.8 2.7Dec −1.3 −0.8 −1.4 −1.3 0.6 −4.2 −1.1 0.2 9.0 −5.1
2011 Jan 2.9 1.6 1.5 2.1 4.8 4.3 2.5 −1.5 −1.0 13.4Feb − −0.3 −0.4 −0.5 −3.3 0.5 − − 2.0 2.6Mar −0.1 −0.1 0.7 −0.7 0.4 −1.1 −1.6 −0.3 −1.7 0.4Apr 1.5 1.8 3.2 0.3 −0.3 2.8 0.9 −2.0 1.7 −0.2May −1.5 −1.8 −3.2 −0.8 −0.3 −1.4 −1.3 −0.3 2.3 0.7Jun 0.2 0.4 0.3 − 0.4 0.4 1.2 −1.5 3.9 −1.4
Jul 0.9 0.9 2.1 0.2 1.0 0.1 −0.7 0.4 −1.9 0.5Aug −0.1 −0.2 0.3 −0.7 −0.5 −0.5 −1.2 −0.9 −0.5 0.9
Sep 1.0 1.0 0.7 1.4 0.8 0.3 1.8 2.5 0.1 0.9Oct 0.9 0.8 0.4 1.3 −0.5 0.3 0.9 3.5 0.1 1.8Nov −0.2 −0.6 −0.6 −1.1 −0.4 1.3 −1.6 −3.4 2.4 3.4Dec 0.6 0.7 1.1 0.2 1.2 2.4 −1.8 −1.2 1.1 0.1
2012 Jan 0.4 0.6 −0.5 1.7 0.7 −1.9 3.4 4.8 1.2 −0.8Feb −0.4 −0.5 0.6 −1.6 −0.4 −1.0 −1.2 −3.0 −0.4 −0.1
Revision to percentage change on previous month
2009 Apr −0.1 − − −0.1 −0.1 −0.1 −0.1 − − −
May − − − − − − 0.1 − −0.1 −0.1Jun − − − − − − − − − 0.1
Jul − − − −0.1 − − − −0.1 0.1 −
Aug − − − − − − − − −0.1 −
Sep − −0.1 − −0.1 − −0.1 − −0.1 − 0.1Oct − − − −0.1 − − − −0.1 −0.1 −0.1Nov −0.1 − − − 0.1 − 0.1 −0.1 0.1 −0.1Dec −0.1 −0.2 −0.1 −0.2 −0.4 −0.2 −0.1 −0.4 −0.2 −0.1
2010 Jan 0.2 0.2 0.1 0.3 0.6 0.1 0.2 0.3 0.3−
Feb 0.2 0.2 0.1 0.3 −0.3 0.4 0.2 0.7 0.2 0.2Mar −0.2 −0.2 −0.3 −0.2 − −0.3 −0.2 −0.3 −0.3 −
Apr − − − −0.1 − −0.1 −0.1 − 0.1 −0.1May − − −0.1 − − 0.1 0.1 − − −0.1Jun − − 0.1 − − − − − −0.1 0.1
Jul − − − −0.1 −0.1 − −0.1 −0.1 0.1 −
Aug − − − − − 0.1 −0.1 − −0.1 −
Sep − − − − − − −0.1 −0.2 −0.1 −
Oct − −0.1 − −0.1 − − − −0.1 −0.1 −0.1Nov − − − − 0.2 − − −0.1 0.1 −0.2Dec −0.2 −0.2 − −0.3 −0.5 −0.2 − −0.5 −0.4 −0.1
2011 Jan 0.3 0.3 0.1 0.4 0.6 0.2 0.4 0.6 0.8 −0.1Feb 0.3 0.4 0.2 0.5 −0.3 0.7 0.2 1.0 0.2 0.2Mar −0.3 −0.3 −0.2 −0.4 − −0.5 −0.2 −0.5 −0.8 0.1Apr − − − −0.1 − −0.1 −0.1 −0.1 0.2 0.1May − − −0.1 − − 0.1 − −0.1 − −0.1Jun − − − − − − 0.1 − −0.1 0.1
Jul− − − − −
0.1−0.1
− −0.2
−Aug − − − − 0.1 −0.2 −0.1 −0.1 −0.2 −
Sep − − − − − − −0.2 −0.1 −0.1 0.1Oct − − − − − − − −0.1 − −0.1Nov −0.1 − − −0.2 −0.2 −0.1 −0.1 −0.3 −0.4 0.2Dec −0.1 − − −0.1 0.1 0.1 −0.4 −0.4 0.2 −
2012 Jan −0.5 −0.5 −0.2 −0.7 −0.2 −0.3 −0.6 −1.4 −1.0 −
1 Predominantly automotive fuel also includes sale of fuel by super markets

8/2/2019 Ons Retail Report
http://slidepdf.com/reader/full/ons-retail-report 23/84
CPSA4RETAIL SALES INDEX: VALUE SEASONALLY ADJUSTEDPERCENTAGE CHANGE 3 MONTHS ON PREVIOUS 3 MONTHS
Predominantly non-food stores
All Allretailing retailing Te xtile,
including excluding Non- clothing and Household Predominantlyautomotive automotive Predominantly specialised footwear goods Other Non-store automotive
fuel1 fuel1 food stores Total stores stores stores stores retailing fuel1
AGG 21 AGG 21X AGG 1 AGG 12 47.19 AGG 5 AGG 7 AGG 13 AGG 14 47.30
Percentage chang e 3 months on previous 3 months
J5BX J45K IEAT IEAW IEAQ IEBI IEBL IEAZ J5B9 JO6A2009 Apr −0.1 0.1 2.3 −1.7 −0.5 0.2 −3.2 −3.1 −3.1 −1.6
May 0.7 0.7 2.2 −0.8 1.8 −0.1 −1.7 −2.2 2.1 0.2Jun 1.2 1.1 1.5 0.3 2.7 −0.7 0.4 −0.1 4.6 2.1
Jul 1.8 1.4 1.0 1.6 2.2 1.0 1.3 1.9 4.7 5.2Aug 2.0 1.4 0.7 1.7 1.0 1.3 1.6 2.5 4.2 7.5Sep 1.6 1.2 0.3 1.5 1.0 0.7 2.8 1.7 6.9 5.0Oct 1.4 0.9 0.1 1.1 1.8 − 3.0 0.2 6.4 6.2Nov 1.1 0.7 −0.1 1.0 2.4 −0.2 2.7 − 5.6 4.4Dec 1.1 0.9 0.3 1.4 2.1 − 2.7 1.2 2.4 2.8
2010 Jan −0.3 − 0.4 −0.3 1.2 0.2 −2.2 −0.3 0.6 −3.6Feb −0.6 −0.1 0.4 −0.5 1.2 2.1 −3.6 −1.4 −1.5 −4.8Mar
−1.0
−0.6
−0.2
−1.1 2.3 4.3
−6.7
−3.6
−0.5
−3.8
Apr 1.0 0.8 −0.4 1.9 3.2 4.5 0.2 − 1.9 2.4May 1.4 1.0 0.2 1.5 3.0 2.5 0.9 0.3 3.4 4.7Jun 1.6 1.3 1.1 1.5 2.6 0.4 2.0 1.7 1.3 4.2
Jul 1.0 1.0 1.4 0.6 1.8 −0.1 −0.9 1.8 1.7 0.9Aug 0.8 1.1 0.7 1.2 1.2 0.3 −1.0 3.8 3.3 −1.5Sep 0.7 1.0 −0.2 1.5 − 1.2 −1.2 4.8 6.2 −1.4Oct 0.5 0.6 −0.2 0.9 0.1 1.8 −2.4 3.1 4.7 0.2Nov 0.8 0.6 0.7 0.4 −0.1 2.1 −3.2 1.6 1.4 3.2Dec 0.9 0.5 1.2 −0.4 0.3 −0.3 −3.6 1.4 2.1 4.2
2011 Jan 1.3 0.8 1.4 −0.1 1.7 −0.9 −2.2 0.9 3.2 6.4Feb 1.4 0.6 0.6 − 2.4 −1.4 −0.6 0.2 7.3 7.5Mar 2.3 1.0 1.0 0.7 2.9 1.5 1.0 −1.5 4.1 12.9Apr 2.0 1.0 1.6 0.2 0.2 2.1 0.5 −1.8 3.2 10.2May 1.5 0.8 1.9 −0.3 −0.4 2.1 −0.6 −2.2 1.0 7.1Jun 0.5 0.5 1.3 −0.8 −1.2 1.4 −0.6 −2.9 4.4 0.7
Jul −0.1 −0.1 − −0.8 0.1 0.5 −0.6 −2.7 5.1 −0.1Aug 0.2 0.3 0.7 −0.6 0.5 0.5 −0.2 −2.5 4.8 −0.4
Sep 0.8 0.8 1.7−0.1 1.1
−0.2
−0.5
−0.3 0.8 0.8
Oct 1.5 1.5 2.4 0.7 0.7 0.1 0.3 1.7 −0.5 2.0Nov 1.7 1.4 1.7 1.4 0.4 0.7 0.8 3.1 −0.2 3.9Dec 1.6 1.1 0.9 1.2 − 2.3 −0.1 1.8 2.2 5.1
2012 Jan 1.3 0.8 0.4 0.8 0.5 2.8 −0.6 0.2 3.7 4.8Feb 1.0 0.7 0.7 0.5 1.0 2.0 −0.9 −0.4 3.5 2.6
Revision to percentage change 3 months on previous 3 months
2009 Apr 0.1 0.2 − 0.2 0.1 0.1 0.1 0.4 − 0.1May − − −0.1 0.1 0.1 − 0.1 0.3 −0.1 0.1Jun − − − −0.1 −0.1 −0.1 − − − −
Jul − −0.1 − − − − − −0.1 − −
Aug − − − − − − −0.1 − − 0.1Sep − − − −0.1 −0.1 0.1 −0.1 − − −
Oct −0.1 −0.1 − −0.1 −0.1 − −0.1 −0.2 −0.1 −
Nov − −0.1 − −0.1 0.1 − −0.1 −0.2 −0.1 −
Dec −0.1 −0.1 − −0.2 −0.1 −0.1 −0.1 −0.4 −0.1 −0.2
2010 Jan− −
0.1− −
0.1− −
0.1− −
0.3− −
0.3Feb 0.1 0.1 0.1 − −0.1 − 0.1 −0.1 0.1 −0.1Mar 0.2 0.2 0.1 0.3 0.2 0.1 0.2 0.5 0.2 −
Apr 0.2 0.1 − 0.3 − 0.1 0.2 0.6 0.2 0.3May − − −0.1 − − − 0.1 0.3 − 0.2Jun −0.1 −0.1 −0.1 −0.1 − −0.2 −0.1 − − 0.1
Jul −0.1 −0.1 −0.1 −0.1 − − − −0.2 −0.1 −
Aug − − − − − 0.1 − − − −
Sep − − − −0.1 −0.1 − −0.1 −0.1 −0.1 −
Oct −0.1 − − −0.1 − − −0.1 −0.1 −0.1 0.1Nov −0.1 − − −0.1 − − −0.2 −0.3 −0.1 −0.1Dec −0.1 −0.1 − −0.2 − −0.2 −0.2 −0.5 −0.3 −0.2
2011 Jan −0.1 − − −0.1 0.1 −0.1 −0.1 −0.5 − −0.3Feb 0.1 − 0.2 0.1 − − 0.2 − 0.2 −0.2Mar 0.3 0.3 0.2 0.4 0.1 0.3 0.4 0.6 0.4 0.1Apr 0.2 0.2 0.1 0.4 −0.1 0.2 0.3 0.8 0.1 0.3May − − −0.1 0.1 − −0.1 −0.1 0.3 −0.2 0.2Jun −0.1 −0.1 −0.2 −0.1 −0.1 −0.2 −0.2 −0.1 −0.3 0.1
Jul−0.1
−0.2
−0.1
−0.2
−0.1
−0.1
−0.1
−0.3
−0.1 0.1
Aug −0.1 −0.1 − −0.1 − − − −0.1 − 0.1Sep −0.1 −0.1 − −0.1 − −0.1 −0.1 −0.1 − 0.1Oct −0.1 − −0.1 −0.1 − −0.1 −0.1 −0.1 − 0.1Nov −0.1 −0.2 −0.1 −0.1 −0.1 −0.1 −0.2 −0.2 −0.2 0.1Dec −0.1 −0.2 − −0.2 −0.1 − −0.3 −0.5 −0.2 0.1
2012 Jan −0.3 −0.4 −0.1 −0.6 −0.2 − −0.6 −1.1 −0.6 0.2
1 Predominantly automotive fuel also includes sale of fuel by super markets
8/2/2019 Ons Retail Report
http://slidepdf.com/reader/full/ons-retail-report 24/84
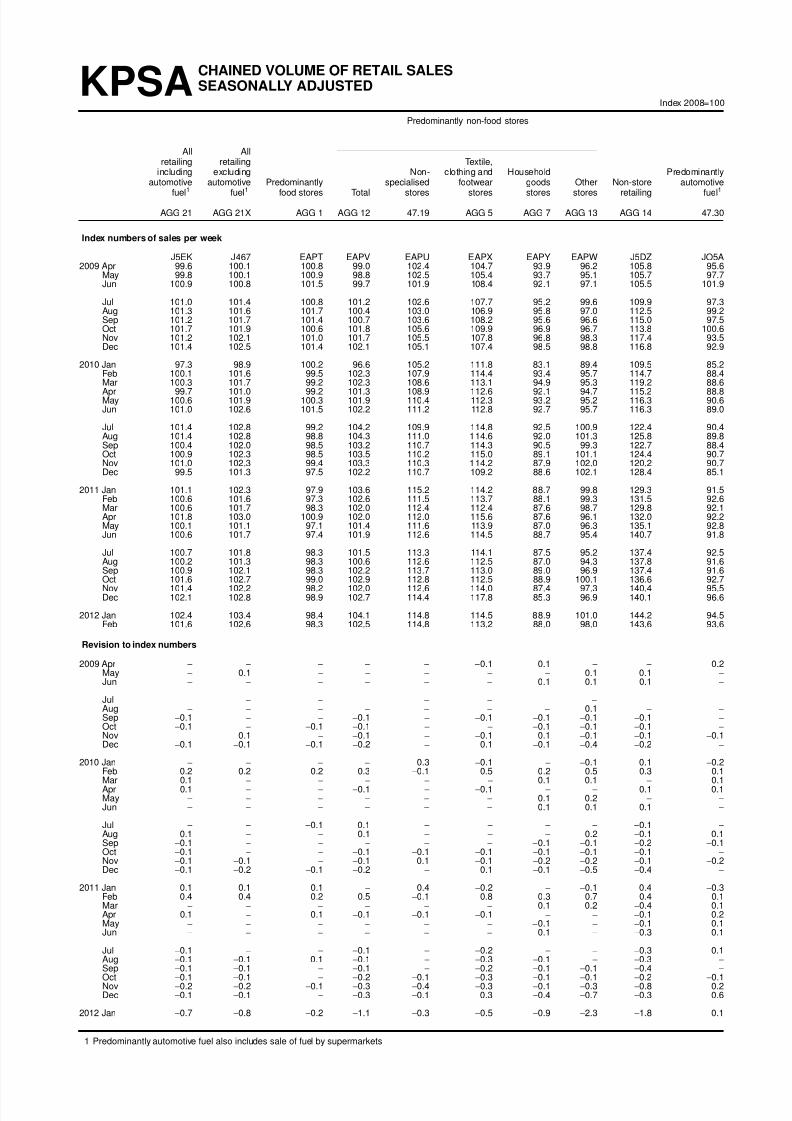
KPSACHAINED VOLUME OF RETAIL SALESSEASONALLY ADJUSTED
Index 2008=100
Predominantly non-food stores
All Allretailing retailing Te xtile,
including excluding Non- clothing and Household Predominantlyautomotive automotive Predominantly specialised footwear goods Other Non-store automotive
fuel1 fuel1 food stores Total stores stores stores stores retailing fuel1
AGG 21 AGG 21X AGG 1 AGG 12 47.19 AGG 5 AGG 7 AGG 13 AGG 14 47.30
Index numbers of sales per week
J5EK J467 EAPT EAPV EAPU EAPX EAPY EAPW J5DZ JO5A2009 Apr 99.6 100.1 100.8 99.0 102.4 104.7 93.9 96.2 105.8 95.6
May 99.8 100.1 100.9 98.8 102.5 105.4 93.7 95.1 105.7 97.7Jun 100.9 100.8 101.5 99.7 101.9 108.4 92.1 97.1 105.5 101.9
Jul 101.0 101.4 100.8 101.2 102.6 107.7 95.2 99.6 109.9 97.3Aug 101.3 101.6 101.7 100.4 103.0 106.9 95.8 97.0 112.5 99.2Sep 101.2 101.7 101.4 100.7 103.6 108.2 95.6 96.6 115.0 97.5Oct 101.7 101.9 100.6 101.8 105.6 109.9 96.9 96.7 113.8 100.6Nov 101.2 102.1 101.0 101.7 105.5 107.8 96.8 98.3 117.4 93.5Dec 101.4 102.5 101.4 102.1 105.1 107.4 98.5 98.8 116.8 92.9
2010 Jan 97.3 98.9 100.2 96.6 105.2 111.8 83.1 89.4 109.5 85.2Feb 100.1 101.6 99.5 102.3 107.9 114.4 93.4 95.7 114.7 88.4Mar 100.3 101.7 99.2 102.3 108.6 113.1 94.9 95.3 119.2 88.6Apr 99.7 101.0 99.2 101.3 108.9 112.6 92.1 94.7 115.2 88.8May 100.6 101.9 100.3 101.9 110.4 112.3 93.2 95.2 116.3 90.6Jun 101.0 102.6 101.5 102.2 111.2 112.8 92.7 95.7 116.3 89.0
Jul 101.4 102.8 99.2 104.2 109.9 114.8 92.5 100.9 122.4 90.4Aug 101.4 102.8 98.8 104.3 111.0 114.6 92.0 101.3 125.8 89.8Sep 100.4 102.0 98.5 103.2 110.7 114.3 90.5 99.3 122.7 88.4Oct 100.9 102.3 98.5 103.5 110.2 115.0 89.1 101.1 124.4 90.7Nov 101.0 102.3 99.4 103.3 110.3 114.2 87.9 102.0 120.2 90.7Dec 99.5 101.3 97.5 102.2 110.7 109.2 88.6 102.1 128.4 85.1
2011 Jan 101.1 102.3 97.9 103.6 115.2 114.2 88.7 99.8 129.3 91.5Feb 100.6 101.6 97.3 102.6 111.5 113.7 88.1 99.3 131.5 92.6Mar 100.6 101.7 98.3 102.0 112.4 112.4 87.6 98.7 129.8 92.1Apr 101.8 103.0 100.9 102.0 112.0 115.6 87.6 96.1 132.0 92.2May 100.1 101.1 97.1 101.4 111.6 113.9 87.0 96.3 135.1 92.8Jun 100.6 101.7 97.4 101.9 112.6 114.5 88.7 95.4 140.7 91.8
Jul 100.7 101.8 98.3 101.5 113.3 114.1 87.5 95.2 137.4 92.5Aug 100.2 101.3 98.3 100.6 112.6 112.5 87.0 94.3 137.8 91.6
Sep 100.9 102.1 98.3 102.2 113.7 113.0 89.0 96.9 137.4 91.6Oct 101.6 102.7 99.0 102.9 112.8 112.5 88.9 100.1 136.6 92.7Nov 101.4 102.2 98.2 102.0 112.6 114.0 87.4 97.3 140.4 95.5Dec 102.1 102.8 98.9 102.7 114.4 117.8 85.3 96.9 140.1 96.6
2012 Jan 102.4 103.4 98.4 104.1 114.8 114.5 88.9 101.0 144.2 94.5Feb 101.6 102.6 98.3 102.5 114.8 113.2 88.0 98.0 143.6 93.6
Revision to index numbers
2009 Apr − − − − − −0.1 0.1 − − 0.2May − 0.1 − − − − − 0.1 0.1 −
Jun − − − − − − 0.1 0.1 0.1 −
Jul − − − − − − − − − −
Aug − − − − − − − 0.1 − −
Sep −0.1 − − −0.1 − −0.1 −0.1 −0.1 −0.1 −
Oct −0.1 − −0.1 −0.1 − − −0.1 −0.1 −0.1 −
Nov − −0.1 − −0.1 − −0.1 −0.1 −0.1 −0.1 −0.1Dec −0.1 −0.1 −0.1 −0.2 − 0.1 −0.1 −0.4 −0.2 −
2010 Jan− − − −
0.3−0.1
− −0.1 0.1
−0.2
Feb 0.2 0.2 0.2 0.3 −0.1 0.5 0.2 0.5 0.3 0.1Mar 0.1 − − − − − 0.1 0.1 − 0.1Apr 0.1 − − −0.1 − −0.1 − − 0.1 0.1May − − − − − − 0.1 0.2 − −
Jun − − − − − − 0.1 0.1 0.1 −
Jul − − −0.1 0.1 − − − − −0.1 −
Aug 0.1 − − 0.1 − − − 0.2 −0.1 0.1Sep −0.1 − − − − − −0.1 −0.1 −0.2 −0.1Oct −0.1 − − −0.1 −0.1 −0.1 −0.1 −0.1 −0.1 −
Nov −0.1 −0.1 − −0.1 0.1 −0.1 −0.2 −0.2 −0.1 −0.2Dec −0.1 −0.2 −0.1 −0.2 − 0.1 −0.1 −0.5 −0.4 −
2011 Jan 0.1 0.1 0.1 − 0.4 −0.2 − −0.1 0.4 −0.3Feb 0.4 0.4 0.2 0.5 −0.1 0.8 0.3 0.7 0.4 0.1Mar − − − − − − 0.1 0.2 −0.4 0.1Apr 0.1 − 0.1 −0.1 −0.1 −0.1 − − −0.1 0.2May − − − − − − −0.1 − −0.1 0.1Jun − − − − − − 0.1 − −0.3 0.1
Jul−0.1
− − −0.1
− −0.2
− − −0.3 0.1
Aug −0.1 −0.1 0.1 −0.1 − −0.3 −0.1 − −0.3 −
Sep −0.1 −0.1 − −0.1 − −0.2 −0.1 −0.1 −0.4 −
Oct −0.1 −0.1 − −0.2 −0.1 −0.3 −0.1 −0.1 −0.2 −0.1Nov −0.2 −0.2 −0.1 −0.3 −0.4 −0.3 −0.1 −0.3 −0.8 0.2Dec −0.1 −0.1 − −0.3 −0.1 0.3 −0.4 −0.7 −0.3 0.6
2012 Jan −0.7 −0.8 −0.2 −1.1 −0.3 −0.5 −0.9 −2.3 −1.8 0.1
1 Predominantly automotive fuel also includes sale of fuel by super markets

8/2/2019 Ons Retail Report
http://slidepdf.com/reader/full/ons-retail-report 25/84
KPSA1RETAIL SALES INDEX: VOLUME SEASONALLY ADJUSTEDPERCENTAGE CHANGE ON SAME MONTH A YEAR EARLIER
Predominantly non-food stores
All Allretailing retailing Te xtile,
including excluding Non- clothing and Household Predominantlyautomotive automotive Predominantly specialised footwear goods Other Non-store automotive
fuel1 fuel1 food stores Total stores stores stores stores retailing fuel1
AGG 21 AGG 21X AGG 1 AGG 12 47.19 AGG 5 AGG 7 AGG 13 AGG 14 47.30
Percentage chang e on same month a year earlier
J5EB J45U IDOB IDOC IDOA IDOG IDOH IDOD J5DK JO4C2009 Apr −0.2 0.7 0.9 −0.1 1.9 11.1 −8.1 −4.2 7.2 −7.5
May −2.8 −2.9 −1.6 −5.0 2.3 −2.0 −10.5 −7.2 6.8 −1.4Jun 1.9 1.8 2.9 0.4 2.8 10.8 −7.9 −3.3 6.3 2.4
Jul 1.7 2.3 1.8 1.6 4.1 8.8 −4.5 −1.1 14.1 −2.7Aug 1.7 1.9 3.0 −0.2 3.9 4.2 −4.8 −2.6 14.9 0.2Sep 1.8 2.4 2.6 1.0 4.7 6.2 −1.8 −3.3 14.7 −3.1Oct 2.7 2.9 0.7 3.9 6.8 9.2 1.8 −0.9 13.0 0.9Nov 2.1 3.1 1.2 3.9 6.0 6.5 1.0 2.8 11.9 −5.4Dec 1.3 2.0 2.5 0.9 2.4 3.6 0.9 −2.2 9.7 −4.1
2010 Jan −3.1 −1.3 1.0 −4.2 4.6 5.3 −14.0 −10.4 7.9 −17.3Feb 1.7 3.2 −0.3 5.1 10.8 9.3 0.3 1.4 17.7 −10.5Mar 0.7 2.1
−1.0 3.6 7.7 6.2 1.9 0.1 15.2
−10.3
Apr − 0.9 −1.6 2.4 6.3 7.5 −1.9 −1.5 8.8 −7.1May 0.8 1.8 −0.6 3.2 7.7 6.6 −0.6 0.1 10.1 −7.2Jun 0.1 1.7 − 2.5 9.1 4.1 0.7 −1.4 10.2 −12.6
Jul 0.4 1.4 −1.5 2.9 7.1 6.6 −2.8 1.3 11.4 −7.1Aug 0.1 1.2 −2.8 3.8 7.7 7.2 −4.0 4.4 11.8 −9.5Sep −0.8 0.3 −2.9 2.4 6.8 5.6 −5.4 2.8 6.7 −9.3Oct −0.8 0.4 −2.1 1.7 4.4 4.7 −8.1 4.6 9.2 −9.8Nov −0.1 0.2 −1.5 1.5 4.5 5.9 −9.2 3.8 2.4 −3.0Dec −1.9 −1.2 −3.8 − 5.3 1.7 −10.0 3.2 10.0 −8.4
2011 Jan 3.8 3.4 −2.4 7.3 9.6 2.2 6.8 11.6 18.0 7.4Feb 0.5 − −2.1 0.2 3.4 −0.7 −5.7 3.8 14.6 4.8Mar 0.4 − −0.9 −0.3 3.5 −0.6 −7.7 3.5 8.9 4.0Apr 2.1 1.9 1.7 0.7 2.9 2.7 −4.9 1.5 14.6 3.8May −0.5 −0.8 −3.2 −0.5 1.1 1.4 −6.6 1.2 16.1 2.3Jun −0.4 −0.8 −4.0 −0.4 1.3 1.5 −4.3 −0.3 21.0 3.0
Jul −0.7 −1.0 −1.0 −2.5 3.1 −0.5 −5.4 −5.7 12.3 2.3Aug −1.1 −1.5 −0.5 −3.5 1.4 −1.8 −5.4 −6.9 9.6 2.1
Sep 0.5 0.1−0.2
−0.9 2.7
−1.2
−1.6
−2.5 12.0 3.6
Oct 0.7 0.5 0.5 −0.6 2.3 −2.2 −0.2 −1.1 9.8 2.3Nov 0.4 −0.2 −1.2 −1.2 2.2 −0.1 −0.7 −4.6 16.8 5.2Dec 2.6 1.4 1.4 0.5 3.3 7.9 −3.7 −5.1 9.1 13.4
2012 Jan 1.4 1.1 0.5 0.4 −0.4 0.3 0.2 1.3 11.5 3.3Feb 1.0 1.0 1.0 − 2.9 −0.4 −0.1 −1.3 9.2 1.1
Revision to percentage change on same month a year earlier
2009 Apr − − − − − − − − − 0.1May − − −0.1 − −0.1 − − − − −
Jun − − − − − − − − − −
Jul − − − − − − − − − 0.1Aug − − − − − − − − − −
Sep − − − −0.1 − − − − − −
Oct − − − − − − − −0.1 − −
Nov −0.1 − − −0.1 − − − − −0.1 −0.1Dec − − − −0.1 −0.1 − −0.1 − −0.2 0.1
2010 Jan− − − −
0.1−0.1 0.1
−0.1 0.1
−0.1
Feb 0.1 0.1 − 0.2 −0.1 0.2 0.1 0.3 0.2 −
Mar − − − − − −0.1 − 0.1 − 0.1Apr − − − − − − −0.1 − − −
May − − − − − − − 0.1 − −
Jun − − − − − − − − − −
Jul − − − − − − − − − −
Aug − − − − − − −0.1 0.1 −0.1 −
Sep − − − − − − −0.1 − − −
Oct −0.1 − − − −0.1 − − − −0.1 −
Nov − − − − 0.1 − −0.1 − − −0.1Dec − −0.1 − −0.1 − 0.1 − −0.3 −0.2 −
2011 Jan − − − − 0.1 −0.1 0.1 −0.1 0.2 −
Feb 0.2 0.2 0.1 0.1 − 0.2 0.1 0.2 − −
Mar − − 0.1 − − − − − −0.4 −
Apr − − − − − − − − −0.2 −
May − − − −0.1 − − −0.1 −0.1 −0.2 −
Jun − − − −0.1 − − − −0.1 −0.3 −0.1
Jul−0.1
− − − − − − −0.1
−0.1
−Aug − −0.1 0.1 −0.1 − −0.2 − −0.2 −0.1 −
Sep − −0.1 − − −0.1 −0.2 − −0.1 −0.2 −
Oct − − − −0.1 −0.1 −0.2 − −0.1 − −
Nov − −0.2 − −0.2 −0.4 −0.1 − −0.2 −0.5 0.4Dec 0.1 − − −0.1 −0.1 0.2 −0.3 −0.2 0.1 0.6
2012 Jan −0.6 −0.8 −0.4 −1.1 −0.7 −0.2 −1.1 −2.1 −1.8 0.5
1 Predominantly automotive fuel also includes sale of fuel by super markets

8/2/2019 Ons Retail Report
http://slidepdf.com/reader/full/ons-retail-report 26/84
KPSA2RETAIL SALES INDEX: VOLUME SEASONALLY ADJUSTEDPERCENTAGE CHANGE 3 MONTHS ON SAME PERIOD A YEAR EARLIER
Predominantly non-food stores
All Allretailing retailing Te xtile,
including excluding Non- clothing and Household Predominantlyautomotive automotive Predominantly specialised footwear goods Other Non-store automotive
fuel1 fuel1 food stores Total stores stores stores stores retailing fuel1
AGG 21 AGG 21X AGG 1 AGG 12 47.19 AGG 5 AGG 7 AGG 13 AGG 14 47.30
Percentage chang e 3 months on same period a year earlier
J5EH J45S IEFB IEFE IEEY IEFQ IEFT IEFH J5DS JO6E2009 Apr −1.3 −1.1 −0.6 −1.9 −0.2 8.3 −8.7 −6.0 3.1 −3.5
May −1.1 −0.9 −0.4 −2.0 2.1 6.3 −9.5 −5.4 6.3 −3.0Jun −0.2 − 0.9 −1.5 2.4 6.6 −8.8 −4.8 6.8 −1.9
Jul 0.3 0.4 1.1 −0.9 3.0 6.0 −7.7 −3.8 8.8 −0.4Aug 1.8 2.0 2.6 0.6 3.5 8.1 −5.9 −2.4 11.3 0.1Sep 1.7 2.2 2.5 0.8 4.2 6.3 −3.6 −2.4 14.6 −2.0Oct 2.0 2.4 2.1 1.5 5.1 6.5 −1.7 −2.3 14.2 −0.9Nov 2.2 2.8 1.5 2.8 5.7 7.2 0.1 −0.7 13.3 −2.6Dec 2.0 2.6 1.5 2.7 4.8 6.2 1.2 −0.3 11.4 −3.0
2010 Jan 0.2 1.3 1.6 0.2 4.2 5.0 −3.7 −3.3 9.9 −8.7Feb − 1.4 1.2 0.6 5.6 5.9 −3.9 −3.7 11.5 −10.3Mar
−0.2 1.4
−0.2 1.6 7.7 6.9
−3.6
−2.9 13.7
−12.6
Apr 0.8 2.1 −1.0 3.7 8.2 7.6 0.2 − 13.9 −9.4May 0.5 1.6 −1.0 3.1 7.3 6.7 − −0.4 11.7 −8.4Jun 0.3 1.5 −0.7 2.7 7.8 5.9 −0.5 −1.0 9.8 −9.3
Jul 0.4 1.6 −0.6 2.8 8.0 5.6 −0.8 −0.1 10.6 −9.3Aug 0.2 1.5 −1.3 3.0 8.0 5.8 −1.9 1.2 11.1 −10.0Sep −0.1 0.9 −2.4 3.0 7.2 6.4 −4.1 2.8 9.7 −8.7Oct −0.5 0.6 −2.6 2.6 6.4 5.8 −5.8 3.8 9.0 −9.5Nov −0.6 0.3 −2.2 1.9 5.4 5.4 −7.4 3.7 6.1 −7.6Dec −1.0 −0.3 −2.6 1.0 4.8 3.9 −9.2 3.8 7.4 −7.2
2011 Jan 0.4 0.6 −2.7 2.6 6.4 3.1 −5.1 5.8 9.9 −2.1Feb 0.5 0.6 −2.9 2.2 6.0 1.1 −4.0 5.8 13.8 0.3Mar 1.4 1.0 −1.7 2.1 5.3 0.2 −3.0 6.0 13.3 5.3Apr 0.9 0.6 −0.5 0.2 3.3 0.4 −6.2 3.0 12.4 4.2May 0.6 0.3 −0.8 −0.1 2.6 1.0 −6.5 2.2 12.8 3.4Jun 0.3 − −2.0 −0.1 1.7 1.8 −5.2 0.7 17.6 3.0
Jul −0.5 −0.9 −2.8 −1.1 1.8 0.8 −5.4 −1.6 16.8 2.6Aug −0.7 −1.1 −2.0 −2.0 1.9 −0.2 −5.0 −4.1 14.7 2.5
Sep−0.4
−0.7
−0.5
−2.2 2.5
−1.2
−4.0
−4.8 11.3 2.7
Oct − −0.2 −0.1 −1.6 2.2 −1.7 −2.4 −3.4 10.6 2.7Nov 0.5 0.1 −0.3 −0.9 2.4 −1.2 −0.9 −2.7 12.8 3.7Dec 1.3 0.6 0.3 −0.4 2.7 2.2 −1.7 −3.7 11.6 7.3
2012 Jan 1.5 0.8 0.3 − 1.8 3.0 −1.6 −3.0 12.1 7.6Feb 1.7 1.2 1.0 0.3 2.0 2.9 −1.4 −2.0 9.9 6.3
Revision to percentage change 3 months on same period a year earlier
2009 Apr 0.1 − − − − − − 0.1 − 0.1May − − − − − − − 0.1 − −
Jun − − − − − −0.1 − − 0.1 −
Jul − − − − −0.1 − − − − −
Aug − − − − − − − − − −
Sep −0.1 − − − −0.1 − − − − −
Oct −0.1 − − − − − −0.1 − −0.1 −
Nov − − −0.1 − − − −0.1 − − −0.1Dec − − − −0.1 −0.1 − − − −0.1 −0.1
2010 Jan− − − −
0.1 0.1− −
0.1−0.1
− −
Feb − 0.1 0.1 0.1 − 0.1 − − − −
Mar − − − − 0.1 0.1 0.1 − 0.1 −
Apr − 0.1 − 0.1 − 0.1 − 0.1 0.1 −
May − − − − − − − − 0.1 −
Jun − − − − − − − − 0.1 −
Jul − − − − −0.1 − − − − −
Aug − − − − −0.1 − − − − −
Sep − − − − − − − − − −
Oct − − − − − − − − −0.1 −
Nov − − − − − − − − −0.1 −
Dec − −0.1 − − − − −0.1 −0.1 −0.1 −
2011 Jan − −0.1 − −0.1 0.1 − − −0.1 −0.1 −
Feb − 0.1 − − − 0.1 0.1 −0.1 − −
Mar − − 0.1 − − − 0.1 0.1 −0.1 −
Apr − 0.1 − 0.1 − 0.1 0.1 0.1 −0.2 −
May − − 0.1 −0.1 − − − − −0.3 −
Jun − − 0.1 −0.1 − − − −0.1 −0.2 −
Jul− −
0.1 0.1−0.1
− −0.1
−0.1
−0.1
−0.2
−Aug − −0.1 − − − −0.1 − −0.1 −0.1 −
Sep −0.1 − 0.1 − − −0.2 − −0.1 −0.2 −
Oct −0.1 − − − − −0.2 − −0.1 −0.1 −
Nov − −0.1 − −0.1 −0.2 −0.2 − −0.1 −0.2 0.1Dec − −0.1 − −0.1 −0.1 − −0.1 −0.1 −0.1 0.3
2012 Jan −0.2 −0.3 −0.1 −0.4 −0.4 − −0.5 −0.8 −0.7 0.5
1 Predominantly automotive fuel also includes sale of fuel by super markets
8/2/2019 Ons Retail Report
http://slidepdf.com/reader/full/ons-retail-report 27/84
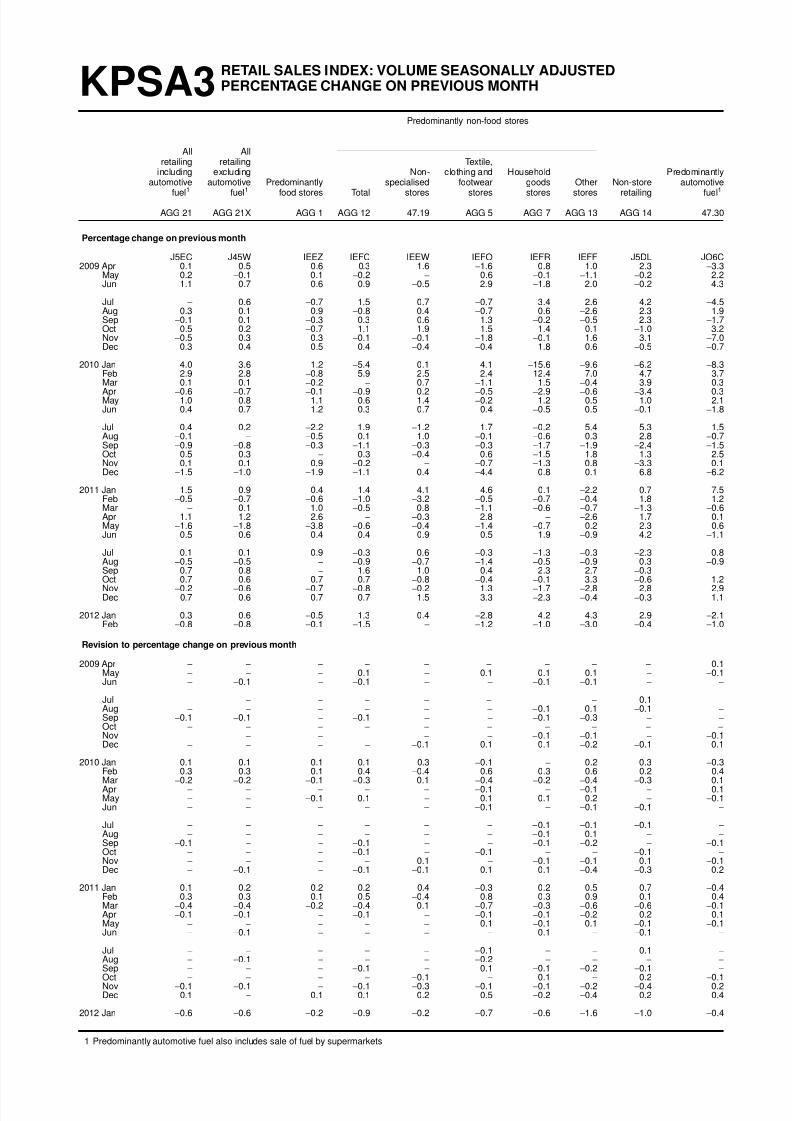
KPSA3RETAIL SALES INDEX: VOLUME SEASONALLY ADJUSTEDPERCENTAGE CHANGE ON PREVIOUS MONTH
Predominantly non-food stores
All Allretailing retailing Te xtile,
including excluding Non- clothing and Household Predominantlyautomotive automotive Predominantly specialised footwear goods Other Non-store automotive
fuel1 fuel1 food stores Total stores stores stores stores retailing fuel1
AGG 21 AGG 21X AGG 1 AGG 12 47.19 AGG 5 AGG 7 AGG 13 AGG 14 47.30
Percentage chang e on previous month
J5EC J45W IEEZ IEFC IEEW IEFO IEFR IEFF J5DL JO6C2009 Apr 0.1 0.5 0.6 0.3 1.6 −1.6 0.8 1.0 2.3 −3.3
May 0.2 −0.1 0.1 −0.2 − 0.6 −0.1 −1.1 −0.2 2.2Jun 1.1 0.7 0.6 0.9 −0.5 2.9 −1.8 2.0 −0.2 4.3
Jul − 0.6 −0.7 1.5 0.7 −0.7 3.4 2.6 4.2 −4.5Aug 0.3 0.1 0.9 −0.8 0.4 −0.7 0.6 −2.6 2.3 1.9Sep −0.1 0.1 −0.3 0.3 0.6 1.3 −0.2 −0.5 2.3 −1.7Oct 0.5 0.2 −0.7 1.1 1.9 1.5 1.4 0.1 −1.0 3.2Nov −0.5 0.3 0.3 −0.1 −0.1 −1.8 −0.1 1.6 3.1 −7.0Dec 0.3 0.4 0.5 0.4 −0.4 −0.4 1.8 0.6 −0.5 −0.7
2010 Jan −4.0 −3.6 −1.2 −5.4 0.1 4.1 −15.6 −9.6 −6.2 −8.3Feb 2.9 2.8 −0.8 5.9 2.5 2.4 12.4 7.0 4.7 3.7Mar 0.1 0.1
−0.2
−0.7
−1.1 1.5
−0.4 3.9 0.3
Apr −0.6 −0.7 −0.1 −0.9 0.2 −0.5 −2.9 −0.6 −3.4 0.3May 1.0 0.8 1.1 0.6 1.4 −0.2 1.2 0.5 1.0 2.1Jun 0.4 0.7 1.2 0.3 0.7 0.4 −0.5 0.5 −0.1 −1.8
Jul 0.4 0.2 −2.2 1.9 −1.2 1.7 −0.2 5.4 5.3 1.5Aug −0.1 − −0.5 0.1 1.0 −0.1 −0.6 0.3 2.8 −0.7Sep −0.9 −0.8 −0.3 −1.1 −0.3 −0.3 −1.7 −1.9 −2.4 −1.5Oct 0.5 0.3 − 0.3 −0.4 0.6 −1.5 1.8 1.3 2.5Nov 0.1 0.1 0.9 −0.2 − −0.7 −1.3 0.8 −3.3 0.1Dec −1.5 −1.0 −1.9 −1.1 0.4 −4.4 0.8 0.1 6.8 −6.2
2011 Jan 1.5 0.9 0.4 1.4 4.1 4.6 0.1 −2.2 0.7 7.5Feb −0.5 −0.7 −0.6 −1.0 −3.2 −0.5 −0.7 −0.4 1.8 1.2Mar − 0.1 1.0 −0.5 0.8 −1.1 −0.6 −0.7 −1.3 −0.6Apr 1.1 1.2 2.6 − −0.3 2.8 − −2.6 1.7 0.1May −1.6 −1.8 −3.8 −0.6 −0.4 −1.4 −0.7 0.2 2.3 0.6Jun 0.5 0.6 0.4 0.4 0.9 0.5 1.9 −0.9 4.2 −1.1
Jul 0.1 0.1 0.9 −0.3 0.6 −0.3 −1.3 −0.3 −2.3 0.8Aug −0.5 −0.5 − −0.9 −0.7 −1.4 −0.5 −0.9 0.3 −0.9
Sep 0.7 0.8−
1.6 1.0 0.4 2.3 2.7−0.3
−Oct 0.7 0.6 0.7 0.7 −0.8 −0.4 −0.1 3.3 −0.6 1.2Nov −0.2 −0.6 −0.7 −0.8 −0.2 1.3 −1.7 −2.8 2.8 2.9Dec 0.7 0.6 0.7 0.7 1.5 3.3 −2.3 −0.4 −0.3 1.1
2012 Jan 0.3 0.6 −0.5 1.3 0.4 −2.8 4.2 4.3 2.9 −2.1Feb −0.8 −0.8 −0.1 −1.5 − −1.2 −1.0 −3.0 −0.4 −1.0
Revision to percentage change on previous month
2009 Apr − − − − − − − − − 0.1May − − − 0.1 − 0.1 0.1 0.1 − −0.1Jun − −0.1 − −0.1 − − −0.1 −0.1 − −
Jul − − − − − − − − −0.1 −
Aug − − − − − − −0.1 0.1 −0.1 −
Sep −0.1 −0.1 − −0.1 − − −0.1 −0.3 − −
Oct − − − − − − − − − −
Nov − − − − − − −0.1 −0.1 − −0.1Dec − − − − −0.1 0.1 0.1 −0.2 −0.1 0.1
2010 Jan 0.1 0.1 0.1 0.1 0.3−0.1
−0.2 0.3
−0.3
Feb 0.3 0.3 0.1 0.4 −0.4 0.6 0.3 0.6 0.2 0.4Mar −0.2 −0.2 −0.1 −0.3 0.1 −0.4 −0.2 −0.4 −0.3 0.1Apr − − − − − −0.1 − −0.1 − 0.1May − − −0.1 0.1 − 0.1 0.1 0.2 − −0.1Jun − − − − − −0.1 − −0.1 −0.1 −
Jul − − − − − − −0.1 −0.1 −0.1 −
Aug − − − − − − −0.1 0.1 − −
Sep −0.1 − − −0.1 − − −0.1 −0.2 − −0.1Oct − − − −0.1 − −0.1 − − −0.1 −
Nov − − − − 0.1 − −0.1 −0.1 0.1 −0.1Dec − −0.1 − −0.1 −0.1 0.1 0.1 −0.4 −0.3 0.2
2011 Jan 0.1 0.2 0.2 0.2 0.4 −0.3 0.2 0.5 0.7 −0.4Feb 0.3 0.3 0.1 0.5 −0.4 0.8 0.3 0.9 0.1 0.4Mar −0.4 −0.4 −0.2 −0.4 0.1 −0.7 −0.3 −0.6 −0.6 −0.1Apr −0.1 −0.1 − −0.1 − −0.1 −0.1 −0.2 0.2 0.1May − − − − − 0.1 −0.1 0.1 −0.1 −0.1Jun − −0.1 − − − − 0.1 − −0.1 −
Jul− − − − − −
0.1− −
0.1−Aug − −0.1 − − − −0.2 − − − −
Sep − − − −0.1 − 0.1 −0.1 −0.2 −0.1 −
Oct − − − − −0.1 − 0.1 − 0.2 −0.1Nov −0.1 −0.1 − −0.1 −0.3 −0.1 −0.1 −0.2 −0.4 0.2Dec 0.1 − 0.1 0.1 0.2 0.5 −0.2 −0.4 0.2 0.4
2012 Jan −0.6 −0.6 −0.2 −0.9 −0.2 −0.7 −0.6 −1.6 −1.0 −0.4
1 Predominantly automotive fuel also includes sale of fuel by super markets
8/2/2019 Ons Retail Report
http://slidepdf.com/reader/full/ons-retail-report 28/84
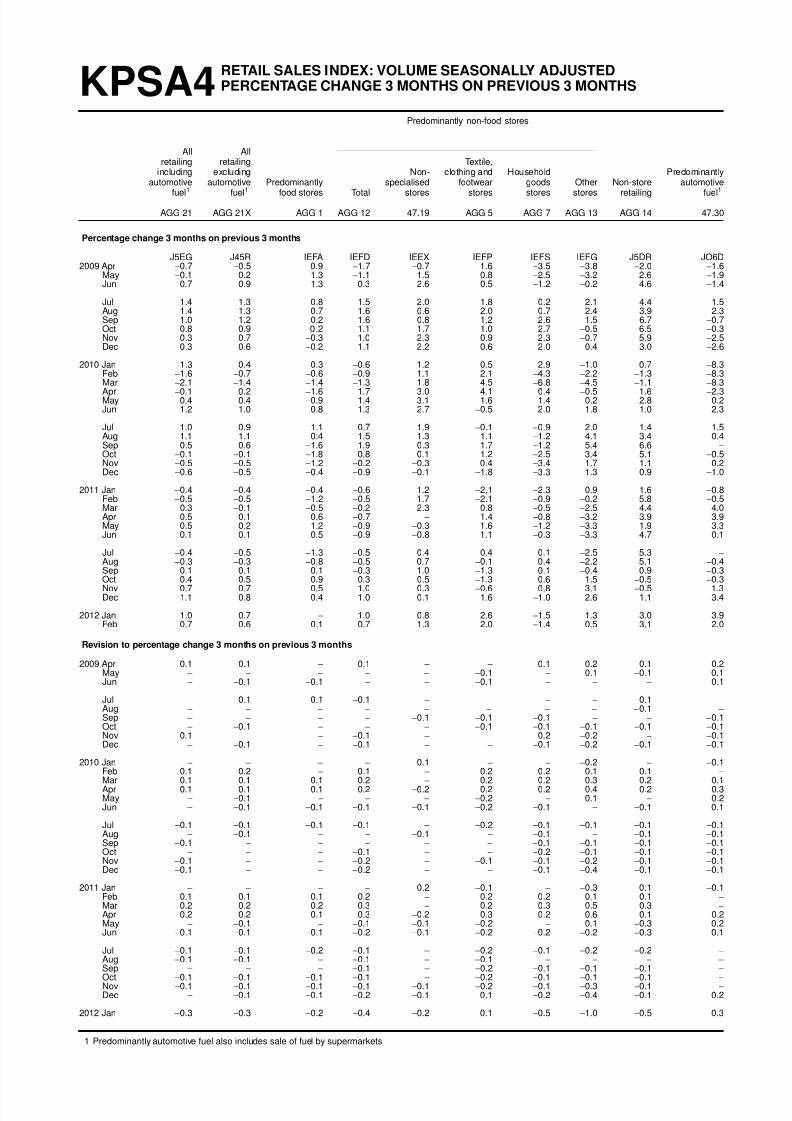
KPSA4RETAIL SALES INDEX: VOLUME SEASONALLY ADJUSTEDPERCENTAGE CHANGE 3 MONTHS ON PREVIOUS 3 MONTHS
Predominantly non-food stores
All Allretailing retailing Te xtile,
including excluding Non- clothing and Household Predominantlyautomotive automotive Predominantly specialised footwear goods Other Non-store automotive
fuel1 fuel1 food stores Total stores stores stores stores retailing fuel1
AGG 21 AGG 21X AGG 1 AGG 12 47.19 AGG 5 AGG 7 AGG 13 AGG 14 47.30
Percentage chang e 3 months on previous 3 months
J5EG J45R IEFA IEFD IEEX IEFP IEFS IEFG J5DR JO6D2009 Apr −0.7 −0.5 0.9 −1.7 −0.7 1.6 −3.5 −3.8 −2.0 −1.6
May −0.1 0.2 1.3 −1.1 1.5 0.8 −2.5 −3.2 2.6 −1.9Jun 0.7 0.9 1.3 0.3 2.6 0.5 −1.2 −0.2 4.6 −1.4
Jul 1.4 1.3 0.8 1.5 2.0 1.8 0.2 2.1 4.4 1.5Aug 1.4 1.3 0.7 1.6 0.6 2.0 0.7 2.4 3.9 2.3Sep 1.0 1.2 0.2 1.6 0.8 1.2 2.6 1.5 6.7 −0.7Oct 0.8 0.9 0.2 1.1 1.7 1.0 2.7 −0.5 6.5 −0.3Nov 0.3 0.7 −0.3 1.0 2.3 0.9 2.3 −0.7 5.9 −2.5Dec 0.3 0.6 −0.2 1.1 2.2 0.6 2.0 0.4 3.0 −2.6
2010 Jan −1.3 −0.4 −0.3 −0.6 1.2 0.5 −2.9 −1.0 0.7 −8.3Feb −1.6 −0.7 −0.6 −0.9 1.1 2.1 −4.3 −2.2 −1.3 −8.3Mar
−2.1
−1.4
−1.4
−1.3 1.8 4.5
−6.8
−4.5
−1.1
−8.3
Apr −0.1 0.2 −1.6 1.7 3.0 4.1 0.4 −0.5 1.6 −2.3May 0.4 0.4 −0.9 1.4 3.1 1.6 1.4 0.2 2.8 0.2Jun 1.2 1.0 0.8 1.3 2.7 −0.5 2.0 1.8 1.0 2.3
Jul 1.0 0.9 1.1 0.7 1.9 −0.1 −0.9 2.0 1.4 1.5Aug 1.1 1.1 0.4 1.5 1.3 1.1 −1.2 4.1 3.4 0.4Sep 0.5 0.6 −1.6 1.9 0.3 1.7 −1.2 5.4 6.6 −
Oct −0.1 −0.1 −1.8 0.8 0.1 1.2 −2.5 3.4 5.1 −0.5Nov −0.5 −0.5 −1.2 −0.2 −0.3 0.4 −3.4 1.7 1.1 0.2Dec −0.6 −0.5 −0.4 −0.9 −0.1 −1.8 −3.3 1.3 0.9 −1.0
2011 Jan −0.4 −0.4 −0.4 −0.6 1.2 −2.1 −2.3 0.9 1.6 −0.8Feb −0.5 −0.5 −1.2 −0.5 1.7 −2.1 −0.9 −0.2 5.8 −0.5Mar 0.3 −0.1 −0.5 −0.2 2.3 0.8 −0.5 −2.5 4.4 4.0Apr 0.5 0.1 0.6 −0.7 − 1.4 −0.8 −3.2 3.9 3.9May 0.5 0.2 1.2 −0.9 −0.3 1.6 −1.2 −3.3 1.9 3.3Jun 0.1 0.1 0.5 −0.9 −0.8 1.1 −0.3 −3.3 4.7 0.1
Jul −0.4 −0.5 −1.3 −0.5 0.4 0.4 0.1 −2.5 5.3 −
Aug −0.3 −0.3 −0.8 −0.5 0.7 −0.1 0.4 −2.2 5.1 −0.4
Sep−0.1
−0.1
−0.1
−0.3 1.0
−1.3 0.1
−0.4 0.9
−0.3
Oct 0.4 0.5 0.9 0.3 0.5 −1.3 0.6 1.5 −0.5 −0.3Nov 0.7 0.7 0.5 1.0 0.3 −0.6 0.8 3.1 −0.5 1.3Dec 1.1 0.8 0.4 1.0 0.1 1.6 −1.0 2.6 1.1 3.4
2012 Jan 1.0 0.7 − 1.0 0.8 2.6 −1.5 1.3 3.0 3.9Feb 0.7 0.6 0.1 0.7 1.3 2.0 −1.4 0.5 3.1 2.0
Revision to percentage change 3 months on previous 3 months
2009 Apr 0.1 0.1 − 0.1 − − 0.1 0.2 0.1 0.2May − − − − − −0.1 − 0.1 −0.1 0.1Jun − −0.1 −0.1 − − −0.1 − − − 0.1
Jul − −0.1 −0.1 −0.1 − − − − −0.1 −
Aug − − − − − − − − −0.1 −
Sep − − − − −0.1 −0.1 −0.1 − − −0.1Oct − −0.1 − − − −0.1 −0.1 −0.1 −0.1 −0.1Nov −0.1 − − −0.1 − − −0.2 −0.2 − −0.1Dec − −0.1 − −0.1 − − −0.1 −0.2 −0.1 −0.1
2010 Jan− − − −
0.1− − −
0.2− −
0.1Feb 0.1 0.2 − 0.1 − 0.2 0.2 0.1 0.1 −
Mar 0.1 0.1 0.1 0.2 − 0.2 0.2 0.3 0.2 0.1Apr 0.1 0.1 0.1 0.2 −0.2 0.2 0.2 0.4 0.2 0.3May − −0.1 − − − −0.2 − 0.1 − 0.2Jun − −0.1 −0.1 −0.1 −0.1 −0.2 −0.1 − −0.1 0.1
Jul −0.1 −0.1 −0.1 −0.1 − −0.2 −0.1 −0.1 −0.1 −0.1Aug − −0.1 − − −0.1 − −0.1 − −0.1 −0.1Sep −0.1 − − − − − −0.1 −0.1 −0.1 −0.1Oct − − − −0.1 − − −0.2 −0.1 −0.1 −0.1Nov −0.1 − − −0.2 − −0.1 −0.1 −0.2 −0.1 −0.1Dec −0.1 − − −0.2 − − −0.1 −0.4 −0.1 −0.1
2011 Jan − − − − 0.2 −0.1 − −0.3 0.1 −0.1Feb 0.1 0.1 0.1 0.2 − 0.2 0.2 0.1 0.1 −
Mar 0.2 0.2 0.2 0.3 − 0.2 0.3 0.5 0.3 −
Apr 0.2 0.2 0.1 0.3 −0.2 0.3 0.2 0.6 0.1 0.2May − −0.1 − −0.1 −0.1 −0.2 − 0.1 −0.3 0.2Jun −0.1 −0.1 −0.1 −0.2 −0.1 −0.2 −0.2 −0.2 −0.3 0.1
Jul−0.1
−0.1
−0.2
−0.1
− −0.2
−0.1
−0.2
−0.2
−Aug −0.1 −0.1 − −0.1 − −0.1 − − − −
Sep − − − −0.1 − −0.2 −0.1 −0.1 −0.1 −
Oct −0.1 −0.1 −0.1 −0.1 − −0.2 −0.1 −0.1 −0.1 −
Nov −0.1 −0.1 −0.1 −0.1 −0.1 −0.2 −0.1 −0.3 −0.1 −
Dec − −0.1 −0.1 −0.2 −0.1 0.1 −0.2 −0.4 −0.1 0.2
2012 Jan −0.3 −0.3 −0.2 −0.4 −0.2 0.1 −0.5 −1.0 −0.5 0.3
1 Predominantly automotive fuel also includes sale of fuel by super markets
8/2/2019 Ons Retail Report
http://slidepdf.com/reader/full/ons-retail-report 29/84
INTERNET INTERNET RETAIL SALES (Non-seasonally adjusted)
Av erage InternetAv erage weekly sales as a
weekly value for percentagevalue for Internet of total
all retail retailretailing sales sales
(£ million) (£ million) (%)
2007 Feb 4 706.6 144.3 3.1Mar 4 905.1 156.8 3.2Apr 5 078.5 159.9 3.1May 5 062.4 168.4 3.3Jun 5 103.8 173.2 3.4
Jul 5 102.9 181.9 3.6Aug 5 011.1 178.9 3.6Sep 5 017.2 196.1 3.9Oct 5 219.9 218.5 4.2Nov 5 760.4 276.8 4.8Dec 6 823.9 310.9 4.6
2008 Jan 4 827.3 232.1 4.8Feb 4 985.7 238.5 4.8Mar 5 071.4 246.5 4.9
Apr 5 121.8 253.6 5.0May 5 394.1 255.9 4.7Jun 5 271.4 266.9 5.1
Jul 5 293.9 267.4 5.1Aug 5 200.3 269.5 5.2Sep 5 169.4 289.8 5.6Oct 5 375.5 311.8 5.8Nov 5 916.8 385.6 6.5Dec 6 844.4 435.1 6.4
2009 Jan 4 925.2 323.7 6.6Feb 4 909.3 317.3 6.5Mar 5 103.6 336.8 6.6Apr 5 291.7 300.6 5.7May 5 299.3 306.9 5.8Jun 5 391.3 307.8 5.7
Jul 5 415.7 326.7 6.0Aug 5 303.6 312.4 5.9Sep 5 282.6 340.0 6.4Oct 5 546.7 406.3 7.3Nov 6 094.0 483.4 7.9Dec 7 048.9 502.3 7.1
2010 Jan 4 922.9 372.6 7.6Feb 5 083.9 364.7 7.2Mar 5 322.1 360.2 6.8Apr 5 360.0 367.5 6.9May 5 482.8 385.4 7.0Jun 5 520.0 376.3 6.8
Jul 5 562.7 395.8 7.1Aug 5 437.0 383.7 7.1Sep 5 411.6 415.9 7.7Oct 5 681.4 464.8 8.2Nov 6 256.4 593.4 9.5
Dec 7 186.2 652.0 9.1
2011 Jan 5 211.8 462.1 8.9Feb 5 232.2 432.6 8.3Mar 5 382.7 450.1 8.4Apr 5 723.7 456.3 8.0May 5 598.9 462.0 8.3Jun 5 640.2 475.0 8.4
Jul 5 714.3 463.5 8.1Aug 5 557.7 456.7 8.2Sep 5 599.4 499.5 8.9Oct 5 890.2 529.8 9.0Nov 6 411.1 710.9 11.1Dec 7 662.7 766.1 10.0
2012 Jan 5 351.8 568.4 10.6Feb 5 369.6 573.6 10.7

8/2/2019 Ons Retail Report
http://slidepdf.com/reader/full/ons-retail-report 30/84
1CHAINED VOLUME OF RETAIL SALESSEASONALLY ADJUSTED
Index 2008=100
Predominantly non-food storesAll All
retailing retailing Te xtile,including excluding Non- clothing and Household Predominantly
automotive automotive Predominantly specialised footwear goods Other Non store automotivefuel1 fuel1 food stores Total stores stores stores stores retailing fuel1
AGG 21 AGG 21X AGG 1 AGG 12 47.19 AGG 5 AGG 7 AGG 13 AGG 14 47.30
Average weekly salesin 2008 (£ millions) 6 060 5 379 2 437 2 682 454 731 654 843 260 681
Index numbers of sales per week
J5EK J467 EAPT EAPV EAPU EAPX EAPY EAPW J5DZ JO5A2004 91.6 91.3 95.9 88.4 90.7 81.4 92.4 90.6 82.5 94.42005 92.7 92.9 97.9 89.8 91.7 84.9 91.6 91.8 84.0 90.12006 95.9 95.4 99.3 93.0 96.0 91.0 95.4 91.2 87.4 100.02007 99.0 98.4 100.3 97.4 101.2 95.9 100.5 94.4 92.0 103.82008 100.0 100.0 100.0 100.0 100.0 100.0 100.0 100.0 100.0 100.0
2009 100.6 100.9 100.8 100.2 102.6 107.0 95.1 97.1 108.9 98.02010 100.3 101.8 99.3 102.3 109.6 113.2 90.9 97.8 119.8 88.72011 101.0 102.0 98.3 102.1 112.9 114.0 87.7 97.2 135.8 92.8
2009 Q1 99.5 99.4 99.8 99.0 99.7 105.8 94.2 96.4 101.0 100.1Q2 100.2 100.4 101.1 99.2 102.2 106.3 93.1 96.2 105.6 98.7Q3 101.2 101.6 101.3 100.8 103.1 107.6 95.5 97.7 112.7 98.0Q4 101.4 102.2 101.0 101.9 105.4 108.3 97.5 98.0 116.1 95.4
2010 Q1 99.3 100.8 99.6 100.6 107.3 113.1 90.8 93.6 114.8 87.5Q2 100.5 101.9 100.4 101.9 110.2 112.6 92.7 95.3 116.0 89.5Q3 101.0 102.5 98.8 103.8 110.5 114.5 91.6 100.4 123.6 89.4Q4 100.4 101.9 98.4 102.9 110.4 112.5 88.6 101.8 124.7 88.6
2011 Q1 100.7 101.8 97.9 102.7 113.0 113.4 88.1 99.2 130.2 92.1Q2 100.8 101.9 98.4 101.8 112.1 114.7 87.8 95.9 136.3 92.2Q3 100.7 101.8 98.3 101.5 113.2 113.2 87.9 95.6 137.6 91.9Q4 101.7 102.6 98.7 102.6 113.4 115.0 87.0 98.0 139.1 95.1
2009 Mar 99.5 99.6 100.2 98.8 100.9 106.5 93.1 95.3 103.4 98.8Apr 99.6 100.1 100.8 99.0 102.4 104.7 93.9 96.2 105.8 95.6May 99.8 100.1 100.9 98.8 102.5 105.4 93.7 95.1 105.7 97.7Jun 100.9 100.8 101.5 99.7 101.9 108.4 92.1 97.1 105.5 101.9
Jul 101.0 101.4 100.8 101.2 102.6 107.7 95.2 99.6 109.9 97.3Aug 101.3 101.6 101.7 100.4 103.0 106.9 95.8 97.0 112.5 99.2Sep 101.2 101.7 101.4 100.7 103.6 108.2 95.6 96.6 115.0 97.5Oct 101.7 101.9 100.6 101.8 105.6 109.9 96.9 96.7 113.8 100.6Nov 101.2 102.1 101.0 101.7 105.5 107.8 96.8 98.3 117.4 93.5Dec 101.4 102.5 101.4 102.1 105.1 107.4 98.5 98.8 116.8 92.9
2010 Jan 97.3 98.9 100.2 96.6 105.2 111.8 83.1 89.4 109.5 85.2Feb 100.1 101.6 99.5 102.3 107.9 114.4 93.4 95.7 114.7 88.4Mar 100.3 101.7 99.2 102.3 108.6 113.1 94.9 95.3 119.2 88.6Apr 99.7 101.0 99.2 101.3 108.9 112.6 92.1 94.7 115.2 88.8May 100.6 101.9 100.3 101.9 110.4 112.3 93.2 95.2 116.3 90.6Jun 101.0 102.6 101.5 102.2 111.2 112.8 92.7 95.7 116.3 89.0
Jul 101.4 102.8 99.2 104.2 109.9 114.8 92.5 100.9 122.4 90.4Aug 101.4 102.8 98.8 104.3 111.0 114.6 92.0 101.3 125.8 89.8Sep 100.4 102.0 98.5 103.2 110.7 114.3 90.5 99.3 122.7 88.4Oct 100.9 102.3 98.5 103.5 110.2 115.0 89.1 101.1 124.4 90.7Nov 101.0 102.3 99.4 103.3 110.3 114.2 87.9 102.0 120.2 90.7Dec 99.5 101.3 97.5 102.2 110.7 109.2 88.6 102.1 128.4 85.1
2011 Jan 101.1 102.3 97.9 103.6 115.2 114.2 88.7 99.8 129.3 91.5Feb 100.6 101.6 97.3 102.6 111.5 113.7 88.1 99.3 131.5 92.6Mar 100.6 101.7 98.3 102.0 112.4 112.4 87.6 98.7 129.8 92.1Apr 101.8 103.0 100.9 102.0 112.0 115.6 87.6 96.1 132.0 92.2May 100.1 101.1 97.1 101.4 111.6 113.9 87.0 96.3 135.1 92.8Jun 100.6 101.7 97.4 101.9 112.6 114.5 88.7 95.4 140.7 91.8
Jul 100.7 101.8 98.3 101.5 113.3 114.1 87.5 95.2 137.4 92.5Aug 100.2 101.3 98.3 100.6 112.6 112.5 87.0 94.3 137.8 91.6Sep 100.9 102.1 98.3 102.2 113.7 113.0 89.0 96.9 137.4 91.6Oct 101.6 102.7 99.0 102.9 112.8 112.5 88.9 100.1 136.6 92.7Nov 101.4 102.2 98.2 102.0 112.6 114.0 87.4 97.3 140.4 95.5Dec 102.1 102.8 98.9 102.7 114.4 117.8 85.3 96.9 140.1 96.6
2012 Jan 102.4 103.4 98.4 104.1 114.8 114.5 88.9 101.0 144.2 94.5Feb 101.6 102.6 98.3 102.5 114.8 113.2 88.0 98.0 143.6 93.6
The monthly periods consist of 4 weeks except for March, June, Septemberand December which are 5 weeks. Januar y 2008 is also a 5 week period.
The quarter ly indices are the weighted averages of the monthly indices forthe months within the quarter, the weights being the number of weeks ineach monthly period.
1 Predominantly automotive fuel also includes sale of fuel by super markets

8/2/2019 Ons Retail Report
http://slidepdf.com/reader/full/ons-retail-report 31/84
1CHAINED VOLUME OF RETAIL SALESSEASONALLY ADJUSTED
continued
Predominantly non-food storesAll All
retailing retailing Te xtile,including excluding Non- clothing and Household Predominantly
automotive automotive Predominantly specialised footwear goods Other Non-store automotivefuel1 fuel1 food stores Total stores stores stores stores retailing fuel1
AGG 21 AGG 21X AGG 1 AGG 12 47.19 AGG 5 AGG 7 AGG 13 AGG 14 47.30
Percentage chang e latest 3 months on previous 3 months
J5EG J45R IEFA IEFD IEEX IEFP IEFS IEFG J5DR JO6D2009 Apr −0.7 −0.5 0.9 −1.7 −0.7 1.6 −3.5 −3.8 −2.0 −1.6
May −0.1 0.2 1.3 −1.1 1.5 0.8 −2.5 −3.2 2.6 −1.9Jun 0.7 0.9 1.3 0.3 2.6 0.5 −1.2 −0.2 4.6 −1.4
Jul 1.4 1.3 0.8 1.5 2.0 1.8 0.2 2.1 4.4 1.5Aug 1.4 1.3 0.7 1.6 0.6 2.0 0.7 2.4 3.9 2.3Sep 1.0 1.2 0.2 1.6 0.8 1.2 2.6 1.5 6.7 −0.7Oct 0.8 0.9 0.2 1.1 1.7 1.0 2.7 −0.5 6.5 −0.3Nov 0.3 0.7 −0.3 1.0 2.3 0.9 2.3 −0.7 5.9 −2.5Dec 0.3 0.6 −0.2 1.1 2.2 0.6 2.0 0.4 3.0 −2.6
2010 Jan −1.3 −0.4 −0.3 −0.6 1.2 0.5 −2.9 −1.0 0.7 −8.3Feb −1.6 −0.7 −0.6 −0.9 1.1 2.1 −4.3 −2.2 −1.3 −8.3Mar −2.1 −1.4 −1.4 −1.3 1.8 4.5 −6.8 −4.5 −1.1 −8.3Apr −0.1 0.2 −1.6 1.7 3.0 4.1 0.4 −0.5 1.6 −2.3
May 0.4 0.4−0.9 1.4 3.1 1.6 1.4 0.2 2.8 0.2
Jun 1.2 1.0 0.8 1.3 2.7 −0.5 2.0 1.8 1.0 2.3
Jul 1.0 0.9 1.1 0.7 1.9 −0.1 −0.9 2.0 1.4 1.5Aug 1.1 1.1 0.4 1.5 1.3 1.1 −1.2 4.1 3.4 0.4Sep 0.5 0.6 −1.6 1.9 0.3 1.7 −1.2 5.4 6.6 −
Oct −0.1 −0.1 −1.8 0.8 0.1 1.2 −2.5 3.4 5.1 −0.5Nov −0.5 −0.5 −1.2 −0.2 −0.3 0.4 −3.4 1.7 1.1 0.2Dec −0.6 −0.5 −0.4 −0.9 −0.1 −1.8 −3.3 1.3 0.9 −1.0
2011 Jan −0.4 −0.4 −0.4 −0.6 1.2 −2.1 −2.3 0.9 1.6 −0.8Feb −0.5 −0.5 −1.2 −0.5 1.7 −2.1 −0.9 −0.2 5.8 −0.5Mar 0.3 −0.1 −0.5 −0.2 2.3 0.8 −0.5 −2.5 4.4 4.0Apr 0.5 0.1 0.6 −0.7 − 1.4 −0.8 −3.2 3.9 3.9May 0.5 0.2 1.2 −0.9 −0.3 1.6 −1.2 −3.3 1.9 3.3Jun 0.1 0.1 0.5 −0.9 −0.8 1.1 −0.3 −3.3 4.7 0.1
Jul −0.4 −0.5 −1.3 −0.5 0.4 0.4 0.1 −2.5 5.3 −
Aug −0.3 −0.3 −0.8 −0.5 0.7 −0.1 0.4 −2.2 5.1 −0.4Sep −0.1 −0.1 −0.1 −0.3 1.0 −1.3 0.1 −0.4 0.9 −0.3Oct 0.4 0.5 0.9 0.3 0.5 −1.3 0.6 1.5 −0.5 −0.3
Nov 0.7 0.7 0.5 1.0 0.3−0.6 0.8 3.1
−0.5 1.3Dec 1.1 0.8 0.4 1.0 0.1 1.6 −1.0 2.6 1.1 3.4
2012 Jan 1.0 0.7 − 1.0 0.8 2.6 −1.5 1.3 3.0 3.9Feb 0.7 0.6 0.1 0.7 1.3 2.0 −1.4 0.5 3.1 2.0
Percentage chang e latest 3 months on same 3 months a year ago
J5EH J45S IEFB IEFE IEEY IEFQ IEFT IEFH J5DS JO6E2009 Apr −1.3 −1.1 −0.6 −1.9 −0.2 8.3 −8.7 −6.0 3.1 −3.5
May −1.1 −0.9 −0.4 −2.0 2.1 6.3 −9.5 −5.4 6.3 −3.0Jun −0.2 − 0.9 −1.5 2.4 6.6 −8.8 −4.8 6.8 −1.9
Jul 0.3 0.4 1.1 −0.9 3.0 6.0 −7.7 −3.8 8.8 −0.4Aug 1.8 2.0 2.6 0.6 3.5 8.1 −5.9 −2.4 11.3 0.1Sep 1.7 2.2 2.5 0.8 4.2 6.3 −3.6 −2.4 14.6 −2.0Oct 2.0 2.4 2.1 1.5 5.1 6.5 −1.7 −2.3 14.2 −0.9Nov 2.2 2.8 1.5 2.8 5.7 7.2 0.1 −0.7 13.3 −2.6Dec 2.0 2.6 1.5 2.7 4.8 6.2 1.2 −0.3 11.4 −3.0
2010 Jan 0.2 1.3 1.6 0.2 4.2 5.0 −3.7 −3.3 9.9 −8.7
Feb−
1.4 1.2 0.6 5.6 5.9−3.9
−3.7 11.5
−10.3
Mar −0.2 1.4 −0.2 1.6 7.7 6.9 −3.6 −2.9 13.7 −12.6Apr 0.8 2.1 −1.0 3.7 8.2 7.6 0.2 − 13.9 −9.4May 0.5 1.6 −1.0 3.1 7.3 6.7 − −0.4 11.7 −8.4Jun 0.3 1.5 −0.7 2.7 7.8 5.9 −0.5 −1.0 9.8 −9.3
Jul 0.4 1.6 −0.6 2.8 8.0 5.6 −0.8 −0.1 10.6 −9.3Aug 0.2 1.5 −1.3 3.0 8.0 5.8 −1.9 1.2 11.1 −10.0Sep −0.1 0.9 −2.4 3.0 7.2 6.4 −4.1 2.8 9.7 −8.7Oct −0.5 0.6 −2.6 2.6 6.4 5.8 −5.8 3.8 9.0 −9.5Nov −0.6 0.3 −2.2 1.9 5.4 5.4 −7.4 3.7 6.1 −7.6Dec −1.0 −0.3 −2.6 1.0 4.8 3.9 −9.2 3.8 7.4 −7.2
2011 Jan 0.4 0.6 −2.7 2.6 6.4 3.1 −5.1 5.8 9.9 −2.1Feb 0.5 0.6 −2.9 2.2 6.0 1.1 −4.0 5.8 13.8 0.3Mar 1.4 1.0 −1.7 2.1 5.3 0.2 −3.0 6.0 13.3 5.3Apr 0.9 0.6 −0.5 0.2 3.3 0.4 −6.2 3.0 12.4 4.2May 0.6 0.3 −0.8 −0.1 2.6 1.0 −6.5 2.2 12.8 3.4Jun 0.3 − −2.0 −0.1 1.7 1.8 −5.2 0.7 17.6 3.0
Jul −0.5 −0.9 −2.8 −1.1 1.8 0.8 −5.4 −1.6 16.8 2.6
Aug−0.7
−1.1
−2.0
−2.0 1.9
−0.2
−5.0
−4.1 14.7 2.5Sep −0.4 −0.7 −0.5 −2.2 2.5 −1.2 −4.0 −4.8 11.3 2.7
Oct − −0.2 −0.1 −1.6 2.2 −1.7 −2.4 −3.4 10.6 2.7Nov 0.5 0.1 −0.3 −0.9 2.4 −1.2 −0.9 −2.7 12.8 3.7Dec 1.3 0.6 0.3 −0.4 2.7 2.2 −1.7 −3.7 11.6 7.3
2012 Jan 1.5 0.8 0.3 − 1.8 3.0 −1.6 −3.0 12.1 7.6Feb 1.7 1.2 1.0 0.3 2.0 2.9 −1.4 −2.0 9.9 6.3
1 Predominantly automotive fuel also includes sale of fuel by super markets
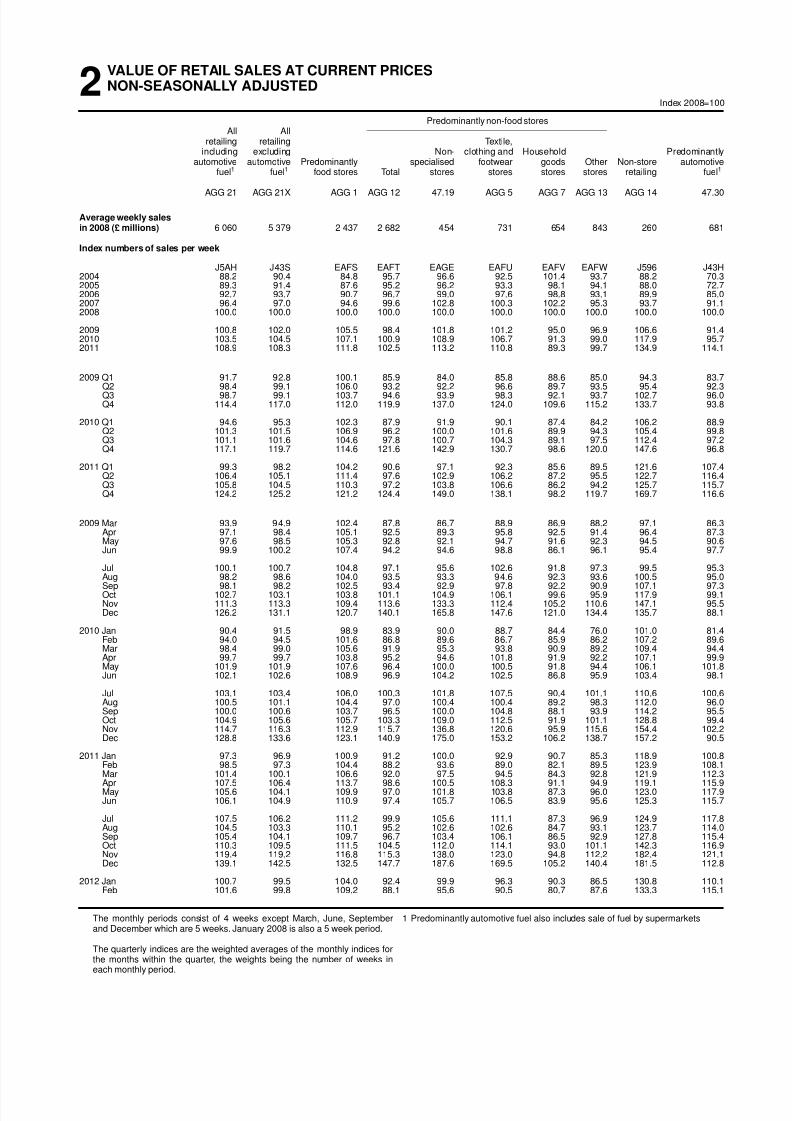
8/2/2019 Ons Retail Report
http://slidepdf.com/reader/full/ons-retail-report 32/84
2VALUE OF RETAIL SALES AT CURRENT PRICESNON-SEASONALLY ADJUSTED
Index 2008=100
Predominantly non-food storesAll All
retailing retailing Te xtile,including excluding Non- clothing and Household Predominantly
automotive automotive Predominantly specialised footwear goods Other Non-store automotivefuel1 fuel1 food stores Total stores stores stores stores retailing fuel1
AGG 21 AGG 21X AGG 1 AGG 12 47.19 AGG 5 AGG 7 AGG 13 AGG 14 47.30
Average weekly salesin 2008 (£ millions) 6 060 5 379 2 437 2 682 454 731 654 843 260 681
Index numbers of sales per week
J5AH J43S EAFS EAFT EAGE EAFU EAFV EAFW J596 J43H2004 88.2 90.4 84.8 95.7 96.6 92.5 101.4 93.7 88.2 70.32005 89.3 91.4 87.6 95.2 96.2 93.3 98.1 94.1 88.0 72.72006 92.7 93.7 90.7 96.7 99.0 97.6 98.8 93.1 89.9 85.02007 96.4 97.0 94.6 99.6 102.8 100.3 102.2 95.3 93.7 91.12008 100.0 100.0 100.0 100.0 100.0 100.0 100.0 100.0 100.0 100.0
2009 100.8 102.0 105.5 98.4 101.8 101.2 95.0 96.9 106.6 91.42010 103.5 104.5 107.1 100.9 108.9 106.7 91.3 99.0 117.9 95.72011 108.9 108.3 111.8 102.5 113.2 110.8 89.3 99.7 134.9 114.1
2009 Q1 91.7 92.8 100.1 85.9 84.0 85.8 88.6 85.0 94.3 83.7Q2 98.4 99.1 106.0 93.2 92.2 96.6 89.7 93.5 95.4 92.3Q3 98.7 99.1 103.7 94.6 93.9 98.3 92.1 93.7 102.7 96.0Q4 114.4 117.0 112.0 119.9 137.0 124.0 109.6 115.2 133.7 93.8
2010 Q1 94.6 95.3 102.3 87.9 91.9 90.1 87.4 84.2 106.2 88.9Q2 101.3 101.5 106.9 96.2 100.0 101.6 89.9 94.3 105.4 99.8Q3 101.1 101.6 104.6 97.8 100.7 104.3 89.1 97.5 112.4 97.2Q4 117.1 119.7 114.6 121.6 142.9 130.7 98.6 120.0 147.6 96.8
2011 Q1 99.3 98.2 104.2 90.6 97.1 92.3 85.6 89.5 121.6 107.4Q2 106.4 105.1 111.4 97.6 102.9 106.2 87.2 95.5 122.7 116.4Q3 105.8 104.5 110.3 97.2 103.8 106.6 86.2 94.2 125.7 115.7Q4 124.2 125.2 121.2 124.4 149.0 138.1 98.2 119.7 169.7 116.6
2009 Mar 93.9 94.9 102.4 87.8 86.7 88.9 86.9 88.2 97.1 86.3Apr 97.1 98.4 105.1 92.5 89.3 95.8 92.5 91.4 96.4 87.3May 97.6 98.5 105.3 92.8 92.1 94.7 91.6 92.3 94.5 90.6Jun 99.9 100.2 107.4 94.2 94.6 98.8 86.1 96.1 95.4 97.7
Jul 100.1 100.7 104.8 97.1 95.6 102.6 91.8 97.3 99.5 95.3Aug 98.2 98.6 104.0 93.5 93.3 94.6 92.3 93.6 100.5 95.0Sep 98.1 98.2 102.5 93.4 92.9 97.8 92.2 90.9 107.1 97.3Oct 102.7 103.1 103.8 101.1 104.9 106.1 99.6 95.9 117.9 99.1Nov 111.3 113.3 109.4 113.6 133.3 112.4 105.2 110.6 147.1 95.5Dec 126.2 131.1 120.7 140.1 165.8 147.6 121.0 134.4 135.7 88.1
2010 Jan 90.4 91.5 98.9 83.9 90.0 88.7 84.4 76.0 101.0 81.4Feb 94.0 94.5 101.6 86.8 89.6 86.7 85.9 86.2 107.2 89.6Mar 98.4 99.0 105.6 91.9 95.3 93.8 90.9 89.2 109.4 94.4Apr 99.7 99.7 103.8 95.2 94.6 101.8 91.9 92.2 107.1 99.9May 101.9 101.9 107.6 96.4 100.0 100.5 91.8 94.4 106.1 101.8Jun 102.1 102.6 108.9 96.9 104.2 102.5 86.8 95.9 103.4 98.1
Jul 103.1 103.4 106.0 100.3 101.8 107.5 90.4 101.1 110.6 100.6Aug 100.5 101.1 104.4 97.0 100.4 100.4 89.2 98.3 112.0 96.0Sep 100.0 100.6 103.7 96.5 100.0 104.8 88.1 93.9 114.2 95.5Oct 104.9 105.6 105.7 103.3 109.0 112.5 91.9 101.1 128.8 99.4Nov 114.7 116.3 112.9 115.7 136.8 120.6 95.9 115.6 154.4 102.2Dec 128.8 133.6 123.1 140.9 175.0 153.2 106.2 138.7 157.2 90.5
2011 Jan 97.3 96.9 100.9 91.2 100.0 92.9 90.7 85.3 118.9 100.8Feb 98.5 97.3 104.4 88.2 93.6 89.0 82.1 89.5 123.9 108.1Mar 101.4 100.1 106.6 92.0 97.5 94.5 84.3 92.8 121.9 112.3Apr 107.5 106.4 113.7 98.6 100.5 108.3 91.1 94.9 119.1 115.9May 105.6 104.1 109.9 97.0 101.8 103.8 87.3 96.0 123.0 117.9Jun 106.1 104.9 110.9 97.4 105.7 106.5 83.9 95.6 125.3 115.7
Jul 107.5 106.2 111.2 99.9 105.6 111.1 87.3 96.9 124.9 117.8Aug 104.5 103.3 110.1 95.2 102.6 102.6 84.7 93.1 123.7 114.0Sep 105.4 104.1 109.7 96.7 103.4 106.1 86.5 92.9 127.8 115.4Oct 110.3 109.5 111.5 104.5 112.0 114.1 93.0 101.1 142.3 116.9Nov 119.4 119.2 116.8 115.3 138.0 123.0 94.8 112.2 182.4 121.1Dec 139.1 142.5 132.5 147.7 187.6 169.5 105.2 140.4 181.5 112.8
2012 Jan 100.7 99.5 104.0 92.4 99.9 96.3 90.3 86.5 130.8 110.1Feb 101.6 99.8 109.2 88.1 95.6 90.5 80.7 87.6 133.3 115.1
The monthly periods consist of 4 weeks except March, June, Septemberand December which are 5 weeks. Januar y 2008 is also a 5 week period.
The quarter ly indices are the weighted averages of the monthly indices forthe months within the quarter, the weights being the number of weeks ineach monthly period.
1 Predominantly automotive fuel also includes sale of fuel by super markets
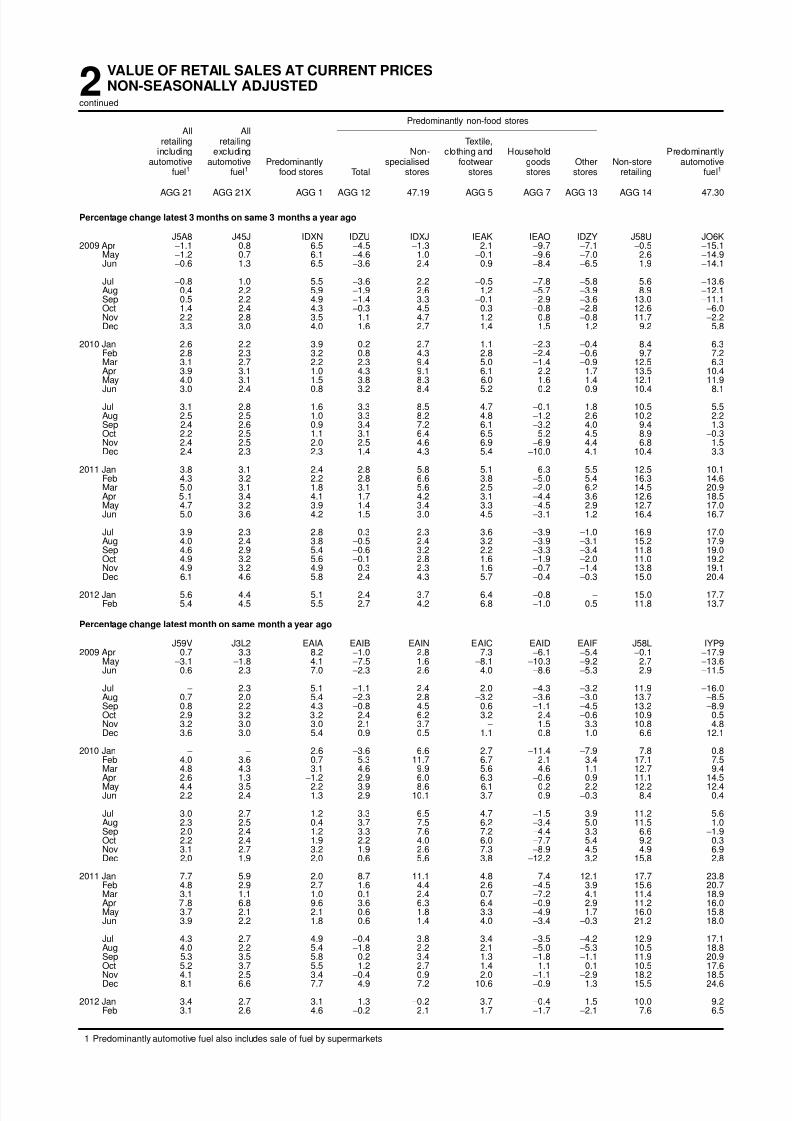
8/2/2019 Ons Retail Report
http://slidepdf.com/reader/full/ons-retail-report 33/84
2VALUE OF RETAIL SALES AT CURRENT PRICESNON-SEASONALLY ADJUSTED
continued
Predominantly non-food storesAll All
retailing retailing Te xtile,including excluding Non- clothing and Household Predominantly
automotive automotive Predominantly specialised footwear goods Other Non-store automotivefuel1 fuel1 food stores Total stores stores stores stores retailing fuel1
AGG 21 AGG 21X AGG 1 AGG 12 47.19 AGG 5 AGG 7 AGG 13 AGG 14 47.30
Percentage chang e latest 3 months on same 3 months a year ago
J5A8 J45J IDXN IDZU IDXJ IEAK IEAO IDZY J58U JO6K2009 Apr −1.1 0.8 6.5 −4.5 −1.3 2.1 −9.7 −7.1 −0.5 −15.1
May −1.2 0.7 6.1 −4.6 1.0 −0.1 −9.6 −7.0 2.6 −14.9Jun −0.6 1.3 6.5 −3.6 2.4 0.9 −8.4 −6.5 1.9 −14.1
Jul −0.8 1.0 5.5 −3.6 2.2 −0.5 −7.8 −5.8 5.6 −13.6Aug 0.4 2.2 5.9 −1.9 2.6 1.2 −5.7 −3.9 8.9 −12.1Sep 0.5 2.2 4.9 −1.4 3.3 −0.1 −2.9 −3.6 13.0 −11.1Oct 1.4 2.4 4.3 −0.3 4.5 0.3 −0.8 −2.8 12.6 −6.0Nov 2.2 2.8 3.5 1.1 4.7 1.2 0.8 −0.8 11.7 −2.2Dec 3.3 3.0 4.0 1.6 2.7 1.4 1.5 1.2 9.2 5.8
2010 Jan 2.6 2.2 3.9 0.2 2.7 1.1 −2.3 −0.4 8.4 6.3Feb 2.8 2.3 3.2 0.8 4.3 2.8 −2.4 −0.6 9.7 7.2Mar 3.1 2.7 2.2 2.3 9.4 5.0 −1.4 −0.9 12.5 6.3Apr 3.9 3.1 1.0 4.3 9.1 6.1 2.2 1.7 13.5 10.4
May 4.0 3.1 1.5 3.8 8.3 6.0 1.6 1.4 12.1 11.9Jun 3.0 2.4 0.8 3.2 8.4 5.2 0.2 0.9 10.4 8.1
Jul 3.1 2.8 1.6 3.3 8.5 4.7 −0.1 1.8 10.5 5.5Aug 2.5 2.5 1.0 3.3 8.2 4.8 −1.2 2.6 10.2 2.2Sep 2.4 2.6 0.9 3.4 7.2 6.1 −3.2 4.0 9.4 1.3Oct 2.2 2.5 1.1 3.1 6.4 6.5 −5.2 4.5 8.9 −0.3Nov 2.4 2.5 2.0 2.5 4.6 6.9 −6.9 4.4 6.8 1.5Dec 2.4 2.3 2.3 1.4 4.3 5.4 −10.0 4.1 10.4 3.3
2011 Jan 3.8 3.1 2.4 2.8 5.8 5.1 −6.3 5.5 12.5 10.1Feb 4.3 3.2 2.2 2.8 6.6 3.8 −5.0 5.4 16.3 14.6Mar 5.0 3.1 1.8 3.1 5.6 2.5 −2.0 6.2 14.5 20.9Apr 5.1 3.4 4.1 1.7 4.2 3.1 −4.4 3.6 12.6 18.5May 4.7 3.2 3.9 1.4 3.4 3.3 −4.5 2.9 12.7 17.0Jun 5.0 3.6 4.2 1.5 3.0 4.5 −3.1 1.2 16.4 16.7
Jul 3.9 2.3 2.8 0.3 2.3 3.6 −3.9 −1.0 16.9 17.0Aug 4.0 2.4 3.8 −0.5 2.4 3.2 −3.9 −3.1 15.2 17.9Sep 4.6 2.9 5.4 −0.6 3.2 2.2 −3.3 −3.4 11.8 19.0Oct 4.9 3.2 5.6 −0.1 2.8 1.6 −1.9 −2.0 11.0 19.2
Nov 4.9 3.2 4.9 0.3 2.3 1.6−0.7
−1.4 13.8 19.1Dec 6.1 4.6 5.8 2.4 4.3 5.7 −0.4 −0.3 15.0 20.4
2012 Jan 5.6 4.4 5.1 2.4 3.7 6.4 −0.8 − 15.0 17.7Feb 5.4 4.5 5.5 2.7 4.2 6.8 −1.0 0.5 11.8 13.7
Percentage chang e latest month on same month a year ago
J59V J3L2 EAIA EAIB EAIN EAIC EAID EAIF J58L IYP92009 Apr 0.7 3.3 8.2 −1.0 2.8 7.3 −6.1 −5.4 −0.1 −17.9
May −3.1 −1.8 4.1 −7.5 1.6 −8.1 −10.3 −9.2 2.7 −13.6Jun 0.6 2.3 7.0 −2.3 2.6 4.0 −8.6 −5.3 2.9 −11.5
Jul − 2.3 5.1 −1.1 2.4 2.0 −4.3 −3.2 11.9 −16.0Aug 0.7 2.0 5.4 −2.3 2.8 −3.2 −3.6 −3.0 13.7 −8.5Sep 0.8 2.2 4.3 −0.8 4.5 0.6 −1.1 −4.5 13.2 −8.9Oct 2.9 3.2 3.2 2.4 6.2 3.2 2.4 −0.6 10.9 0.5Nov 3.2 3.0 3.0 2.1 3.7 − 1.5 3.3 10.8 4.8Dec 3.6 3.0 5.4 0.9 0.5 1.1 0.8 1.0 6.6 12.1
2010 Jan − − 2.6 −3.6 6.6 2.7 −11.4 −7.9 7.8 0.8
Feb 4.0 3.6 0.7 5.3 11.7 6.7 2.1 3.4 17.1 7.5Mar 4.8 4.3 3.1 4.6 9.9 5.6 4.6 1.1 12.7 9.4Apr 2.6 1.3 −1.2 2.9 6.0 6.3 −0.6 0.9 11.1 14.5May 4.4 3.5 2.2 3.9 8.6 6.1 0.2 2.2 12.2 12.4Jun 2.2 2.4 1.3 2.9 10.1 3.7 0.9 −0.3 8.4 0.4
Jul 3.0 2.7 1.2 3.3 6.5 4.7 −1.5 3.9 11.2 5.6Aug 2.3 2.5 0.4 3.7 7.5 6.2 −3.4 5.0 11.5 1.0Sep 2.0 2.4 1.2 3.3 7.6 7.2 −4.4 3.3 6.6 −1.9Oct 2.2 2.4 1.9 2.2 4.0 6.0 −7.7 5.4 9.2 0.3Nov 3.1 2.7 3.2 1.9 2.6 7.3 −8.9 4.5 4.9 6.9Dec 2.0 1.9 2.0 0.6 5.6 3.8 −12.2 3.2 15.8 2.8
2011 Jan 7.7 5.9 2.0 8.7 11.1 4.8 7.4 12.1 17.7 23.8Feb 4.8 2.9 2.7 1.6 4.4 2.6 −4.5 3.9 15.6 20.7Mar 3.1 1.1 1.0 0.1 2.4 0.7 −7.2 4.1 11.4 18.9Apr 7.8 6.8 9.6 3.6 6.3 6.4 −0.9 2.9 11.2 16.0May 3.7 2.1 2.1 0.6 1.8 3.3 −4.9 1.7 16.0 15.8Jun 3.9 2.2 1.8 0.6 1.4 4.0 −3.4 −0.3 21.2 18.0
Jul 4.3 2.7 4.9 −0.4 3.8 3.4 −3.5 −4.2 12.9 17.1
Aug 4.0 2.2 5.4−1.8 2.2 2.1
−5.0
−5.3 10.5 18.8Sep 5.3 3.5 5.8 0.2 3.4 1.3 −1.8 −1.1 11.9 20.9
Oct 5.2 3.7 5.5 1.2 2.7 1.4 1.1 0.1 10.5 17.6Nov 4.1 2.5 3.4 −0.4 0.9 2.0 −1.1 −2.9 18.2 18.5Dec 8.1 6.6 7.7 4.9 7.2 10.6 −0.9 1.3 15.5 24.6
2012 Jan 3.4 2.7 3.1 1.3 −0.2 3.7 −0.4 1.5 10.0 9.2Feb 3.1 2.6 4.6 −0.2 2.1 1.7 −1.7 −2.1 7.6 6.5
1 Predominantly automotive fuel also includes sale of fuel by super markets
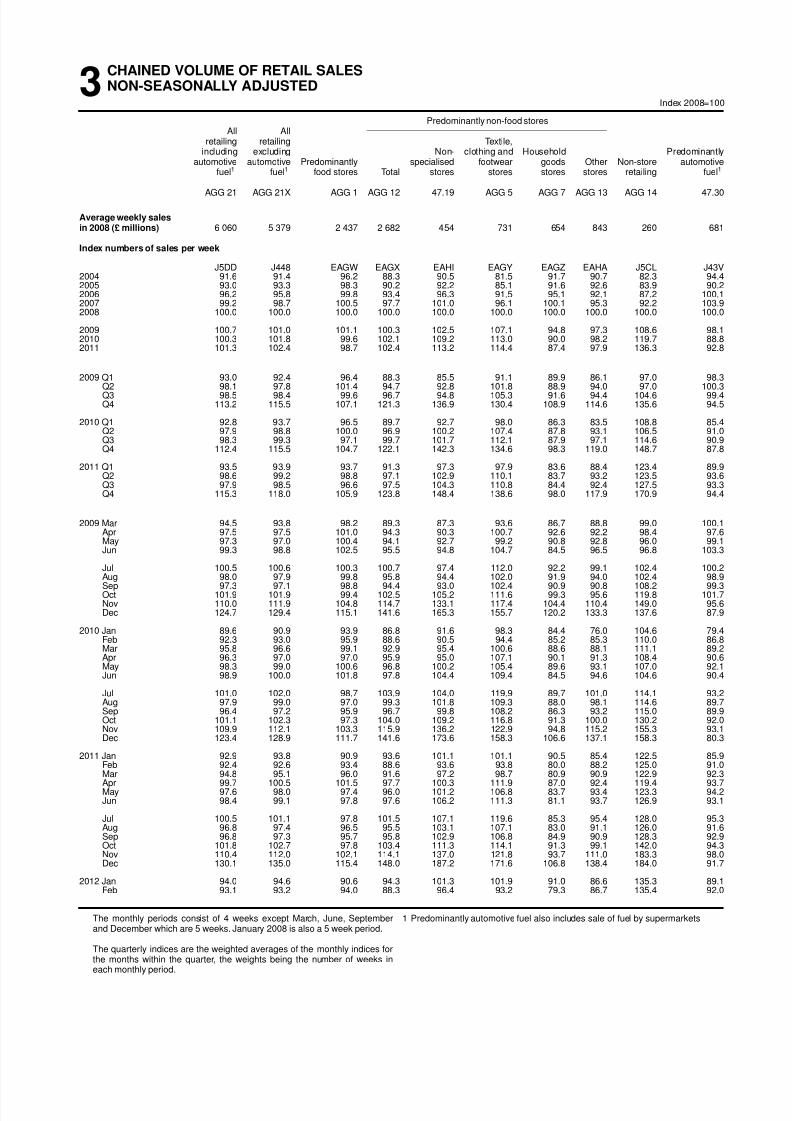
8/2/2019 Ons Retail Report
http://slidepdf.com/reader/full/ons-retail-report 34/84
3CHAINED VOLUME OF RETAIL SALESNON-SEASONALLY ADJUSTED
Index 2008=100
Predominantly non-food storesAll All
retailing retailing Te xtile,including excluding Non- clothing and Household Predominantly
automotive automotive Predominantly specialised footwear goods Other Non-store automotivefuel1 fuel1 food stores Total stores stores stores stores retailing fuel1
AGG 21 AGG 21X AGG 1 AGG 12 47.19 AGG 5 AGG 7 AGG 13 AGG 14 47.30
Average weekly salesin 2008 (£ millions) 6 060 5 379 2 437 2 682 454 731 654 843 260 681
Index numbers of sales per week
J5DD J448 EAGW EAGX EAHI EAGY EAGZ EAHA J5CL J43V2004 91.6 91.4 96.2 88.3 90.5 81.5 91.7 90.7 82.3 94.42005 93.0 93.3 98.3 90.2 92.2 85.1 91.6 92.6 83.9 90.22006 96.2 95.8 99.8 93.4 96.3 91.5 95.1 92.1 87.2 100.12007 99.2 98.7 100.5 97.7 101.0 96.1 100.1 95.3 92.2 103.92008 100.0 100.0 100.0 100.0 100.0 100.0 100.0 100.0 100.0 100.0
2009 100.7 101.0 101.1 100.3 102.5 107.1 94.8 97.3 108.6 98.12010 100.3 101.8 99.6 102.1 109.2 113.0 90.0 98.2 119.7 88.82011 101.3 102.4 98.7 102.4 113.2 114.4 87.4 97.9 136.3 92.8
2009 Q1 93.0 92.4 96.4 88.3 85.5 91.1 89.9 86.1 97.0 98.3Q2 98.1 97.8 101.4 94.7 92.8 101.8 88.9 94.0 97.0 100.3Q3 98.5 98.4 99.6 96.7 94.8 105.3 91.6 94.4 104.6 99.4Q4 113.2 115.5 107.1 121.3 136.9 130.4 108.9 114.6 135.6 94.5
2010 Q1 92.8 93.7 96.5 89.7 92.7 98.0 86.3 83.5 108.8 85.4Q2 97.9 98.8 100.0 96.9 100.2 107.4 87.8 93.1 106.5 91.0Q3 98.3 99.3 97.1 99.7 101.7 112.1 87.9 97.1 114.6 90.9Q4 112.4 115.5 104.7 122.1 142.3 134.6 98.3 119.0 148.7 87.8
2011 Q1 93.5 93.9 93.7 91.3 97.3 97.9 83.6 88.4 123.4 89.9Q2 98.6 99.2 98.8 97.1 102.9 110.1 83.7 93.2 123.5 93.6Q3 97.9 98.5 96.6 97.5 104.3 110.8 84.4 92.4 127.5 93.3Q4 115.3 118.0 105.9 123.8 148.4 138.6 98.0 117.9 170.9 94.4
2009 Mar 94.5 93.8 98.2 89.3 87.3 93.6 86.7 88.8 99.0 100.1Apr 97.5 97.5 101.0 94.3 90.3 100.7 92.6 92.2 98.4 97.6May 97.3 97.0 100.4 94.1 92.7 99.2 90.8 92.8 96.0 99.1Jun 99.3 98.8 102.5 95.5 94.8 104.7 84.5 96.5 96.8 103.3
Jul 100.5 100.6 100.3 100.7 97.4 112.0 92.2 99.1 102.4 100.2Aug 98.0 97.9 99.8 95.8 94.4 102.0 91.9 94.0 102.4 98.9Sep 97.3 97.1 98.8 94.4 93.0 102.4 90.9 90.8 108.2 99.3Oct 101.9 101.9 99.4 102.5 105.2 111.6 99.3 95.6 119.8 101.7Nov 110.0 111.9 104.8 114.7 133.1 117.4 104.4 110.4 149.0 95.6Dec 124.7 129.4 115.1 141.6 165.3 155.7 120.2 133.3 137.6 87.9
2010 Jan 89.6 90.9 93.9 86.8 91.6 98.3 84.4 76.0 104.6 79.4Feb 92.3 93.0 95.9 88.6 90.5 94.4 85.2 85.3 110.0 86.8Mar 95.8 96.6 99.1 92.9 95.4 100.6 88.6 88.1 111.1 89.2Apr 96.3 97.0 97.0 95.9 95.0 107.1 90.1 91.3 108.4 90.6May 98.3 99.0 100.6 96.8 100.2 105.4 89.6 93.1 107.0 92.1Jun 98.9 100.0 101.8 97.8 104.4 109.4 84.5 94.6 104.6 90.4
Jul 101.0 102.0 98.7 103.9 104.0 119.9 89.7 101.0 114.1 93.2Aug 97.9 99.0 97.0 99.3 101.8 109.3 88.0 98.1 114.6 89.7Sep 96.4 97.2 95.9 96.7 99.8 108.2 86.3 93.2 115.0 89.9Oct 101.1 102.3 97.3 104.0 109.2 116.8 91.3 100.0 130.2 92.0Nov 109.9 112.1 103.3 115.9 136.2 122.9 94.8 115.2 155.3 93.1Dec 123.4 128.9 111.7 141.6 173.6 158.3 106.6 137.1 158.3 80.3
2011 Jan 92.9 93.8 90.9 93.6 101.1 101.1 90.5 85.4 122.5 85.9Feb 92.4 92.6 93.4 88.6 93.6 93.8 80.0 88.2 125.0 91.0Mar 94.8 95.1 96.0 91.6 97.2 98.7 80.9 90.9 122.9 92.3Apr 99.7 100.5 101.5 97.7 100.3 111.9 87.0 92.4 119.4 93.7May 97.6 98.0 97.4 96.0 101.2 106.8 83.7 93.4 123.3 94.2Jun 98.4 99.1 97.8 97.6 106.2 111.3 81.1 93.7 126.9 93.1
Jul 100.5 101.1 97.8 101.5 107.1 119.6 85.3 95.4 128.0 95.3Aug 96.8 97.4 96.5 95.5 103.1 107.1 83.0 91.1 126.0 91.6Sep 96.8 97.3 95.7 95.8 102.9 106.8 84.9 90.9 128.3 92.9Oct 101.8 102.7 97.8 103.4 111.3 114.1 91.3 99.1 142.0 94.3Nov 110.4 112.0 102.1 114.1 137.0 121.8 93.7 111.0 183.3 98.0Dec 130.1 135.0 115.4 148.0 187.2 171.6 106.8 138.4 184.0 91.7
2012 Jan 94.0 94.6 90.6 94.3 101.3 101.9 91.0 86.6 135.3 89.1Feb 93.1 93.2 94.0 88.3 96.4 93.2 79.3 86.7 135.4 92.0
The monthly periods consist of 4 weeks except March, June, Septemberand December which are 5 weeks. Januar y 2008 is also a 5 week period.
The quarter ly indices are the weighted averages of the monthly indices forthe months within the quarter, the weights being the number of weeks ineach monthly period.
1 Predominantly automotive fuel also includes sale of fuel by super markets
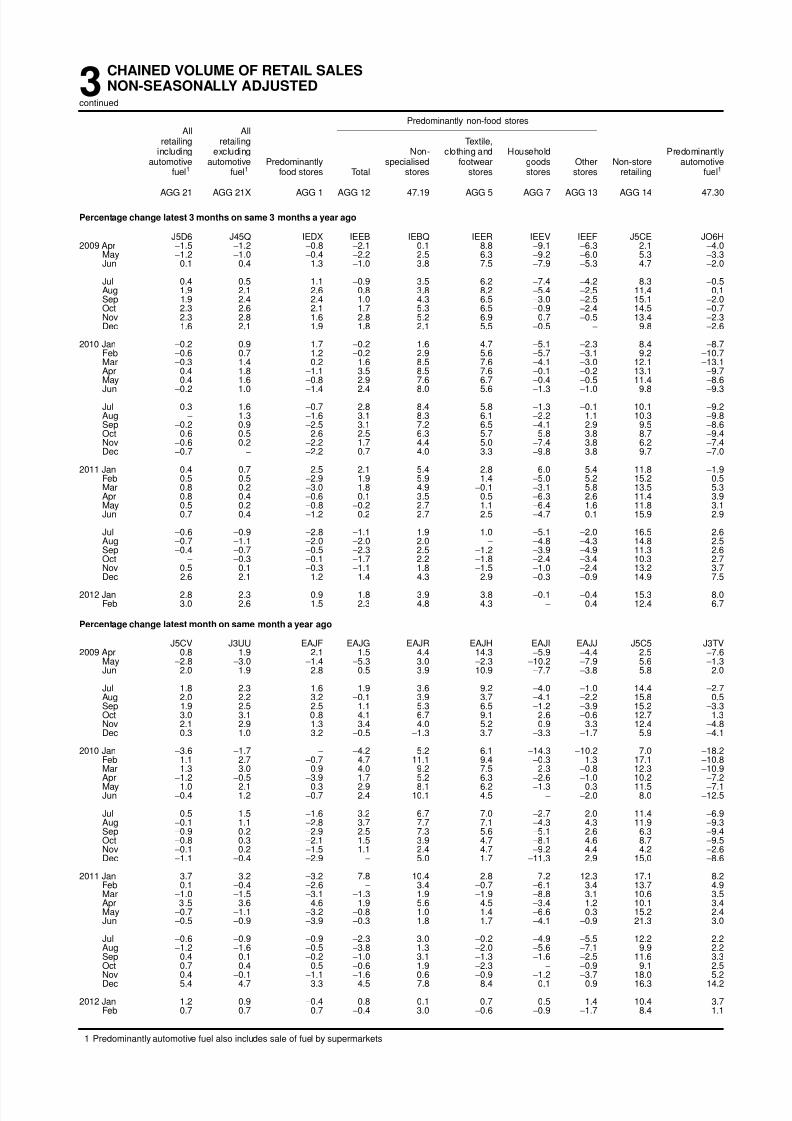
8/2/2019 Ons Retail Report
http://slidepdf.com/reader/full/ons-retail-report 35/84
3CHAINED VOLUME OF RETAIL SALESNON-SEASONALLY ADJUSTED
continued
Predominantly non-food storesAll All
retailing retailing Te xtile,including excluding Non- clothing and Household Predominantly
automotive automotive Predominantly specialised footwear goods Other Non-store automotivefuel1 fuel1 food stores Total stores stores stores stores retailing fuel1
AGG 21 AGG 21X AGG 1 AGG 12 47.19 AGG 5 AGG 7 AGG 13 AGG 14 47.30
Percentage chang e latest 3 months on same 3 months a year ago
J5D6 J45Q IEDX IEEB IEBQ IEER IEEV IEEF J5CE JO6H2009 Apr −1.5 −1.2 −0.8 −2.1 0.1 8.8 −9.1 −6.3 2.1 −4.0
May −1.2 −1.0 −0.4 −2.2 2.5 6.3 −9.2 −6.0 5.3 −3.3Jun 0.1 0.4 1.3 −1.0 3.8 7.5 −7.9 −5.3 4.7 −2.0
Jul 0.4 0.5 1.1 −0.9 3.5 6.2 −7.4 −4.2 8.3 −0.5Aug 1.9 2.1 2.6 0.8 3.8 8.2 −5.4 −2.5 11.4 0.1Sep 1.9 2.4 2.4 1.0 4.3 6.5 −3.0 −2.5 15.1 −2.0Oct 2.3 2.6 2.1 1.7 5.3 6.5 −0.9 −2.4 14.5 −0.7Nov 2.3 2.8 1.6 2.8 5.2 6.9 0.7 −0.5 13.4 −2.3Dec 1.6 2.1 1.9 1.8 2.1 5.5 −0.5 − 9.8 −2.6
2010 Jan −0.2 0.9 1.7 −0.2 1.6 4.7 −5.1 −2.3 8.4 −8.7Feb −0.6 0.7 1.2 −0.2 2.9 5.6 −5.7 −3.1 9.2 −10.7Mar −0.3 1.4 0.2 1.6 8.5 7.6 −4.1 −3.0 12.1 −13.1Apr 0.4 1.8 −1.1 3.5 8.5 7.6 −0.1 −0.2 13.1 −9.7
May 0.4 1.6−0.8 2.9 7.6 6.7
−0.4
−0.5 11.4
−8.6
Jun −0.2 1.0 −1.4 2.4 8.0 5.6 −1.3 −1.0 9.8 −9.3
Jul 0.3 1.6 −0.7 2.8 8.4 5.8 −1.3 −0.1 10.1 −9.2Aug − 1.3 −1.6 3.1 8.3 6.1 −2.2 1.1 10.3 −9.8Sep −0.2 0.9 −2.5 3.1 7.2 6.5 −4.1 2.9 9.5 −8.6Oct −0.6 0.5 −2.6 2.5 6.3 5.7 −5.8 3.8 8.7 −9.4Nov −0.6 0.2 −2.2 1.7 4.4 5.0 −7.4 3.8 6.2 −7.4Dec −0.7 − −2.2 0.7 4.0 3.3 −9.8 3.8 9.7 −7.0
2011 Jan 0.4 0.7 −2.5 2.1 5.4 2.8 −6.0 5.4 11.8 −1.9Feb 0.5 0.5 −2.9 1.9 5.9 1.4 −5.0 5.2 15.2 0.5Mar 0.8 0.2 −3.0 1.8 4.9 −0.1 −3.1 5.8 13.5 5.3Apr 0.8 0.4 −0.6 0.1 3.5 0.5 −6.3 2.6 11.4 3.9May 0.5 0.2 −0.8 −0.2 2.7 1.1 −6.4 1.6 11.8 3.1Jun 0.7 0.4 −1.2 0.2 2.7 2.5 −4.7 0.1 15.9 2.9
Jul −0.6 −0.9 −2.8 −1.1 1.9 1.0 −5.1 −2.0 16.5 2.6Aug −0.7 −1.1 −2.0 −2.0 2.0 − −4.8 −4.3 14.8 2.5Sep −0.4 −0.7 −0.5 −2.3 2.5 −1.2 −3.9 −4.9 11.3 2.6Oct − −0.3 −0.1 −1.7 2.2 −1.8 −2.4 −3.4 10.3 2.7
Nov 0.5 0.1−0.3
−1.1 1.8
−1.5
−1.0
−2.4 13.2 3.7Dec 2.6 2.1 1.2 1.4 4.3 2.9 −0.3 −0.9 14.9 7.5
2012 Jan 2.8 2.3 0.9 1.8 3.9 3.8 −0.1 −0.4 15.3 8.0Feb 3.0 2.6 1.5 2.3 4.8 4.3 − 0.4 12.4 6.7
Percentage chang e latest month on same month a year ago
J5CV J3UU EAJF EAJG EAJR EAJH EAJI EAJJ J5C5 J3TV2009 Apr 0.8 1.9 2.1 1.5 4.4 14.3 −5.9 −4.4 2.5 −7.6
May −2.8 −3.0 −1.4 −5.3 3.0 −2.3 −10.2 −7.9 5.6 −1.3Jun 2.0 1.9 2.8 0.5 3.9 10.9 −7.7 −3.8 5.8 2.0
Jul 1.8 2.3 1.6 1.9 3.6 9.2 −4.0 −1.0 14.4 −2.7Aug 2.0 2.2 3.2 −0.1 3.9 3.7 −4.1 −2.2 15.8 0.5Sep 1.9 2.5 2.5 1.1 5.3 6.5 −1.2 −3.9 15.2 −3.3Oct 3.0 3.1 0.8 4.1 6.7 9.1 2.6 −0.6 12.7 1.3Nov 2.1 2.9 1.3 3.4 4.0 5.2 0.9 3.3 12.4 −4.8Dec 0.3 1.0 3.2 −0.5 −1.3 3.7 −3.3 −1.7 5.9 −4.1
2010 Jan −3.6 −1.7 − −4.2 5.2 6.1 −14.3 −10.2 7.0 −18.2
Feb 1.1 2.7−0.7 4.7 11.1 9.4
−0.3 1.3 17.1
−10.8
Mar 1.3 3.0 0.9 4.0 9.2 7.5 2.3 −0.8 12.3 −10.9Apr −1.2 −0.5 −3.9 1.7 5.2 6.3 −2.6 −1.0 10.2 −7.2May 1.0 2.1 0.3 2.9 8.1 6.2 −1.3 0.3 11.5 −7.1Jun −0.4 1.2 −0.7 2.4 10.1 4.5 − −2.0 8.0 −12.5
Jul 0.5 1.5 −1.6 3.2 6.7 7.0 −2.7 2.0 11.4 −6.9Aug −0.1 1.1 −2.8 3.7 7.7 7.1 −4.3 4.3 11.9 −9.3Sep −0.9 0.2 −2.9 2.5 7.3 5.6 −5.1 2.6 6.3 −9.4Oct −0.8 0.3 −2.1 1.5 3.9 4.7 −8.1 4.6 8.7 −9.5Nov −0.1 0.2 −1.5 1.1 2.4 4.7 −9.2 4.4 4.2 −2.6Dec −1.1 −0.4 −2.9 − 5.0 1.7 −11.3 2.9 15.0 −8.6
2011 Jan 3.7 3.2 −3.2 7.8 10.4 2.8 7.2 12.3 17.1 8.2Feb 0.1 −0.4 −2.6 − 3.4 −0.7 −6.1 3.4 13.7 4.9Mar −1.0 −1.5 −3.1 −1.3 1.9 −1.9 −8.8 3.1 10.6 3.5Apr 3.5 3.6 4.6 1.9 5.6 4.5 −3.4 1.2 10.1 3.4May −0.7 −1.1 −3.2 −0.8 1.0 1.4 −6.6 0.3 15.2 2.4Jun −0.5 −0.9 −3.9 −0.3 1.8 1.7 −4.1 −0.9 21.3 3.0
Jul −0.6 −0.9 −0.9 −2.3 3.0 −0.2 −4.9 −5.5 12.2 2.2
Aug−1.2
−1.6
−0.5
−3.8 1.3
−2.0
−5.6
−7.1 9.9 2.2Sep 0.4 0.1 −0.2 −1.0 3.1 −1.3 −1.6 −2.5 11.6 3.3
Oct 0.7 0.4 0.5 −0.6 1.9 −2.3 − −0.9 9.1 2.5Nov 0.4 −0.1 −1.1 −1.6 0.6 −0.9 −1.2 −3.7 18.0 5.2Dec 5.4 4.7 3.3 4.5 7.8 8.4 0.1 0.9 16.3 14.2
2012 Jan 1.2 0.9 −0.4 0.8 0.1 0.7 0.5 1.4 10.4 3.7Feb 0.7 0.7 0.7 −0.4 3.0 −0.6 −0.9 −1.7 8.4 1.1
1 Predominantly automotive fuel also includes sale of fuel by super markets
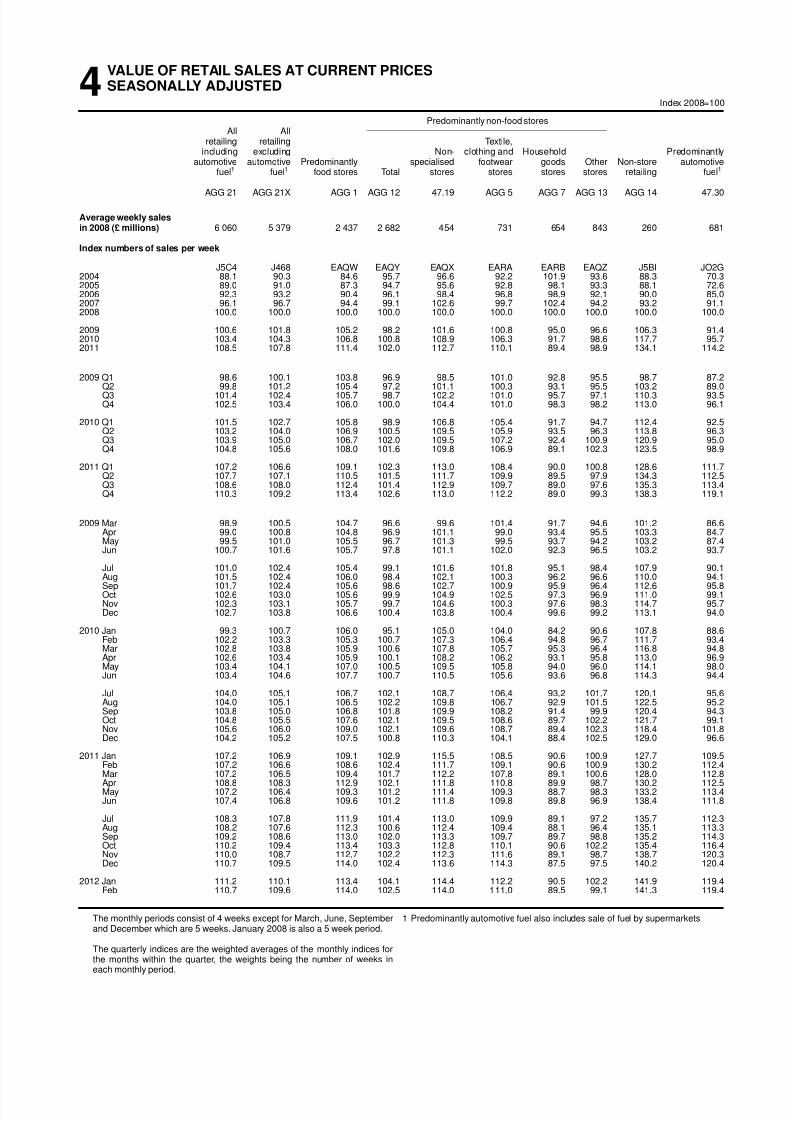
8/2/2019 Ons Retail Report
http://slidepdf.com/reader/full/ons-retail-report 36/84
4VALUE OF RETAIL SALES AT CURRENT PRICESSEASONALLY ADJUSTED
Index 2008=100
Predominantly non-food storesAll All
retailing retailing Te xtile,including excluding Non- clothing and Household Predominantly
automotive automotive Predominantly specialised footwear goods Other Non-store automotivefuel1 fuel1 food stores Total stores stores stores stores retailing fuel1
AGG 21 AGG 21X AGG 1 AGG 12 47.19 AGG 5 AGG 7 AGG 13 AGG 14 47.30
Average weekly salesin 2008 (£ millions) 6 060 5 379 2 437 2 682 454 731 654 843 260 681
Index numbers of sales per week
J5C4 J468 EAQW EAQY EAQX EARA EARB EAQZ J5BI JO2G2004 88.1 90.3 84.6 95.7 96.6 92.2 101.9 93.6 88.3 70.32005 89.0 91.0 87.3 94.7 95.6 92.8 98.1 93.3 88.1 72.62006 92.3 93.2 90.4 96.1 98.4 96.8 98.9 92.1 90.0 85.02007 96.1 96.7 94.4 99.1 102.6 99.7 102.4 94.2 93.2 91.12008 100.0 100.0 100.0 100.0 100.0 100.0 100.0 100.0 100.0 100.0
2009 100.6 101.8 105.2 98.2 101.6 100.8 95.0 96.6 106.3 91.42010 103.4 104.3 106.8 100.8 108.9 106.3 91.7 98.6 117.7 95.72011 108.5 107.8 111.4 102.0 112.7 110.1 89.4 98.9 134.1 114.2
2009 Q1 98.6 100.1 103.8 96.9 98.5 101.0 92.8 95.5 98.7 87.2Q2 99.8 101.2 105.4 97.2 101.1 100.3 93.1 95.5 103.2 89.0Q3 101.4 102.4 105.7 98.7 102.2 101.0 95.7 97.1 110.3 93.5Q4 102.5 103.4 106.0 100.0 104.4 101.0 98.3 98.2 113.0 96.1
2010 Q1 101.5 102.7 105.8 98.9 106.8 105.4 91.7 94.7 112.4 92.5Q2 103.2 104.0 106.9 100.5 109.5 105.9 93.5 96.3 113.8 96.3Q3 103.9 105.0 106.7 102.0 109.5 107.2 92.4 100.9 120.9 95.0Q4 104.8 105.6 108.0 101.6 109.8 106.9 89.1 102.3 123.5 98.9
2011 Q1 107.2 106.6 109.1 102.3 113.0 108.4 90.0 100.8 128.6 111.7Q2 107.7 107.1 110.5 101.5 111.7 109.9 89.5 97.9 134.3 112.5Q3 108.6 108.0 112.4 101.4 112.9 109.7 89.0 97.6 135.3 113.4Q4 110.3 109.2 113.4 102.6 113.0 112.2 89.0 99.3 138.3 119.1
2009 Mar 98.9 100.5 104.7 96.6 99.6 101.4 91.7 94.6 101.2 86.6Apr 99.0 100.8 104.8 96.9 101.1 99.0 93.4 95.5 103.3 84.7May 99.5 101.0 105.5 96.7 101.3 99.5 93.7 94.2 103.2 87.4Jun 100.7 101.6 105.7 97.8 101.1 102.0 92.3 96.5 103.2 93.7
Jul 101.0 102.4 105.4 99.1 101.6 101.8 95.1 98.4 107.9 90.1Aug 101.5 102.4 106.0 98.4 102.1 100.3 96.2 96.6 110.0 94.1Sep 101.7 102.4 105.6 98.6 102.7 100.9 95.9 96.4 112.6 95.8Oct 102.6 103.0 105.6 99.9 104.9 102.5 97.3 96.9 111.0 99.1Nov 102.3 103.1 105.7 99.7 104.6 100.3 97.6 98.3 114.7 95.7Dec 102.7 103.8 106.6 100.4 103.8 100.4 99.6 99.2 113.1 94.0
2010 Jan 99.3 100.7 106.0 95.1 105.0 104.0 84.2 90.6 107.8 88.6Feb 102.2 103.3 105.3 100.7 107.3 106.4 94.8 96.7 111.7 93.4Mar 102.8 103.8 105.9 100.6 107.8 105.7 95.3 96.4 116.8 94.8Apr 102.6 103.4 105.9 100.1 108.2 106.2 93.1 95.8 113.0 96.9May 103.4 104.1 107.0 100.5 109.5 105.8 94.0 96.0 114.1 98.0Jun 103.4 104.6 107.7 100.7 110.5 105.6 93.6 96.8 114.3 94.4
Jul 104.0 105.1 106.7 102.1 108.7 106.4 93.2 101.7 120.1 95.6Aug 104.0 105.1 106.5 102.2 109.8 106.7 92.9 101.5 122.5 95.2Sep 103.8 105.0 106.8 101.8 109.9 108.2 91.4 99.9 120.4 94.3Oct 104.8 105.5 107.6 102.1 109.5 108.6 89.7 102.2 121.7 99.1Nov 105.6 106.0 109.0 102.1 109.6 108.7 89.4 102.3 118.4 101.8Dec 104.2 105.2 107.5 100.8 110.3 104.1 88.4 102.5 129.0 96.6
2011 Jan 107.2 106.9 109.1 102.9 115.5 108.5 90.6 100.9 127.7 109.5Feb 107.2 106.6 108.6 102.4 111.7 109.1 90.6 100.9 130.2 112.4Mar 107.2 106.5 109.4 101.7 112.2 107.8 89.1 100.6 128.0 112.8Apr 108.8 108.3 112.9 102.1 111.8 110.8 89.9 98.7 130.2 112.5May 107.2 106.4 109.3 101.2 111.4 109.3 88.7 98.3 133.2 113.4Jun 107.4 106.8 109.6 101.2 111.8 109.8 89.8 96.9 138.4 111.8
Jul 108.3 107.8 111.9 101.4 113.0 109.9 89.1 97.2 135.7 112.3Aug 108.2 107.6 112.3 100.6 112.4 109.4 88.1 96.4 135.1 113.3Sep 109.2 108.6 113.0 102.0 113.3 109.7 89.7 98.8 135.2 114.3Oct 110.2 109.4 113.4 103.3 112.8 110.1 90.6 102.2 135.4 116.4Nov 110.0 108.7 112.7 102.2 112.3 111.6 89.1 98.7 138.7 120.3Dec 110.7 109.5 114.0 102.4 113.6 114.3 87.5 97.5 140.2 120.4
2012 Jan 111.2 110.1 113.4 104.1 114.4 112.2 90.5 102.2 141.9 119.4Feb 110.7 109.6 114.0 102.5 114.0 111.0 89.5 99.1 141.3 119.4
The monthly periods consist of 4 weeks except for March, June, Septemberand December which are 5 weeks. Januar y 2008 is also a 5 week period.
The quarter ly indices are the weighted averages of the monthly indices forthe months within the quarter, the weights being the number of weeks ineach monthly period.
1 Predominantly automotive fuel also includes sale of fuel by super markets

8/2/2019 Ons Retail Report
http://slidepdf.com/reader/full/ons-retail-report 37/84
4VALUE OF RETAIL SALES AT CURRENT PRICESSEASONALLY ADJUSTED
continued
Predominantly non-food storesAll All
retailing retailing Te xtile,including excluding Non- clothing and Household Predominantly
automotive automotive Predominantly specialised footwear goods Other Non-store automotivefuel1 fuel1 food stores Total stores stores stores stores retailing fuel1
AGG 21 AGG 21X AGG 1 AGG 12 47.19 AGG 5 AGG 7 AGG 13 AGG 14 47.30
Percentage chang e latest 3 months on previous 3 months
J5BX J45K IEAT IEAW IEAQ IEBI IEBL IEAZ J5B9 JO6A2009 Apr −0.1 0.1 2.3 −1.7 −0.5 0.2 −3.2 −3.1 −3.1 −1.6
May 0.7 0.7 2.2 −0.8 1.8 −0.1 −1.7 −2.2 2.1 0.2Jun 1.2 1.1 1.5 0.3 2.7 −0.7 0.4 −0.1 4.6 2.1
Jul 1.8 1.4 1.0 1.6 2.2 1.0 1.3 1.9 4.7 5.2Aug 2.0 1.4 0.7 1.7 1.0 1.3 1.6 2.5 4.2 7.5Sep 1.6 1.2 0.3 1.5 1.0 0.7 2.8 1.7 6.9 5.0Oct 1.4 0.9 0.1 1.1 1.8 − 3.0 0.2 6.4 6.2Nov 1.1 0.7 −0.1 1.0 2.4 −0.2 2.7 − 5.6 4.4Dec 1.1 0.9 0.3 1.4 2.1 − 2.7 1.2 2.4 2.8
2010 Jan −0.3 − 0.4 −0.3 1.2 0.2 −2.2 −0.3 0.6 −3.6Feb −0.6 −0.1 0.4 −0.5 1.2 2.1 −3.6 −1.4 −1.5 −4.8Mar −1.0 −0.6 −0.2 −1.1 2.3 4.3 −6.7 −3.6 −0.5 −3.8Apr 1.0 0.8 −0.4 1.9 3.2 4.5 0.2 − 1.9 2.4
May 1.4 1.0 0.2 1.5 3.0 2.5 0.9 0.3 3.4 4.7Jun 1.6 1.3 1.1 1.5 2.6 0.4 2.0 1.7 1.3 4.2
Jul 1.0 1.0 1.4 0.6 1.8 −0.1 −0.9 1.8 1.7 0.9Aug 0.8 1.1 0.7 1.2 1.2 0.3 −1.0 3.8 3.3 −1.5Sep 0.7 1.0 −0.2 1.5 − 1.2 −1.2 4.8 6.2 −1.4Oct 0.5 0.6 −0.2 0.9 0.1 1.8 −2.4 3.1 4.7 0.2Nov 0.8 0.6 0.7 0.4 −0.1 2.1 −3.2 1.6 1.4 3.2Dec 0.9 0.5 1.2 −0.4 0.3 −0.3 −3.6 1.4 2.1 4.2
2011 Jan 1.3 0.8 1.4 −0.1 1.7 −0.9 −2.2 0.9 3.2 6.4Feb 1.4 0.6 0.6 − 2.4 −1.4 −0.6 0.2 7.3 7.5Mar 2.3 1.0 1.0 0.7 2.9 1.5 1.0 −1.5 4.1 12.9Apr 2.0 1.0 1.6 0.2 0.2 2.1 0.5 −1.8 3.2 10.2May 1.5 0.8 1.9 −0.3 −0.4 2.1 −0.6 −2.2 1.0 7.1Jun 0.5 0.5 1.3 −0.8 −1.2 1.4 −0.6 −2.9 4.4 0.7
Jul −0.1 −0.1 − −0.8 0.1 0.5 −0.6 −2.7 5.1 −0.1Aug 0.2 0.3 0.7 −0.6 0.5 0.5 −0.2 −2.5 4.8 −0.4Sep 0.8 0.8 1.7 −0.1 1.1 −0.2 −0.5 −0.3 0.8 0.8Oct 1.5 1.5 2.4 0.7 0.7 0.1 0.3 1.7 −0.5 2.0
Nov 1.7 1.4 1.7 1.4 0.4 0.7 0.8 3.1−0.2 3.9Dec 1.6 1.1 0.9 1.2 − 2.3 −0.1 1.8 2.2 5.1
2012 Jan 1.3 0.8 0.4 0.8 0.5 2.8 −0.6 0.2 3.7 4.8Feb 1.0 0.7 0.7 0.5 1.0 2.0 −0.9 −0.4 3.5 2.6
Percentage chang e latest 3 months on same 3 months a year ago
J5BY J45L IEAU IEAX IEAR IEBJ IEBM IEBA J5BA JO6B2009 Apr −1.1 0.7 6.7 −4.4 −1.7 1.5 −9.8 −6.7 0.2 −15.1
May −1.2 0.6 6.1 −4.5 0.6 −0.2 −10.1 −6.4 3.3 −15.0Jun −0.8 0.9 6.1 −4.0 1.0 − −9.2 −6.0 3.8 −14.1
Jul −0.7 1.0 5.5 −3.5 1.8 −0.5 −8.1 −5.4 6.1 −13.4Aug 0.5 2.1 5.9 −1.9 2.4 1.3 −6.0 −3.8 8.9 −11.8Sep 0.6 2.1 4.9 −1.4 3.2 −0.2 −3.2 −3.5 12.5 −10.7Oct 1.4 2.4 4.3 −0.4 4.2 0.2 −1.3 −2.8 12.3 −5.9Nov 2.2 2.7 3.6 1.1 5.1 1.4 0.6 −0.9 11.5 −2.2Dec 3.5 3.3 3.7 2.3 5.0 1.7 2.6 1.0 9.4 5.6
2010 Jan 2.8 2.5 3.8 0.5 4.9 1.5 −1.3 −1.3 8.6 6.0
Feb 3.1 2.7 3.3 1.4 6.5 3.1−1.1
−1.2 10.7 7.0
Mar 2.9 2.6 1.9 2.1 8.4 4.3 −1.1 −0.9 13.9 6.1Apr 3.9 3.3 1.1 4.3 8.7 5.9 2.2 1.9 14.1 10.3May 3.9 3.0 1.2 3.8 7.8 5.8 1.5 1.4 12.1 11.8Jun 3.4 2.8 1.5 3.4 8.3 5.5 0.5 0.8 10.3 8.2
Jul 3.1 2.8 1.5 3.3 8.2 4.7 − 1.7 10.9 5.8Aug 2.7 2.7 1.2 3.3 8.1 4.7 −1.2 2.7 11.1 2.5Sep 2.5 2.6 1.0 3.4 7.2 6.1 −3.5 4.0 9.6 1.6Oct 2.2 2.5 1.2 3.1 6.4 6.5 −5.3 4.6 9.1 −0.2Nov 2.4 2.6 2.0 2.7 5.5 7.1 −6.8 4.3 6.6 1.3Dec 2.2 2.1 1.9 1.6 5.2 5.8 −9.4 4.2 9.3 3.0
2011 Jan 3.9 3.3 2.2 3.3 6.9 5.3 −5.2 5.9 11.9 10.0Feb 4.5 3.4 2.2 3.1 6.7 3.5 −3.9 6.0 16.1 14.4Mar 5.6 3.8 3.1 3.4 5.9 2.9 −1.9 6.5 14.3 20.8Apr 5.0 3.4 4.2 1.6 3.9 2.9 −4.9 4.0 13.4 18.5May 4.6 3.1 3.9 1.3 3.1 3.1 −5.3 3.4 13.5 17.0Jun 4.4 3.0 3.3 1.0 2.0 3.8 −4.3 1.7 17.9 16.8
Jul 3.9 2.3 2.8 0.2 2.2 3.5 −4.6 −0.6 17.2 17.2
Aug 4.0 2.4 3.9−0.5 2.4 3.3
−4.5
−2.9 15.2 18.3Sep 4.6 2.9 5.4 −0.6 3.1 2.3 −3.6 −3.3 11.9 19.4
Oct 4.9 3.2 5.6 − 2.8 1.8 −2.0 −1.9 11.4 19.3Nov 4.9 3.3 4.9 0.5 2.9 1.8 −0.5 −1.5 13.5 19.1Dec 5.3 3.5 5.0 1.0 2.9 5.0 −0.2 −3.0 12.0 20.4
2012 Jan 4.8 3.3 4.6 1.0 1.6 5.6 −0.5 −2.6 11.9 17.5Feb 4.5 3.4 5.1 1.0 1.5 5.3 −0.8 −2.1 9.4 13.6
1 Predominantly automotive fuel also includes sale of fuel by super markets
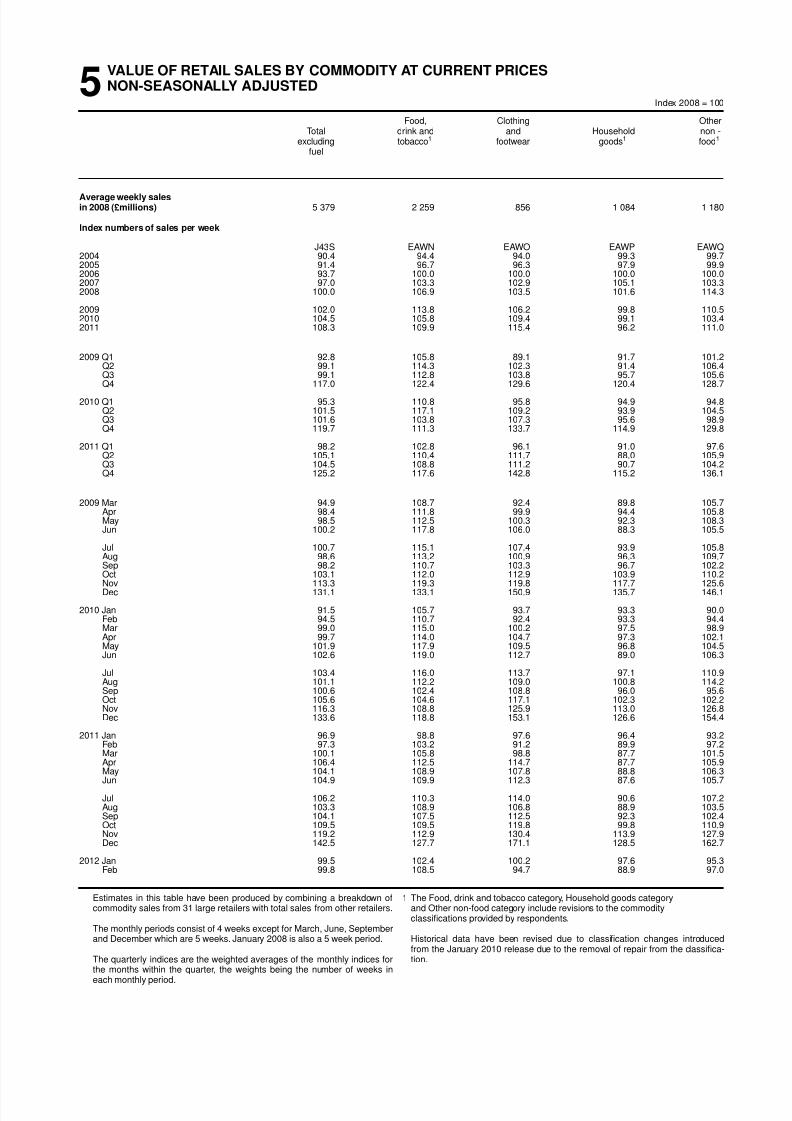
8/2/2019 Ons Retail Report
http://slidepdf.com/reader/full/ons-retail-report 38/84
5VALUE OF RETAIL SALES BY COMMODITY AT CURRENT PRICESNON-SEASONALLY ADJUSTED
Index 2008 = 100
Food, Clothing OtherTotal drink and and Household non -
excluding tobacco1 footwear goods1 food1
fuel
Average weekly salesin 2008 (£millions) 5 379 2 259 856 1 084 1 180
Index numbers of sales per week
J43S EAWN EAWO EAWP EAWQ2004 90.4 94.4 94.0 99.3 99.72005 91.4 96.7 96.3 97.9 99.92006 93.7 100.0 100.0 100.0 100.02007 97.0 103.3 102.9 105.1 103.32008 100.0 106.9 103.5 101.6 114.3
2009 102.0 113.8 106.2 99.8 110.52010 104.5 105.8 109.4 99.1 103.42011 108.3 109.9 115.4 96.2 111.0
2009 Q1 92.8 105.8 89.1 91.7 101.2Q2 99.1 114.3 102.3 91.4 106.4
Q3 99.1 112.8 103.8 95.7 105.6Q4 117.0 122.4 129.6 120.4 128.7
2010 Q1 95.3 110.8 95.8 94.9 94.8Q2 101.5 117.1 109.2 93.9 104.5Q3 101.6 103.8 107.3 95.6 98.9Q4 119.7 111.3 133.7 114.9 129.8
2011 Q1 98.2 102.8 96.1 91.0 97.6Q2 105.1 110.4 111.7 88.0 105.9Q3 104.5 108.8 111.2 90.7 104.2Q4 125.2 117.6 142.8 115.2 136.1
2009 Mar 94.9 108.7 92.4 89.8 105.7Apr 98.4 111.8 99.9 94.4 105.8May 98.5 112.5 100.3 92.3 108.3Jun 100.2 117.8 106.0 88.3 105.5
Jul 100.7 115.1 107.4 93.9 105.8Aug 98.6 113.2 100.9 96.3 109.7
Sep 98.2 110.7 103.3 96.7 102.2Oct 103.1 112.0 112.9 103.9 110.2Nov 113.3 119.3 119.8 117.7 125.6Dec 131.1 133.1 150.9 135.7 146.1
2010 Jan 91.5 105.7 93.7 93.3 90.0Feb 94.5 110.7 92.4 93.3 94.4Mar 99.0 115.0 100.2 97.5 98.9Apr 99.7 114.0 104.7 97.3 102.1May 101.9 117.9 109.5 96.8 104.5Jun 102.6 119.0 112.7 89.0 106.3
Jul 103.4 116.0 113.7 97.1 110.9Aug 101.1 112.2 109.0 100.8 114.2Sep 100.6 102.4 108.8 96.0 95.6Oct 105.6 104.6 117.1 102.3 102.2Nov 116.3 108.8 125.9 113.0 126.8Dec 133.6 118.8 153.1 126.6 154.4
2011 Jan 96.9 98.8 97.6 96.4 93.2Feb 97.3 103.2 91.2 89.9 97.2Mar 100.1 105.8 98.8 87.7 101.5Apr 106.4 112.5 114.7 87.7 105.9May 104.1 108.9 107.8 88.8 106.3Jun 104.9 109.9 112.3 87.6 105.7
Jul 106.2 110.3 114.0 90.6 107.2Aug 103.3 108.9 106.8 88.9 103.5Sep 104.1 107.5 112.5 92.3 102.4Oct 109.5 109.5 119.8 99.8 110.9Nov 119.2 112.9 130.4 113.9 127.9Dec 142.5 127.7 171.1 128.5 162.7
2012 Jan 99.5 102.4 100.2 97.6 95.3Feb 99.8 108.5 94.7 88.9 97.0
Estimates in this table have been produced by combining a breakdown ofcommodity sales from 31 large retailers with total sales from other retailers.
The monthly periods consist of 4 weeks except for March, June, Septemberand December which are 5 weeks. Januar y 2008 is also a 5 week period.
The quarter ly indices are the weighted averages of the monthly indices forthe months within the quarter, the weights being the number of weeks ineach monthly period.
1 The Food, drink and tobacco category, Household goods categoryand Other non-food category include revisions to the commodityclassifications provided by respondents.
Historical data have been revised due to classification changes introduced
from the Januar y 2010 release due to the removal of repair from the classifica-tion.

8/2/2019 Ons Retail Report
http://slidepdf.com/reader/full/ons-retail-report 39/84
5VALUE OF RETAIL SALES BY COMMODITY AT CURRENT PRICESNON-SEASONALLY ADJUSTED
continued
Food Clothing OtherTotal drink and and Household non -
excluding tobacco footwear goods foodfuel
Percentage chang e latest 3 months on same 3 months a year ago
J45J HN5T HN5U HN5V HN5W2009 Apr 0.8 5.9 3.2 −6.8 −3.1
May 0.7 5.4 1.0 −5.4 −2.7Jun 1.3 7.2 2.2 −4.2 −5.3
Jul 1.0 7.2 0.9 −3.2 −6.7Aug 2.2 8.6 2.5 −2.2 −6.5Sep 2.2 7.5 0.8 0.1 −5.6Oct 2.4 6.6 1.8 1.8 −4.5Nov 2.8 5.2 3.5 3.4 −3.2Dec 3.0 4.7 3.7 3.8 −1.3
2010 Jan 2.2 4.7 3.5 1.1 −2.5Feb 2.3 4.6 4.8 1.5 −3.5Mar 2.7 4.8 7.6 3.5 −6.3Apr 3.1 3.9 7.4 6.2 −4.7May 3.1 4.3 7.5 5.7 −4.6Jun 2.4 2.5 6.7 2.8 −1.9
Jul 2.8 2.1 7.0 2.9 0.7Aug 2.5 0.4 6.7 2.9 3.0Sep 2.6 0.7 7.2 0.3 5.0Oct 2.5 1.0 7.6 −1.0 4.8Nov 2.5 1.6 7.8 −3.3 5.9Dec 2.3 1.6 8.1 −6.5 7.4
2011 Jan 3.1 1.3 8.6 −5.2 10.3Feb 3.2 1.3 7.5 −4.2 10.8Mar 3.1 1.2 4.7 −3.3 12.3Apr 3.4 3.4 5.9 −5.9 10.4May 3.2 3.3 5.6 −6.2 9.6Jun 3.6 3.5 6.5 −4.2 8.2
Jul 2.3 2.3 3.9 −3.8 6.3Aug 2.4 3.3 4.1 −4.8 5.2Sep 2.9 4.8 3.6 −5.1 5.4Oct 3.2 4.9 3.0 −4.4 6.7Nov 3.2 4.5 3.1 −1.8 5.3Dec 4.6 5.6 6.8 0.2 4.8
2012 Jan 4.4 5.3 7.1 1.2 3.3Feb 4.5 5.7 7.5 0.8 3.2
Percentage chang e latest month on same month a year ago
J3L2 HN5X HN5Y HN5Z HN622009 Apr 3.3 8.0 7.2 −2.9 −2.1
May −1.8 3.4 −6.6 −4.7 −5.3Jun 2.3 9.7 6.0 −4.9 −7.9
Jul 2.3 7.9 2.4 0.4 −6.8Aug 2.0 8.1 −1.8 −1.3 −4.4Sep 2.2 6.8 1.4 1.0 −5.6Oct 3.2 4.8 5.7 5.7 −3.4Nov 3.0 3.8 3.6 3.9 −0.4Dec 3.0 5.2 2.7 2.6 −0.6
2010 Jan − 5.0 5.1 −4.9 −8.9Feb 3.6 3.3 8.9 6.5 −3.6Mar 4.3 5.9 8.5 8.5 −6.5
Apr 1.3 1.9 4.9 3.0−3.5May 3.5 4.8 9.1 4.9 −3.5
Jun 2.4 1.0 6.4 0.8 0.8
Jul 2.7 0.8 5.9 3.4 4.8Aug 2.5 −0.9 8.0 4.6 4.1Sep 2.4 0.8 7.5 −0.1 4.2Oct 2.4 2.0 7.6 −3.1 4.6Nov 2.7 2.0 8.2 −6.7 8.8Dec 1.9 0.9 8.3 −8.3 8.1
2011 Jan 5.9 1.2 9.7 2.5 17.3Feb 2.9 2.0 3.6 −3.3 10.4Mar 1.1 0.6 1.9 −7.9 10.3Apr 6.8 8.3 12.8 −6.1 10.5May 2.1 1.6 2.8 −4.1 8.0Jun 2.2 1.2 4.6 −2.9 6.5
Jul 2.7 4.4 4.2 −4.6 4.5Aug 2.2 5.0 3.4 −7.3 4.2Sep 3.5 5.0 3.4 −3.8 7.2
Oct 3.7 4.7 2.3−
2.4 8.5Nov 2.5 3.8 3.6 0.8 0.9Dec 6.6 7.6 11.8 1.5 5.4
2012 Jan 2.7 3.6 2.7 1.2 2.3Feb 2.6 5.1 3.8 −1.0 −0.1
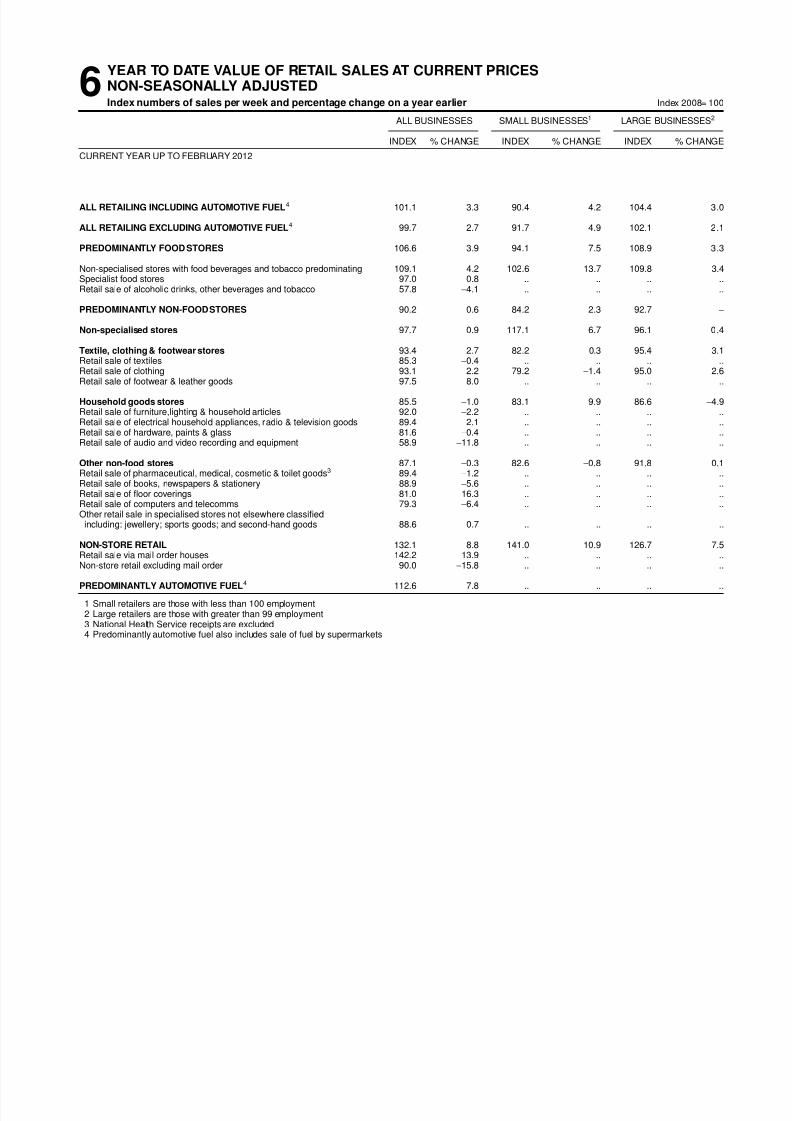
8/2/2019 Ons Retail Report
http://slidepdf.com/reader/full/ons-retail-report 40/84
6YEAR TO DATE VALUE OF RETAIL SALES AT CURRENT PRICESNON-SEASONALLY ADJUSTEDIndex numbers of sales per week and percentage chang e on a year earlier Index 2008= 100
ALL BUSINESSES SMALL BUSINESSES1 LARGE BUSINESSES2
INDEX % CHANGE INDEX % CHANGE INDEX % CHANGE
CURRENT YEAR UP TO FEBRUARY 2012
ALL RETAILING INCLUDING AUTOMOTIVE FUEL4 101.1 3.3 90.4 4.2 104.4 3.0
ALL RETAILING EXCLUDING AUTOMOTIVE FUEL4 99.7 2.7 91.7 4.9 102.1 2.1
PREDOMINANTLY FOOD STORES 106.6 3.9 94.1 7.5 108.9 3.3
Non-specialised stores with food beverages and tobacco predominating 109.1 4.2 102.6 13.7 109.8 3.4Specialist food stores 97.0 0.8 .. .. .. ..Retail sale of alcoholic drinks, other beverages and tobacco 57.8 −4.1 .. .. .. ..
PREDOMINANTLY NON-FOOD STORES 90.2 0.6 84.2 2.3 92.7 −
Non-specialised stores 97.7 0.9 117.1 6.7 96.1 0.4
Te xtile , clothing & footwear stores 93.4 2.7 82.2 0.3 95.4 3.1Retail sale of textiles 85.3 −0.4 .. .. .. ..Retail sale of clothing 93.1 2.2 79.2 −1.4 95.0 2.6
Retail sale of footwear & leather goods 97.5 8.0 .. .. .. ..
Household goods stores 85.5 −1.0 83.1 9.9 86.6 −4.9Retail sale of furniture,lighting & household articles 92.0 −2.2 .. .. .. ..Retail sale of electrical household appliances, radio & television goods 89.4 2.1 .. .. .. ..Retail sale of hardware, paints & glass 81.6 −0.4 .. .. .. ..Retail sale of audio and video recording and equipment 58.9 −11.8 .. .. .. ..
Other non-food stores 87.1 −0.3 82.6 −0.8 91.8 0.1Retail sale of pharmaceutical, medical, cosmetic & toilet goods3 89.4 −1.2 .. .. .. ..Retail sale of books, newspapers & stationery 88.9 −5.6 .. .. .. ..Retail sale of floor coverings 81.0 16.3 .. .. .. ..Retail sale of computers and telecomms 79.3 −6.4 .. .. .. ..Other retail sale in specialised stores not elsewhere classifiedincluding: jeweller y; spor ts goods; and second-hand goods 88.6 0.7 .. .. .. ..
NON-STORE RETAIL 132.1 8.8 141.0 10.9 126.7 7.5Retail sale via mail order houses 142.2 13.9 .. .. .. ..
Non-store retail excluding mail order 90.0−
15.8 .. .. .. ..
PREDOMINANTLY AUTOMOTIVE FUEL4 112.6 7.8 .. .. .. ..
1 Small retailers are those with less than 100 employment2 Large retailers are those with greater than 99 employment3 National Health Service receipts are excluded4 Predominantly automotive fuel also includes sale of fuel by super markets

8/2/2019 Ons Retail Report
http://slidepdf.com/reader/full/ons-retail-report 41/84
7VALUE OF RETAIL SALES AT CURRENT PRICESNON-SEASONALLY ADJUSTEDIndex numbers of sales per week and percentage increase on a year earlier Index 2008=100
Year 1st Qtr 2nd Qtr 3rd Qtr 4th Qtr Jan Feb Mar Apr May June July Aug Sept Oct Nov Dec
SIC 2007 (SALES IN 2008)
All Retailing, Including Automotive Fuel, All Businesses (£321,178m)
2003 84.2 77.7 81.3 81.8 96.0 76.2 77.4 79.3 82.1 80.3 81.5 82.9 80.7 81.7 85.4 92.9 107.02004 88.2 81.1 86.0 85.9 99.8 80.0 80.2 82.6 85.6 85.9 86.4 87.0 85.0 85.6 89.5 97.1 110.12005 89.3 82.6 86.7 86.5 101.4 81.0 81.8 84.6 86.1 86.4 87.5 88.2 85.4 85.9 89.3 97.8 114.02006 92.7 84.3 90.5 90.2 105.8 82.6 83.6 86.2 89.6 90.2 91.3 91.9 89.8 89.2 92.8 101.2 119.82007 96.4 87.6 94.3 93.6 109.8 84.4 86.8 90.9 94.1 93.9 94.8 94.8 92.9 93.3 96.6 106.1 123.4
2008 100.0 92.7 98.9 98.2 110.7 90.0 93.2 94.9 96.5 100.8 99.4 100.1 97.5 97.3 99.8 107.9 121.82009 100.8 91.7 98.4 98.7 114.4 90.3 90.4 93.9 97.1 97.6 99.9 100.1 98.2 98.1 102.7 111.3 126.22010 103.5 94.6 101.3 101.1 117.1 90.4 94.0 98.4 99.7 101.9 102.1 103.1 100.5 100.0 104.9 114.7 128.82011 108.9 99.3 106.4 105.8 124.2 97.3 98.5 101.4 107.5 105.6 106.1 107.5 104.5 105.4 110.3 119.4 139.12012 .. .. .. .. .. 100.7 101.6 .. .. .. .. .. .. .. .. .. ..
Percentage increase on a year earlier
2003 2.7 2.0 2.2 3.2 2.8 2.5 1.8 1.4 1.7 0.2 4.2 2.6 3.3 3.6 3.2 2.5 2.82004 4.7 4.3 5.7 5.0 3.9 5.1 3.7 4.1 4.2 7.0 6.0 5.0 5.4 4.8 4.9 4.6 2.92005 1.3 1.9 0.9 0.7 1.7 1.3 2.0 2.5 0.6 0.5 1.3 1.4 0.4 0.3 −0.2 0.7 3.62006 3.8 2.0 4.3 4.4 4.3 2.0 2.2 1.9 4.1 4.5 4.3 4.2 5.1 3.8 3.9 3.5 5.12007 3.9 3.9 4.2 3.8 3.8 2.2 3.7 5.4 5.0 4.0 3.8 3.1 3.5 4.6 4.1 4.8 3.0
2008 3.8 5.7 4.9 4.9 0.8 6.6 7.4 4.4 2.5 7.4 4.9 5.6 4.9 4.3 3.3 1.7 −1.3
2009 0.8−1.0
−0.6 0.5 3.3 0.4
−3.0
−1.0 0.7
−3.1 0.6
−0.7 0.8 2.9 3.2 3.62010 2.7 3.1 3.0 2.4 2.4 − 4.0 4.8 2.6 4.4 2.2 3.0 2.3 2.0 2.2 3.1 2.0
2011 5.2 5.0 5.0 4.6 6.1 7.7 4.8 3.1 7.8 3.7 3.9 4.3 4.0 5.3 5.2 4.1 8.12012 .. .. .. .. .. 3.4 3.1 .. .. .. .. .. .. .. .. .. ..
All Retailing, Including Automotive Fuel, Large Businesses (£245,671m)
2003 81.2 73.7 77.5 78.2 95.2 72.3 73.2 75.2 78.2 76.6 77.7 79.3 77.3 78.0 82.3 91.3 108.72004 85.3 78.0 82.3 82.3 98.8 77.2 77.1 79.4 82.3 82.3 82.3 82.9 81.7 82.3 86.2 95.2 111.62005 87.0 80.7 83.7 82.9 100.5 79.9 79.3 82.6 83.1 83.5 84.5 84.7 81.6 82.6 86.0 96.0 115.72006 91.0 82.2 87.9 88.1 105.9 80.9 81.3 83.9 87.5 87.8 88.2 89.9 87.5 87.3 90.8 100.3 122.52007 95.4 85.9 92.0 92.2 111.6 83.6 85.0 88.6 92.0 91.7 92.2 92.8 91.2 92.6 96.1 106.6 128.1
2008 100.0 92.4 97.7 97.5 113.0 90.8 92.1 94.2 94.7 100.1 98.0 99.1 96.8 96.7 99.6 109.3 126.72009 101.7 92.8 98.4 98.5 117.3 92.2 91.2 94.6 97.6 97.4 99.9 99.3 97.6 98.5 103.2 113.2 131.82010 106.5 97.8 103.3 102.7 122.3 94.7 96.4 101.5 101.4 103.8 104.5 104.0 101.6 102.5 107.4 118.4 137.32011 112.2 102.4 109.1 107.9 129.3 101.3 101.3 104.0 110.8 107.8 108.9 109.7 106.1 108.1 112.4 123.3 147.72012 .. .. .. .. .. 104.2 104.6 .. .. .. .. .. .. .. .. .. ..
Percentage increase on a year earlier
2003 5.1 4.1 5.0 5.7 5.0 4.5 4.0 3.3 4.7 3.0 6.8 5.4 5.8 5.9 5.4 4.5 5.12004 5.2 5.8 6.2 5.3 3.7 6.8 5.3 5.5 5.2 7.5 5.9 4.5 5.7 5.6 4.8 4.2 2.72005 1.9 3.5 1.7 0.8 1.8 3.5 2.9 4.0 0.9 1.4 2.6 2.1 −0.1 0.4 −0.3 0.8 3.72006 4.6 1.8 4.9 6.3 5.4 1.2 2.5 1.6 5.3 5.2 4.4 6.2 7.2 5.6 5.5 4.5 5.92007 4.8 4.6 4.7 4.6 5.4 3.3 4.5 5.6 5.1 4.4 4.5 3.2 4.3 6.1 5.8 6.3 4.5
2008 4.8 7.5 6.2 5.7 1.2 8.7 8.4 6.4 2.9 9.2 6.4 6.9 6.2 4.4 3.7 2.5 −1.02009 1.7 0.4 0.8 1.0 3.8 1.5 −0.9 0.4 3.1 −2.7 1.8 0.1 0.8 1.8 3.7 3.5 4.02010 4.7 5.4 5.0 4.3 4.3 2.8 5.6 7.3 3.9 6.5 4.6 4.8 4.0 4.1 4.1 4.6 4.22011 5.3 4.6 5.6 5.1 5.7 7.0 5.1 2.4 9.3 3.8 4.2 5.4 4.4 5.4 4.6 4.1 7.62012 .. .. .. .. .. 2.8 3.2 .. .. .. .. .. .. .. .. .. ..
All Retailing, Including Automotive Fuel, Small Businesses (£75,507m)
2003 94.1 90.9 93.6 93.4 98.5 88.7 91.0 92.7 94.7 92.3 93.8 94.4 91.8 94.0 95.5 97.7 101.42004 97.4 91.1 97.9 97.5 103.0 89.3 90.5 93.0 96.2 97.5 99.6 100.4 96.0 96.5 100.2 103.2 105.0
2005 96.9 88.8 96.5 97.9 104.3 84.8 89.9 91.2 96.0 95.6 97.5 99.7 97.9 96.5 100.1 103.6 108.32006 98.1 91.3 98.9 97.0 105.3 88.3 91.2 93.8 96.5 98.1 101.3 98.5 97.4 95.5 99.3 104.3 110.92007 99.3 93.2 101.9 98.2 104.1 87.3 92.6 98.3 101.0 101.1 103.1 101.2 98.5 95.4 98.4 104.5 108.2
2008 100.0 93.5 103.0 100.6 103.3 87.3 96.8 97.0 102.1 103.0 103.8 103.2 99.6 99.3 100.5 103.3 105.72009 97.7 88.2 98.2 99.7 105.0 84.4 87.5 91.7 95.6 98.2 100.2 102.7 100.1 96.9 100.9 105.2 108.02010 93.7 84.0 94.7 96.0 100.2 76.3 86.1 88.4 94.0 95.7 94.5 100.1 97.0 91.9 96.7 102.8 101.02011 98.2 89.2 97.4 98.7 107.5 84.3 89.3 93.1 96.5 98.7 97.0 100.6 99.5 96.6 103.7 106.8 111.22012 .. .. .. .. .. 89.2 91.7 .. .. .. .. .. .. .. .. .. ..
Percentage increase on a year earlier
2003 −3.5 −2.9 −4.7 −3.1 −3.5 −2.6 −3.6 −3.3 −5.5 −6.8 −2.1 −4.5 −2.9 −2.2 −2.6 −2.8 −4.62004 3.5 0.2 4.6 4.4 4.6 0.6 −0.5 0.3 1.6 5.6 6.2 6.3 4.6 2.7 5.0 5.6 3.52005 −0.5 −2.5 −1.5 0.4 1.3 −5.0 −0.7 −1.9 −0.2 −2.0 −2.1 −0.7 1.9 0.1 −0.1 0.3 3.22006 1.3 2.8 2.5 −0.9 0.9 4.1 1.5 2.9 0.5 2.6 3.9 −1.2 −0.5 −1.1 −0.8 0.7 2.42007 1.2 2.0 3.0 1.2 −1.2 −1.1 1.6 4.8 4.7 3.1 1.8 2.8 1.1 − −0.9 0.2 −2.4
2008 0.7 0.4 1.2 2.5 −0.7 − 4.5 −1.3 1.1 1.8 0.7 2.0 1.1 4.1 2.1 −1.2 −2.32009 −2.3 −5.7 −4.7 −1.0 1.6 −3.4 −9.6 −5.5 −6.4 −4.6 −3.4 −0.5 0.4 −2.4 0.4 1.9 2.22010 −4.1 −4.8 −3.5 −3.7 −4.5 −9.6 −1.6 −3.6 −1.6 −2.5 −5.7 −2.5 −3.0 −5.2 −4.1 −2.3 −6.52011 4.8 6.3 2.8 2.8 7.3 10.5 3.7 5.3 2.7 3.1 2.7 0.5 2.6 5.1 7.3 3.9 10.12012 .. .. .. .. .. 5.8 2.7 .. .. .. .. .. .. .. .. .. ..
The monthly periods consist of 4 weeks except for March, June, Septemberand December which are 5 weeks. Januar y 2008 is also a 5 week period.
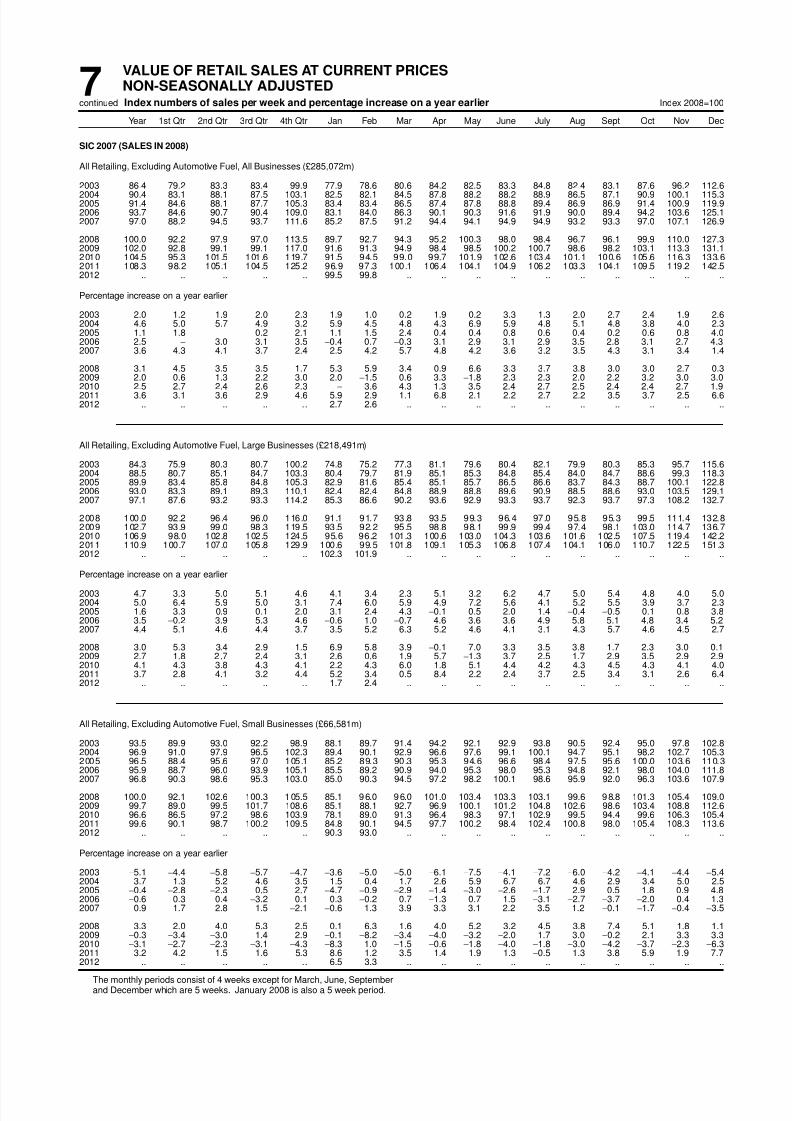
8/2/2019 Ons Retail Report
http://slidepdf.com/reader/full/ons-retail-report 42/84
7VALUE OF RETAIL SALES AT CURRENT PRICESNON-SEASONALLY ADJUSTEDIndex numbers of sales per week and percentage increase on a year earliercontinued Index 2008=100
Year 1st Qtr 2nd Qtr 3rd Qtr 4th Qtr Jan Feb Mar Apr May June July Aug Sept Oct Nov Dec
SIC 2007 (SALES IN 2008)
All Retailing, Excluding Automotive Fuel, All Businesses (£285,072m)
2003 86.4 79.2 83.3 83.4 99.9 77.9 78.6 80.6 84.2 82.5 83.3 84.8 82.4 83.1 87.6 96.2 112.62004 90.4 83.1 88.1 87.5 103.1 82.5 82.1 84.5 87.8 88.2 88.2 88.9 86.5 87.1 90.9 100.1 115.32005 91.4 84.6 88.1 87.7 105.3 83.4 83.4 86.5 87.4 87.8 88.8 89.4 86.9 86.9 91.4 100.9 119.92006 93.7 84.6 90.7 90.4 109.0 83.1 84.0 86.3 90.1 90.3 91.6 91.9 90.0 89.4 94.2 103.6 125.12007 97.0 88.2 94.5 93.7 111.6 85.2 87.5 91.2 94.4 94.1 94.9 94.9 93.2 93.3 97.0 107.1 126.9
2008 100.0 92.2 97.9 97.0 113.5 89.7 92.7 94.3 95.2 100.3 98.0 98.4 96.7 96.1 99.9 110.0 127.32009 102.0 92.8 99.1 99.1 117.0 91.6 91.3 94.9 98.4 98.5 100.2 100.7 98.6 98.2 103.1 113.3 131.12010 104.5 95.3 101.5 101.6 119.7 91.5 94.5 99.0 99.7 101.9 102.6 103.4 101.1 100.6 105.6 116.3 133.62011 108.3 98.2 105.1 104.5 125.2 96.9 97.3 100.1 106.4 104.1 104.9 106.2 103.3 104.1 109.5 119.2 142.52012 .. .. .. .. .. 99.5 99.8 .. .. .. .. .. .. .. .. .. ..
Percentage increase on a year earlier
2003 2.0 1.2 1.9 2.0 2.3 1.9 1.0 0.2 1.9 0.2 3.3 1.3 2.0 2.7 2.4 1.9 2.62004 4.6 5.0 5.7 4.9 3.2 5.9 4.5 4.8 4.3 6.9 5.9 4.8 5.1 4.8 3.8 4.0 2.32005 1.1 1.8 − 0.2 2.1 1.1 1.5 2.4 −0.4 −0.4 0.8 0.6 0.4 −0.2 0.6 0.8 4.02006 2.5 − 3.0 3.1 3.5 −0.4 0.7 −0.3 3.1 2.9 3.1 2.9 3.5 2.8 3.1 2.7 4.32007 3.6 4.3 4.1 3.7 2.4 2.5 4.2 5.7 4.8 4.2 3.6 3.2 3.5 4.3 3.1 3.4 1.4
2008 3.1 4.5 3.5 3.5 1.7 5.3 5.9 3.4 0.9 6.6 3.3 3.7 3.8 3.0 3.0 2.7 0.3
2009 2.0 0.6 1.3 2.2 3.0 2.0−1.5 0.6 3.3
−1.8 2.3 2.3 2.0 2.2 3.2 3.0 3.02010 2.5 2.7 2.4 2.6 2.3 − 3.6 4.3 1.3 3.5 2.4 2.7 2.5 2.4 2.4 2.7 1.9
2011 3.6 3.1 3.6 2.9 4.6 5.9 2.9 1.1 6.8 2.1 2.2 2.7 2.2 3.5 3.7 2.5 6.62012 .. .. .. .. .. 2.7 2.6 .. .. .. .. .. .. .. .. .. ..
All Retailing, Excluding Automotive Fuel, Large Businesses (£218,491m)
2003 84.3 75.9 80.3 80.7 100.2 74.8 75.2 77.3 81.1 79.6 80.4 82.1 79.9 80.3 85.3 95.7 115.62004 88.5 80.7 85.1 84.7 103.3 80.4 79.7 81.9 85.1 85.3 84.8 85.4 84.0 84.7 88.6 99.3 118.32005 89.9 83.4 85.8 84.8 105.3 82.9 81.6 85.4 85.1 85.7 86.5 86.6 83.7 84.3 88.7 100.1 122.82006 93.0 83.3 89.1 89.3 110.1 82.4 82.4 84.8 88.9 88.8 89.6 90.9 88.5 88.6 93.0 103.5 129.12007 97.1 87.6 93.2 93.3 114.2 85.3 86.6 90.2 93.6 92.9 93.3 93.7 92.3 93.7 97.3 108.2 132.7
2008 100.0 92.2 96.4 96.0 116.0 91.1 91.7 93.8 93.5 99.3 96.4 97.0 95.8 95.3 99.5 111.4 132.82009 102.7 93.9 99.0 98.3 119.5 93.5 92.2 95.5 98.8 98.1 99.9 99.4 97.4 98.1 103.0 114.7 136.72010 106.9 98.0 102.8 102.5 124.5 95.6 96.2 101.3 100.6 103.0 104.3 103.6 101.6 102.5 107.5 119.4 142.22011 110.9 100.7 107.0 105.8 129.9 100.6 99.5 101.8 109.1 105.3 106.8 107.4 104.1 106.0 110.7 122.5 151.32012 .. .. .. .. .. 102.3 101.9 .. .. .. .. .. .. .. .. .. ..
Percentage increase on a year earlier
2003 4.7 3.3 5.0 5.1 4.6 4.1 3.4 2.3 5.1 3.2 6.2 4.7 5.0 5.4 4.8 4.0 5.02004 5.0 6.4 5.9 5.0 3.1 7.4 6.0 5.9 4.9 7.2 5.6 4.1 5.2 5.5 3.9 3.7 2.32005 1.6 3.3 0.9 0.1 2.0 3.1 2.4 4.3 −0.1 0.5 2.0 1.4 −0.4 −0.5 0.1 0.8 3.82006 3.5 −0.2 3.9 5.3 4.6 −0.6 1.0 −0.7 4.6 3.6 3.6 4.9 5.8 5.1 4.8 3.4 5.22007 4.4 5.1 4.6 4.4 3.7 3.5 5.2 6.3 5.2 4.6 4.1 3.1 4.3 5.7 4.6 4.5 2.7
2008 3.0 5.3 3.4 2.9 1.5 6.9 5.8 3.9 −0.1 7.0 3.3 3.5 3.8 1.7 2.3 3.0 0.12009 2.7 1.8 2.7 2.4 3.1 2.6 0.6 1.9 5.7 −1.3 3.7 2.5 1.7 2.9 3.5 2.9 2.92010 4.1 4.3 3.8 4.3 4.1 2.2 4.3 6.0 1.8 5.1 4.4 4.2 4.3 4.5 4.3 4.1 4.02011 3.7 2.8 4.1 3.2 4.4 5.2 3.4 0.5 8.4 2.2 2.4 3.7 2.5 3.4 3.1 2.6 6.42012 .. .. .. .. .. 1.7 2.4 .. .. .. .. .. .. .. .. .. ..
All Retailing, Excluding Automotive Fuel, Small Businesses (£66,581m)
2003 93.5 89.9 93.0 92.2 98.9 88.1 89.7 91.4 94.2 92.1 92.9 93.8 90.5 92.4 95.0 97.8 102.82004 96.9 91.0 97.9 96.5 102.3 89.4 90.1 92.9 96.6 97.6 99.1 100.1 94.7 95.1 98.2 102.7 105.3
2005 96.5 88.4 95.6 97.0 105.1 85.2 89.3 90.3 95.3 94.6 96.6 98.4 97.5 95.6 100.0 103.6 110.32006 95.9 88.7 96.0 93.9 105.1 85.5 89.2 90.9 94.0 95.3 98.0 95.3 94.8 92.1 98.0 104.0 111.82007 96.8 90.3 98.6 95.3 103.0 85.0 90.3 94.5 97.2 98.2 100.1 98.6 95.9 92.0 96.3 103.6 107.9
2008 100.0 92.1 102.6 100.3 105.5 85.1 96.0 96.0 101.0 103.4 103.3 103.1 99.6 98.8 101.3 105.4 109.02009 99.7 89.0 99.5 101.7 108.6 85.1 88.1 92.7 96.9 100.1 101.2 104.8 102.6 98.6 103.4 108.8 112.62010 96.6 86.5 97.2 98.6 103.9 78.1 89.0 91.3 96.4 98.3 97.1 102.9 99.5 94.4 99.6 106.3 105.42011 99.6 90.1 98.7 100.2 109.5 84.8 90.1 94.5 97.7 100.2 98.4 102.4 100.8 98.0 105.4 108.3 113.62012 .. .. .. .. .. 90.3 93.0 .. .. .. .. .. .. .. .. .. ..
Percentage increase on a year earlier
2003 −5.1 −4.4 −5.8 −5.7 −4.7 −3.6 −5.0 −5.0 −6.1 −7.5 −4.1 −7.2 −6.0 −4.2 −4.1 −4.4 −5.42004 3.7 1.3 5.2 4.6 3.5 1.5 0.4 1.7 2.6 5.9 6.7 6.7 4.6 2.9 3.4 5.0 2.52005 −0.4 −2.8 −2.3 0.5 2.7 −4.7 −0.9 −2.9 −1.4 −3.0 −2.6 −1.7 2.9 0.5 1.8 0.9 4.82006 −0.6 0.3 0.4 −3.2 0.1 0.3 −0.2 0.7 −1.3 0.7 1.5 −3.1 −2.7 −3.7 −2.0 0.4 1.32007 0.9 1.7 2.8 1.5 −2.1 −0.6 1.3 3.9 3.3 3.1 2.2 3.5 1.2 −0.1 −1.7 −0.4 −3.5
2008 3.3 2.0 4.0 5.3 2.5 0.1 6.3 1.6 4.0 5.2 3.2 4.5 3.8 7.4 5.1 1.8 1.12009 −0.3 −3.4 −3.0 1.4 2.9 −0.1 −8.2 −3.4 −4.0 −3.2 −2.0 1.7 3.0 −0.2 2.1 3.3 3.32010 −3.1 −2.7 −2.3 −3.1 −4.3 −8.3 1.0 −1.5 −0.6 −1.8 −4.0 −1.8 −3.0 −4.2 −3.7 −2.3 −6.32011 3.2 4.2 1.5 1.6 5.3 8.6 1.2 3.5 1.4 1.9 1.3
−0.5 1.3 3.8 5.9 1.9 7.7
2012 .. .. .. .. .. 6.5 3.3 .. .. .. .. .. .. .. .. .. ..
The monthly periods consist of 4 weeks except for March, June, Septemberand December which are 5 weeks. Januar y 2008 is also a 5 week period.

8/2/2019 Ons Retail Report
http://slidepdf.com/reader/full/ons-retail-report 43/84
7VALUE OF RETAIL SALES AT CURRENT PRICESNON-SEASONALLY ADJUSTEDIndex numbers of sales per week and percentage increase on a year earliercontinued Index 2008=100
Year 1st Qtr 2nd Qtr 3rd Qtr 4th Qtr Jan Feb Mar Apr May June July Aug Sept Oct Nov Dec
SIC 2007 (SALES IN 2008)
Predominantly Food Stores, All Businesses (£129,162m)
2003 81.6 77.3 81.3 80.6 87.2 75.2 77.4 79.0 81.9 80.2 81.6 81.3 81.0 79.6 81.1 84.8 93.92004 84.8 80.6 84.6 83.5 90.6 78.7 80.7 82.1 84.2 84.7 84.8 84.2 84.1 82.5 84.1 88.4 97.72005 87.6 83.5 87.0 85.8 94.1 81.1 83.3 85.5 86.1 86.8 87.8 87.4 85.5 84.8 86.4 91.4 102.42006 90.7 84.6 90.0 89.9 98.5 81.1 85.6 86.5 89.1 89.0 91.6 92.1 89.1 88.9 90.2 94.7 108.12007 94.6 89.1 94.0 93.0 102.1 84.8 89.8 91.9 94.1 93.9 94.1 93.2 93.1 92.7 93.7 99.0 111.4
2008 100.0 94.3 99.6 98.9 107.6 90.8 95.9 96.5 97.1 101.2 100.4 99.7 98.7 98.4 100.6 106.2 114.52009 105.5 100.1 106.0 103.7 112.0 96.4 100.9 102.4 105.1 105.3 107.4 104.8 104.0 102.5 103.8 109.4 120.72010 107.1 102.3 106.9 104.6 114.6 98.9 101.6 105.6 103.8 107.6 108.9 106.0 104.4 103.7 105.7 112.9 123.12011 111.8 104.2 111.4 110.3 121.2 100.9 104.4 106.6 113.7 109.9 110.9 111.2 110.1 109.7 111.5 116.8 132.52012 .. .. .. .. .. 104.0 109.2 .. .. .. .. .. .. .. .. .. ..
Percentage increase on a year earlier
2003 3.8 3.1 4.0 4.1 3.5 3.9 2.4 2.3 5.2 2.0 4.7 3.2 4.9 4.3 4.0 3.3 3.22004 4.0 4.3 4.1 3.7 4.0 4.7 4.2 4.0 2.7 5.7 4.0 3.5 3.8 3.6 3.7 4.2 4.02005 3.2 3.5 2.8 2.8 3.8 3.0 3.3 4.1 2.3 2.5 3.5 3.9 1.7 2.8 2.7 3.4 4.82006 3.6 1.3 3.5 4.8 4.7 − 2.8 1.2 3.5 2.5 4.3 5.3 4.2 4.8 4.4 3.7 5.52007 4.2 5.4 4.5 3.4 3.7 4.6 4.9 6.3 5.7 5.5 2.7 1.2 4.5 4.2 4.0 4.5 3.0
2008 5.8 5.9 5.9 6.3 5.4 7.1 6.8 5.0 3.1 7.8 6.7 7.0 5.9 6.1 7.3 7.3 2.8
2009 5.5 6.1 6.5 4.9 4.0 6.1 5.2 6.1 8.2 4.1 7.0 5.1 5.4 4.3 3.2 3.0 5.42010 1.6 2.2 0.8 0.9 2.3 2.6 0.7 3.1 −1.2 2.2 1.3 1.2 0.4 1.2 1.9 3.2 2.02011 4.3 1.8 4.2 5.4 5.8 2.0 2.7 1.0 9.6 2.1 1.8 4.9 5.4 5.8 5.5 3.4 7.72012 .. .. .. .. .. 3.1 4.6 .. .. .. .. .. .. .. .. .. ..
Predominantly Food Stores, Large Businesses (£108,742m)
2003 80.2 75.5 79.6 78.9 86.8 73.4 75.6 77.3 80.2 78.3 80.2 79.5 79.2 78.1 79.7 84.2 94.62004 83.7 79.7 83.2 81.8 90.1 77.8 79.8 81.1 82.8 83.3 83.3 82.3 82.1 81.2 82.4 87.4 98.42005 87.0 83.3 86.3 84.6 93.8 81.0 82.9 85.4 85.1 86.2 87.3 86.3 84.1 83.8 84.9 90.6 103.52006 90.2 84.1 89.3 89.1 98.2 80.7 84.9 86.2 88.4 87.9 91.2 91.0 88.0 88.5 89.0 94.1 108.82007 94.8 89.1 93.9 92.9 103.4 84.8 89.6 92.0 94.0 93.6 94.1 92.8 92.8 93.1 93.9 99.9 113.8
2008 100.0 94.7 99.0 98.2 108.5 91.4 95.9 97.2 96.1 100.7 100.1 98.8 97.7 98.1 100.2 106.9 116.42009 105.9 100.6 105.7 103.3 114.1 97.7 100.9 102.7 104.8 104.7 107.3 103.9 103.1 103.0 104.4 111.1 124.12010 109.4 104.8 108.3 106.3 118.1 101.4 103.7 108.4 105.4 108.9 110.2 107.3 105.7 106.0 107.8 115.4 128.62011 113.7 106.7 113.2 110.9 123.8 103.8 107.1 108.8 115.7 111.5 112.5 111.8 110.2 110.9 112.3 119.7 136.32012 .. .. .. .. .. 106.2 111.7 .. .. .. .. .. .. .. .. .. ..
Percentage increase on a year earlier
2003 5.0 4.1 5.0 5.4 5.1 4.6 3.6 3.5 6.1 2.5 6.1 4.6 6.4 5.3 5.1 4.9 5.32004 4.4 5.5 4.5 3.7 3.8 6.0 5.6 5.0 3.3 6.4 3.9 3.5 3.6 4.0 3.5 3.8 4.12005 3.9 4.5 3.8 3.4 4.1 4.1 3.8 5.3 2.8 3.5 4.8 4.9 2.4 3.1 3.1 3.6 5.22006 3.7 1.0 3.5 5.3 4.7 −0.3 2.4 0.9 3.9 2.0 4.4 5.5 4.7 5.7 4.8 3.9 5.12007 5.1 5.9 5.2 4.2 5.3 5.1 5.5 6.8 6.3 6.5 3.3 1.9 5.4 5.2 5.5 6.1 4.6
2008 5.5 6.4 5.4 5.7 4.9 7.7 7.0 5.6 2.3 7.5 6.3 6.5 5.3 5.4 6.7 7.0 2.32009 5.9 6.2 6.8 5.2 5.2 6.9 5.2 5.7 9.1 4.0 7.2 5.2 5.5 4.9 4.2 4.0 6.72010 3.3 4.2 2.5 2.9 3.6 3.8 2.8 5.6 0.5 4.0 2.8 3.2 2.5 2.9 3.3 3.9 3.62011 3.9 1.9 4.5 4.4 4.8 2.3 3.3 0.4 9.8 2.4 2.0 4.2 4.3 4.6 4.1 3.7 6.02012 .. .. .. .. .. 2.4 4.2 .. .. .. .. .. .. .. .. .. ..
Predominantly Food Stores, Small Businesses (£20,421m)
2003 88.9 86.8 90.1 89.6 89.1 84.8 87.4 88.0 91.5 90.3 88.9 91.3 90.4 87.6 88.9 87.8 90.42004 90.9 85.7 92.2 92.5 93.4 83.8 85.1 87.6 91.2 92.3 92.9 94.2 94.7 89.5 93.0 93.3 93.7
2005 90.7 84.5 90.6 92.2 95.4 81.9 85.6 85.7 91.2 90.3 90.5 93.4 93.1 90.5 93.9 95.5 96.52006 93.7 87.1 93.9 94.2 99.8 83.3 89.6 88.0 92.7 94.5 94.3 97.6 94.9 91.0 96.4 97.8 104.22007 93.2 89.3 94.6 93.4 95.4 84.6 91.0 91.6 95.1 95.0 94.0 95.6 95.0 90.2 92.8 94.2 98.5
2008 100.0 92.2 102.7 102.5 103.3 87.8 96.3 93.3 102.4 103.7 102.0 104.7 103.8 99.7 102.7 102.2 104.72009 103.0 97.6 107.7 105.6 101.0 89.5 101.3 101.0 106.3 108.4 108.3 109.1 108.8 100.3 100.4 99.9 102.32010 95.1 89.1 99.4 95.9 95.8 85.8 90.5 90.7 95.2 100.9 101.6 99.2 97.6 91.8 94.6 99.5 93.92011 101.7 90.4 102.3 106.7 107.3 85.4 89.8 94.9 103.0 101.5 102.3 108.1 109.3 103.6 107.5 101.1 112.12012 .. .. .. .. .. 92.1 96.2 .. .. .. .. .. .. .. .. .. ..
Percentage increase on a year earlier
2003 −1.9 −1.4 −0.3 −1.6 −4.3 0.9 −3.1 −2.6 1.2 −0.2 −1.7 −3.2 −1.6 −0.3 −0.9 −4.0 −7.22004 2.3 −1.4 2.3 3.3 4.8 −1.2 −2.7 −0.5 −0.3 2.2 4.5 3.2 4.7 2.1 4.6 6.3 3.72005 −0.3 −1.4 −1.7 −0.3 2.2 −2.3 0.6 −2.1 −0.1 −2.2 −2.6 −0.8 −1.6 1.2 1.0 2.4 3.02006 3.4 3.0 3.6 2.2 4.6 1.7 4.7 2.7 1.6 4.7 4.2 4.5 1.9 0.5 2.6 2.3 8.02007 −0.6 2.5 0.8 −0.9 −4.4 1.6 1.5 4.0 2.6 0.5 −0.3 −2.1 0.1 −0.8 −3.7 −3.6 −5.5
2008 7.3 3.2 8.5 9.8 8.2 3.7 5.7 1.9 7.7 9.1 8.6 9.5 9.2 10.5 10.7 8.5 6.32009 3.0 5.9 4.9 3.1 −2.2 2.0 5.2 8.3 3.8 4.5 6.2 4.2 4.9 0.6 −2.2 −2.2 −2.32010 −7.7 −8.7 −7.7 −9.2 −5.1 −4.2 −10.7 −10.3 −10.4 −6.9 −6.2 −9.0 −10.3 −8.5 −5.8 −0.5 −8.22011 7.0 1.5 2.8 11.3 12.0
−0.4
−0.8 4.7 8.2 0.6 0.6 9.0 11.9 12.9 13.6 1.7 19.3
2012 .. .. .. .. .. 7.8 7.2 .. .. .. .. .. .. .. .. .. ..
The monthly periods consist of 4 weeks except for March, June, Septemberand December which are 5 weeks. Januar y 2008 is also a 5 week period.

8/2/2019 Ons Retail Report
http://slidepdf.com/reader/full/ons-retail-report 44/84
7VALUE OF RETAIL SALES AT CURRENT PRICESNON-SEASONALLY ADJUSTEDIndex numbers of sales per week and percentage increase on a year earliercontinued Index 2008=100
Year 1st Qtr 2nd Qtr 3rd Qtr 4th Qtr Jan Feb Mar Apr May June July Aug Sept Oct Nov Dec
SIC 2007 (SALES IN 2008)
Non Specialised Food Stores, All Businesses (£117,265m)
2003 79.2 74.9 78.7 78.2 85.1 72.9 74.8 76.5 79.3 77.6 79.1 78.7 78.7 77.5 78.9 82.9 91.82004 83.1 79.1 82.7 81.6 89.0 77.2 79.1 80.5 82.2 82.8 82.9 82.1 82.0 80.8 82.3 86.8 96.12005 86.3 82.6 85.5 84.4 92.7 80.4 82.4 84.5 84.6 85.3 86.4 86.0 83.9 83.5 84.7 90.1 101.32006 89.9 83.9 89.1 89.2 97.5 80.7 84.7 85.7 88.1 88.0 90.8 91.2 88.1 88.5 89.3 93.9 107.02007 94.4 89.2 93.7 92.8 102.2 85.0 89.9 91.9 93.9 93.5 93.8 92.7 92.8 92.8 93.7 99.1 111.4
2008 100.0 94.9 99.4 98.5 107.6 91.6 96.3 97.1 96.9 101.0 100.1 99.2 98.2 98.2 100.3 106.4 114.52009 106.2 100.9 106.6 104.1 113.1 97.4 101.5 103.3 105.5 105.7 108.1 104.8 104.2 103.3 104.7 110.5 121.92010 108.9 104.1 108.5 106.3 116.8 100.8 103.3 107.3 105.1 109.2 110.6 107.3 105.9 105.8 107.2 114.7 126.12011 113.7 106.3 113.4 112.0 123.1 103.1 106.3 108.9 116.0 111.8 112.6 112.7 111.6 111.6 113.2 118.9 134.52012 .. .. .. .. .. 106.6 111.6 .. .. .. .. .. .. .. .. .. ..
Percentage increase on a year earlier
2003 5.1 4.3 5.2 5.4 5.0 5.0 3.5 3.8 6.4 3.1 6.0 4.4 6.4 5.5 5.2 4.6 5.12004 4.9 5.6 5.0 4.3 4.6 5.9 5.7 5.2 3.7 6.7 4.8 4.3 4.2 4.3 4.3 4.8 4.72005 3.9 4.5 3.4 3.4 4.2 4.2 4.1 5.0 2.9 3.1 4.2 4.8 2.3 3.3 2.9 3.8 5.42006 4.2 1.5 4.2 5.7 5.2 0.3 2.8 1.4 4.1 3.0 5.1 6.0 5.0 6.0 5.4 4.2 5.72007 5.0 6.3 5.2 4.0 4.7 5.4 6.1 7.2 6.6 6.3 3.2 1.7 5.4 4.8 4.9 5.5 4.1
2008 5.9 6.4 6.1 6.2 5.4 7.7 7.2 5.7 3.1 8.1 6.8 7.0 5.8 5.8 7.1 7.3 2.8
2009 6.2 6.4 7.2 5.7 5.1 6.4 5.4 6.4 8.9 4.7 8.0 5.7 6.2 5.3 4.4 3.9 6.42010 2.6 3.1 1.8 2.2 3.3 3.5 1.8 3.9 −0.4 3.3 2.2 2.4 1.6 2.4 2.4 3.8 3.52011 4.4 2.1 4.6 5.3 5.4 2.2 2.9 1.4 10.4 2.4 1.9 5.0 5.4 5.5 5.5 3.6 6.72012 .. .. .. .. .. 3.4 5.0 .. .. .. .. .. .. .. .. .. ..
Non Specialised Food Stores, Large Businesses (£105,941m)
2003 79.5 74.8 78.9 78.2 86.1 72.8 74.7 76.5 79.5 77.6 79.5 78.7 78.5 77.5 79.0 83.6 93.72004 83.1 79.2 82.5 81.2 89.5 77.4 79.3 80.6 82.3 82.7 82.7 81.6 81.4 80.7 81.9 86.9 97.62005 86.5 82.9 85.7 84.1 93.2 80.6 82.4 85.0 84.6 85.6 86.8 85.8 83.4 83.2 84.4 90.1 102.72006 89.9 83.9 89.0 88.8 97.7 80.5 84.7 85.9 88.1 87.6 90.8 90.7 87.7 88.3 88.7 93.8 108.12007 94.6 88.9 93.6 92.7 103.0 84.7 89.3 91.8 93.7 93.4 93.8 92.5 92.5 93.0 93.7 99.6 113.3
2008 100.0 94.7 99.0 98.2 108.5 91.4 95.8 97.2 96.1 100.6 100.0 98.8 97.7 98.1 100.1 106.9 116.42009 106.1 100.8 105.8 103.4 114.2 97.9 101.0 102.9 105.0 104.8 107.4 104.0 103.2 103.2 104.6 111.4 124.22010 110.2 105.7 109.2 107.1 119.0 102.2 104.6 109.3 106.3 109.8 111.0 108.0 106.6 106.8 108.6 116.2 129.42011 114.5 107.5 114.0 111.7 124.7 104.5 107.9 109.6 116.6 112.3 113.2 112.5 111.0 111.8 113.1 120.6 137.22012 .. .. .. .. .. 107.1 112.5 .. .. .. .. .. .. .. .. .. ..
Percentage increase on a year earlier
2003 5.7 4.7 5.7 6.0 5.9 5.2 4.0 4.1 6.9 3.2 6.7 5.1 7.0 6.0 5.7 5.5 6.32004 4.6 5.9 4.6 3.9 4.0 6.3 6.2 5.3 3.5 6.5 4.1 3.7 3.7 4.1 3.6 4.0 4.22005 4.0 4.6 3.8 3.6 4.1 4.2 3.9 5.5 2.8 3.5 4.9 5.2 2.5 3.2 3.0 3.6 5.32006 3.9 1.2 3.8 5.6 4.9 −0.1 2.7 1.1 4.2 2.3 4.6 5.7 5.1 6.0 5.1 4.1 5.32007 5.2 5.9 5.2 4.3 5.4 5.2 5.5 6.9 6.4 6.6 3.3 1.9 5.5 5.3 5.7 6.2 4.7
2008 5.8 6.6 5.7 5.9 5.3 7.9 7.3 5.8 2.5 7.8 6.7 6.8 5.6 5.5 6.9 7.3 2.72009 6.1 6.4 6.9 5.3 5.3 7.1 5.4 5.9 9.2 4.2 7.3 5.3 5.6 5.2 4.5 4.2 6.72010 3.9 4.9 3.1 3.6 4.1 4.5 3.5 6.2 1.3 4.7 3.4 3.8 3.3 3.5 3.8 4.3 4.22011 3.9 1.7 4.4 4.3 4.8 2.2 3.2 0.2 9.7 2.3 2.0 4.2 4.1 4.6 4.2 3.8 6.02012 .. .. .. .. .. 2.4 4.3 .. .. .. .. .. .. .. .. .. ..
Non Specialised Food Stores, Small Businesses (£11,324m)
2003 76.7 75.6 76.9 78.6 75.8 74.0 76.1 76.3 77.8 77.1 76.0 78.5 80.3 77.4 77.5 76.5 73.92004 82.7 77.6 83.7 85.2 84.3 75.7 77.3 79.3 81.8 83.9 85.2 86.6 87.5 82.1 85.8 85.8 82.0
2005 84.8 80.1 83.5 87.1 88.5 78.5 82.0 79.8 84.7 83.1 82.9 87.9 88.3 85.5 87.6 90.5 87.52006 90.5 83.6 90.2 92.7 95.5 82.1 85.2 83.6 87.7 91.3 91.2 95.8 92.2 90.6 94.5 95.2 96.62007 93.4 91.8 94.4 93.6 93.8 88.2 94.8 92.4 95.7 94.5 93.4 95.0 95.8 90.7 93.1 94.4 93.9
2008 100.0 96.4 103.0 101.1 99.7 93.0 101.0 96.2 104.1 104.6 101.0 102.8 102.4 98.8 101.4 101.1 97.22009 107.0 102.4 113.4 109.9 102.3 93.0 106.1 107.0 110.3 114.0 115.4 112.3 114.0 104.7 105.2 102.6 99.82010 96.5 89.2 1 01.8 98.7 96.4 87.6 91.5 88.7 94.1 103.5 106.7 100.9 99.1 96.5 94.2 100.6 94.72011 106.4 94.9 108.2 113.8 108.5 89.3 91.2 102.3 110.0 107.5 107.4 114.6 117.4 110.3 113.4 102.7 109.32012 .. .. .. .. .. 102.1 103.1 .. .. .. .. .. .. .. .. .. ..
Percentage increase on a year earlier
2003 −0.2 1.1 1.4 0.1 −3.6 2.9 −1.3 1.0 2.5 2.1 −0.1 −2.5 1.3 1.2 1.2 −3.8 −7.12004 7.8 2.7 8.9 8.3 11.3 2.3 1.6 3.8 5.1 8.7 12.0 10.3 9.1 6.1 10.8 12.2 11.02005 2.5 3.2 −0.2 2.2 4.9 3.7 6.0 0.6 3.6 −0.9 −2.7 1.4 0.9 4.1 2.0 5.5 6.82006 6.7 4.5 7.9 6.4 8.0 4.6 3.9 4.9 3.4 9.9 10.0 9.0 4.4 5.9 8.0 5.1 10.32007 3.2 9.8 4.7 1.0 −1.8 7.4 11.3 10.4 9.1 3.5 2.4 −0.8 4.0 0.1 −1.6 −0.8 −2.8
2008 7.1 5.0 9.1 8.1 6.3 5.5 6.5 4.1 8.7 10.6 8.1 8.2 6.8 9.0 9.0 7.1 3.52009 7.0 6.2 10.0 8.7 2.7 − 5.1 11.3 6.0 9.0 14.2 9.2 11.4 6.0 3.8 1.5 2.72010 −9.8 −12.9 −10.2 −10.2 −5.8 −5.8 −13.8 −17.1 −14.7 −9.2 −7.5 −10.1 −13.0 −7.8 −10.4 −2.0 −5.12011 10.2 6.3 6.2 15.3 12.6 1.9
−0.3 15.4 16.9 3.9 0.6 13.6 18.4 14.3 20.3 2.1 15.4
2012 .. .. .. .. .. 14.4 13.1 .. .. .. .. .. .. .. .. .. ..
The monthly periods consist of 4 weeks except for March, June, Septemberand December which are 5 weeks. Januar y 2008 is also a 5 week period.
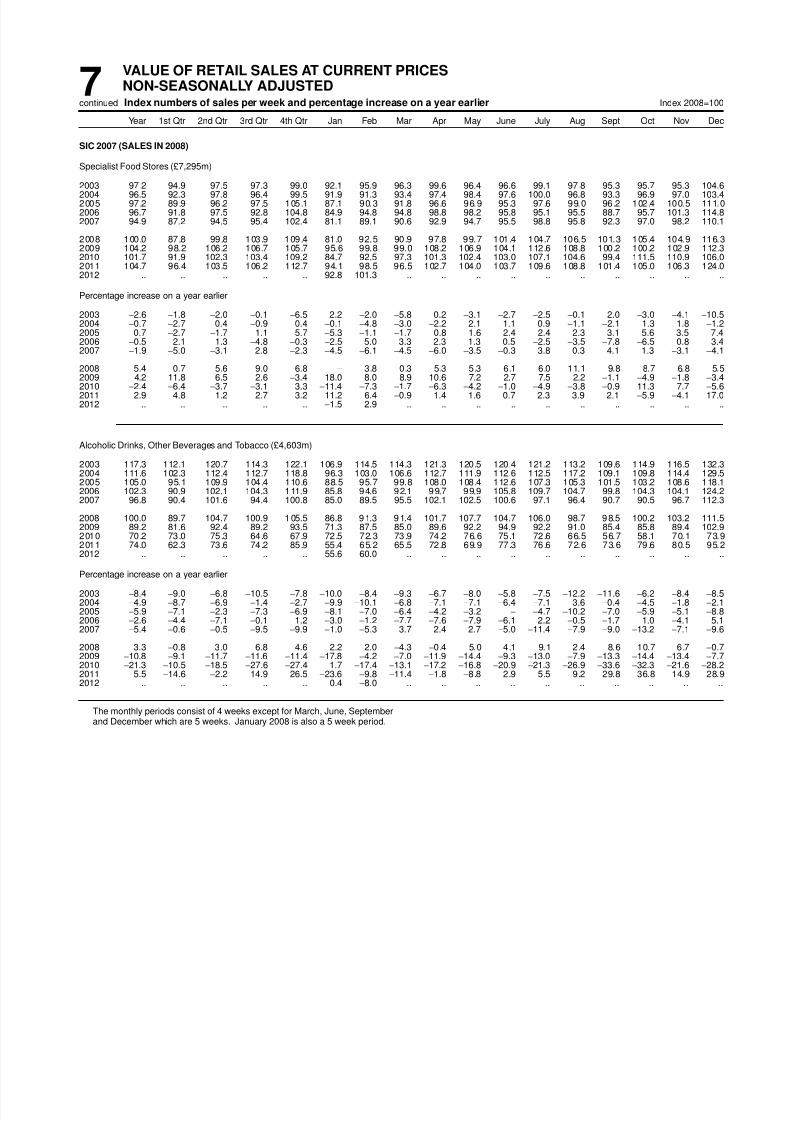
8/2/2019 Ons Retail Report
http://slidepdf.com/reader/full/ons-retail-report 45/84
7VALUE OF RETAIL SALES AT CURRENT PRICESNON-SEASONALLY ADJUSTEDIndex numbers of sales per week and percentage increase on a year earliercontinued Index 2008=100
Year 1st Qtr 2nd Qtr 3rd Qtr 4th Qtr Jan Feb Mar Apr May June July Aug Sept Oct Nov Dec
SIC 2007 (SALES IN 2008)
Specialist Food Stores (£7,295m)
2003 97.2 94.9 97.5 97.3 99.0 92.1 95.9 96.3 99.6 96.4 96.6 99.1 97.8 95.3 95.7 95.3 104.62004 96.5 92.3 97.8 96.4 99.5 91.9 91.3 93.4 97.4 98.4 97.6 100.0 96.8 93.3 96.9 97.0 103.42005 97.2 89.9 96.2 97.5 105.1 87.1 90.3 91.8 96.6 96.9 95.3 97.6 99.0 96.2 102.4 100.5 111.02006 96.7 91.8 97.5 92.8 104.8 84.9 94.8 94.8 98.8 98.2 95.8 95.1 95.5 88.7 95.7 101.3 114.82007 94.9 87.2 94.5 95.4 102.4 81.1 89.1 90.6 92.9 94.7 95.5 98.8 95.8 92.3 97.0 98.2 110.1
2008 100.0 87.8 99.8 103.9 109.4 81.0 92.5 90.9 97.8 99.7 101.4 104.7 106.5 101.3 105.4 104.9 116.32009 104.2 98.2 106.2 106.7 105.7 95.6 99.8 99.0 108.2 106.9 104.1 112.6 108.8 100.2 100.2 102.9 112.32010 101.7 91.9 102.3 103.4 109.2 84.7 92.5 97.3 101.3 102.4 103.0 107.1 104.6 99.4 111.5 110.9 106.02011 104.7 96.4 103.5 106.2 112.7 94.1 98.5 96.5 102.7 104.0 103.7 109.6 108.8 101.4 105.0 106.3 124.02012 .. .. .. .. .. 92.8 101.3 .. .. .. .. .. .. .. .. .. ..
Percentage increase on a year earlier
2003 −2.6 −1.8 −2.0 −0.1 −6.5 2.2 −2.0 −5.8 0.2 −3.1 −2.7 −2.5 −0.1 2.0 −3.0 −4.1 −10.52004 −0.7 −2.7 0.4 −0.9 0.4 −0.1 −4.8 −3.0 −2.2 2.1 1.1 0.9 −1.1 −2.1 1.3 1.8 −1.22005 0.7 −2.7 −1.7 1.1 5.7 −5.3 −1.1 −1.7 −0.8 −1.6 −2.4 −2.4 2.3 3.1 5.6 3.5 7.42006 −0.5 2.1 1.3 −4.8 −0.3 −2.5 5.0 3.3 2.3 1.3 0.5 −2.5 −3.5 −7.8 −6.5 0.8 3.42007 −1.9 −5.0 −3.1 2.8 −2.3 −4.5 −6.1 −4.5 −6.0 −3.5 −0.3 3.8 0.3 4.1 1.3 −3.1 −4.1
2008 5.4 0.7 5.6 9.0 6.8 − 3.8 0.3 5.3 5.3 6.1 6.0 11.1 9.8 8.7 6.8 5.5
2009 4.2 11.8 6.5 2.6−3.4 18.0 8.0 8.9 10.6 7.2 2.7 7.5 2.2
−1.1
−4.9
−1.8
−3.42010 −2.4 −6.4 −3.7 −3.1 3.3 −11.4 −7.3 −1.7 −6.3 −4.2 −1.0 −4.9 −3.8 −0.9 11.3 7.7 −5.6
2011 2.9 4.8 1.2 2.7 3.2 11.2 6.4 −0.9 1.4 1.6 0.7 2.3 3.9 2.1 −5.9 −4.1 17.02012 .. .. .. .. .. −1.5 2.9 .. .. .. .. .. .. .. .. .. ..
Alcoholic Drinks, Other Beverages and Tobacco (£4,603m)
2003 117.3 112.1 120.7 114.3 122.1 106.9 114.5 114.3 121.3 120.5 120.4 121.2 113.2 109.6 114.9 116.5 132.32004 111.6 102.3 112.4 112.7 118.8 96.3 103.0 106.6 112.7 111.9 112.6 112.5 117.2 109.1 109.8 114.4 129.52005 105.0 95.1 109.9 104.4 110.6 88.5 95.7 99.8 108.0 108.4 112.6 107.3 105.3 101.5 103.2 108.6 118.12006 102.3 90.9 102.1 104.3 111.9 85.8 94.6 92.1 99.7 99.9 105.8 109.7 104.7 99.8 104.3 104.1 124.22007 96.8 90.4 101.6 94.4 100.8 85.0 89.5 95.5 102.1 102.5 100.6 97.1 96.4 90.7 90.5 96.7 112.3
2008 100.0 89.7 104.7 100.9 105.5 86.8 91.3 91.4 101.7 107.7 104.7 106.0 98.7 98.5 100.2 103.2 111.52009 89.2 81.6 92.4 89.2 93.5 71.3 87.5 85.0 89.6 92.2 94.9 92.2 91.0 85.4 85.8 89.4 102.92010 70.2 73.0 75.3 64.6 67.9 72.5 72.3 73.9 74.2 76.6 75.1 72.6 66.5 56.7 58.1 70.1 73.92011 74.0 62.3 73.6 74.2 85.9 55.4 65.2 65.5 72.8 69.9 77.3 76.6 72.6 73.6 79.6 80.5 95.22012 .. .. .. .. .. 55.6 60.0 .. .. .. .. .. .. .. .. .. ..
Percentage increase on a year earlier
2003 −8.4 −9.0 −6.8 −10.5 −7.8 −10.0 −8.4 −9.3 −6.7 −8.0 −5.8 −7.5 −12.2 −11.6 −6.2 −8.4 −8.52004 −4.9 −8.7 −6.9 −1.4 −2.7 −9.9 −10.1 −6.8 −7.1 −7.1 −6.4 −7.1 3.6 −0.4 −4.5 −1.8 −2.12005 −5.9 −7.1 −2.3 −7.3 −6.9 −8.1 −7.0 −6.4 −4.2 −3.2 − −4.7 −10.2 −7.0 −5.9 −5.1 −8.82006 −2.6 −4.4 −7.1 −0.1 1.2 −3.0 −1.2 −7.7 −7.6 −7.9 −6.1 2.2 −0.5 −1.7 1.0 −4.1 5.12007 −5.4 −0.6 −0.5 −9.5 −9.9 −1.0 −5.3 3.7 2.4 2.7 −5.0 −11.4 −7.9 −9.0 −13.2 −7.1 −9.6
2008 3.3 −0.8 3.0 6.8 4.6 2.2 2.0 −4.3 −0.4 5.0 4.1 9.1 2.4 8.6 10.7 6.7 −0.72009 −10.8 −9.1 −11.7 −11.6 −11.4 −17.8 −4.2 −7.0 −11.9 −14.4 −9.3 −13.0 −7.9 −13.3 −14.4 −13.4 −7.72010 −21.3 −10.5 −18.5 −27.6 −27.4 1.7 −17.4 −13.1 −17.2 −16.8 −20.9 −21.3 −26.9 −33.6 −32.3 −21.6 −28.22011 5.5 −14.6 −2.2 14.9 26.5 −23.6 −9.8 −11.4 −1.8 −8.8 2.9 5.5 9.2 29.8 36.8 14.9 28.92012 .. .. .. .. .. 0.4 −8.0 .. .. .. .. .. .. .. .. .. ..
The monthly periods consist of 4 weeks except for March, June, Septemberand December which are 5 weeks. Januar y 2008 is also a 5 week period.

8/2/2019 Ons Retail Report
http://slidepdf.com/reader/full/ons-retail-report 46/84
7VALUE OF RETAIL SALES AT CURRENT PRICESNON-SEASONALLY ADJUSTEDIndex numbers of sales per week and percentage increase on a year earliercontinued Index 2008=100
Year 1st Qtr 2nd Qtr 3rd Qtr 4th Qtr Jan Feb Mar Apr May June July Aug Sept Oct Nov Dec
SIC 2007 (SALES IN 2008)
Predominantly Non-food Stores, All Businesses (£142,149m)
2003 91.5 81.3 86.1 86.7 111.8 81.0 80.0 82.7 87.2 85.6 85.7 88.9 84.6 86.6 93.1 105.6 131.72004 95.7 85.6 91.6 91.4 114.4 86.4 83.6 86.7 91.6 91.7 91.4 93.5 89.6 91.0 96.3 109.5 132.82005 95.2 85.7 89.5 90.0 115.8 85.8 83.1 87.8 88.6 89.2 90.4 91.9 89.0 89.3 95.5 108.8 137.52006 96.7 84.7 91.9 91.4 118.7 85.5 82.6 85.7 91.7 92.0 92.1 93.0 91.3 90.2 97.5 110.6 142.22007 99.6 87.7 95.6 95.1 119.9 86.1 85.4 90.8 95.3 94.9 96.3 97.0 94.1 94.4 99.7 112.6 142.0
2008 100.0 90.2 96.7 95.9 118.0 88.7 89.2 92.4 93.4 100.3 96.4 98.2 95.7 94.2 98.8 111.3 138.82009 98.4 85.9 93.2 94.6 119.9 87.0 82.5 87.8 92.5 92.8 94.2 97.1 93.5 93.4 101.1 113.6 140.12010 100.9 87.9 96.2 97.8 121.6 83.9 86.8 91.9 95.2 96.4 96.9 100.3 97.0 96.5 103.3 115.7 140.92011 102.5 90.6 97.6 97.2 124.4 91.2 88.2 92.0 98.6 97.0 97.4 99.9 95.2 96.7 104.5 115.3 147.72012 .. .. .. .. .. 92.4 88.1 .. .. .. .. .. .. .. .. .. ..
Percentage increase on a year earlier
2003 1.7 0.3 1.5 1.9 2.1 0.8 1.1 −0.9 0.6 −0.2 3.6 1.2 1.4 2.9 2.4 1.4 2.42004 4.7 5.3 6.3 5.4 2.3 6.7 4.5 4.8 5.1 7.0 6.7 5.2 6.0 5.1 3.5 3.7 0.82005 −0.5 0.1 −2.3 −1.5 1.2 −0.7 −0.6 1.3 −3.4 −2.7 −1.1 −1.8 −0.8 −1.9 −0.9 −0.7 3.62006 1.5 −1.2 2.8 1.6 2.6 −0.4 −0.6 −2.3 3.6 3.1 1.9 1.2 2.6 1.0 2.1 1.7 3.42007 3.0 3.6 3.9 4.1 1.0 0.7 3.4 5.9 3.9 3.2 4.6 4.4 3.1 4.7 2.2 1.8 −0.2
2008 0.4 2.8 1.2 0.8 −1.6 3.1 4.4 1.8 −2.0 5.7 0.1 1.2 1.7 −0.2 −0.9 −1.2 −2.2
2009−1.6
−4.7
−3.6
−1.4 1.6
−2.0
−7.5
−4.9
−1.0
−7.5
−2.3
−1.1
−2.3
−0.8 2.4 2.1 0.92010 2.5 2.3 3.2 3.4 1.4 −3.6 5.3 4.6 2.9 3.9 2.9 3.3 3.7 3.3 2.2 1.9 0.6
2011 1.6 3.1 1.5 −0.6 2.4 8.7 1.6 0.1 3.6 0.6 0.6 −0.4 −1.8 0.2 1.2 −0.4 4.92012 .. .. .. .. .. 1.3 −0.2 .. .. .. .. .. .. .. .. .. ..
Predominantly Non-food Stores, Large Businesses (£101,158m)
2003 88.3 75.8 81.1 82.6 113.9 76.4 74.0 76.7 82.3 81.0 80.2 84.9 80.8 82.1 90.0 106.0 139.42004 93.1 81.4 86.9 87.4 116.8 83.1 78.9 82.0 87.6 87.2 86.1 88.6 86.1 87.5 93.9 110.0 140.52005 93.0 83.5 85.3 85.5 117.9 84.9 79.6 85.5 84.3 85.5 85.9 87.5 84.1 85.1 92.1 109.4 145.32006 96.2 82.6 89.7 89.8 122.7 84.6 79.6 83.4 90.1 90.2 89.0 91.6 89.5 88.7 96.4 111.9 152.42007 99.5 85.9 93.0 94.0 125.2 85.9 83.1 88.2 93.5 92.4 92.9 95.1 92.3 94.4 100.2 114.8 153.6
2008 100.0 89.4 93.9 94.0 123.6 90.6 86.7 90.2 90.4 98.7 93.0 95.7 94.3 92.3 98.3 114.6 151.02009 98.8 86.3 92.1 93.0 123.9 88.7 82.5 87.4 92.5 91.2 92.5 95.0 91.4 92.6 100.2 115.4 149.72010 103.7 90.3 97.2 98.3 129.1 88.9 87.6 93.4 95.7 97.1 98.5 99.8 97.0 98.2 105.4 120.2 155.12011 106.2 92.8 99.8 99.4 133.0 95.9 89.5 93.0 101.5 97.8 99.9 102.2 96.7 99.4 107.0 120.5 163.82012 .. .. .. .. .. 95.9 89.4 .. .. .. .. .. .. .. .. .. ..
Percentage increase on a year earlier
2003 4.6 2.5 5.3 5.2 4.2 3.8 3.6 0.7 5.2 3.9 6.6 4.8 4.6 6.0 4.8 3.2 4.52004 5.4 7.4 7.1 5.8 2.5 8.8 6.6 7.0 6.4 7.6 7.4 4.3 6.5 6.5 4.3 3.8 0.82005 −0.1 2.6 −1.9 −2.1 0.9 2.2 1.0 4.2 −3.7 −2.0 −0.3 −1.2 −2.3 −2.7 −1.9 −0.6 3.42006 3.4 −1.1 5.2 5.0 4.1 −0.4 −0.1 −2.5 6.8 5.6 3.6 4.7 6.4 4.2 4.6 2.3 4.92007 3.4 4.0 3.6 4.6 2.1 1.5 4.4 5.7 3.8 2.5 4.4 3.7 3.2 6.4 4.0 2.6 0.8
2008 0.5 4.0 1.1 − −1.3 5.5 4.4 2.3 −3.4 6.7 0.1 0.6 2.2 −2.2 −2.0 −0.2 −1.72009 −1.2 −3.4 −2.0 −1.1 0.3 −2.1 −4.8 −3.1 2.3 −7.6 −0.5 −0.7 −3.1 0.3 2.0 0.8 −0.92010 4.9 4.6 5.6 5.8 4.1 0.3 6.2 6.9 3.5 6.5 6.5 5.1 6.1 6.1 5.2 4.1 3.62011 2.4 2.8 2.6 1.1 3.1 7.8 2.1 −0.5 6.1 0.7 1.5 2.4 −0.2 1.2 1.5 0.3 5.62012 .. .. .. .. .. − −0.1 .. .. .. .. .. .. .. .. .. ..
Predominantly Non-food Stores, Small Businesses (£40,991m)
2003 99.2 95.0 98.5 96.7 106.5 92.4 94.7 97.4 99.3 97.0 99.1 98.8 93.8 97.5 100.8 104.8 112.52004 102.2 96.1 103.0 101.2 108.6 94.7 95.2 98.0 101.6 102.7 104.4 105.7 98.5 99.6 102.4 108.4 113.7
2005 100.6 91.1 99.8 100.9 110.6 87.9 91.5 93.3 99.0 98.5 101.5 102.5 101.0 99.5 103.8 107.4 118.52006 97.9 89.8 97.5 95.1 109.0 87.6 89.9 91.5 95.9 96.4 99.7 96.3 95.7 93.8 100.3 107.4 117.22007 99.7 92.1 102.0 98.0 106.9 86.5 91.2 97.3 99.7 101.1 104.6 102.0 98.5 94.3 98.4 107.3 113.3
2008 100.0 92.2 103.4 100.6 104.4 84.2 95.2 97.8 100.9 104.3 104.7 104.4 99.1 98.9 100.0 103.2 108.82009 97.4 85.0 96.0 98.6 110.0 82.8 82.2 89.0 92.6 96.6 98.2 102.4 98.7 95.5 103.3 109.1 116.22010 93.9 82.0 93.7 96.6 103.1 71.4 84.9 88.2 93.9 94.5 92.8 101.7 97.1 92.1 98.1 104.8 105.92011 93.2 85.1 92.4 91.8 103.3 79.6 85.1 89.6 91.3 95.0 91.2 94.3 91.6 90.1 98.4 102.2 108.12012 .. .. .. .. .. 83.7 84.7 .. .. .. .. .. .. .. .. .. ..
Percentage increase on a year earlier
2003 −4.1 −3.8 −5.6 −4.4 −3.0 −4.7 −3.3 −3.8 −7.8 −7.8 −1.9 −5.6 −4.9 −3.1 −2.4 −2.9 −3.62004 3.0 1.1 4.6 4.6 1.9 2.4 0.5 0.7 2.4 6.0 5.3 7.1 5.0 2.2 1.6 3.4 1.12005 −1.6 −5.2 −3.1 −0.3 1.8 −7.1 −3.8 −4.8 −2.6 −4.1 −2.8 −3.0 2.6 −0.2 1.4 −0.9 4.22006 −2.7 −1.4 −2.3 −5.7 −1.4 −0.4 −1.7 −1.9 −3.2 −2.1 −1.8 −6.1 −5.3 −5.8 −3.4 − −1.12007 1.9 2.5 4.6 3.0 −1.9 −1.2 1.4 6.3 4.0 4.8 4.9 5.9 3.0 0.6 −1.9 −0.1 −3.3
2008 0.3 0.1 1.4 2.7 −2.3 −2.7 4.5 0.5 1.2 3.2 0.1 2.4 0.5 4.8 1.6 −3.8 −4.02009 −2.6 −7.8 −7.2 −2.0 5.4 −1.7 −13.6 −9.0 −8.2 −7.4 −6.2 −1.9 −0.3 −3.5 3.3 5.6 6.92010 −3.6 −3.5 −2.4 −2.0 −6.3 −13.7 3.2 −0.8 1.4 −2.1 −5.4 −0.6 −1.7 −3.5 −5.0 −3.9 −8.92011
−0.7 3.8
−1.4
−4.9 0.2 11.4 0.3 1.6
−2.7 0.5
−1.8
−7.3
−5.7
−2.2 0.4
−2.5 2.1
2012 .. .. .. .. .. 5.2 −0.5 .. .. .. .. .. .. .. .. .. ..
The monthly periods consist of 4 weeks except for March, June, Septemberand December which are 5 weeks. Januar y 2008 is also a 5 week period.
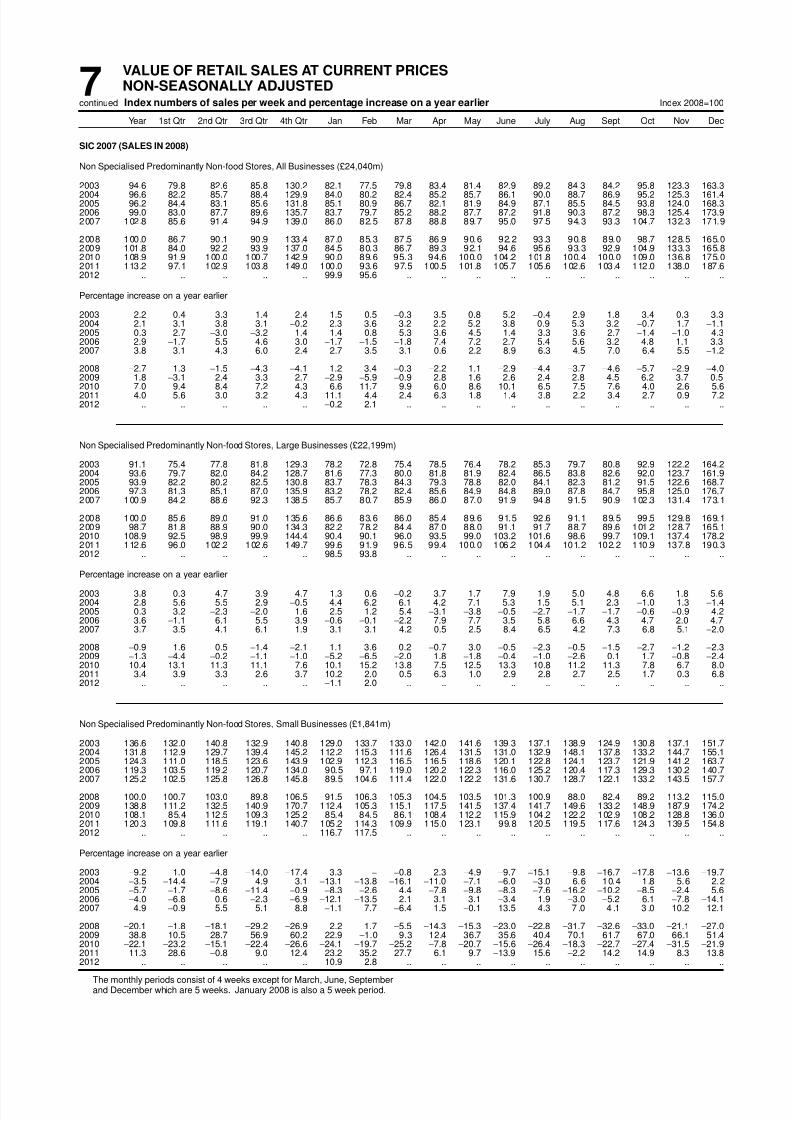
8/2/2019 Ons Retail Report
http://slidepdf.com/reader/full/ons-retail-report 47/84
7VALUE OF RETAIL SALES AT CURRENT PRICESNON-SEASONALLY ADJUSTEDIndex numbers of sales per week and percentage increase on a year earliercontinued Index 2008=100
Year 1st Qtr 2nd Qtr 3rd Qtr 4th Qtr Jan Feb Mar Apr May June July Aug Sept Oct Nov Dec
SIC 2007 (SALES IN 2008)
Non Specialised Predominantly Non-food Stores, All Businesses (£24,040m)
2003 94.6 79.8 82.6 85.8 130.2 82.1 77.5 79.8 83.4 81.4 82.9 89.2 84.3 84.2 95.8 123.3 163.32004 96.6 82.2 85.7 88.4 129.9 84.0 80.2 82.4 85.2 85.7 86.1 90.0 88.7 86.9 95.2 125.3 161.42005 96.2 84.4 83.1 85.6 131.8 85.1 80.9 86.7 82.1 81.9 84.9 87.1 85.5 84.5 93.8 124.0 168.32006 99.0 83.0 87.7 89.6 135.7 83.7 79.7 85.2 88.2 87.7 87.2 91.8 90.3 87.2 98.3 125.4 173.92007 102.8 85.6 91.4 94.9 139.0 86.0 82.5 87.8 88.8 89.7 95.0 97.5 94.3 93.3 104.7 132.3 171.9
2008 100.0 86.7 90.1 90.9 133.4 87.0 85.3 87.5 86.9 90.6 92.2 93.3 90.8 89.0 98.7 128.5 165.02009 101.8 84.0 92.2 93.9 137.0 84.5 80.3 86.7 89.3 92.1 94.6 95.6 93.3 92.9 104.9 133.3 165.82010 108.9 91.9 100.0 100.7 142.9 90.0 89.6 95.3 94.6 100.0 104.2 101.8 100.4 100.0 109.0 136.8 175.02011 113.2 97.1 102.9 103.8 149.0 100.0 93.6 97.5 100.5 101.8 105.7 105.6 102.6 103.4 112.0 138.0 187.62012 .. .. .. .. .. 99.9 95.6 .. .. .. .. .. .. .. .. .. ..
Percentage increase on a year earlier
2003 2.2 0.4 3.3 1.4 2.4 1.5 0.5 −0.3 3.5 0.8 5.2 −0.4 2.9 1.8 3.4 0.3 3.32004 2.1 3.1 3.8 3.1 −0.2 2.3 3.6 3.2 2.2 5.2 3.8 0.9 5.3 3.2 −0.7 1.7 −1.12005 −0.3 2.7 −3.0 −3.2 1.4 1.4 0.8 5.3 −3.6 −4.5 −1.4 −3.3 −3.6 −2.7 −1.4 −1.0 4.32006 2.9 −1.7 5.5 4.6 3.0 −1.7 −1.5 −1.8 7.4 7.2 2.7 5.4 5.6 3.2 4.8 1.1 3.32007 3.8 3.1 4.3 6.0 2.4 2.7 3.5 3.1 0.6 2.2 8.9 6.3 4.5 7.0 6.4 5.5 −1.2
2008 −2.7 1.3 −1.5 −4.3 −4.1 1.2 3.4 −0.3 −2.2 1.1 −2.9 −4.4 −3.7 −4.6 −5.7 −2.9 −4.0
2009 1.8−3.1 2.4 3.3 2.7
−2.9
−5.9
−0.9 2.8 1.6 2.6 2.4 2.8 4.5 6.2 3.7 0.52010 7.0 9.4 8.4 7.2 4.3 6.6 11.7 9.9 6.0 8.6 10.1 6.5 7.5 7.6 4.0 2.6 5.6
2011 4.0 5.6 3.0 3.2 4.3 11.1 4.4 2.4 6.3 1.8 1.4 3.8 2.2 3.4 2.7 0.9 7.22012 .. .. .. .. .. −0.2 2.1 .. .. .. .. .. .. .. .. .. ..
Non Specialised Predominantly Non-food Stores, Large Businesses (£22,199m)
2003 91.1 75.4 77.8 81.8 129.3 78.2 72.8 75.4 78.5 76.4 78.2 85.3 79.7 80.8 92.9 122.2 164.22004 93.6 79.7 82.0 84.2 128.7 81.6 77.3 80.0 81.8 81.9 82.4 86.5 83.8 82.6 92.0 123.7 161.92005 93.9 82.2 80.2 82.5 130.8 83.7 78.3 84.3 79.3 78.8 82.0 84.1 82.3 81.2 91.5 122.6 168.72006 97.3 81.3 85.1 87.0 135.9 83.2 78.2 82.4 85.6 84.9 84.8 89.0 87.8 84.7 95.8 125.0 176.72007 100.9 84.2 88.6 92.3 138.5 85.7 80.7 85.9 86.0 87.0 91.9 94.8 91.5 90.9 102.3 131.4 173.1
2008 100.0 85.6 89.0 91.0 135.6 86.6 83.6 86.0 85.4 89.6 91.5 92.6 91.1 89.5 99.5 129.8 169.12009 98.7 81.8 88.9 90.0 134.3 82.2 78.2 84.4 87.0 88.0 91.1 91.7 88.7 89.6 101.2 128.7 165.12010 108.9 92.5 98.9 99.9 144.4 90.4 90.1 96.0 93.5 99.0 103.2 101.6 98.6 99.7 109.1 137.4 178.22011 112.6 96.0 102.2 102.6 149.7 99.6 91.9 96.5 99.4 100.0 106.2 104.4 101.2 102.2 110.9 137.8 190.32012 .. .. .. .. .. 98.5 93.8 .. .. .. .. .. .. .. .. .. ..
Percentage increase on a year earlier
2003 3.8 0.3 4.7 3.9 4.7 1.3 0.6 −0.2 3.7 1.7 7.9 1.9 5.0 4.8 6.6 1.8 5.62004 2.8 5.6 5.5 2.9 −0.5 4.4 6.2 6.1 4.2 7.1 5.3 1.5 5.1 2.3 −1.0 1.3 −1.42005 0.3 3.2 −2.3 −2.0 1.6 2.5 1.2 5.4 −3.1 −3.8 −0.5 −2.7 −1.7 −1.7 −0.6 −0.9 4.22006 3.6 −1.1 6.1 5.5 3.9 −0.6 −0.1 −2.2 7.9 7.7 3.5 5.8 6.6 4.3 4.7 2.0 4.72007 3.7 3.5 4.1 6.1 1.9 3.1 3.1 4.2 0.5 2.5 8.4 6.5 4.2 7.3 6.8 5.1 −2.0
2008 −0.9 1.6 0.5 −1.4 −2.1 1.1 3.6 0.2 −0.7 3.0 −0.5 −2.3 −0.5 −1.5 −2.7 −1.2 −2.32009 −1.3 −4.4 −0.2 −1.1 −1.0 −5.2 −6.5 −2.0 1.8 −1.8 −0.4 −1.0 −2.6 0.1 1.7 −0.8 −2.42010 10.4 13.1 11.3 11.1 7.6 10.1 15.2 13.8 7.5 12.5 13.3 10.8 11.2 11.3 7.8 6.7 8.02011 3.4 3.9 3.3 2.6 3.7 10.2 2.0 0.5 6.3 1.0 2.9 2.8 2.7 2.5 1.7 0.3 6.82012 .. .. .. .. .. −1.1 2.0 .. .. .. .. .. .. .. .. .. ..
Non Specialised Predominantly Non-food Stores, Small Businesses (£1,841m)
2003 136.6 132.0 140.8 132.9 140.8 129.0 133.7 133.0 142.0 141.6 139.3 137.1 138.9 124.9 130.8 137.1 151.72004 131.8 112.9 129.7 139.4 145.2 112.2 115.3 111.6 126.4 131.5 131.0 132.9 148.1 137.8 133.2 144.7 155.1
2005 124.3 111.0 118.5 123.6 143.9 102.9 112.3 116.5 116.5 118.6 120.1 122.8 124.1 123.7 121.9 141.2 163.72006 119.3 103.5 119.2 120.7 134.0 90.5 97.1 119.0 120.2 122.3 116.0 125.2 120.4 117.3 129.3 130.2 140.72007 125.2 102.5 125.8 126.8 145.8 89.5 104.6 111.4 122.0 122.2 131.6 130.7 128.7 122.1 133.2 143.5 157.7
2008 100.0 100.7 103.0 89.8 106.5 91.5 106.3 105.3 104.5 103.5 101.3 100.9 88.0 82.4 89.2 113.2 115.02009 138.8 111.2 132.5 140.9 170.7 112.4 105.3 115.1 117.5 141.5 137.4 141.7 149.6 133.2 148.9 187.9 174.22010 108.1 85.4 112.5 109.3 125.2 85.4 84.5 86.1 108.4 112.2 115.9 104.2 122.2 102.9 108.2 128.8 136.02011 120.3 109.8 111.6 119.1 140.7 105.2 114.3 109.9 115.0 123.1 99.8 120.5 119.5 117.6 124.3 139.5 154.82012 .. .. .. .. .. 116.7 117.5 .. .. .. .. .. .. .. .. .. ..
Percentage increase on a year earlier
2003 −9.2 1.0 −4.8 −14.0 −17.4 3.3 − −0.8 2.3 −4.9 −9.7 −15.1 −9.8 −16.7 −17.8 −13.6 −19.72004 −3.5 −14.4 −7.9 4.9 3.1 −13.1 −13.8 −16.1 −11.0 −7.1 −6.0 −3.0 6.6 10.4 1.8 5.6 2.22005 −5.7 −1.7 −8.6 −11.4 −0.9 −8.3 −2.6 4.4 −7.8 −9.8 −8.3 −7.6 −16.2 −10.2 −8.5 −2.4 5.62006 −4.0 −6.8 0.6 −2.3 −6.9 −12.1 −13.5 2.1 3.1 3.1 −3.4 1.9 −3.0 −5.2 6.1 −7.8 −14.12007 4.9 −0.9 5.5 5.1 8.8 −1.1 7.7 −6.4 1.5 −0.1 13.5 4.3 7 .0 4 .1 3 .0 10.2 12.1
2008 −20.1 −1.8 −18.1 −29.2 −26.9 2.2 1.7 −5.5 −14.3 −15.3 −23.0 −22.8 −31.7 −32.6 −33.0 −21.1 −27.02009 38.8 10.5 28.7 56.9 60.2 22.9 −1.0 9.3 12.4 36.7 35.6 40.4 70.1 61.7 67.0 66.1 51.42010 −22.1 −23.2 −15.1 −22.4 −26.6 −24.1 −19.7 −25.2 −7.8 −20.7 −15.6 −26.4 −18.3 −22.7 −27.4 −31.5 −21.92011 11.3 28.6
−0.8 9.0 12.4 23.2 35.2 27.7 6.1 9.7
−13.9 15.6
−2.2 14.2 14.9 8.3 13.8
2012 .. .. .. .. .. 10.9 2.8 .. .. .. .. .. .. .. .. .. ..
The monthly periods consist of 4 weeks except for March, June, Septemberand December which are 5 weeks. Januar y 2008 is also a 5 week period.

8/2/2019 Ons Retail Report
http://slidepdf.com/reader/full/ons-retail-report 48/84
7VALUE OF RETAIL SALES AT CURRENT PRICESNON-SEASONALLY ADJUSTEDIndex numbers of sales per week and percentage increase on a year earliercontinued Index 2008=100
Year 1st Qtr 2nd Qtr 3rd Qtr 4th Qtr Jan Feb Mar Apr May June July Aug Sept Oct Nov Dec
SIC 2007 (SALES IN 2008)
Te xtile, Clothing, Footwear & Leather, All Businesses (£38,767m)
2003 88.0 73.3 82.5 85.4 110.8 73.5 70.1 75.7 81.8 81.1 84.1 89.9 81.4 85.2 92.5 100.7 133.52004 92.5 77.4 88.2 89.1 115.4 79.0 72.9 79.7 86.4 89.3 88.7 91.5 86.9 88.9 97.3 105.9 137.42005 93.3 78.7 88.4 89.1 117.0 78.6 75.5 81.4 85.1 88.4 90.9 92.9 86.1 88.5 94.5 108.4 141.82006 97.6 79.5 92.3 93.6 124.9 79.4 75.9 82.4 89.3 93.7 93.5 98.4 91.2 91.8 102.5 113.5 152.02007 100.3 83.4 96.5 97.3 123.8 80.2 80.7 88.2 98.2 95.3 96.2 99.3 94.1 98.4 102.2 111.3 151.0
2008 100.0 84.7 95.7 98.4 122.4 82.8 83.4 87.6 89.3 103.1 95.0 100.6 97.7 97.2 102.8 112.4 145.92009 101.2 85.8 96.6 98.3 124.0 86.4 81.3 88.9 95.8 94.7 98.8 102.6 94.6 97.8 106.1 112.4 147.62010 106.7 90.1 101.6 104.3 130.7 88.7 86.7 93.8 101.8 100.5 102.5 107.5 100.4 104.8 112.5 120.6 153.22011 110.8 92.3 106.2 106.6 138.1 92.9 89.0 94.5 108.3 103.8 106.5 111.1 102.6 106.1 114.1 123.0 169.52012 .. .. .. .. .. 96.3 90.5 .. .. .. .. .. .. .. .. .. ..
Percentage increase on a year earlier
2003 3.7 3.5 4.4 4.6 1.6 3.4 4.0 3.3 3.0 3.3 6.4 4.3 0.6 8.1 4.0 2.3 −0.12004 5.1 5.6 6.9 4.3 4.1 7.4 4.0 5.3 5.6 10.2 5.4 1.8 6.8 4.4 5.1 5.2 2.92005 0.9 1.7 0.2 − 1.4 −0.4 3.5 2.2 −1.5 −1.0 2.5 1.5 −0.9 −0.5 −2.8 2.4 3.22006 4.6 0.9 4.4 5.1 6.8 1.0 0.5 1.2 4.9 6.0 2.9 5.9 5.9 3.7 8.4 4.7 7.22007 2.8 5.0 4.6 4.0 −0.9 1.0 6.4 7.1 9.9 1.7 2.9 0.9 3.2 7.2 −0.3 −2.0 −0.7
2008 −0.3 1.5 −0.8 1.1 −1.1 3.2 3.3 −0.7 −9.1 8.3 −1.2 1.3 3.8 −1.2 0.6 1.1 −3.4
2009 1.2 1.3 0.9−0.1 1.4 4.3
−2.6 1.4 7.3
−8.1 4.0 2.0
−3.2 0.6 3.2
−1.12010 5.4 5.0 5.2 6.1 5.4 2.7 6.7 5.6 6.3 6.1 3.7 4.7 6.2 7.2 6.0 7.3 3.8
2011 3.9 2.5 4.5 2.2 5.7 4.8 2.6 0.7 6.4 3.3 4.0 3.4 2.1 1.3 1.4 2.0 10.62012 .. .. .. .. .. 3.7 1.7 .. .. .. .. .. .. .. .. .. ..
Te xtile, Clothing, Footwear & Leather, Large Businesses (£33,045m)
2003 84.7 69.9 78.7 80.6 109.8 70.3 66.5 72.3 77.7 77.6 80.3 85.8 76.1 79.9 88.8 99.3 134.92004 89.6 74.5 84.6 85.2 114.1 76.9 70.0 76.2 82.9 85.8 85.1 88.0 82.0 85.6 93.8 104.5 137.92005 91.6 76.4 86.3 86.3 117.3 76.3 72.5 79.6 82.9 86.6 88.9 91.1 82.8 85.2 92.4 109.3 143.52006 95.7 76.8 90.0 90.9 125.1 76.9 73.6 79.3 87.1 91.5 91.1 96.3 87.8 89.1 100.0 113.7 154.42007 99.5 82.0 95.0 95.8 125.1 79.1 79.0 86.7 96.4 93.9 94.8 97.5 91.6 97.9 101.8 112.1 154.1
2008 100.0 84.3 95.4 97.3 124.2 82.6 82.6 87.5 87.8 103.8 94.9 100.4 96.3 95.7 102.4 114.3 149.52009 102.0 85.2 96.7 98.1 128.2 85.6 80.2 88.9 96.0 94.8 98.8 101.7 94.0 98.4 107.5 115.4 154.92010 109.0 91.8 103.9 105.6 134.8 90.7 88.1 95.8 103.5 102.8 105.0 108.5 101.9 106.3 113.8 124.3 160.02011 113.7 94.0 108.4 108.9 143.6 94.8 90.2 96.3 110.7 105.7 108.8 114.2 104.8 108.0 117.5 127.0 177.72012 .. .. .. .. .. 98.3 92.5 .. .. .. .. .. .. .. .. .. ..
Percentage increase on a year earlier
2003 4.8 5.7 4.9 5.2 2.8 6.6 6.6 4.2 2.6 3.6 7.8 5.8 1.5 7.6 3.2 3.6 2.12004 5.8 6.6 7.6 5.8 3.9 9.4 5.2 5.4 6.8 10.6 5.9 2.6 7.7 7.0 5.7 5.2 2.22005 2.2 2.6 2.0 1.2 2.8 −0.8 3.6 4.5 − 1.0 4.5 3.5 0.9 −0.4 −1.6 4.6 4.12006 4.5 0.5 4.2 5.4 6.7 0.8 1.5 −0.4 5.0 5.7 2.5 5.8 6.1 4.5 8.3 4.0 7.62007 3.9 6.8 5.6 5.4 − 2.9 7.3 9.4 10.7 2.6 4.0 1.2 4.3 9.9 1.8 −1.4 −0.2
2008 0.5 2.8 0.5 1.5 −0.8 4.3 4.6 0.8 −8.9 10.5 0.1 3.0 5.1 −2.3 0.5 1.9 −3.02009 2.0 1.1 1.4 0.8 3.2 3.7 −2.9 1.7 9.3 −8.6 4.2 1.3 −2.4 2.8 5.1 1.0 3.62010 6.8 7.8 7.4 7.7 5.2 5.9 9.9 7.7 7.9 8.4 6.2 6.6 8.4 8.0 5.8 7.6 3.32011 4.3 2.3 4.4 3.2 6.6 4.6 2.3 0.6 6.9 2.9 3.6 5.2 2.9 1.7 3.3 2.2 11.12012 .. .. .. .. .. 3.6 2.6 .. .. .. .. .. .. .. .. .. ..
Te xtile, Clothing, Footwear & Leather, Small Businesses (£5,722m)
2003 106.9 93.2 104.5 113.6 116.6 92.1 91.1 95.6 105.9 101.2 105.9 113.4 111.6 115.4 114.0 108.7 124.92004 109.3 94.2 108.8 111.3 122.8 91.0 90.1 100.0 106.7 110.0 109.5 111.5 115.0 108.2 117.0 114.0 134.5
2005 103.3 92.2 100.0 105.4 115.5 92.2 92.6 91.8 98.0 99.0 102.5 103.2 105.2 107.3 107.0 103.3 131.92006 108.3 94.9 105.5 109.2 123.8 94.0 89.1 100.2 102.4 106.3 107.3 110.0 110.6 107.4 117.0 112.7 138.32007 104.8 91.8 105.3 106.1 116.1 86.3 91.0 96.7 108.6 103.2 104.4 109.4 108.6 101.4 104.3 106.3 133.3
2008 100.0 86.9 97.6 104.5 111.9 84.1 88.4 88.5 97.9 99.5 96.0 101.3 105.8 106.1 105.2 101.9 125.32009 96.1 88.8 96.1 99.6 100.0 90.8 87.5 88.4 94.8 94.4 98.5 107.8 98.0 94.3 97.7 95.2 105.62010 93.0 79.7 88.8 96.5 107.0 77.1 78.5 82.7 91.6 87.4 87.8 101.5 92.1 96.2 105.0 99.8 114.42011 93.9 82.7 93.5 92.8 106.6 81.8 82.0 83.9 94.1 92.7 93.5 93.2 89.5 95.2 94.2 99.9 121.92012 .. .. .. .. .. 85.2 79.1 .. .. .. .. .. .. .. .. .. ..
Percentage increase on a year earlier
2003 −1.1 −4.8 2.3 2.2 −4.5 −8.6 −5.7 −0.3 4.7 2.0 0.7 −1.7 −2.9 10.1 7.8 −4.1 −12.02004 2.2 1.1 4.1 −2.0 5.3 −1.2 −1.2 4.7 0.7 8.7 3.4 −1.6 3.1 −6.3 2.6 4.9 7.62005 −5.5 −2.1 −8.0 −5.3 −6.0 1.3 2.8 −8.2 −8.2 −10.0 −6.4 −7.4 −8.5 −0.8 −8.5 −9.4 −1.92006 4.9 2.9 5.4 3.6 7.3 1.9 −3.8 9.1 4.5 7.4 4.6 6.6 5.2 0.1 9.3 9.1 4.82007 −3.3 −3.3 −0.1 −2.9 −6.3 −8.2 2.1 −3.5 6.1 −2.9 −2.7 −0.6 −1.8 −5.6 −10.9 −5.6 −3.6
2008 −4.6 −5.3 −7.3 −1.4 −3.6 −2.5 −2.9 −8.5 −9.9 −3.6 −8.1 −7.3 −2.6 4.6 0.9 −4.1 −6.02009 −3.9 2.2 −1.6 −4.7 −10.7 8.0 −1.1 −0.1 −3.1 −5.1 2.7 6.3 −7.4 −11.1 −7.1 −6.6 −15.72010 −3.2 −10.3 −7.6 −3.1 7.0 −15.0 −10.2 −6.4 −3.3 −7.4 −11.0 −5.8 −6.0 2.0 7.4 4.8 8.32011 0.9 3.7 5.2
−3.8
−0.4 6.1 4.4 1.4 2.7 6.1 6.6
−8.1
−2.8
−1.0
−10.2 0.1 6.6
2012 .. .. .. .. .. 4.2 −3.6 .. .. .. .. .. .. .. .. .. ..
The monthly periods consist of 4 weeks except for March, June, Septemberand December which are 5 weeks. Januar y 2008 is also a 5 week period.
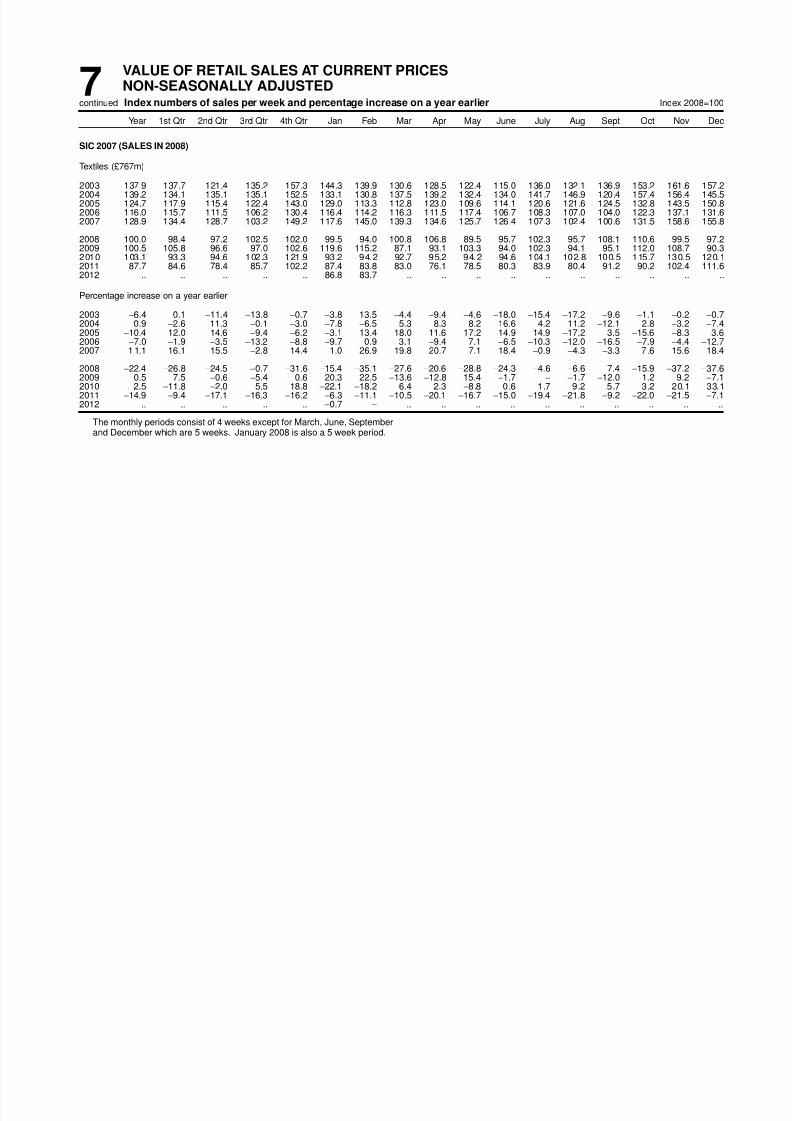
8/2/2019 Ons Retail Report
http://slidepdf.com/reader/full/ons-retail-report 49/84
7VALUE OF RETAIL SALES AT CURRENT PRICESNON-SEASONALLY ADJUSTEDIndex numbers of sales per week and percentage increase on a year earliercontinued Index 2008=100
Year 1st Qtr 2nd Qtr 3rd Qtr 4th Qtr Jan Feb Mar Apr May June July Aug Sept Oct Nov Dec
SIC 2007 (SALES IN 2008)
Te xtiles (£767m)
2003 137.9 137.7 121.4 135.2 157.3 144.3 139.9 130.6 128.5 122.4 115.0 136.0 132.1 136.9 153.2 161.6 157.22004 139.2 134.1 135.1 135.1 152.5 133.1 130.8 137.5 139.2 132.4 134.0 141.7 146.9 120.4 157.4 156.4 145.52005 124.7 117.9 115.4 122.4 143.0 129.0 113.3 112.8 123.0 109.6 114.1 120.6 121.6 124.5 132.8 143.5 150.82006 116.0 115.7 111.5 106.2 130.4 116.4 114.2 116.3 111.5 117.4 106.7 108.3 107.0 104.0 122.3 137.1 131.62007 128.9 134.4 128.7 103.2 149.2 117.6 145.0 139.3 134.6 125.7 126.4 107.3 102.4 100.6 131.5 158.6 155.8
2008 100.0 98.4 97.2 102.5 102.0 99.5 94.0 100.8 106.8 89.5 95.7 102.3 95.7 108.1 110.6 99.5 97.22009 100.5 105.8 96.6 97.0 102.6 119.6 115.2 87.1 93.1 103.3 94.0 102.3 94.1 95.1 112.0 108.7 90.32010 103.1 93.3 94.6 102.3 121.9 93.2 94.2 92.7 95.2 94.2 94.6 104.1 102.8 100.5 115.7 130.5 120.12011 87.7 84.6 78.4 85.7 102.2 87.4 83.8 83.0 76.1 78.5 80.3 83.9 80.4 91.2 90.2 102.4 111.62012 .. .. .. .. .. 86.8 83.7 .. .. .. .. .. .. .. .. .. ..
Percentage increase on a year earlier
2003 −6.4 0.1 −11.4 −13.8 −0.7 −3.8 13.5 −4.4 −9.4 −4.6 −18.0 −15.4 −17.2 −9.6 −1.1 −0.2 −0.72004 0.9 −2.6 11.3 −0.1 −3.0 −7.8 −6.5 5.3 8.3 8.2 16.6 4.2 11.2 −12.1 2.8 −3.2 −7.42005 −10.4 −12.0 −14.6 −9.4 −6.2 −3.1 −13.4 −18.0 −11.6 −17.2 −14.9 −14.9 −17.2 3.5 −15.6 −8.3 3.62006 −7.0 −1.9 −3.5 −13.2 −8.8 −9.7 0.9 3.1 −9.4 7.1 −6.5 −10.3 −12.0 −16.5 −7.9 −4.4 −12.72007 1 1.1 16.1 15.5 −2.8 14.4 1.0 26.9 19.8 20.7 7.1 18.4 −0.9 −4.3 −3.3 7 .6 15.6 18.4
2008 −22.4 −26.8 −24.5 −0.7 −31.6 −15.4 −35.1 −27.6 −20.6 −28.8 −24.3 −4.6 −6.6 7.4 −15.9 −37.2 −37.6
2009 0.5 7.5−0.6
−5.4 0.6 20.3 22.5
−13.6
−12.8 15.4
−1.7
− −1.7
−12.0 1.2 9.2
−7.12010 2.5 −11.8 −2.0 5.5 18.8 −22.1 −18.2 6.4 2.3 −8.8 0.6 1.7 9.2 5.7 3.2 20.1 33.1
2011 −14.9 −9.4 −17.1 −16.3 −16.2 −6.3 −11.1 −10.5 −20.1 −16.7 −15.0 −19.4 −21.8 −9.2 −22.0 −21.5 −7.12012 .. .. .. .. .. −0.7 − .. .. .. .. .. .. .. .. .. ..
The monthly periods consist of 4 weeks except for March, June, Septemberand December which are 5 weeks. Januar y 2008 is also a 5 week period.

8/2/2019 Ons Retail Report
http://slidepdf.com/reader/full/ons-retail-report 50/84
7VALUE OF RETAIL SALES AT CURRENT PRICESNON-SEASONALLY ADJUSTEDIndex numbers of sales per week and percentage increase on a year earliercontinued Index 2008=100
Year 1st Qtr 2nd Qtr 3rd Qtr 4th Qtr Jan Feb Mar Apr May June July Aug Sept Oct Nov Dec
SIC 2007 (SALES IN 2008)
Clothing, All Businesses (£33,990m)
2003 86.4 72.1 80.4 82.7 110.4 72.2 69.0 74.4 79.6 79.4 81.8 87.4 78.2 82.5 90.5 100.5 134.22004 91.0 76.4 86.1 86.8 114.9 77.8 72.2 78.6 84.6 87.3 86.2 89.4 84.1 86.9 95.1 105.7 138.22005 92.1 77.2 87.0 87.0 117.1 76.1 73.7 80.8 83.8 87.0 89.5 91.4 83.7 86.2 93.0 108.4 143.22006 97.4 79.0 91.5 92.9 126.4 78.1 75.6 82.5 88.6 92.6 92.8 98.0 90.3 90.9 102.0 115.1 155.02007 99.9 83.0 95.3 96.4 124.9 79.2 80.3 88.3 96.5 94.2 95.1 98.7 92.3 98.0 101.7 112.0 153.7
2008 100.0 84.7 95.3 97.3 123.8 82.1 83.8 88.1 88.7 103.2 94.3 100.1 95.6 96.4 102.8 114.0 148.62009 101.1 85.5 95.7 97.7 125.6 85.4 80.6 89.5 94.3 93.7 98.3 102.5 93.1 97.5 105.8 113.7 150.92010 106.4 90.4 101.3 102.9 130.8 88.4 87.1 94.7 101.5 100.2 101.9 106.8 98.4 103.5 111.6 120.6 154.42011 111.3 92.9 106.7 106.2 139.2 92.6 89.8 95.8 108.8 104.5 106.7 111.0 102.0 105.7 114.2 123.7 171.62012 .. .. .. .. .. 95.7 90.6 .. .. .. .. .. .. .. .. .. ..
Percentage increase on a year earlier
2003 3.4 3.4 4.2 4.9 0.8 4.3 3.8 2.3 1.5 3.6 7.0 4.9 1.3 7.8 3.3 2.1 −1.12004 5.4 6.0 7.1 5.0 4.1 7.7 4.6 5.6 6.4 10.0 5.4 2.3 7.6 5.4 5.0 5.2 3.02005 1.1 1.0 1.1 0.3 1.8 −2.2 2.1 2.7 −1.0 −0.3 3.8 2.2 −0.4 −0.8 −2.1 2.5 3.62006 5.9 2.4 5.2 6.7 8.0 2.7 2.5 2.2 5.8 6.5 3.7 7.3 7.8 5.4 9.7 6.2 8.22007 2.5 5.1 4.2 3.8 −1.2 1.3 6.2 7.1 8.9 1.7 2.5 0.7 2.2 7.8 −0.3 −2.7 −0.8
2008 0.1 2.0 − 0.9 −0.8 3.7 4.4 −0.3 −8.1 9.6 −0.9 1.5 3.6 −1.6 1.1 1.8 −3.3
2009 1.1 0.9 0.4 0.4 1.4 4.0−3.9 1.6 6.4
−9.2 4.3 2.4
−2.5 1.1 3.0
−0.2 1.62010 5.2 5.8 5.8 5.4 4.2 3.5 8.1 5.9 7.6 6.9 3.6 4.1 5.6 6.1 5.5 6.0 2.3
2011 4.6 2.8 5.3 3.2 6.4 4.7 3.1 1.1 7.2 4.2 4.7 4.0 3.6 2.1 2.3 2.6 11.22012 .. .. .. .. .. 3.4 0.9 .. .. .. .. .. .. .. .. .. ..
Clothing, Large Businesses (£29,958m)
2003 84.0 69.2 77.3 79.2 110.3 69.5 66.0 71.6 76.2 76.6 78.8 84.7 74.0 78.9 88.1 100.0 136.22004 88.8 73.9 83.3 83.5 114.4 76.0 69.5 75.8 81.7 84.6 83.6 86.5 79.7 84.1 92.7 105.1 139.12005 90.6 75.5 85.2 84.6 117.1 74.3 71.9 79.3 81.9 85.6 87.5 89.7 80.7 83.6 90.9 109.2 144.42006 95.0 76.2 88.9 89.4 125.5 75.4 73.2 79.1 85.9 90.4 90.0 94.9 86.2 87.7 98.9 114.1 155.82007 98.7 81.6 93.7 94.1 125.3 77.9 78.8 86.8 95.0 92.7 93.4 96.2 89.0 96.6 100.9 112.4 155.1
2008 100.0 84.4 95.0 96.4 125.4 81.9 83.0 87.9 87.6 103.8 93.9 99.8 94.3 95.2 102.6 116.0 151.32009 101.8 85.3 96.1 97.1 128.7 85.1 80.2 89.5 95.3 94.4 98.1 101.2 92.3 97.8 107.0 116.1 156.12010 108.9 92.2 103.7 104.7 135.0 90.2 88.5 96.7 103.5 102.9 104.6 108.1 100.4 105.3 113.3 124.6 160.92011 113.6 94.4 108.0 108.0 143.9 94.5 90.7 97.4 110.3 105.7 107.9 113.2 103.5 107.3 117.1 127.6 178.42012 .. .. .. .. .. 97.5 92.5 .. .. .. .. .. .. .. .. .. ..
Percentage increase on a year earlier
2003 4.6 5.6 4.5 5.5 2.5 7.1 6.4 3.6 1.7 3.5 7.5 6.1 1.7 7.9 3.0 3.7 1.62004 5.7 6.8 7.8 5.4 3.7 9.4 5.3 5.8 7.2 10.4 6.1 2.1 7.7 6.6 5.1 5.0 2.12005 2.1 2.1 2.2 1.4 2.4 −2.2 3.4 4.6 0.3 1.2 4.6 3.8 1.3 −0.6 −1.9 3.9 3.82006 4.8 0.9 4.3 5.7 7.1 1.4 1.9 −0.2 4.9 5.6 2.8 5.7 6.7 4.9 8.8 4.5 7.92007 3.9 7.1 5.4 5.3 −0.2 3.3 7.6 9.6 10.5 2.5 3.9 1.4 3.3 10.1 1.9 −1.5 −0.5
2008 1.3 3.4 1.4 2.4 0.1 5.1 5.3 1.3 −7.8 12.0 0.5 3.8 6.0 −1.4 1.7 3.2 −2.42009 1.8 1.1 1.1 0.8 2.6 3.9 −3.4 1.8 8.9 −9.1 4.4 1.4 −2.2 2.7 4.3 0.1 3.22010 7.0 8.1 7.9 7.8 4.9 6.0 10.4 8.1 8.6 9.0 6.6 6.8 8.8 7.8 5.9 7.3 3.02011 4.3 2.4 4.1 3.1 6.6 4.7 2.4 0.6 6.6 2.7 3.2 4.7 3.1 1.8 3.4 2.5 10.92012 .. .. .. .. .. 3.1 2.0 .. .. .. .. .. .. .. .. .. ..
Clothing, Small Businesses (£4,032m)
2003 104.0 93.4 102.9 108.6 111.1 92.5 91.7 95.5 104.3 99.8 104.2 107.2 109.1 109.2 108.3 103.7 119.32004 108.0 94.9 106.3 111.5 119.2 91.4 92.7 99.5 106.3 107.4 105.4 110.9 117.0 107.5 112.8 110.5 131.2
2005 102.8 89.7 100.1 104.9 116.6 89.1 87.8 91.6 97.5 97.6 104.2 103.5 105.9 105.2 108.8 102.3 134.32006 115.7 100.4 110.7 118.4 133.3 98.7 93.3 107.5 108.5 109.1 113.7 121.4 120.7 114.1 124.8 122.7 148.62007 109.0 93.8 107.0 113.4 121.7 88.7 91.3 99.9 107.8 105.2 107.7 117.2 116.2 108.0 107.7 109.3 142.8
2008 100.0 87.5 97.4 104.2 111.8 83.8 90.1 89.2 97.0 98.6 96.7 102.5 104.7 105.3 104.2 99.3 128.02009 96.0 87.0 92.6 101.9 102.5 87.9 83.5 89.0 86.8 88.6 100.5 112.1 99.5 95.8 97.4 96.0 111.72010 87.4 77.0 83.0 90.1 99.5 74.7 76.3 79.4 86.7 80.5 82.1 96.5 83.8 89.9 99.5 91.1 106.32011 94.0 81.8 96.9 93.1 104.3 78.0 82.8 84.0 97.4 95.4 97.7 94.6 90.6 94.0 92.6 94.9 121.32012 .. .. .. .. .. 82.2 76.2 .. .. .. .. .. .. .. .. .. ..
Percentage increase on a year earlier
2003 −3.4 −7.3 2.6 1.7 −10.0 −8.9 −8.6 −4.8 − 3.9 3.8 −2.0 −0.9 7.2 4.6 −8.0 −19.42004 3.8 1.6 3.3 2.7 7.2 −1.2 1.0 4.2 1.9 7.6 1.1 3.4 7.2 −1.5 4.2 6.5 10.02005 −4.8 −5.5 −5.8 −5.9 −2.1 −2.5 −5.3 −7.9 −8.3 −9.1 −1.1 −6.6 −9.4 −2.2 −3.5 −7.4 2.42006 12.5 12.0 10.5 12.8 14.3 10.8 6.3 17.3 11.3 11.8 9.1 17.2 13.9 8.5 14.7 20.0 10.62007 −5.8 −6.6 −3.4 −4.2 −8.7 −10.1 −2.1 −7.1 −0.7 −3.6 −5.2 −3.4 −3.7 −5.4 −13.7 −10.9 −3.9
2008 −8.2 −6.7 −9.0 −8.1 −8.1 −5.6 −1.4 −10.8 −10.0 −6.2 −10.2 −12.6 −9.9 −2.5 −3.2 −9.2 −10.42009 −4.0 −0.6 −4.9 −2.2 −8.4 5.0 −7.3 −0.2 −10.5 −10.2 3.9 9.4 −5.0 −9.0 −6.6 −3.3 −12.72010 −9.0 −11.5 −10.3 −11.6 −2.9 −15.1 −8.7 −10.9 −0.1 −9.1 −18.3 −13.9 −15.8 −6.1 2.2 −5.2 −4.82011 7.6 6.3 16.7 3.4 4.8 4.5 8.5 5.8 12.4 18.5 18.9
−1.9 8.2 4.5
−6.9 4.2 14.1
2012 .. .. .. .. .. 5.4 −7.9 .. .. .. .. .. .. .. .. .. ..
The monthly periods consist of 4 weeks except for March, June, Septemberand December which are 5 weeks. Januar y 2008 is also a 5 week period.

8/2/2019 Ons Retail Report
http://slidepdf.com/reader/full/ons-retail-report 51/84
7VALUE OF RETAIL SALES AT CURRENT PRICESNON-SEASONALLY ADJUSTEDIndex numbers of sales per week and percentage increase on a year earliercontinued Index 2008=100
Year 1st Qtr 2nd Qtr 3rd Qtr 4th Qtr Jan Feb Mar Apr May June July Aug Sept Oct Nov Dec
SIC 2007 (SALES IN 2008)
Footwear and Leather Goods (£4,010m)
2003 92.2 71.3 92.9 99.5 105.1 70.8 66.2 75.8 92.4 87.6 97.7 101.9 98.8 98.0 97.9 90.8 122.42004 95.9 75.0 97.3 99.5 111.9 78.2 67.9 78.0 91.6 98.6 100.8 99.8 99.2 99.6 104.4 98.0 129.02005 97.8 84.6 95.0 100.2 111.5 90.5 83.0 81.2 89.4 96.3 98.5 100.3 99.3 100.9 100.0 102.0 128.22006 95.1 76.1 95.5 97.4 111.5 83.0 70.7 74.9 91.0 98.1 96.9 99.3 96.0 97.0 102.8 95.5 131.22007 97.9 77.1 100.9 104.0 109.6 81.6 72.2 77.3 105.4 98.4 99.3 102.7 108.4 101.5 100.8 95.8 127.8
2008 100.0 81.8 99.2 106.8 113.6 85.3 78.2 81.1 90.8 104.9 101.3 103.9 116.1 101.6 101.4 101.8 132.92009 101.7 84.3 104.5 103.3 114.6 87.9 80.8 84.2 108.7 101.7 103.6 103.5 106.9 100.2 107.0 102.2 130.62010 109.8 86.4 106.2 115.7 131.0 90.3 82.2 86.8 105.4 103.9 108.6 113.9 117.0 116.1 119.0 119.3 149.92011 111.4 88.6 107.7 113.6 135.7 97.0 83.4 86.0 109.6 102.8 110.1 116.5 112.0 112.4 117.5 121.0 162.12012 .. .. .. .. .. 103.8 91.1 .. .. .. .. .. .. .. .. .. ..
Percentage increase on a year earlier
2003 9.3 6.2 10.7 8.5 9.3 −0.7 2.8 16.3 20.5 3.5 9.5 6.8 1.6 16.4 11.8 5.6 10.02004 4.0 5.1 4.7 0.1 6.4 10.5 2.5 2.9 −0.8 12.5 3.2 −2.1 0.4 1.6 6.6 7.9 5.42005 2.0 12.9 −2.3 0.7 −0.4 15.7 22.3 4.0 −2.5 −2.3 −2.3 0.6 0.1 1.3 −4.2 4.1 −0.62006 −2.8 −10.0 0.5 −2.8 − −8.2 −14.7 −7.7 1.9 1.9 −1.5 −1.0 −3.4 −3.8 2.8 −6.4 2.32007 2.9 1.3 5.7 6.8 −1.6 −1.7 2.1 3.2 15.8 0.2 2.4 3.4 13.0 4.7 −1.9 0.3 −2.6
2008 2.1 6.1 −1.7 2.7 3.6 4.5 8.3 4.8 −13.8 6.6 2.0 1.2 7.1 0.1 0.6 6.3 4.0
2009 1.7 3.1 5.4−3.3 0.9 3.1 3.4 3.9 19.6
−3.1 2.2
−0.4
−7.9
−1.4 5.6 0.4
−1.72010 8.0 2.5 1.5 12.0 14.3 2.7 1.6 3.1 −3.0 2.2 4.8 10.1 9.4 15.9 11.2 16.7 14.7
2011 1.4 2.5 1.5 −1.9 3.6 7.5 1.6 −1.0 4.0 −1.0 1.4 2.3 −4.3 −3.2 −1.3 1.5 8.12012 .. .. .. .. .. 7.0 9.2 .. .. .. .. .. .. .. .. .. ..
The monthly periods consist of 4 weeks except for March, June, Septemberand December which are 5 weeks. Januar y 2008 is also a 5 week period.

8/2/2019 Ons Retail Report
http://slidepdf.com/reader/full/ons-retail-report 52/84
7VALUE OF RETAIL SALES AT CURRENT PRICESNON-SEASONALLY ADJUSTEDIndex numbers of sales per week and percentage increase on a year earliercontinued Index 2008=100
Year 1st Qtr 2nd Qtr 3rd Qtr 4th Qtr Jan Feb Mar Apr May June July Aug Sept Oct Nov Dec
SIC 2007 (SALES IN 2008)
Household Goods Stores, All Businesses (£34,646m)
2003 97.9 93.2 93.8 92.9 111.7 94.7 92.9 92.3 98.3 95.3 89.1 92.8 91.9 93.8 101.0 107.4 123.82004 101.4 97.3 97.4 97.9 113.3 100.6 96.6 95.2 101.9 97.3 93.8 98.2 96.0 99.0 103.4 112.6 121.72005 98.1 97.3 92.9 92.1 110.2 102.2 94.4 95.7 95.7 93.5 90.2 92.7 90.8 92.6 98.9 104.6 123.62006 98.8 93.5 95.3 93.8 112.5 99.5 90.8 90.9 99.5 94.2 92.8 91.8 95.0 94.5 99.4 107.8 126.72007 102.2 99.1 98.8 97.7 113.1 103.4 95.9 98.1 101.2 98.8 97.1 100.0 97.1 96.5 101.9 108.8 125.3
2008 100.0 99.3 97.9 94.8 108.0 104.0 94.3 98.6 98.5 102.1 94.2 95.9 95.8 93.2 97.3 103.6 120.12009 95.0 88.6 89.7 92.1 109.6 95.3 84.2 86.9 92.5 91.6 86.1 91.8 92.3 92.2 99.6 105.2 121.02010 91.3 87.4 89.9 89.1 98.6 84.4 85.9 90.9 91.9 91.8 86.8 90.4 89.2 88.1 91.9 95.9 106.22011 89.3 85.6 87.2 86.2 98.2 90.7 82.1 84.3 91.1 87.3 83.9 87.3 84.7 86.5 93.0 94.8 105.22012 .. .. .. .. .. 90.3 80.7 .. .. .. .. .. .. .. .. .. ..
Percentage increase on a year earlier
2003 −0.4 −2.8 1.2 − −0.2 −1.6 −0.6 −5.4 2.6 0.3 0.8 0.6 0.2 −0.7 −0.1 −1.7 0.82004 3.6 4.3 3.8 5.3 1.4 6.2 3.9 3.1 3.6 2.1 5.3 5.8 4.5 5.6 2.4 4.9 −1.72005 −3.3 − −4.5 −5.9 −2.7 1.6 −2.2 0.5 −6.1 −3.8 −3.8 −5.7 −5.4 −6.5 −4.3 −7.1 1.62006 0.7 −3.9 2.5 1.9 2.1 −2.7 −3.9 −5.0 3.9 0.7 2.8 −1.0 4.7 2.0 0.5 3.1 2.52007 3.4 6.0 3.7 4.2 0.5 4.0 5.6 7.9 1.7 4.9 4.6 8.9 2.2 2.1 2.6 1.0 −1.1
2008 −2.1 0.2 −0.9 −3.0 −4.5 0.5 −1.7 0.6 −2.6 3.3 −3.0 −4.0 −1.3 −3.4 −4.6 −4.8 −4.2
2009−5.0
−10.7
−8.4
−2.9 1.5
−8.4
−10.7
−11.9
−6.1
−10.3
−8.6
−4.3
−3.6
−1.1 2.4 1.5 0.82010 −3.9 −1.4 0.2 −3.2 −10.0 −11.4 2.1 4.6 −0.6 0.2 0.9 −1.5 −3.4 −4.4 −7.7 −8.9 −12.2
2011 −2.2 −2.0 −3.1 −3.3 −0.4 7.4 −4.5 −7.2 −0.9 −4.9 −3.4 −3.5 −5.0 −1.8 1.1 −1.1 −0.92012 .. .. .. .. .. −0.4 −1.7 .. .. .. .. .. .. .. .. .. ..
Household Goods Stores, Large Businesses (£24,224m)
2003 96.1 88.6 92.5 90.9 112.6 91.3 87.9 87.0 97.1 95.0 86.9 90.9 90.5 91.2 96.4 106.9 130.02004 101.3 96.2 98.6 96.2 114.4 99.7 94.9 94.4 104.6 98.2 94.1 96.5 94.4 97.4 100.9 111.5 127.62005 98.1 97.4 92.4 90.2 112.3 103.3 92.3 96.8 94.5 93.3 89.9 89.9 88.8 91.5 97.5 104.1 130.72006 99.0 92.7 96.6 93.5 113.2 99.7 88.8 90.4 102.4 96.0 92.6 91.0 93.9 95.2 97.3 104.9 132.62007 102.0 96.2 98.6 96.9 116.4 102.6 91.8 94.7 102.9 98.3 95.3 97.8 95.7 97.0 103.0 107.8 134.0
2008 100.0 100.4 97.2 92.1 110.2 108.9 91.9 98.7 98.0 103.5 91.6 93.0 94.5 89.5 93.4 102.9 129.62009 95.3 89.3 91.3 91.0 109.6 96.7 84.9 87.0 95.7 92.9 86.5 89.3 91.6 91.8 95.8 102.8 126.22010 93.4 90.0 90.2 89.1 104.5 91.4 85.7 92.4 92.0 92.8 86.7 88.9 89.4 89.0 94.0 98.9 117.32011 90.9 89.2 88.6 85.9 99.9 97.5 84.5 86.4 96.4 86.8 83.9 86.2 83.7 87.3 91.0 92.9 112.72012 .. .. .. .. .. 94.2 79.0 .. .. .. .. .. .. .. .. .. ..
Percentage increase on a year earlier
2003 1.9 −2.8 4.5 3.6 2.3 0.9 −0.4 −7.7 6.5 4.5 2.7 3.5 3.2 3.9 2.2 0.8 3.32004 5.4 8.5 6.6 5.8 1.7 9.2 7.9 8.4 7.8 3.4 8.2 6.2 4.2 6.8 4.6 4.3 −1.92005 −3.2 1.3 −6.3 −6.3 −1.8 3.6 −2.7 2.6 −9.7 −4.9 −4.4 −6.8 −5.9 −6.1 −3.4 −6.6 2.52006 1.0 −4.8 4.6 3.7 0.8 −3.5 −3.9 −6.6 8.3 2.9 2.9 1.2 5.7 4.1 −0.2 0.7 1.52007 3.0 3.8 2.0 3.6 2.8 2.9 3.4 4.8 0.6 2.3 2.9 7.5 2.0 2.0 5.9 2.8 1.0
2008 −2.0 4.3 −1.4 −4.9 −5.3 6.1 0.1 4.3 −4.8 5.3 −3.9 −4.9 −1.3 −7.8 −9.3 −4.6 −3.22009 −4.7 −11.0 −6.1 −1.3 −0.5 −11.2 −7.6 −11.9 −2.4 −10.2 −5.6 −4.0 −3.1 2.6 2.6 −0.1 −2.62010 −1.9 0.8 −1.2 −2.0 −4.7 −5.5 0.9 6.2 −3.9 −0.1 0.2 −0.5 −2.3 −3.0 −1.8 −3.8 −7.12011 −2.7 −0.9 −1.7 −3.7 −4.3 6.7 −1.4 −6.5 4.9 −6.5 −3.2 −3.1 −6.4 −2.0 −3.2 −6.0 −3.92012 .. .. .. .. .. −3.4 −6.5 .. .. .. .. .. .. .. .. .. ..
Household Goods Stores, Small Businesses (£10,422m)
2003 102.1 104.0 96.9 97.6 109.8 102.6 104.6 104.8 101.3 96.0 94.1 97.4 95.0 99.8 111.5 108.4 109.52004 101.7 99.8 94.5 101.7 110.6 102.7 100.4 97.1 95.5 95.2 93.1 102.3 99.9 102.7 109.0 115.2 108.1
2005 98.2 97.0 94.3 96.4 105.2 99.5 99.3 93.0 98.6 94.0 91.0 99.0 95.4 95.2 102.3 105.6 107.22006 98.2 95.2 92.1 94.6 110.8 98.9 95.5 92.1 92.8 90.0 93.3 93.6 97.7 92.8 104.3 114.6 113.12007 102.5 105.6 99.5 99.8 105.3 105.3 105.5 105.9 97.1 100.0 101.2 104.9 100.3 95.2 99.5 111.3 105.2
2008 100.0 96.7 99.6 101.2 102.8 92.5 99.9 98.4 99.8 98.8 100.1 102.6 98.8 101.9 106.3 105.3 97.92009 94.3 87.0 86.2 94.7 109.4 91.9 82.5 86.8 85.1 88.7 85.1 97.4 94.2 92.9 108.5 110.8 109.02010 86.2 81.3 89.3 89.1 85.1 68.2 86.6 87.4 91.9 89.3 87.1 93.8 88.7 85.8 87.1 88.9 80.52011 85.5 77.1 83.7 87.0 94.3 74.8 76.6 79.5 78.8 88.4 83.9 89.7 87.0 84.7 97.6 99.1 87.82012 .. .. .. .. .. 81.4 84.8 .. .. .. .. .. .. .. .. .. ..
Percentage increase on a year earlier
2003 −5.2 −2.8 −5.4 −7.0 −5.6 −6.4 −1.1 −0.7 −5.2 −8.3 −3.2 −5.2 −5.8 −9.3 −4.4 −7.0 −5.42004 −0.4 −4.0 −2.5 4.2 0.7 0.1 −4.0 −7.3 −5.7 −0.9 −1.1 5.0 5.1 2.9 −2.2 6.3 −1.32005 −3.4 −2.9 −0.2 −5.2 −4.9 −3.1 −1.0 −4.2 3.2 −1.2 −2.3 −3.2 −4.5 −7.3 −6.2 −8.4 −0.92006 − −1.8 −2.3 −1.9 5.4 −0.6 −3.9 −1.0 −5.8 −4.4 2.6 −5.5 2.4 −2.5 2.0 8.5 5.52007 4.4 10.9 8.1 5.5 −5.0 6.5 10.5 15.0 4.6 11.1 8.4 12.0 2.7 2.5 −4.6 −2.9 −6.9
2008 −2.5 −8.4 0.1 1.4 −2.4 −12.2 −5.3 −7.1 2.8 −1.2 −1.0 −2.2 −1.5 7.0 6.9 −5.4 −7.02009 −5.7 −10.0 −13.5 −6.4 6.4 −0.6 −17.4 −11.8 −14.7 −10.3 −15.0 −5.1 −4.7 −8.8 2.0 5.2 11.32010 −8.6 −6.7 3.6 −5.9 −22.2 −25.8 5.0 0.8 8.0 0.7 2.4 −3.7 −5.9 −7.6 −19.7 −19.8 −26.22011
−0.8
−5.1
−6.2
−2.4 10.8 9.7
−11.6
−9.0
−14.3
−1.0
−3.7
−4.3
−1.8
−1.4 12.1 11.5 9.1
2012 .. .. .. .. .. 8.9 10.8 .. .. .. .. .. .. .. .. .. ..
The monthly periods consist of 4 weeks except for March, June, Septemberand December which are 5 weeks. Januar y 2008 is also a 5 week period.

8/2/2019 Ons Retail Report
http://slidepdf.com/reader/full/ons-retail-report 53/84
7VALUE OF RETAIL SALES AT CURRENT PRICESNON-SEASONALLY ADJUSTEDIndex numbers of sales per week and percentage increase on a year earliercontinued Index 2008=100
Year 1st Qtr 2nd Qtr 3rd Qtr 4th Qtr Jan Feb Mar Apr May June July Aug Sept Oct Nov Dec
SIC 2007 (SALES IN 2008)
Fur niture, Lighting, etc (£11,633m)
2003 92.7 92.8 86.8 88.8 102.4 91.1 93.9 93.2 89.0 90.0 82.5 89.3 84.8 91.6 102.3 104.0 101.32004 97.1 98.5 89.4 95.5 105.0 99.6 99.8 96.5 92.0 90.7 86.4 96.2 91.1 98.4 104.2 112.4 99.72005 94.6 97.3 87.3 90.2 103.7 96.9 99.1 96.1 94.5 86.3 82.4 89.5 89.1 91.8 101.1 104.7 104.92006 98.9 98.8 91.9 95.2 109.7 99.3 96.6 100.3 96.9 90.8 88.8 92.0 96.7 96.7 106.3 112.5 110.32007 101.3 101.9 97.7 99.3 106.4 98.0 100.7 106.1 97.4 99.0 97.0 104.6 97.1 96.8 103.2 111.1 105.1
2008 100.0 102.9 99.0 96.1 101.7 101.1 103.0 104.6 102.3 99.3 96.2 98.0 96.4 94.4 105.4 103.5 97.22009 93.4 87.1 85.7 94.6 106.3 92.8 84.3 84.9 87.1 86.2 84.2 95.8 93.7 94.3 108.1 109.9 102.02010 88.7 88.1 84.3 86.6 95.7 82.2 91.6 90.2 86.4 86.9 80.6 88.1 85.7 86.2 99.0 99.0 90.42011 92.3 91.9 84.5 91.1 101.5 93.2 94.9 88.5 83.4 84.9 84.9 92.5 87.5 93.0 103.1 101.7 100.12012 .. .. .. .. .. 95.0 89.1 .. .. .. .. .. .. .. .. .. ..
Percentage increase on a year earlier
2003 −3.1 −2.8 −2.9 −4.8 −1.9 −3.2 −2.6 −2.9 −5.8 −0.5 −2.5 −4.3 −7.0 −3.6 −4.3 −1.4 −0.42004 4.7 6.1 3.0 7.5 2.5 9.4 6.2 3.5 3.4 0.8 4.7 7.7 7.5 7.5 1.8 8.1 −1.62005 −2.5 −1.2 −2.4 −5.5 −1.3 −2.7 −0.7 −0.3 2.7 −4.8 −4.6 −7.0 −2.3 −6.7 −3.0 −6.8 5.22006 4.6 1.6 5.3 5.5 5.9 2.4 −2.5 4.3 2.6 5.2 7.8 2.8 8.5 5.4 5.1 7.5 5.22007 2.4 3.1 6.3 4.3 −3.1 −1.3 4.2 5.8 0.5 9.0 9.3 13.8 0.4 0.1 −2.9 −1.3 −4.7
2008 −1.3 1.0 1.3 −3.2 −4.4 3.2 2.3 −1.3 5.0 0.4 −0.8 −6.3 −0.7 −2.5 2.1 −6.9 −7.5
2009−6.6
−15.4
−13.5
−1.6 4.6
−8.3
−18.2
−18.9
−14.8
−13.2
−12.5
−2.3
−2.8
−2.6 6.2 5.02010 −5.1 1.2 −1.6 −8.4 −10.0 −11.4 8.7 6.2 −0.8 0.8 −4.3 −8.1 −8.6 −8.6 −8.4 −10.0 −11.4
2011 4.0 4.3 0.2 5.2 6.1 13.5 3.6 −1.9 −3.4 −2.3 5.4 5.0 2.1 7.9 4.1 2.8 10.82012 .. .. .. .. .. 1.9 −6.1 .. .. .. .. .. .. .. .. .. ..
Electr ical Household Appliances (£8,835m)
2003 109.8 100.8 92.4 99.0 147.2 111.9 99.8 92.6 97.1 92.1 88.8 95.3 100.0 101.1 109.3 132.6 189.22004 110.3 103.0 93.3 100.8 144.1 115.7 100.1 95.1 96.4 88.8 94.4 96.9 98.4 105.9 109.9 131.9 181.32005 105.3 102.3 86.7 92.9 139.4 120.9 95.1 93.2 87.6 86.2 86.4 91.6 89.7 96.6 103.0 120.6 183.52006 106.7 98.8 91.9 94.6 141.5 115.0 93.8 89.9 95.1 90.7 90.3 90.0 96.6 96.7 103.5 122.2 187.42007 107.5 103.2 89.2 96.8 140.9 119.1 97.8 94.7 88.1 86.0 92.7 96.9 93.7 99.2 107.4 119.2 184.9
2008 100.0 98.9 83.9 88.9 128.5 116.5 85.8 91.6 84.5 86.4 81.3 85.3 92.6 88.7 87.9 108.8 176.82009 95.9 85.4 77.4 89.3 131.6 101.1 81.4 76.0 79.1 79.1 74.6 86.3 88.4 92.5 98.6 115.5 171.02010 93.5 83.6 80.7 89.1 120.5 88.8 81.5 81.2 75.3 80.5 85.3 87.5 87.4 91.8 94.1 107.6 152.02011 84.9 81.7 70.4 79.4 108.1 102.3 72.9 72.2 69.7 70.9 70.6 72.7 77.8 86.1 90.6 95.6 132.02012 .. .. .. .. .. 102.2 76.7 .. .. .. .. .. .. .. .. .. ..
Percentage increase on a year earlier
2003 −1.6 −6.7 −0.1 3.3 −2.2 −7.1 −4.9 −5.6 4.5 −3.3 −1.1 4.5 5.7 0.6 −1.8 −3.9 −1.32004 0.4 2.2 1.0 1.9 −2.1 3.3 0.3 2.7 −0.8 −3.5 6.2 1.7 −1.6 4.7 0.5 −0.5 −4.22005 −4.5 −0.6 −7.0 −7.8 −3.3 4.5 −5.0 −1.9 −9.1 −2.9 −8.4 −5.5 −8.8 −8.8 −6.3 −8.6 1.22006 1.3 −3.4 6.0 1.8 1.5 −4.8 −1.3 −3.6 8.5 5.1 4.6 −1.7 7.6 0.2 0.5 1.3 2.12007 0.7 4.4 −2.9 2.3 −0.5 3.6 4.2 5.4 −7.3 −5.1 2.6 7.7 −3.0 2.6 3.8 −2.5 −1.3
2008 −7.0 −4.2 −6.0 −8.2 −8.7 −2.2 −12.2 −3.3 −4.1 0.5 −12.3 −11.9 −1.2 −10.6 −18.2 −8.7 −4.42009 −4.1 −13.6 −7.7 0.5 2.4 −13.3 −5.1 −17.1 −6.4 −8.5 −8.2 1.1 −4.5 4.3 12.3 6.1 −3.32010 −2.5 −2.0 4.3 −0.2 −8.5 −12.1 0.1 6.8 −4.8 1.8 14.3 1.5 −1.1 −0.7 −4.6 −6.8 −11.12011 −9.2 −2.4 −12.7 −10.9 −10.3 15.1 −10.6 −11.1 −7.3 −12.0 −17.1 −17.0 −11.0 −6.2 −3.7 −11.1 −13.12012 .. .. .. .. .. −0.1 5.2 .. .. .. .. .. .. .. .. .. ..
Hardware, Paints and Glass (£11,782m)
2003 92.7 88.1 103.3 92.6 86.9 83.8 87.0 92.4 110.3 104.5 96.8 94.8 92.9 90.5 93.0 87.5 81.52004 98.3 92.3 110.2 98.8 91.9 89.2 91.7 95.2 118.5 112.7 101.7 102.4 100.3 94.7 97.6 95.3 84.6
2005 95.6 94.1 105.5 94.3 88.6 91.7 90.9 98.7 106.1 108.5 102.7 97.8 95.0 91.0 94.1 90.0 83.02006 92.1 84.7 103.0 93.1 87.6 86.9 83.8 83.7 107.8 101.8 100.2 94.2 93.7 91.8 90.0 90.2 83.72007 98.7 93.6 1 10.0 98.1 92.9 95.9 90.6 94.2 118.7 111.4 102.0 98.6 101.6 94.9 96.5 96.9 86.9
2008 100.0 97.9 110.9 99.9 91.4 97.8 94.9 100.4 109.2 120.3 104.8 103.9 99.9 96.9 97.4 96.6 82.52009 97.4 93.2 107.2 96.4 92.7 92.4 86.5 99.1 113.1 111.0 99.5 96.6 98.9 94.2 96.3 93.1 89.42010 94.0 92.4 107.2 96.3 80.2 85.6 86.5 102.7 115.2 110.3 98.2 99.2 98.7 92.1 86.8 83.1 72.62011 93.5 86.7 108.9 92.3 86.2 83.4 80.4 94.4 121.8 109.1 98.4 99.2 93.2 85.9 90.5 89.0 80.42012 .. .. .. .. .. 83.2 80.0 .. .. .. .. .. .. .. .. .. ..
Percentage increase on a year earlier
2003 3.7 1.7 6.1 1.5 5.3 8.5 6.7 −7.8 8.7 4.2 5.4 1.8 2.1 0.9 7.1 1.2 7.52004 6.0 4.7 6.7 6.7 5.8 6.5 5.4 3.0 7.5 7.9 5.0 8.0 7.9 4.6 5.0 9.0 3.82005 −2.7 2.0 −4.3 −4.5 −3.6 2.7 −0.9 3.6 −10.4 −3.7 1.0 −4.5 −5.2 −3.9 −3.6 −5.6 −1.92006 −3.7 −10.0 −2.4 −1.3 −1.0 −5.2 −7.8 −15.2 1.6 −6.2 −2.5 −3.7 −1.4 0.9 −4.3 0.3 0.82007 7.1 10.5 6.8 5.4 6.0 10.3 8.2 12.6 10.1 9.4 1.8 4.7 8.4 3.4 7.2 7.4 3.9
2008 1.3 4.5 0.8 1.9 −1.6 1.9 4.7 6.5 −8.0 8.0 2.7 5.3 −1.7 2.1 0.9 −0.3 −5.02009 −2.6 −4.8 −3.3 −3.6 1.3 −5.5 −8.8 −1.2 3.5 −7.7 −5.1 −7.0 −1.0 −2.7 −1.1 −3.6 8.32010 −3.4 −0.8 −0.1 −0.1 −13.4 −7.4 − 3.6 1.9 −0.7 −1.3 2.7 −0.3 −2.3 −9.9 −10.8 −18.82011
−0.5
−6.2 1.6
−4.2 7.4
−2.5
−7.1
−8.1 5.7
−1.0 0.2
− −5.6
−6.7 4.3 7.1 10.7
2012 .. .. .. .. .. −0.2 −0.5 .. .. .. .. .. .. .. .. .. ..
The monthly periods consist of 4 weeks except for March, June, Septemberand December which are 5 weeks. Januar y 2008 is also a 5 week period.
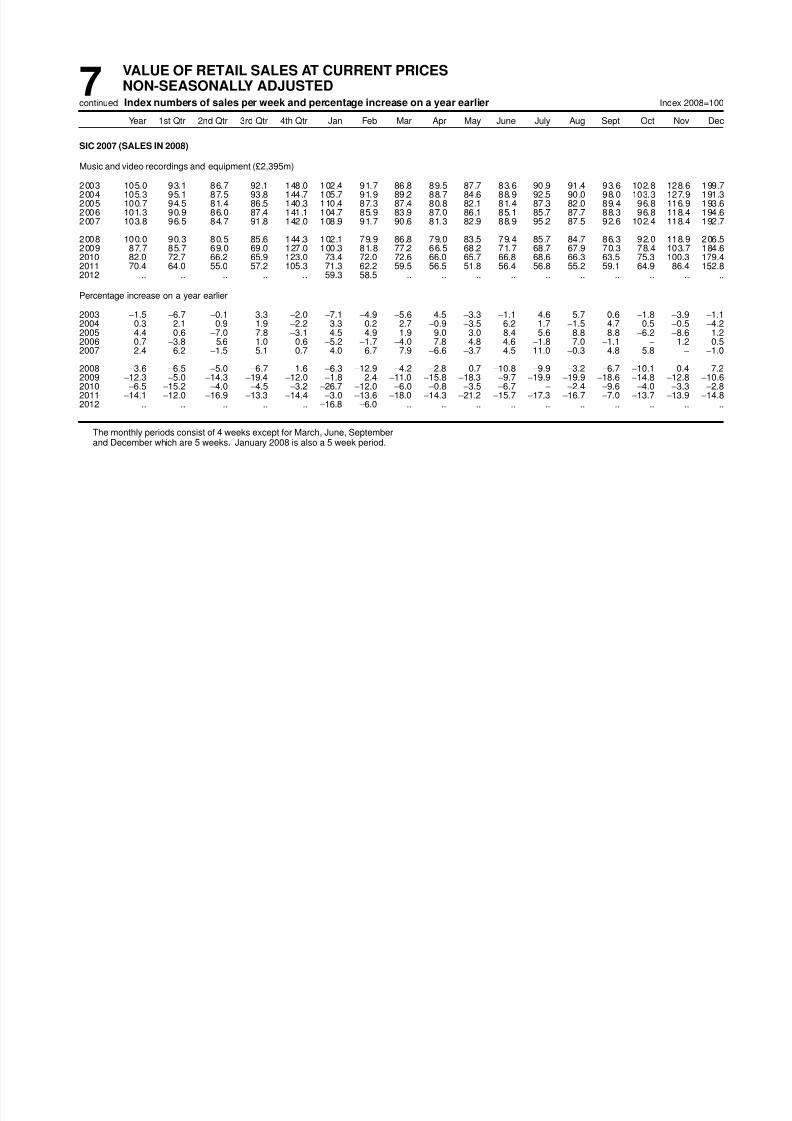
8/2/2019 Ons Retail Report
http://slidepdf.com/reader/full/ons-retail-report 54/84
7VALUE OF RETAIL SALES AT CURRENT PRICESNON-SEASONALLY ADJUSTEDIndex numbers of sales per week and percentage increase on a year earliercontinued Index 2008=100
Year 1st Qtr 2nd Qtr 3rd Qtr 4th Qtr Jan Feb Mar Apr May June July Aug Sept Oct Nov Dec
SIC 2007 (SALES IN 2008)
Music and video recordings and equipment (£2,395m)
2003 105.0 93.1 86.7 92.1 148.0 102.4 91.7 86.8 89.5 87.7 83.6 90.9 91.4 93.6 102.8 128.6 199.72004 105.3 95.1 87.5 93.8 144.7 105.7 91.9 89.2 88.7 84.6 88.9 92.5 90.0 98.0 103.3 127.9 191.32005 100.7 94.5 81.4 86.5 140.3 110.4 87.3 87.4 80.8 82.1 81.4 87.3 82.0 89.4 96.8 116.9 193.62006 101.3 90.9 86.0 87.4 141.1 104.7 85.9 83.9 87.0 86.1 85.1 85.7 87.7 88.3 96.8 118.4 194.62007 103.8 96.5 84.7 91.8 142.0 108.9 91.7 90.6 81.3 82.9 88.9 95.2 87.5 92.6 102.4 118.4 192.7
2008 100.0 90.3 80.5 85.6 144.3 102.1 79.9 86.8 79.0 83.5 79.4 85.7 84.7 86.3 92.0 118.9 206.52009 87.7 85.7 69.0 69.0 127.0 100.3 81.8 77.2 66.5 68.2 71.7 68.7 67.9 70.3 78.4 103.7 184.62010 82.0 72.7 66.2 65.9 123.0 73.4 72.0 72.6 66.0 65.7 66.8 68.6 66.3 63.5 75.3 100.3 179.42011 70.4 64.0 55.0 57.2 105.3 71.3 62.2 59.5 56.5 51.8 56.4 56.8 55.2 59.1 64.9 86.4 152.82012 .. .. .. .. .. 59.3 58.5 .. .. .. .. .. .. .. .. .. ..
Percentage increase on a year earlier
2003 −1.5 −6.7 −0.1 3.3 −2.0 −7.1 −4.9 −5.6 4.5 −3.3 −1.1 4.6 5.7 0.6 −1.8 −3.9 −1.12004 0.3 2.1 0.9 1.9 −2.2 3.3 0.2 2.7 −0.9 −3.5 6.2 1.7 −1.5 4.7 0.5 −0.5 −4.22005 −4.4 −0.6 −7.0 −7.8 −3.1 4.5 −4.9 −1.9 −9.0 −3.0 −8.4 −5.6 −8.8 −8.8 −6.2 −8.6 1.22006 0.7 −3.8 5.6 1.0 0.6 −5.2 −1.7 −4.0 7.8 4.8 4.6 −1.8 7.0 −1.1 − 1.2 0.52007 2.4 6.2 −1.5 5.1 0.7 4.0 6.7 7.9 −6.6 −3.7 4.5 11.0 −0.3 4.8 5.8 − −1.0
2008 −3.6 −6.5 −5.0 −6.7 1.6 −6.3 −12.9 −4.2 −2.8 0.7 −10.8 −9.9 −3.2 −6.7 −10.1 0.4 7.2
2009−12.3
−5.0
−14.3
−19.4
−12.0
−1.8 2.4
−11.0
−15.8
−18.3
−9.7
−19.9
−19.9
−18.6
−14.8
−12.8
−10.62010 −6.5 −15.2 −4.0 −4.5 −3.2 −26.7 −12.0 −6.0 −0.8 −3.5 −6.7 − −2.4 −9.6 −4.0 −3.3 −2.8
2011 −14.1 −12.0 −16.9 −13.3 −14.4 −3.0 −13.6 −18.0 −14.3 −21.2 −15.7 −17.3 −16.7 −7.0 −13.7 −13.9 −14.82012 .. .. .. .. .. −16.8 −6.0 .. .. .. .. .. .. .. .. .. ..
The monthly periods consist of 4 weeks except for March, June, Septemberand December which are 5 weeks. Januar y 2008 is also a 5 week period.
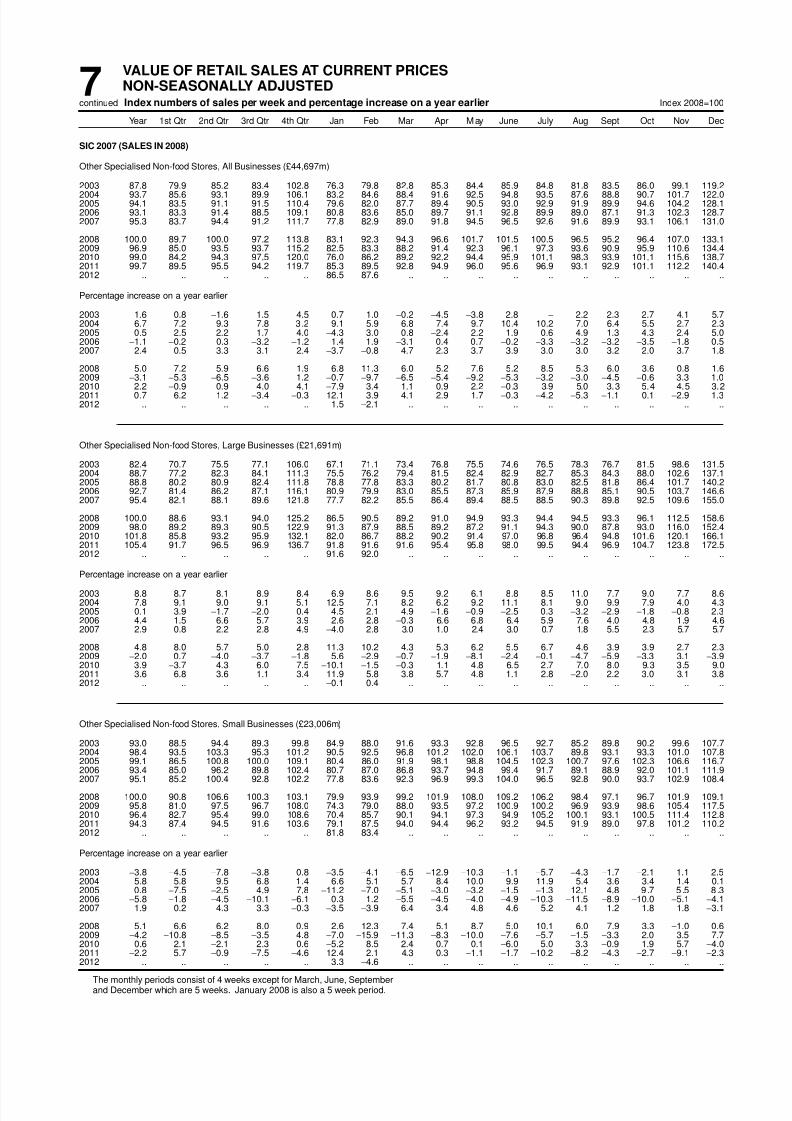
8/2/2019 Ons Retail Report
http://slidepdf.com/reader/full/ons-retail-report 55/84
7VALUE OF RETAIL SALES AT CURRENT PRICESNON-SEASONALLY ADJUSTEDIndex numbers of sales per week and percentage increase on a year earliercontinued Index 2008=100
Year 1st Qtr 2nd Qtr 3rd Qtr 4th Qtr Jan Feb Mar Apr May June July Aug Sept Oct Nov Dec
SIC 2007 (SALES IN 2008)
Other Specialised Non-food Stores, All Businesses (£44,697m)
2003 87.8 79.9 85.2 83.4 102.8 76.3 79.8 82.8 85.3 84.4 85.9 84.8 81.8 83.5 86.0 99.1 119.22004 93.7 85.6 93.1 89.9 106.1 83.2 84.6 88.4 91.6 92.5 94.8 93.5 87.6 88.8 90.7 101.7 122.02005 94.1 83.5 91.1 91.5 110.4 79.6 82.0 87.7 89.4 90.5 93.0 92.9 91.9 89.9 94.6 104.2 128.12006 93.1 83.3 91.4 88.5 109.1 80.8 83.6 85.0 89.7 91.1 92.8 89.9 89.0 87.1 91.3 102.3 128.72007 95.3 83.7 94.4 91.2 111.7 77.8 82.9 89.0 91.8 94.5 96.5 92.6 91.6 89.9 93.1 106.1 131.0
2008 100.0 89.7 100.0 97.2 113.8 83.1 92.3 94.3 96.6 101.7 101.5 100.5 96.5 95.2 96.4 107.0 133.12009 96.9 85.0 93.5 93.7 115.2 82.5 83.3 88.2 91.4 92.3 96.1 97.3 93.6 90.9 95.9 110.6 134.42010 99.0 84.2 94.3 97.5 120.0 76.0 86.2 89.2 92.2 94.4 95.9 101.1 98.3 93.9 101.1 115.6 138.72011 99.7 89.5 95.5 94.2 119.7 85.3 89.5 92.8 94.9 96.0 95.6 96.9 93.1 92.9 101.1 112.2 140.42012 .. .. .. .. .. 86.5 87.6 .. .. .. .. .. .. .. .. .. ..
Percentage increase on a year earlier
2003 1.6 0.8 −1.6 1.5 4.5 0.7 1.0 −0.2 −4.5 −3.8 2.8 − 2.2 2.3 2.7 4.1 5.72004 6.7 7.2 9.3 7.8 3.2 9.1 5.9 6.8 7.4 9.7 10.4 10.2 7.0 6.4 5.5 2.7 2.32005 0.5 −2.5 −2.2 1.7 4.0 −4.3 −3.0 −0.8 −2.4 −2.2 −1.9 −0.6 4.9 1.3 4.3 2.4 5.02006 −1.1 −0.2 0.3 −3.2 −1.2 1.4 1.9 −3.1 0.4 0.7 −0.2 −3.3 −3.2 −3.2 −3.5 −1.8 0.52007 2.4 0.5 3.3 3.1 2.4 −3.7 −0.8 4.7 2.3 3.7 3.9 3.0 3.0 3.2 2.0 3.7 1.8
2008 5.0 7.2 5.9 6.6 1.9 6.8 11.3 6.0 5.2 7.6 5.2 8.5 5.3 6.0 3.6 0.8 1.6
2009−3.1
−5.3
−6.5
−3.6 1.2
−0.7
−9.7
−6.5
−5.4
−9.2
−5.3
−3.2
−3.0
−4.5
−0.6 3.3 1.02010 2.2 −0.9 0.9 4.0 4.1 −7.9 3.4 1.1 0.9 2.2 −0.3 3.9 5.0 3.3 5.4 4.5 3.2
2011 0.7 6.2 1.2 −3.4 −0.3 12.1 3.9 4.1 2.9 1.7 −0.3 −4.2 −5.3 −1.1 0.1 −2.9 1.32012 .. .. .. .. .. 1.5 −2.1 .. .. .. .. .. .. .. .. .. ..
Other Specialised Non-food Stores, Large Businesses (£21,691m)
2003 82.4 70.7 75.5 77.1 106.0 67.1 71.1 73.4 76.8 75.5 74.6 76.5 78.3 76.7 81.5 98.6 131.52004 88.7 77.2 82.3 84.1 111.3 75.5 76.2 79.4 81.5 82.4 82.9 82.7 85.3 84.3 88.0 102.6 137.12005 88.8 80.2 80.9 82.4 111.8 78.8 77.8 83.3 80.2 81.7 80.8 83.0 82.5 81.8 86.4 101.7 140.22006 92.7 81.4 86.2 87.1 116.1 80.9 79.9 83.0 85.5 87.3 85.9 87.9 88.8 85.1 90.5 103.7 146.62007 95.4 82.1 88.1 89.6 121.8 77.7 82.2 85.5 86.4 89.4 88.5 88.5 90.3 89.8 92.5 109.6 155.0
2008 100.0 88.6 93.1 94.0 125.2 86.5 90.5 89.2 91.0 94.9 93.3 94.4 94.5 93.3 96.1 112.5 158.62009 98.0 89.2 89.3 90.5 122.9 91.3 87.9 88.5 89.2 87.2 91.1 94.3 90.0 87.8 93.0 116.0 152.42010 101.8 85.8 93.2 95.9 132.1 82.0 86.7 88.2 90.2 91.4 97.0 96.8 96.4 94.8 101.6 120.1 166.12011 105.4 91.7 96.5 96.9 136.7 91.8 91.6 91.6 95.4 95.8 98.0 99.5 94.4 96.9 104.7 123.8 172.52012 .. .. .. .. .. 91.6 92.0 .. .. .. .. .. .. .. .. .. ..
Percentage increase on a year earlier
2003 8.8 8.7 8.1 8.9 8.4 6.9 8.6 9.5 9.2 6.1 8.8 8.5 11.0 7.7 9.0 7.7 8.62004 7.8 9.1 9.0 9.1 5.1 12.5 7.1 8.2 6.2 9.2 11.1 8.1 9.0 9.9 7.9 4.0 4.32005 0.1 3.9 −1.7 −2.0 0.4 4.5 2.1 4.9 −1.6 −0.9 −2.5 0.3 −3.2 −2.9 −1.8 −0.8 2.32006 4.4 1.5 6.6 5.7 3.9 2.6 2.8 −0.3 6.6 6.8 6.4 5.9 7.6 4.0 4.8 1.9 4.62007 2.9 0.8 2.2 2.8 4.9 −4.0 2.8 3.0 1.0 2.4 3.0 0.7 1.8 5.5 2.3 5.7 5.7
2008 4.8 8.0 5.7 5.0 2.8 11.3 10.2 4.3 5.3 6.2 5.5 6.7 4.6 3.9 3.9 2.7 2.32009 −2.0 0.7 −4.0 −3.7 −1.8 5.6 −2.9 −0.7 −1.9 −8.1 −2.4 −0.1 −4.7 −5.9 −3.3 3.1 −3.92010 3.9 −3.7 4.3 6.0 7.5 −10.1 −1.5 −0.3 1.1 4.8 6.5 2.7 7.0 8.0 9.3 3.5 9.02011 3.6 6.8 3.6 1.1 3.4 11.9 5.8 3.8 5.7 4.8 1.1 2.8 −2.0 2.2 3.0 3.1 3.82012 .. .. .. .. .. −0.1 0.4 .. .. .. .. .. .. .. .. .. ..
Other Specialised Non-food Stores, Small Businesses (£23,006m)
2003 93.0 88.5 94.4 89.3 99.8 84.9 88.0 91.6 93.3 92.8 96.5 92.7 85.2 89.8 90.2 99.6 107.72004 98.4 93.5 103.3 95.3 101.2 90.5 92.5 96.8 101.2 102.0 106.1 103.7 89.8 93.1 93.3 101.0 107.8
2005 99.1 86.5 100.8 100.0 109.1 80.4 86.0 91.9 98.1 98.8 104.5 102.3 100.7 97.6 102.3 106.6 116.72006 93.4 85.0 96.2 89.8 102.4 80.7 87.0 86.8 93.7 94.8 99.4 91.7 89.1 88.9 92.0 101.1 111.92007 95.1 85.2 100.4 92.8 102.2 77.8 83.6 92.3 96.9 99.3 104.0 96.5 92.8 90.0 93.7 102.9 108.4
2008 100.0 90.8 106.6 100.3 103.1 79.9 93.9 99.2 101.9 108.0 109.2 106.2 98.4 97.1 96.7 101.9 109.12009 95.8 81.0 97.5 96.7 108.0 74.3 79.0 88.0 93.5 97.2 100.9 100.2 96.9 93.9 98.6 105.4 117.52010 96.4 82.7 95.4 99.0 108.6 70.4 85.7 90.1 94.1 97.3 94.9 105.2 100.1 93.1 100.5 111.4 112.82011 94.3 87.4 94.5 91.6 103.6 79.1 87.5 94.0 94.4 96.2 93.2 94.5 91.9 89.0 97.8 101.2 110.22012 .. .. .. .. .. 81.8 83.4 .. .. .. .. .. .. .. .. .. ..
Percentage increase on a year earlier
2003 −3.8 −4.5 −7.8 −3.8 0.8 −3.5 −4.1 −6.5 −12.9 −10.3 −1.1 −5.7 −4.3 −1.7 −2.1 1.1 2.52004 5.8 5.8 9.5 6.8 1.4 6.6 5.1 5.7 8.4 10.0 9.9 11.9 5.4 3.6 3.4 1.4 0.12005 0.8 −7.5 −2.5 4.9 7.8 −11.2 −7.0 −5.1 −3.0 −3.2 −1.5 −1.3 12.1 4.8 9.7 5.5 8.32006 −5.8 −1.8 −4.5 −10.1 −6.1 0.3 1.2 −5.5 −4.5 −4.0 −4.9 −10.3 −11.5 −8.9 −10.0 −5.1 −4.12007 1.9 0.2 4.3 3.3 −0.3 −3.5 −3.9 6.4 3.4 4.8 4.6 5.2 4.1 1.2 1.8 1.8 −3.1
2008 5.1 6.6 6.2 8.0 0.9 2.6 12.3 7.4 5.1 8.7 5.0 10.1 6.0 7.9 3.3 −1.0 0.62009 −4.2 −10.8 −8.5 −3.5 4.8 −7.0 −15.9 −11.3 −8.3 −10.0 −7.6 −5.7 −1.5 −3.3 2.0 3.5 7.72010 0.6 2.1 −2.1 2.3 0.6 −5.2 8.5 2.4 0.7 0.1 −6.0 5.0 3.3 −0.9 1.9 5.7 −4.02011
−2.2 5.7
−0.9
−7.5
−4.6 12.4 2.1 4.3 0.3
−1.1
−1.7
−10.2
−8.2
−4.3
−2.7
−9.1
−2.3
2012 .. .. .. .. .. 3.3 −4.6 .. .. .. .. .. .. .. .. .. ..
The monthly periods consist of 4 weeks except for March, June, Septemberand December which are 5 weeks. Januar y 2008 is also a 5 week period.

8/2/2019 Ons Retail Report
http://slidepdf.com/reader/full/ons-retail-report 56/84
7VALUE OF RETAIL SALES AT CURRENT PRICESNON-SEASONALLY ADJUSTEDIndex numbers of sales per week and percentage increase on a year earliercontinued Index 2008=100
Year 1st Qtr 2nd Qtr 3rd Qtr 4th Qtr Jan Feb Mar Apr May June July Aug Sept Oct Nov Dec
SIC 2007 (SALES IN 2008)
Phar maceutical, Medical, Cosmetic & Toilet Goods (£4,451m)
2003 89.3 77.0 85.2 87.8 107.1 72.6 77.3 80.3 82.3 81.9 90.2 87.0 86.0 89.9 84.9 99.0 131.22004 91.3 79.7 86.0 88.8 110.7 77.5 78.4 82.5 82.1 86.2 88.9 88.7 88.3 89.3 88.3 99.8 137.32005 93.4 81.0 86.7 92.3 113.6 78.9 83.4 80.9 80.8 85.6 92.4 94.4 92.0 90.8 89.7 99.1 144.42006 90.2 77.1 86.0 86.3 111.2 69.5 78.2 82.4 80.1 85.7 91.0 89.0 85.8 84.6 88.2 97.0 141.02007 95.4 83.3 87.4 93.1 118.0 78.5 83.5 86.9 83.2 87.3 90.8 90.3 92.6 95.9 90.5 104.4 150.9
2008 100.0 91.0 96.4 93.8 119.4 88.0 92.8 92.6 93.3 97.0 98.5 97.7 95.1 89.6 96.1 106.0 148.82009 92.0 81.1 86.2 89.6 111.3 77.7 82.7 82.5 83.1 81.9 92.1 92.7 90.0 86.8 92.6 100.3 135.12010 96.9 83.0 89.3 92.1 123.3 76.4 86.5 85.4 87.3 88.6 91.4 95.5 93.7 88.1 96.4 111.4 154.32011 101.7 92.5 95.5 96.1 122.7 89.5 91.4 95.8 94.3 94.8 96.9 99.2 94.9 94.6 97.1 113.5 150.52012 .. .. .. .. .. 87.1 91.7 .. .. .. .. .. .. .. .. .. ..
Percentage increase on a year earlier
2003 6.8 0.8 3.6 9.2 11.8 −5.6 2.1 5.1 −4.9 1.8 12.4 0.5 11.5 15.0 10.5 12.5 12.22004 2.3 3.5 0.8 1.2 3.4 6.7 1.4 2.7 −0.3 5.3 −1.5 2.0 2.6 −0.6 4.0 0.9 4.62005 2.3 1.7 0.9 3.9 2.6 1.8 6.3 −1.9 −1.6 −0.7 4.0 6.4 4.2 1.7 1.6 −0.8 5.12006 −3.5 −4.8 −0.8 −6.5 −2.1 −11.9 −6.2 1.9 −0.8 0.1 −1.5 −5.7 −6.7 −6.9 −1.7 −2.1 −2.32007 5.9 7.9 1.6 7.9 6.1 13.0 6.8 5.4 3.8 1.8 −0.2 1.4 8.0 13.4 2.6 7.6 7.0
2008 4.8 9.3 10.4 0.7 1.2 12.1 11.1 6.6 12.1 11.2 8.5 8.3 2.7 −6.6 6.2 1.6 −1.4
2009−8.0
−10.9
−10.6
−4.5
−6.8
−11.8
−10.9
−10.9
−10.9
−15.6
−6.6
−5.2
−5.4
−3.1
−3.7
−5.3
−9.22010 5.3 2.3 3.6 2.8 10.8 −1.6 4.6 3.4 5.0 8.1 −0.7 3.0 4.1 1.5 4.1 11.0 14.3
2011 4.9 11.5 6.9 4.4 −0.5 17.2 5.6 12.2 8.0 7.0 6.0 3.9 1.3 7.4 0.7 1.9 −2.52012 .. .. .. .. .. −2.7 0.3 .. .. .. .. .. .. .. .. .. ..
Books, Newspapers & Per iodicals (£4,477m)
2003 121.7 114.8 103.0 111.8 157.3 116.7 116.8 111.8 105.5 97.5 105.4 110.2 107.8 116.4 121.2 143.2 197.42004 125.1 117.8 109.2 111.7 161.8 117.6 116.9 118.6 110.0 107.8 109.7 107.6 107.4 118.3 126.4 145.5 203.12005 125.6 112.7 107.4 117.6 164.9 110.6 111.8 115.2 107.8 105.8 108.3 116.7 112.4 122.5 132.3 146.8 205.42006 113.3 107.2 95.5 101.7 148.7 107.4 109.5 105.3 98.2 94.8 93.8 95.2 99.1 108.9 115.8 129.6 190.32007 105.8 96.7 89.6 97.7 139.0 93.4 99.0 97.5 87.3 88.7 92.2 95.2 92.5 103.8 107.2 120.2 179.5
2008 100.0 90.8 85.0 95.2 129.7 87.0 97.5 89.1 83.9 80.9 89.2 90.3 92.5 101.4 103.0 115.9 162.02009 107.2 100.9 93.0 96.5 138.5 99.5 103.1 100.2 95.7 90.3 93.0 93.6 94.3 100.4 108.5 123.0 174.82010 98.0 92.5 82.9 90.6 126.1 88.6 95.4 93.1 81.4 82.2 84.6 87.7 90.0 93.5 96.0 111.7 161.72011 100.1 94.4 85.3 91.0 129.7 92.2 96.2 94.6 80.8 84.6 89.4 91.1 87.0 94.1 93.4 112.4 172.62012 .. .. .. .. .. 86.7 91.0 .. .. .. .. .. .. .. .. .. ..
Percentage increase on a year earlier
2003 −4.5 −2.6 −5.9 −3.6 −5.9 −0.3 −3.6 −3.7 −6.8 −13.2 1.0 0.1 −3.9 −6.0 −9.1 −7.3 −3.32004 2.8 2.6 6.0 −0.2 2.9 0.9 0.1 6.1 4.3 10.5 4.0 −2.4 −0.3 1.7 4.3 1.6 2.92005 0.4 −4.3 −1.7 5.3 1.9 −6.0 −4.4 −2.8 −1.9 −1.9 −1.3 8.5 4.7 3.5 4.6 0.9 1.12006 −9.9 −4.9 −11.1 −13.6 −9.8 −2.9 −2.0 −8.6 −8.9 −10.4 −13.4 −18.4 −11.9 −11.1 −12.4 −11.7 −7.42007 −6.6 −9.8 −6.1 −3.9 −6.5 −13.0 −9.6 −7.4 −11.1 −6.4 −1.7 − −6.6 −4.6 −7.4 −7.2 −5.7
2008 −5.4 −6.2 −5.1 −2.5 −6.7 −6.9 −1.5 −8.6 −3.8 −8.7 −3.3 −5.2 − −2.4 −3.9 −3.6 −9.82009 7.2 11.1 9.4 1.3 6.8 14.3 5.8 12.4 14.0 11.6 4.2 3.7 1.9 −0.9 5.3 6.1 7.92010 −8.6 −8.3 −10.9 −6.1 −8.9 −10.9 −7.4 −7.1 −15.0 −9.0 −9.0 −6.3 −4.6 −7.0 −11.5 −9.2 −7.52011 2.1 2.0 2.9 0.4 2.8 4.0 0.8 1.6 −0.7 3.0 5.6 3.9 −3.3 0.6 −2.7 0.6 6.72012 .. .. .. .. .. −5.9 −5.4 .. .. .. .. .. .. .. .. .. ..
Floor Coverings (£2,487m)
2003 86.2 92.1 86.3 81.7 84.6 92.8 99.2 85.8 88.9 82.0 87.7 88.7 72.6 83.4 90.1 99.0 68.62004 90.7 81.4 88.2 94.6 98.6 86.2 78.1 80.3 86.0 87.8 90.2 98.0 88.3 97.0 100.8 116.4 82.4
2005 89.9 84.8 85.4 92.3 97.3 83.4 87.2 84.1 86.2 84.6 85.3 88.6 100.8 88.4 99.5 115.0 81.42006 99.1 96.9 94.4 100.5 104.7 88.9 100.5 100.4 94.1 94.8 94.3 95.3 104.5 101.4 107.3 119.3 90.92007 110.1 107.2 103.5 112.6 117.2 99.7 107.6 112.8 96.8 102.9 109.5 111.7 110.2 115.4 111.7 138.0 105.0
2008 100.0 110.8 100.7 100.7 87.1 100.2 107.7 123.8 115.9 94.6 93.3 102.6 105.0 95.7 94.1 110.3 62.92009 103.0 91.6 101.5 110.7 108.2 77.7 82.4 110.1 103.5 105.1 97.0 111.7 114.2 107.1 121.1 119.5 88.82010 84.9 89.9 85.2 83.2 81.3 84.1 90.9 93.6 89.0 86.3 81.3 83.4 85.2 81.4 84.6 103.4 60.92011 66.1 69.8 60.4 65.2 69.1 73.8 65.7 69.9 63.8 58.3 59.2 64.4 64.2 66.7 73.6 79.4 57.22012 .. .. .. .. .. 80.4 81.6 .. .. .. .. .. .. .. .. .. ..
Percentage increase on a year earlier
2003 −6.4 5.1 −2.2 −13.8 −13.6 15.9 7.1 −5.8 −3.9 −8.4 4.6 −8.9 −13.8 −17.5 −17.6 −17.1 −4.12004 5.3 −11.5 2.2 15.8 16.5 −7.1 −21.2 −6.4 −3.3 7.1 2.9 10.4 21.6 16.3 11.9 17.6 20.22005 −0.8 4.2 −3.2 −2.5 −1.3 −3.2 11.6 4.8 0.2 −3.7 −5.5 −9.6 14.2 −8.9 −1.4 −1.2 −1.22006 10.2 14.2 10.6 8.9 7.6 6.5 15.3 19.4 9.1 12.1 10.5 7.6 3.7 14.7 7.9 3.7 11.72007 11.1 10.6 9.7 12.1 11.9 12.2 7.0 12.4 2.9 8.5 16.1 17.1 5.4 13.8 4.1 15.7 15.4
2008 −9.2 3.4 −2.8 −10.6 −25.7 0.5 0.1 9.7 19.8 −8.1 −14.7 −8.1 −4.7 −17.1 −15.8 −20.1 −40.12009 3.0 −17.3 0.8 10.0 24.3 −22.4 −23.5 −11.1 −10.7 11.1 3.9 8.9 8.8 12.0 28.8 8.4 41.32010 −17.6 −1.9 −16.0 −24.9 −24.9 8.2 10.3 −14.9 −14.0 −17.8 −16.1 −25.4 −25.4 −24.1 −30.2 −13.4 −31.42011
−22.1
−22.4
−29.2
−21.6
−15.0
−12.3
−27.8
−25.3
−28.3
−32.5
−27.2
−22.7
−24.7
−18.1
−13.0
−23.2
−6.1
2012 .. .. .. .. .. 9.1 24.3 .. .. .. .. .. .. .. .. .. ..
The monthly periods consist of 4 weeks except for March, June, Septemberand December which are 5 weeks. Januar y 2008 is also a 5 week period.
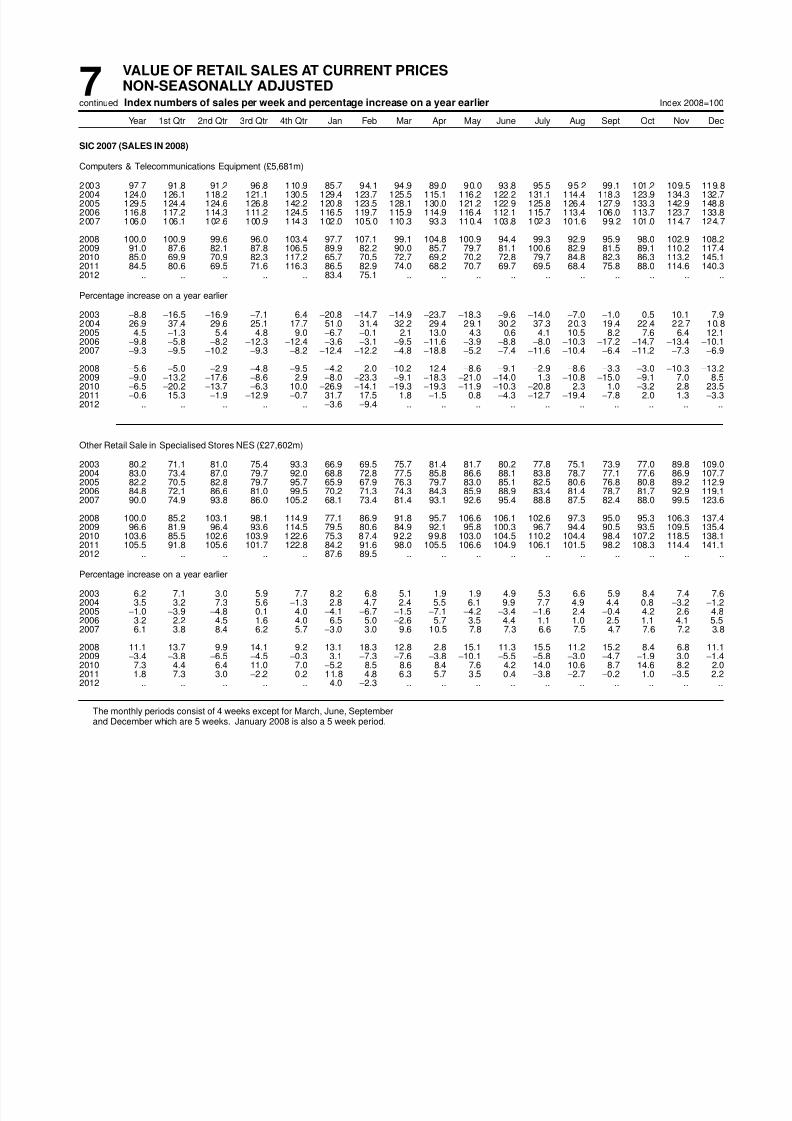
8/2/2019 Ons Retail Report
http://slidepdf.com/reader/full/ons-retail-report 57/84
7VALUE OF RETAIL SALES AT CURRENT PRICESNON-SEASONALLY ADJUSTEDIndex numbers of sales per week and percentage increase on a year earliercontinued Index 2008=100
Year 1st Qtr 2nd Qtr 3rd Qtr 4th Qtr Jan Feb Mar Apr May June July Aug Sept Oct Nov Dec
SIC 2007 (SALES IN 2008)
Computers & Telecommunications Equipment (£5,681m)
2003 97.7 91.8 91.2 96.8 110.9 85.7 94.1 94.9 89.0 90.0 93.8 95.5 95.2 99.1 101.2 109.5 119.82004 124.0 126.1 118.2 121.1 130.5 129.4 123.7 125.5 115.1 116.2 122.2 131.1 114.4 118.3 123.9 134.3 132.72005 129.5 124.4 124.6 126.8 142.2 120.8 123.5 128.1 130.0 121.2 122.9 125.8 126.4 127.9 133.3 142.9 148.82006 116.8 117.2 114.3 111.2 124.5 116.5 119.7 115.9 114.9 116.4 112.1 115.7 113.4 106.0 113.7 123.7 133.82007 106.0 106.1 102.6 100.9 114.3 102.0 105.0 110.3 93.3 110.4 103.8 102.3 101.6 99.2 101.0 114.7 124.7
2008 100.0 100.9 99.6 96.0 103.4 97.7 107.1 99.1 104.8 100.9 94.4 99.3 92.9 95.9 98.0 102.9 108.22009 91.0 87.6 82.1 87.8 106.5 89.9 82.2 90.0 85.7 79.7 81.1 100.6 82.9 81.5 89.1 110.2 117.42010 85.0 69.9 70.9 82.3 117.2 65.7 70.5 72.7 69.2 70.2 72.8 79.7 84.8 82.3 86.3 113.2 145.12011 84.5 80.6 69.5 71.6 116.3 86.5 82.9 74.0 68.2 70.7 69.7 69.5 68.4 75.8 88.0 114.6 140.32012 .. .. .. .. .. 83.4 75.1 .. .. .. .. .. .. .. .. .. ..
Percentage increase on a year earlier
2003 −8.8 −16.5 −16.9 −7.1 6.4 −20.8 −14.7 −14.9 −23.7 −18.3 −9.6 −14.0 −7.0 −1.0 0.5 10.1 7.92004 26.9 37.4 29.6 25.1 17.7 51.0 31.4 32.2 29.4 29.1 30.2 37.3 20.3 19.4 22.4 22.7 10.82005 4.5 −1.3 5.4 4.8 9.0 −6.7 −0.1 2.1 13.0 4.3 0.6 −4.1 10.5 8.2 7.6 6.4 12.12006 −9.8 −5.8 −8.2 −12.3 −12.4 −3.6 −3.1 −9.5 −11.6 −3.9 −8.8 −8.0 −10.3 −17.2 −14.7 −13.4 −10.12007 −9.3 −9.5 −10.2 −9.3 −8.2 −12.4 −12.2 −4.8 −18.8 −5.2 −7.4 −11.6 −10.4 −6.4 −11.2 −7.3 −6.9
2008 −5.6 −5.0 −2.9 −4.8 −9.5 −4.2 2.0 −10.2 12.4 −8.6 −9.1 −2.9 −8.6 −3.3 −3.0 −10.3 −13.2
2009−9.0
−13.2
−17.6
−8.6 2.9
−8.0
−23.3
−9.1
−18.3
−21.0
−14.0 1.3
−10.8
−15.0
−9.1 7.0 8.52010 −6.5 −20.2 −13.7 −6.3 10.0 −26.9 −14.1 −19.3 −19.3 −11.9 −10.3 −20.8 2.3 1.0 −3.2 2.8 23.5
2011 −0.6 15.3 −1.9 −12.9 −0.7 31.7 17.5 1.8 −1.5 0.8 −4.3 −12.7 −19.4 −7.8 2.0 1.3 −3.32012 .. .. .. .. .. −3.6 −9.4 .. .. .. .. .. .. .. .. .. ..
Other Retail Sale in Specialised Stores NES (£27,602m)
2003 80.2 71.1 81.0 75.4 93.3 66.9 69.5 75.7 81.4 81.7 80.2 77.8 75.1 73.9 77.0 89.8 109.02004 83.0 73.4 87.0 79.7 92.0 68.8 72.8 77.5 85.8 86.6 88.1 83.8 78.7 77.1 77.6 86.9 107.72005 82.2 70.5 82.8 79.7 95.7 65.9 67.9 76.3 79.7 83.0 85.1 82.5 80.6 76.8 80.8 89.2 112.92006 84.8 72.1 86.6 81.0 99.5 70.2 71.3 74.3 84.3 85.9 88.9 83.4 81.4 78.7 81.7 92.9 119.12007 90.0 74.9 93.8 86.0 105.2 68.1 73.4 81.4 93.1 92.6 95.4 88.8 87.5 82.4 88.0 99.5 123.6
2008 100.0 85.2 103.1 98.1 114.9 77.1 86.9 91.8 95.7 106.6 106.1 102.6 97.3 95.0 95.3 106.3 137.42009 96.6 81.9 96.4 93.6 114.5 79.5 80.6 84.9 92.1 95.8 100.3 96.7 94.4 90.5 93.5 109.5 135.42010 103.6 85.5 102.6 103.9 122.6 75.3 87.4 92.2 99.8 103.0 104.5 110.2 104.4 98.4 107.2 118.5 138.12011 105.5 91.8 105.6 101.7 122.8 84.2 91.6 98.0 105.5 106.6 104.9 106.1 101.5 98.2 108.3 114.4 141.12012 .. .. .. .. .. 87.6 89.5 .. .. .. .. .. .. .. .. .. ..
Percentage increase on a year earlier
2003 6.2 7.1 3.0 5.9 7.7 8.2 6.8 5.1 1.9 1.9 4.9 5.3 6.6 5.9 8.4 7.4 7.62004 3.5 3.2 7.3 5.6 −1.3 2.8 4.7 2.4 5.5 6.1 9.9 7.7 4.9 4.4 0.8 −3.2 −1.22005 −1.0 −3.9 −4.8 0.1 4.0 −4.1 −6.7 −1.5 −7.1 −4.2 −3.4 −1.6 2.4 −0.4 4.2 2.6 4.82006 3.2 2.2 4.5 1.6 4.0 6.5 5.0 −2.6 5.7 3.5 4.4 1.1 1.0 2.5 1.1 4.1 5.52007 6.1 3.8 8.4 6.2 5.7 −3.0 3.0 9.6 10.5 7.8 7.3 6.6 7.5 4.7 7.6 7.2 3.8
2008 11.1 13.7 9.9 14.1 9.2 13.1 18.3 12.8 2.8 15.1 11.3 15.5 11.2 15.2 8.4 6.8 11.12009 −3.4 −3.8 −6.5 −4.5 −0.3 3.1 −7.3 −7.6 −3.8 −10.1 −5.5 −5.8 −3.0 −4.7 −1.9 3.0 −1.42010 7.3 4.4 6.4 11.0 7.0 −5.2 8.5 8.6 8.4 7.6 4.2 14.0 10.6 8.7 14.6 8.2 2.02011 1.8 7.3 3.0 −2.2 0.2 11.8 4.8 6.3 5.7 3.5 0.4 −3.8 −2.7 −0.2 1.0 −3.5 2.22012 .. .. .. .. .. 4.0 −2.3 .. .. .. .. .. .. .. .. .. ..
The monthly periods consist of 4 weeks except for March, June, Septemberand December which are 5 weeks. Januar y 2008 is also a 5 week period.
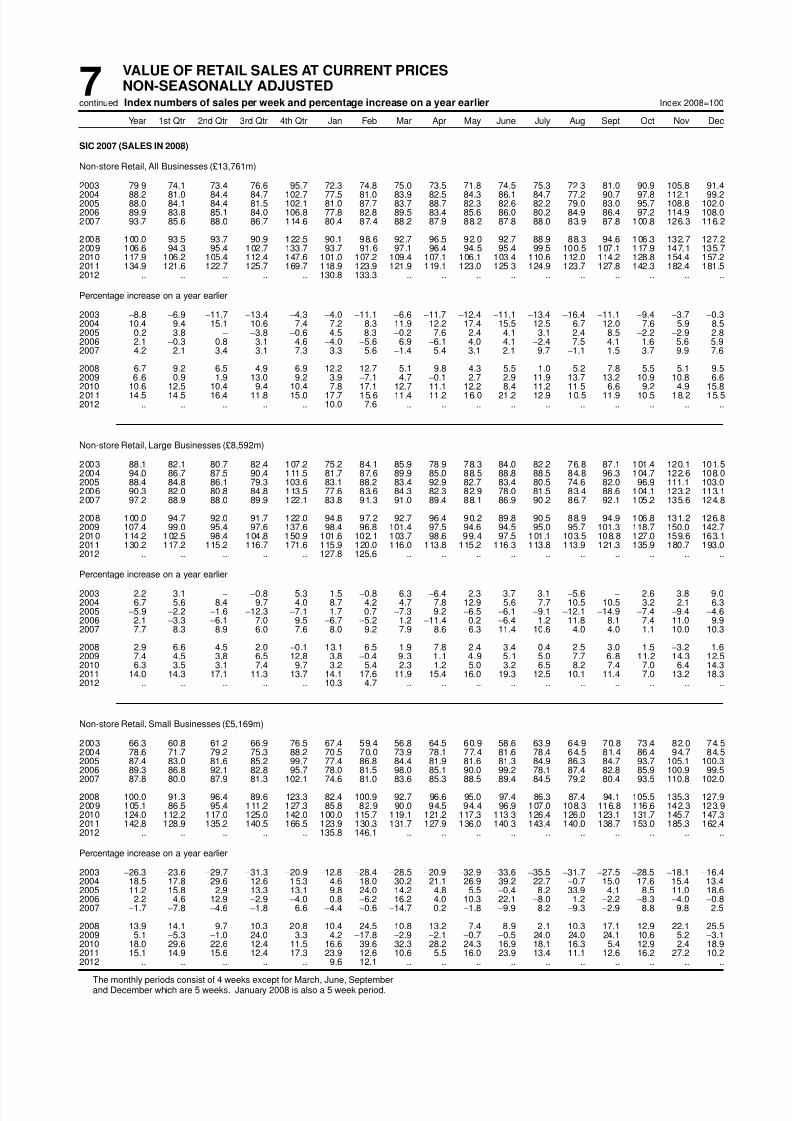
8/2/2019 Ons Retail Report
http://slidepdf.com/reader/full/ons-retail-report 58/84
7VALUE OF RETAIL SALES AT CURRENT PRICESNON-SEASONALLY ADJUSTEDIndex numbers of sales per week and percentage increase on a year earliercontinued Index 2008=100
Year 1st Qtr 2nd Qtr 3rd Qtr 4th Qtr Jan Feb Mar Apr May June July Aug Sept Oct Nov Dec
SIC 2007 (SALES IN 2008)
Non-store Retail, All Businesses (£13,761m)
2003 79.9 74.1 73.4 76.6 95.7 72.3 74.8 75.0 73.5 71.8 74.5 75.3 72.3 81.0 90.9 105.8 91.42004 88.2 81.0 84.4 84.7 102.7 77.5 81.0 83.9 82.5 84.3 86.1 84.7 77.2 90.7 97.8 112.1 99.22005 88.0 84.1 84.4 81.5 102.1 81.0 87.7 83.7 88.7 82.3 82.6 82.2 79.0 83.0 95.7 108.8 102.02006 89.9 83.8 85.1 84.0 106.8 77.8 82.8 89.5 83.4 85.6 86.0 80.2 84.9 86.4 97.2 114.9 108.02007 93.7 85.6 88.0 86.7 114.6 80.4 87.4 88.2 87.9 88.2 87.8 88.0 83.9 87.8 100.8 126.3 116.2
2008 100.0 93.5 93.7 90.9 122.5 90.1 98.6 92.7 96.5 92.0 92.7 88.9 88.3 94.6 106.3 132.7 127.22009 106.6 94.3 95.4 102.7 133.7 93.7 91.6 97.1 96.4 94.5 95.4 99.5 100.5 107.1 117.9 147.1 135.72010 117.9 106.2 105.4 112.4 147.6 101.0 107.2 109.4 107.1 106.1 103.4 110.6 112.0 114.2 128.8 154.4 157.22011 134.9 121.6 122.7 125.7 169.7 118.9 123.9 121.9 119.1 123.0 125.3 124.9 123.7 127.8 142.3 182.4 181.52012 .. .. .. .. .. 130.8 133.3 .. .. .. .. .. .. .. .. .. ..
Percentage increase on a year earlier
2003 −8.8 −6.9 −11.7 −13.4 −4.3 −4.0 −11.1 −6.6 −11.7 −12.4 −11.1 −13.4 −16.4 −11.1 −9.4 −3.7 −0.32004 10.4 9.4 15.1 10.6 7.4 7.2 8.3 11.9 12.2 17.4 15.5 12.5 6.7 12.0 7.6 5.9 8.52005 −0.2 3.8 − −3.8 −0.6 4.5 8.3 −0.2 7.6 −2.4 −4.1 −3.1 2.4 −8.5 −2.2 −2.9 2.82006 2.1 −0.3 0.8 3.1 4.6 −4.0 −5.6 6.9 −6.1 4.0 4.1 −2.4 7.5 4.1 1.6 5.6 5.92007 4.2 2.1 3.4 3.1 7.3 3.3 5.6 −1.4 5.4 3.1 2.1 9.7 −1.1 1.5 3.7 9.9 7.6
2008 6.7 9.2 6.5 4.9 6.9 12.2 12.7 5.1 9.8 4.3 5.5 1.0 5.2 7.8 5.5 5.1 9.5
2009 6.6 0.9 1.9 13.0 9.2 3.9−7.1 4.7
−0.1 2.7 2.9 11.9 13.7 13.2 10.9 10.8 6.62010 10.6 12.5 10.4 9.4 10.4 7.8 17.1 12.7 11.1 12.2 8.4 11.2 11.5 6.6 9.2 4.9 15.8
2011 14.5 14.5 16.4 11.8 15.0 17.7 15.6 11.4 11.2 16.0 21.2 12.9 10.5 11.9 10.5 18.2 15.52012 .. .. .. .. .. 10.0 7.6 .. .. .. .. .. .. .. .. .. ..
Non-store Retail, Large Businesses (£8,592m)
2003 88.1 82.1 80.7 82.4 107.2 75.2 84.1 85.9 78.9 78.3 84.0 82.2 76.8 87.1 101.4 120.1 101.52004 94.0 86.7 87.5 90.4 111.5 81.7 87.6 89.9 85.0 88.5 88.8 88.5 84.8 96.3 104.7 122.6 108.02005 88.4 84.8 86.1 79.3 103.6 83.1 88.2 83.4 92.9 82.7 83.4 80.5 74.6 82.0 96.9 111.1 103.02006 90.3 82.0 80.8 84.8 113.5 77.6 83.6 84.3 82.3 82.9 78.0 81.5 83.4 88.6 104.1 123.2 113.12007 97.2 88.9 88.0 89.9 122.1 83.8 91.3 91.0 89.4 88.1 86.9 90.2 86.7 92.1 105.2 135.6 124.8
2008 100.0 94.7 92.0 91.7 122.0 94.8 97.2 92.7 96.4 90.2 89.8 90.5 88.9 94.9 106.8 131.2 126.82009 107.4 99.0 95.4 97.6 137.6 98.4 96.8 101.4 97.5 94.6 94.5 95.0 95.7 101.3 118.7 150.0 142.72010 114.2 102.5 98.4 104.8 150.9 101.6 102.1 103.7 98.6 99.4 97.5 101.1 103.5 108.8 127.0 159.6 163.12011 130.2 117.2 115.2 116.7 171.6 115.9 120.0 116.0 113.8 115.2 116.3 113.8 113.9 121.3 135.9 180.7 193.02012 .. .. .. .. .. 127.8 125.6 .. .. .. .. .. .. .. .. .. ..
Percentage increase on a year earlier
2003 2.2 3.1 − −0.8 5.3 1.5 −0.8 6.3 −6.4 2.3 3.7 3.1 −5.6 − 2.6 3.8 9.02004 6.7 5.6 8.4 9.7 4.0 8.7 4.2 4.7 7.8 12.9 5.6 7.7 10.5 10.5 3.2 2.1 6.32005 −5.9 −2.2 −1.6 −12.3 −7.1 1.7 0.7 −7.3 9.2 −6.5 −6.1 −9.1 −12.1 −14.9 −7.4 −9.4 −4.62006 2.1 −3.3 −6.1 7.0 9.5 −6.7 −5.2 1.2 −11.4 0.2 −6.4 1.2 11.8 8.1 7.4 11.0 9.92007 7.7 8.3 8.9 6.0 7.6 8.0 9.2 7.9 8.6 6.3 11.4 10.6 4.0 4.0 1.1 10.0 10.3
2008 2.9 6.6 4.5 2.0 −0.1 13.1 6.5 1.9 7.8 2.4 3.4 0.4 2.5 3.0 1.5 −3.2 1.62009 7.4 4.5 3.8 6.5 12.8 3.8 −0.4 9.3 1.1 4.9 5.1 5.0 7.7 6.8 11.2 14.3 12.52010 6.3 3.5 3.1 7.4 9.7 3.2 5.4 2.3 1.2 5.0 3.2 6.5 8.2 7.4 7.0 6.4 14.32011 14.0 14.3 17.1 11.3 13.7 14.1 17.6 11.9 15.4 16.0 19.3 12.5 10.1 11.4 7.0 13.2 18.32012 .. .. .. .. .. 10.3 4.7 .. .. .. .. .. .. .. .. .. ..
Non-store Retail, Small Businesses (£5,169m)
2003 66.3 60.8 61.2 66.9 76.5 67.4 59.4 56.8 64.5 60.9 58.6 63.9 64.9 70.8 73.4 82.0 74.52004 78.6 71.7 79.2 75.3 88.2 70.5 70.0 73.9 78.1 77.4 81.6 78.4 64.5 81.4 86.4 94.7 84.5
2005 87.4 83.0 81.6 85.2 99.7 77.4 86.8 84.4 81.9 81.6 81.3 84.9 86.3 84.7 93.7 105.1 100.32006 89.3 86.8 92.1 82.8 95.7 78.0 81.5 98.0 85.1 90.0 99.2 78.1 87.4 82.8 85.9 100.9 99.52007 87.8 80.0 87.9 81.3 102.1 74.6 81.0 83.6 85.3 88.5 89.4 84.5 79.2 80.4 93.5 110.8 102.0
2008 100.0 91.3 96.4 89.6 123.3 82.4 100.9 92.7 96.6 95.0 97.4 86.3 87.4 94.1 105.5 135.3 127.92009 105.1 86.5 95.4 111.2 127.3 85.8 82.9 90.0 94.5 94.4 96.9 107.0 108.3 116.8 116.6 142.3 123.92010 124.0 112.2 117.0 125.0 142.0 100.0 115.7 119.1 121.2 117.3 113.3 126.4 126.0 123.1 131.7 145.7 147.32011 142.8 128.9 135.2 140.5 166.5 123.9 130.3 131.7 127.9 136.0 140.3 143.4 140.0 138.7 153.0 185.3 162.42012 .. .. .. .. .. 135.8 146.1 .. .. .. .. .. .. .. .. .. ..
Percentage increase on a year earlier
2003 −26.3 −23.6 −29.7 −31.3 −20.9 −12.8 −28.4 −28.5 −20.9 −32.9 −33.6 −35.5 −31.7 −27.5 −28.5 −18.1 −16.42004 18.5 17.8 29.6 12.6 15.3 4.6 18.0 30.2 21.1 26.9 39.2 22.7 −0.7 15.0 17.6 15.4 13.42005 11.2 15.8 2.9 13.3 13.1 9.8 24.0 14.2 4.8 5.5 −0.4 8.2 33.9 4.1 8.5 11.0 18.62006 2.2 4.6 12.9 −2.9 −4.0 0.8 −6.2 16.2 4.0 10.3 22.1 −8.0 1.2 −2.2 −8.3 −4.0 −0.82007 −1.7 −7.8 −4.6 −1.8 6.6 −4.4 −0.6 −14.7 0.2 −1.8 −9.9 8.2 −9.3 −2.9 8.8 9.8 2.5
2008 13.9 14.1 9.7 10.3 20.8 10.4 24.5 10.8 13.2 7.4 8.9 2.1 10.3 17.1 12.9 22.1 25.52009 5.1 −5.3 −1.0 24.0 3.3 4.2 −17.8 −2.9 −2.1 −0.7 −0.5 24.0 24.0 24.1 10.6 5.2 −3.12010 18.0 29.6 22.6 12.4 11.5 16.6 39.6 32.3 28.2 24.3 16.9 18.1 16.3 5.4 12.9 2.4 18.92011 15.1 14.9 15.6 12.4 17.3 23.9 12.6 10.6 5.5 16.0 23.9 13.4 11.1 12.6 16.2 27.2 10.22012 .. .. .. .. .. 9.6 12.1 .. .. .. .. .. .. .. .. .. ..
The monthly periods consist of 4 weeks except for March, June, Septemberand December which are 5 weeks. Januar y 2008 is also a 5 week period.

8/2/2019 Ons Retail Report
http://slidepdf.com/reader/full/ons-retail-report 59/84
7VALUE OF RETAIL SALES AT CURRENT PRICESNON-SEASONALLY ADJUSTEDIndex numbers of sales per week and percentage increase on a year earliercontinued Index 2008=100
Year 1st Qtr 2nd Qtr 3rd Qtr 4th Qtr Jan Feb Mar Apr May June July Aug Sept Oct Nov Dec
SIC 2007 (SALES IN 2008)
Mail Order (£11,091m)
2003 76.2 69.7 68.9 72.8 93.4 66.1 70.2 72.2 67.2 66.4 72.1 70.8 68.7 77.7 89.0 104.7 87.92004 84.5 77.2 78.6 80.1 101.9 73.3 77.7 80.0 76.1 79.0 80.3 78.9 73.9 86.1 95.2 113.1 98.32005 86.6 81.4 82.6 79.6 102.9 79.6 84.3 80.4 87.9 79.5 80.8 79.5 76.5 82.1 97.1 109.7 102.12006 88.8 85.6 81.9 80.1 107.6 81.0 84.2 90.4 83.9 84.1 78.5 77.4 79.6 82.8 97.0 116.9 108.82007 95.5 84.9 87.7 88.7 120.8 80.6 85.9 87.6 87.2 88.7 87.2 89.4 86.2 90.0 104.4 133.6 123.6
2008 100.0 94.8 92.5 91.3 121.7 94.9 97.9 92.4 96.4 90.1 91.4 90.0 89.0 94.2 105.9 130.2 127.62009 106.0 98.3 94.4 97.7 133.8 98.8 94.7 100.8 96.1 94.2 93.1 95.5 95.0 101.5 117.5 145.7 137.42010 119.8 107.9 104.2 112.5 154.7 104.3 108.7 110.2 106.8 104.5 101.9 107.5 112.2 116.7 132.5 160.5 167.92011 140.3 124.7 123.7 130.7 182.0 125.2 124.5 124.6 120.6 124.5 125.5 128.3 128.9 134.0 146.5 197.1 198.22012 .. .. .. .. .. 142.7 141.7 .. .. .. .. .. .. .. .. .. ..
Percentage increase on a year earlier
2003 −6.5 −6.4 −9.7 −10.4 −1.1 −5.2 −11.7 −4.1 −13.7 −11.1 −5.4 −9.2 −13.3 −9.1 −6.2 −2.6 5.22004 10.8 10.8 14.2 10.0 9.1 10.9 10.7 10.7 13.2 19.0 11.4 11.4 7.6 10.8 7.0 8.0 11.82005 2.5 5.4 5.0 −0.7 1.0 8.7 8.6 0.6 15.5 0.5 0.6 0.7 3.6 −4.7 2.0 −3.0 3.92006 2.5 5.2 −0.8 0.7 4.6 1.7 −0.2 12.4 −4.5 5.9 −2.9 −2.6 4.0 0.8 −0.1 6.5 6.52007 7.5 −0.8 7.1 10.7 12.2 −0.5 2.0 −3.1 4.0 5.4 11.1 15.6 8.3 8.8 7.7 14.3 13.6
2008 4.7 11.7 5.5 3.0 0.8 17.7 14.1 5.5 10.5 1.5 4.8 0.6 3.2 4.6 1.4 −2.5 3.2
2009 6.0 3.6 2.0 7.0 9.9 4.1−3.4 9.1
−0.3 4.6 1.9 6.1 6.8 7.8 10.9 11.9 7.72010 13.0 9.8 10.4 15.1 15.6 5.6 14.9 9.3 11.2 10.9 9.4 12.5 18.1 14.9 12.8 10.2 22.3
2011 17.1 15.6 18.7 16.2 17.6 20.0 14.6 13.1 12.9 19.2 23.2 19.4 14.8 14.9 10.6 22.8 18.02012 .. .. .. .. .. 14.0 13.8 .. .. .. .. .. .. .. .. .. ..
Other Non-store Retail (£2,670m)
2003 95.4 92.2 92.1 92.2 105.1 97.9 93.9 86.4 99.6 94.2 84.4 93.9 87.5 94.5 98.9 110.3 105.92004 103.8 96.9 108.4 103.7 106.2 95.0 94.7 100.2 108.8 106.2 109.9 109.1 90.8 109.7 108.7 107.9 102.72005 94.0 95.4 92.0 89.6 98.9 86.5 101.7 97.4 92.3 94.1 90.0 93.3 89.2 86.9 90.0 105.0 101.12006 94.5 76.4 98.2 100.3 103.3 64.1 77.0 85.7 81.0 91.6 117.3 92.0 106.8 101.7 98.4 106.6 104.62007 86.1 88.2 89.2 78.3 88.8 79.3 93.9 90.9 90.5 86.2 90.6 82.1 74.3 78.3 85.8 95.8 85.5
2008 100.0 87.7 98.4 89.3 125.6 70.5 101.2 94.2 96.9 100.2 98.0 84.2 85.6 96.4 108.0 143.0 125.72009 108.7 77.9 99.8 123.7 133.4 72.5 78.7 81.7 97.7 95.7 104.8 116.0 123.1 130.3 119.9 152.9 128.52010 109.7 98.8 110.2 112.2 117.8 87.2 100.7 106.4 108.5 112.6 109.7 123.9 110.9 104.0 113.5 129.0 112.32011 112.7 108.4 118.5 104.9 118.8 92.9 121.0 110.7 112.8 116.8 124.5 110.9 102.4 102.1 125.0 121.3 111.92012 .. .. .. .. .. 81.5 98.6 .. .. .. .. .. .. .. .. .. ..
Percentage increase on a year earlier
2003 −15.6 −8.4 −17.3 −21.9 −14.4 −0.3 −9.1 −14.5 −5.6 −15.9 −26.8 −24.3 −25.1 −17.3 −19.6 −8.0 −15.32004 8.8 5.1 17.7 12.5 1.0 −2.9 0.9 16.0 9.3 12.7 30.2 16.1 3.8 16.2 9.9 −2.2 −3.02005 −9.5 −1.6 −15.2 −13.6 −6.9 −9.0 7.4 −2.8 −15.2 −11.3 −18.1 −14.4 −1.8 −20.8 −17.2 −2.7 −1.52006 0.6 −19.9 6.8 12.0 4.4 −25.9 −24.2 −12.1 −12.2 −2.7 30.3 −1.4 19.8 17.1 9.3 1.5 3.42007 −8.9 15.5 −9.2 −22.0 −14.1 23.7 21.9 6.1 11.7 −5.9 −22.8 −10.7 −30.4 −23.0 −12.8 −10.1 −18.2
2008 16.1 −0.6 10.3 14.1 41.5 −11.1 7.7 3.6 7.1 16.2 8.2 2.6 15.1 23.1 25.8 49.4 47.02009 8.7 −11.1 1.5 38.5 6.2 2.8 −22.2 −13.2 0.8 −4.5 6.9 37.7 43.9 35.2 11.1 6.9 2.22010 1.0 26.7 10.4 −9.2 −11.7 20.4 28.0 30.2 11.0 17.6 4.6 6.8 −9.9 −20.2 −5.4 −15.7 −12.62011 2.7 9.7 7.5 −6.5 0.9 6.5 20.1 4.1 4.0 3.7 13.5 −10.4 −7.7 −1.9 10.1 −5.9 −0.32012 .. .. .. .. .. −12.3 −18.5 .. .. .. .. .. .. .. .. .. ..
The monthly periods consist of 4 weeks except for March, June, Septemberand December which are 5 weeks. Januar y 2008 is also a 5 week period.

8/2/2019 Ons Retail Report
http://slidepdf.com/reader/full/ons-retail-report 60/84
7VALUE OF RETAIL SALES AT CURRENT PRICESNON-SEASONALLY ADJUSTEDIndex numbers of sales per week and percentage increase on a year earliercontinued Index 2008=100
Year 1st Qtr 2nd Qtr 3rd Qtr 4th Qtr Jan Feb Mar Apr May June July Aug Sept Oct Nov Dec
SIC 2007 (SALES IN 2008)
Automotive Fuel, All Businesses (£36,106m)
2003 66.6 66.5 65.6 68.7 65.4 62.2 67.7 69.0 66.1 63.1 67.3 67.4 67.7 70.5 68.2 66.5 62.32004 70.3 64.6 69.7 73.2 73.6 60.5 65.2 67.5 68.1 68.2 72.3 72.2 73.4 73.8 79.2 73.5 69.22005 72.7 67.1 76.1 76.8 70.9 62.2 69.3 69.3 75.8 74.9 77.3 78.8 73.6 77.7 73.2 73.1 67.42006 85.0 82.2 88.3 89.2 80.5 78.8 81.0 86.0 85.8 89.7 89.1 91.8 88.4 87.6 81.9 82.2 78.02007 91.1 83.0 92.7 92.8 95.9 78.3 81.0 88.4 92.0 92.1 93.7 93.9 91.1 93.3 93.2 98.4 96.0
2008 100.0 96.3 107.4 108.0 88.6 92.2 97.1 99.8 106.3 104.8 110.4 113.4 103.9 106.8 98.6 91.2 78.62009 91.4 83.7 92.3 96.0 93.8 80.7 83.3 86.3 87.3 90.6 97.7 95.3 95.0 97.3 99.1 95.5 88.12010 95.7 88.9 99.8 97.2 96.8 81.4 89.6 94.4 99.9 101.8 98.1 100.6 96.0 95.5 99.4 102.2 90.52011 114.1 107.4 116.4 115.7 116.6 100.8 108.1 112.3 115.9 117.9 115.7 117.8 114.0 115.4 116.9 121.1 112.82012 .. .. .. .. .. 110.1 115.1 .. .. .. .. .. .. .. .. .. ..
Percentage increase on a year earlier
2003 10.1 11.0 4.9 15.6 9.1 8.5 9.4 13.4 −0.5 0.2 13.7 16.9 18.3 12.7 12.0 11.0 5.12004 5.6 −2.8 6.2 6.6 12.6 −2.7 −3.7 −2.2 3.0 8.0 7.4 7.2 8.4 4.7 16.1 10.6 11.12005 3.5 3.8 9.1 4.9 −3.6 2.7 6.3 2.7 11.3 10.0 6.9 9.1 0.3 5.3 −7.5 −0.7 −2.52006 16.9 22.5 16.0 16.1 13.5 26.7 16.9 24.1 13.3 19.7 15.4 16.5 20.1 12.7 11.9 12.6 15.72007 7.1 1.0 5.0 4.1 19.1 −0.6 − 2.9 7.2 2.7 5.1 2.2 3.0 6.5 13.8 19.6 23.1
2008 9.8 16.0 15.9 16.3 −7.6 17.7 19.9 12.8 15.5 13.9 17.9 20.9 14.1 14.5 5.7 −7.3 −18.2
2009−8.6
−13.1
−14.1
−11.1 5.8
−12.5
−14.3
−13.5
−17.9
−13.6
−11.5
−16.0
−8.5
−8.9 0.5 4.8 12.12010 4.7 6.3 8.1 1.3 3.3 0.8 7.5 9.4 14.5 12.4 0.4 5.6 1.0 −1.9 0.3 6.9 2.8
2011 19.2 20.9 16.7 19.0 20.4 23.8 20.7 18.9 16.0 15.8 18.0 17.1 18.8 20.9 17.6 18.5 24.62012 .. .. .. .. .. 9.2 6.5 .. .. .. .. .. .. .. .. .. ..
The monthly periods consist of 4 weeks except for March, June, Septemberand December which are 5 weeks. Januar y 2008 is also a 5 week period.

8/2/2019 Ons Retail Report
http://slidepdf.com/reader/full/ons-retail-report 61/84
8CHAINED VOLUME OF RETAIL SALESNON-SEASONALLY ADJUSTEDIndex numbers of sales per week and percentage increase on a year earlier Index 2008=100
Year 1st Qtr 2nd Qtr 3rd Qtr 4th Qtr Jan Feb Mar Apr May June July Aug Sept Oct Nov Dec
SIC 2007 (SALES IN 2008)
All Retailing, Including Automotive Fuel, All Businesses (£321,178m)
2003 86.9 80.1 83.9 84.7 99.1 79.2 79.7 81.2 84.4 82.7 84.3 86.5 83.7 84.1 88.0 95.8 110.62004 91.6 84.3 89.0 89.7 103.5 83.4 83.4 85.7 88.8 88.7 89.5 91.3 88.9 89.0 92.8 100.7 114.52005 93.0 86.4 90.1 89.9 105.6 85.3 85.7 87.9 89.6 89.7 90.9 92.3 89.0 88.8 92.7 101.8 119.02006 96.2 88.3 93.8 93.3 109.5 86.9 87.4 90.0 93.6 93.4 94.2 95.6 92.8 92.0 96.4 104.9 123.82007 99.2 91.3 96.7 96.9 111.9 88.7 90.6 93.9 97.0 96.3 96.8 98.6 96.3 95.9 99.0 108.0 125.4
2008 100.0 94.3 98.0 96.7 111.4 92.3 94.9 95.9 96.8 100.1 97.4 98.8 96.1 95.5 99.0 107.8 124.42009 100.7 93.0 98.1 98.5 113.2 92.9 91.3 94.5 97.5 97.3 99.3 100.5 98.0 97.3 101.9 110.0 124.72010 100.3 92.8 97.9 98.3 112.4 89.6 92.3 95.8 96.3 98.3 98.9 101.0 97.9 96.4 101.1 109.9 123.42011 101.3 93.5 98.6 97.9 115.3 92.9 92.4 94.8 99.7 97.6 98.4 100.5 96.8 96.8 101.8 110.4 130.12012 .. .. .. .. .. 94.0 93.1 .. .. .. .. .. .. .. .. .. ..
Percentage increase on a year earlier
2003 3.2 2.6 3.0 3.4 3.1 3.7 2.2 1.7 2.5 1.0 5.1 3.0 3.2 3.9 3.4 2.8 3.02004 5.4 5.2 6.2 5.9 4.5 5.3 4.6 5.5 5.2 7.2 6.1 5.6 6.3 5.8 5.4 5.1 3.52005 1.5 2.6 1.3 0.3 2.0 2.2 2.8 2.6 0.9 1.2 1.6 1.1 − −0.2 − 1.1 3.92006 3.4 2.1 4.0 3.8 3.7 1.9 2.0 2.4 4.4 4.1 3.6 3.6 4.3 3.5 4.0 3.1 4.02007 3.1 3.4 3.1 3.8 2.2 2.1 3.6 4.3 3.6 3.1 2.8 3.1 3.8 4.3 2.7 3.0 1.3
2008 0.8 3.3 1.4 −0.2 −0.4 4.1 4.7 2.1 −0.2 3.9 0.6 0.1 −0.2 −0.5 −0.1 −0.2 −0.8
2009 0.7−1.4 0.1 1.9 1.6 0.7
−3.8
−1.4 0.8
−2.8 2.0 1.8 2.0 1.9 3.0 2.1 0.32010 −0.4 −0.3 −0.2 −0.2 −0.7 −3.6 1.1 1.3 −1.2 1.0 −0.4 0.5 −0.1 −0.9 −0.8 −0.1 −1.1
2011 1.0 0.8 0.7 −0.4 2.6 3.7 0.1 −1.0 3.5 −0.7 −0.5 −0.6 −1.2 0.4 0.7 0.4 5.42012 .. .. .. .. .. 1.2 0.7 .. .. .. .. .. .. .. .. .. ..
All Retailing, Including Automotive Fuel, Large Businesses (£245,671m)
2003 83.5 75.7 79.7 80.7 98.0 74.9 75.2 76.8 80.2 78.6 80.2 82.5 79.9 80.0 84.5 93.9 112.22004 88.5 80.8 85.1 85.8 102.4 80.2 79.9 82.1 85.2 84.8 85.1 86.9 85.3 85.4 89.2 98.6 116.12005 90.5 84.3 86.9 86.2 104.6 83.9 82.9 85.7 86.3 86.6 87.6 88.5 84.9 85.4 89.2 99.9 120.82006 94.4 86.0 91.0 91.1 109.6 85.0 84.9 87.6 91.3 90.8 91.0 93.5 90.3 89.9 94.1 103.7 126.62007 98.1 89.3 94.2 95.3 113.7 87.6 88.5 91.4 94.6 93.9 94.1 96.4 94.4 95.2 98.3 108.4 130.2
2008 100.0 94.0 96.8 95.9 113.8 93.1 93.7 95.2 95.0 99.4 96.0 97.8 95.4 94.8 98.7 109.1 129.52009 101.6 94.0 98.1 98.2 116.2 94.7 92.0 95.1 97.9 97.0 99.2 99.7 97.5 97.7 102.5 111.9 130.52010 103.3 96.0 99.9 99.8 117.4 94.0 94.7 98.8 98.0 100.1 101.2 102.0 99.0 98.7 103.4 113.4 131.72011 104.3 96.3 101.0 99.8 120.1 96.7 94.9 97.1 102.8 99.4 100.9 102.4 98.1 99.1 103.4 113.9 138.42012 .. .. .. .. .. 97.1 95.5 .. .. .. .. .. .. .. .. .. ..
Percentage increase on a year earlier
2003 5.7 4.9 5.9 6.0 5.3 6.0 4.7 3.8 5.6 4.0 7.7 5.9 5.7 6.3 5.7 4.8 5.32004 6.0 6.7 6.7 6.3 4.5 7.0 6.2 6.9 6.2 7.9 6.2 5.3 6.7 6.8 5.6 5.0 3.52005 2.2 4.3 2.1 0.4 2.2 4.6 3.8 4.3 1.3 2.1 2.9 1.9 −0.4 − − 1.3 4.12006 4.3 2.0 4.8 5.7 4.7 1.3 2.4 2.2 5.8 4.9 3.9 5.6 6.4 5.3 5.5 3.9 4.82007 3.9 3.9 3.4 4.6 3.8 3.1 4.2 4.3 3.6 3.4 3.4 3.1 4.5 5.9 4.4 4.5 2.9
2008 1.9 5.3 2.8 0.6 0.1 6.3 5.8 4.3 0.4 5.9 2.1 1.4 1.0 −0.4 0.4 0.7 −0.62009 1.6 − 1.4 2.4 2.1 1.7 −1.8 −0.1 3.1 −2.4 3.2 1.9 2.2 3.1 3.9 2.6 0.82010 1.6 2.1 1.8 1.6 1.0 −0.7 2.9 3.8 − 3.2 2.1 2.3 1.6 1.1 0.9 1.3 0.92011 1.0 0.3 1.2 − 2.3 2.8 0.2 −1.7 4.9 −0.7 −0.3 0.4 −0.9 0.4 − 0.4 5.12012 .. .. .. .. .. 0.5 0.7 .. .. .. .. .. .. .. .. .. ..
All Retailing, Including Automotive Fuel, Small Businesses (£75,507m)
2003 98.1 94.5 97.5 97.8 102.5 93.1 94.6 95.5 98.3 96.0 98.1 99.5 96.2 97.7 99.5 101.7 105.52004 101.8 95.5 102.0 102.4 107.2 93.8 94.9 97.3 100.5 101.2 103.8 105.9 100.9 100.7 104.3 107.4 109.3
2005 101.3 93.5 100.8 102.1 108.8 89.8 94.8 95.3 100.4 100.0 101.8 104.6 102.3 100.0 104.1 108.0 113.22006 102.1 95.8 102.6 100.5 109.5 93.2 95.6 98.2 101.0 101.7 104.7 102.5 100.7 98.7 103.8 108.8 114.72007 102.7 97.6 104.9 102.0 106.2 92.3 97.3 102.1 104.6 104.2 105.7 105.8 102.5 98.5 101.3 106.8 109.6
2008 100.0 95.2 102.1 99.2 103.9 89.6 98.7 98.0 102.5 102.2 101.6 101.9 98.4 97.7 99.8 103.3 107.72009 97.7 89.7 98.0 99.4 103.4 87.2 88.8 92.5 96.2 98.0 99.6 103.3 99.8 96.0 99.9 103.7 106.02010 90.8 82.1 91.5 93.4 96.3 75.1 84.4 85.9 91.0 92.3 91.3 98.0 94.5 88.9 93.5 98.8 96.42011 91.6 84.3 90.5 91.8 99.8 80.5 84.2 87.4 89.8 91.5 90.3 94.1 92.4 89.3 96.3 99.3 103.12012 .. .. .. .. .. 83.7 84.9 .. .. .. .. .. .. .. .. .. ..
Percentage increase on a year earlier
2003 −3.3 −3.1 −4.1 −3.0 −3.3 −2.1 −3.8 −3.7 −5.1 −6.1 −1.5 −4.2 −3.1 −2.0 −2.4 −2.7 −4.52004 3.7 1.0 4.6 4.7 4.6 0.8 0.3 1.8 2.3 5.4 5.8 6.5 4.9 3.1 4.8 5.5 3.62005 −0.5 −2.1 −1.2 −0.3 1.5 −4.3 −0.1 −2.0 −0.1 −1.3 −1.9 −1.3 1.3 −0.7 −0.1 0.6 3.52006 0.8 2.6 1.8 −1.6 0.7 3.7 0.8 3.0 0.6 1.8 2.8 −2.0 −1.5 −1.3 −0.3 0.8 1.32007 0.5 1.8 2.2 1.5 −3.0 −0.9 1.7 4.0 3.6 2.4 1.0 3.2 1.7 −0.2 −2.5 −1.8 −4.4
2008 −2.6 −2.5 −2.7 −2.7 −2.1 −3.0 1.4 −4.0 −2.0 −1.9 −3.9 −3.6 −4.0 −0.8 −1.4 −3.3 −1.82009 −2.3 −5.7 −3.9 0.2 −0.5 −2.6 −10.1 −5.6 −6.2 −4.2 −2.0 1.4 1.4 −1.7 0.1 0.4 −1.62010 −7.0 −8.5 −6.7 −6.0 −6.9 −13.9 −4.9 −7.1 −5.4 −5.8 −8.3 −5.1 −5.3 −7.4 −6.4 −4.8 −9.02011 0.9 2.6
−1.1
−1.8 3.7 7.2
−0.2 1.7
−1.3
−0.8
−1.1
−4.0
−2.2 0.5 3.0 0.5 6.9
2012 .. .. .. .. .. 4.0 0.9 .. .. .. .. .. .. .. .. .. ..
The monthly periods consist of 4 weeks except for March, June, Septemberand December which are 5 weeks. Januar y 2008 is also a 5 week period.
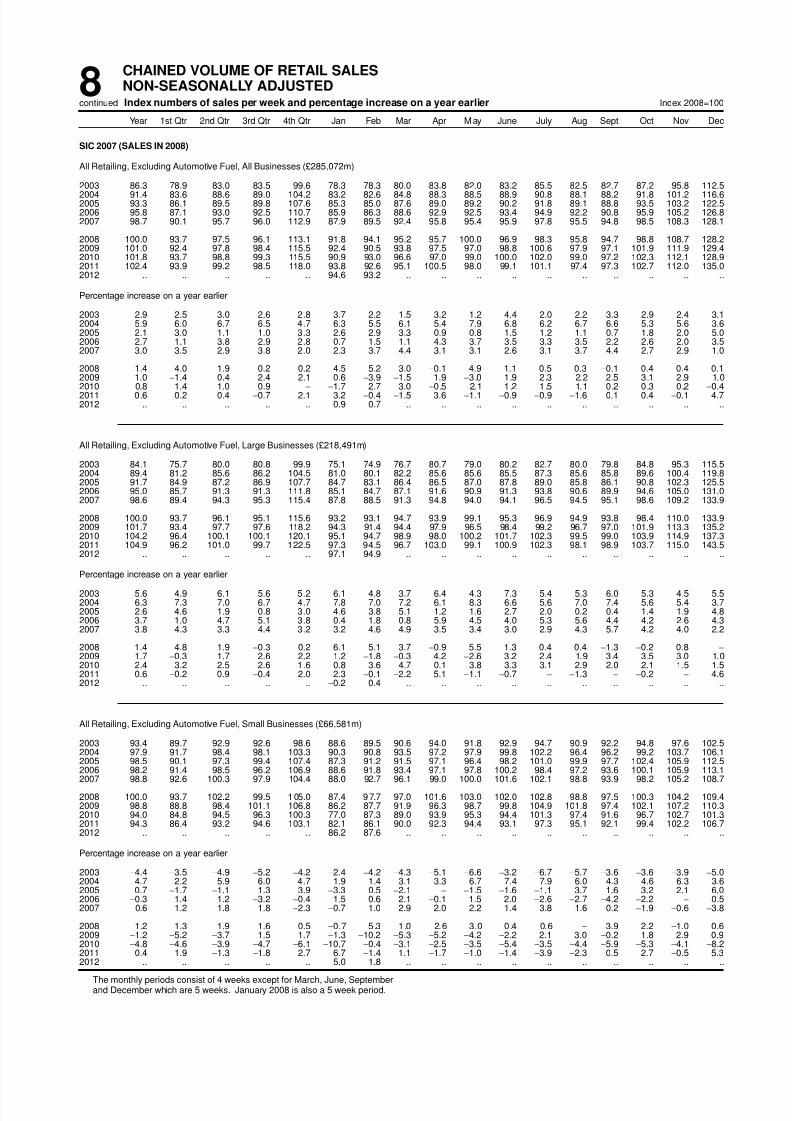
8/2/2019 Ons Retail Report
http://slidepdf.com/reader/full/ons-retail-report 62/84
8CHAINED VOLUME OF RETAIL SALESNON-SEASONALLY ADJUSTEDIndex numbers of sales per week and percentage increase on a year earliercontinued Index 2008=100
Year 1st Qtr 2nd Qtr 3rd Qtr 4th Qtr Jan Feb Mar Apr May June July Aug Sept Oct Nov Dec
SIC 2007 (SALES IN 2008)
All Retailing, Excluding Automotive Fuel, All Businesses (£285,072m)
2003 86.3 78.9 83.0 83.5 99.6 78.3 78.3 80.0 83.8 82.0 83.2 85.5 82.5 82.7 87.2 95.8 112.52004 91.4 83.6 88.6 89.0 104.2 83.2 82.6 84.8 88.3 88.5 88.9 90.8 88.1 88.2 91.8 101.2 116.62005 93.3 86.1 89.5 89.8 107.6 85.3 85.0 87.6 89.0 89.2 90.2 91.8 89.1 88.8 93.5 103.2 122.52006 95.8 87.1 93.0 92.5 110.7 85.9 86.3 88.6 92.9 92.5 93.4 94.9 92.2 90.8 95.9 105.2 126.82007 98.7 90.1 95.7 96.0 112.9 87.9 89.5 92.4 95.8 95.4 95.9 97.8 95.5 94.8 98.5 108.3 128.1
2008 100.0 93.7 97.5 96.1 113.1 91.8 94.1 95.2 95.7 100.0 96.9 98.3 95.8 94.7 98.8 108.7 128.22009 101.0 92.4 97.8 98.4 115.5 92.4 90.5 93.8 97.5 97.0 98.8 100.6 97.9 97.1 101.9 111.9 129.42010 101.8 93.7 98.8 99.3 115.5 90.9 93.0 96.6 97.0 99.0 100.0 102.0 99.0 97.2 102.3 112.1 128.92011 102.4 93.9 99.2 98.5 118.0 93.8 92.6 95.1 100.5 98.0 99.1 101.1 97.4 97.3 102.7 112.0 135.02012 .. .. .. .. .. 94.6 93.2 .. .. .. .. .. .. .. .. .. ..
Percentage increase on a year earlier
2003 2.9 2.5 3.0 2.6 2.8 3.7 2.2 1.5 3.2 1.2 4.4 2.0 2.2 3.3 2.9 2.4 3.12004 5.9 6.0 6.7 6.5 4.7 6.3 5.5 6.1 5.4 7.9 6.8 6.2 6.7 6.6 5.3 5.6 3.62005 2.1 3.0 1.1 1.0 3.3 2.6 2.9 3.3 0.9 0.8 1.5 1.2 1.1 0.7 1.8 2.0 5.02006 2.7 1.1 3.8 2.9 2.8 0.7 1.5 1.1 4.3 3.7 3.5 3.3 3.5 2.2 2.6 2.0 3.52007 3.0 3.5 2.9 3.8 2.0 2.3 3.7 4.4 3.1 3.1 2.6 3.1 3.7 4.4 2.7 2.9 1.0
2008 1.4 4.0 1.9 0.2 0.2 4.5 5.2 3.0 −0.1 4.9 1.1 0.5 0.3 −0.1 0.4 0.4 0.1
2009 1.0−1.4 0.4 2.4 2.1 0.6
−3.9
−1.5 1.9
−3.0 1.9 2.3 2.2 2.5 3.1 2.9 1.02010 0.8 1.4 1.0 0.9 − −1.7 2.7 3.0 −0.5 2.1 1.2 1.5 1.1 0.2 0.3 0.2 −0.4
2011 0.6 0.2 0.4 −0.7 2.1 3.2 −0.4 −1.5 3.6 −1.1 −0.9 −0.9 −1.6 0.1 0.4 −0.1 4.72012 .. .. .. .. .. 0.9 0.7 .. .. .. .. .. .. .. .. .. ..
All Retailing, Excluding Automotive Fuel, Large Businesses (£218,491m)
2003 84.1 75.7 80.0 80.8 99.9 75.1 74.9 76.7 80.7 79.0 80.2 82.7 80.0 79.8 84.8 95.3 115.52004 89.4 81.2 85.6 86.2 104.5 81.0 80.1 82.2 85.6 85.6 85.5 87.3 85.6 85.8 89.6 100.4 119.82005 91.7 84.9 87.2 86.9 107.7 84.7 83.1 86.4 86.5 87.0 87.8 89.0 85.8 86.1 90.8 102.3 125.52006 95.0 85.7 91.3 91.3 111.8 85.1 84.7 87.1 91.6 90.9 91.3 93.8 90.6 89.9 94.6 105.0 131.02007 98.6 89.4 94.3 95.3 115.4 87.8 88.5 91.3 94.8 94.0 94.1 96.5 94.5 95.1 98.6 109.2 133.9
2008 100.0 93.7 96.1 95.1 115.6 93.2 93.1 94.7 93.9 99.1 95.3 96.9 94.9 93.8 98.4 110.0 133.92009 101.7 93.4 97.7 97.6 118.2 94.3 91.4 94.4 97.9 96.5 98.4 99.2 96.7 97.0 101.9 113.3 135.22010 104.2 96.4 100.1 100.1 120.1 95.1 94.7 98.9 98.0 100.2 101.7 102.3 99.5 99.0 103.9 114.9 137.32011 104.9 96.2 101.0 99.7 122.5 97.3 94.5 96.7 103.0 99.1 100.9 102.3 98.1 98.9 103.7 115.0 143.52012 .. .. .. .. .. 97.1 94.9 .. .. .. .. .. .. .. .. .. ..
Percentage increase on a year earlier
2003 5.6 4.9 6.1 5.6 5.2 6.1 4.8 3.7 6.4 4.3 7.3 5.4 5.3 6.0 5.3 4.5 5.52004 6.3 7.3 7.0 6.7 4.7 7.8 7.0 7.2 6.1 8.3 6.6 5.6 7.0 7.4 5.6 5.4 3.72005 2.6 4.6 1.9 0.8 3.0 4.6 3.8 5.1 1.2 1.6 2.7 2.0 0.2 0.4 1.4 1.9 4.82006 3.7 1.0 4.7 5.1 3.8 0.4 1.8 0.8 5.9 4.5 4.0 5.3 5.6 4.4 4.2 2.6 4.32007 3.8 4.3 3.3 4.4 3.2 3.2 4.6 4.9 3.5 3.4 3.0 2.9 4.3 5.7 4.2 4.0 2.2
2008 1.4 4.8 1.9 −0.3 0.2 6.1 5.1 3.7 −0.9 5.5 1.3 0.4 0.4 −1.3 −0.2 0.8 −
2009 1.7 −0.3 1.7 2.6 2.2 1.2 −1.8 −0.3 4.2 −2.6 3.2 2.4 1.9 3.4 3.5 3.0 1.02010 2.4 3.2 2.5 2.6 1.6 0.8 3.6 4.7 0.1 3.8 3.3 3.1 2.9 2.0 2.1 1.5 1.52011 0.6 −0.2 0.9 −0.4 2.0 2.3 −0.1 −2.2 5.1 −1.1 −0.7 − −1.3 − −0.2 − 4.62012 .. .. .. .. .. −0.2 0.4 .. .. .. .. .. .. .. .. .. ..
All Retailing, Excluding Automotive Fuel, Small Businesses (£66,581m)
2003 93.4 89.7 92.9 92.6 98.6 88.6 89.5 90.6 94.0 91.8 92.9 94.7 90.9 92.2 94.8 97.6 102.52004 97.9 91.7 98.4 98.1 103.3 90.3 90.8 93.5 97.2 97.9 99.8 102.2 96.4 96.2 99.2 103.7 106.1
2005 98.5 90.1 97.3 99.4 107.4 87.3 91.2 91.5 97.1 96.4 98.2 101.0 99.9 97.7 102.4 105.9 112.52006 98.2 91.4 98.5 96.2 106.9 88.6 91.8 93.4 97.1 97.8 100.2 98.4 97.2 93.6 100.1 105.9 113.12007 98.8 92.6 100.3 97.9 104.4 88.0 92.7 96.1 99.0 100.0 101.6 102.1 98.8 93.9 98.2 105.2 108.7
2008 100.0 93.7 102.2 99.5 105.0 87.4 97.7 97.0 101.6 103.0 102.0 102.8 98.8 97.5 100.3 104.2 109.42009 98.8 88.8 98.4 101.1 106.8 86.2 87.7 91.9 96.3 98.7 99.8 104.9 101.8 97.4 102.1 107.2 110.32010 94.0 84.8 94.5 96.3 100.3 77.0 87.3 89.0 93.9 95.3 94.4 101.3 97.4 91.6 96.7 102.7 101.32011 94.3 86.4 93.2 94.6 103.1 82.1 86.1 90.0 92.3 94.4 93.1 97.3 95.1 92.1 99.4 102.2 106.72012 .. .. .. .. .. 86.2 87.6 .. .. .. .. .. .. .. .. .. ..
Percentage increase on a year earlier
2003 −4.4 −3.5 −4.9 −5.2 −4.2 −2.4 −4.2 −4.3 −5.1 −6.6 −3.2 −6.7 −5.7 −3.6 −3.6 −3.9 −5.02004 4.7 2.2 5.9 6.0 4.7 1.9 1.4 3.1 3.3 6.7 7.4 7.9 6.0 4.3 4.6 6.3 3.62005 0.7 −1.7 −1.1 1.3 3.9 −3.3 0.5 −2.1 − −1.5 −1.6 −1.1 3.7 1.6 3.2 2.1 6.02006 −0.3 1.4 1.2 −3.2 −0.4 1.5 0.6 2.1 −0.1 1.5 2.0 −2.6 −2.7 −4.2 −2.2 − 0.52007 0.6 1.2 1.8 1.8 −2.3 −0.7 1.0 2.9 2.0 2.2 1.4 3.8 1.6 0.2 −1.9 −0.6 −3.8
2008 1.2 1.3 1.9 1.6 0.5 −0.7 5.3 1.0 2.6 3.0 0.4 0.6 − 3.9 2.2 −1.0 0.62009 −1.2 −5.2 −3.7 1.5 1.7 −1.3 −10.2 −5.3 −5.2 −4.2 −2.2 2.1 3.0 −0.2 1.8 2.9 0.92010 −4.8 −4.6 −3.9 −4.7 −6.1 −10.7 −0.4 −3.1 −2.5 −3.5 −5.4 −3.5 −4.4 −5.9 −5.3 −4.1 −8.22011 0.4 1.9
−1.3
−1.8 2.7 6.7
−1.4 1.1
−1.7
−1.0
−1.4
−3.9
−2.3 0.5 2.7
−0.5 5.3
2012 .. .. .. .. .. 5.0 1.8 .. .. .. .. .. .. .. .. .. ..
The monthly periods consist of 4 weeks except for March, June, Septemberand December which are 5 weeks. Januar y 2008 is also a 5 week period.

8/2/2019 Ons Retail Report
http://slidepdf.com/reader/full/ons-retail-report 63/84
8CHAINED VOLUME OF RETAIL SALESNON-SEASONALLY ADJUSTEDIndex numbers of sales per week and percentage increase on a year earliercontinued Index 2008=100
Year 1st Qtr 2nd Qtr 3rd Qtr 4th Qtr Jan Feb Mar Apr May June July Aug Sept Oct Nov Dec
SIC 2007 (SALES IN 2008)
Predominantly Food Stores, All Businesses (£129,162m)
2003 92.8 88.6 92.5 91.7 98.6 86.5 88.6 90.2 93.3 91.0 93.0 92.9 92.2 90.2 91.7 95.9 106.32004 96.2 91.2 95.7 95.2 102.8 89.1 91.2 92.8 95.1 95.6 96.2 96.0 95.9 93.9 95.5 100.3 110.62005 98.3 93.8 97.4 96.6 105.4 91.6 93.6 95.7 96.7 97.0 98.2 98.4 96.2 95.3 97.1 102.4 114.42006 99.8 94.3 99.6 98.5 106.6 90.7 95.3 96.5 99.4 98.4 100.7 101.3 97.6 96.9 98.0 102.5 116.82007 100.5 96.0 100.1 99.3 106.8 92.2 96.8 98.4 100.5 100.0 99.9 100.1 99.8 98.3 98.7 103.5 115.9
2008 100.0 97.8 100.1 97.2 105.0 94.7 99.4 99.7 98.9 101.8 99.7 98.7 96.7 96.5 98.6 103.4 111.52009 101.1 96.4 101.4 99.6 107.1 93.8 96.6 98.2 101.0 100.4 102.5 100.3 99.8 98.8 99.4 104.8 115.12010 99.6 96.5 100.0 97.1 104.7 93.9 95.9 99.1 97.0 100.6 101.8 98.7 97.0 95.9 97.3 103.3 111.72011 98.7 93.7 98.8 96.6 105.9 90.9 93.4 96.0 101.5 97.4 97.8 97.8 96.5 95.7 97.8 102.1 115.42012 .. .. .. .. .. 90.6 94.0 .. .. .. .. .. .. .. .. .. ..
Percentage increase on a year earlier
2003 2.9 3.5 3.3 2.9 1.7 4.7 2.6 2.6 4.9 1.1 3.8 2.3 3.5 2.8 2.5 1.7 1.32004 3.6 2.9 3.4 3.8 4.2 3.0 2.9 2.8 1.9 5.0 3.4 3.4 4.0 4.1 4.1 4.6 4.12005 2.2 2.9 1.8 1.4 2.6 2.8 2.7 3.1 1.7 1.5 2.0 2.6 0.2 1.5 1.7 2.1 3.52006 1.5 0.6 2.3 2.0 1.2 −1.0 1.8 0.9 2.8 1.4 2.6 2.9 1.5 1.7 0.9 0.1 2.12007 0.8 1.7 0.5 0.9 0.1 1.7 1.5 2.0 1.1 1.7 −0.8 −1.1 2.2 1.4 0.7 1.0 −0.8
2008 −0.5 1.9 − −2.1 −1.6 2.7 2.7 1.3 −1.5 1.8 −0.2 −1.5 −3.0 −1.9 − −0.1 −3.8
2009 1.1−1.5 1.3 2.4 1.9
−0.9
−2.8
−1.5 2.1
−1.4 2.8 1.6 3.2 2.5 0.8 1.3 3.22010 −1.5 0.2 −1.4 −2.5 −2.2 − −0.7 0.9 −3.9 0.3 −0.7 −1.6 −2.8 −2.9 −2.1 −1.5 −2.9
2011 −0.8 −3.0 −1.2 −0.5 1.2 −3.2 −2.6 −3.1 4.6 −3.2 −3.9 −0.9 −0.5 −0.2 0.5 −1.1 3.32012 .. .. .. .. .. −0.4 0.7 .. .. .. .. .. .. .. .. .. ..
Predominantly Food Stores, Large Businesses (£108,742m)
2003 91.1 86.4 90.5 89.6 98.0 84.3 86.3 88.1 91.1 88.7 91.4 90.6 90.1 88.4 90.0 95.1 106.92004 94.8 90.0 94.0 93.2 102.1 88.0 90.1 91.5 93.5 93.9 94.4 93.8 93.6 92.4 93.5 99.2 111.32005 97.6 93.5 96.5 95.2 105.1 91.4 93.1 95.5 95.5 96.2 97.6 97.1 94.5 94.1 95.5 101.5 115.62006 99.1 93.8 98.7 97.6 106.3 90.2 94.4 96.1 98.6 97.1 100.1 100.1 96.4 96.5 96.7 101.8 117.62007 100.8 95.9 99.9 99.2 108.0 92.2 96.5 98.5 100.2 99.7 99.9 99.6 99.3 98.7 98.8 104.4 118.3
2008 100.0 98.2 99.5 96.6 105.9 95.2 99.2 100.3 97.9 101.3 99.4 97.8 95.8 96.3 98.3 104.2 113.32009 101.6 96.9 101.1 99.3 109.1 95.1 96.6 98.5 100.8 99.9 102.4 99.5 99.0 99.3 100.0 106.5 118.42010 101.7 98.9 101.3 98.7 107.9 96.3 97.9 101.8 98.6 101.9 103.1 99.9 98.2 98.0 99.3 105.6 116.72011 100.5 96.0 100.4 97.3 108.2 93.6 95.9 98.1 103.4 98.9 99.3 98.4 96.7 96.8 98.5 104.8 118.82012 .. .. .. .. .. 92.6 96.2 .. .. .. .. .. .. .. .. .. ..
Percentage increase on a year earlier
2003 4.2 4.6 4.3 4.2 3.4 5.5 3.9 3.7 5.8 1.7 5.2 3.8 5.0 3.8 3.5 3.2 3.42004 4.0 4.1 3.9 4.0 4.1 4.3 4.4 3.8 2.6 5.8 3.3 3.5 3.9 4.5 3.9 4.3 4.22005 2.9 3.9 2.7 2.1 2.9 3.9 3.3 4.4 2.2 2.5 3.3 3.6 1.0 1.9 2.1 2.3 3.82006 1.6 0.3 2.3 2.5 1.2 −1.3 1.4 0.6 3.2 0.9 2.6 3.1 2.0 2.5 1.3 0.3 1.72007 1.7 2.3 1.2 1.7 1.6 2.2 2.1 2.4 1.7 2.6 −0.2 −0.5 3.1 2.4 2.2 2.5 0.6
2008 −0.7 2.4 −0.4 −2.6 −2.0 3.3 2.9 1.8 −2.3 1.6 −0.5 −1.8 −3.5 −2.5 −0.5 −0.2 −4.22009 1.6 −1.3 1.6 2.8 3.0 −0.1 −2.7 −1.8 2.9 −1.4 3.0 1.8 3.3 3.1 1.8 2.2 4.52010 0.1 2.1 0.2 −0.6 −1.1 1.2 1.4 3.4 −2.2 2.0 0.7 0.4 −0.8 −1.2 −0.7 −0.9 −1.42011 −1.2 −2.9 −0.9 −1.4 0.3 −2.8 −2.0 −3.6 4.8 −2.9 −3.7 −1.5 −1.5 −1.3 −0.8 −0.8 1.82012 .. .. .. .. .. −1.0 0.3 .. .. .. .. .. .. .. .. .. ..
Predominantly Food Stores, Small Businesses (£20,421m)
2003 102.0 100.3 103.4 102.6 101.5 98.4 100.9 101.4 105.0 103.2 102.1 104.9 103.7 100.0 101.2 100.1 103.02004 103.6 97.4 104.8 105.9 106.4 95.5 96.8 99.5 103.6 104.6 105.9 107.9 108.5 102.2 106.1 106.4 106.6
2005 102.2 95.4 101.9 104.1 107.3 92.9 96.6 96.5 102.9 101.3 101.5 105.5 105.0 102.1 105.9 107.4 108.22006 103.4 97.5 104.2 103.4 108.4 93.4 100.2 98.6 103.7 104.9 104.0 107.7 104.1 99.5 105.0 106.1 113.02007 99.5 96.5 101.1 100.1 100.2 92.2 98.4 98.4 101.8 101.6 100.1 103.1 102.1 96.2 98.0 98.9 102.9
2008 100.0 95.9 103.2 100.6 100.7 91.8 100.0 96.6 104.4 104.4 101.2 103.4 101.5 97.6 100.5 99.5 101.72009 98.5 93.7 102.7 101.2 96.3 87.0 96.8 96.7 101.9 103.0 103.1 104.2 104.2 96.5 95.9 95.5 97.42010 88.2 83.8 92.7 88.8 87.4 81.1 85.1 84.9 88.7 94.1 94.8 92.2 90.5 84.8 87.0 90.8 85.02011 89.4 81.1 90.2 93.0 93.3 76.7 80.1 85.3 91.5 89.6 89.7 94.5 95.4 90.0 93.9 87.9 97.22012 .. .. .. .. .. 79.8 82.5 .. .. .. .. .. .. .. .. .. ..
Percentage increase on a year earlier
2003 −2.8 −1.2 −1.2 −2.8 −6.0 1.4 −3.0 −2.6 0.8 −1.3 −2.7 −4.1 −2.9 −1.7 −2.5 −5.6 −8.92004 1.6 −2.9 1.4 3.2 4.8 −3.0 −4.1 −1.8 −1.4 1.3 3.7 2.9 4.6 2.2 4.8 6.3 3.62005 −1.4 −2.0 −2.8 −1.7 0.8 −2.7 −0.1 −3.0 −0.7 −3.2 −4.1 −2.2 −3.2 −0.2 −0.1 0.9 1.52006 1.2 2.2 2.3 −0.6 1.1 0.5 3.6 2.2 0.8 3.6 2.4 2.0 −0.9 −2.5 −0.9 −1.2 4.42007 −3.8 −1.0 −3.0 −3.2 −7.6 −1.2 −1.8 −0.3 −1.9 −3.1 −3.8 −4.3 −2.0 −3.3 −6.7 −6.8 −8.9
2008 0.5 −0.6 2.1 0.5 0.5 −0.5 1.7 −1.8 2.6 2.7 1.2 0.4 −0.6 1.5 2.6 0.6 −1.22009 −1.5 −2.2 −0.4 0.6 −4.3 −5.3 −3.3 0.1 −2.4 −1.3 1.9 0.7 2.6 −1.2 −4.6 −4.0 −4.32010 −10.5 −10.6 −9.8 −12.2 −9.3 −6.7 −12.0 −12.2 −13.0 −8.6 −8.1 −11.5 −13.1 −12.1 −9.4 −5.0 −12.72011 1.4
−3.3
−2.7 4.7 6.8
−5.5
−5.9 0.4 3.2
−4.9
−5.4 2.5 5.4 6.1 8.0
−3.1 14.3
2012 .. .. .. .. .. 4.0 3.0 .. .. .. .. .. .. .. .. .. ..
The monthly periods consist of 4 weeks except for March, June, Septemberand December which are 5 weeks. Januar y 2008 is also a 5 week period.

8/2/2019 Ons Retail Report
http://slidepdf.com/reader/full/ons-retail-report 64/84
8CHAINED VOLUME OF RETAIL SALESNON-SEASONALLY ADJUSTEDIndex numbers of sales per week and percentage increase on a year earliercontinued Index 2008=100
Year 1st Qtr 2nd Qtr 3rd Qtr 4th Qtr Jan Feb Mar Apr May June July Aug Sept Oct Nov Dec
SIC 2007 (SALES IN 2008)
Non Specialised Food Stores, All Businesses (£117,265m)
2003 90.0 85.6 89.4 88.8 96.0 83.7 85.5 87.2 90.1 87.9 90.1 89.7 89.4 87.6 89.0 93.6 103.62004 94.1 89.2 93.4 92.9 100.8 87.3 89.3 90.7 92.8 93.3 93.9 93.5 93.5 91.9 93.3 98.5 108.62005 96.8 92.7 95.6 94.9 103.8 90.7 92.5 94.5 94.9 95.3 96.5 96.8 94.3 93.7 95.2 101.0 113.02006 98.8 93.5 98.4 97.6 105.5 90.1 94.2 95.6 98.2 97.2 99.7 100.2 96.5 96.4 97.0 101.6 115.62007 100.3 96.0 99.7 99.0 106.7 92.4 96.7 98.3 100.1 99.5 99.4 99.5 99.4 98.3 98.5 103.5 115.8
2008 100.0 98.3 99.9 96.9 105.0 95.4 99.7 100.2 98.7 101.6 99.5 98.1 96.3 96.3 98.4 103.6 111.52009 101.8 97.2 101.9 100.0 108.2 94.9 97.2 99.1 101.4 100.8 103.2 100.3 100.0 99.7 100.3 106.0 116.32010 101.3 98.3 101.5 98.7 106.7 95.7 97.6 100.8 98.3 102.1 103.4 99.9 98.4 97.9 98.7 105.0 114.42011 100.5 95.6 100.7 98.2 107.6 92.9 95.2 98.1 103.6 99.2 99.5 99.2 98.0 97.5 99.3 104.0 117.22012 .. .. .. .. .. 92.9 96.2 .. .. .. .. .. .. .. .. .. ..
Percentage increase on a year earlier
2003 4.3 4.8 4.6 4.2 3.3 5.9 3.8 4.1 6.2 2.3 5.1 3.5 5.1 4.1 3.7 3.0 3.22004 4.6 4.3 4.4 4.6 5.0 4.3 4.5 4.1 3.0 6.2 4.3 4.3 4.5 4.9 4.8 5.2 4.92005 2.9 3.9 2.4 2.1 3.0 4.0 3.6 4.1 2.3 2.1 2.7 3.5 0.9 2.0 2.0 2.6 4.02006 2.1 0.8 3.0 2.9 1.7 −0.7 1.9 1.2 3.5 2.0 3.3 3.6 2.3 2.9 1.8 0.6 2.32007 1.6 2.7 1.2 1.4 1.1 2.5 2.7 2.8 2.0 2.4 −0.3 −0.7 3.0 2.0 1.6 1.9 0.2
2008 −0.3 2.4 0.2 −2.2 −1.6 3.3 3.0 1.9 −1.4 2.1 − −1.4 −3.1 −2.1 −0.1 0.1 −3.7
2009 1.8−1.1 2.0 3.2 3.0
−0.5
−2.5
−1.1 2.8
−0.8 3.8 2.2 3.9 3.5 2.0 2.3 4.32010 −0.5 1.1 −0.5 −1.3 −1.4 0.9 0.4 1.7 −3.1 1.3 0.2 −0.4 −1.7 −1.8 −1.6 −1.0 −1.6
2011 −0.7 −2.7 −0.8 −0.5 0.9 −2.9 −2.4 −2.7 5.4 −2.8 −3.8 −0.7 −0.4 −0.4 0.6 −0.9 2.42012 .. .. .. .. .. − 1.1 .. .. .. .. .. .. .. .. .. ..
Non Specialised Food Stores, Large Businesses (£105,941m)
2003 90.3 85.5 89.6 88.8 97.2 83.6 85.3 87.2 90.3 88.0 90.5 89.7 89.3 87.6 89.2 94.3 105.72004 94.1 89.4 93.3 92.4 101.4 87.5 89.5 90.9 92.8 93.2 93.7 93.0 92.8 91.7 92.9 98.6 110.32005 96.9 93.0 95.9 94.5 104.3 91.0 92.6 95.0 94.9 95.6 96.9 96.6 93.8 93.5 94.9 100.9 114.72006 98.7 93.5 98.3 97.2 105.8 90.0 94.2 95.8 98.2 96.8 99.7 99.7 96.0 96.2 96.4 101.4 116.82007 100.5 95.7 99.6 98.9 107.6 92.0 96.2 98.3 99.9 99.4 99.5 99.3 99.0 98.6 98.6 104.1 117.7
2008 100.0 98.2 99.5 96.6 105.9 95.2 99.2 100.3 97.9 101.3 99.4 97.8 95.9 96.3 98.3 104.2 113.32009 101.8 97.1 101.2 99.4 109.3 95.3 96.8 98.7 100.9 100.0 102.5 99.6 99.0 99.5 100.3 106.8 118.52010 102.5 99.8 102.1 99.4 108.7 97.1 98.8 102.7 99.4 102.7 103.8 100.5 99.1 98.8 100.0 106.3 117.52011 101.2 96.7 101.2 98.0 109.0 94.3 96.7 98.8 104.2 99.7 100.0 99.0 97.4 97.6 99.3 105.5 119.52012 .. .. .. .. .. 93.3 97.0 .. .. .. .. .. .. .. .. .. ..
Percentage increase on a year earlier
2003 4.9 5.2 5.0 4.8 4.1 6.1 4.3 4.4 6.6 2.4 5.8 4.3 5.6 4.5 4.1 3.8 4.42004 4.3 4.6 4.0 4.1 4.3 4.7 4.9 4.2 2.8 5.9 3.6 3.6 4.0 4.7 4.1 4.5 4.32005 3.0 4.0 2.8 2.3 3.0 4.0 3.4 4.6 2.2 2.6 3.4 3.9 1.0 1.9 2.1 2.4 3.92006 1.8 0.5 2.6 2.8 1.4 −1.1 1.7 0.9 3.5 1.2 2.9 3.2 2.4 2.9 1.6 0.5 1.92007 1.8 2.3 1.3 1.8 1.8 2.3 2.1 2.5 1.7 2.7 −0.2 −0.5 3.2 2.5 2.3 2.6 0.8
2008 −0.5 2.6 −0.1 −2.4 −1.6 3.5 3.1 2.1 −2.0 1.9 −0.1 −1.5 −3.2 −2.4 −0.3 0.1 −3.82009 1.8 −1.1 1.7 2.9 3.2 0.1 −2.4 −1.6 3.1 −1.2 3.1 1.9 3.3 3.4 2.1 2.5 4.62010 0.7 2.8 0.9 − −0.6 1.8 2.1 4.0 −1.5 2.7 1.3 1.0 − −0.7 −0.2 −0.4 −0.92011 −1.2 −3.0 −0.9 −1.5 0.3 −2.9 −2.2 −3.8 4.8 −3.0 −3.7 −1.5 −1.6 −1.2 −0.7 −0.8 1.72012 .. .. .. .. .. −1.0 0.4 .. .. .. .. .. .. .. .. .. ..
Non Specialised Food Stores, Small Businesses (£11,324m)
2003 87.1 86.3 87.3 89.2 85.5 85.0 86.9 86.9 88.3 87.3 86.5 89.5 91.2 87.4 87.4 86.3 83.32004 93.6 87.5 94.5 96.9 95.5 85.6 87.2 89.3 92.2 94.5 96.4 98.6 99.7 93.3 97.3 97.2 92.6
2005 95.0 89.8 93.4 97.8 99.0 88.5 92.0 89.1 95.0 92.7 92.6 98.8 99.2 96.0 98.4 101.4 97.62006 99.3 93.2 99.6 101.3 103.3 91.7 94.7 93.2 97.6 100.8 100.1 105.2 100.8 98.6 102.6 102.8 104.32007 99.2 98.8 100.4 99.9 97.9 95.7 102.0 98.8 101.9 100.5 99.0 101.9 102.5 96.1 97.8 98.5 97.5
2008 100.0 99.8 103.5 99.4 97.3 96.8 104.4 99.2 106.0 105.1 100.3 101.7 100.3 96.9 99.4 98.5 94.62009 102.6 98.5 108.4 105.5 97.8 90.5 101.5 102.5 106.0 108.6 110.1 107.5 109.3 100.9 100.8 98.3 95.22010 89.7 84.1 95.2 91.6 88.0 83.1 86.3 83.2 88.0 96.8 99.8 93.9 92.0 89.3 86.7 91.9 85.92011 94.0 85.3 96.0 99.7 94.8 80.5 81.6 92.1 98.2 95.3 94.8 100.8 103.0 96.3 99.4 89.8 95.22012 .. .. .. .. .. 88.9 88.8 .. .. .. .. .. .. .. .. .. ..
Percentage increase on a year earlier
2003 −1.0 1.6 0.7 −1.1 −5.1 3.9 −1.0 1.3 2.2 1.3 −0.9 −3.3 − −0.2 −0.3 −5.3 −8.72004 7.5 1.4 8.3 8.6 11.7 0.7 0.4 2.7 4.4 8.2 11.5 10.2 9.4 6.7 11.4 12.7 11.12005 1.5 2.6 −1.2 1.0 3.7 3.5 5.4 −0.3 3.0 −1.8 −4.0 0.2 −0.5 2.9 1.1 4.3 5.42006 4.6 3.8 6.6 3.6 4.4 3.5 3.0 4.6 2.8 8.7 8.1 6.5 1.6 2.7 4.3 1.4 6.82007 −0.1 6.0 0.8 −1.5 −5.2 4.4 7.8 5.9 4.4 −0.3 −1.1 −3.1 1.7 −2.6 −4.7 −4.2 −6.5
2008 0.8 1.0 3.1 −0.4 −0.7 1.2 2.4 0.4 3.9 4.6 1.3 −0.2 −2.1 0.8 1.6 −0.1 −3.02009 2.6 −1.3 4.7 6.1 0.6 −6.5 −2.8 3.4 − 3.3 9.8 5.7 9.0 4.2 1.3 −0.2 0.62010 −12.5 −14.6 −12.1 −13.2 −10.1 −8.1 −15.0 −18.8 −17.0 −10.9 −9.4 −12.6 −15.8 −11.5 −13.9 −6.5 −9.72011 4.7 1.4 0.8 8.9 7.8
−3.2
−5.5 10.7 11.6
−1.5
−5.0 7.3 11.9 7.8 14.7
−2.3 10.8
2012 .. .. .. .. .. 10.6 8.8 .. .. .. .. .. .. .. .. .. ..
The monthly periods consist of 4 weeks except for March, June, Septemberand December which are 5 weeks. Januar y 2008 is also a 5 week period.
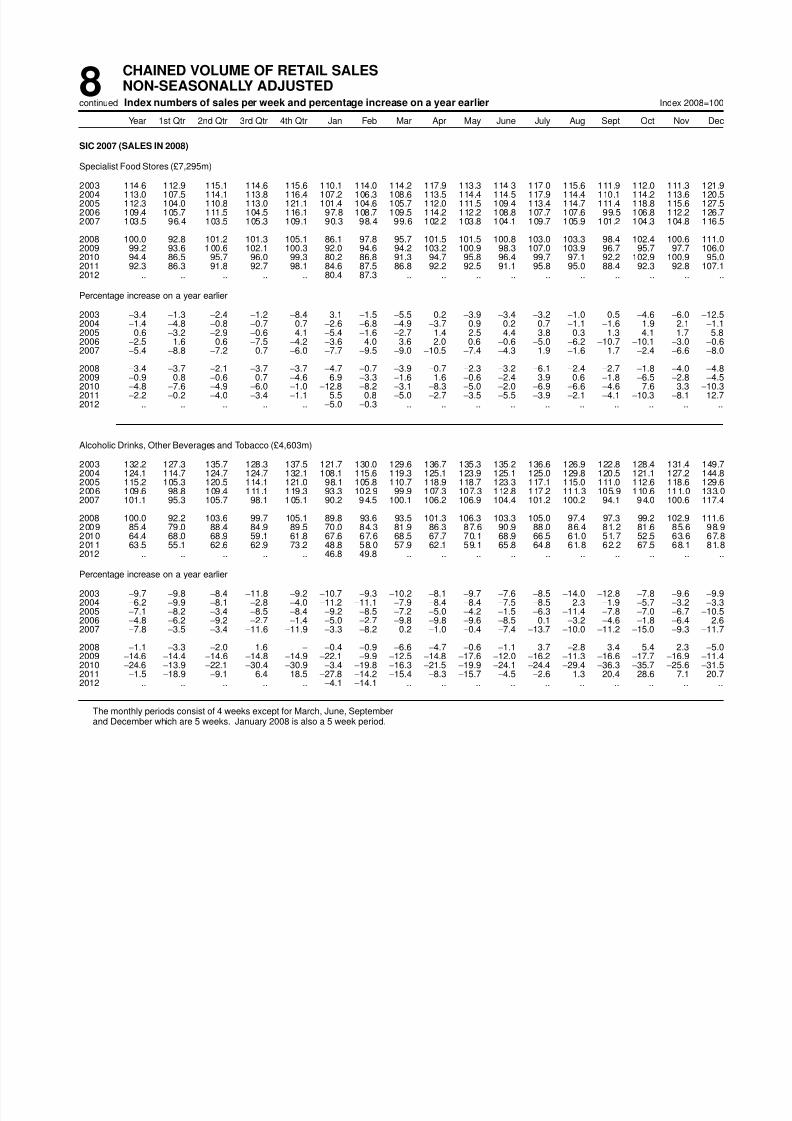
8/2/2019 Ons Retail Report
http://slidepdf.com/reader/full/ons-retail-report 65/84
8CHAINED VOLUME OF RETAIL SALESNON-SEASONALLY ADJUSTEDIndex numbers of sales per week and percentage increase on a year earliercontinued Index 2008=100
Year 1st Qtr 2nd Qtr 3rd Qtr 4th Qtr Jan Feb Mar Apr May June July Aug Sept Oct Nov Dec
SIC 2007 (SALES IN 2008)
Specialist Food Stores (£7,295m)
2003 114.6 112.9 115.1 114.6 115.6 110.1 114.0 114.2 117.9 113.3 114.3 117.0 115.6 111.9 112.0 111.3 121.92004 113.0 107.5 114.1 113.8 116.4 107.2 106.3 108.6 113.5 114.4 114.5 117.9 114.4 110.1 114.2 113.6 120.52005 112.3 104.0 110.8 113.0 121.1 101.4 104.6 105.7 112.0 111.5 109.4 113.4 114.7 111.4 118.8 115.6 127.52006 109.4 105.7 111.5 104.5 116.1 97.8 108.7 109.5 114.2 112.2 108.8 107.7 107.6 99.5 106.8 112.2 126.72007 103.5 96.4 103.5 105.3 109.1 90.3 98.4 99.6 102.2 103.8 104.1 109.7 105.9 101.2 104.3 104.8 116.5
2008 100.0 92.8 101.2 101.3 105.1 86.1 97.8 95.7 101.5 101.5 100.8 103.0 103.3 98.4 102.4 100.6 111.02009 99.2 93.6 1 00.6 102.1 100.3 92.0 94.6 94.2 103.2 100.9 98.3 107.0 103.9 96.7 95.7 97.7 106.02010 94.4 86.5 95.7 96.0 99.3 80.2 86.8 91.3 94.7 95.8 96.4 99.7 97.1 92.2 102.9 100.9 95.02011 92.3 86.3 91.8 92.7 98.1 84.6 87.5 86.8 92.2 92.5 91.1 95.8 95.0 88.4 92.3 92.8 107.12012 .. .. .. .. .. 80.4 87.3 .. .. .. .. .. .. .. .. .. ..
Percentage increase on a year earlier
2003 −3.4 −1.3 −2.4 −1.2 −8.4 3.1 −1.5 −5.5 0.2 −3.9 −3.4 −3.2 −1.0 0.5 −4.6 −6.0 −12.52004 −1.4 −4.8 −0.8 −0.7 0.7 −2.6 −6.8 −4.9 −3.7 0.9 0.2 0.7 −1.1 −1.6 1.9 2.1 −1.12005 −0.6 −3.2 −2.9 −0.6 4.1 −5.4 −1.6 −2.7 −1.4 −2.5 −4.4 −3.8 0.3 1.3 4.1 1.7 5.82006 −2.5 1.6 0.6 −7.5 −4.2 −3.6 4.0 3.6 2.0 0.6 −0.6 −5.0 −6.2 −10.7 −10.1 −3.0 −0.62007 −5.4 −8.8 −7.2 0.7 −6.0 −7.7 −9.5 −9.0 −10.5 −7.4 −4.3 1.9 −1.6 1.7 −2.4 −6.6 −8.0
2008 −3.4 −3.7 −2.1 −3.7 −3.7 −4.7 −0.7 −3.9 −0.7 −2.3 −3.2 −6.1 −2.4 −2.7 −1.8 −4.0 −4.8
2009−0.9 0.8
−0.6 0.7
−4.6 6.9
−3.3
−1.6 1.6
−0.6
−2.4 3.9 0.6
−1.8
−6.5
−2.8
−4.52010 −4.8 −7.6 −4.9 −6.0 −1.0 −12.8 −8.2 −3.1 −8.3 −5.0 −2.0 −6.9 −6.6 −4.6 7.6 3.3 −10.3
2011 −2.2 −0.2 −4.0 −3.4 −1.1 5.5 0.8 −5.0 −2.7 −3.5 −5.5 −3.9 −2.1 −4.1 −10.3 −8.1 12.72012 .. .. .. .. .. −5.0 −0.3 .. .. .. .. .. .. .. .. .. ..
Alcoholic Drinks, Other Beverages and Tobacco (£4,603m)
2003 132.2 127.3 135.7 128.3 137.5 121.7 130.0 129.6 136.7 135.3 135.2 136.6 126.9 122.8 128.4 131.4 149.72004 124.1 114.7 124.7 124.7 132.1 108.1 115.6 119.3 125.1 123.9 125.1 125.0 129.8 120.5 121.1 127.2 144.82005 115.2 105.3 120.5 114.1 121.0 98.1 105.8 110.7 118.9 118.7 123.3 117.1 115.0 111.0 112.6 118.6 129.62006 109.6 98.8 109.4 111.1 119.3 93.3 102.9 99.9 107.3 107.3 112.8 117.2 111.3 105.9 110.6 111.0 133.02007 101.1 95.3 105.7 98.1 105.1 90.2 94.5 100.1 106.2 106.9 104.4 101.2 100.2 94.1 94.0 100.6 117.4
2008 100.0 92.2 103.6 99.7 105.1 89.8 93.6 93.5 101.3 106.3 103.3 105.0 97.4 97.3 99.2 102.9 111.62009 85.4 79.0 88.4 84.9 89.5 70.0 84.3 81.9 86.3 87.6 90.9 88.0 86.4 81.2 81.6 85.6 98.92010 64.4 68.0 68.9 59.1 61.8 67.6 67.6 68.5 67.7 70.1 68.9 66.5 61.0 51.7 52.5 63.6 67.82011 63.5 55.1 62.6 62.9 73.2 48.8 58.0 57.9 62.1 59.1 65.8 64.8 61.8 62.2 67.5 68.1 81.82012 .. .. .. .. .. 46.8 49.8 .. .. .. .. .. .. .. .. .. ..
Percentage increase on a year earlier
2003 −9.7 −9.8 −8.4 −11.8 −9.2 −10.7 −9.3 −10.2 −8.1 −9.7 −7.6 −8.5 −14.0 −12.8 −7.8 −9.6 −9.92004 −6.2 −9.9 −8.1 −2.8 −4.0 −11.2 −11.1 −7.9 −8.4 −8.4 −7.5 −8.5 2.3 −1.9 −5.7 −3.2 −3.32005 −7.1 −8.2 −3.4 −8.5 −8.4 −9.2 −8.5 −7.2 −5.0 −4.2 −1.5 −6.3 −11.4 −7.8 −7.0 −6.7 −10.52006 −4.8 −6.2 −9.2 −2.7 −1.4 −5.0 −2.7 −9.8 −9.8 −9.6 −8.5 0.1 −3.2 −4.6 −1.8 −6.4 2.62007 −7.8 −3.5 −3.4 −11.6 −11.9 −3.3 −8.2 0.2 −1.0 −0.4 −7.4 −13.7 −10.0 −11.2 −15.0 −9.3 −11.7
2008 −1.1 −3.3 −2.0 1.6 − −0.4 −0.9 −6.6 −4.7 −0.6 −1.1 3.7 −2.8 3.4 5.4 2.3 −5.02009 −14.6 −14.4 −14.6 −14.8 −14.9 −22.1 −9.9 −12.5 −14.8 −17.6 −12.0 −16.2 −11.3 −16.6 −17.7 −16.9 −11.42010 −24.6 −13.9 −22.1 −30.4 −30.9 −3.4 −19.8 −16.3 −21.5 −19.9 −24.1 −24.4 −29.4 −36.3 −35.7 −25.6 −31.52011 −1.5 −18.9 −9.1 6.4 18.5 −27.8 −14.2 −15.4 −8.3 −15.7 −4.5 −2.6 1.3 20.4 28.6 7.1 20.72012 .. .. .. .. .. −4.1 −14.1 .. .. .. .. .. .. .. .. .. ..
The monthly periods consist of 4 weeks except for March, June, Septemberand December which are 5 weeks. Januar y 2008 is also a 5 week period.
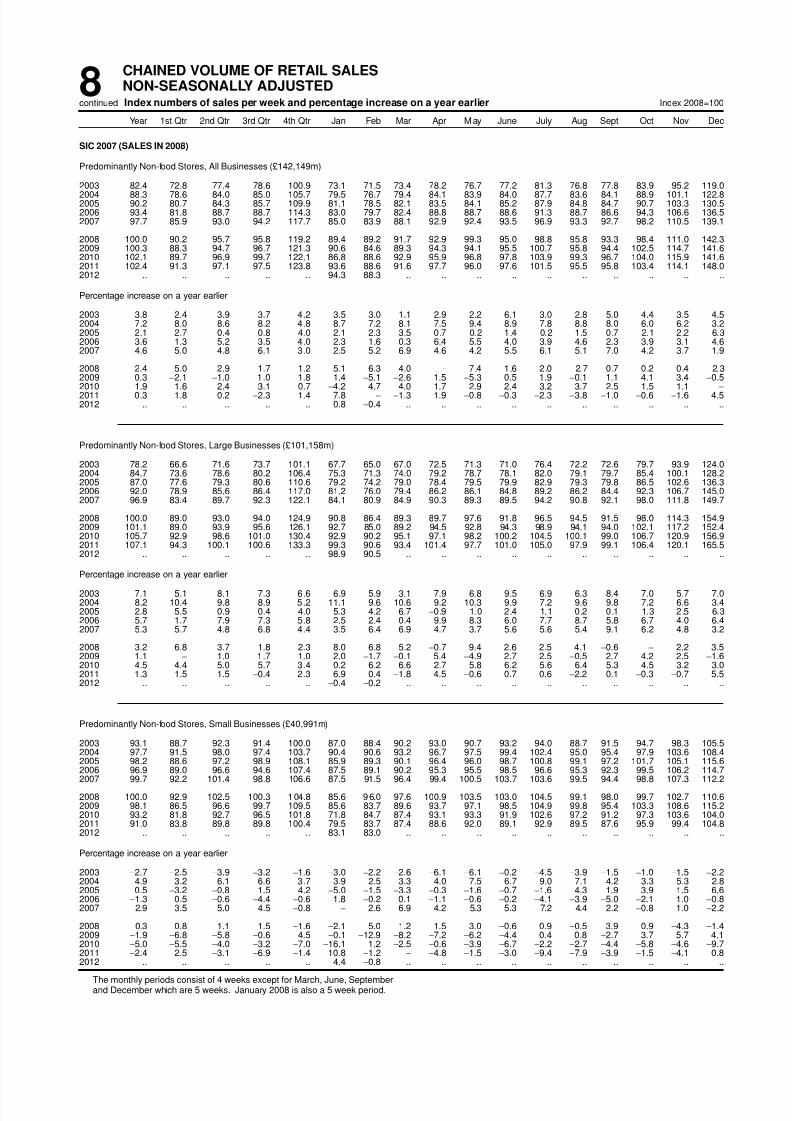
8/2/2019 Ons Retail Report
http://slidepdf.com/reader/full/ons-retail-report 66/84
8CHAINED VOLUME OF RETAIL SALESNON-SEASONALLY ADJUSTEDIndex numbers of sales per week and percentage increase on a year earliercontinued Index 2008=100
Year 1st Qtr 2nd Qtr 3rd Qtr 4th Qtr Jan Feb Mar Apr May June July Aug Sept Oct Nov Dec
SIC 2007 (SALES IN 2008)
Predominantly Non-food Stores, All Businesses (£142,149m)
2003 82.4 72.8 77.4 78.6 100.9 73.1 71.5 73.4 78.2 76.7 77.2 81.3 76.8 77.8 83.9 95.2 119.02004 88.3 78.6 84.0 85.0 105.7 79.5 76.7 79.4 84.1 83.9 84.0 87.7 83.6 84.1 88.9 101.1 122.82005 90.2 80.7 84.3 85.7 109.9 81.1 78.5 82.1 83.5 84.1 85.2 87.9 84.8 84.7 90.7 103.3 130.52006 93.4 81.8 88.7 88.7 114.3 83.0 79.7 82.4 88.8 88.7 88.6 91.3 88.7 86.6 94.3 106.6 136.52007 97.7 85.9 93.0 94.2 117.7 85.0 83.9 88.1 92.9 92.4 93.5 96.9 93.3 92.7 98.2 110.5 139.1
2008 100.0 90.2 95.7 95.8 119.2 89.4 89.2 91.7 92.9 99.3 95.0 98.8 95.8 93.3 98.4 111.0 142.32009 100.3 88.3 94.7 96.7 121.3 90.6 84.6 89.3 94.3 94.1 95.5 100.7 95.8 94.4 102.5 114.7 141.62010 102.1 89.7 96.9 99.7 122.1 86.8 88.6 92.9 95.9 96.8 97.8 103.9 99.3 96.7 104.0 115.9 141.62011 102.4 91.3 97.1 97.5 123.8 93.6 88.6 91.6 97.7 96.0 97.6 101.5 95.5 95.8 103.4 114.1 148.02012 .. .. .. .. .. 94.3 88.3 .. .. .. .. .. .. .. .. .. ..
Percentage increase on a year earlier
2003 3.8 2.4 3.9 3.7 4.2 3.5 3.0 1.1 2.9 2.2 6.1 3.0 2.8 5.0 4.4 3.5 4.52004 7.2 8.0 8.6 8.2 4.8 8.7 7.2 8.1 7.5 9.4 8.9 7.8 8.8 8.0 6.0 6.2 3.22005 2.1 2.7 0.4 0.8 4.0 2.1 2.3 3.5 −0.7 0.2 1.4 0.2 1.5 0.7 2.1 2.2 6.32006 3.6 1.3 5.2 3.5 4.0 2.3 1.6 0.3 6.4 5.5 4.0 3.9 4.6 2.3 3.9 3.1 4.62007 4.6 5.0 4.8 6.1 3.0 2.5 5.2 6.9 4.6 4.2 5.5 6.1 5.1 7.0 4.2 3.7 1.9
2008 2.4 5.0 2.9 1.7 1.2 5.1 6.3 4.0 − 7.4 1.6 2.0 2.7 0.7 0.2 0.4 2.3
2009 0.3−2.1
−1.0 1.0 1.8 1.4
−5.1
−2.6 1.5
−5.3 0.5 1.9
−0.1 1.1 4.1 3.4
−0.52010 1.9 1.6 2.4 3.1 0.7 −4.2 4.7 4.0 1.7 2.9 2.4 3.2 3.7 2.5 1.5 1.1 −
2011 0.3 1.8 0.2 −2.3 1.4 7.8 − −1.3 1.9 −0.8 −0.3 −2.3 −3.8 −1.0 −0.6 −1.6 4.52012 .. .. .. .. .. 0.8 −0.4 .. .. .. .. .. .. .. .. .. ..
Predominantly Non-food Stores, Large Businesses (£101,158m)
2003 78.2 66.6 71.6 73.7 101.1 67.7 65.0 67.0 72.5 71.3 71.0 76.4 72.2 72.6 79.7 93.9 124.02004 84.7 73.6 78.6 80.2 106.4 75.3 71.3 74.0 79.2 78.7 78.1 82.0 79.1 79.7 85.4 100.1 128.22005 87.0 77.6 79.3 80.6 110.6 79.2 74.2 79.0 78.4 79.5 79.9 82.9 79.3 79.8 86.5 102.6 136.32006 92.0 78.9 85.6 86.4 117.0 81.2 76.0 79.4 86.2 86.1 84.8 89.2 86.2 84.4 92.3 106.7 145.02007 96.9 83.4 89.7 92.3 122.1 84.1 80.9 84.9 90.3 89.3 89.5 94.2 90.8 92.1 98.0 111.8 149.7
2008 100.0 89.0 93.0 94.0 124.9 90.8 86.4 89.3 89.7 97.6 91.8 96.5 94.5 91.5 98.0 114.3 154.92009 101.1 89.0 93.9 95.6 126.1 92.7 85.0 89.2 94.5 92.8 94.3 98.9 94.1 94.0 102.1 117.2 152.42010 105.7 92.9 98.6 101.0 130.4 92.9 90.2 95.1 97.1 98.2 100.2 104.5 100.1 99.0 106.7 120.9 156.92011 107.1 94.3 100.1 100.6 133.3 99.3 90.6 93.4 101.4 97.7 101.0 105.0 97.9 99.1 106.4 120.1 165.52012 .. .. .. .. .. 98.9 90.5 .. .. .. .. .. .. .. .. .. ..
Percentage increase on a year earlier
2003 7.1 5.1 8.1 7.3 6.6 6.9 5.9 3.1 7.9 6.8 9.5 6.9 6.3 8.4 7.0 5.7 7.02004 8.2 10.4 9.8 8.9 5.2 11.1 9.6 10.6 9.2 10.3 9.9 7.2 9.6 9.8 7.2 6.6 3.42005 2.8 5.5 0.9 0.4 4.0 5.3 4.2 6.7 −0.9 1.0 2.4 1.1 0.2 0.1 1.3 2.5 6.32006 5.7 1.7 7.9 7.3 5.8 2.5 2.4 0.4 9.9 8.3 6.0 7.7 8.7 5.8 6.7 4.0 6.42007 5.3 5.7 4.8 6.8 4.4 3.5 6.4 6.9 4.7 3.7 5.6 5.6 5.4 9.1 6.2 4.8 3.2
2008 3.2 6.8 3.7 1.8 2.3 8.0 6.8 5.2 −0.7 9.4 2.6 2.5 4.1 −0.6 − 2.2 3.52009 1.1 − 1.0 1.7 1.0 2.0 −1.7 −0.1 5.4 −4.9 2.7 2.5 −0.5 2.7 4.2 2.5 −1.62010 4.5 4.4 5.0 5.7 3.4 0.2 6.2 6.6 2.7 5.8 6.2 5.6 6.4 5.3 4.5 3.2 3.02011 1.3 1.5 1.5 −0.4 2.3 6.9 0.4 −1.8 4.5 −0.6 0.7 0.6 −2.2 0.1 −0.3 −0.7 5.52012 .. .. .. .. .. −0.4 −0.2 .. .. .. .. .. .. .. .. .. ..
Predominantly Non-food Stores, Small Businesses (£40,991m)
2003 93.1 88.7 92.3 91.4 100.0 87.0 88.4 90.2 93.0 90.7 93.2 94.0 88.7 91.5 94.7 98.3 105.52004 97.7 91.5 98.0 97.4 103.7 90.4 90.6 93.2 96.7 97.5 99.4 102.4 95.0 95.4 97.9 103.6 108.4
2005 98.2 88.6 97.2 98.9 108.1 85.9 89.3 90.1 96.4 96.0 98.7 100.8 99.1 97.2 101.7 105.1 115.62006 96.9 89.0 96.6 94.6 107.4 87.5 89.1 90.2 95.3 95.5 98.5 96.6 95.3 92.3 99.5 106.2 114.72007 99.7 92.2 101.4 98.8 106.6 87.5 91.5 96.4 99.4 100.5 103.7 103.6 99.5 94.4 98.8 107.3 112.2
2008 100.0 92.9 102.5 100.3 104.8 85.6 96.0 97.6 100.9 103.5 103.0 104.5 99.1 98.0 99.7 102.7 110.62009 98.1 86.5 96.6 99.7 109.5 85.6 83.7 89.6 93.7 97.1 98.5 104.9 99.8 95.4 103.3 108.6 115.22010 93.2 81.8 92.7 96.5 101.8 71.8 84.7 87.4 93.1 93.3 91.9 102.6 97.2 91.2 97.3 103.6 104.02011 91.0 83.8 89.8 89.8 100.4 79.5 83.7 87.4 88.6 92.0 89.1 92.9 89.5 87.6 95.9 99.4 104.82012 .. .. .. .. .. 83.1 83.0 .. .. .. .. .. .. .. .. .. ..
Percentage increase on a year earlier
2003 −2.7 −2.5 −3.9 −3.2 −1.6 −3.0 −2.2 −2.6 −6.1 −6.1 −0.2 −4.5 −3.9 −1.5 −1.0 −1.5 −2.22004 4.9 3.2 6.1 6.6 3.7 3.9 2.5 3.3 4.0 7.5 6.7 9.0 7.1 4.2 3.3 5.3 2.82005 0.5 −3.2 −0.8 1.5 4.2 −5.0 −1.5 −3.3 −0.3 −1.6 −0.7 −1.6 4.3 1.9 3.9 1.5 6.62006 −1.3 0.5 −0.6 −4.4 −0.6 1.8 −0.2 0.1 −1.1 −0.6 −0.2 −4.1 −3.9 −5.0 −2.1 1.0 −0.82007 2.9 3.5 5.0 4.5 −0.8 − 2.6 6.9 4.2 5.3 5.3 7.2 4.4 2.2 −0.8 1.0 −2.2
2008 0.3 0.8 1.1 1.5 −1.6 −2.1 5.0 1.2 1.5 3.0 −0.6 0.9 −0.5 3.9 0.9 −4.3 −1.42009 −1.9 −6.8 −5.8 −0.6 4.5 −0.1 −12.9 −8.2 −7.2 −6.2 −4.4 0.4 0.8 −2.7 3.7 5.7 4.12010 −5.0 −5.5 −4.0 −3.2 −7.0 −16.1 1.2 −2.5 −0.6 −3.9 −6.7 −2.2 −2.7 −4.4 −5.8 −4.6 −9.72011
−2.4 2.5
−3.1
−6.9
−1.4 10.8
−1.2
− −4.8
−1.5
−3.0
−9.4
−7.9
−3.9
−1.5
−4.1 0.8
2012 .. .. .. .. .. 4.4 −0.8 .. .. .. .. .. .. .. .. .. ..
The monthly periods consist of 4 weeks except for March, June, Septemberand December which are 5 weeks. Januar y 2008 is also a 5 week period.

8/2/2019 Ons Retail Report
http://slidepdf.com/reader/full/ons-retail-report 67/84
8CHAINED VOLUME OF RETAIL SALESNON-SEASONALLY ADJUSTEDIndex numbers of sales per week and percentage increase on a year earliercontinued Index 2008=100
Year 1st Qtr 2nd Qtr 3rd Qtr 4th Qtr Jan Feb Mar Apr May June July Aug Sept Oct Nov Dec
SIC 2007 (SALES IN 2008)
Non Specialised Predominantly Non-food Stores, All Businesses (£24,040m)
2003 86.6 72.5 75.5 79.0 119.5 75.2 70.4 72.1 76.0 74.2 76.1 82.9 77.7 77.1 87.9 113.1 149.82004 90.5 76.6 80.0 83.5 121.7 78.5 74.7 76.6 79.5 79.9 80.5 85.5 83.9 81.6 89.4 117.6 150.92005 92.2 80.4 79.3 82.5 126.4 81.4 77.3 82.2 78.4 78.1 81.0 84.2 82.4 81.1 90.3 119.2 161.02006 96.3 80.8 85.4 87.6 131.6 81.9 77.5 82.6 86.1 85.4 84.7 90.8 88.4 84.5 95.9 121.9 167.92007 101.0 84.1 89.3 94.2 136.4 85.3 81.3 85.3 86.7 87.6 92.6 97.5 93.8 92.0 103.3 130.0 168.0
2008 100.0 86.6 89.4 90.9 134.1 87.4 85.4 86.9 86.5 90.0 91.2 94.0 90.9 88.4 98.6 128.0 167.42009 102.5 85.5 92.8 94.8 136.9 87.1 81.5 87.3 90.3 92.7 94.8 97.4 94.4 93.0 105.2 133.1 165.32010 109.2 92.7 100.2 101.7 142.3 91.6 90.5 95.4 95.0 100.2 104.4 104.0 101.8 99.8 109.2 136.2 173.62011 113.2 97.3 102.9 104.3 148.4 101.1 93.6 97.2 100.3 101.2 106.2 107.1 103.1 102.9 111.3 137.0 187.22012 .. .. .. .. .. 101.3 96.4 .. .. .. .. .. .. .. .. .. ..
Percentage increase on a year earlier
2003 4.3 2.5 5.6 3.3 4.5 4.2 2.4 1.6 5.7 3.0 7.6 1.6 4.4 3.8 5.3 2.2 5.52004 4.4 5.6 6.0 5.7 1.9 4.4 6.1 6.3 4.6 7.6 5.8 3.2 8.0 5.9 1.6 4.0 0.72005 1.9 5.0 −0.8 −1.3 3.8 3.6 3.5 7.3 −1.3 −2.2 0.7 −1.6 −1.8 −0.6 1.1 1.3 6.72006 4.5 0.5 7.6 6.2 4.1 0.7 0.3 0.5 9.8 9.3 4.6 7.8 7.2 4.1 6.2 2.3 4.32007 4.8 4.0 4.6 7.6 3.7 4.1 4.8 3.2 0.7 2.6 9.3 7.4 6.2 8.9 7.7 6.6 0.1
2008 −1.0 3.1 0.2 −3.6 −1.7 2.5 5.1 1.9 −0.3 2.8 −1.5 −3.6 −3.1 −3.9 −4.6 −1.6 −0.4
2009 2.5−1.4 3.8 4.3 2.1
−0.3
−4.6 0.5 4.4 3.0 3.9 3.6 3.9 5.3 6.7 4.0
−1.32010 6.6 8.5 8.0 7.2 4.0 5.2 11.1 9.2 5.2 8.1 10.1 6.7 7.7 7.3 3.9 2.4 5.0
2011 3.6 4.9 2.7 2.5 4.3 10.4 3.4 1.9 5.6 1.0 1.8 3.0 1.3 3.1 1.9 0.6 7.82012 .. .. .. .. .. 0.1 3.0 .. .. .. .. .. .. .. .. .. ..
Non Specialised Predominantly Non-food Stores, Large Businesses (£22,199m)
2003 83.4 68.6 71.1 75.4 118.7 71.6 66.2 68.1 71.6 69.7 71.8 79.2 73.5 74.0 85.3 112.0 150.72004 87.7 74.2 76.6 79.5 120.5 76.3 72.0 74.4 76.3 76.3 77.0 82.2 79.3 77.7 86.4 116.1 151.32005 89.9 78.3 76.5 79.4 125.4 79.9 74.8 79.9 75.7 75.2 78.2 81.3 79.4 78.0 88.1 117.8 161.32006 94.7 79.2 82.8 85.1 131.7 81.3 76.1 79.9 83.5 82.6 82.4 88.0 85.9 82.0 93.4 121.5 170.52007 99.2 82.7 86.5 91.6 135.8 85.0 79.5 83.4 84.0 85.0 89.7 94.7 91.0 89.6 101.0 129.1 169.2
2008 100.0 85.5 88.3 91.0 136.3 87.0 83.6 85.4 85.0 89.0 90.5 93.4 91.1 88.9 99.4 129.2 171.62009 99.4 83.2 89.4 90.9 134.1 84.7 79.4 84.9 87.9 88.6 91.2 93.5 89.7 89.7 101.5 128.5 164.62010 109.3 93.3 99.2 101.0 143.7 92.0 90.9 96.2 93.8 99.2 103.4 103.8 99.9 99.6 109.3 136.9 176.82011 112.6 96.2 102.1 103.0 149.1 100.7 91.9 96.2 99.1 99.5 106.7 105.8 101.6 101.7 110.3 136.9 189.92012 .. .. .. .. .. 99.8 94.5 .. .. .. .. .. .. .. .. .. ..
Percentage increase on a year earlier
2003 6.0 2.4 6.9 5.8 6.8 3.9 2.5 1.7 5.9 3.9 10.3 4.0 6.5 6.9 8.6 3.8 7.82004 5.1 8.2 7.8 5.4 1.6 6.5 8.8 9.2 6.6 9.6 7.2 3.7 7.8 5.0 1.3 3.6 0.42005 2.5 5.5 −0.1 −0.1 4.1 4.8 3.9 7.4 −0.8 −1.5 1.6 −1.0 0.1 0.4 1.9 1.5 6.62006 5.3 1.1 8.2 7.1 5.0 1.7 1.7 0.1 10.3 9.8 5.3 8.2 8.2 5.2 6.1 3.1 5.72007 4.7 4.4 4.5 7.7 3.1 4.5 4.4 4.4 0.6 2.9 8.8 7.6 5.9 9.2 8.1 6.2 −0.8
2008 0.9 3.4 2.1 −0.7 0.4 2.4 5.3 2.4 1.2 4.7 0.9 −1.4 0.2 −0.8 −1.6 0.1 1.42009 −0.6 −2.7 1.2 −0.1 −1.7 −2.6 −5.1 −0.6 3.4 −0.4 0.8 0.2 −1.6 0.9 2.1 −0.6 −4.12010 10.0 12.2 10.9 11.1 7.2 8.6 14.6 13.2 6.7 11.9 13.3 11.0 11.4 11.0 7.7 6.5 7.42011 3.0 3.2 3.0 2.0 3.7 9.5 1.0 − 5.6 0.3 3.2 2.0 1.7 2.2 0.9 − 7.42012 .. .. .. .. .. −0.8 2.9 .. .. .. .. .. .. .. .. .. ..
Non Specialised Predominantly Non-food Stores, Small Businesses (£1,841m)
2003 125.2 120.1 128.8 122.6 129.3 118.4 121.6 120.3 129.5 129.2 127.9 127.5 128.1 114.4 120.1 125.8 139.32004 123.6 105.3 121.2 131.9 136.2 104.9 107.4 103.9 118.0 122.7 122.5 126.4 140.2 129.6 125.1 136.0 145.1
2005 119.1 105.9 113.2 119.2 138.2 98.4 107.4 110.6 111.4 113.3 114.7 118.8 119.7 118.9 117.4 135.8 156.72006 116.3 100.8 116.2 118.1 130.1 88.6 94.6 115.6 117.4 119.1 112.8 123.9 117.9 113.7 126.3 126.7 135.92007 123.2 100.7 122.9 126.0 143.2 88.8 103.1 108.3 119.3 119.5 128.5 130.7 128.1 120.5 131.5 141.1 154.3
2008 100.0 100.6 102.3 89.9 107.1 91.9 106.5 104.7 104.2 102.9 100.3 101.8 88.1 81.9 89.1 112.8 116.82009 139.9 113.2 133.5 142.5 170.6 116.0 107.0 116.0 118.9 142.6 137.8 144.6 151.5 133.5 149.5 187.8 173.92010 108.6 86.2 112.9 110.5 124.8 86.9 85.5 86.3 108.9 112.6 116.3 106.6 124.0 102.9 108.5 128.4 135.02011 120.4 110.1 111.6 119.7 140.2 106.4 114.4 109.6 114.8 122.6 100.4 122.3 120.2 117.1 123.7 138.6 154.62012 .. .. .. .. .. 118.4 118.6 .. .. .. .. .. .. .. .. .. ..
Percentage increase on a year earlier
2003 −7.4 3.1 −2.7 −12.5 −15.8 6.0 1.8 1.1 4.4 −2.8 −7.7 −13.4 −8.4 −15.0 −16.3 −11.9 −18.02004 −1.3 −12.3 −5.9 7.5 5.3 −11.3 −11.7 −13.6 −8.9 −5.0 −4.2 −0.9 9.4 13.3 4.2 8.1 4.22005 −3.7 0.5 −6.6 −9.6 1.5 −6.2 − 6.4 −5.6 −7.7 −6.4 −5.9 −14.6 −8.2 −6.2 −0.1 8.02006 −2.4 −4.8 2.6 −0.9 −5.9 −10.0 −11.9 4.5 5.4 5.2 −1.7 4.3 −1.5 −4.4 7.5 −6.7 −13.32007 5.9 −0.1 5.8 6.7 10.1 0.2 9.0 −6.3 1.6 0.3 13.9 5.5 8.7 6.0 4.2 11.4 13.5
2008 −18.8 − −16.7 −28.6 −25.3 3.6 3.3 −3.4 −12.6 −13.9 −21.9 −22.1 −31.2 −32.1 −32.3 −20.1 −24.32009 39.9 12.5 30.4 58.4 59.4 26.2 0.4 10.8 14.1 38.6 37.3 42.1 72.0 63.0 67.8 66.5 48.82010 −22.4 −23.9 −15.4 −22.4 −26.8 −25.1 −20.1 −25.6 −8.4 −21.1 −15.6 −26.3 −18.2 −22.9 −27.4 −31.6 −22.32011 10.9 27.7
−1.1 8.3 12.3 22.5 33.8 27.1 5.4 8.9
−13.7 14.8
−3.1 13.9 14.0 7.9 14.5
2012 .. .. .. .. .. 11.3 3.7 .. .. .. .. .. .. .. .. .. ..
The monthly periods consist of 4 weeks except for March, June, Septemberand December which are 5 weeks. Januar y 2008 is also a 5 week period.

8/2/2019 Ons Retail Report
http://slidepdf.com/reader/full/ons-retail-report 68/84
8CHAINED VOLUME OF RETAIL SALESNON-SEASONALLY ADJUSTEDIndex numbers of sales per week and percentage increase on a year earliercontinued Index 2008=100
Year 1st Qtr 2nd Qtr 3rd Qtr 4th Qtr Jan Feb Mar Apr May June July Aug Sept Oct Nov Dec
SIC 2007 (SALES IN 2008)
Te xtile, Clothing, Footwear & Leather, All Businesses (£38,767m)
2003 75.0 62.4 70.1 73.6 94.0 63.3 59.6 63.9 69.4 68.6 71.7 79.0 70.3 72.0 78.4 85.1 113.62004 81.5 67.6 77.2 79.8 101.6 69.1 63.8 69.6 75.6 77.9 78.0 83.2 78.2 78.3 85.6 92.8 121.52005 85.1 71.5 80.2 82.4 106.5 71.7 68.8 73.5 77.2 80.2 82.5 87.2 79.7 80.7 86.4 98.5 128.92006 91.5 74.7 86.1 88.9 116.3 74.9 71.4 77.1 83.7 87.1 87.1 95.2 86.6 85.6 95.5 105.1 141.92007 96.1 80.4 91.6 94.5 118.1 77.6 78.0 84.4 93.3 90.4 91.2 97.7 91.5 94.3 97.8 105.8 144.1
2008 100.0 84.1 94.7 98.8 123.6 82.6 82.9 86.6 88.1 101.5 94.4 102.6 98.4 96.2 102.3 111.7 150.22009 107.1 91.1 101.8 105.3 130.4 92.7 86.3 93.6 100.7 99.2 104.7 112.0 102.0 102.4 111.6 117.4 155.72010 113.0 98.0 107.4 112.1 134.6 98.3 94.4 100.6 107.1 105.4 109.4 119.9 109.3 108.2 116.8 122.9 158.32011 114.4 97.9 110.1 110.8 138.6 101.1 93.8 98.7 111.9 106.8 111.3 119.6 107.1 106.8 114.1 121.8 171.62012 .. .. .. .. .. 101.9 93.2 .. .. .. .. .. .. .. .. .. ..
Percentage increase on a year earlier
2003 6.3 7.0 7.7 6.1 3.9 7.8 7.1 6.5 6.2 6.7 9.7 5.9 1.2 10.4 6.1 5.0 2.02004 8.7 8.4 10.2 8.3 8.0 9.0 6.9 8.9 8.8 13.4 8.7 5.3 11.2 8.8 9.1 9.0 6.92005 4.4 5.7 3.8 3.3 4.8 3.8 7.8 5.6 2.2 3.0 5.8 4.8 1.9 3.1 0.9 6.2 6.12006 7.5 4.4 7.4 7.9 9.2 4.4 3.8 4.9 8.4 8.7 5.6 9.2 8.7 6.1 10.6 6.7 10.02007 5.1 7.7 6.4 6.3 1.6 3.7 9.3 9.5 11.4 3.8 4.7 2.6 5.6 10.1 2.4 0.7 1.6
2008 4.0 4.7 3.3 4.6 4.7 6.3 6.3 2.6 −5.5 12.3 3.4 5.0 7.6 2.0 4.5 5.5 4.2
2009 7.1 8.3 7.5 6.5 5.5 12.3 4.1 8.0 14.3−2.3 10.9 9.2 3.7 6.5 9.1 5.2 3.72010 5.5 7.6 5.6 6.5 3.3 6.1 9.4 7.5 6.3 6.2 4.5 7.0 7.1 5.6 4.7 4.7 1.7
2011 1.2 −0.1 2.5 −1.2 2.9 2.8 −0.7 −1.9 4.5 1.4 1.7 −0.2 −2.0 −1.3 −2.3 −0.9 8.42012 .. .. .. .. .. 0.7 −0.6 .. .. .. .. .. .. .. .. .. ..
Te xtile, Clothing, Footwear & Leather, Large Businesses (£33,045m)
2003 72.1 59.4 66.7 69.3 93.0 60.5 56.5 60.9 65.8 65.6 68.4 75.3 65.7 67.5 75.2 83.8 114.72004 78.9 65.0 74.0 76.3 100.4 67.1 61.1 66.5 72.4 74.7 74.8 80.0 73.7 75.3 82.5 91.5 121.82005 83.5 69.3 78.3 79.7 106.6 69.5 66.0 71.8 75.2 78.4 80.6 85.5 76.6 77.7 84.3 99.2 130.42006 89.6 72.1 83.9 86.2 116.4 72.4 69.2 74.1 81.5 85.0 84.8 93.2 83.3 83.0 93.1 105.1 143.92007 95.3 78.9 90.1 92.9 119.3 76.6 76.3 83.0 91.5 89.0 89.8 95.9 89.0 93.7 97.4 106.5 147.0
2008 100.0 83.7 94.3 97.8 125.4 82.3 82.1 86.4 86.7 102.1 94.2 102.5 97.0 94.6 101.8 113.5 153.92009 108.2 90.6 102.0 105.2 134.9 91.9 85.3 93.7 101.0 99.4 104.9 111.3 101.6 103.2 113.2 120.7 163.52010 115.7 100.1 110.0 113.7 139.0 100.7 96.1 102.8 109.1 107.9 112.3 121.3 111.1 109.8 118.3 126.7 165.42011 117.4 99.8 112.4 113.4 144.1 103.3 95.2 100.6 114.5 108.8 113.7 123.0 109.5 108.7 117.6 125.7 180.02012 .. .. .. .. .. 104.0 95.3 .. .. .. .. .. .. .. .. .. ..
Percentage increase on a year earlier
2003 7.4 9.3 8.2 6.7 5.1 11.2 9.8 7.5 5.8 7.0 11.1 7.4 2.1 10.0 5.3 6.4 4.32004 9.4 9.5 10.9 10.0 7.9 11.1 8.2 9.1 10.1 13.9 9.3 6.2 12.3 11.6 9.7 9.2 6.22005 5.8 6.6 5.7 4.5 6.2 3.5 8.0 8.1 3.7 5.0 7.8 6.8 3.8 3.2 2.2 8.4 7.02006 7.4 4.0 7.1 8.2 9.1 4.2 4.8 3.2 8.5 8.4 5.2 9.0 8.8 6.8 10.4 5.9 10.42007 6.3 9.5 7.4 7.8 2.5 5.7 10.2 11.9 12.2 4.7 5.9 2.9 6.8 12.9 4.6 1.3 2.1
2008 4.9 6.0 4.7 5.2 5.2 7.5 7.6 4.2 −5.3 14.7 4.9 6.9 9.0 1.0 4.5 6.5 4.72009 8.2 8.2 8.1 7.5 7.5 11.7 3.9 8.5 16.6 −2.7 11.3 8.5 4.7 9.0 11.2 6.4 6.32010 7.0 10.5 7.8 8.2 3.1 9.6 12.7 9.7 8.0 8.6 7.1 9.0 9.4 6.5 4.4 5.0 1.12011 1.5 −0.3 2.3 −0.3 3.7 2.6 −1.0 −2.1 5.0 0.9 1.3 1.4 −1.4 −1.0 −0.6 −0.8 8.82012 .. .. .. .. .. 0.6 0.2 .. .. .. .. .. .. .. .. .. ..
Te xtile, Clothing, Footwear & Leather, Small Businesses (£5,722m)
2003 91.9 80.0 89.5 98.5 99.6 80.1 78.1 81.3 90.7 86.3 91.0 100.3 97.1 98.2 97.3 92.5 107.12004 96.7 82.8 95.6 100.0 108.5 80.2 79.2 87.8 93.7 96.3 96.7 101.8 103.8 95.7 103.4 100.2 119.3
2005 94.6 84.0 91.1 97.7 105.7 84.4 84.7 83.2 89.2 90.1 93.5 97.2 97.7 98.2 98.3 94.4 120.62006 102.1 89.6 98.9 104.1 116.0 89.1 84.3 94.2 96.5 99.4 100.4 106.9 105.5 100.7 109.7 105.0 129.82007 100.9 88.7 100.4 103.3 111.3 83.9 88.2 93.0 103.7 98.4 99.4 107.9 105.8 97.5 100.3 101.6 127.7
2008 100.0 86.5 96.6 104.9 113.0 84.2 88.0 87.6 96.8 98.1 95.4 103.2 106.5 105.0 104.7 101.2 129.02009 101.1 93.9 100.5 105.8 104.2 97.2 92.3 92.5 99.0 98.1 103.7 116.7 104.7 98.1 102.0 98.6 110.62010 97.7 85.7 92.9 102.7 109.5 84.5 84.4 87.7 95.6 90.7 92.6 111.7 98.9 98.6 108.3 101.0 117.42011 96.7 87.2 96.5 96.1 107.0 88.4 86.0 87.2 97.0 95.0 97.4 99.8 92.9 95.6 94.4 99.1 123.52012 .. .. .. .. .. 89.7 81.2 .. .. .. .. .. .. .. .. .. ..
Percentage increase on a year earlier
2003 1.2 −1.8 5.4 3.5 −2.6 −5.0 −3.1 2.6 7.8 5.2 3.7 −0.1 −2.3 12.2 9.8 −1.8 −10.42004 5.3 3.6 6.9 1.6 9.0 0.1 1.4 7.9 3.4 11.5 6.2 1.4 6.9 −2.6 6.2 8.3 11.52005 −2.2 1.5 −4.7 −2.3 −2.6 5.3 6.9 −5.3 −4.8 −6.4 −3.3 −4.5 −5.9 2.7 −4.9 −5.8 1.12006 7.9 6.6 8.5 6.5 9.7 5.6 −0.5 13.3 8.1 10.2 7.5 10.0 8.0 2.5 11.6 11.2 7.62007 −1.2 −0.9 1.5 −0.8 −4.0 −5.8 4.7 −1.3 7.5 −1.0 −1.0 0.9 0.3 −3.2 −8.6 −3.2 −1.6
2008 −0.9 −2.5 −3.7 1.6 1.5 0.3 −0.2 −5.8 −6.6 −0.3 −4.0 −4.4 0.6 7.7 4.4 −0.4 1.02009 1.1 8.5 4.0 0.9 −7.7 15.4 4.9 5.6 2.3 − 8.7 13.1 −1.6 −6.6 −2.6 −2.6 −14.32010 −3.4 −8.7 −7.5 −3.0 5.1 −13.1 −8.5 −5.2 −3.5 −7.5 −10.7 −4.3 −5.6 0.5 6.2 2.4 6.22011
−1.0 1.7 3.9
−6.4
−2.3 4.6 1.8
−0.6 1.5 4.8 5.1
−10.7
−6.0
−3.0
−12.8
−1.8 5.2
2012 .. .. .. .. .. 1.6 −5.5 .. .. .. .. .. .. .. .. .. ..
The monthly periods consist of 4 weeks except for March, June, Septemberand December which are 5 weeks. Januar y 2008 is also a 5 week period.
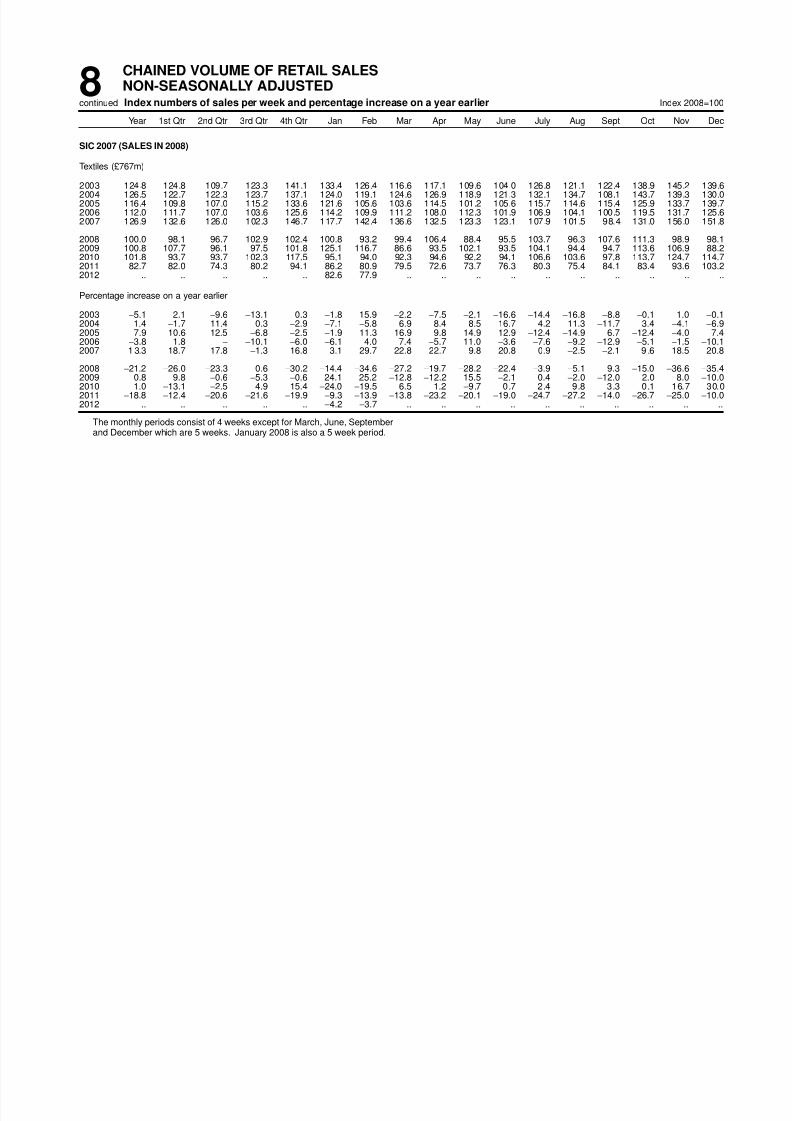
8/2/2019 Ons Retail Report
http://slidepdf.com/reader/full/ons-retail-report 69/84
8CHAINED VOLUME OF RETAIL SALESNON-SEASONALLY ADJUSTEDIndex numbers of sales per week and percentage increase on a year earliercontinued Index 2008=100
Year 1st Qtr 2nd Qtr 3rd Qtr 4th Qtr Jan Feb Mar Apr May June July Aug Sept Oct Nov Dec
SIC 2007 (SALES IN 2008)
Te xtiles (£767m)
2003 124.8 124.8 109.7 123.3 141.1 133.4 126.4 116.6 117.1 109.6 104.0 126.8 121.1 122.4 138.9 145.2 139.62004 126.5 122.7 122.3 123.7 137.1 124.0 119.1 124.6 126.9 118.9 121.3 132.1 134.7 108.1 143.7 139.3 130.02005 116.4 109.8 107.0 115.2 133.6 121.6 105.6 103.6 114.5 101.2 105.6 115.7 114.6 115.4 125.9 133.7 139.72006 112.0 111.7 107.0 103.6 125.6 114.2 109.9 111.2 108.0 112.3 101.9 106.9 104.1 100.5 119.5 131.7 125.62007 126.9 132.6 126.0 102.3 146.7 117.7 142.4 136.6 132.5 123.3 123.1 107.9 101.5 98.4 131.0 156.0 151.8
2008 100.0 98.1 96.7 102.9 102.4 100.8 93.2 99.4 106.4 88.4 95.5 103.7 96.3 107.6 111.3 98.9 98.12009 100.8 107.7 96.1 97.5 101.8 125.1 116.7 86.6 93.5 102.1 93.5 104.1 94.4 94.7 113.6 106.9 88.22010 101.8 93.7 93.7 102.3 117.5 95.1 94.0 92.3 94.6 92.2 94.1 106.6 103.6 97.8 113.7 124.7 114.72011 82.7 82.0 74.3 80.2 94.1 86.2 80.9 79.5 72.6 73.7 76.3 80.3 75.4 84.1 83.4 93.6 103.22012 .. .. .. .. .. 82.6 77.9 .. .. .. .. .. .. .. .. .. ..
Percentage increase on a year earlier
2003 −5.1 2.1 −9.6 −13.1 0.3 −1.8 15.9 −2.2 −7.5 −2.1 −16.6 −14.4 −16.8 −8.8 −0.1 1.0 −0.12004 1.4 −1.7 11.4 0.3 −2.9 −7.1 −5.8 6.9 8.4 8.5 16.7 4.2 11.3 −11.7 3.4 −4.1 −6.92005 −7.9 −10.6 −12.5 −6.8 −2.5 −1.9 −11.3 −16.9 −9.8 −14.9 −12.9 −12.4 −14.9 6.7 −12.4 −4.0 7.42006 −3.8 1.8 − −10.1 −6.0 −6.1 4.0 7.4 −5.7 11.0 −3.6 −7.6 −9.2 −12.9 −5.1 −1.5 −10.12007 1 3.3 18.7 17.8 −1.3 16.8 3.1 29.7 22.8 22.7 9.8 20.8 0.9 −2.5 −2.1 9 .6 18.5 20.8
2008 −21.2 −26.0 −23.3 0.6 −30.2 −14.4 −34.6 −27.2 −19.7 −28.2 −22.4 −3.9 −5.1 9.3 −15.0 −36.6 −35.4
2009 0.8 9.8−0.6
−5.3
−0.6 24.1 25.2
−12.8
−12.2 15.5
−2.1 0.4
−2.0
−12.0 2.0 8.0
−10.02010 1.0 −13.1 −2.5 4.9 15.4 −24.0 −19.5 6.5 1.2 −9.7 0.7 2.4 9.8 3.3 0.1 16.7 30.0
2011 −18.8 −12.4 −20.6 −21.6 −19.9 −9.3 −13.9 −13.8 −23.2 −20.1 −19.0 −24.7 −27.2 −14.0 −26.7 −25.0 −10.02012 .. .. .. .. .. −4.2 −3.7 .. .. .. .. .. .. .. .. .. ..
The monthly periods consist of 4 weeks except for March, June, Septemberand December which are 5 weeks. Januar y 2008 is also a 5 week period.
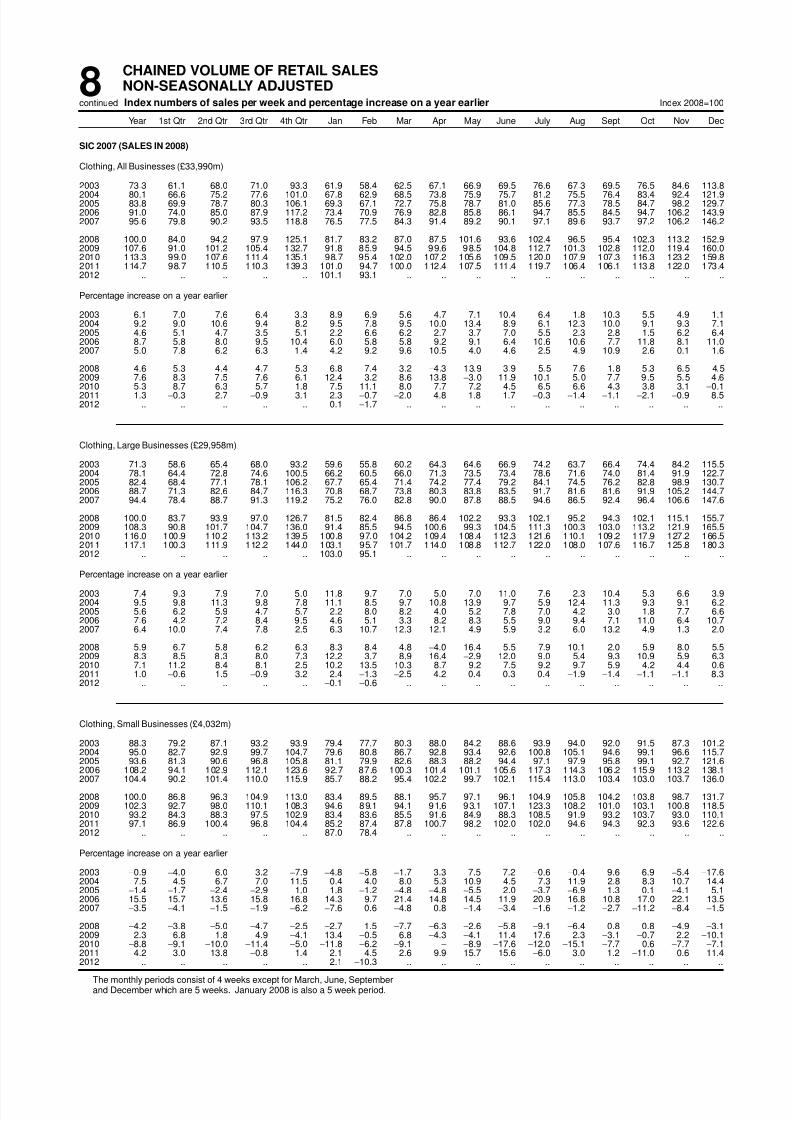
8/2/2019 Ons Retail Report
http://slidepdf.com/reader/full/ons-retail-report 70/84
8CHAINED VOLUME OF RETAIL SALESNON-SEASONALLY ADJUSTEDIndex numbers of sales per week and percentage increase on a year earliercontinued Index 2008=100
Year 1st Qtr 2nd Qtr 3rd Qtr 4th Qtr Jan Feb Mar Apr May June July Aug Sept Oct Nov Dec
SIC 2007 (SALES IN 2008)
Clothing, All Businesses (£33,990m)
2003 73.3 61.1 68.0 71.0 93.3 61.9 58.4 62.5 67.1 66.9 69.5 76.6 67.3 69.5 76.5 84.6 113.82004 80.1 66.6 75.2 77.6 101.0 67.8 62.9 68.5 73.8 75.9 75.7 81.2 75.5 76.4 83.4 92.4 121.92005 83.8 69.9 78.7 80.3 106.1 69.3 67.1 72.7 75.8 78.7 81.0 85.6 77.3 78.5 84.7 98.2 129.72006 91.0 74.0 85.0 87.9 117.2 73.4 70.9 76.9 82.8 85.8 86.1 94.7 85.5 84.5 94.7 106.2 143.92007 95.6 79.8 90.2 93.5 118.8 76.5 77.5 84.3 91.4 89.2 90.1 97.1 89.6 93.7 97.2 106.2 146.2
2008 100.0 84.0 94.2 97.9 125.1 81.7 83.2 87.0 87.5 101.6 93.6 102.4 96.5 95.4 102.3 113.2 152.92009 107.6 91.0 101.2 105.4 132.7 91.8 85.9 94.5 99.6 98.5 104.8 112.7 101.3 102.8 112.0 119.4 160.02010 113.3 99.0 107.6 111.4 135.1 98.7 95.4 102.0 107.2 105.6 109.5 120.0 107.9 107.3 116.3 123.2 159.82011 114.7 98.7 110.5 110.3 139.3 101.0 94.7 100.0 112.4 107.5 111.4 119.7 106.4 106.1 113.8 122.0 173.42012 .. .. .. .. .. 101.1 93.1 .. .. .. .. .. .. .. .. .. ..
Percentage increase on a year earlier
2003 6.1 7.0 7.6 6.4 3.3 8.9 6.9 5.6 4.7 7.1 10.4 6.4 1.8 10.3 5.5 4.9 1.12004 9.2 9.0 10.6 9.4 8.2 9.5 7.8 9.5 10.0 13.4 8.9 6.1 12.3 10.0 9.1 9.3 7.12005 4.6 5.1 4.7 3.5 5.1 2.2 6.6 6.2 2.7 3.7 7.0 5.5 2.3 2.8 1.5 6.2 6.42006 8.7 5.8 8.0 9.5 10.4 6.0 5.8 5.8 9.2 9.1 6.4 10.6 10.6 7.7 11.8 8.1 11.02007 5.0 7.8 6.2 6.3 1.4 4.2 9.2 9.6 10.5 4.0 4.6 2.5 4.9 10.9 2.6 0.1 1.6
2008 4.6 5.3 4.4 4.7 5.3 6.8 7.4 3.2 −4.3 13.9 3.9 5.5 7.6 1.8 5.3 6.5 4.5
2009 7.6 8.3 7.5 7.6 6.1 12.4 3.2 8.6 13.8−3.0 11.9 10.1 5.0 7.7 9.5 5.5 4.62010 5.3 8.7 6.3 5.7 1.8 7.5 11.1 8.0 7.7 7.2 4.5 6.5 6.6 4.3 3.8 3.1 −0.1
2011 1.3 −0.3 2.7 −0.9 3.1 2.3 −0.7 −2.0 4.8 1.8 1.7 −0.3 −1.4 −1.1 −2.1 −0.9 8.52012 .. .. .. .. .. 0.1 −1.7 .. .. .. .. .. .. .. .. .. ..
Clothing, Large Businesses (£29,958m)
2003 71.3 58.6 65.4 68.0 93.2 59.6 55.8 60.2 64.3 64.6 66.9 74.2 63.7 66.4 74.4 84.2 115.52004 78.1 64.4 72.8 74.6 100.5 66.2 60.5 66.0 71.3 73.5 73.4 78.6 71.6 74.0 81.4 91.9 122.72005 82.4 68.4 77.1 78.1 106.2 67.7 65.4 71.4 74.2 77.4 79.2 84.1 74.5 76.2 82.8 98.9 130.72006 88.7 71.3 82.6 84.7 116.3 70.8 68.7 73.8 80.3 83.8 83.5 91.7 81.6 81.6 91.9 105.2 144.72007 94.4 78.4 88.7 91.3 119.2 75.2 76.0 82.8 90.0 87.8 88.5 94.6 86.5 92.4 96.4 106.6 147.6
2008 100.0 83.7 93.9 97.0 126.7 81.5 82.4 86.8 86.4 102.2 93.3 102.1 95.2 94.3 102.1 115.1 155.72009 108.3 90.8 101.7 104.7 136.0 91.4 85.5 94.5 100.6 99.3 104.5 111.3 100.3 103.0 113.2 121.9 165.52010 116.0 100.9 110.2 113.2 139.5 100.8 97.0 104.2 109.4 108.4 112.3 121.6 110.1 109.2 117.9 127.2 166.52011 117.1 100.3 111.9 112.2 144.0 103.1 95.7 101.7 114.0 108.8 112.7 122.0 108.0 107.6 116.7 125.8 180.32012 .. .. .. .. .. 103.0 95.1 .. .. .. .. .. .. .. .. .. ..
Percentage increase on a year earlier
2003 7.4 9.3 7.9 7.0 5.0 11.8 9.7 7.0 5.0 7.0 11.0 7.6 2.3 10.4 5.3 6.6 3.92004 9.5 9.8 11.3 9.8 7.8 11.1 8.5 9.7 10.8 13.9 9.7 5.9 12.4 11.3 9.3 9.1 6.22005 5.6 6.2 5.9 4.7 5.7 2.2 8.0 8.2 4.0 5.2 7.8 7.0 4.2 3.0 1.8 7.7 6.62006 7.6 4.2 7.2 8.4 9.5 4.6 5.1 3.3 8.2 8.3 5.5 9.0 9.4 7.1 11.0 6.4 10.72007 6.4 10.0 7.4 7.8 2.5 6.3 10.7 12.3 12.1 4.9 5.9 3.2 6.0 13.2 4.9 1.3 2.0
2008 5.9 6.7 5.8 6.2 6.3 8.3 8.4 4.8 −4.0 16.4 5.5 7.9 10.1 2.0 5.9 8.0 5.52009 8.3 8.5 8.3 8.0 7.3 12.2 3.7 8.9 16.4 −2.9 12.0 9.0 5.4 9.3 10.9 5.9 6.32010 7.1 11.2 8.4 8.1 2.5 10.2 13.5 10.3 8.7 9.2 7.5 9.2 9.7 5.9 4.2 4.4 0.62011 1.0 −0.6 1.5 −0.9 3.2 2.4 −1.3 −2.5 4.2 0.4 0.3 0.4 −1.9 −1.4 −1.1 −1.1 8.32012 .. .. .. .. .. −0.1 −0.6 .. .. .. .. .. .. .. .. .. ..
Clothing, Small Businesses (£4,032m)
2003 88.3 79.2 87.1 93.2 93.9 79.4 77.7 80.3 88.0 84.2 88.6 93.9 94.0 92.0 91.5 87.3 101.22004 95.0 82.7 92.9 99.7 104.7 79.6 80.8 86.7 92.8 93.4 92.6 100.8 105.1 94.6 99.1 96.6 115.7
2005 93.6 81.3 90.6 96.8 105.8 81.1 79.9 82.6 88.3 88.2 94.4 97.1 97.9 95.8 99.1 92.7 121.62006 108.2 94.1 102.9 112.1 123.6 92.7 87.6 100.3 101.4 101.1 105.6 117.3 114.3 106.2 115.9 113.2 138.12007 104.4 90.2 101.4 110.0 115.9 85.7 88.2 95.4 102.2 99.7 102.1 115.4 113.0 103.4 103.0 103.7 136.0
2008 100.0 86.8 96.3 104.9 113.0 83.4 89.5 88.1 95.7 97.1 96.1 104.9 105.8 104.2 103.8 98.7 131.72009 102.3 92.7 98.0 110.1 108.3 94.6 89.1 94.1 91.6 93.1 107.1 123.3 108.2 101.0 103.1 100.8 118.52010 93.2 84.3 88.3 97.5 102.9 83.4 83.6 85.5 91.6 84.9 88.3 108.5 91.9 93.2 103.7 93.0 110.12011 97.1 86.9 100.4 96.8 104.4 85.2 87.4 87.8 100.7 98.2 102.0 102.0 94.6 94.3 92.3 93.6 122.62012 .. .. .. .. .. 87.0 78.4 .. .. .. .. .. .. .. .. .. ..
Percentage increase on a year earlier
2003 −0.9 −4.0 6.0 3.2 −7.9 −4.8 −5.8 −1.7 3.3 7.5 7.2 −0.6 −0.4 9.6 6.9 −5.4 −17.62004 7.5 4.5 6.7 7.0 11.5 0.4 4.0 8.0 5.3 10.9 4.5 7.3 11.9 2.8 8.3 10.7 14.42005 −1.4 −1.7 −2.4 −2.9 1.0 1.8 −1.2 −4.8 −4.8 −5.5 2.0 −3.7 −6.9 1.3 0.1 −4.1 5.12006 15.5 15.7 13.6 15.8 16.8 14.3 9.7 21.4 14.8 14.5 11.9 20.9 16.8 10.8 17.0 22.1 13.52007 −3.5 −4.1 −1.5 −1.9 −6.2 −7.6 0.6 −4.8 0.8 −1.4 −3.4 −1.6 −1.2 −2.7 −11.2 −8.4 −1.5
2008 −4.2 −3.8 −5.0 −4.7 −2.5 −2.7 1.5 −7.7 −6.3 −2.6 −5.8 −9.1 −6.4 0.8 0.8 −4.9 −3.12009 2.3 6.8 1.8 4.9 −4.1 13.4 −0.5 6.8 −4.3 −4.1 11.4 17.6 2.3 −3.1 −0.7 2.2 −10.12010 −8.8 −9.1 −10.0 −11.4 −5.0 −11.8 −6.2 −9.1 − −8.9 −17.6 −12.0 −15.1 −7.7 0.6 −7.7 −7.12011 4.2 3.0 13.8
−0.8 1.4 2.1 4.5 2.6 9.9 15.7 15.6
−6.0 3.0 1.2
−11.0 0.6 11.4
2012 .. .. .. .. .. 2.1 −10.3 .. .. .. .. .. .. .. .. .. ..
The monthly periods consist of 4 weeks except for March, June, Septemberand December which are 5 weeks. Januar y 2008 is also a 5 week period.

8/2/2019 Ons Retail Report
http://slidepdf.com/reader/full/ons-retail-report 71/84
8CHAINED VOLUME OF RETAIL SALESNON-SEASONALLY ADJUSTEDIndex numbers of sales per week and percentage increase on a year earliercontinued Index 2008=100
Year 1st Qtr 2nd Qtr 3rd Qtr 4th Qtr Jan Feb Mar Apr May June July Aug Sept Oct Nov Dec
SIC 2007 (SALES IN 2008)
Footwear and Leather Goods (£4,010m)
2003 80.4 62.3 80.9 87.3 91.2 62.5 57.9 65.7 80.5 76.0 85.2 91.2 87.2 84.4 84.3 78.4 106.82004 85.8 66.6 86.2 90.1 100.0 69.8 60.4 69.1 81.1 87.3 89.5 91.4 90.2 89.0 93.0 87.1 115.92005 91.0 77.8 87.9 94.0 104.2 83.4 76.3 74.4 82.2 89.2 91.3 95.2 93.4 93.5 93.1 94.9 120.62006 91.4 73.3 91.4 94.1 106.9 80.2 68.1 71.9 87.4 93.7 92.7 97.2 92.9 92.5 98.0 91.0 126.82007 95.0 75.3 97.0 101.4 106.5 80.2 70.6 75.3 101.8 94.4 95.3 100.8 105.7 98.4 97.6 92.7 124.6
2008 100.0 82.2 98.2 106.1 114.9 86.5 78.5 80.8 90.1 103.4 100.5 104.0 115.4 100.3 100.5 100.9 137.62009 104.3 88.4 107.4 105.8 115.7 93.9 84.4 87.0 112.0 104.2 106.3 107.9 110.0 100.7 107.4 102.8 132.82010 113.4 90.7 108.8 120.2 134.0 96.0 86.2 90.0 108.0 106.0 111.6 121.3 122.0 117.9 121.8 120.8 154.22011 117.5 94.5 113.5 120.5 141.6 105.0 88.6 90.7 115.2 107.0 117.3 126.7 118.7 117.1 123.0 125.3 169.42012 .. .. .. .. .. 112.0 97.2 .. .. .. .. .. .. .. .. .. ..
Percentage increase on a year earlier
2003 11.3 8.9 13.3 9.8 11.0 2.3 5.4 19.1 23.6 6.0 11.8 9.1 2.1 17.8 13.3 7.5 11.82004 6.6 7.0 6.6 3.2 9.7 11.7 4.5 5.2 0.8 15.0 5.0 0.1 3.5 5.5 10.3 11.1 8.52005 6.1 16.7 1.9 4.3 4.2 19.6 26.3 7.6 1.4 2.2 2.1 4.2 3.5 5.0 0.1 9.0 4.02006 0.5 −5.8 4.0 0.1 2.6 −3.8 −10.8 −3.3 6.3 5.0 1.5 2.2 −0.6 −1.0 5.3 −4.2 5.12007 4.0 2.8 6.2 7.8 −0.4 −0.1 3.7 4.7 16.4 0.8 2.8 3.6 13.8 6.4 −0.4 1.9 −1.8
2008 5.2 9.1 1.2 4.7 7.9 7.9 11.1 7.3 −11.5 9.5 5.5 3.2 9.3 1.9 2.9 8.9 10.5
2009 4.3 7.5 9.4−0.3 0.7 8.5 7.6 7.8 24.4 0.8 5.8 3.7
−4.7 0.4 6.9 1.8
−3.52010 8.7 2.6 1.3 13.6 15.7 2.2 2.1 3.4 −3.6 1.7 5.0 12.4 10.9 17.0 13.4 17.5 16.1
2011 3.6 4.2 4.3 0.3 5.7 9.5 2.8 0.8 6.6 1.0 5.1 4.5 −2.7 −0.7 0.9 3.7 9.92012 .. .. .. .. .. 6.6 9.7 .. .. .. .. .. .. .. .. .. ..
The monthly periods consist of 4 weeks except for March, June, Septemberand December which are 5 weeks. Januar y 2008 is also a 5 week period.

8/2/2019 Ons Retail Report
http://slidepdf.com/reader/full/ons-retail-report 72/84
8CHAINED VOLUME OF RETAIL SALESNON-SEASONALLY ADJUSTEDIndex numbers of sales per week and percentage increase on a year earliercontinued Index 2008=100
Year 1st Qtr 2nd Qtr 3rd Qtr 4th Qtr Jan Feb Mar Apr May June July Aug Sept Oct Nov Dec
SIC 2007 (SALES IN 2008)
Household Goods Stores, All Businesses (£34,646m)
2003 85.9 80.7 81.7 81.9 99.3 82.6 80.6 79.2 85.6 82.7 77.7 81.9 81.2 82.4 89.2 95.1 110.72004 91.7 87.5 87.3 88.8 103.1 91.0 86.9 85.2 91.6 87.1 84.0 89.5 87.3 89.5 93.8 102.5 110.92005 91.6 90.0 86.0 86.2 104.0 95.2 87.8 87.6 88.8 86.4 83.5 86.2 85.3 86.9 93.4 98.8 116.72006 95.1 89.5 91.7 90.5 108.5 95.9 87.2 86.3 96.1 90.9 89.0 89.3 92.0 90.2 96.7 104.3 121.32007 100.1 96.2 95.6 96.6 112.1 101.8 93.8 93.6 98.6 95.8 93.0 99.5 96.1 94.7 101.3 107.6 124.3
2008 100.0 99.6 96.6 94.4 109.5 105.5 94.6 97.5 98.3 101.1 91.6 96.0 95.8 92.0 96.9 103.5 124.32009 94.8 89.9 88.9 91.6 108.9 98.4 85.4 86.7 92.6 90.8 84.5 92.2 91.9 90.9 99.3 104.4 120.22010 90.0 86.3 87.8 87.9 98.3 84.4 85.2 88.6 90.1 89.6 84.5 89.7 88.0 86.3 91.3 94.8 106.62011 87.4 83.6 83.7 84.4 98.0 90.5 80.0 80.9 87.0 83.7 81.1 85.3 83.0 84.9 91.3 93.7 106.82012 .. .. .. .. .. 91.0 79.3 .. .. .. .. .. .. .. .. .. ..
Percentage increase on a year earlier
2003 3.1 − 4.7 3.7 3.7 1.4 2.2 −2.6 6.1 3.8 4.3 4.2 4.2 3.0 3.4 1.7 5.22004 6.7 8.5 6.8 8.5 3.8 10.1 7.8 7.6 7.0 5.3 8.0 9.3 7.5 8.6 5.2 7.8 0.12005 −0.1 2.8 −1.4 −2.9 1.0 4.6 1.1 2.7 −3.0 −0.8 −0.6 −3.7 −2.2 −2.9 −0.5 −3.6 5.32006 3.8 −0.5 6.7 5.0 4.3 0.7 −0.7 −1.5 8.2 5.1 6.6 3.6 7.8 3.8 3.5 5.6 3.92007 5.3 7.4 4.2 6.8 3.3 6.2 7.6 8.4 2.6 5.4 4.5 11.4 4.5 5.0 4.7 3.2 2.5
2008 −0.1 3.5 1.1 −2.3 −2.4 3.7 0.8 4.2 −0.3 5.6 −1.5 −3.4 −0.3 −2.8 −4.4 −3.9 −
2009−5.2
−9.7
−7.9
−3.0
−0.5
−6.8
−9.7
−11.1
−5.9
−10.2
−7.7
−4.0
−4.1
−1.2 2.6 0.9
−3.32010 −5.1 −4.1 −1.3 −4.1 −9.8 −14.3 −0.3 2.3 −2.6 −1.3 − −2.7 −4.3 −5.1 −8.1 −9.2 −11.3
2011 −2.9 −3.1 −4.7 −3.9 −0.3 7.2 −6.1 −8.8 −3.4 −6.6 −4.1 −4.9 −5.6 −1.6 − −1.2 0.12012 .. .. .. .. .. 0.5 −0.9 .. .. .. .. .. .. .. .. .. ..
Household Goods Stores, Large Businesses (£24,224m)
2003 83.1 75.4 79.2 78.8 98.8 78.3 75.0 73.5 83.1 81.1 74.7 78.8 78.7 79.0 83.9 93.4 115.02004 90.4 85.3 87.2 86.1 103.0 88.9 84.2 83.4 92.7 86.7 83.1 86.6 84.5 86.9 90.4 100.2 115.32005 90.5 89.0 84.4 83.5 105.2 95.0 84.7 87.6 86.5 85.1 82.2 82.7 82.5 84.9 90.9 97.5 122.72006 94.4 87.9 92.1 89.3 108.4 95.1 84.4 85.1 97.7 91.6 87.9 87.5 90.0 90.1 93.7 100.6 126.42007 99.3 92.7 94.7 95.0 114.9 100.0 88.9 89.8 99.4 94.6 90.9 96.4 93.9 94.7 101.6 106.0 132.8
2008 100.0 100.3 95.7 91.7 112.3 110.0 91.7 97.5 97.4 102.2 89.1 92.9 94.5 88.4 93.2 103.2 134.92009 95.3 90.7 90.5 90.6 109.5 99.9 86.2 86.9 95.7 92.1 85.1 89.7 91.1 90.9 95.7 102.5 126.22010 92.4 89.1 88.2 87.9 104.3 91.7 85.1 90.3 90.2 90.8 84.5 88.3 88.2 87.3 93.4 98.0 118.22011 89.6 87.3 85.5 84.7 101.0 97.5 82.4 83.1 92.2 83.6 81.6 84.8 82.4 86.3 90.0 93.0 116.32012 .. .. .. .. .. 95.4 77.9 .. .. .. .. .. .. .. .. .. ..
Percentage increase on a year earlier
2003 5.8 0.3 8.4 7.7 6.5 4.3 2.7 −4.7 10.4 8.4 6.6 7.5 7.6 7.9 6.1 4.6 8.12004 8.8 13.1 10.0 9.2 4.3 13.5 12.3 13.5 11.6 6.9 11.3 9.9 7.3 10.1 7.7 7.3 0.32005 0.1 4.3 −3.2 −3.0 2.2 6.9 0.6 5.1 −6.7 −1.9 −1.1 −4.6 −2.3 −2.3 0.6 −2.7 6.52006 4.3 −1.2 9.1 6.9 3.1 0.1 −0.4 −2.9 13.0 7.7 7.0 5.9 9.0 6.0 3.1 3.2 3.02007 5.2 5.4 2.8 6.4 6.0 5.2 5.4 5.5 1.8 3.2 3.4 10.2 4.4 5.1 8.4 5.4 5.0
2008 0.7 8.3 1.1 −3.5 −2.3 10.0 3.2 8.6 −2.0 8.1 −1.9 −3.6 0.6 −6.6 −8.3 −2.7 1.62009 −4.7 −9.6 −5.5 −1.2 −2.4 −9.2 −6.1 −10.8 −1.8 −9.9 −4.6 −3.4 −3.6 2.8 2.8 −0.7 −6.42010 −3.1 −1.7 −2.6 −3.0 −4.7 −8.1 −1.3 3.9 −5.7 −1.4 −0.7 −1.6 −3.2 −4.0 −2.5 −4.3 −6.42011 −3.0 −2.0 −3.1 −3.7 −3.2 6.3 −3.2 −8.0 2.2 −7.9 −3.5 −3.9 −6.5 −1.1 −3.7 −5.1 −1.62012 .. .. .. .. .. −2.2 −5.5 .. .. .. .. .. .. .. .. .. ..
Household Goods Stores, Small Businesses (£10,422m)
2003 92.7 93.5 87.6 89.3 100.5 93.1 94.4 93.1 91.7 86.4 85.1 89.2 87.2 90.9 102.2 99.2 100.12004 94.7 92.8 87.5 95.5 103.2 96.1 93.3 89.7 88.7 87.9 86.1 96.5 94.0 95.8 102.3 108.0 100.1
2005 94.1 92.4 89.9 92.7 101.2 95.5 95.3 87.5 94.3 89.7 86.6 94.8 92.1 91.6 99.4 102.0 102.12006 96.6 93.3 91.0 93.4 108.7 97.8 94.1 89.2 92.1 89.0 91.6 93.5 97.0 90.5 103.9 113.2 109.02007 102.1 104.6 97.8 100.5 105.3 106.2 105.6 102.6 96.6 98.7 98.1 106.7 101.4 94.8 100.5 111.5 104.1
2008 100.0 97.7 98.6 101.0 102.8 94.9 101.3 97.7 100.4 98.5 97.3 103.4 99.0 100.6 105.8 104.2 99.22009 93.7 88.1 85.3 94.0 107.5 95.0 83.7 86.2 85.3 87.9 83.2 98.0 93.8 91.0 107.7 108.8 106.22010 84.6 79.6 86.9 87.8 84.1 67.2 85.5 84.8 89.9 86.9 84.6 93.0 87.4 83.9 86.5 87.2 79.72011 82.3 74.8 79.7 83.9 90.8 74.0 74.4 75.7 75.1 83.9 79.9 86.5 84.3 81.6 94.3 95.2 84.52012 .. .. .. .. .. 80.6 82.6 .. .. .. .. .. .. .. .. .. ..
Percentage increase on a year earlier
2003 −2.4 −0.6 −2.7 −4.0 −2.6 −4.1 1.2 1.7 −2.3 −5.7 −0.4 −2.3 −2.6 −6.2 −1.5 −4.3 −2.12004 2.2 −0.8 −0.1 7.0 2.7 3.2 −1.1 −3.7 −3.2 1.7 1.1 8.1 7.8 5.4 0.1 8.9 −0.12005 −0.7 −0.5 2.8 −2.9 −1.9 −0.6 2.2 −2.5 6.3 2.0 0.6 −1.7 −2.0 −4.5 −2.8 −5.6 2.02006 2.7 1.0 1.2 0.8 7.4 2.3 −1.3 1.9 −2.4 −0.8 5.8 −1.3 5.3 −1.1 4.5 11.0 6.82007 5.6 12.1 7.5 7.5 −3.1 8.6 12.2 15.1 4.9 10.9 7.0 14.1 4.6 4.7 −3.2 −1.5 −4.5
2008 −2.0 −6.6 0.8 0.5 −2.4 −10.6 −4.0 −4.8 3.9 −0.2 −0.7 −3.1 −2.3 6.2 5.2 −6.6 −4.72009 −6.3 −9.8 −13.5 −6.9 4.6 0.1 −17.4 −11.8 −15.0 −10.8 −14.5 −5.3 −5.3 −9.5 1.8 4.4 7.02010 −9.7 −9.7 1.9 −6.6 −21.7 −29.2 2.1 −1.6 5.4 −1.1 1.6 −5.1 −6.8 −7.8 −19.7 −19.8 −24.92011
−2.7
−6.0
−8.4
−4.4 7.9 10.1
−12.9
−10.7
−16.5
−3.5
−5.5
−7.0
−3.6
−2.8 9.0 9.1 6.0
2012 .. .. .. .. .. 8.9 11.0 .. .. .. .. .. .. .. .. .. ..
The monthly periods consist of 4 weeks except for March, June, Septemberand December which are 5 weeks. Januar y 2008 is also a 5 week period.

8/2/2019 Ons Retail Report
http://slidepdf.com/reader/full/ons-retail-report 73/84
8CHAINED VOLUME OF RETAIL SALESNON-SEASONALLY ADJUSTEDIndex numbers of sales per week and percentage increase on a year earliercontinued Index 2008=100
Year 1st Qtr 2nd Qtr 3rd Qtr 4th Qtr Jan Feb Mar Apr May June July Aug Sept Oct Nov Dec
SIC 2007 (SALES IN 2008)
Fur niture, Lighting, etc (£11,633m)
2003 97.2 97.6 90.9 93.6 106.4 97.6 99.8 95.9 94.1 93.6 86.3 94.8 90.0 95.6 107.8 108.5 103.72004 101.6 103.9 93.0 101.2 108.4 106.9 105.4 100.4 96.4 94.0 89.4 103.1 97.2 102.9 110.1 117.7 99.62005 98.5 102.5 91.3 94.3 106.0 104.1 106.2 98.4 99.8 90.2 85.3 93.2 93.7 95.7 106.6 108.3 103.62006 103.0 103.9 96.1 100.0 112.0 106.4 103.1 102.6 102.7 95.2 91.4 98.0 102.2 99.8 112.4 117.0 107.72007 103.7 105.4 98.6 103.2 107.4 105.1 106.4 104.8 101.3 101.1 94.4 110.7 101.8 98.3 107.0 113.5 102.9
2008 100.0 105.7 97.8 96.2 99.8 106.6 106.9 103.8 104.2 99.2 91.6 99.6 97.2 92.7 105.1 101.7 94.12009 90.9 87.2 83.4 92.4 100.8 95.3 84.8 82.5 86.1 84.1 80.6 95.7 92.4 89.8 105.3 104.9 94.12010 84.0 84.7 80.0 82.4 89.0 80.7 88.6 84.7 83.5 82.5 75.1 85.6 82.1 80.0 94.2 91.5 82.82011 84.5 85.4 77.5 83.8 91.1 89.0 88.4 80.2 77.3 78.2 77.3 87.0 80.6 83.8 93.8 91.2 88.82012 .. .. .. .. .. 88.3 81.1 .. .. .. .. .. .. .. .. .. ..
Percentage increase on a year earlier
2003 −3.1 −3.0 −2.8 −4.8 −1.9 −3.1 −2.6 −3.3 −5.2 −0.5 −2.7 −4.3 −7.0 −3.3 −4.7 −1.5 0.12004 4.6 6.4 2.2 8.1 1.9 9.5 5.5 4.7 2.4 0.4 3.6 8.8 8.1 7.7 2.2 8.5 −3.92005 −3.1 −1.3 −1.8 −6.8 −2.3 −2.6 0.8 −2.1 3.6 −4.1 −4.5 −9.6 −3.6 −7.0 −3.2 −8.0 4.02006 4.5 1.4 5.2 6.0 5.7 2.2 −2.9 4.3 2.9 5.6 7.1 5.1 9.0 4.3 5.4 8.0 3.92007 0.6 1.4 2.6 3.2 −4.1 −1.3 3.3 2.2 −1.4 6.2 3.3 12.9 −0.4 −1.5 −4.7 −3.0 −4.4
2008 −3.5 0.3 −0.8 −6.8 −7.1 1.5 0.4 −1.0 2.9 −1.9 −3.0 −10.0 −4.5 −5.7 −1.8 −10.4 −8.6
2009−9.1
−17.5
−14.8
−4.0 1.0
−10.6
−20.6
−20.5
−17.3
−15.3
−12.0
−3.9
−5.0
−3.2 0.1 3.1
−2010 −7.6 −2.9 −4.1 −10.8 −11.8 −15.3 4.4 2.6 −3.0 −1.8 −6.8 −10.6 −11.1 −10.8 −10.5 −12.7 −12.02011 0.6 0.9 −3.0 1.7 2.4 10.2 −0.1 −5.3 −7.5 −5.3 2.9 1.7 −1.9 4.7 −0.4 −0.4 7.32012 .. .. .. .. .. −0.7 −8.3 .. .. .. .. .. .. .. .. .. ..
Electr ical Household Appliances (£8,835m)
2003 64.9 57.0 53.4 59.2 89.8 63.1 56.4 52.7 55.7 53.2 51.8 56.5 59.7 60.9 66.3 80.5 116.12004 71.2 64.5 59.5 65.3 95.4 72.0 62.6 60.0 61.4 56.9 60.2 62.6 63.7 68.8 72.1 87.1 120.72005 75.5 70.1 61.2 67.4 103.4 82.2 64.8 64.5 61.3 60.8 61.6 65.9 65.2 70.4 76.0 89.7 136.32006 84.4 75.4 72.8 75.1 114.2 87.0 70.9 69.6 74.6 71.9 72.1 71.9 77.0 76.3 83.8 98.6 151.02007 94.2 85.3 77.0 86.6 128.1 97.7 80.8 79.1 74.9 74.0 81.1 86.3 83.5 89.2 97.4 108.4 168.3
2008 100.0 94.1 82.5 89.4 134.5 109.8 81.4 88.4 82.6 85.0 80.4 85.3 93.1 89.7 90.4 112.8 187.22009 102.2 90.8 81.5 94.7 141.7 108.6 86.4 80.2 83.9 83.1 78.3 91.9 93.1 98.3 106.2 124.3 184.12010 104.0 90.9 88.6 99.3 137.0 96.4 88.6 88.4 82.4 88.5 93.6 97.1 97.2 102.8 106.6 122.8 172.62011 103.4 95.0 83.9 98.2 136.5 118.1 84.8 84.8 82.2 83.9 85.4 88.5 96.2 107.5 112.7 121.4 167.62012 .. .. .. .. .. 129.4 97.9 .. .. .. .. .. .. .. .. .. ..
Percentage increase on a year earlier
2003 8.5 1.6 9.6 14.1 8.6 0.9 3.3 3.4 14.2 6.1 8.7 14.7 17.2 11.5 9.3 6.2 9.72004 9.8 13.2 11.4 10.5 6.2 14.2 11.1 14.0 10.2 6.8 16.3 10.9 6.7 13.1 8.8 8.1 4.02005 6.1 8.6 2.9 3.2 8.4 14.2 3.5 7.5 −0.1 6.9 2.3 5.2 2.4 2.3 5.4 3.0 12.92006 11.7 7.6 18.9 11.5 10.5 5.8 9.4 7.9 21.8 18.3 17.1 9.1 18.1 8.3 10.2 10.0 10.82007 11.7 13.2 5.7 15.2 12.1 12.2 13.9 13.6 0.3 3.0 12.4 20.1 8.5 17.0 16.3 9.9 11.5
2008 6.1 10.2 7.1 3.2 5.0 12.4 0.8 11.8 10.4 14.8 −0.9 −1.2 11.4 0.6 −7.3 4.0 11.22009 2.2 −3.4 −1.2 6.0 5.4 −1.1 6.1 −9.3 1.6 −2.2 −2.6 7.7 − 9.5 17.5 10.3 −1.72010 1.7 0.1 8.7 4.9 −3.4 −11.2 2.6 10.2 −1.8 6.4 19.6 5.7 4.4 4.6 0.4 −1.3 −6.22011 −0.5 4.5 −5.2 −1.2 −0.3 22.5 −4.3 −4.1 −0.2 −5.2 −8.8 −8.9 −1.0 4.6 5.7 −1.1 −2.92012 .. .. .. .. .. 9.6 15.5 .. .. .. .. .. .. .. .. .. ..
Hardware, Paints and Glass (£11,782m)
2003 98.5 93.3 110.1 98.7 92.0 89.3 92.2 97.4 117.5 111.2 103.3 101.5 99.2 96.1 98.8 92.7 86.02004 104.6 98.5 117.2 105.6 97.1 95.3 98.0 101.3 126.3 119.7 108.1 110.0 107.3 100.9 103.4 100.9 89.0
2005 101.8 100.1 111.9 100.7 94.4 97.9 97.1 104.4 113.0 114.9 108.7 103.6 102.0 97.5 100.7 96.3 87.92006 98.0 90.5 109.9 99.1 92.4 93.2 89.6 88.9 115.2 108.9 106.6 101.0 99.7 97.0 95.8 95.6 87.22007 102.5 98.2 114.5 101.9 95.5 101.7 95.2 97.9 124.3 116.1 105.3 102.9 105.8 98.0 99.9 99.9 88.4
2008 100.0 99.4 111.2 99.3 90.0 100.2 96.5 101.0 110.2 121.0 104.3 104.2 99.6 95.3 95.9 94.5 81.72009 93.4 91.3 103.0 92.1 87.0 91.7 84.7 96.2 109.5 106.8 94.8 93.0 94.5 89.4 91.3 87.6 83.02010 85.8 85.9 98.1 87.6 71.4 79.9 80.6 94.9 106.2 101.0 89.4 91.0 89.9 83.2 78.4 73.8 63.92011 80.0 75.5 93.9 78.5 72.2 73.5 70.2 81.3 105.3 94.0 84.7 85.3 79.2 72.3 76.4 74.8 66.82012 .. .. .. .. .. 69.6 66.3 .. .. .. .. .. .. .. .. .. ..
Percentage increase on a year earlier
2003 4.5 2.1 7.3 2.4 5.7 9.3 7.1 −7.4 9.7 5.5 6.8 3.0 3.3 1.3 7.4 1.4 7.92004 6.2 5.5 6.5 7.0 5.6 6.7 6.3 4.1 7.5 7.6 4.6 8.4 8.1 4.9 4.7 8.8 3.62005 −2.7 1.7 −4.5 −4.6 −2.8 2.8 −1.0 3.0 −10.5 −4.0 0.6 −5.8 −5.0 −3.4 −2.7 −4.6 −1.32006 −3.8 −9.7 −1.8 −1.6 −2.1 −4.8 −7.7 −14.8 1.9 −5.2 −2.0 −2.5 −2.2 −0.4 −4.8 −0.7 −0.82007 4.6 8.6 4.1 2.9 3.3 9.1 6.2 10.1 7.9 6.7 −1.2 1.8 6.1 1.0 4.3 4.5 1.4
2008 −2.5 1.2 −2.8 −2.5 −5.7 −1.4 1.4 3.1 −11.3 4.1 −0.9 1.3 −5.9 −2.8 −4.1 −5.4 −7.52009 −6.6 −8.2 −7.4 −7.3 −3.4 −8.5 −12.2 −4.8 −0.6 −11.7 −9.1 −10.7 −5.1 −6.1 −4.8 −7.3 1.62010 −8.1 −5.9 −4.8 −4.9 −17.9 −12.9 −4.8 −1.3 −3.1 −5.5 −5.7 −2.2 −4.9 −7.0 −14.1 −15.8 −23.02011
−6.7
−12.1
−4.3
−10.5 1.1
−8.0
−13.0
−14.3
−0.8
−6.9
−5.3
−6.2
−11.8
−13.0
−2.6 1.4 4.5
2012 .. .. .. .. .. −5.3 −5.6 .. .. .. .. .. .. .. .. .. ..
The monthly periods consist of 4 weeks except for March, June, Septemberand December which are 5 weeks. Januar y 2008 is also a 5 week period.
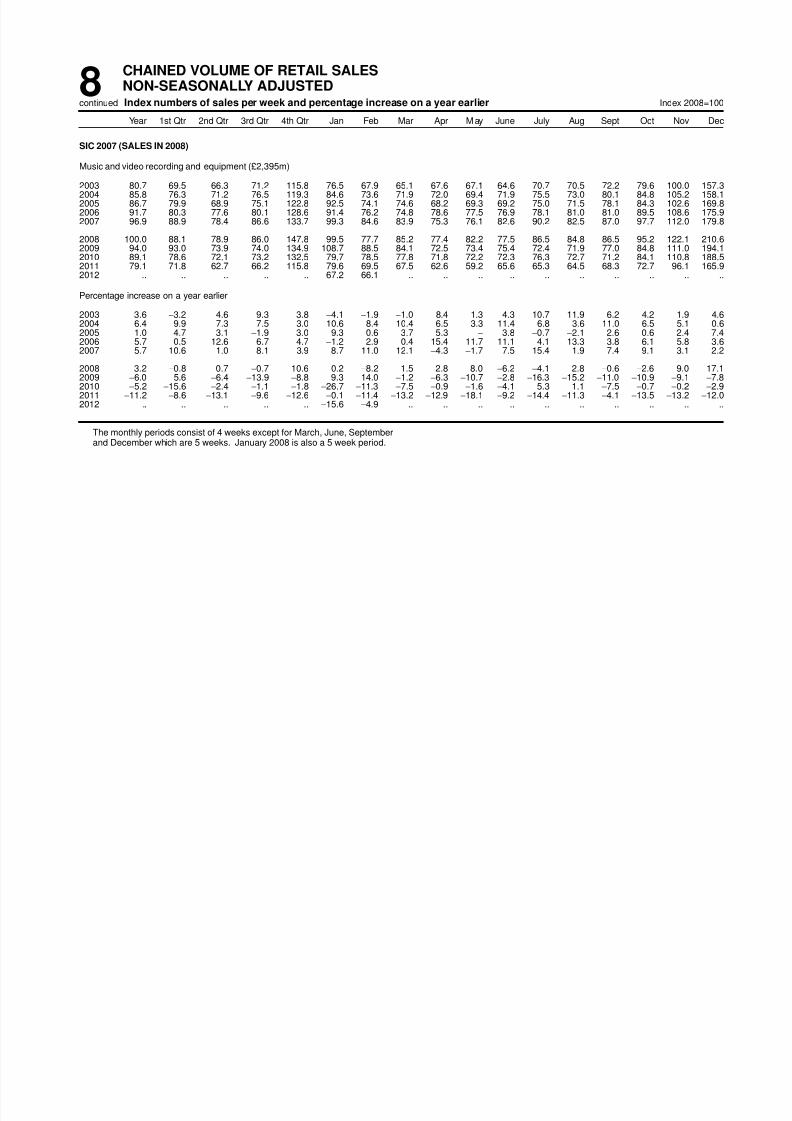
8/2/2019 Ons Retail Report
http://slidepdf.com/reader/full/ons-retail-report 74/84
8CHAINED VOLUME OF RETAIL SALESNON-SEASONALLY ADJUSTEDIndex numbers of sales per week and percentage increase on a year earliercontinued Index 2008=100
Year 1st Qtr 2nd Qtr 3rd Qtr 4th Qtr Jan Feb Mar Apr May June July Aug Sept Oct Nov Dec
SIC 2007 (SALES IN 2008)
Music and video recording and equipment (£2,395m)
2003 80.7 69.5 66.3 71.2 115.8 76.5 67.9 65.1 67.6 67.1 64.6 70.7 70.5 72.2 79.6 100.0 157.32004 85.8 76.3 71.2 76.5 119.3 84.6 73.6 71.9 72.0 69.4 71.9 75.5 73.0 80.1 84.8 105.2 158.12005 86.7 79.9 68.9 75.1 122.8 92.5 74.1 74.6 68.2 69.3 69.2 75.0 71.5 78.1 84.3 102.6 169.82006 91.7 80.3 77.6 80.1 128.6 91.4 76.2 74.8 78.6 77.5 76.9 78.1 81.0 81.0 89.5 108.6 175.92007 96.9 88.9 78.4 86.6 133.7 99.3 84.6 83.9 75.3 76.1 82.6 90.2 82.5 87.0 97.7 112.0 179.8
2008 100.0 88.1 78.9 86.0 147.8 99.5 77.7 85.2 77.4 82.2 77.5 86.5 84.8 86.5 95.2 122.1 210.62009 94.0 93.0 73.9 74.0 134.9 108.7 88.5 84.1 72.5 73.4 75.4 72.4 71.9 77.0 84.8 111.0 194.12010 89.1 78.6 72.1 73.2 132.5 79.7 78.5 77.8 71.8 72.2 72.3 76.3 72.7 71.2 84.1 110.8 188.52011 79.1 71.8 62.7 66.2 115.8 79.6 69.5 67.5 62.6 59.2 65.6 65.3 64.5 68.3 72.7 96.1 165.92012 .. .. .. .. .. 67.2 66.1 .. .. .. .. .. .. .. .. .. ..
Percentage increase on a year earlier
2003 3.6 −3.2 4.6 9.3 3.8 −4.1 −1.9 −1.0 8.4 1.3 4.3 10.7 11.9 6.2 4.2 1.9 4.62004 6.4 9.9 7.3 7.5 3.0 10.6 8.4 10.4 6.5 3.3 11.4 6.8 3.6 11.0 6.5 5.1 0.62005 1.0 4.7 −3.1 −1.9 3.0 9.3 0.6 3.7 −5.3 − −3.8 −0.7 −2.1 −2.6 −0.6 −2.4 7.42006 5.7 0.5 12.6 6.7 4.7 −1.2 2.9 0.4 15.4 11.7 11.1 4.1 13.3 3.8 6.1 5.8 3.62007 5.7 10.6 1.0 8.1 3.9 8.7 11.0 12.1 −4.3 −1.7 7.5 15.4 1.9 7.4 9.1 3.1 2.2
2008 3.2 −0.8 0.7 −0.7 10.6 0.2 −8.2 1.5 2.8 8.0 −6.2 −4.1 2.8 −0.6 −2.6 9.0 17.1
2009−6.0 5.6
−6.4
−13.9
−8.8 9.3 14.0
−1.2
−6.3
−10.7
−2.8
−16.3
−15.2
−11.0
−10.9
−9.1
−7.82010 −5.2 −15.6 −2.4 −1.1 −1.8 −26.7 −11.3 −7.5 −0.9 −1.6 −4.1 5.3 1.1 −7.5 −0.7 −0.2 −2.9
2011 −11.2 −8.6 −13.1 −9.6 −12.6 −0.1 −11.4 −13.2 −12.9 −18.1 −9.2 −14.4 −11.3 −4.1 −13.5 −13.2 −12.02012 .. .. .. .. .. −15.6 −4.9 .. .. .. .. .. .. .. .. .. ..
The monthly periods consist of 4 weeks except for March, June, Septemberand December which are 5 weeks. Januar y 2008 is also a 5 week period.

8/2/2019 Ons Retail Report
http://slidepdf.com/reader/full/ons-retail-report 75/84
8CHAINED VOLUME OF RETAIL SALESNON-SEASONALLY ADJUSTEDIndex numbers of sales per week and percentage increase on a year earliercontinued Index 2008=100
Year 1st Qtr 2nd Qtr 3rd Qtr 4th Qtr Jan Feb Mar Apr May June July Aug Sept Oct Nov Dec
SIC 2007 (SALES IN 2008)
Other Specialised Non-food Stores, All Businesses (£44,697m)
2003 84.1 76.1 81.8 80.3 98.3 73.2 76.0 78.5 81.6 80.9 82.6 82.2 78.8 80.0 82.2 94.8 113.82004 90.7 82.7 90.0 87.6 102.7 80.4 81.6 85.4 88.4 89.3 91.8 91.5 85.4 86.3 87.6 98.5 118.22005 92.6 81.8 89.6 90.2 108.9 78.3 80.5 85.8 87.7 89.1 91.4 91.9 90.5 88.5 92.9 102.8 126.62006 92.1 82.6 90.5 87.7 107.6 80.6 82.6 84.1 89.1 90.3 91.8 89.6 88.2 85.8 90.3 101.2 126.62007 95.3 83.7 94.2 91.9 111.6 78.4 82.8 88.7 91.3 94.2 96.4 93.7 92.3 90.2 93.3 106.4 130.5
2008 100.0 90.1 99.3 96.7 114.6 84.0 92.6 94.2 96.4 100.8 100.4 100.1 96.1 94.6 96.1 106.9 135.62009 97.3 86.1 94.0 94.4 114.6 84.7 84.2 88.8 92.2 92.8 96.5 99.1 94.0 90.8 95.6 110.4 133.32010 98.2 83.5 93.1 97.1 119.0 76.0 85.3 88.1 91.3 93.1 94.6 101.0 98.1 93.2 100.0 115.2 137.12011 97.9 88.4 93.2 92.4 117.9 85.4 88.2 90.9 92.4 93.4 93.7 95.4 91.1 90.9 99.1 111.0 138.42012 .. .. .. .. .. 86.6 86.7 .. .. .. .. .. .. .. .. .. ..
Percentage increase on a year earlier
2003 2.1 1.0 −0.6 1.9 5.0 1.5 0.9 −0.2 −3.6 −2.9 3.8 0.3 2.3 2.9 3.3 4.6 6.22004 7.9 8.7 10.1 9.1 4.5 9.8 7.5 8.8 8.4 10.4 11.1 11.4 8.4 7.8 6.5 3.9 3.82005 2.1 −1.0 −0.5 2.9 6.0 −2.6 −1.4 0.4 −0.8 −0.2 −0.4 0.5 6.0 2.5 6.0 4.3 7.12006 −0.5 0.9 1.0 −2.7 −1.1 3.0 2.6 −1.9 1.6 1.2 0.4 −2.5 −2.5 −3.0 −2.8 −1.5 −
2007 3.5 1.3 4.1 4.7 3.7 −2.8 0.2 5.4 2.5 4.4 5.0 4.5 4.6 5.0 3.4 5.1 3.0
2008 4.9 7.6 5.4 5.3 2.7 7.1 11.9 6.2 5.6 7.1 4.1 6.9 4.2 4.9 3.0 0.5 4.0
2009−2.7
−4.4
−5.3
−2.5
−0.9
−9.1
−5.8
−4.4
−7.9
−3.8
−1.0
−2.2
−3.9
−0.6 3.3
−1.72010 0.9 −3.0 −1.0 2.9 3.8 −10.2 1.3 −0.8 −1.0 0.3 −2.0 2.0 4.3 2.6 4.6 4.4 2.9
2011 −0.2 5.8 0.1 −4.9 −0.9 12.3 3.4 3.1 1.2 0.3 −0.9 −5.5 −7.1 −2.5 −0.9 −3.7 0.92012 .. .. .. .. .. 1.4 −1.7 .. .. .. .. .. .. .. .. .. ..
Other Specialised Non-food Stores, Large Businesses (£21,691m)
2003 77.1 65.8 70.8 72.6 99.1 62.9 66.1 68.0 71.7 70.7 70.2 72.4 73.7 71.9 76.3 92.3 122.92004 84.2 72.9 77.9 80.3 105.6 71.3 71.9 75.1 77.0 77.9 78.6 79.3 81.4 80.3 83.1 97.3 130.22005 85.6 77.0 77.9 79.6 108.1 75.8 74.6 79.8 77.0 78.8 77.9 80.4 79.7 78.9 83.1 98.3 136.02006 90.1 79.1 83.8 84.8 112.7 79.1 77.4 80.6 83.2 84.8 83.4 86.1 86.5 82.4 88.0 100.8 142.02007 94.3 80.7 86.6 89.1 120.6 77.0 80.6 83.8 84.6 87.9 87.3 88.4 89.8 89.1 91.7 108.8 153.1
2008 100.0 88.4 92.5 93.7 126.3 86.7 90.2 88.6 90.6 94.2 92.6 94.4 94.2 92.8 95.9 112.5 161.72009 98.7 90.6 90.1 91.2 122.9 94.0 89.0 89.3 90.2 88.0 91.8 96.0 90.6 87.8 93.0 116.5 151.92010 101.8 85.8 92.5 96.3 132.6 83.0 86.2 87.7 89.7 90.7 96.1 97.6 97.1 94.7 101.4 121.2 166.82011 105.2 91.9 95.5 96.4 136.9 93.5 91.6 90.9 94.2 94.4 97.3 99.4 93.8 96.0 103.6 124.5 173.42012 .. .. .. .. .. 93.9 93.0 .. .. .. .. .. .. .. .. .. ..
Percentage increase on a year earlier
2003 9.5 9.1 9.1 9.4 9.1 7.9 8.6 9.7 10.2 7.2 9.9 9.0 11.2 8.3 9.8 8.2 9.22004 9.2 10.8 10.0 10.6 6.5 13.4 8.8 10.4 7.3 10.1 12.0 9.4 10.5 11.6 9.0 5.4 5.92005 1.7 5.5 − −0.9 2.4 6.4 3.8 6.3 0.1 1.2 −0.9 1.4 −2.2 −1.7 −0.1 1.1 4.52006 5.2 2.8 7.6 6.6 4.2 4.4 3.7 1.0 8.1 7.6 7.1 7.1 8.6 4.5 5.9 2.5 4.42007 4.6 2.0 3.4 5.0 7.0 −2.7 4.2 4.0 1.6 3.6 4.6 2.7 3.8 8.1 4.3 7.9 7.8
2008 6.1 9.5 6.7 5.2 4.8 12.6 11.9 5.8 7.2 7.2 6.1 6.8 4.8 4.1 4.5 3.4 5.62009 −1.3 2.6 −2.6 −2.7 −2.7 8.4 −1.4 0.8 −0.5 −6.6 −0.8 1.7 −3.7 −5.4 −3.0 3.6 −6.12010 3.1 −5.4 2.7 5.6 7.9 −11.7 −3.1 −1.8 −0.5 3.2 4.7 1.6 7.1 7.9 9.1 4.1 9.82011 3.3 7.2 3.2 − 3.2 12.7 6.3 3.6 5.0 4.1 1.3 1.9 −3.4 1.3 2.2 2.8 4.02012 .. .. .. .. .. 0.4 1.4 .. .. .. .. .. .. .. .. .. ..
Other Specialised Non-food Stores, Small Businesses (£23,006m)
2003 90.9 86.1 92.5 87.8 97.3 83.3 85.6 88.8 91.2 90.8 94.8 91.7 83.8 87.9 88.1 97.3 104.82004 97.2 92.2 101.8 94.8 99.8 89.3 91.2 95.5 99.6 100.4 104.7 103.5 89.2 92.2 91.9 99.7 106.3
2005 99.4 86.6 101.0 100.5 109.6 80.6 86.2 91.6 98.1 99.2 104.6 103.2 101.2 97.9 102.4 107.1 117.22006 94.0 85.9 97.0 90.6 102.6 82.1 87.7 87.6 94.8 95.5 100.0 93.1 89.9 89.2 92.5 101.6 111.52007 96.4 86.6 1 01.5 94.6 102.9 79.7 84.8 93.5 97.8 100.4 105.4 98.8 94.6 91.2 94.9 104.0 108.3
2008 100.0 91.7 105.8 99.7 1 03.4 81.2 9 4.8 9 9.6 101.9 107.3 107.8 105.6 98.0 96.3 96.4 101.6 110.52009 95.9 81.8 97.8 97.3 106.8 75.9 79.6 88.3 94.1 97.4 101.0 102.0 97.2 93.7 98.0 104.6 115.72010 94.7 81.4 93.7 97.8 106.1 69.5 84.4 88.5 92.7 95.3 93.1 104.3 99.0 91.7 98.6 109.6 109.12011 91.1 85.0 91.0 88.6 99.9 77.7 84.9 90.9 90.6 92.4 90.3 91.7 88.6 86.1 94.8 98.2 105.42012 .. .. .. .. .. 79.7 80.8 .. .. .. .. .. .. .. .. .. ..
Percentage increase on a year earlier
2003 −3.4 −4.4 −6.9 −3.5 1.2 −2.8 −4.3 −6.5 −12.2 −9.5 −0.2 −5.6 −4.4 −1.1 −1.7 1.5 3.02004 6.9 7.1 10.1 7.9 2.5 7.1 6.5 7.6 9.2 10.6 10.4 12.9 6.5 4.8 4.3 2.5 1.42005 2.3 −6.2 −0.8 6.1 9.7 −9.7 −5.5 −4.1 −1.5 −1.2 −0.1 −0.3 13.4 6.2 11.5 7.4 10.32006 −5.4 −0.7 −3.9 −9.9 −6.3 1.8 1.8 −4.4 −3.4 −3.7 −4.4 −9.8 −11.2 −8.9 −9.7 −5.1 −4.82007 2.5 0.7 4.6 4.4 0.2 −3.0 −3.3 6.7 3.2 5.1 5.4 6.1 5.3 2.3 2.5 2.4 −2.9
2008 3.7 5.9 4.3 5.4 0.6 1.9 11.8 6.5 4.1 6.9 2.4 6.8 3.6 5.6 1.6 −2.4 2.12009 −4.1 −10.7 −7.6 −2.4 3.3 −6.5 −16.0 −11.3 −7.7 −9.2 −6.4 −3.4 −0.8 −2.7 1.6 3.0 4.62010 −1.3 −0.6 −4.2 0.5 −0.7 −8.5 5.9 0.2 −1.5 −2.2 −7.8 2.3 1.8 −2.1 0.7 4.8 −5.62011
−3.8 4.4
−2.8
−9.4
−5.8 11.8 0.6 2.7
−2.2
−3.1
−3.0
−12.1
−10.5
−6.1
−3.9
−10.5
−3.4
2012 .. .. .. .. .. 2.6 −4.8 .. .. .. .. .. .. .. .. .. ..
The monthly periods consist of 4 weeks except for March, June, Septemberand December which are 5 weeks. Januar y 2008 is also a 5 week period.

8/2/2019 Ons Retail Report
http://slidepdf.com/reader/full/ons-retail-report 76/84
8CHAINED VOLUME OF RETAIL SALESNON-SEASONALLY ADJUSTEDIndex numbers of sales per week and percentage increase on a year earliercontinued Index 2008=100
Year 1st Qtr 2nd Qtr 3rd Qtr 4th Qtr Jan Feb Mar Apr May June July Aug Sept Oct Nov Dec
SIC 2007 (SALES IN 2008)
Phar maceutical, Medical, Cosmetic & Toilet Goods (£4,451m)
2003 90.7 77.7 86.4 89.4 109.3 73.7 78.0 80.7 83.1 82.9 91.9 89.0 87.4 91.2 86.2 100.8 134.62004 94.4 81.9 88.8 92.2 114.7 79.8 80.5 84.8 84.4 89.0 92.1 92.2 91.7 92.7 91.1 103.3 142.72005 97.1 83.8 90.0 96.1 118.5 81.8 86.2 83.4 83.6 88.7 96.1 98.3 95.6 94.6 93.0 103.0 151.22006 93.0 80.0 88.7 88.9 114.2 72.3 80.9 85.5 82.6 88.3 93.9 92.4 88.2 86.7 90.4 99.6 145.02007 96.8 84.8 88.4 94.9 119.0 80.9 84.9 87.9 83.9 88.2 92.1 91.9 94.4 97.7 91.3 105.4 152.1
2008 100.0 91.8 96.6 93.4 118.8 89.1 93.6 93.0 93.4 97.2 98.7 97.5 94.4 89.3 95.3 104.2 149.32009 90.1 79.8 84.4 87.7 108.4 77.1 81.2 81.0 81.5 80.6 89.9 90.7 87.9 85.0 89.8 97.7 131.92010 92.9 80.2 85.9 88.3 117.3 74.1 83.7 82.3 84.1 85.5 87.7 92.1 90.0 84.0 91.8 106.5 146.32011 95.3 86.9 90.0 89.8 114.4 84.4 86.0 89.8 88.9 89.3 91.4 93.2 88.7 87.8 90.5 105.8 140.42012 .. .. .. .. .. 81.3 84.9 .. .. .. .. .. .. .. .. .. ..
Percentage increase on a year earlier
2003 8.0 2.1 5.1 10.1 12.9 −3.8 3.1 6.1 −3.5 3.2 13.9 2.1 12.2 15.5 11.4 13.2 13.52004 4.1 5.4 2.7 3.2 4.9 8.2 3.3 5.1 1.5 7.3 0.2 3.6 4.9 1.6 5.6 2.5 6.02005 2.8 2.3 1.3 4.1 3.3 2.5 7.1 −1.7 −0.9 −0.3 4.3 6.6 4.3 2.1 2.2 −0.3 6.02006 −4.2 −4.5 −1.4 −7.4 −3.6 −11.6 −6.1 2.4 −1.2 −0.4 −2.3 −6.0 −7.8 −8.4 −2.8 −3.3 −4.12007 4.1 6.0 −0.4 6.8 4.2 11.9 4.9 2.9 1.6 −0.2 −1.9 −0.6 7.1 12.7 1.0 5.8 4.9
2008 3.3 8.2 9.3 −1.6 −0.2 10.2 10.2 5.8 11.4 10.2 7.1 6.1 − −8.7 4.4 −1.1 −1.8
2009−9.9
−13.0
−12.6
−6.2
−8.8
−13.5
−13.2
−13.0
−12.8
−17.0
−8.9
−7.0
−6.9
−4.8
−5.8
−6.2
−11.72010 3.1 0.5 1.7 0.8 8.2 −3.9 3.1 1.7 3.2 6.0 −2.4 1.5 2.4 −1.2 2.3 8.9 10.9
2011 2.5 8.4 4.8 1.6 −2.4 13.9 2.7 9.0 5.8 4.6 4.2 1.2 −1.4 4.6 −1.5 −0.6 −4.02012 .. .. .. .. .. −3.7 −1.3 .. .. .. .. .. .. .. .. .. ..
Books, Newspapers & Per iodicals (£4,477m)
2003 129.6 122.9 110.0 119.2 166.2 125.4 125.0 119.1 112.5 104.6 112.3 118.2 115.4 123.2 128.5 151.8 207.82004 132.0 124.9 115.5 117.9 169.7 124.9 123.9 125.5 116.3 114.3 115.7 113.7 113.6 124.8 132.8 153.0 212.52005 132.1 118.9 113.3 123.2 172.9 116.8 117.8 121.5 114.1 111.8 113.9 121.7 118.2 128.4 138.3 153.7 215.92006 116.9 111.7 99.0 104.7 152.3 113.8 112.9 109.1 102.3 98.5 96.8 97.9 102.3 112.0 119.8 133.3 193.62007 108.5 100.2 92.3 99.7 141.7 98.7 101.4 100.4 90.0 91.1 95.2 97.7 94.5 105.5 109.1 123.0 182.9
2008 100.0 90.7 84.0 94.5 131.4 88.9 96.4 88.0 83.4 79.5 88.2 89.1 92.1 100.8 103.5 116.8 165.52009 106.4 100.3 92.9 95.0 137.5 101.3 100.9 98.9 95.3 90.1 93.2 92.9 93.0 98.3 106.8 123.0 173.72010 94.0 89.8 79.2 86.3 120.6 87.1 92.6 89.7 78.6 78.4 80.3 83.5 85.4 89.2 91.8 107.9 153.82011 94.4 88.9 79.8 85.6 123.3 88.7 89.6 88.5 74.7 78.9 84.6 85.3 82.2 88.6 87.7 107.3 164.52012 .. .. .. .. .. 83.7 85.3 .. .. .. .. .. .. .. .. .. ..
Percentage increase on a year earlier
2003 −6.1 −3.9 −7.7 −5.2 −7.5 −1.4 −4.7 −5.3 −8.7 −14.7 −0.9 −1.1 −5.7 −7.9 −10.4 −8.7 −5.32004 1.9 1.6 5.0 −1.1 2.1 −0.4 −0.9 5.4 3.4 9.3 3.0 −3.8 −1.5 1.3 3.4 0.8 2.32005 0.1 −4.8 −1.9 4.5 1.9 −6.5 −5.0 −3.2 −2.0 −2.2 −1.6 7.1 4.0 2.9 4.1 0.4 1.62006 −11.5 −6.0 −12.6 −15.1 −11.9 −2.6 −4.1 −10.2 −10.3 −11.9 −15.0 −19.6 −13.5 −12.8 −13.4 −13.2 −10.32007 −7.2 −10.4 −6.7 −4.7 −7.0 −13.3 −10.3 −8.0 −12.0 −7.5 −1.7 −0.2 −7.6 −5.7 −8.9 −7.8 −5.6
2008 −7.8 −9.4 −9.0 −5.2 −7.3 −9.9 −4.8 −12.3 −7.4 −12.8 −7.3 −8.7 −2.6 −4.5 −5.2 −5.0 −9.52009 6.4 10.5 10.6 0.5 4.6 13.9 4.6 12.4 14.3 13.4 5.7 4.2 1.0 −2.4 3.2 5.3 4.92010 −11.7 −10.4 −14.7 −9.2 −12.3 −14.0 −8.2 −9.3 −17.5 −13.0 −13.8 −10.1 −8.2 −9.3 −14.0 −12.2 −11.52011 0.5 −1.0 0.7 −0.7 2.2 1.8 −3.3 −1.3 −4.9 0.6 5.3 2.3 −3.7 −0.6 −4.5 −0.6 7.02012 .. .. .. .. .. −5.6 −4.8 .. .. .. .. .. .. .. .. .. ..
Floor Coverings (£2,487m)
2003 93.6 101.6 94.0 88.5 90.1 103.0 110.3 93.6 98.3 87.0 96.1 97.5 78.4 89.5 97.6 106.4 71.22004 96.3 88.1 93.1 100.9 103.2 93.7 84.1 86.9 91.5 92.2 95.1 105.1 93.8 103.3 107.2 123.8 83.5
2005 94.9 91.0 89.7 97.7 101.0 89.4 93.6 90.2 91.4 88.2 89.5 94.1 106.6 93.5 104.3 119.8 83.42006 104.0 102.3 98.6 105.7 109.1 94.6 105.6 105.8 98.8 98.6 98.5 101.1 109.0 106.7 112.2 126.0 93.22007 115.3 113.9 108.5 117.3 121.5 107.8 113.1 119.5 103.0 105.4 115.3 117.6 114.6 119.1 115.9 146.7 105.7
2008 100.0 114.6 99.9 98.5 86.0 105.1 109.5 128.1 118.1 92.1 91.4 101.0 103.2 92.7 93.2 110.0 60.92009 100.0 88.9 97.7 109.6 103.9 77.3 80.0 105.2 101.8 100.1 92.6 112.1 111.1 106.4 117.0 116.5 83.32010 79.7 84.9 79.8 78.3 75.8 80.0 85.7 88.2 84.0 80.1 76.1 78.9 79.7 76.8 78.9 98.6 54.92011 59.2 63.2 54.6 58.7 60.5 67.5 59.2 62.9 58.0 52.0 53.9 58.9 56.0 60.8 64.6 71.8 48.02012 .. .. .. .. .. 71.3 69.6 .. .. .. .. .. .. .. .. .. ..
Percentage increase on a year earlier
2003 −7.4 5.1 −3.0 −15.6 −14.9 15.5 7.5 −6.1 −2.9 −9.9 2.5 −10.8 −15.8 −19.1 −19.0 −18.3 −4.92004 3.0 −13.3 −0.9 14.0 14.5 −9.0 −23.7 −7.1 −6.9 5.9 −1.0 7.9 19.6 15.4 9.8 16.4 17.32005 −1.5 3.2 −3.7 −3.2 −2.1 −4.6 11.3 3.8 −0.1 −4.4 −5.9 −10.5 13.7 −9.5 −2.7 −3.2 −0.12006 9.6 12.5 10.0 8.1 8.0 5.8 12.9 17.4 8.1 11.8 10.1 7.4 2.2 14.1 7.6 5.2 11.72007 10.9 11.4 10.0 11.0 11.3 14.0 7.1 12.9 4.2 6.9 17.0 16.3 5.2 11.6 3.3 16.5 13.4
2008 −13.3 0.5 −7.9 −16.0 −29.2 −2.5 −3.2 7.2 14.7 −12.6 −20.7 −14.1 −10.0 −22.2 −19.5 −25.0 −42.42009 − −22.4 −2.1 11.3 20.8 −26.5 −26.9 −17.9 −13.8 8.6 1.2 11.0 7.7 14.8 25.5 5.9 36.72010 −20.3 −4.4 −18.4 −28.5 −27.1 3.6 7.2 −16.2 −17.5 −19.9 −17.8 −29.6 −28.3 −27.8 −32.5 −15.3 −34.12011
−25.7
−25.6
−31.6
−25.0
−20.2
−15.6
−30.9
−28.7
−31.0
−35.1
−29.2
−25.3
−29.7
−20.9
−18.1
−27.2
−12.5
2012 .. .. .. .. .. 5.7 17.6 .. .. .. .. .. .. .. .. .. ..
The monthly periods consist of 4 weeks except for March, June, Septemberand December which are 5 weeks. Januar y 2008 is also a 5 week period.

8/2/2019 Ons Retail Report
http://slidepdf.com/reader/full/ons-retail-report 77/84
8CHAINED VOLUME OF RETAIL SALESNON-SEASONALLY ADJUSTEDIndex numbers of sales per week and percentage increase on a year earliercontinued Index 2008=100
Year 1st Qtr 2nd Qtr 3rd Qtr 4th Qtr Jan Feb Mar Apr May June July Aug Sept Oct Nov Dec
SIC 2007 (SALES IN 2008)
Computers and Telecommunications Equipment (£5,681m)
2003 65.7 60.5 60.7 65.6 75.8 56.8 62.0 62.4 59.0 59.9 62.7 64.2 64.5 67.5 68.9 74.8 82.22004 87.9 87.2 82.9 87.0 94.7 89.0 85.2 87.3 80.1 81.4 86.2 93.8 82.0 85.7 89.0 97.2 97.32005 98.7 92.2 94.6 97.0 111.2 89.3 91.1 95.3 97.7 92.2 94.0 96.3 96.1 98.2 102.8 111.5 117.52006 94.5 92.7 92.5 90.6 102.3 92.0 94.1 92.1 92.5 94.3 91.0 94.5 93.0 85.7 92.7 101.4 110.52007 94.8 90.7 90.1 91.8 106.5 86.7 89.7 94.7 80.7 97.0 92.0 93.2 91.8 90.8 92.9 106.6 117.3
2008 100.0 97.2 98.7 96.4 108.0 92.8 103.5 96.6 103.3 100.0 94.0 99.0 93.1 96.8 99.6 106.6 115.72009 97.9 93.2 87.7 94.8 115.9 95.5 87.1 96.2 91.2 85.0 87.2 109.3 88.9 87.8 96.2 119.8 128.52010 97.5 76.2 79.9 95.1 138.6 71.8 76.6 79.4 77.9 79.1 82.1 91.2 97.7 96.3 100.5 134.4 172.42011 105.0 97.3 85.4 88.3 148.9 104.4 99.6 89.9 82.8 86.5 86.6 85.6 83.3 94.3 110.9 146.1 181.42012 .. .. .. .. .. 109.2 101.3 .. .. .. .. .. .. .. .. .. ..
Percentage increase on a year earlier
2003 −5.7 −14.5 −13.6 −4.4 10.2 −18.5 −13.2 −12.7 −20.9 −15.4 −5.5 −12.3 −4.3 2.5 4.4 13.8 11.72004 33.9 44.0 36.5 32.8 24.8 56.8 37.5 40.0 35.9 35.8 37.5 46.1 27.2 26.9 29.2 29.9 18.32005 12.2 5.7 14.1 11.4 17.4 0.3 7.0 9.1 21.9 13.3 9.0 2.7 17.2 14.6 15.6 14.8 20.82006 −4.3 0.6 −2.2 −6.5 −8.0 3.0 3.3 −3.3 −5.3 2.3 −3.1 −1.9 −3.3 −12.7 −9.8 −9.1 −5.92007 0.3 −2.1 −2.6 1.3 4.2 −5.7 −4.7 2.8 −12.7 2.9 1.0 −1.3 −1.3 5.9 0.2 5.2 6.1
2008 5.5 7.2 9.6 4.9 1.3 7.0 15.3 2.0 28.0 3.1 2.2 6.2 1.5 6.7 7.2 − −1.4
2009−2.1
−4.2
−11.1
−1.7 7.3 2.9
−15.8
−0.4
−11.7
−15.0
−7.2 10.4
−4.6
−9.4
−3.3 12.4 11.02010 −0.4 −18.2 −8.9 0.4 19.6 −24.8 −12.0 −17.4 −14.5 −7.0 −5.8 −16.6 9.9 9.7 4.4 12.2 34.2
2011 7.7 27.7 6.9 −7.2 7.4 45.4 30.0 13.1 6.3 9.4 5.5 −6.1 −14.7 −2.1 10.4 8.7 5.22012 .. .. .. .. .. 4.6 1.7 .. .. .. .. .. .. .. .. .. ..
Other Retail Sale in Specialised Stores NES (£27,602m)
2003 80.8 71.2 82.0 76.5 9 3.5 67.7 69.5 75.5 82.0 82.7 81.4 79.6 76.0 74.4 77.2 90.2 109.32004 84.1 74.4 88.0 81.1 9 2.8 69.7 73.9 78.5 86.9 87.6 89.3 86.0 80.2 78.0 77.9 87.5 108.92005 83.8 72.0 84.3 81.4 9 7.3 67.6 69.5 77.4 81.0 84.9 86.6 84.8 82.4 78.0 81.8 90.7 115.02006 86.3 73.9 88.1 82.5 100.8 72.4 72.9 75.9 86.2 87.4 90.3 85.5 82.9 79.8 82.9 94.1 120.32007 91.4 76.5 95.2 87.9 106.0 70.0 75.0 82.7 94.4 93.9 96.8 91.3 89.7 83.8 89.2 100.2 124.1
2008 100.0 86.0 102.3 97.6 115.3 78.4 87.8 92.0 95.5 105.9 104.9 102.4 97.1 94.0 94.5 105.5 139.72009 96.6 83.1 96.7 93.9 112.6 81.7 81.7 85.4 92.7 96.2 100.4 98.2 94.7 89.8 92.6 107.9 132.42010 101.5 84.4 100.4 102.4 118.8 75.1 86.1 90.6 97.9 100.8 102.2 109.4 103.1 96.1 104.4 115.4 133.12011 101.0 88.9 101.0 97.7 116.3 82.7 88.5 94.2 100.8 101.5 100.6 102.8 97.7 93.7 103.0 108.7 133.12012 .. .. .. .. .. 84.7 85.7 .. .. .. .. .. .. .. .. .. ..
Percentage increase on a year earlier
2003 6.6 7.0 4.0 6.3 8.0 9.0 6.2 4.8 2.7 3.1 5.9 5.6 6.5 6.7 8.7 7.7 7.82004 4.0 4.4 7.4 6.0 −0.8 3.0 6.3 3.9 5.9 5.9 9.8 8.0 5.5 4.7 0.9 −3.0 −0.32005 −0.4 −3.2 −4.2 0.4 4.9 −3.1 −5.9 −1.3 −6.8 −3.1 −3.1 −1.4 2.7 − 5.1 3.7 5.72006 3.1 2.7 4.5 1.3 3.5 7.2 4.8 −2.0 6.5 3.0 4.3 0.9 0.6 2.3 1.4 3.7 4.62007 5.9 3.5 8.0 6.6 5.2 −3.3 2.9 9.0 9.5 7.5 7.2 6.8 8.2 5.1 7.5 6.5 3.1
2008 9.4 12.4 7.5 11.0 8.7 12.0 17.1 11.2 1.1 12.7 8.3 12.2 8.3 12.2 6.0 5.3 12.62009 −3.4 −3.3 −5.4 −3.8 −2.3 4.1 −7.0 −7.1 −2.9 −9.1 −4.3 −4.2 −2.5 −4.5 −2.0 2.3 −5.22010 5.1 1.5 3.8 9.1 5.5 −8.1 5.4 6.0 5.6 4.7 1.8 11.4 8.9 7.1 12.8 7.0 0.52011 −0.5 5.3 0.5 −4.5 −2.1 10.2 2.9 4.0 3.0 0.8 −1.5 −6.1 −5.3 −2.5 −1.3 −5.8 −
2012 .. .. .. .. .. 2.3 −3.2 .. .. .. .. .. .. .. .. .. ..
The monthly periods consist of 4 weeks except for March, June, Septemberand December which are 5 weeks. Januar y 2008 is also a 5 week period.
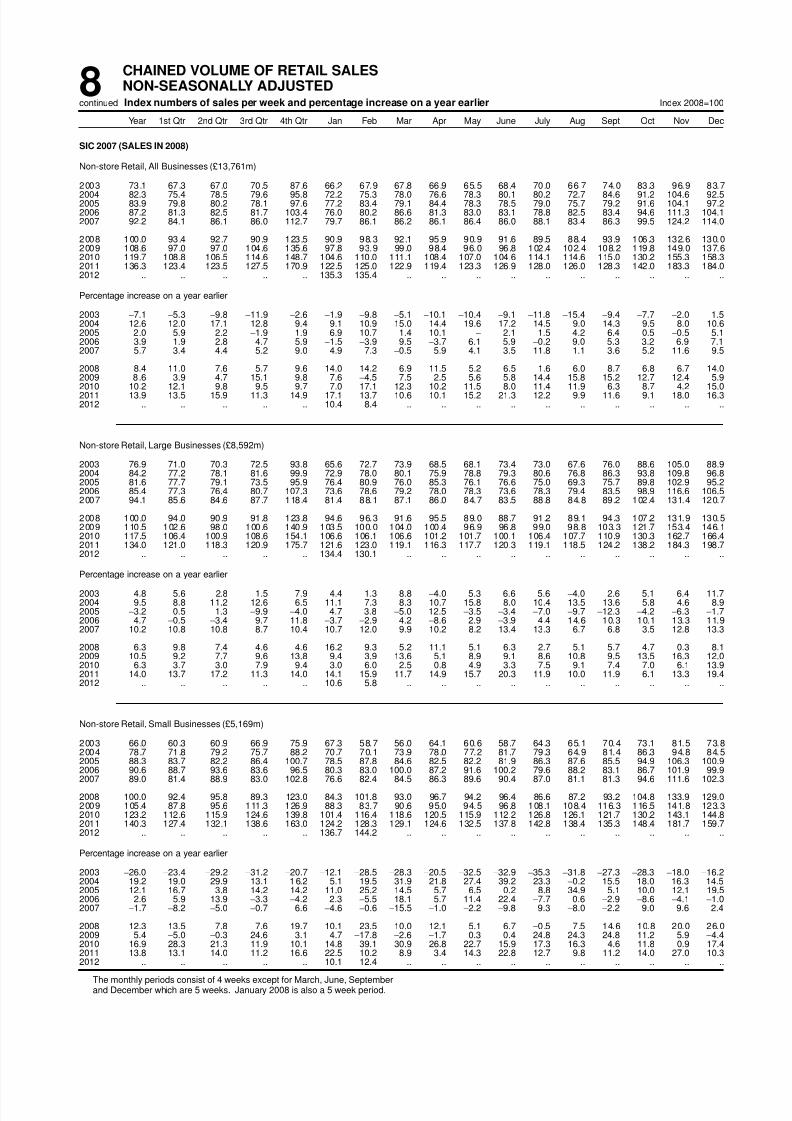
8/2/2019 Ons Retail Report
http://slidepdf.com/reader/full/ons-retail-report 78/84
8CHAINED VOLUME OF RETAIL SALESNON-SEASONALLY ADJUSTEDIndex numbers of sales per week and percentage increase on a year earliercontinued Index 2008=100
Year 1st Qtr 2nd Qtr 3rd Qtr 4th Qtr Jan Feb Mar Apr May June July Aug Sept Oct Nov Dec
SIC 2007 (SALES IN 2008)
Non-store Retail, All Businesses (£13,761m)
2003 73.1 67.3 67.0 70.5 87.6 66.2 67.9 67.8 66.9 65.5 68.4 70.0 66.7 74.0 83.3 96.9 83.72004 82.3 75.4 78.5 79.6 95.8 72.2 75.3 78.0 76.6 78.3 80.1 80.2 72.7 84.6 91.2 104.6 92.52005 83.9 79.8 80.2 78.1 97.6 77.2 83.4 79.1 84.4 78.3 78.5 79.0 75.7 79.2 91.6 104.1 97.22006 87.2 81.3 82.5 81.7 103.4 76.0 80.2 86.6 81.3 83.0 83.1 78.8 82.5 83.4 94.6 111.3 104.12007 92.2 84.1 86.1 86.0 112.7 79.7 86.1 86.2 86.1 86.4 86.0 88.1 83.4 86.3 99.5 124.2 114.0
2008 100.0 93.4 92.7 90.9 123.5 90.9 98.3 92.1 95.9 90.9 91.6 89.5 88.4 93.9 106.3 132.6 130.02009 108.6 97.0 97.0 104.6 135.6 97.8 93.9 99.0 98.4 96.0 96.8 102.4 102.4 108.2 119.8 149.0 137.62010 119.7 108.8 106.5 114.6 148.7 104.6 110.0 111.1 108.4 107.0 104.6 114.1 114.6 115.0 130.2 155.3 158.32011 136.3 123.4 123.5 127.5 170.9 122.5 125.0 122.9 119.4 123.3 126.9 128.0 126.0 128.3 142.0 183.3 184.02012 .. .. .. .. .. 135.3 135.4 .. .. .. .. .. .. .. .. .. ..
Percentage increase on a year earlier
2003 −7.1 −5.3 −9.8 −11.9 −2.6 −1.9 −9.8 −5.1 −10.1 −10.4 −9.1 −11.8 −15.4 −9.4 −7.7 −2.0 1.52004 12.6 12.0 17.1 12.8 9.4 9.1 10.9 15.0 14.4 19.6 17.2 14.5 9.0 14.3 9.5 8.0 10.62005 2.0 5.9 2.2 −1.9 1.9 6.9 10.7 1.4 10.1 − −2.1 −1.5 4.2 −6.4 0.5 −0.5 5.12006 3.9 1.9 2.8 4.7 5.9 −1.5 −3.9 9.5 −3.7 6.1 5.9 −0.2 9.0 5.3 3.2 6.9 7.12007 5.7 3.4 4.4 5.2 9.0 4.9 7.3 −0.5 5.9 4.1 3.5 11.8 1.1 3.6 5.2 11.6 9.5
2008 8.4 11.0 7.6 5.7 9.6 14.0 14.2 6.9 11.5 5.2 6.5 1.6 6.0 8.7 6.8 6.7 14.0
2009 8.6 3.9 4.7 15.1 9.8 7.6−4.5 7.5 2.5 5.6 5.8 14.4 15.8 15.2 12.7 12.4 5.92010 10.2 12.1 9.8 9.5 9.7 7.0 17.1 12.3 10.2 11.5 8.0 11.4 11.9 6.3 8.7 4.2 15.0
2011 13.9 13.5 15.9 11.3 14.9 17.1 13.7 10.6 10.1 15.2 21.3 12.2 9.9 11.6 9.1 18.0 16.32012 .. .. .. .. .. 10.4 8.4 .. .. .. .. .. .. .. .. .. ..
Non-store Retail, Large Businesses (£8,592m)
2003 76.9 71.0 70.3 72.5 93.8 65.6 72.7 73.9 68.5 68.1 73.4 73.0 67.6 76.0 88.6 105.0 88.92004 84.2 77.2 78.1 81.6 99.9 72.9 78.0 80.1 75.9 78.8 79.3 80.6 76.8 86.3 93.8 109.8 96.82005 81.6 77.7 79.1 73.5 95.9 76.4 80.9 76.0 85.3 76.1 76.6 75.0 69.3 75.7 89.8 102.9 95.22006 85.4 77.3 76.4 80.7 107.3 73.6 78.6 79.2 78.0 78.3 73.6 78.3 79.4 83.5 98.9 116.6 106.52007 94.1 85.6 84.6 87.7 118.4 81.4 88.1 87.1 86.0 84.7 83.5 88.8 84.8 89.2 102.4 131.4 120.7
2008 100.0 94.0 90.9 91.8 123.8 94.6 96.3 91.6 95.5 89.0 88.7 91.2 89.1 94.3 107.2 131.9 130.52009 110.5 102.6 98.0 100.6 140.9 103.5 100.0 104.0 100.4 96.9 96.8 99.0 98.8 103.3 121.7 153.4 146.12010 117.5 106.4 100.9 108.6 154.1 106.6 106.1 106.6 101.2 101.7 100.1 106.4 107.7 110.9 130.3 162.7 166.42011 134.0 121.0 118.3 120.9 175.7 121.6 123.0 119.1 116.3 117.7 120.3 119.1 118.5 124.2 138.2 184.3 198.72012 .. .. .. .. .. 134.4 130.1 .. .. .. .. .. .. .. .. .. ..
Percentage increase on a year earlier
2003 4.8 5.6 2.8 1.5 7.9 4.4 1.3 8.8 −4.0 5.3 6.6 5.6 −4.0 2.6 5.1 6.4 11.72004 9.5 8.8 11.2 12.6 6.5 11.1 7.3 8.3 10.7 15.8 8.0 10.4 13.5 13.6 5.8 4.6 8.92005 −3.2 0.5 1.3 −9.9 −4.0 4.7 3.8 −5.0 12.5 −3.5 −3.4 −7.0 −9.7 −12.3 −4.2 −6.3 −1.72006 4.7 −0.5 −3.4 9.7 11.8 −3.7 −2.9 4.2 −8.6 2.9 −3.9 4.4 14.6 10.3 10.1 13.3 11.92007 10.2 10.8 10.8 8.7 10.4 10.7 12.0 9.9 10.2 8.2 13.4 13.3 6.7 6.8 3.5 12.8 13.3
2008 6.3 9.8 7.4 4.6 4.6 16.2 9.3 5.2 11.1 5.1 6.3 2.7 5.1 5.7 4.7 0.3 8.12009 10.5 9.2 7.7 9.6 13.8 9.4 3.9 13.6 5.1 8.9 9.1 8.6 10.8 9.5 13.5 16.3 12.02010 6.3 3.7 3.0 7.9 9.4 3.0 6.0 2.5 0.8 4.9 3.3 7.5 9.1 7.4 7.0 6.1 13.92011 14.0 13.7 17.2 11.3 14.0 14.1 15.9 11.7 14.9 15.7 20.3 11.9 10.0 11.9 6.1 13.3 19.42012 .. .. .. .. .. 10.6 5.8 .. .. .. .. .. .. .. .. .. ..
Non-store Retail, Small Businesses (£5,169m)
2003 66.0 60.3 60.9 66.9 75.9 67.3 58.7 56.0 64.1 60.6 58.7 64.3 65.1 70.4 73.1 81.5 73.82004 78.7 71.8 79.2 75.7 88.2 70.7 70.1 73.9 78.0 77.2 81.7 79.3 64.9 81.4 86.3 94.8 84.5
2005 88.3 83.7 82.2 86.4 100.7 78.5 87.8 84.6 82.5 82.2 81.9 86.3 87.6 85.5 94.9 106.3 100.92006 90.6 88.7 93.6 83.6 96.5 80.3 83.0 100.0 87.2 91.6 100.2 79.6 88.2 83.1 86.7 101.9 99.92007 89.0 81.4 88.9 83.0 102.8 76.6 82.4 84.5 86.3 89.6 90.4 87.0 81.1 81.3 94.6 111.6 102.3
2008 100.0 92.4 95.8 89.3 123.0 84.3 101.8 93.0 96.7 94.2 96.4 86.6 87.2 93.2 104.8 133.9 129.02009 105.4 87.8 95.6 111.3 126.9 88.3 83.7 90.6 95.0 94.5 96.8 108.1 108.4 116.3 116.5 141.8 123.32010 123.2 112.6 115.9 124.6 139.8 101.4 116.4 118.6 120.5 115.9 112.2 126.8 126.1 121.7 130.2 143.1 144.82011 140.3 127.4 132.1 138.6 163.0 124.2 128.3 129.1 124.6 132.5 137.8 142.8 138.4 135.3 148.4 181.7 159.72012 .. .. .. .. .. 136.7 144.2 .. .. .. .. .. .. .. .. .. ..
Percentage increase on a year earlier
2003 −26.0 −23.4 −29.2 −31.2 −20.7 −12.1 −28.5 −28.3 −20.5 −32.5 −32.9 −35.3 −31.8 −27.3 −28.3 −18.0 −16.22004 19.2 19.0 29.9 13.1 16.2 5.1 19.5 31.9 21.8 27.4 39.2 23.3 −0.2 15.5 18.0 16.3 14.52005 12.1 16.7 3.8 14.2 14.2 11.0 25.2 14.5 5.7 6.5 0.2 8.8 34.9 5.1 10.0 12.1 19.52006 2.6 5.9 13.9 −3.3 −4.2 2.3 −5.5 18.1 5.7 11.4 22.4 −7.7 0.6 −2.9 −8.6 −4.1 −1.02007 −1.7 −8.2 −5.0 −0.7 6.6 −4.6 −0.6 −15.5 −1.0 −2.2 −9.8 9.3 −8.0 −2.2 9.0 9.6 2.4
2008 12.3 13.5 7.8 7.6 19.7 10.1 23.5 10.0 12.1 5.1 6.7 −0.5 7.5 14.6 10.8 20.0 26.02009 5.4 −5.0 −0.3 24.6 3.1 4.7 −17.8 −2.6 −1.7 0.3 0.4 24.8 24.3 24.8 11.2 5.9 −4.42010 16.9 28.3 21.3 11.9 10.1 14.8 39.1 30.9 26.8 22.7 15.9 17.3 16.3 4.6 11.8 0.9 17.42011 13.8 13.1 14.0 11.2 16.6 22.5 10.2 8.9 3.4 14.3 22.8 12.7 9.8 11.2 14.0 27.0 10.32012 .. .. .. .. .. 10.1 12.4 .. .. .. .. .. .. .. .. .. ..
The monthly periods consist of 4 weeks except for March, June, Septemberand December which are 5 weeks. Januar y 2008 is also a 5 week period.

8/2/2019 Ons Retail Report
http://slidepdf.com/reader/full/ons-retail-report 79/84
8CHAINED VOLUME OF RETAIL SALESNON-SEASONALLY ADJUSTEDIndex numbers of sales per week and percentage increase on a year earliercontinued Index 2008=100
Year 1st Qtr 2nd Qtr 3rd Qtr 4th Qtr Jan Feb Mar Apr May June July Aug Sept Oct Nov Dec
SIC 2007 (SALES IN 2008)
Retail Sale Via Mail Order Houses (£11,091m)
2003 65.4 59.3 58.9 63.0 80.4 56.7 59.6 61.0 57.4 56.7 61.9 62.0 59.5 66.7 76.5 90.0 75.72004 74.6 67.8 69.2 71.4 90.1 64.4 68.2 70.2 66.9 69.5 70.8 70.9 66.0 76.2 84.1 99.9 87.02005 79.1 73.7 75.1 73.2 94.5 72.3 76.5 72.6 79.9 72.4 73.5 73.4 70.5 75.2 89.2 100.8 93.62006 83.5 80.1 76.9 75.8 101.1 76.3 78.6 84.3 79.0 78.9 73.6 74.1 75.4 77.6 91.6 109.9 101.82007 92.1 81.5 84.0 86.3 116.8 78.0 82.5 83.5 83.6 85.0 83.5 87.9 84.0 86.9 101.3 129.2 119.2
2008 100.0 94.0 91.4 91.5 123.6 94.5 96.9 91.1 95.4 88.9 90.3 90.9 89.3 93.7 106.4 130.9 131.32009 109.4 102.1 97.1 100.9 137.3 104.1 98.1 103.7 99.2 96.8 95.7 100.0 98.4 103.8 120.8 149.3 141.02010 123.7 112.4 107.2 116.9 158.4 109.8 113.4 113.7 109.9 107.3 104.9 113.6 117.2 119.2 136.2 164.0 171.72011 145.0 129.5 127.7 135.9 186.8 131.7 128.7 128.3 123.8 127.8 130.7 135.1 134.6 137.6 149.6 201.7 204.72012 .. .. .. .. .. 150.6 147.3 .. .. .. .. .. .. .. .. .. ..
Percentage increase on a year earlier
2003 −3.9 −4.0 −6.9 −8.1 1.7 −2.3 −9.6 −1.6 −11.3 −8.3 −2.4 −6.8 −11.5 −6.5 −3.6 0.3 8.12004 14.1 14.4 17.4 13.3 12.1 13.7 14.4 15.0 16.7 22.5 14.3 14.4 10.9 14.2 10.0 11.0 14.92005 6.0 8.8 8.6 2.5 4.9 12.2 12.2 3.5 19.4 4.2 3.9 3.5 6.8 −1.3 6.0 0.8 7.72006 5.5 8.6 2.3 3.6 7.1 5.5 2.7 16.1 −1.2 9.1 0.1 0.9 6.9 3.2 2.7 9.0 8.72007 10.3 1.7 9.2 13.8 15.5 2.1 4.9 −1.0 5.8 7.6 13.4 18.6 11.4 12.1 10.6 17.6 17.1
2008 8.5 15.4 8.9 6.0 5.8 21.3 17.5 9.2 14.2 4.6 8.2 3.4 6.3 7.7 5.0 1.4 10.2
2009 9.4 8.6 6.2 10.4 11.1 10.1 1.2 13.8 3.9 8.9 6.0 10.0 10.1 10.8 13.5 14.0 7.32010 13.1 10.1 10.4 15.8 15.3 5.4 15.6 9.6 10.8 10.9 9.6 13.6 19.1 14.9 12.8 9.8 21.82011 17.2 15.2 19.1 16.3 18.0 20.0 13.6 12.9 12.6 19.1 24.5 18.9 14.8 15.4 9.9 23.0 19.22012 .. .. .. .. .. 14.3 14.4 .. .. .. .. .. .. .. .. .. ..
Other Non-store Retail (£2,670m)
2003 114.0 110.5 110.7 110.3 124.6 118.0 112.2 103.1 119.4 113.2 101.8 112.8 104.9 112.6 117.6 130.9 125.22004 122.4 114.9 128.0 122.5 124.3 112.8 112.3 118.7 128.4 125.1 130.0 129.3 107.5 129.2 127.3 126.4 120.22005 107.9 110.8 105.8 102.7 112.5 101.2 118.5 112.2 106.3 108.4 103.3 107.4 102.3 99.3 102.5 119.7 114.72006 105.7 86.7 110.7 111.5 114.1 73.0 87.0 97.4 92.1 103.4 131.3 102.6 118.7 112.8 109.0 117.8 115.22007 92.8 97.1 96.6 84.4 93.0 87.9 103.5 99.2 98.2 93.5 98.0 89.3 80.6 83.5 90.8 100.2 89.0
2008 100.0 90.4 98.6 88.2 123.5 73.4 104.3 96.3 98.3 100.4 97.3 83.5 84.5 95.0 106.1 140.5 123.82009 105.3 76.0 96.8 119.9 128.6 71.5 76.5 79.3 95.1 92.8 101.4 112.7 119.1 126.4 115.7 148.0 123.52010 102.8 93.7 103.8 105.2 108.7 83.3 95.8 100.4 102.3 105.8 103.3 116.2 104.0 97.3 105.6 119.6 102.52011 100.4 98.2 106.0 92.8 1 04.8 84.5 109.4 100.2 101.0 104.6 111.1 98.7 90.4 89.9 110.6 107.0 98.32012 .. .. .. .. .. 71.8 86.1 .. .. .. .. .. .. .. .. .. ..
Percentage increase on a year earlier
2003 −16.8 −9.5 −18.1 −23.2 −16.1 −1.0 −10.5 −15.7 −6.6 −16.7 −27.5 −25.3 −26.5 −18.6 −20.8 −9.8 −17.12004 7.4 4.0 15.6 11.1 −0.3 −4.4 − 15.1 7.6 10.5 27.7 14.6 2.5 14.7 8.2 −3.4 −4.02005 −11.9 −3.6 −17.4 −16.2 −9.5 −10.3 5.6 −5.5 −17.3 −13.4 −20.5 −17.0 −4.9 −23.2 −19.5 −5.3 −4.62006 −2.0 −21.7 4.6 8.5 1.4 −27.9 −26.6 −13.2 −13.4 −4.6 27.1 −4.4 16.0 13.6 6.4 −1.6 0.42007 −12.2 12.0 −12.7 −24.3 −18.5 20.5 18.9 1.9 6.7 −9.6 −25.4 −12.9 −32.1 −26.0 −16.7 −14.9 −22.7
2008 7.8 −6.8 2.0 4.5 32.8 −16.5 0.8 −2.9 0.1 7.4 −0.6 −6.5 4.8 13.8 16.9 40.2 39.12009 5.4 −15.9 −1.8 35.9 4.2 −2.6 −26.7 −17.7 −3.3 −7.6 4.2 35.0 41.0 33.0 9.0 5.3 −0.32010 −2.4 23.3 7.2 −12.3 −15.5 16.5 25.3 26.6 7.6 14.1 1.8 3.1 −12.7 −23.0 −8.8 −19.2 −16.92011 −2.3 4.8 2.1 −11.8 −3.6 1.5 14.1 −0.2 −1.3 −1.2 7.6 −15.0 −13.1 −7.6 4.7 −10.5 −4.12012 .. .. .. .. .. −15.1 −21.3 .. .. .. .. .. .. .. .. .. ..
The monthly periods consist of 4 weeks except for March, June, Septemberand December which are 5 weeks. Januar y 2008 is also a 5 week period.

8/2/2019 Ons Retail Report
http://slidepdf.com/reader/full/ons-retail-report 80/84
8CHAINED VOLUME OF RETAIL SALESNON-SEASONALLY ADJUSTEDIndex numbers of sales per week and percentage increase on a year earliercontinued Index 2008=100
Year 1st Qtr 2nd Qtr 3rd Qtr 4th Qtr Jan Feb Mar Apr May June July Aug Sept Oct Nov Dec
SIC 2007 (SALES IN 2008)
Automotive Fuel, All Businesses (£36,106m)
2003 94.3 93.2 93.2 98.0 92.8 89.0 95.8 94.5 91.3 90.2 97.2 97.1 96.6 99.9 97.0 94.3 88.32004 94.4 90.8 93.8 97.6 95.6 85.4 91.8 94.2 94.2 90.4 96.2 97.0 97.8 98.0 102.9 94.5 90.72005 90.2 89.2 96.1 90.9 84.8 84.0 92.6 90.6 95.4 94.8 97.7 96.8 87.8 88.8 84.6 87.2 82.92006 100.1 99.0 100.7 101.5 99.1 95.2 97.4 103.4 99.7 101.1 101.2 102.6 98.3 103.1 101.3 102.2 94.82007 103.9 101.5 105.7 105.2 103.2 96.2 100.2 106.9 107.6 104.6 105.2 105.8 103.2 106.3 103.6 105.5 101.2
2008 100.0 99.3 102.3 101.4 97.0 96.0 100.9 101.3 105.6 100.4 101.2 102.9 98.5 102.6 100.3 100.4 91.72009 98.1 98.3 100.3 99.4 94.5 97.1 97.2 100.1 97.6 99.1 103.3 100.2 98.9 99.3 101.7 95.6 87.92010 88.8 85.4 91.0 90.9 87.8 79.4 86.8 89.2 90.6 92.1 90.4 93.2 89.7 89.9 92.0 93.1 80.32011 92.8 89.9 93.6 93.3 94.4 85.9 91.0 92.3 93.7 94.2 93.1 95.3 91.6 92.9 94.3 98.0 91.72012 .. .. .. .. .. 89.1 92.0 .. .. .. .. .. .. .. .. .. ..
Percentage increase on a year earlier
2003 6.2 2.8 3.0 13.1 6.5 2.1 1.9 3.3 −4.5 −0.7 12.8 15.0 15.2 10.3 10.0 8.5 2.12004 0.1 −2.6 0.6 −0.4 3.0 −4.1 −4.2 −0.3 3.2 0.2 −1.1 − 1.3 −1.9 6.1 0.1 2.72005 −4.4 −1.7 2.5 −6.9 −11.3 −1.6 0.8 −3.8 1.3 4.9 1.6 −0.3 −10.3 −9.4 −17.8 −7.7 −8.52006 10.9 11.0 4.8 11.7 16.9 13.3 5.2 14.1 4.5 6.7 3.6 6.1 12.1 16.2 19.7 17.1 14.42007 3.8 2.5 5.0 3.6 4.2 1.0 2.9 3.3 7.9 3.4 4.0 3.1 4.9 3.1 2.3 3.2 6.7
2008 −3.8 −2.2 −3.2 −3.6 −6.0 −0.2 0.7 −5.2 −1.8 −4.0 −3.8 −2.7 −4.6 −3.5 −3.2 −4.8 −9.4
2009−1.9
−1.0
−2.0
−2.0
−2.6 1.1
−3.6
−1.2
−7.6
−1.3 2.0
−2.7 0.5
−3.3 1.3
−4.8
−4.12010 −9.5 −13.1 −9.3 −8.6 −7.0 −18.2 −10.8 −10.9 −7.2 −7.1 −12.5 −6.9 −9.3 −9.4 −9.5 −2.6 −8.6
2011 4.5 5.3 2.9 2.6 7.5 8.2 4.9 3.5 3.4 2.4 3.0 2.2 2.2 3.3 2.5 5.2 14.22012 .. .. .. .. .. 3.7 1.1 .. .. .. .. .. .. .. .. .. ..
The monthly periods consist of 4 weeks except for March, June, Septemberand December which are 5 weeks. Januar y 2008 is also a 5 week period.

8/2/2019 Ons Retail Report
http://slidepdf.com/reader/full/ons-retail-report 81/84
R1CHAINED VOLUME OF RETAIL SALESSEASONALLY ADJUSTED
Index 2008=100
Predominantly non-food storesAll All
retailing retailing Te xtile,including excluding Non- clothing and Household Predominantly
automotive automotive Predominantly specialised footwear goods Other Non-store automotivefuel1 fuel1 food stores Total stores stores stores stores retailing fuel1
AGG 21 AGG 21X AGG 1 AGG 12 47.19 AGG 5 AGG 7 AGG 13 AGG 14 47.30
Revisions to index numbers
2004 − − 0.1 − − − − − − 0.12005 − − − − − − − − − −
2006 − − − − − − − − − −
2007 − − − − − − − − − −
2008 − − − − − − − − − −
2009 − − − − − − − − − −
2010 − − − − − − − − − −
2011 − − − −0.1 −0.1 −0.1 −0.1 − −0.2 0.1
2009 Q1 − − 0.1 0.1 0.1 0.1 − 0.1 − −
Q2 − − − − − − − 0.1 − 0.1Q3 − − − − − −0.1 −0.1 0.1 − −
Q4 −0.1 −0.1 −0.1 −0.1 − − −0.1 −0.2 −0.1 −0.1
2010 Q1 0.1 0.1 0.1 0.2−
0.1 0.1 0.1 0.1−
Q2 − − − − − − 0.1 0.1 0.1 0.1Q3 − − − − − −0.1 − − −0.1 −
Q4 −0.1 −0.1 − −0.2 − −0.1 −0.1 −0.3 −0.2 −
2011 Q1 0.1 0.1 0.1 0.2 0.1 0.2 0.1 0.2 0.1 −
Q2 − − − − − − − − −0.2 0.1Q3 − − − −0.1 −0.1 −0.2 −0.1 − −0.3 −
Q4 −0.1 −0.1 − −0.2 −0.1 −0.1 −0.3 −0.4 −0.4 0.3
2009 Feb 0.2 0.2 0.2 0.2 −0.1 0.2 0.2 0.3 0.2 −
Mar − − − 0.1 − 0.1 − 0.1 − 0.1Apr − − − − − −0.1 0.1 − − 0.2May − 0.1 − − − − − 0.1 0.1 −
Jun − − − − − − 0.1 0.1 0.1 −
Jul − − − − − − − − − −
Aug − − − − − − − 0.1 − −
Sep −0.1 − − −0.1 − −0.1 −0.1 −0.1 −0.1 −
Oct −0.1 − −0.1 −0.1 − − −0.1 −0.1 −0.1 −
Nov− −
0.1− −
0.1− −
0.1−0.1
−0.1
−0.1
−0.1
Dec −0.1 −0.1 −0.1 −0.2 − 0.1 −0.1 −0.4 −0.2 −
2010 Jan − − − − 0.3 −0.1 − −0.1 0.1 −0.2Feb 0.2 0.2 0.2 0.3 −0.1 0.5 0.2 0.5 0.3 0.1Mar 0.1 − − − − − 0.1 0.1 − 0.1Apr 0.1 − − −0.1 − −0.1 − − 0.1 0.1May − − − − − − 0.1 0.2 − −
Jun − − − − − − 0.1 0.1 0.1 −
Jul − − −0.1 0.1 − − − − −0.1 −
Aug 0.1 − − 0.1 − − − 0.2 −0.1 0.1Sep −0.1 − − − − − −0.1 −0.1 −0.2 −0.1Oct −0.1 − − −0.1 −0.1 −0.1 −0.1 −0.1 −0.1 −
Nov −0.1 −0.1 − −0.1 0.1 −0.1 −0.2 −0.2 −0.1 −0.2Dec −0.1 −0.2 −0.1 −0.2 − 0.1 −0.1 −0.5 −0.4 −
2011 Jan 0.1 0.1 0.1 − 0.4 −0.2 − −0.1 0.4 −0.3Feb 0.4 0.4 0.2 0.5 −0.1 0.8 0.3 0.7 0.4 0.1Mar − − − − − − 0.1 0.2 −0.4 0.1Apr 0.1 − 0.1 −0.1 −0.1 −0.1 − − −0.1 0.2
May− − − − − − −
0.1− −
0.1 0.1Jun − − − − − − 0.1 − −0.3 0.1
Jul −0.1 − − −0.1 − −0.2 − − −0.3 0.1Aug −0.1 −0.1 0.1 −0.1 − −0.3 −0.1 − −0.3 −
Sep −0.1 −0.1 − −0.1 − −0.2 −0.1 −0.1 −0.4 −
Oct −0.1 −0.1 − −0.2 −0.1 −0.3 −0.1 −0.1 −0.2 −0.1Nov −0.2 −0.2 −0.1 −0.3 −0.4 −0.3 −0.1 −0.3 −0.8 0.2Dec −0.1 −0.1 − −0.3 −0.1 0.3 −0.4 −0.7 −0.3 0.6
2012 Jan −0.7 −0.8 −0.2 −1.1 −0.3 −0.5 −0.9 −2.3 −1.8 0.1
1 Predominantly automotive fuel also includes sale of fuel by super markets

8/2/2019 Ons Retail Report
http://slidepdf.com/reader/full/ons-retail-report 82/84
R1CHAINED VOLUME OF RETAIL SALESSEASONALLY ADJUSTED
continued
Predominantly non-food storesAll All
retailing retailing Te xtile,including excluding Non- clothing and Household Predominantly
automotive automotive Predominantly specialised footwear goods Other Non store automotivefuel1 fuel1 food stores Total stores stores stores stores retailing fuel1
AGG 21 AGG 21X AGG 1 AGG 12 47.19 AGG 5 AGG 7 AGG 13 AGG 14 47.30
Revisions to headline growth rates
Percentage chang e latest 3 months on previous 3 months
2009 Feb − − − 0.1 − 0.1 0.1 − 0.1 −
Mar − 0.1 − 0.2 − 0.1 0.1 0.2 − −
Apr 0.1 0.1 − 0.1 − − 0.1 0.2 0.1 0.2May − − − − − −0.1 − 0.1 −0.1 0.1Jun − −0.1 −0.1 − − −0.1 − − − 0.1
Jul − −0.1 −0.1 −0.1 − − − − −0.1 −
Aug − − − − − − − − −0.1 −
Sep − − − − −0.1 −0.1 −0.1 − − −0.1Oct − −0.1 − − − −0.1 −0.1 −0.1 −0.1 −0.1Nov −0.1 − − −0.1 − − −0.2 −0.2 − −0.1Dec − −0.1 − −0.1 − − −0.1 −0.2 −0.1 −0.1
2010 Jan − − − − 0.1 − − −0.2 − −0.1Feb 0.1 0.2
−0.1
−0.2 0.2 0.1 0.1
−
Mar 0.1 0.1 0.1 0.2 − 0.2 0.2 0.3 0.2 0.1Apr 0.1 0.1 0.1 0.2 −0.2 0.2 0.2 0.4 0.2 0.3May − −0.1 − − − −0.2 − 0.1 − 0.2Jun − −0.1 −0.1 −0.1 −0.1 −0.2 −0.1 − −0.1 0.1
Jul −0.1 −0.1 −0.1 −0.1 − −0.2 −0.1 −0.1 −0.1 −0.1Aug − −0.1 − − −0.1 − −0.1 − −0.1 −0.1Sep −0.1 − − − − − −0.1 −0.1 −0.1 −0.1Oct − − − −0.1 − − −0.2 −0.1 −0.1 −0.1Nov −0.1 − − −0.2 − −0.1 −0.1 −0.2 −0.1 −0.1Dec −0.1 − − −0.2 − − −0.1 −0.4 −0.1 −0.1
2011 Jan − − − − 0.2 −0.1 − −0.3 0.1 −0.1Feb 0.1 0.1 0.1 0.2 − 0.2 0.2 0.1 0.1 −
Mar 0.2 0.2 0.2 0.3 − 0.2 0.3 0.5 0.3 −
Apr 0.2 0.2 0.1 0.3 −0.2 0.3 0.2 0.6 0.1 0.2May − −0.1 − −0.1 −0.1 −0.2 − 0.1 −0.3 0.2Jun −0.1 −0.1 −0.1 −0.2 −0.1 −0.2 −0.2 −0.2 −0.3 0.1
Jul −0.1 −0.1 −0.2 −0.1 − −0.2 −0.1 −0.2 −0.2 −
Aug−0.1
−0.1
− −0.1
− −0.1
− − − −Sep − − − −0.1 − −0.2 −0.1 −0.1 −0.1 −
Oct −0.1 −0.1 −0.1 −0.1 − −0.2 −0.1 −0.1 −0.1 −
Nov −0.1 −0.1 −0.1 −0.1 −0.1 −0.2 −0.1 −0.3 −0.1 −
Dec − −0.1 −0.1 −0.2 −0.1 0.1 −0.2 −0.4 −0.1 0.2
2012 Jan −0.3 −0.3 −0.2 −0.4 −0.2 0.1 −0.5 −1.0 −0.5 0.3
Percentage chang e latest 3 months on same 3 months a year ago
2009 Feb − − 0.1 − − 0.1 0.1 − 0.1 −
Mar − − 0.1 0.1 − 0.1 − − − −
Apr 0.1 − − − − − − 0.1 − 0.1May − − − − − − − 0.1 − −
Jun − − − − − −0.1 − − 0.1 −
Jul − − − − −0.1 − − − − −
Aug − − − − − − − − − −
Sep −0.1 − − − −0.1 − − − − −
Oct −0.1 − − − − − −0.1 − −0.1 −
Nov − − −0.1 − − − −0.1 − − −0.1Dec
− − − −0.1
−0.1
− − − −0.1
−0.1
2010 Jan − − − −0.1 0.1 − −0.1 −0.1 − −
Feb − 0.1 0.1 0.1 − 0.1 − − − −
Mar − − − − 0.1 0.1 0.1 − 0.1 −
Apr − 0.1 − 0.1 − 0.1 − 0.1 0.1 −
May − − − − − − − − 0.1 −
Jun − − − − − − − − 0.1 −
Jul − − − − −0.1 − − − − −
Aug − − − − −0.1 − − − − −
Sep − − − − − − − − − −
Oct − − − − − − − − −0.1 −
Nov − − − − − − − − −0.1 −
Dec − −0.1 − − − − −0.1 −0.1 −0.1 −
2011 Jan − −0.1 − −0.1 0.1 − − −0.1 −0.1 −
Feb − 0.1 − − − 0.1 0.1 −0.1 − −
Mar − − 0.1 − − − 0.1 0.1 −0.1 −
Apr − 0.1 − 0.1 − 0.1 0.1 0.1 −0.2 −
May − − 0.1 −0.1 − − − − −0.3 −
Jun− −
0.1−0.1
− − − −0.1
−0.2
−
Jul − −0.1 0.1 −0.1 − −0.1 −0.1 −0.1 −0.2 −
Aug − −0.1 − − − −0.1 − −0.1 −0.1 −
Sep −0.1 − 0.1 − − −0.2 − −0.1 −0.2 −
Oct −0.1 − − − − −0.2 − −0.1 −0.1 −
Nov − −0.1 − −0.1 −0.2 −0.2 − −0.1 −0.2 0.1Dec − −0.1 − −0.1 −0.1 − −0.1 −0.1 −0.1 0.3
2012 Jan −0.2 −0.3 −0.1 −0.4 −0.4 − −0.5 −0.8 −0.7 0.5
1 Predominantly automotive fuel also includes sale of fuel by super markets

8/2/2019 Ons Retail Report
http://slidepdf.com/reader/full/ons-retail-report 83/84
ID1IMPLIED PRICE DEFLATORYear on year percentage change
Predominantly non-food storesAll All
retailing retailing Te xtile,including excluding Non- clothing Household Predominantly
automotive automotive Predominantly specialised and goods Other Non store automotivefuel1 fuel1 food stores Total stores footwear stores stores retailing fuel1
stores
AGG 21 AGG 21X AGG 1 AGG 12 47.19 AGG 5 AGG 7 AGG 13 AGG 14 47.30
J5HW J3VA A4VJ A4VK A4VL A4VM A4VN A4VO J5HU J3UX2006 Mar −0.5 −1.4 0.3 −2.6 −2.3 −3.5 −3.6 −1.2 −2.4 8.7
Apr −0.4 −1.2 0.7 −2.6 −2.2 −3.2 −3.9 −1.2 −2.5 8.4May 0.4 −0.8 1.1 −2.2 −1.9 −2.5 −4.2 −0.5 −2.0 12.2Jun 0.7 −0.4 1.7 −2.1 −1.7 −2.6 −3.6 −0.6 −1.6 11.4
Jul 0.6 −0.4 2.4 −2.6 −2.2 −3.0 −4.4 −0.8 −2.1 9.8Aug 0.9 0.1 2.7 −1.9 −1.5 −2.5 −3.0 −0.7 −1.4 7.2Sep 0.3 0.6 3.1 −1.3 −0.8 −2.2 −1.7 −0.2 −1.1 −3.0Oct −0.1 0.5 3.5 −1.7 −1.3 −2.0 −3.0 −0.7 −1.5 −6.5Nov 0.4 0.7 3.6 −1.4 −1.1 −1.9 −2.3 −0.3 −1.3 −3.9Dec 1.0 0.8 3.3 −1.1 −0.9 −2.6 −1.4 0.4 −1.1 1.1
2007 Jan 0.1 0.3 2.9 −1.7 −1.3 −2.6 −2.1 −0.9 −1.5 −1.6Feb 0.2 0.5 3.3 −1.7 −1.2 −2.6 −1.8 −1.0 −1.7 −2.8Mar 1.1 1.3 4.3 −1.0 −0.1 −2.2 −0.5 −0.7 −0.9 −0.4
Apr 1.4 1.6 4.5−0.7
−0.1
−1.3
−0.9
−0.2
−0.5
−0.6
May 0.9 1.1 3.8 −1.0 −0.4 −2.0 −0.5 −0.7 −1.0 −0.7Jun 1.0 1.0 3.5 −0.9 −0.4 −1.8 0.1 −1.1 −1.3 1.1
Jul −0.1 0.1 2.4 −1.6 −1.1 −1.6 −2.2 −1.4 −1.9 −0.9Aug −0.3 −0.1 2.2 −1.9 −1.6 −2.3 −2.2 −1.5 −2.2 −1.9Sep 0.2 −0.1 2.7 −2.2 −1.8 −2.6 −2.7 −1.7 −2.0 3.3Oct 1.4 0.4 3.3 −1.8 −1.2 −2.7 −2.1 −1.3 −1.5 11.3Nov 1.8 0.4 3.5 −1.8 −1.1 −2.7 −2.2 −1.3 −1.5 15.9Dec 1.7 0.4 3.9 −2.0 −1.2 −2.2 −3.5 −1.2 −1.7 15.4
2008 Jan 2.5 0.7 4.2 −1.9 −1.3 −2.9 −3.0 −0.3 −1.6 18.0Feb 2.5 0.7 4.0 −1.8 −1.6 −2.8 −2.5 −0.5 −1.3 19.0Mar 2.2 0.3 3.7 −2.2 −2.2 −3.2 −3.5 −0.3 −1.7 19.0Apr 2.7 0.9 4.7 −2.0 −1.9 −3.8 −2.4 −0.3 −1.5 17.6May 3.3 1.6 5.9 −1.7 −1.6 −3.6 −2.1 0.5 −0.8 18.6Jun 4.3 2.2 6.9 −1.5 −1.4 −4.5 −1.5 1.1 −0.9 22.5
Jul 5.5 3.3 8.6 −0.8 −0.8 −3.6 −0.6 1.5 −0.6 24.3Aug 5.1 3.5 9.3 −1.0 −0.6 −3.5 −1.0 1.1 −0.7 19.6Sep 4.8 3.2 8.2 −0.8 −0.7 −3.2 −0.6 1.1 −0.8 18.6
Oct 3.3 2.6 7.3−1.2
−1.1
−3.8
−0.2 0.5
−1.3 9.2Nov 1.9 2.3 7.3 −1.6 −1.3 −4.2 −1.0 0.4 −1.5 −2.6
Dec −0.5 0.2 6.9 −4.4 −3.7 −7.3 −4.2 −2.3 −4.0 −9.7
2009 Jan −0.3 1.4 7.1 −3.3 −2.6 −7.1 −1.7 −1.5 −3.4 −13.5Feb 0.8 2.4 8.2 −2.6 −1.4 −6.4 −1.2 −0.6 −2.8 −11.0Mar 0.4 2.2 7.7 −2.4 −1.4 −6.1 −0.8 −0.7 −2.5 −12.4Apr −0.1 1.4 6.0 −2.4 −1.5 −6.1 −0.3 −1.0 −2.6 −11.2May −0.3 1.3 5.6 −2.4 −1.4 −5.9 −0.1 −1.3 −2.7 −12.5Jun −1.4 0.3 4.1 −2.8 −1.3 −6.3 −0.9 −1.5 −2.7 −13.3
Jul −1.8 − 3.4 −2.9 −1.2 −6.6 −0.4 −2.2 −2.2 −13.7Aug −1.3 −0.2 2.2 −2.2 −1.1 −6.6 0.5 −0.8 −1.8 −9.0Sep −1.1 −0.3 1.8 −1.9 −0.8 −5.6 − −0.6 −1.7 −5.9Oct −0.1 0.1 2.4 −1.7 −0.4 −5.4 −0.2 − −1.5 −0.8Nov 1.0 0.1 1.7 −1.3 −0.3 −4.9 0.7 − −1.4 10.0Dec 3.4 2.0 2.1 1.4 1.8 −2.4 4.2 2.8 0.7 17.0
2010 Jan 3.8 1.7 2.6 0.7 1.4 −3.2 3.3 2.7 0.8 23.3Feb 2.8 0.8 1.4 0.5 0.5 −2.4 2.4 2.0 −0.1 20.5Mar 3.5 1.3 2.1 0.7 0.6 −1.8 2.3 1.9 0.4 22.8
Apr 3.9 1.8 2.8 1.1 0.7−
2.1 1.9 0.8 23.3May 3.3 1.4 1.9 0.9 0.5 −0.2 1.5 2.0 0.7 21.0Jun 2.6 1.2 2.0 0.5 − −0.8 0.9 1.8 0.3 14.8
Jul 2.5 1.2 2.8 0.1 −0.2 −2.1 1.3 1.9 −0.2 13.5Aug 2.4 1.4 3.3 0.1 −0.2 −0.9 0.9 0.7 −0.4 11.4Sep 2.9 2.3 4.2 0.8 0.3 1.5 0.7 0.7 0.3 8.3Oct 3.0 2.1 4.0 0.7 0.1 1.3 0.4 0.7 0.4 10.8Nov 3.1 2.5 4.8 0.8 0.2 2.5 0.4 0.1 0.7 9.8Dec 3.1 2.4 5.1 0.6 0.5 2.1 −1.1 0.3 0.7 12.4
2011 Jan 3.8 2.6 5.3 0.8 0.6 1.9 0.2 −0.2 0.5 14.5Feb 4.7 3.4 5.4 1.6 1.0 3.3 1.7 0.5 1.7 15.1Mar 4.1 2.7 4.2 1.5 0.5 2.7 1.7 0.9 0.7 15.0Apr 4.1 3.1 4.7 1.7 0.6 1.8 2.6 1.6 1.0 12.3May 4.4 3.2 5.5 1.5 0.7 1.9 1.9 1.4 0.7 13.2Jun 4.4 3.1 6.0 0.8 −0.3 2.2 0.7 0.5 −0.1 14.5
Jul 4.9 3.7 5.9 1.9 0.8 3.6 1.5 1.5 0.6 14.5Aug 5.2 3.8 5.9 2.1 0.9 4.3 0.7 2.0 0.5 16.3Sep 4.9 3.4 6.0 1.2 0.3 2.6 −0.2 1.4 0.2 17.0Oct 4.5 3.2 5.0 1.8 0.8 3.8 1.2 1.0 1.3 14.8Nov 3.6 2.5 4.6 1.2 0.3 3.0 0.1 0.8 0.1 12.6Dec 2.5 1.8 4.2 0.3 −0.6 2.0 −1.1 0.3 −0.7 9.1
2012 Jan 2.2 1.8 3.5 0.6 −0.3 2.9 −0.9 0.1 −0.3 5.3Feb 2.4 1.9 3.9 0.2 −0.8 2.3 −0.8 −0.5 −0.7 5.3
1 Predominantly automotive fuel also includes sale of fuel by super markets.

8/2/2019 Ons Retail Report
http://slidepdf.com/reader/full/ons-retail-report 84/84
ID2IMPLIED PRICE DEFLATORMonth on month percentage change
Predominantly non-food storesAll All
retailing retailing Te xtile,including excluding Non- clothing Household Predominantly
automotive automotive Predominantly specialised and goods Other Non store automotivefuel1 fuel1 food stores Total stores footwear stores stores retailing fuel1
stores
AGG 21 AGG 21X AGG 1 AGG 12 47.19 AGG 5 AGG 7 AGG 13 AGG 14 47.30
J5HV J3TU A4RT A4RU A4RV A4RW A4RX A4RY J5HT J3TJ2006 Mar 0.1 0.1 −0.3 0.4 0.3 0.6 1.2 −0.2 − −0.1
Apr − −0.4 0.1 −0.7 −0.6 −0.2 −1.7 −0.3 −0.7 3.6May 0.9 0.6 0.9 0.4 0.3 0.8 0.1 0.3 0.5 3.0Jun 0.3 0.4 0.6 0.2 0.2 −0.2 0.6 0.2 0.5 −0.7
Jul −0.8 −1.1 −0.1 −2.0 −1.7 −3.7 −1.4 −0.9 −1.7 1.6Aug 0.7 0.8 0.4 1.0 1.0 1.9 0.5 0.5 1.0 0.5Sep 0.2 0.9 0.4 1.2 1.0 1.7 1.4 0.6 0.8 −5.6Oct −0.8 −0.3 0.3 −0.7 −0.7 0.1 −1.9 −0.3 −0.8 −4.8Nov 0.3 0.3 0.4 0.4 0.3 0.7 0.6 − 0.3 −0.5Dec 0.3 0.2 0.1 0.4 0.7 −0.8 1.1 0.6 0.5 2.1
2007 Jan −1.7 −1.7 −0.5 −2.9 −2.6 −3.7 −2.8 −2.4 −2.8 −1.0Feb 0.6 0.8 0.9 0.6 0.7 0.2 0.6 1.0 0.8 −0.7Mar 1.0 0.9 0.6 1.2 1.4 1.0 2.5 0.2 0.8 2.3
Apr 0.3−0.1 0.3
−0.4
−0.5 0.8
−2.1 0.2
−0.3 3.4
May 0.4 0.1 0.2 0.1 −0.1 0.1 0.5 −0.2 −0.1 2.9Jun 0.4 0.3 0.4 0.3 0.2 0.1 1.2 −0.3 0.1 1.1
Jul −1.9 −2.0 −1.2 −2.7 −2.4 −3.6 −3.7 −1.2 −2.2 −0.3Aug 0.5 0.6 0.3 0.7 0.5 1.3 0.5 0.4 0.7 −0.5Sep 0.7 0.9 0.9 0.9 0.9 1.4 0.9 0.4 1.0 −0.6Oct 0.4 0.1 0.8 −0.3 −0.1 0.1 −1.2 0.1 −0.3 2.6Nov 0.7 0.4 0.6 0.4 0.4 0.7 0.5 − 0.3 3.6Dec 0.1 0.2 0.5 0.2 0.6 −0.4 −0.3 0.6 0.3 1.8
2008 Jan −0.9 −1.4 −0.2 −2.7 −2.7 −4.3 −2.3 −1.5 −2.7 1.2Feb 0.7 0.8 0.7 0.7 0.4 0.3 1.2 0.7 1.1 0.2Mar 0.7 0.5 0.3 0.8 0.8 0.6 1.5 0.5 0.4 2.3Apr 0.7 0.5 1.3 −0.2 −0.3 0.1 −0.9 0.1 −0.1 2.2May 1.0 0.8 1.3 0.4 0.2 0.3 0.7 0.6 0.6 3.8Jun 1.4 0.9 1.3 0.4 0.4 −0.8 1.9 0.3 − 4.5
Jul −0.7 −1.0 0.4 −2.0 −1.8 −2.7 −2.9 −0.7 −1.9 1.0Aug 0.1 0.8 0.9 0.5 0.7 1.3 0.1 − 0.6 −4.3Sep 0.5 0.6 −0.1 1.1 0.8 1.8 1.3 0.3 0.9 −1.3
Oct−1.1
−0.4
− −0.6
−0.5
−0.6
−0.9
−0.4
−0.8
−5.6Nov −0.7 0.1 0.6 − 0.2 0.2 −0.3 −0.2 0.1 −7.6
Dec −2.2 −1.9 0.1 −2.7 −1.9 −3.5 −3.5 −2.0 −2.2 −5.7
2009 Jan −0.7 −0.2 − −1.6 −1.6 −4.1 0.2 −0.7 −2.1 −3.0Feb 1.9 1.8 1.7 1.5 1.5 1.1 1.7 1.6 1.8 3.0Mar 0.3 0.3 −0.2 0.9 0.8 0.9 1.8 0.3 0.6 0.7Apr 0.2 −0.3 −0.3 −0.2 −0.4 0.1 −0.4 −0.2 −0.1 3.6May 0.8 0.7 0.8 0.5 0.4 0.4 0.9 0.3 0.5 2.2Jun 0.3 − −0.1 −0.1 0.5 −1.2 1.0 0.2 0.1 3.5
Jul −1.1 −1.4 −0.3 −2.1 −1.7 −2.9 −2.3 −1.4 −1.4 0.6Aug 0.6 0.6 −0.2 1.2 0.8 1.2 1.0 1.4 1.0 1.0Sep 0.6 0.4 −0.5 1.3 1.1 2.9 0.8 0.6 0.9 2.0Oct − − 0.7 −0.3 −0.2 −0.4 −1.1 0.2 −0.6 −0.5Nov 0.4 0.1 − 0.4 0.4 0.7 0.5 −0.2 0.2 2.5Dec − − 0.5 −0.2 0.1 −1.0 −0.1 0.7 −0.1 0.3
2010 Jan −0.3 −0.5 0.5 −2.2 −2.0 −4.9 −0.6 −0.8 −2.1 2.3Feb 0.9 0.9 0.6 1.3 0.7 1.9 0.8 1.0 1.0 0.7Mar 0.9 0.8 0.5 1.0 0.9 1.6 1.7 0.2 1.1 2.5
Apr 0.7 0.2 0.4 0.3−
0.3 1.9−
0.5−
0.1 0.3 4.1May 0.2 0.2 − 0.3 0.2 0.3 0.3 0.3 0.3 0.3Jun −0.4 −0.2 − −0.5 − −1.8 0.3 − −0.3 −1.8
Jul −1.2 −1.3 0.5 −2.5 −1.9 −4.3 −1.9 −1.3 −1.9 −0.6A 0 6 0 8 0 2 1 2 0 7 2 5 0 6 0 2 0 7 0 9