39 accounting for defect characteristics in evaluations...
TRANSCRIPT

39
Accounting for Defect Characteristics in Evaluations of Te stingTechniques
JAYMIE STRECKER, College of Wooster
ATIF M. MEMON, University of Maryland, College Park
As new software-testing techniques are developed, and before they can achieve widespread acceptance, theireffectiveness at detecting defects must be evaluated. The most common way to evaluate testing techniquesis with empirical studies, in which one or more techniques are tried out on software with known defects.However, the defects used can affect the performance of the techniques. To complicate matters, it is not evenclear how to effectively describe or characterize defects. To address these problems, this work describes anexperiment architecture for empirically evaluating testing techniques, which takes both defect and test-suitecharacteristics into account. As proof of concept, an experiment on GUI-testing techniques is conducted. Itprovides evidence that the defect characteristics proposed do help explain defect detection, at least for GUItesting, and it explores the relationship between the coverage of defective code and the detection of defects.
Categories and Subject Descriptors: D.2.7 [Software Engineering]: Testing and Debugging—testing tools;D.2.8 [Software Engineering]: Metrics—product metrics
General Terms: Experimentation, Measurement
Additional Key Words and Phrases: Defects, faults, GUI testing
ACM Reference Format:
Strecker, J. and Memon, A. M., 2011. Accounting for Defect Characteristics in Evaluations of Testing Tech-niques ACM Trans. Embedd. Comput. Syst. 9, 4, Article 39 (March 2010), 44 pages.DOI = 10.1145/0000000.0000000 http://doi.acm.org/10.1145/0000000.0000000
1. INTRODUCTION
Software-testing techniques need to be good at detecting defects in software. Re-searchers evaluate testing techniques to determine if they are good—relative to othertechniques, within some domain of software and defects, by some measurable defini-tion of “good” that considers the resources used and the defects detected.
Anyone who has dealt with software defects knows that some defects are more sus-ceptible to detection than others. Yet, for decades, evaluations of testing techniqueshave not been able to take this into account very well. This work offers a remedy: anexperiment architecture for empirical evaluations that accounts for the impact thatdefect characteristics have on evaluation results.
As motivation, consider the well-known experiment on data-flow- and control-flow-based testing techniques by Hutchins et al. [1994]. The experiment compared test
This article is a revised and extended version of a paper entitled “Relationships between Test Suites, Faults,and Fault Detection in GUI Testing,” presented at the 2008 International Conference on Software Testing,Verification, and Validation (ICST 2008) in Lillehammer, Norway.This work was partially supported by the US National Science Foundation under grants CCF-0447864 andCNS-0855055, and the Office of Naval Research grant N00014-05-1-0421.Author’s addresses: J. Strecker, Computer Science Department, College of Wooster, Wooster, Ohio; A. M.Memon, Computer Science Department, University of Maryland, College Park, Maryland.Permission to make digital or hard copies of part or all of this work for personal or classroom use is grantedwithout fee provided that copies are not made or distributed for profit or commercial advantage and thatcopies show this notice on the first page or initial screen of a display along with the full citation. Copyrightsfor components of this work owned by others than ACM must be honored. Abstracting with credit is per-mitted. To copy otherwise, to republish, to post on servers, to redistribute to lists, or to use any componentof this work in other works requires prior specific permission and/or a fee. Permissions may be requestedfrom Publications Dept., ACM, Inc., 2 Penn Plaza, Suite 701, New York, NY 10121-0701 USA, fax +1 (212)869-0481, or [email protected]© 2010 ACM 1539-9087/2010/03-ART39 $10.00
DOI 10.1145/0000000.0000000 http://doi.acm.org/10.1145/0000000.0000000
ACM Transactions on Embedded Computing Systems, Vol. 9, No. 4, Article 39, Publication date: March 2010.

39:2 J. Strecker and A. M. Memon
suites covering all def-use pairs, suites satisfying predicate (“edge”) coverage, and ran-dom suites. Test suites were created and run for seven C programs with a total of 130hand-seeded faults—mistakes in the source code. In order to compare the techniques,each fault was classified according to which kinds of test suites (i.e., techniques) weremost likely to detect it. It turned out that very few faults were equally likely to bedetected by all techniques; instead, most faults clearly lent themselves to detection byjust one or two of the techniques. This is a tantalizing conclusion, one that could poten-tially help testers to choose a testing technique based on the kinds of faults they hopeor expect to detect. Unfortunately, the authors “were not able to discern any charac-teristics of the faults, either syntactic or semantic, that seem to correlate with higherdetection by either method.”
At least one other empirical study, by Basili and Selby [1987], has shown that certaindefects can be “harder” to detect with one testing technique and “easier” with another.Based on one’s experience testing software, one might also suspect that some faultsare “harder” or “easier” than others in a more general sense. Offutt and Hayes [1996]formalized this notion, and they and others have observed it empirically [Andrewset al. 2006; Hutchins et al. 1994; Rothermel et al. 2004].
Thus, the defects against which testing techniques are evaluated can make the tech-niques look better or worse—both absolutely, in defect-detection rates, and relativeto other techniques. Without understanding defects, it is difficult to integrate resultsfrom different experiments [Basili et al. 1999], and it is usually impossible to explainwhy one technique outperforms another.
To understand fully how evaluations of testing techniques may depend on the defectsused, one must be familiar with the typical procedure for such evaluations. Althoughsome analytical approaches have been proposed [Frankl and Weyuker 1993], by farthe most common and practical way to evaluate testing techniques continues to beempirical studies. Typically, these studies investigate hypotheses like “Technique Adetects more defects than technique B” or “A detects more than zero defects moreoften than B” [Juristo et al. 2004].
Empirical studies, by their very nature as sample-based evaluations, always face therisk that different samples might lead to different results. An empirical study mustselect a sample of software to test, a sample of the test suites that can be generated (orrecognized) by each technique for the software, and a sample of the defects— typicallyfaults—that may arise in the software. Because different studies usually use differentsamples, one study might report that technique A detects more faults than B, whileanother would report just the opposite. Increasingly, published empirical studies ofsoftware testing are acknowledging this as a threat to external validity [Andrews et al.2006; Graves et al. 2001; Rothermel et al. 2004].
This threat to external validity can be mitigated by replicating the study with dif-ferent samples of test suites and fault-ridden software. But, while replicated studiesare necessary for scientific progress [Basili et al. 1999; Zelkowitz and Wallace 1997],they are not sufficient. It is not enough to observe differing results in replicated stud-ies; it is necessary to explain and predict them, for several reasons. First, explanationand prediction of phenomena are goals of any science, including the science of softwaretesting. Second, the ability to predict situations in which a software-testing techniquemight behave differently than in a studied situation would aid researchers by pointingto interesting situations to study in the future [Basili et al. 1999]. Third, it would aidpractitioners by alerting them if a testing technique may not behave as expected fortheir project.
If evaluators of testing techniques are to explain and predict the techniques’ perfor-mance outside the evaluation, then they must identify and account for all the charac-teristics of the studied samples of software, test suite, and faults that can significantly
ACM Transactions on Embedded Computing Systems, Vol. 9, No. 4, Article 39, Publication date: March 2010.

Accounting for Defect Characteristics in Evaluations of Testing Techniques 39:3
affect the evaluation’s results. Some previous work has identified and accounted forcharacteristics of the software (e.g., size) and the test suites (e.g., granularity) [Elbaumet al. 2001; Morgan et al. 1997; Rothermel et al. 2004; Xie and Memon 2006]. Charac-teristics of faults, however, have resisted scrutiny. Few characteristics of faults havebeen identified, even fewer have been practical and objective to measure, and none ofthose have been demonstrated to help explain testing techniques’ behavior [Streckerand Memon 2007]. In the words of Harrold et al. [1997], “Although there have beenstudies of fault categories. . . there is no established correlation between categories offaults and testing techniques that expose those faults.”
This work proposes a new set of fault characteristics and shows how they—or any setof fault characteristics—can be accounted for in empirical studies of testing techniques.The challenge here is that, for a given piece of software under test, fault characteris-tics and test-suite characteristics may both affect fault detection. To account for bothkinds of characteristics, this work presents an experiment architecture, or high-levelview of experiment design. The experiment architecture shows how a study’s inputs(test suites and faulty software) can be assembled and analyzed to discover how welldifferent kinds of test suites cover different parts of the software and detect differentkinds of faults.
Finally, this work presents an experiment that instantiates the architecture. Theexperiment provides a proof of concept for the architecture. Furthermore, it showsthat each of the fault characteristics proposed in this work helps explain differences infaults’ susceptibility to detection in at least one domain of testing (GUI testing).
In summary, the major contributions of this work are:
— to propose and empirically validate a simple, practical fault characterization forsoftware-testing studies and
— to present an experiment in the domain of GUI testing that:— demonstrates one way to account for test-suite and fault characteristics in evalu-
ations of testing techniques, building on preliminary work [Strecker and Memon2008];
— explores the relationship between execution of faulty code and detection of faults.
The next section provides necessary background information and surveys relatedwork. Section 3 describes the experiment architecture (Figure 3). Then, Section 4 givesthe fault characterization (Table I) and specifics of the experiment procedure. Exper-iment results are presented in Section 5 and discussed in Section 6. Sections 7 and 8offer conclusions and future work.
2. BACKGROUND AND RELATED WORK
This work presents a new way of conducting software-testing studies—which takesinto account characteristics of the faults and test suites used in the study—and, asproof of concept, a study in the domain of GUI testing. This section provides necessarybackground information on GUI testing and on characteristics of faults, test suites, and(for completeness) other influences on test effectiveness. It goes on to describe modelsof failure propagation that inspired this work’s treatment of faulty-code coverage andfault detection.
2.1. GUI testing
Experiments in software testing have often focused on a particular domain of soft-ware (e.g., UNIX utilities) and of testing (e.g., JUnit test cases). This work focuses onGUI-intensive applications and model-based GUI testing [Memon 2007; Strecker andMemon 2009], a form of system testing. GUI-intensive applications make up a largeportion of today’s software, so it is important to include them as subjects of empiri-
ACM Transactions on Embedded Computing Systems, Vol. 9, No. 4, Article 39, Publication date: March 2010.

39:4 J. Strecker and A. M. Memon
w4
w5
w8
w6
w7
w2
w1
w0
w3
Main Window Exit Confirmation Dialog
circle
square
create
exit
yes
no
reset
(un)check
(a) (b)
Fig. 1. (a) A Simple GUI and (b) its Event-Flow Graph
cal studies. Conveniently, model-based GUI testing lends itself to experimentation be-cause test cases can be generated and executed automatically, enabling experimentersto create large samples of test cases.
The basic unit of interaction with a GUI is an event. Some examples of events inthe GUI of Figure 1(a) are clicking on widget w3, i.e., the Create button and check-ing/unchecking the check-box labeled w6. In this GUI, each widget has exactly oneevent associated with it. The complete list of (widget, event) pairs is: { (w0, Exit), (w1,Circle), (w2, Square), (w3, Create), (w5, Reset), (w6, (un)check), (w7, Yes), (w8, No) }; thereis no event associated with w4. Another common example of an event, not seen in thissimple GUI, is entering a text string in a text-box. As this example suggests, someevents are parameterized—e.g., text entry in a text box is parameterized by the textstring entered. In actual GUI testing, only a finite set of parameter values can be testedfor each event. This work uses just one parameter value for each event, thus eliminat-ing, in effect, the distinction between unparameterized and parameterized events.
The portion of the application code that executes in response to a GUI event is calledthe event handler. The event handlers for our running example are shown in Figure 2.The code in the left column shows six event handlers; the right column shows themain() method, initialization code that executes only when the application starts, anda draw() method called by several event handlers. When the application starts, themain() method creates a new RadioButtonDemo object, which creates all the widgets,adds them to the main window frame, and associates ActionListeners with each wid-get. The application then waits for user events.
The dynamic behavior of a GUI can be modeled by an event-flow graph (EFG), inwhich each node represents a GUI event. A directed edge to node n2 from node n1
means that the corresponding event e2 can be executed immediately after event e1.Henceforth, in this paper, the term event will be used to mean both an actual eventand a node representing an event. The EFG for the GUI of Figure 1(a) is shown inFigure 1(b). In this EFG, there is an edge from circle to circle because a user canexecute circle in succession; however, there is no edge from circle to yes. The EFGhas a set of initial events, shaded in Figure 1(b), which can be executed in the GUI’sinitial state. We show exit, a window-opening event, using a diamond; yes and no, bothwindow-termination events, using the double-circle shape; and the remaining system-interaction events using ovals.
ACM Transactions on Embedded Computing Systems, Vol. 9, No. 4, Article 39, Publication date: March 2010.

Accounting for Defect Characteristics in Evaluations of Testing Techniques 39:5
�0 // Widget w0 ’s event handler
1 class W0Listenerimplements ActionListener {2 public void actionPerformed(ActionEvent e) {3 String message = ”Are you sure you want to exit?” ;4 Object [] params = { message, w6 };5 exit = JOptionPane.showConfirmDialog(null, params,6 ”Exit Confirmation” , JOptionPane.YESNOOPTION);7 if (exit == 0) {8 if (log) writeTimeStamp();9 System.exit(0);}}}
� ��9 // Widget w1 ’s event handler
10 class W1Listenerimplements ActionListener {11 public void actionPerformed(ActionEvent arg0) {12 currentShape = Shape.CIRCLE;13 if (created) draw(new CirclePanel ()) ; }}
� ��13 // Widget w2 ’s event handler
14 class W2Listenerimplements ActionListener {15 public void actionPerformed(ActionEvent arg0) {16 currentShape = Shape.SQUARE;17 if (created) draw(new SquarePanel());}}
� ��17 // Widget w3 ’s event handler
18 class W3Listenerimplements ActionListener {19 public void actionPerformed(ActionEvent e) {20 w5.setEnabled(true) ;21 created = true;22 JPanel shape;23 if (currentShape == Shape.CIRCLE)24 shape = new CirclePanel () ;25 else if (currentShape == Shape.SQUARE)26 shape = new SquarePanel() ;27 else shape = newEmptyPanel() ;28 draw(shape);}}
� ��28 // Widget w5 ’s event handler
29 class W5Listenerimplements ActionListener {30 public void actionPerformed(ActionEvent e) {31 w5.setEnabled(false) ;32 created = false;33 draw(new EmptyPanel());}}
� ��33 // Widget w6 ’s event handler
34 class W6Listenerimplements ActionListener {35 public void actionPerformed(ActionEvent e) {36 log = w6.isSelected();}}
� �
�36public static void main(String[] args) {37javax.swing.SwingUtilities.invokeLater(38new Runnable() {39public void run() {40RadioButtonDemo frame = newRadioButtonDemo();41frame.setVisible(true);}});}}
� ��41public class RadioButtonDemo extends JFrame{42JButton w0;43JRadioButtonw1;44JRadioButtonw2;45JButton w3;46JPanel w4;47JButton w5;48JCheckBox w6;49Boolean created = false;50Boolean log = false;51Shape currentShape = Shape.CIRCLE;52JPanel contentPane;5354public RadioButtonDemo() {55// Create the main window
56super(”Radio Button Demo”);57contentPane = new JPanel(new BorderLayout()) ;5859//Create all widgets and add listeners
60w1 = new JRadioButton(”Circle” ) ;61w1.setSelected(true) ;62w1.addActionListener(new W1Listener()) ;63// . . . . code omitted for other widgets . . . .
6465draw(new EmptyPanel()) ;6667w6 = new JCheckBox(”Log exit time. ” ) ;68w6.addActionListener(new W6Listener()) ;6970setContentPane(contentPane);71setDefaultCloseOperation(JFrame.EXITONCLOSE);}
� ��71private void draw(JPanel shape) {72if (w4 != null)73contentPane.remove(w4);74w4 = shape;75w4.setBorder(BorderFactory .createTitledBorder(76BorderFactory77.createLineBorder(Color.GRAY) , ”Rendered Shape” )) ;78contentPane.add(w4);79repaint() ;80pack() ;81}
� �
Fig. 2. Source Code Snippets of the Running Example.
A length-l test case consists of any path through l events in the EFG, starting at aninitial event. The depth of an event in the EFG is the length of the shortest test casecontaining the event, counting the event itself; initial events have a depth of 1. Eventcircle, square, exit, reset, and create have a depth of 1; (un)check, yes and no have adepth of 2. For usability reasons, most GUI applications are organized as a hierarchyof windows [Memon 2009]; these hierarchies are not very deep (most applications are5–10 windows deep); consequently the EFG depths are also small.
In model-based GUI testing, the oracle information used to determine whether a testcase passes or fails consists of a set of observed properties (e.g., title, background color)of all windows and widgets in the GUI. The oracle procedure compares these propertiesto their expected values after each event in the test case is executed. Such oracles arerelevant for many GUI-based applications, that we call GUI-intensive applications,which expose much of their state, via visual cues, during execution.
The main steps in GUI testing—including reverse-engineering an EFG from a GUI,generating and executing test cases, and applying the oracle—have been automated inthe GUI Testing Framework (GUITAR) [Xie and Memon 2006]. In summary, GUITARuses graph traversal algorithms to generate test cases from a GUI’s EFG. To date, ourexperiments have shown that test suites that contain test cases of a specific length that
ACM Transactions on Embedded Computing Systems, Vol. 9, No. 4, Article 39, Publication date: March 2010.

39:6 J. Strecker and A. M. Memon
cover all GUI events are most effective at detecting faults. Such test suites ensure thatall events in the GUI are executed, and that each event has been tested in a numberof contexts [Yuan et al. 2010]. We will use such test cases in the experiment proceduredescribed in Section 4.
2.2. Characterizing faults
How should faults in software-testing studies be characterized? This is an open ques-tion. One or more of three approaches to characterizing faults are usually taken:
(1) Characterize faults by their origin (natural, hand-seeded, or mutation). Often, allfaults in a study share a common origin, but some studies [Andrews et al. 2006; Doand Rothermel 2006] have compared results for faults of different origins.
(2) Describe each fault and report results individually for each one [Myers 1978]. Thisis only practical if few faults are used.
(3) Calculate the “difficulty” or “semantic size” of each fault relative to the test casesused in the study and compare results for “easier” and “harder” faults [Hutchinset al. 1994; Offutt and Hayes 1996; Rothermel et al. 2004].
The third approach comes closest to characterizing faults to help explain and predictresults from other studies and real situations. But the “difficulty” of a fault can onlybe calculated relative to a set of test cases. Two different sets of test cases—e.g., ahuge test pool in an empirical study and an early version of a test suite in practice,or test sets generated from two different operational profiles—would assign different“difficulty” values, and possibly different “difficulty” rankings, to a set of faults.
A fourth approach has occasionally been used:
(4) Characterize faults by some measure intrinsic to them, such as the type of pro-gramming error (omissive or commissive; initialization, control, data, computation,interface, or cosmetic) [Basili and Selby 1987] or the fault’s effect on the programdependence graph [Harrold et al. 1997].
Basili and Selby [1987] and Harrold et al. [1997] each compare the ability of dif-ferent testing techniques to detect faults, reporting the number of faults of each cate-gory detected by each technique. The fault characterization schema used by Basili andSelby [1987] proves to be relevant to the testing and inspecting techniques studied—certain techniques better detect certain kinds of faults—but the characterization islabor-intensive and not entirely objective. Conversely, the schema used by Harroldet al. [1997] is objective, allowing faults to be seeded automatically, but has not beenshown to help explain why some faults were more likely to be detected than others.(Unfortunately, this result could not be re-evaluated in this work because the neces-sary tools were not available for Java software.)
In summary, fault characterization remains an open problem, but, for software-testing studies, objective and quick-to-measure characteristics are best. When de-scribed by such characteristics, faults can be grouped into types or clusters that retaintheir meaning across studies and situations. Section 4.1 identifies several such charac-teristics, and the experiment of Section 4 evaluates their ability to explain why somefaults are more likely to be detected than others.
2.3. Characterizing test suites
Test-suite characteristics and their effects on fault detection have been studied muchmore intensively than fault characteristics. Probably the most studied characteristicof test suites is the technique used to generate or recognize them. In many studies, asample of test suites from a technique has been used to evaluate the technique em-pirically against other testing or validation techniques. Techniques that have been
ACM Transactions on Embedded Computing Systems, Vol. 9, No. 4, Article 39, Publication date: March 2010.
Accounting for Defect Characteristics in Evaluations of Testing Techniques 39:7
compared in this way include code reading, functional testing, and structural testing[Basili and Selby 1987]; data-flow- and control-flow-based techniques [Hutchins et al.1994]; regression test selection techniques [Graves et al. 2001]; and variations of mu-tation testing [Offutt et al. 1996].
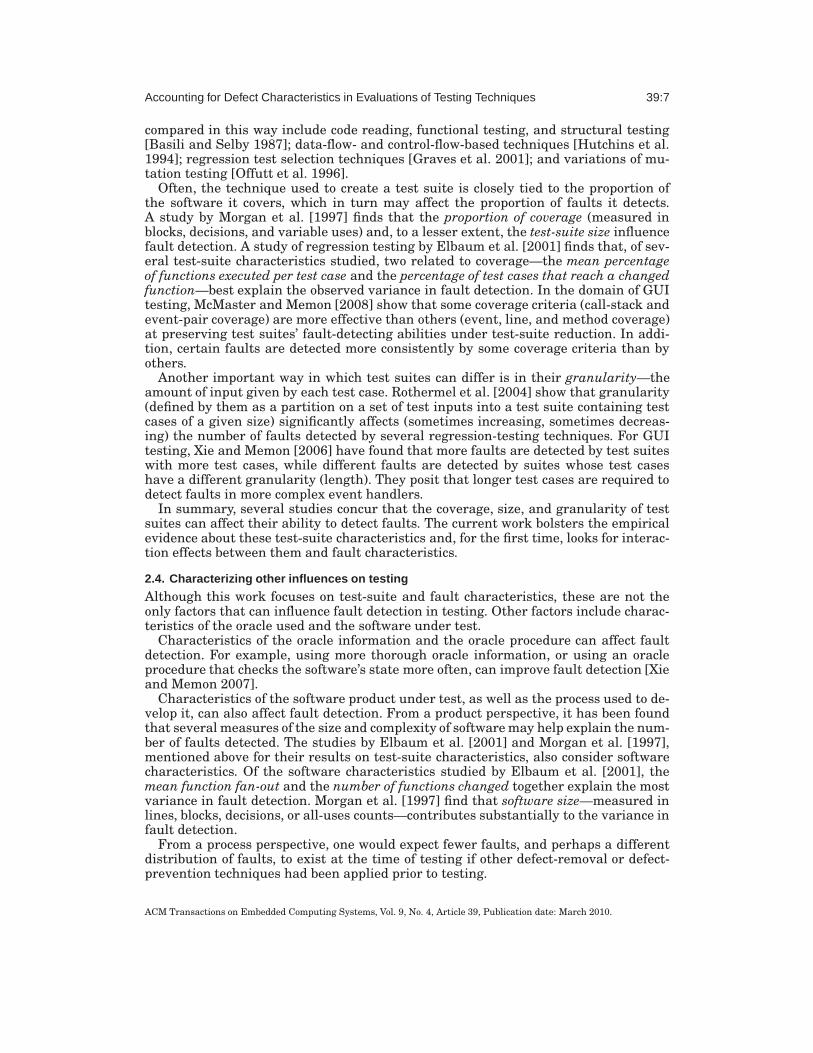
Often, the technique used to create a test suite is closely tied to the proportion ofthe software it covers, which in turn may affect the proportion of faults it detects.A study by Morgan et al. [1997] finds that the proportion of coverage (measured inblocks, decisions, and variable uses) and, to a lesser extent, the test-suite size influencefault detection. A study of regression testing by Elbaum et al. [2001] finds that, of sev-eral test-suite characteristics studied, two related to coverage—the mean percentageof functions executed per test case and the percentage of test cases that reach a changedfunction—best explain the observed variance in fault detection. In the domain of GUItesting, McMaster and Memon [2008] show that some coverage criteria (call-stack andevent-pair coverage) are more effective than others (event, line, and method coverage)at preserving test suites’ fault-detecting abilities under test-suite reduction. In addi-tion, certain faults are detected more consistently by some coverage criteria than byothers.
Another important way in which test suites can differ is in their granularity—theamount of input given by each test case. Rothermel et al. [2004] show that granularity(defined by them as a partition on a set of test inputs into a test suite containing testcases of a given size) significantly affects (sometimes increasing, sometimes decreas-ing) the number of faults detected by several regression-testing techniques. For GUItesting, Xie and Memon [2006] have found that more faults are detected by test suiteswith more test cases, while different faults are detected by suites whose test caseshave a different granularity (length). They posit that longer test cases are required todetect faults in more complex event handlers.
In summary, several studies concur that the coverage, size, and granularity of testsuites can affect their ability to detect faults. The current work bolsters the empiricalevidence about these test-suite characteristics and, for the first time, looks for interac-tion effects between them and fault characteristics.
2.4. Characterizing other influences on testing
Although this work focuses on test-suite and fault characteristics, these are not theonly factors that can influence fault detection in testing. Other factors include charac-teristics of the oracle used and the software under test.
Characteristics of the oracle information and the oracle procedure can affect faultdetection. For example, using more thorough oracle information, or using an oracleprocedure that checks the software’s state more often, can improve fault detection [Xieand Memon 2007].
Characteristics of the software product under test, as well as the process used to de-velop it, can also affect fault detection. From a product perspective, it has been foundthat several measures of the size and complexity of software may help explain the num-ber of faults detected. The studies by Elbaum et al. [2001] and Morgan et al. [1997],mentioned above for their results on test-suite characteristics, also consider softwarecharacteristics. Of the software characteristics studied by Elbaum et al. [2001], themean function fan-out and the number of functions changed together explain the mostvariance in fault detection. Morgan et al. [1997] find that software size—measured inlines, blocks, decisions, or all-uses counts—contributes substantially to the variance infault detection.
From a process perspective, one would expect fewer faults, and perhaps a differentdistribution of faults, to exist at the time of testing if other defect-removal or defect-prevention techniques had been applied prior to testing.
ACM Transactions on Embedded Computing Systems, Vol. 9, No. 4, Article 39, Publication date: March 2010.

39:8 J. Strecker and A. M. Memon
2.5. Models of failure propagation
Part of this work is concerned with understanding the conditional probability thata test suite detects a fault, given that the test suite covers the code containing thefault. As Section 4 explains, this conditional probability separates the concerns of faultdetection and fault coverage. It shows how susceptible a fault is to detection, regardlessof whether the code it lies in is frequently or rarely executed.
The relationship between fault detection and coverage has previously been viewedfrom the perspective of the RELAY model and PIE analysis. The RELAY modelof Richardson and Thompson [1993] traces the steps by which a fault in source codeleads to a failure in execution: from the incorrect evaluation of an expression to un-expected internal states to unexpected output. RELAY is the basis for propagation,infection, and execution (PIE) analysis of program testability proposed by Voas [1992].PIE uses the probability that a given program element is executed and the probabilitythat a fault in that element is detected.
Like RELAY, the current work is concerned with the relationship between faults andfailures. This work, however, ignores internal program state. In contrast to this work’sempirical approach, Richardson and Thompson use RELAY to compare test adequacycriteria analytically.
PIE differs from the current work because it estimates execution probabilities withrespect to some fixed input distribution and infection probabilities with respect to somefixed distribution of faults. In contrast, the current work studies how variations in theinput distribution (test suite) and the type of fault affect the test suite’s likelihood ofexecuting and detecting the fault.
3. EXPERIMENT ARCHITECTURE
We now provide a way to design empirical studies of software testing, particularly eval-uations of testing techniques. Because it is more general than an experiment design,we call it an experiment architecture. (An experiment architecture is to an experimentdesign as a software architecture is to a software design; it is a high-level approachthat can be instantiated to plan a specific experiment.) Our architecture enables ex-perimenters to compare the effectiveness of different testing techniques and, at thesame time, to measure the influence of other factors on the results.
In a given software product with a given oracle, two kinds of factors can influencea testing technique’s ability to detect a fault: characteristics of the test suite used(other than testing technique) and characteristics of the fault. Thus, the architecturecannot account for just fault characteristics, even though they are the focus of thiswork. It must simultaneously account for both test-suite and fault characteristics. Inother words, it must be able to show that certain kinds of test suites generally detectmore faults, and certain kinds of faults are generally more susceptible to detection,and certain kinds of test suites are better at detecting certain kinds of faults.
The key observation leading to the architecture is that fault characteristics andtest-suite characteristics, including the testing technique, can be accounted for simul-taneously with the right kind of multivariate statistical analysis. The experiment inthis work uses logistic-regression analysis (a decision that is justified in Section 4.3).Hence, the architecture must satisfy the requirements of logistic regression.
As Section 4.3 will explain, the input to logistic regression is a data set in which eachdata point consists of a vector of some independent variables and a binomial dependentvariable. The output is a vector of coefficients, which estimate the strength of eachindependent variable’s effect on the dependent variable. If each data point consists ofa vector of characteristics of a 〈test suite, fault〉 pair and a value indicating whether thetest suite detects the fault, then the output is just what we want: an estimate of each
ACM Transactions on Embedded Computing Systems, Vol. 9, No. 4, Article 39, Publication date: March 2010.

Accounting for Defect Characteristics in Evaluations of Testing Techniques 39:9
Fig. 3. Architecture and experiment procedure
characteristic’s effect on the likelihood that a given test suite detects a given fault.(For example, in the special case where the independent variables are just the testingtechnique and one fault characteristic, logistic regression would show how likely eachtechnique would be to detect a hypothetical fault having any given value for the faultcharacteristic.)
Logistic-regression analysis is a flexible technique, able to model different kindsof relationships between the independent variables and the dependent variable. Themain requirement is that the data points must be chosen by independent sampling1.If each data point consists of characteristics of a 〈test suite, fault〉 pair, then the sametest suite or the same fault cannot be used in more than one data point. This leads toa somewhat unusual (for software-testing studies) experiment design, in which eachtest suite is paired with a single fault.
Now that some motivation for the architecture has been given, Figure 3 illustratesthe architecture (top darker gray box) and its instantiation in the experiment to bepresented (bottom lighter gray box). For now, let us focus on the architecture itself,moving from left to right through the figure. The objects of study are a sample of Ntest suites (T1, . . . , TN ) for a software application and a sample of N faults (F1, . . . , FN )in that application. Each test suite is paired with exactly one fault (T1 with F1, T2 withF2, etc.) to form a 〈test suite, fault〉 pair.
Each test suite in a pair is run to see whether it (1) executes (covers) the piece ofcode containing the fault in the pair and (2) if so, whether it detects the fault. Thesefacts are recorded in the dependent variables, Cov (which is 1 if the suite covers thefault, 0 otherwise) and Det (which is 1 if the suite detects the fault, 0 otherwise).In addition, certain characteristics of each fault (F.C1, . . . , F.Cn) and each test suite(T.C1, . . . , T.Cm) are recorded. Determined by the experimenters, these characteristicsmay include the main variable of interest (e.g., testing technique) as well as factorsthat the experimenters need to control for. All of these characteristics together com-prise the independent variables. As the next part of Figure 3 shows, the data collectedfor the independent and dependent variables form a table structure. For each of the N〈test suite, fault〉 pairs, there is one data point (row in the table) consisting of a vectorof values for the independent and dependent variables.
The data points are analyzed, as the right half of Figure 3 shows, to build one ormore statistical models of the relationship between the independent variables andthe dependent variables. The models estimate the probability that a given test suite
1Independent sampling means that the error terms of any two data points are statistically indepen-dent [Garson 2006]. That is, any random factor (including but not limited to errors in measurement) thataffects one data point’s value affects either none or all of the other data points’ values.
ACM Transactions on Embedded Computing Systems, Vol. 9, No. 4, Article 39, Publication date: March 2010.

39:10 J. Strecker and A. M. Memon
(i.e., a given vector of values for T.C1, . . . , T.Cm) covers or detects a given fault (i.e.,a given vector of values for F.C1, . . . , F.Cn) as a function of the test-suite and faultcharacteristics. Additionally, if only data points with Cov = 1 are considered, thenmodels of Det can be built from them to estimate the conditional probability of faultdetection given fault coverage (Pr(Det|Cov)).
The architecture offers experimenters some choices: in the test-suite and fault char-acteristics to use as independent variables and in the way the samples of test suitesand faults are provided. For this experiment in this work, the choice of independentvariables is explained in Section 4.1. The test suites were generated randomly usinga GUI-testing technique (Section 4.2.2), and the faults were generated by mutation ofsingle lines of source code (Section 4.2.3). Because all faults in the experiment wereconfined to one line, a fault was considered to be covered by a test suite if the linecontaining it was covered.
No single experiment architecture is right for everyone. To use this architecture, thecontext of an experiment must satisfy the following preconditions:
— The experimenters must be able to obtain an adequate sample size of 〈test suite,fault〉 pairs for their purposes. The sample size depends on how many test-suite andfault characteristics are studied and how balanced the data are. (The experiment inSection 4 studied 20 characteristics, so we strove for a very large sample size.)
— For the type of faults studied, there must be some notion of “coverage”. For faultsgenerated by mutation and located inside of methods (as in our experiment), it isobvious whether a test suite covers the faulty code. But for more complex faults,such as faults of omission, it may not be obvious [Frankl et al. 1998]. Experimentersmust either define “coverage” of faults or forgo calculating Pr(Cov) and Pr(Det|Cov).
— The experimenters must be able to measure coverage without affecting the behaviorof the software. This could be an issue for real-time software, for example, whereinstrumentation might affect response time.
The architecture could be trivially extended to consider a broader class of defectcharacteristics, including the characteristics of the failures caused by a fault. However,the preceding description emphasized fault characteristics because they are the focusof the experiment in the next section.
4. EXPERIMENT PROCEDURE
This experiment applies the architecture described in the previous section, as shownin Figure 3. It serves multiple purposes:
— as a stand-alone experiment, testing hypotheses about the influence of test-suiteand fault characteristics on fault detection;
— as a concrete example for potential users of the experiment architecture to follow;and
— as a validation of the fault characterization described in Section 4.1, showing em-pirically that the fault characteristics chosen can affect faults’ susceptibility to de-tection.
The data and artifacts from the experiment have been made available to other re-searchers as a software-testing benchmark (Section 4.2).
This experiment significantly extends, and resolves major problems with, a pre-liminary study of several test-suite characteristics and just two fault characteris-tics [Strecker and Memon 2008]. The results of the preliminary study raised intriguingquestions about the relationship between the execution (coverage) of faulty code andthe detection of faults: Are certain kinds of faults more likely to be detected just be-cause the faulty code is more likely to be covered during testing? Or are these faults
ACM Transactions on Embedded Computing Systems, Vol. 9, No. 4, Article 39, Publication date: March 2010.

Accounting for Defect Characteristics in Evaluations of Testing Techniques 39:11
harder to detect even if the code is covered? This work pursues those questions bystudying not just the likelihood of detecting faults, but the likelihood of detecting themgiven that the faulty code has been covered. This perspective echoes existing modelsof failure propagation (Section 2.5), but its use to study faults empirically is unprece-dented; our novel experiment architecture makes it possible.
For each fault characteristic c studied in the experiment, the experiment tests thefollowing null hypotheses:
— H1: The fault characteristic c does not affect a fault’s likelihood of being detected bya test suite.
— H2: No interaction effect between the fault characteristic c and a test-suite charac-teristic affects a fault’s likelihood of being detected by a test suite. (Certain kinds offaults are not more likely to be detected by certain kinds of test suites.)
— H3: The fault characteristic c does not affect a fault’s likelihood of being detected bya test suite, given that the test suite covers the faulty code.
— H4: No interaction effect between the fault characteristic c and a test-suite charac-teristic affects a fault’s likelihood of being detected by a test suite, given that thetest suite covers the faulty code.
Hypotheses analogous to H1 and H3 are tested for each test-suite characteristic:
— H5: The test-suite characteristic does not affect a fault’s likelihood of being detectedby a test suite.
— H6: The test-suite characteristic does not affect a fault’s likelihood of being detectedby a test suite, given that the test suite covers the faulty code.
Hypotheses H2 and H4 also apply to test-suite characteristics. The main concern of theexperiment, however, is the fault characteristics because they need to be evaluated todetermine whether they really are relevant to software testing.
Like any experiment, this one restricts itself to a limited domain of applications,testing techniques, and faults. In choosing this domain, important factors were thecost and replicability of the experiment. Since we knew of no existing data set that fitthe requirements of this experiment, and since creating a large sample of test suitesand faults by hand is expensive and hard to replicate, we decided to generate testsuites and faults automatically. For faults, this led us to choose the domain of mutationfaults. For test suites (and consequently applications), the authors’ experience withautomated GUI testing made this domain an obvious choice. As Section 2.1 explained,GUI testing is a form of system testing in which test cases are generated by traversingan event-flow-graph (EFG) model of a GUI. Considering that many computer userstoday use GUIs exclusively and have encountered GUI-related failures, research onGUIs and GUI testing is timely and relevant.
4.1. Test-suite and fault characterization
The independent variables in this experiment are characteristics of faults and testsuites hypothesized to affect the probability of fault detection. Since there is currentlyno standard way to choose these characteristics, the selection was necessarily some-what improvised but was driven by earlier research (Section 2). Although the litera-ture does not directly suggest viable fault characteristics, it does clearly point to cer-tain test-suite characteristics. Because the test suites and faults in this experimentwere generated automatically, characteristics related to human factors did not need tobe considered. To make this experiment practical to perform, replicate, and apply inpractice, only characteristics that can be measured objectively and automatically wereconsidered.
ACM Transactions on Embedded Computing Systems, Vol. 9, No. 4, Article 39, Publication date: March 2010.

39:12 J. Strecker and A. M. Memon
Truly objective measures of faults—measures of intrinsic properties, independent ofany test set—would be derived from static analysis. In this experiment, however, somecharacteristic measures were derived from execution data from the test pool (the setof all test cases used in the experiment), not from static analysis. This is not entirelyobjective because a different test pool would result in different measurements. How-ever, measures that are closely correlated to the specific test pool (e.g., those averagedacross the test cases in the pool) were avoided. We deferred the use of static analysisto future work because the bias introduced by the execution data was expected to beacceptably small, and because static analysis tools accounting for the event-orientedstructure of GUI-based applications were still under development [Staiger 2007].
In this work, a characteristic is an informally defined property of a fault or testsuite, such as the degrees of freedom in execution of faulty code or the proportion ofthe application covered by the test suite. Each characteristic can be measured by oneor more metrics, which are more precisely defined. When one of several metrics mightbe used to measure a characteristic, it is not clear a priori which one best predicts afault’s likelihood of being covered or detected. The rest of this section lists the faultand test-suite metrics explored in this experiment, organized by characteristic. Themetrics are summarized in Table I.
4.1.1. Fault characteristics. One fault characteristic studied is the method of creation,which for this experiment is some form of mutation. The mutation operators fall intotwo categories: class-level that are added to class code not specific to any particularmethod (e.g., changing Shape.CIRCLE to Shape.SQUARE on Line 51 in Figure 2) andmethod-level that are within the scope of a single method (e.g., changing ! = to ==on Line 72 in Figure 2). Class-level and method-level mutations were previously stud-ied in Strecker and Memon [2008]; the results were inconclusive but suggested thatclass-level and method-level faults may be differently susceptible to detection. The la-bel for the metric of mutation type is F.MutType. To provide finer-grained analysis, infuture work, we intend to model mutation operators as characteristics of faults.
Another fault characteristic is the distance of faulty code from the initial state.Faults residing in code that is “closer”, in some sense, to the beginning of the pro-gram are probably easier to cover and may be easier to detect. For example, Line 57in Figure 2 is executed before Line 78. One metric measuring this is the minimumnumber of source-code lines that must be covered before the faulty line is executed forthe first time (F.CovBef). This can be estimated by running the test pool with programinstrumentation to collect coverage data.
Another way to measure the distance of a line of code from the program’s initial stateis to compute the minimum EFG depth, discussed in Section 2.1, of the events asso-ciated with a faulty line. Events can be associated with particular lines by collectingcoverage data for each event in each test case of the test pool. The label for this metricis F.Depth.
The repetitions in which the faulty code is executed may affect fault detection.Faults that lie in code that, when executed, tends to be executed multiple times by it-eration, recursion, or multiple invocations may be easier to detect. The exact numberof times a line is executed varies by test case; two binomial metrics are studied in-stead. One is whether the line is ever executed more than once by an event handler(F.SomeRep). The other is whether the line is always executed more than once by anevent handler (F.AllRep).
Another fault characteristic that may affect fault detection is the degree of free-dom in execution of the faulty code. In GUI-based applications, an event handlercan typically be executed just before or after any of several other event handlers. In ourexample of Figure 1, event (un)check can be executed only after itself and exit; whereas
ACM Transactions on Embedded Computing Systems, Vol. 9, No. 4, Article 39, Publication date: March 2010.

Accounting for Defect Characteristics in Evaluations of Testing Techniques 39:13
Table I. Test-suite and fault characteristics studiedCharacteristic Metric Definition
Fault
Method ofcreation
F.MutType 1 if a method-level mutant, 0 if a class-level mutant
Distancefrom initialstate
F.CovBef Est. minimum lines covered before firstexecution of faulty line, normalized bytotal lines
F.Depth Est. minimum EFG depth of first eventexecuting faulty line in each test case,normalized by EFG depth
RepetitionsF.SomeRep 1 if est. minimum executions of faulty
line by each executing event is > 0, 0otherwise
F.AllRep 1 if est. maximum executions of faultyline by each executing event is > 0, 0otherwise
Degrees offreedom
F.MinPred Est. minimum EFG predecessors ofevents executing faulty line, normal-ized by total events in EFG
F.MaxPred Est. maximum EFG predecessors ofevents executing faulty line, normal-ized by total events in EFG
F.MinSucc Est. minimum EFG successors ofevents executing faulty line, normal-ized by total events in EFG
F.MaxSucc Est. maximum EFG successors ofevents executing faulty line, normal-ized by total events in EFG
F.Events Est. number of distinct events exe-cuting faulty line, normalized by totalevents in EFG
Size of eventhandlers
F.MinWith Est. minimum lines covered in sameevent as faulty line, normalized by to-tal lines
F.MaxWith Est. maximum lines covered in sameevent as faulty line, normalized by to-tal lines
Testsuite
Granularity T.Len Length (number of events) of each testcase
Size T.Events Number of events, normalized by totalevents in EFG
Proportionof coverage
T.Class Percent of classes coveredT.Meth Percent of methods coveredT.Block Percent of blocks coveredT.Line Percent of lines coveredT.Pairs Percent of event pairs in EFG coveredT.Triples Percent of event triples in EFG covered
ACM Transactions on Embedded Computing Systems, Vol. 9, No. 4, Article 39, Publication date: March 2010.

39:14 J. Strecker and A. M. Memon
circle can be executed after circle, square, reset, create, and no. Faulty code executedby an event that can be preceded or succeeded by many other events may be easier tocover, and it is not clear whether it would be more or less susceptible to detection. Theminimum or maximum number of event predecessors or successors associated with afaulty line (F.MinPred, F.MaxPred, F.MinSucc, F.MaxSucc) can be estimated by associ-ating coverage data from the test pool with the EFG. Faulty code executed by moreevents (e.g., code in the draw() method, invoked by several events, in Figure 2) mayalso be easier to cover and either more or less susceptible to detection. The number ofevents executing the faulty code (F.Events), too, can be estimated with coverage datafrom the test pool.
Morgan et al. [1997] report that program size affects fault detection in testing, sothe size of the event handler(s) that execute a faulty line may similarly havean effect. Event-handler size can be measured as the minimum or maximum num-ber of lines covered by each event handler that executes the faulty line (F.MinWith,F.MaxWith).
4.1.2. Test-suite characteristics. For test suites, one interesting characteristic is thegranularity of test cases—the amount of input provided by each test case. In GUItesting, granularity can easily be measured by the length (number of events) of a testcase (T.Len). In this experiment, the length of the test cases in a test suite could bemeasured either by taking the average of different-length test cases in a suite or byconstructing each suite such that its test cases have a uniform length. The latter ap-proach is chosen because it has a precedent in previous work [Rothermel et al. 2004;Xie and Memon 2006]. As mentioned in Section 2.1, uniform-length test suites ensurethat all events in the GUI are covered, and that each event has been tested in a numberof contexts [Yuan et al. 2010].
Clearly, the characteristic of test-suite size can affect fault detection: larger testsuites are likely to cover and detect more faults. An important question studied in thisexperiment is whether they do so when other factors, such as the suite’s coverage level,are controlled for. In some studies, test-suite size is measured as the number of testcases. But for this experiment, since different suites have different test-case lengths, amore meaningful metric is the total number of events in the suite, which is the productof the test-case length and the number of test cases (T.Events).
Another test-suite characteristic that can affect fault detection is the proportionof the application covered. Obviously, the more of an application’s code a test suitecovers, the more likely it is to cover a specific line, faulty or not. It may also be likelyto detect more faults [Morgan et al. 1997]. The proportion of coverage may be mea-sured by any of the myriad coverage metrics proposed over the years. This experimentconsiders several structural metrics—class (T.Class), method (T.Meth), block (T.Block),and line coverage (T.Line)—because of their popularity and availability of tool support.(Block and line coverage are very similar, but both are studied because it is not cleara priori which better predicts fault detection.) For GUI-based applications, additionalcoverage metrics based on the event-flow graph (EFG) are available. Event coverage(coverage of nodes in the EFG) turns out not to be a useful metric for this experi-ment because each suite is made to cover all events. However, coverage of event pairs(EFG edges or length-2 event sequences; T.Pairs) and event triples (length-3 event se-quences; T.Triples) is considered. (Longer event sequences could have been consideredas well, but length 3 seemed a reasonable stopping point for this experiment. We notethat a similar notion of “length 3 sequences,” albeit in the context of state machines,has been developed earlier; it has been called edge-pair, tranistion-pair, or two-tripcoverage [Ammann and Offutt 2008]. Because our experiment does show coverage of
ACM Transactions on Embedded Computing Systems, Vol. 9, No. 4, Article 39, Publication date: March 2010.

Accounting for Defect Characteristics in Evaluations of Testing Techniques 39:15
Table II. Applications under testLines Classes Events EFG edges EFG depth Data points
CrosswordSage 0.3.5 2171 36 98 950 6 2230FreeMind 0.7.1 9382 211 224 30146 3 970
length-2 and length-3 sequences to be influential variables, future experiments canstudy coverage of longer sequences.)
4.2. Data collection
The first stage of the experiment involves building and collecting data from a sampleof test suites and a sample of faults. One of the contributions of this work is to makedata and artifacts from this experiment—products of thousands of computation-hoursand hundreds of person-hours—available to other researchers as a software-testingbenchmark2. These data and artifacts, which include the samples of test suites andfaults, can help other researchers replicate this work and perform other studies.
4.2.1. Applications under test. Two medium-sized, open-source applications were stud-ied: CrosswordSage 0.3.53, a crossword-design tool; and FreeMind 0.7.14, a tool forcreating “mind maps”. Both are implemented in Java and rely heavily on GUI-basedinteractions. Table II gives each application’s size as measured by executable lines ofcode, classes, and GUI events modeled in testing; the depth and number of edges of itsEFG; and the number of data points (〈test suite, fault〉 pairs) generated for it.
GUI testing of the applications was performed with tools in the GUITAR suite [Xieand Memon 2006]. To make the applications more amenable to these tools, a few mod-ifications were made to the applications’ source code and configuration files (e.g., tomake file choosers open to a certain directory and to disable automatic saves). Themodified applications are referred to as the clean-uninstrumented versions. Each ap-plication was made to have the same configuration throughout the experiment. A sim-ple input file was created for each application; it could be opened by performing thecorrect sequence of events on the GUI. Using GUITAR, an EFG was created for eachapplication. GUI events that could interfere with the experiment (e.g., events involvedin printing) were removed from the EFG. The applications, configuration files, inputfiles, and EFG are provided in the software-testing benchmark described at the begin-ning of Section 4.2.
To collect coverage data, each clean-uninstrumented application was instrumentedwith Instr5 and Emma6. The instrumented applications are referred to as the cleanversions. Instr reports how many times each source line was executed, while Emmareports (among other information) the proportion of classes, methods, blocks, and linescovered. Coverage reports from Instr were collected after each event in a test case; areport from Emma was collected at the end of the test case.
To identify lines in initialization code—code executed before any events areperformed—an “empty” test case (with no GUI events) was run on each applicationand coverage reports were collected. The initialization code was treated as an initialevent in the EFG having depth 0, no in-edges, and out-edges extending to all depth-1events.
2http://www.cs.umd.edu/~atif/Benchmarks/UMD2008a.html3http://crosswordsage.sourceforge.net4http://freemind.sourceforge.net5http://www.glenmccl.com/instr/index.htm6http://emma.sourceforge.net
ACM Transactions on Embedded Computing Systems, Vol. 9, No. 4, Article 39, Publication date: March 2010.
39:16 J. Strecker and A. M. Memon
4.2.2. Test suites. The sample of test suites used in this experiment should be large7;and the results of the experiment should be replicable, i.e., not influenced by the skill ofthe tester. These criteria suggest an automated testing technique. For this experiment,a form of automated GUI testing (Section 2.1) is chosen.
Because of our choice of logistic regression analysis (discussed in Section 3), notonly should the sample of test suites be large and replicable, but it should also bean independent sample. As mentioned earlier, this imposes the requirement that testsuites in different 〈test suite, fault〉 pairs should not be “related” to one another, i.e.,the same test suite or the same fault cannot be used in more than one data point. Thisensures that our data points are independently sampled, i.e., the error terms of anytwo data points are statistically independent [Garson 2006]. For this reason, a uniqueset of tests was generated, using the process described below, for each 〈test suite, fault〉pair. (The alternative would be to form each test suite by selecting, with replacement,a subset of a large pool of test cases, as was done in a preliminary study [Strecker andMemon 2008].)
Each test suite satisfies two requirements. First, it covers every event in the appli-cation’s EFG at least once. This is to ensure that faults in code only executed by oneevent have a chance of being covered or detected. Second, its test cases are all the samelength. This is so that test-case length can be studied as an independent variable. Thelength must be greater than or equal to the depth of the EFG to ensure that all eventscan be covered.
Model-based GUI testing has the advantage of being automated, but this is tem-pered by the fact that existing tools for generating and executing GUI test cases areimmature; they are still under development and may contain bugs. Also, the EFG isonly an approximation of actual GUI behavior; because of enabling/disabling of eventsand other complex behavior in the actual GUI, not every test case generated from theEFG model is executable [Yuan and Memon 2007]. For these reasons, each test suitemust be generated carefully to ensure that every test case runs properly.
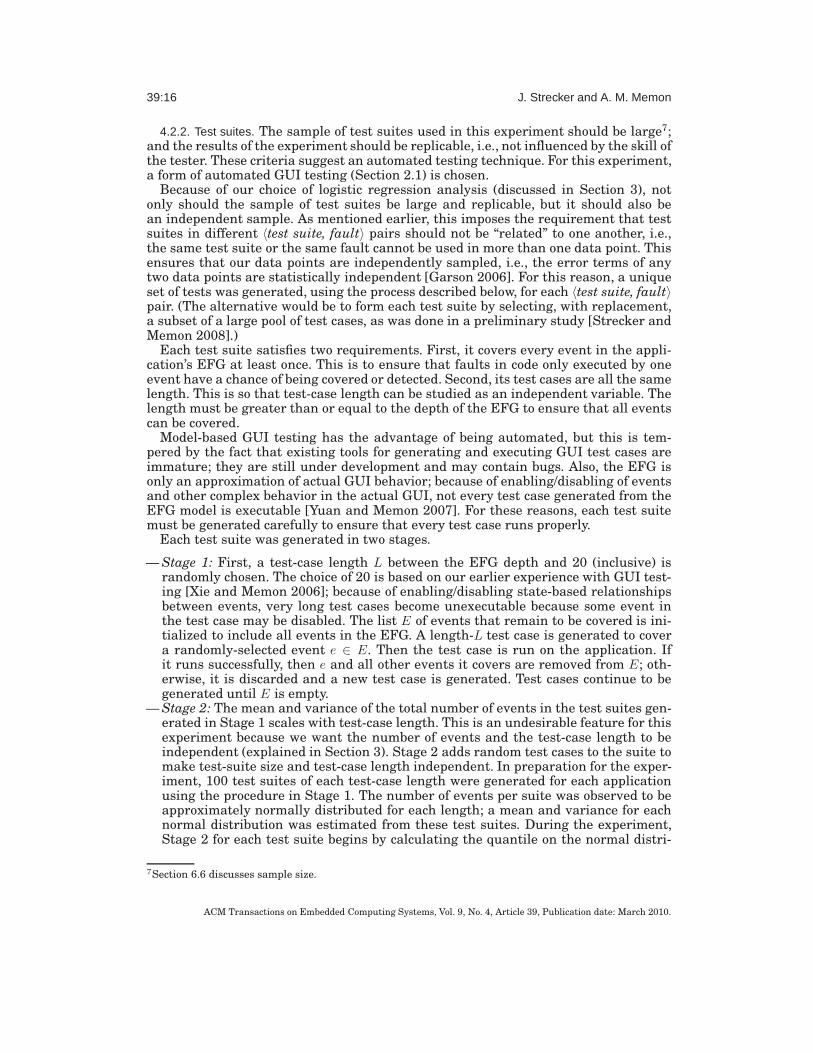
Each test suite was generated in two stages.
— Stage 1: First, a test-case length L between the EFG depth and 20 (inclusive) israndomly chosen. The choice of 20 is based on our earlier experience with GUI test-ing [Xie and Memon 2006]; because of enabling/disabling state-based relationshipsbetween events, very long test cases become unexecutable because some event inthe test case may be disabled. The list E of events that remain to be covered is ini-tialized to include all events in the EFG. A length-L test case is generated to covera randomly-selected event e ∈ E. Then the test case is run on the application. Ifit runs successfully, then e and all other events it covers are removed from E; oth-erwise, it is discarded and a new test case is generated. Test cases continue to begenerated until E is empty.
— Stage 2: The mean and variance of the total number of events in the test suites gen-erated in Stage 1 scales with test-case length. This is an undesirable feature for thisexperiment because we want the number of events and the test-case length to beindependent (explained in Section 3). Stage 2 adds random test cases to the suite tomake test-suite size and test-case length independent. In preparation for the exper-iment, 100 test suites of each test-case length were generated for each applicationusing the procedure in Stage 1. The number of events per suite was observed to beapproximately normally distributed for each length; a mean and variance for eachnormal distribution was estimated from these test suites. During the experiment,Stage 2 for each test suite begins by calculating the quantile on the normal distri-
7Section 6.6 discusses sample size.
ACM Transactions on Embedded Computing Systems, Vol. 9, No. 4, Article 39, Publication date: March 2010.

Accounting for Defect Characteristics in Evaluations of Testing Techniques 39:17
bution for length L corresponding to the suite’s number of events after Stage 1. Thenumber of events corresponding to the same quantile on the normal distribution forlength 20 is then found; this becomes the target number of events for the suite. Testcases are generated by randomly traversing the EFG and are added to the suite toreach the target number.
4.2.3. Faults. An important consideration in any empirical study of fault detectionis whether to use natural, manually-seeded, or automatically-seeded faults [Andrewset al. 2006; Do and Rothermel 2006]. To obtain this experiment’s large sample size(Table II) with the resources available, using automatically-seeded faults was theonly feasible option. Even apart from resource considerations, automatically-seededfaults offer some advantages for experimentation: unlike natural or hand-seededfaults, automatically-seeded faults are not influenced by the person (accidentally orintentionally) seeding the fault. The tool MuJava8 was used to seed mutation faults(syntactically-small changes to the source code, such as replacing one operator or iden-tifier with another; a full list of the mutation types is available at the referenced URL).Although the use of mutation faults is a threat to external validity, it should be notedthat in at least some cases mutation faults turn out to be about equally difficult todetect as natural faults [Andrews et al. 2006; Do and Rothermel 2006], and a fault’ssyntactic size has little to do with its difficulty of detection [Offutt and Hayes 1996].
Using MuJava, all possible faults within MuJava’s parameters were generated foreach application. Of those, faults that spanned multiple lines and faults in applica-tion classes corresponding to events deliberately omitted from the application’s EFG(e.g., crosswordsage.PrintUtilities; see Section 4.2.1) were omitted. Faults not in-side methods (i.e., in class-variable declarations and initialization) were also omit-ted because their coverage is not tracked by Emma or Instr and because most extra-method faults turned out to be either trivially detectable (e.g., removing a necessaryvariable initialization) or not faults at all (e.g., removing an unnecessary variableinitialization). For CrosswordSage, all 2230 of the remaining faults were used. ForFreeMind—which requires much more time to generate and run each test suite be-cause of its larger GUI—1000 of the 5729 single-line faults in acceptable classes wereinitially selected at random, and of those the 970 faults located inside methods wereused. Equivalent mutants were not accounted for in this experiment because it wouldhave been infeasible to examine every mutant to see if it could lead to a failure.
4.2.4. Test execution and characteristic measurement. A test suite was generated for eachfault in the sample. For each 〈test suite, fault〉 pair, each test case was executed on theclean version of the application and, if it covered the line containing the fault, on thefaulty version. Test cases were executed by GUITAR on a cluster of Linux machines.Most of the computation time for the experiment was spent running test cases. Withthe parameters set for GUITAR, a test case of length L took at least 5 + 2.5L secondsto run on the clean version. For CrosswordSage, test suites consisted of 18 to 101 testcases (306 to 680 events); for FreeMind, 45 to 343 test cases (770 to 1178 events);we attribute the wide variance to the randomness built into the two-stage test-suitecreation process.
To determine whether a test suite covered a faulty line (Cov), the coverage reportfrom Instr was examined. To determine whether a test suite that covered a faulty linealso detected the fault (Det), the oracle information collected by GUITAR for the cleanand faulty versions was compared.
When the experiment was run, some false reports of fault detection were anticipated.Because of timing problems in the current version of the test-case-replayer component
8http://cs.gmu.edu/~offut/mujava
ACM Transactions on Embedded Computing Systems, Vol. 9, No. 4, Article 39, Publication date: March 2010.
39:18 J. Strecker and A. M. Memon
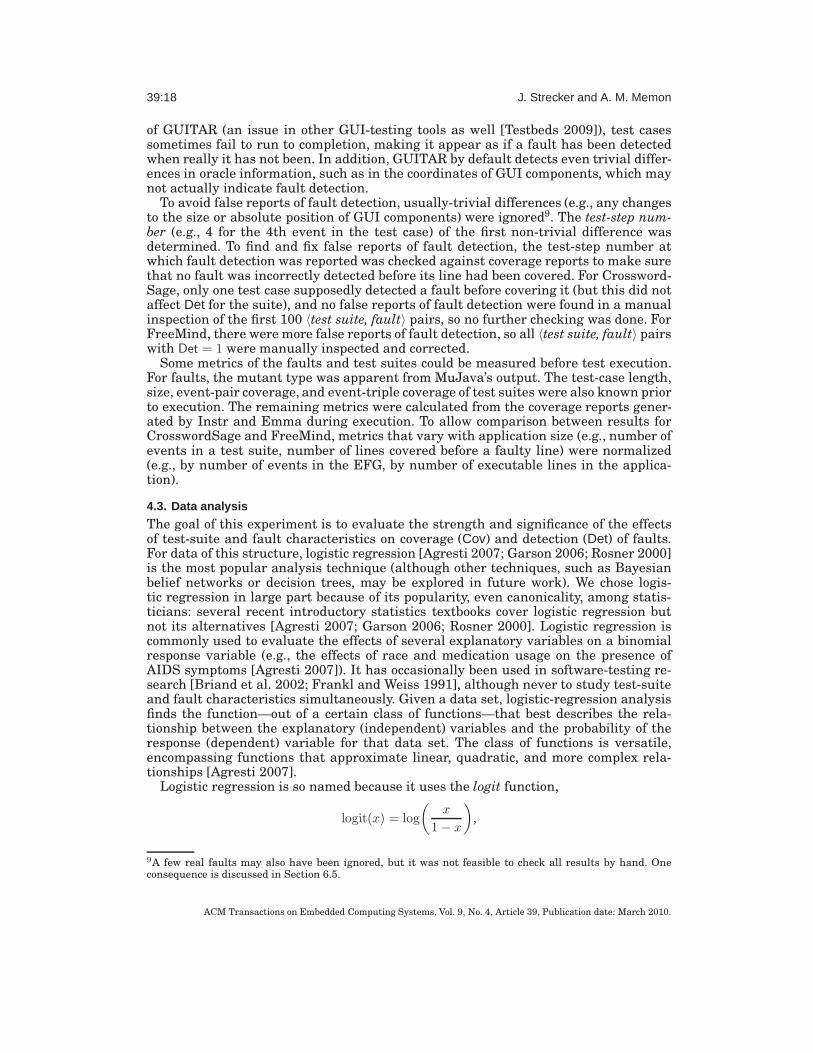
of GUITAR (an issue in other GUI-testing tools as well [Testbeds 2009]), test casessometimes fail to run to completion, making it appear as if a fault has been detectedwhen really it has not been. In addition, GUITAR by default detects even trivial differ-ences in oracle information, such as in the coordinates of GUI components, which maynot actually indicate fault detection.
To avoid false reports of fault detection, usually-trivial differences (e.g., any changesto the size or absolute position of GUI components) were ignored9. The test-step num-ber (e.g., 4 for the 4th event in the test case) of the first non-trivial difference wasdetermined. To find and fix false reports of fault detection, the test-step number atwhich fault detection was reported was checked against coverage reports to make surethat no fault was incorrectly detected before its line had been covered. For Crossword-Sage, only one test case supposedly detected a fault before covering it (but this did notaffect Det for the suite), and no false reports of fault detection were found in a manualinspection of the first 100 〈test suite, fault〉 pairs, so no further checking was done. ForFreeMind, there were more false reports of fault detection, so all 〈test suite, fault〉 pairswith Det = 1 were manually inspected and corrected.
Some metrics of the faults and test suites could be measured before test execution.For faults, the mutant type was apparent from MuJava’s output. The test-case length,size, event-pair coverage, and event-triple coverage of test suites were also known priorto execution. The remaining metrics were calculated from the coverage reports gener-ated by Instr and Emma during execution. To allow comparison between results forCrosswordSage and FreeMind, metrics that vary with application size (e.g., number ofevents in a test suite, number of lines covered before a faulty line) were normalized(e.g., by number of events in the EFG, by number of executable lines in the applica-tion).
4.3. Data analysis
The goal of this experiment is to evaluate the strength and significance of the effectsof test-suite and fault characteristics on coverage (Cov) and detection (Det) of faults.For data of this structure, logistic regression [Agresti 2007; Garson 2006; Rosner 2000]is the most popular analysis technique (although other techniques, such as Bayesianbelief networks or decision trees, may be explored in future work). We chose logis-tic regression in large part because of its popularity, even canonicality, among statis-ticians: several recent introductory statistics textbooks cover logistic regression butnot its alternatives [Agresti 2007; Garson 2006; Rosner 2000]. Logistic regression iscommonly used to evaluate the effects of several explanatory variables on a binomialresponse variable (e.g., the effects of race and medication usage on the presence ofAIDS symptoms [Agresti 2007]). It has occasionally been used in software-testing re-search [Briand et al. 2002; Frankl and Weiss 1991], although never to study test-suiteand fault characteristics simultaneously. Given a data set, logistic-regression analysisfinds the function—out of a certain class of functions—that best describes the rela-tionship between the explanatory (independent) variables and the probability of theresponse (dependent) variable for that data set. The class of functions is versatile,encompassing functions that approximate linear, quadratic, and more complex rela-tionships [Agresti 2007].
Logistic regression is so named because it uses the logit function,
logit(x) = log
(
x
1 − x
)
,
9A few real faults may also have been ignored, but it was not feasible to check all results by hand. Oneconsequence is discussed in Section 6.5.
ACM Transactions on Embedded Computing Systems, Vol. 9, No. 4, Article 39, Publication date: March 2010.

Accounting for Defect Characteristics in Evaluations of Testing Techniques 39:19
−2 −1 0 1 2
0.0
0.2
0.4
0.6
0.8
1.0
X
Pr(
Y)
−10
−1
−0.1
0.1
1
10
Fig. 4. Predicted probabilities for example logistic-regression models
to map probabilities—values between 0 and 1—onto the entire range of real num-
bers. For a dependent variable Y and a vector of independent variables ~X, the logistic-regression model has the form
logit(Pr(Y )) = α + ~β · ~X. (1)
The intercept term α is related to the overall probability of Y , and, as explained below,
the coefficients ~β show the strength of relationship between each element of ~X and Y .Note that logit(Pr(Y )) equals the log of the odds of Y . Rewritten, Equation 1 expressesthe probability of the dependent variable as a function of the independents:
Pr(Y ) =exp(α + ~β · ~X)
1 + exp(α + ~β · ~X). (2)
Figure 4 plots this function for ~X = X , α = 0, and ~β = β ∈ {−10,−1,−0.1, 0.1, 1, 10}.In logistic-regression analysis, a data set consists of a set of data points, each a
vector of values for ~X (here, test-suite and fault characteristics) paired with a valuefor Y (here, Cov or Det). The goal of logistic regression is to find values for the intercept
α and coefficients ~β that maximize the likelihood that the set of observed values of Y
in the data set would have occurred given α, ~β, and the observed values of ~X. The
process of choosing values for α and ~β is called model fitting and is accomplished by amaximum-likelihood-estimation algorithm.
Coefficients in a logistic-regression model indicate the magnitude and direction ofeach independent variable’s relationship to the log of the odds of the dependent vari-able. If βi = 0, then there is no relationship between Xi and Y ; if βi < 0, then the oddsand probability of Y decrease as Xi increases; if βi > 0, then the odds and probabilityof Y increase as Xi increases. However, the increase or decrease in the odds of Y ismultiplicative, not additive; it is a factor not of βi but of exp(βi). More precisely, theratio of the odds of Y when Xi = xi + ∆ to the odds of Y when Xi = xi, when all otherXj ∈ ~X are held constant, is estimated to be
OR = exp(βi∆). (3)
ACM Transactions on Embedded Computing Systems, Vol. 9, No. 4, Article 39, Publication date: March 2010.

39:20 J. Strecker and A. M. Memon
Table III. Data setsData set Description
ALLFAULTS
All 〈test suite, fault〉 pairsAll test-suite metricsFault metrics not requiring execution data
POOLCOVFAULTS
Pairs where test pool covers faultAll test-suite metricsAll fault metrics
SUITECOVFAULTS
Pairs where test suite covers faultAll test-suite metricsAll fault metrics
Associated with each coefficient is a p-value for the chi-square test of deviance, astatistical test of whether the independent variable is actually related to the dependentvariable, or whether the apparent relationship (non-zero coefficient) is merely due tochance. A p-value ≤ 0.05, indicating that there is only a 5% chance of seeing a fittedcoefficient value that extreme under the null hypothesis, is typically considered tobe statistically significant. For exploratory analysis (as in this experiment), p-values≤ 0.10 may also be considered [Garson 2006].
4.3.1. Data sets. This study tests hypotheses about the effects of test-suite and faultcharacteristics on (1) the likelihood of a test suite detecting a fault and (2) the like-lihood of a test suite detecting a fault, given that the test suite covers the fault. Thehypotheses can be grouped according to these two dependent variables.
To explore the second group of hypotheses, a data set consisting of all 〈test suite,fault〉 pairs where the test suite covers the fault was constructed. This data set iscalled SUITECOVFAULTS, and its properties are described in Table III.
To explore the first group of hypotheses, a data set consisting of 〈test suite, fault〉pairs where the test suite does not necessarily cover the fault was needed. Becauseof the way fault metrics are measured in this study, two data sets were actually con-structed. Measurement of most of the fault metrics requires some information collectedfrom executing the faulty line of code. But many of the faulty lines were not executedby any test case in the test pool, so no information was available for them. The 〈testsuite, fault〉 pairs for which information was available were collected into a data setcalled POOLCOVFAULTS. All 〈test suite, fault〉 pairs were collected into a data set calledALLFAULTS, but the only fault metric in ALLFAULTS was the one that could be mea-sured without execution information (F.MutType). Table III also lists the properties ofPOOLCOVFAULTS and ALLFAULTS.
4.3.2. Model fitting. For each data set, two kinds of logistic-regression models were fit-ted: univariate and multivariate. Each univariate model, which assesses the effect ofan independent variable Xi by itself on the dependent variable Y , has the form
logit(Pr(Y )) = α + βiXi.
Each multivariate model, which assesses the contribution of each independent vari-able toward explaining the dependent variable in the context of the other independent
variables, has the form in Equation 1, with ~X consisting of some subset of the inde-pendent variables for the data set. For the ALLFAULTS and POOLCOVFAULTS datasets, Y can be either Cov or Det; for SUITECOVFAULTS, Y can only be Det since Cov isalways 1. Before model-fitting, all non-categorical data was centered10—the mean was
10In models with interaction terms, centering is “strongly recommended to reduce multicollinearity and aidinterpretation of coefficients” [Garson 2006].
ACM Transactions on Embedded Computing Systems, Vol. 9, No. 4, Article 39, Publication date: March 2010.

Accounting for Defect Characteristics in Evaluations of Testing Techniques 39:21
subtracted. Model-fitting and other statistical calculations were performed with the Rsoftware environment11 [Ripley 2001].
A potential problem in fitting multivariate logistic-regression models—for whichother studies of fault detection have been criticized [Fenton and Neil 1999]—is thatstrongly correlated (“multicolinear”) independent variables can result in models withmisleading coefficients and significance tests. If two or more multicolinear variablesare included as parameters in a multivariate model, then none may appear to be sta-tistically significant even if each is significant in its respective univariate model. Also,the fitted coefficients may be very different from those in the univariate models, evenchanging signs. Thus, the models may be overfitted to the data; they would not fitother data well. Although some correlation among model parameters is acceptable—indeed, the intention of multivariate analysis is to control for such correlation—for thepurposes of this work it is desirable to avoid serious multicolinearity.
To avoid multicolinearity, as well as to provide multivariate models that are smallenough to comprehend, a subset of the metrics in Table I may need to be selected foreach model. There is no standard way to do this; to some extent, it is a process oftrial and error [Slud 2008]. Only metrics that are close to being statistically signifi-cant in their univariate models (p <= 0.10) are considered. Correlations among thesemetrics turn out to be complex. Not surprisingly, groups of metrics measuring thesame characteristic tend to be strongly correlated. However, for the test-suite char-acteristic of coverage level, the code-coverage metrics (T.Class, T.Meth, T.Block, andT.Line) and the event-coverage metrics (T.Pairs and T.Triples) are strongly correlatedamongst themselves but not as strongly correlated between the two groups. Betweenmetrics measuring different characteristics, some correlations also arise—for example,between T.Pairs and T.Len—and vary in strength across data sets. To re-group the dataaccording to correlation, we tried principal-component analysis, but it proved unhelp-ful: many metrics did not fall neatly into one component or another. For each data set,then, the problem of selecting the subset of metrics that form the best-fitting multi-variate model for the dependent variable, while not being too strongly correlated toeach other, was an optimization problem.
We reduced the problem size and then applied a brute-force solution. To reduce theproblem size, metrics were grouped according to the characteristic they measured,with the exception that the test-suite coverage metrics were split into code-coverageand event-coverage groups. While only a heuristic, this grouping makes sense because,as stated above, metrics within each group tend to be strongly correlated. To find thebest-fitting multivariate model, a program was written in R to fit logistic-regressionmodels made up of every combination of metrics that could be formed by choosing onemetric from each group. (This brute-force solution was feasible because there were fewenough groups.) The model with the lowest AIC (Section 4.3.3) and without severemulticolinearity12 was chosen. This is the main-effects model.
Each main-effects model was expanded by adding interaction effects of interest—namely, those between a test-suite metric and a fault metric. The models were then re-duced by stepwise regression based on AIC to eliminate independent variables and in-teractions whose contribution toward explaining the dependent variable is negligible.The result is the interaction-effects model. This is the multivariate model presented inthe next section.
11http://www.r-project.org/12In this experiment, the only criterion for severe multicolinearity is unexpected coefficient signs. For amore stringent definition of multicolinearity, some maximum allowable correlation value would have to bechosen arbitrarily.
ACM Transactions on Embedded Computing Systems, Vol. 9, No. 4, Article 39, Publication date: March 2010.

39:22 J. Strecker and A. M. Memon
Table IV. Data summary: ALLFAULTS
CrosswordSage FreeMind 0.7.1Min. Mean Max. Min. Mean Max.
F.MutType 0 0.474 1 0 0.705 1T.Len 6 13.0 20 3 11.6 20T.Events 3.12 5.00 6.94 3.44 4.35 5.26T.Class 0.556 0.697 0.750 0.749 0.795 0.815T.Meth 0.328 0.454 0.490 0.521 0.569 0.595T.Block 0.361 0.509 0.552 0.419 0.485 0.524T.Line 0.345 0.484 0.525 0.423 0.488 0.525T.Pairs 0.192 0.272 0.338 0.0141 0.0230 0.0286T.Triples 0.0198 0.0337 0.0499 0.0000554 0.0001540 0.0002132
4.3.3. Goodness of fit. To evaluate the multivariate models’ goodness of fit to the data,several measures were used. One was deviance [Agresti 2007; Garson 2006], whichindicates how much of the variance in the dependent variable fails to be explainedby the model13; lower deviance means better fit. (R2, a similar measure for linear-regression models, is not applicable to logistic-regression models). The deviance shouldbe interpreted relative to the null deviance, which is the deviance of a model consistingof just a constant term (intercept). Some statistical tests of goodness of fit involvecomparing the deviance to the null deviance. Another goodness-of-fit measure usedwas Akaike’s “an information criterion” (AIC) [Agresti 2007; Garson 2006], a functionof the deviance and the number of independent variables in the model that balancesmodel fit with parsimony (fewer variables); lower AIC is better.
Other measures of goodness of fit used, which may be more familiar outside thestatistics community, were sensitivity and specificity [Agresti 2007; Garson 2006].These have to do with the number of correct classifications (“predictions”) made bythe model on the data to which it was fit. Although probabilities predicted by logistic-regression models may fall anywhere between 0 and 1, they can be classified as 0 (“neg-ative”) or 1 (“positive”) using the sample mean of the dependent variable as the cutoff.For example, for the ALLFAULTS data set for CrosswordSage, 27.0% of Det values are1, so model predictions < 0.270 are considered to be 0 and those > 0.270 are consid-ered to be 1. Sensitivity is the proportion of actual positives (e.g., Det = 1) correctlyclassified as such. Specificity is the proportion of actual negatives correctly classifiedas such.
5. RESULTS
Tables IV, V, and VI summarize the three data sets to be analyzed, which were de-scribed in Table III. These tables list the minimum, mean, and maximum of each in-dependent variable in each data set. Understanding the range of the data will help tointerpret the logistic-regression models presented in this section. Some key observa-tions about the data sets can also be made.
The first observation is that the mean values of the test-suite metrics are nearlythe same for the ALLFAULTS and POOLCOVFAULTS data sets. For example, the meanvalue of T.Class is 0.697 in ALLFAULTS and 0.694 in POOLCOVFAULTS for Crossword-Sage, and 0.795 in both data sets for FreeMind. The second observation is that, for themean value of the one fault metric shared between ALLFAULTS and POOLCOVFAULTS,
13More precisely, deviance is a function of “the probability that the observed values of the dependent maybe predicted by the independents” [Garson 2006]. This probability is called the likelihood. The deviance of amodel is actually −2(LM −LS), where LM is the log of the likelihood for the model and LS is the log of thelikelihood for a perfectly-fitting model.
ACM Transactions on Embedded Computing Systems, Vol. 9, No. 4, Article 39, Publication date: March 2010.

Accounting for Defect Characteristics in Evaluations of Testing Techniques 39:23
Table V. Data summary: POOLCOVFAULTS
CrosswordSage FreeMind 0.7.1Min. Mean Max. Min. Mean Max.
F.MutType 0 0.448 1 0 0.759 1F.CovBef 0.0000 0.0736 0.2165 0.000 0.138 0.292F.Depth 0.000 0.291 0.833 0.000 0.397 1.000F.SomeRep 0 0.323 1 0 0.745 1F.AllRep 0 0.304 1 0 0.176 1F.MinPred 0.0000 0.0293 0.2041 0.00000 0.02450 0.77679F.MaxPred 0.0000 0.1560 0.2041 0.00000 0.67410 0.77679F.MinSucc 0.0102 0.0592 0.2041 0.00446 0.14032 0.75893F.MaxSucc 0.0204 0.1660 0.2041 0.01786 0.66597 0.75893F.Events 0.0102 0.0698 0.4388 0.00446 0.54611 0.96429F.MinWith 0.000461 0.060423 0.171350 0.000107 0.041343 0.143253F.MaxWith 0.00322 0.12423 0.17181 0.0576 0.1552 0.1768T.Len 6 12.9 20 3 11.6 20T.Events 3.12 5.02 6.89 3.44 4.34 5.22T.Class 0.556 0.694 0.750 0.749 0.795 0.815T.Meth 0.328 0.453 0.487 0.521 0.568 0.595T.Block 0.361 0.508 0.552 0.420 0.484 0.524T.Line 0.345 0.483 0.525 0.424 0.487 0.525T.Pairs 0.192 0.272 0.336 0.0141 0.0230 0.0286T.Triples 0.0198 0.0337 0.0460 0.0000554 0.0001545 0.0002132
Table VI. Data summary: SUITECOVFAULTS
CrosswordSage FreeMind 0.7.1Min. Mean Max. Min. Mean Max.
F.MutType 0 0.429 1 0 0.711 1F.CovBef 0.0000 0.0716 0.2165 0.000 0.116 0.238F.Depth 0.000 0.283 0.833 0.000 0.330 0.667F.SomeRep 0 0.319 1 0 0.731 1F.AllRep 0 0.306 1 0 0.166 1F.MinPred 0.0000 0.0277 0.2041 0.00000 0.00931 0.02679F.MaxPred 0.0000 0.1631 0.2041 0.00000 0.65850 0.77679F.MinSucc 0.0102 0.0589 0.2041 0.00446 0.12396 0.75893F.MaxSucc 0.0204 0.1718 0.2041 0.01786 0.65450 0.75890F.Events 0.0102 0.0729 0.4388 0.00446 0.59915 0.96429F.MinWith 0.000461 0.057481 0.171350 0.000107 0.038661 0.137178F.MaxWith 0.00322 0.12132 0.17181 0.0666 0.1596 0.1768T.Len 6 12.9 20 3 11.5 20T.Events 3.12 5.02 6.89 3.44 4.34 5.22T.Class 0.556 0.703 0.750 0.763 0.796 0.815T.Meth 0.328 0.457 0.487 0.521 0.569 0.595T.Block 0.361 0.514 0.552 0.420 0.486 0.524T.Line 0.345 0.489 0.525 0.424 0.489 0.525T.Pairs 0.192 0.272 0.336 0.0141 0.0230 0.0286T.Triples 0.0198 0.0337 0.0460 0.0000553 0.0001539 0.0002132
ACM Transactions on Embedded Computing Systems, Vol. 9, No. 4, Article 39, Publication date: March 2010.

39:24 J. Strecker and A. M. Memon
Table VII. Data summary: Cov and DetCrosswordSage
Cov Det Total0 1 Mean 0 1 Mean
ALLFAULTS 1147 1083 0.486 1629 601 0.270 2230POOLCOVFAULTS 101 1083 0.915 583 601 0.508 1184SUITECOVFAULTS 0 1083 1.000 482 601 0.555 1083
FreeMind 0.7.1Cov Det Total
0 1 Mean 0 1 MeanALLFAULTS 506 464 0.478 800 170 0.175 970POOLCOVFAULTS 137 464 0.772 431 170 0.283 601SUITECOVFAULTS 0 464 1.000 294 170 0.366 464
F.MutType, the difference between data sets is greater—0.474 vs. 0.448 for Crossword-Sage, 0.705 vs. 0.759 for FreeMind. Since ALLFAULTS includes all 〈test suite, fault〉pairs, while POOLCOVFAULTS includes just the 〈test suite, fault〉 pairs where the testpool covers the fault—a factor dependent on the fault but not on the test suite—itmakes sense for the test-suite characteristics to stay the same but the fault character-istics to differ.
The third observation is that the mean values of many of the fault characteristicsdiffer noticeably between the POOLCOVFAULTS and the SUITECOVFAULTS data sets.For example, the mean value of F.CovBef is 0.0736 in POOLCOVFAULTS and 0.0716in SUITECOVFAULTS for CrosswordSage, and 0.138 in POOLCOVFAULTS and 0.116in SUITECOVFAULTS for FreeMind. The fourth observation is that the mean valuesof the test-suite characteristics do not seem to differ much, but they sometimes differa little more between POOLCOVFAULTS and SUITECOVFAULTS than between ALL-FAULTS and POOLCOVFAULTS. For example, the mean value of T.Line for Crossword-Sage is 0.484 in ALLFAULTS, 0.483 in POOLCOVFAULTS, and 0.489 in SUITECOV-FAULTS. Since SUITECOVFAULTS includes just the 〈test suite, fault〉 pairs where thetest suite covers the fault—a factor dependent on both the fault and the test suite—itwould make sense for both fault characteristics and test-suite characteristics to differbetween SUITECOVFAULTS and the other data sets.
These observations concern only the apparent differences between the data sets.Whether those differences are statistically meaningful, and whether they are in theexpected direction, will be examined later in this section.
A final observation is that the levels of coverage in this experiment are rather low, byresearch standards if not by industrial standards. Even though each test suite executeseach event in the EFG an average of 3 to 7 times (T.Events), class coverage (T.Class)falls at less than 82% and line coverage (T.Line) at less than 53%. With a few tweaksin test-case generation, coverage could have been improved (e.g., by providing moreinput files or forcing more test cases to open input files), but only at the expense of therandomness and replicability of the test suites. Since fault detection seems to increasesuper-linearly with coverage [Hutchins et al. 1994], different results might be obtainedwith greater coverage levels.
Table VII summarizes the dependent variables, Cov and Det, for each data set, giv-ing the frequency of each value (0 or 1), the mean (proportion of 1 values), and the totalnumber of data points. With each successive data set, from ALLFAULTS to POOLCOV-FAULTS to SUITECOVFAULTS, more data points with Cov = 0 (and therefore Det = 0)are eliminated, so the proportion of Cov and Det grows.
ACM Transactions on Embedded Computing Systems, Vol. 9, No. 4, Article 39, Publication date: March 2010.

Accounting for Defect Characteristics in Evaluations of Testing Techniques 39:25
In the rest of this section, the three data sets are used to test the hypotheses listedin Section 4 by fitting logistic-regression models to them. These hypotheses ask ques-tions about whether any test-suite or fault characteristics affect fault detection. Sec-tions 5.2 and 5.3 directly answer those questions. But first, as a stepping stone towardthose answers, Section 5.1 explores whether test-suite and fault characteristics affectfault coverage. In addition, Section 5.1 explains how to interpret the logistic-regressionmodels.
5.1. What characteristics affect whether a test suite cover s a faulty line?
For this work, understanding the fault and test-suite characteristics that affect cov-erage of faulty lines is not an end in itself. Rather, it assists in understanding thecharacteristics that affect detection of faults.
Because the study of coverage plays only a supporting role in this work, the experi-ment set-up is not ideal for drawing conclusions about coverage. Only a limited sampleof lines of source code is studied—those where faults happened to be seeded—and lineswith more opportunities for fault seeding are more likely to be in the sample. This is athreat to the validity of conclusions drawn about the hypotheses below, but it is not athreat to the validity of the main experiment (i.e., Hypotheses H1–H6 in Section 4).
Hypotheses: This section examines the following null hypotheses for each faultcharacteristic and each test-suite characteristic:
— H7: The fault characteristic does not affect a fault’s likelihood of being covered by atest suite.
— H8: The test-suite characteristic does not affect a fault’s likelihood of being coveredby a test suite.
— H9: No interaction effect between a fault characteristic and a test-suite characteris-tic affects a fault’s likelihood of being covered by a test suite.
(Hypothesis H8 also applies to test-suite characteristics.) These hypotheses correspondto Hypotheses H1, H2, and H5 from Section 4, except that the dependent variable isfault coverage instead of fault detection.
Data sets: Two of the data sets can be used to test these hypotheses: ALLFAULTS
and POOLCOVFAULTS. Each addresses the hypotheses from a different perspective.The POOLCOVFAULTS data set shows what happens only for faults covered by at leastone test case in the test pool. The ALLFAULTS data set shows what happens for faultsregardless of their coverage, but, as a consequence, only considers the one fault char-acteristic that can be measured without coverage data (fault’s method of creation). Forboth data sets, the dependent variable is Cov. The SUITECOVFAULTS data set cannotbe used because it only contains faults where Cov is 1.
To show empirically that a test-suite or fault characteristic affects the likelihood thata test suite covers a fault, at least one metric measuring that characteristic must havea statistically significant relationship to coverage in at least one data set. Consistentresults across metrics for a characteristic and across applications bolster the evidence.
For some metrics, it is obvious even without empirical evidence that they affect cov-erage of faulty lines. The probability of Cov is bound to increase, on average, as T.Class,T.Meth, T.Block, and T.Line increase, and it cannot decrease as T.Events, T.Pairs, andT.Triples increase. Certainly F.CovBef, F.Depth, F.MinPred, and F.MaxPred affect cover-age as well: all faults with a value of 0 for these variables are guaranteed to be covered,since they lie in initialization code that is executed by every test case. For other met-rics, like those measuring the size of event handlers (F.MinWith and F.MaxWith), theirrelationship to coverage can only be discovered by analyzing the data.
ACM Transactions on Embedded Computing Systems, Vol. 9, No. 4, Article 39, Publication date: March 2010.

39:26 J. Strecker and A. M. Memon
Table VIII. Univariate models: ALLFAULTS, CovCrosswordSage FreeMind 0.7.1
Int. Coef. Sig. Int. Coef. Sig.Meth. of creation F.MutType 0.108 -0.349 *** -0.126 0.0558Granularity T.Len -0.0575 -0.0131 -0.0867 -0.00588Size T.Events -0.0574 0.0901 -0.0867 -0.107
Proportion ofcoverage
T.Class -0.0581 2.16 *** -0.0874 12.3 *T.Meth -0.0582 4.28 *** -0.0868 4.85T.Block -0.0582 3.28 *** -0.0869 4.27T.Line -0.0582 3.54 *** -0.0869 4.28T.Pairs -0.0574 1.15 -0.0867 0.265T.Triples -0.0574 2.45 -0.0867 -76.4
Table IX. Univariate models: POOLCOVFAULTS, CovCrosswordSage FreeMind 0.7.1
Int. Coef. Sig. Int. Coef. Sig.Meth. of creation F.MutType 2.84 -0.875 *** 2.50 -1.54 ***Distance frominitial state
F.CovBef 2.48 -14.1 *** 2.93 -43.3 ***F.Depth 2.53 -4.34 *** 1.91 -6.70 ***
RepetitionsF.SomeRep 2.46 -0.255 1.50 -0.361F.AllRep 2.35 0.0888 1.28 -0.30
Degrees offreedom
F.MinPred 2.41 -6.34 *** -1.11 -197 ***F.MaxPred 2.81 13.1 *** 1.25 -1.25 **F.MinSucc 2.37 -1.09 1.23 -0.874 **F.MaxSucc 2.95 21.7 *** 1.24 -1.09 *F.Events 2.90 27.8 *** 1.34 1.99 ***
Size of eventhandlers
F.MinWith 2.62 -18.4 *** 1.24 -6.79 **F.MaxWith 2.62 -14.7 *** 1.33 24.3 ***
Granularity T.Len 2.37 -0.0164 1.22 -0.0205Size T.Events 2.37 -0.0314 1.22 -0.00992
Proportion ofcoverage
T.Class 3.37 19.6 *** 1.25 28.7 ***T.Meth 3.28 36.5 *** 1.23 14.8 *T.Block 3.31 28.1 *** 1.24 12.5 **T.Line 3.30 30.2 *** 1.24 12.7 **T.Pairs 2.37 0.86 1.22 -22.3T.Triples 2.37 -3.83 1.22 -2150
5.1.1. Univariate models. Univariate logistic-regression models (Section 4.3) were fit tothe ALLFAULTS and POOLCOVFAULTS data sets, with Cov as the dependent variable.Tables VIII and IX summarize the univariate models, giving intercepts, coefficients,and significance levels. For example, the first row of Table VIII for CrosswordSagerepresents the model
logit(Pr(Cov)) = 0.108 + −0.349F.MutType.
Metrics with significance levels of “◦”, “*”, “**”, and “***” have p-values less than orequal to 0.1, 0.05, 0.01, and 0.001, respectively. The smaller the p-value, the morelikely it is that the theoretical (true) coefficient value is non-zero and has the samesign as the estimated coefficient. If the p-value is greater than 0.10, the coefficientvalue is considered to be statistically meaningless—it is too likely to be non-zero dueto random variation—and therefore it is ignored in the analysis.
ACM Transactions on Embedded Computing Systems, Vol. 9, No. 4, Article 39, Publication date: March 2010.

Accounting for Defect Characteristics in Evaluations of Testing Techniques 39:27
0.35 0.40 0.45 0.50 0.55
0.40
0.45
0.50
T.Block
Pr(
Cov
)
Fig. 5. Predicted probabilities for CrosswordSage T.Block model in Table VIII
This section alternates between a tutorial on interpreting logistic-regression mod-els and a description of major results, with sub-sections labeled accordingly. Readersfamiliar with logistic-regression analysis may skip the tutorial.
Tutorial. Recall from Section 4.3 that a univariate model shows how much an in-dependent variable (fault or test-suite metric) affects the likelihood of the dependentvariable (Cov), without controlling for any other independent variables.
To understand how to interpret the coefficients in these models, consider T.Block forCrosswordSage in Table VIII. The coefficient, 3.28, means that the odds of Cov are ex-pected to increase by a factor of exp(3.28)∆ when T.Block increases by ∆ (Equation 3).For example, if T.Block increases from 0.4 to 0.5, the odds of covering a given faultyline are expected to increase by a factor of exp(3.28)0.5−0.4 ≈ 1.39. Figure 5 shows howthis translates to probabilities. The plotted curve represents the predicted probabil-ity of Cov across the range of T.Block (similar to Figure 4). (The near-linear shape ofthe curve demonstrates the ability of logistic-regression functions to mimic other func-tions, such as linear functions.) For comparison, the curve is superimposed on a barplot of the sample probabilities of Cov at different levels of T.Block in the ALLFAULTS
data set. (No T.Block values fall between 0.45 and 0.5, so no bar is drawn.) The pre-dicted probability for a particular value of T.Block is found by subtracting the mean ofT.Block for the data set (0.509)—since the models are fit to centered data—to get X ,and then plugging X , the intercept (−0.0582), and the coefficient (3.28) into Equation 2.For instance, for a T.Block value of 0.540, X is 0.540 − 0.509 = 0.031, and the predictedprobability of Cov is exp(−0.0582+3.28∗0.031)/(1+exp(−0.0582+3.28∗0.031)) = 0.511.
For certain metrics—F.MutType, F.SomeRep, and F.AllRep—X can only be 0 or 1. InTable IX for FreeMind, for example, the predicted probability of Cov for method-levelmutation faults (encoded as 1) is exp(2.50+−1.54∗1)/(1+exp(2.50+−1.54∗1)) = 0.724,whereas for class-level mutation faults (encoded as 0) it is exp(2.50 + −1.54 ∗ 0)/(1 +exp(2.50 + −1.54 ∗ 0)) = 0.924.
While it is important to understand how to interpret the magnitude of modelcoefficients—or at least to understand that they do not denote a linear relationshipwith the probability of the dependent variable—the analysis to follow focuses on thesignificance levels, the signs, and occasionally the relative magnitudes of coefficients.
Major results. The univariate models can address Hypotheses H7 and H8, whichasked whether any fault characteristic or test-suite characteristic affects a fault’s like-
ACM Transactions on Embedded Computing Systems, Vol. 9, No. 4, Article 39, Publication date: March 2010.

39:28 J. Strecker and A. M. Memon
Table X. Multivariate models: ALLFAULTS, CovCrosswordSage FreeMind 0.7.1Coef. Sig. Coef. Sig.
Intercept 0.105 -0.0874F.MutType -0.346 ***T.Class 12.3 *T.Block 3.25 ***
Null deviance 3089.6 1342.9Deviance 3056.8 1338.6AIC 3062.8 1342.6Sensitivity 444/1083 = 0.410 395/464 = 0.851Specificity 785/1147 = 0.684 99/506 = 0.196
lihood of being covered by a test suite. (The multivariate models will address Hypoth-esis H9, which concerns interaction effects.) In the univariate models (Tables VIIIand IX), most of the fault characteristics do affect coverage: the fault’s method ofcreation (F.MutType, except for FreeMind in FreeMind’s ALLFAULTS model), its dis-tance from the initial state (F.CovBef and F.Depth), its degrees of freedom in execution(F.MinPred, F.MaxPred, F.MinSucc for FreeMind, F.MaxSucc, and F.Events), and the sizeof its enclosing event handlers (F.MinWith and F.MaxWith). One fault characteristic doesnot affect Cov: the repetitions in which the faulty code is executed (F.SomeRep andF.AllRep). This makes sense because a faulty line only has to be executed once to becovered.
In the univariate models, just one test-suite characteristic affects the likelihood ofcovering a fault: the proportion of the application that the test suite covers (T.Class forall models; T.Meth, T.Block, and T.Line for all but FreeMind’s ALLFAULTS model). Theevent-coverage metrics (T.Pairs and T.Triples), the length of test cases (T.Len), and thesize of the test suite (T.Events) do not significantly affect fault coverage. For the event-coverage metrics, the small range of metric values studied (Tables IV and V) may notbe sufficient to show effects on fault coverage.
In addition to identifying the characteristics that affect fault coverage, it is worthobserving the direction of the effect, indicated by the model coefficients. For the onesignificant test-suite characteristic—proportion of coverage—fault coverage increaseswith a test suite’s proportion of coverage, as expected. For the fault characteristicof distance from the initial state, coefficients are negative for both metrics and bothapplications—meaning that, as expected, faulty lines lying farther from the initialstate are less likely to be covered. For the fault characteristics of degrees of freedomand size of event handlers, the signs of coefficients are inconsistent across metrics andacross applications. For the fault characteristic of method of creation, as measured byF.MutType, the results are the same in three of four models but surprising: class-levelmutation faults are more likely to be covered than method-level mutation faults. Or,put another way, class-level mutation faults were more likely than method-level mu-tation faults to be seeded in code covered by the test pool.
5.1.2. Multivariate models. Multivariate models (Section 4.3.2) were fit to the ALL-FAULTS and POOLCOVFAULTS data sets, again with Cov as the dependent variable.Tables X and XI summarize the multivariate models for the two data sets. For example,the model for CrosswordSage in Table X is
logit(Pr(Cov)) = 0.105 + −0.346F.MutType + 3.25T.Block.
The lower portion of each table lists several measures of goodness of fit (Section 4.3.3).
ACM Transactions on Embedded Computing Systems, Vol. 9, No. 4, Article 39, Publication date: March 2010.

Accounting for Defect Characteristics in Evaluations of Testing Techniques 39:29
Table XI. Multivariate models: POOLCOVFAULTS, CovCrosswordSage FreeMind 0.7.1
Coef. Sig. Coef. Sig.Intercept 10.6 3.19F.MutType -1.16 ***F.CovBef -142 *** -50.9 ***F.MinPred -106 ***F.MaxPred 67.2 ***F.MinWith -13.7 *F.MaxWith -113 ***T.Class 110 ***T.Block -39.6 ***T.Class× F.CovBef -1150 ***T.Block × F.CovBef 2350T.Block × F.MaxPred -1940 ***T.Block × F.MaxWith 3260 ***
Null deviance 690.36 645.22Deviance 58.81 308.82AIC 74.81 322.82Sensitivity 1059/1083 = 0.978 376/464 = 0.810Specificity 100/101 = 0.990 122/137 = 0.891
Recall from Section 4.3.2 that each multivariate model uses the subset of all metricsthat provides the best balance of model fit and parsimony (i.e., the lowest AIC) withoutsevere symptoms of multicolinearity. For each “best” multivariate model, often severalsimilar models are nearly as good; for example, for a model that includes T.Line, modelswith T.Block, T.Meth, or T.Class in its place often have similar AIC values.
Tutorial. Recall from Section 4.3.2 that a multivariate model can be used to assesseach independent variable’s contribution to explaining the dependent variable in thecontext of the other independent variables. An independent variable’s coefficient in amultivariate model shows how much it affects the dependent variable, relative to theother metrics in the model, when the other metrics are held constant.
As with the univariate models, predicted probabilities of the dependent variable,Cov, can be calculated by plugging values for the independent variables into Equa-tion 2. Coefficients should be interpreted relative to other coefficients. For example, inthe model for FreeMind in Table XI, the coefficient of F.MinPred (−106) is almost 8 timesthat of F.MinWith (−13.7). Thus, the model estimates that a change of ∆ in F.MinPredwould increase or decrease the odds of Cov by roughly the same factor that a changeof 8∆ in F.MinWith would, if all other metrics were held constant. For instance, whenF.MinPred increases from 0.01 to 0.02, the odds of Cov are predicted to decrease by afactor of exp(−106)0.01 = 0.346. When F.MinWith increases from 0.01 to 0.09, the odds ofCov are predicted to decrease by roughly the same factor: exp(−13.7)0.08 = 0.334.
Interaction effects in a model can be understood by looking at the signs of their co-efficients or by calculating predicted probabilities. Consider the interaction betweenT.Class and F.CovBef (T.Class × F.CovBef) for FreeMind in Table XI. The positive co-efficient of T.Class and the negative coefficient of F.CovBef imply that the probabilityof Cov generally increases as T.Class increases or F.CovBef decreases. But when thesemetrics have opposite signs in the centered data (i.e., one is above its mean and theother is below its mean in the original data), their product is negative, and this multi-plied by the negative coefficient of T.Class×F.CovBef is positive—boosting the probabil-ity of Cov. Conversely, if T.Class and F.CovBef have the same sign in the centered data,
ACM Transactions on Embedded Computing Systems, Vol. 9, No. 4, Article 39, Publication date: March 2010.

39:30 J. Strecker and A. M. Memon
0.00
0.05
0.10
0.15
0.20
0.25
0.75 0.76 0.77 0.78 0.79 0.80 0.81
0.2 0.4
0.6 0.8
T.Class
F.C
ovB
ef
Fig. 6. Predicted probabilities for FreeMind model in Table XI
the interaction effect diminishes the probability of Cov. To illustrate, the contour plot14
in Figure 6 shows the predicted probabilities at various levels of T.Class and F.CovBefwhen F.MutType is held constant at 0 and F.MinPred and F.MinWith are held constantat their respective means. The basic idea is that test suites with high class coverage(T.Class) are especially good at covering lines at a small distance from the initial state(F.CovBef), and test suites with low class coverage are especially bad at covering linesat a great distance from the initial state.
Major results. The multivariate models can again address Hypotheses H7 andH8—whether any fault characteristic or test-suite characteristic affects a fault’s like-lihood of being covered by a test suite. For both applications, the multivariate models(Tables X and XI) show that, when all other characteristics are held constant, a fault’sdistance from the initial state, a fault’s degrees of freedom, and a test suite’s proportionof coverage all affect fault coverage. A fault’s method of creation also affects fault cover-age in CrosswordSage’s ALLFAULTS model and FreeMind’s POOLCOVFAULTS model.The set of metrics chosen to represent each characteristic in the model is only consis-tent across applications for a fault’s distance from the initial state (F.CovBef).
The multivariate models can also address Hypothesis H9—whether any interactioneffects between a fault characteristic and a test-suite characteristic affect a fault’slikelihood of being covered by a test suite. For FreeMind, the interaction between atest suite’s coverage and a fault’s distance from the initial state (T.Class × F.CovBef)significantly affects coverage. The negative coefficient indicates that test suites thatcover many classes are especially good at covering faults lying closer to the initialstate, while test suites that cover few classes are especially bad at covering such faults(Figure 6). For CrosswordSage, the interaction between a test suite’s coverage anda fault’s degrees of freedom (T.Block × F.MaxPred, T.Block × F.MaxWith) significantlyaffects fault coverage, but the direction of the effect depends on the metric.
CrosswordSage’s ALLFAULTS model contains just one characteristic (test suite’s pro-portion of coverage), since it was the only one significant in the univariate models. But
14Each line of the contour plot represents all values of T.Class and F.CovBef for which the predicted prob-ability of Cov equals the value on the line label. For example, for each point on the uppermost line, thepredicted probability of Cov is 0.20.
ACM Transactions on Embedded Computing Systems, Vol. 9, No. 4, Article 39, Publication date: March 2010.

Accounting for Defect Characteristics in Evaluations of Testing Techniques 39:31
Table XII. Univariate models: ALLFAULTS, DetCrosswordSage FreeMind 0.7.1
Int. Coef. Sig. Int. Coef. Sig.Meth. of creation F.MutType -1.10 0.211 * -1.16 -0.577 **Granularity T.Len -0.997 -0.00597 -1.55 0.0120Size T.Events -1.00 0.230 ** -1.55 0.362
Proportion ofcoverage
T.Class -0.999 1.07 ◦ -1.55 -4.10T.Meth -0.999 2.41 * -1.55 -0.128T.Block -0.999 1.85 * -1.55 0.177T.Line -0.999 2.01 * -1.55 0.154T.Pairs -1.00 5.78 ** -1.55 39.9T.Triples -0.999 23.2 ** -1.55 2520
Table XIII. Univariate models: POOLCOVFAULTS, DetCrosswordSage FreeMind 0.7.1
Int. Coef. Sig. Int. Coef. Sig.Meth. of creation F.MutType -0.209 0.536 *** -0.124 -1.12 ***Distance frominitial state
F.CovBef 0.0296 -6.56 *** -1.10 -12.1 ***F.Depth 0.0305 -1.05 ** -1.12 -3.79 ***
RepetitionsF.SomeRep -0.112 0.444 *** -0.606 -0.445 *F.AllRep -0.131 0.537 *** -1.03 0.532 *
Degrees offreedom
F.MinPred 0.0293 -3.87 ** -3.07 -144 ***F.MaxPred 0.0292 3.76 *** -0.971 -2.00 ***F.MinSucc 0.0304 0.744 -0.935 -0.531F.MaxSucc 0.0202 10.3 *** -0.972 -2.25 ***F.Events 0.0409 7.89 *** -0.953 -0.984 ***
Size of eventhandlers
F.MinWith 0.0293 -8.83 *** -0.965 10.9 ***F.MaxWith 0.0304 0.699 -0.930 -0.209
Granularity T.Len 0.0304 0.00198 -0.931 0.012Size T.Events 0.0305 0.246 * -0.936 0.504 ◦
Proportion ofcoverage
T.Class 0.0303 2.30 ** -0.931 -3.16T.Meth 0.0302 4.89 *** -0.930 1.43T.Block 0.0302 3.70 *** -0.930 1.41T.Line 0.0302 4.01 *** -0.930 1.45T.Pairs 0.0305 7.35 ** -0.934 41.1T.Triples 0.0305 31.0 * -0.932 2450
for the rest of the models, it is a combination of test-suite and fault characteristics thatbest explains fault coverage.
The models for the POOLCOVFAULTS data set fit the data well. For CrosswordSage,the fit is nearly perfect, with sensitivity and specificity at 97.8% and 99.0%. For Free-Mind, the fit is not quite as good, with sensitivity and specificity at 81.0% and 89.1%.The models for the ALLFAULTS data set, having fewer fault metrics to work with, donot fit nearly as well.
5.2. What characteristics affect whether a test suite detec ts a fault?
Considering the widespread use of code coverage as a predictor of fault detection, onemight assume that the same characteristics that affect whether a test suite coversfaulty code would also affect whether a test suite detects a fault. Our results showthat this is not necessarily the case.
ACM Transactions on Embedded Computing Systems, Vol. 9, No. 4, Article 39, Publication date: March 2010.

39:32 J. Strecker and A. M. Memon
Hypotheses: This section examines hypotheses H1, H2, and H5 from Section 4.These hypotheses state that no fault characteristic, test-suite characteristic, or inter-action effect between the two affects a fault’s likelihood of being detected by a testsuite.
Data sets: To test these hypotheses, the same data sets as in the previous sectioncan be used: ALLFAULTS and POOLCOVFAULTS. The dependent variable now is Detinstead of Cov.
5.2.1. Univariate models. Tables XII and XIII summarize the univariate models of Detfor the two data sets.
In all of these models, all of the fault characteristics affect fault detection. This in-cludes all of the fault characteristics that affected fault coverage (Tables VIII and IX),as well as repetitions in execution (F.SomeRep and F.AllRep). For FreeMind’s ALL-FAULTS model, a fault’s method of creation affects its likelihood of detection but notits likelihood of coverage.
For CrosswordSage, two of the three test-suite characteristics affect fault detection:size and proportion of coverage. Size and the event-coverage metrics for proportionof coverage (T.Pairs and T.Triples) both affect fault detection without affecting faultcoverage. For FreeMind, the only characteristic that is near significant is proportionof coverage (T.Events in the POOLCOVFAULTS model). For neither application doesgranularity affect fault detection; the same was true for fault coverage.
For most test-suite and fault characteristics that affected fault coverage as well asfault detection—fault’s distance from the initial state, fault’s degrees of freedom, fault’ssize of event handlers, test suite’s proportion of coverage—the direction of coefficientsis the same as before: either consistent with expectations (e.g., fault’s distance fromthe initial state) or inconsistent among metrics and applications (e.g., fault’s degreesof freedom). For the fault characteristic of repetitions in execution, the coefficient di-rection could be expected to go either way—faulty code inside a loop could be executedin more states (higher detection), but it could fail only in a few states (lower detec-tion). In three of the four cases here, it leads to higher detection, while in the othercase (F.SomeRep in FreeMind’s POOLCOVFAULTS model) it leads to lower detection.Interestingly, for CrosswordSage, the fault characteristic of method of creation hasopposing effects on fault coverage and fault detection: class-level mutation faults aremore likely to be covered but less likely to be detected.
To see whether metrics have a stronger effect on fault detection or fault coverage,the confidence intervals of significant coefficients in the models of fault detection (Ta-bles XII and XIII) can be compared to those in the models of fault coverage (Tables VIIIand IX).15 For CrosswordSage’s ALLFAULTS models, only the difference in coefficientsfor F.MutType (opposite signs) is meaningful. For FreeMind’s ALLFAULTS models, nometrics were significant in both. For both applications’ POOLCOVFAULTS models, mostof the differences in coefficients are statistically meaningful. (Exceptions are F.MinPredfor CrosswordSage and F.MutType, F.MinPred, and F.MaxPred for FreeMind.) Thus, forexample, a fault’s distance from the initial state, as measured by either F.CovBef orF.Depth, has a stronger effect on fault coverage than on fault detection.
5.2.2. Multivariate models. Tables XIV and XV summarize the multivariate models ofDet for the two data sets.
15Differences in coefficient magnitudes are meaningful only if both coefficients are statistically significantand their confidence intervals do not overlap. (A sufficient condition is that the coefficients have oppositesigns.) The 95% Wald confidence interval for a coefficient βi is βi ± 1.96SE, where SE is the standard errorfor βi. [Agresti 2007]
ACM Transactions on Embedded Computing Systems, Vol. 9, No. 4, Article 39, Publication date: March 2010.

Accounting for Defect Characteristics in Evaluations of Testing Techniques 39:33
Table XIV. Multivariate models: ALLFAULTS, DetCrosswordSage FreeMind 0.7.1Coef. Sig. Coef. Sig.
Intercept -1.11 -1.16F.MutType 0.213 * -0.577 **T.Line 0.363 *T.Pairs 5.82 **T.Line× F.MutType 3.22
Null deviance 2599.1 900.40Deviance 2580.2 889.91AIC 2590.2 893.91Sensitivity 296/601 = 0.493 68/170 = 0.400Specificity 974/1629 = 0.598 582/800 = 0.728
Table XV. Multivariate models: POOLCOVFAULTS, DetCrosswordSage FreeMind 0.7.1Coef. Sig. Coef. Sig.
Intercept -0.561 -1.24F.MutType 0.910 *** -0.711 ***F.CovBef -15.4 *** -7.68 ***F.AllRep 0.387 ***F.MinPred -49.9 ***F.MaxSucc 11.7 ***F.MinWith -8.94 ***T.Events 0.506 ◦T.Line 5.17 ***T.Pairs 9.02 **T.Line × F.MutType 4.93 **T.Line × F.CovBef 95.2 *T.Line × F.MaxSucc -109 ***T.Line × F.MinWith 150 ***T.Pairs × F.CovBef 235 **
Null deviance 1641.1 715.95Deviance 1398.1 588.07AIC 1424.1 598.07Sensitivity 428/601 = 0.712 102/170 = 0.600Specificity 399/583 = 0.684 352/431 = 0.817
The multivariate models show that, when all other characteristics are held constant,all of the fault characteristics studied can affect fault detection. So can a test suite’sproportion of coverage (CrosswordSage only) and perhaps size (FreeMind’s POOLCOV-FAULTS only). Test-suite size is significant in CrosswordSage’s univariate models butnot chosen for its multivariate models, indicating that it does not explain any faultdetection that is not already explained by a test suite’s proportion of coverage.
Significant interaction effects appear only in CrosswordSage’s POOLCOVFAULTS
model. As in CrosswordSage’s POOLCOVFAULTS model of fault coverage (Table XI),interactions between a test suite’s proportion of coverage and a fault’s size of eventhandlers, and between proportion of coverage and a fault’s degrees of freedom, affectfault detection. So do interactions between proportion of coverage and a fault’s method
ACM Transactions on Embedded Computing Systems, Vol. 9, No. 4, Article 39, Publication date: March 2010.

39:34 J. Strecker and A. M. Memon
of creation, and between proportion of coverage and a fault’s distance from the initialstate.
Once again, for most of the models and data sets, it is a combination of test-suiteand fault characteristics that best explains fault detection.
As with fault coverage (Tables X and XI), the models of fault detection for the POOL-COVFAULTS data set fit the data better than the models for the ALLFAULTS data set,since more fault metrics are considered. But, whereas the models of fault coverage forPOOLCOVFAULTS had sensitivity and specificity of 0.810–0.990, the models of faultdetection for POOLCOVFAULTS do not fit as well. Thus, while the set of characteristicsin POOLCOVFAULTS is nearly sufficient to explain coverage of faulty lines, it is notsufficient to explain detection of faults.
5.3. What characteristics affect whether a test suite detec ts a fault, given that the test suitecovers the faulty line?
The previous section asked: What characteristics affect whether a test suite detectsa fault? Some of those characteristics might affect the probability that a fault is de-tected primarily because they affect the probability that the faulty code is covered. Forexample, some faults may be harder to detect simply because they lie in a part of theprogram that is harder to cover. But other faults may be harder to detect even if codecontaining them is covered, which is why it is necessary to ask the question for thissection.
Hypotheses: This section examines hypotheses H3, H4, and H6 from Section 4.These hypotheses state that no fault characteristic, test-suite characteristic, or inter-action effect between the two affects a fault’s likelihood of being detected by a testsuite, given that the fault is covered by the test suite.
Data sets: To test these hypotheses, we use the SUITECOVFAULTS data set. Thisdata set consists of the POOLCOVFAULTS data set minus any data points where thetest suite does not cover the fault (Cov = 0). Thus, SUITECOVFAULTS is ideal for un-derstanding the conditional probability that a test suite detects a fault given that itcovers the faulty line. The dependent variable of interest is Det.
5.3.1. Univariate models. Table XVI summarizes the univariate models of Det givenCov.
The set of characteristics that significantly affects fault detection given coverage forat least one application is the same as the set that affected fault detection (Tables XIIand XIII) and a superset of the set that affected fault coverage (Tables VIII and X).Specifically, every fault characteristic and the test-suite characteristics of size and pro-portion of coverage affect fault detection given coverage. For CrosswordSage, the code-coverage metrics for proportion of coverage behave differently than the event-coveragemetrics (T.Pairs and T.Triples): while the code-coverage metrics affect fault detectionprimarily because they affect fault coverage (as shown by their absence in Crossword-Sage’s SUITECOVFAULTS model), the event-coverage metrics affect fault detection yetdo not affect fault coverage.
For all statistically significant metrics, the sign of their coefficients is the same asin the models of fault detection (Tables XII and XIII). To see whether metrics morestrongly affect fault detection or fault detection given coverage, the confidence inter-vals surrounding model coefficients can again be compared, as in Section 5.2. The onlymetrics for which the difference is meaningful turn out to be F.MaxSucc for Crossword-Sage and F.CovBef and F.Depth for FreeMind (which have a stronger effect on Det) andF.Events for FreeMind (which has a stronger effect on Det given Cov).
5.3.2. Multivariate models. Table XVII summarizes the multivariate models.
ACM Transactions on Embedded Computing Systems, Vol. 9, No. 4, Article 39, Publication date: March 2010.

Accounting for Defect Characteristics in Evaluations of Testing Techniques 39:35
Table XVI. Univariate models: SUITECOVFAULTS, DetCrosswordSage FreeMind 0.7.1
Int. Coef. Sig. Int. Coef. Sig.Meth. of creation F.MutType -0.104 0.778 *** 0.0299 -0.834 ***Distance frominitial state
F.CovBef 0.221 -3.94 * -0.596 -9.03 ***F.Depth 0.221 -0.251 -0.607 -2.74 ***
RepetitionsF.SomeRep 0.0488 0.554 *** -0.274 -0.380 ◦F.AllRep 0.0479 0.582 *** -0.682 0.760 **
Degrees offreedom
F.MinPred 0.221 -2.70 ◦ -0.602 -116 ***F.MaxPred 0.221 1.25 -0.563 -1.90 ***F.MinSucc 0.221 1.08 -0.548 -0.256F.MaxSucc 0.223 6.72 *** -0.564 -2.30 ***F.Events 0.229 5.54 *** -0.586 -2.05 ***
Size of eventhandlers
F.MinWith 0.223 -6.16 *** -0.568 15.1 ***F.MaxWith 0.222 2.69 ** -0.555 -10.3 **
Granularity T.Len 0.221 0.00537 -0.549 0.021Size T.Events 0.222 0.273 * -0.553 0.583 *
Proportion ofcoverage
T.Class 0.221 -0.814 -0.551 -17.4 ◦T.Meth 0.221 -1.12 -0.548 -4.29T.Block 0.221 -0.846 -0.548 -3.40T.Line 0.221 -0.891 -0.548 -3.44T.Pairs 0.222 7.92 ** -0.552 54.3 ◦T.Triples 0.222 34.8 * -0.55 3540
Table XVII. Multivariate models: SUITECOVFAULTS, DetCrosswordSage FreeMind 0.7.1
Coef. Sig. Coef. Sig.Intercept -0.310 -0.395F.MutType 0.940 *** -0.472 ***F.CovBef -11.062 ***F.Depth -1.552F.AllRep 0.503 ** 0.669 ***F.MinPred -53.810 ***F.MaxSucc 5.328 ***F.MinWith -7.275 ***F.MaxWith -15.226 ***T.Class -20.190 ◦T.Pairs 8.806 ** 90.017 *T.Pairs × F.CovBef 173.314 ◦
Null deviance 1488.3 609.7Deviance 1365.9 526.4AIC 1381.9 542.4Sensitivity 393/601 = 0.654 105/170 = 0.618Specificity 312/482 = 0.647 222/294 = 0.755
ACM Transactions on Embedded Computing Systems, Vol. 9, No. 4, Article 39, Publication date: March 2010.

39:36 J. Strecker and A. M. Memon
The multivariate models show that, when all other characteristics are held constant,every fault characteristic studied can still affect fault detection given coverage. Of thetest-suite characteristics, proportion of coverage affects fault detection given coverage,but size does not. (As in the models of fault detection, test-suite size does not giveany information about fault detection given coverage that is not already provided byproportion of coverage.)
The only interaction effect in these models is between a test suite’s proportion ofcoverage and a fault’s distance from the initial state for CrosswordSage.
CrosswordSage’s model of fault detection given coverage fits the data slightly worsethan its model of fault detection for POOLCOVFAULTS (Table XV), based on a compar-ison of sensitivity and specificity. FreeMind’s model of fault detection given coveragehas better sensitivity than its model of fault detection for POOLCOVFAULTS, but thespecificity and the total percentage of data points correctly classified are lower (70.5%vs. 75.5%). Thus, FreeMind’s model of fault detection given coverage also fits the dataslightly worse than its model of fault detection for POOLCOVFAULTS.
6. DISCUSSION
Sections 6.1, 6.2, and 6.3 sum up the effects of faults characteristics, test-suite char-acteristics, and interactions between them on coverage and fault detection. In Sec-tion 6.4, implications of the fit of the logistic-regression models are considered. Sec-tion 6.5 discusses differences in the results for CrosswordSage and FreeMind. Finally,Section 6.6 considers threats to validity.
6.1. Fault characteristics
Every fault characteristic, and every fault metric but F.MinSucc, turned out to signifi-cantly affect the likelihood of fault detection in at least one logistic-regression model.Furthermore, there were some cases where the likelihood of fault detection dependedonly on fault characteristics, not on test-suite characteristics (i.e., the models for Free-Mind in Tables XII and XIV). These facts suggest that the kinds of faults used to eval-uate the effectiveness of testing techniques can significantly impact the percentage offaults they detect.
The characteristics provide a fairly orthogonal classification of faults for studies offault detection, as most or all fault characteristics were represented in each multivari-ate model of fault detection. The rest of this section considers each characteristic inturn.
6.1.1. Method of creation. F.MutType had a different effect on fault detection for the twoapplications. For CrosswordSage, method-level mutation faults were easier to detect,while for FreeMind, class-level mutation faults were easier. Strangely, for both appli-cations class-level mutation faults were easier to cover. The hypothesis from prelim-inary work [Strecker and Memon 2008] was only that class-level mutation faults inclass-variable declarations/initializations would be easier to detect, and such faultswere omitted from this experiment. That F.MutType makes a difference in Cov andDet seems to be a quirk of the way CrosswordSage and FreeMind are structured—inproviding opportunities to seed mutation faults—not an inherent difference betweenclass- and method-level mutation faults. But it is something for experimenters to beaware of.
6.1.2. Distance from initial state. F.CovBef and F.Depth behaved just as expected: faultslying “closer” to the initial state were easier to cover and detect. Interestingly, thesefaults were easier to detect even given that they had been covered.
ACM Transactions on Embedded Computing Systems, Vol. 9, No. 4, Article 39, Publication date: March 2010.

Accounting for Defect Characteristics in Evaluations of Testing Techniques 39:37
6.1.3. Frequency of execution. F.AllRep and F.SomeRep significantly affected fault detec-tion, although the direction of that effect was mixed. Faulty lines that, when executedby an event, were only sometimes executed more than once (F.SomeRep = 1) wereeasier to detect for CrosswordSage but harder for FreeMind. Faulty lines that, whenexecuted, were always executed more than once (F.AllRep = 1) were easier to detectfor both applications. Since F.AllRep was chosen over F.SomeRep for the multivariatemodels, its effect on fault detection was not only more consistent but also more impor-tant.
6.1.4. Degrees of freedom. It was not clear at the outset which measures of degreesof freedom in execution of a faulty line—F.MinPred, F.MaxPred, F.MinSucc, F.MaxSucc,or F.Events—would be most closely associated with fault detection. Nor was it clearwhether faults in code with more degrees of freedom—code that could be executedin many different contexts—would be easier or harder to cover and detect. For Free-Mind, the minimum number of EFG predecessors of a faulty event (F.MinPred) turnedout to be the most influential of these metrics, having been selected for each multi-variate model of Det and of Det given Cov (Tables XV and XVII). Faulty code withfewer EFG predecessors—fewer degrees of freedom—was consistently more likely tobe covered and detected for both applications. For CrosswordSage, F.MaxSucc was themetric chosen to represent the degrees-of-freedom characteristic in the multivariatemodels of Det and of Det given Cov (Tables XV and XVII). In contrast to the resultsfor F.MinPred, faulty code with more EFG successors—more degrees of freedom—wasconsistently more likely to be detected.
6.1.5. Size of event handlers. The size of event handlers executing a faulty line couldeither be measured by the minimum or the maximum number of lines executed in thesame event (F.MinWith or F.MaxWith). For CrosswordSage, F.MinWith was the better pre-dictor of fault detection, with faults in larger event handlers being harder to detect.For FreeMind, the results are inconsistent. In the univariate models of the SUITECOV-FAULTS data set, for example, event handlers with a larger F.MinWith are associatedwith greater fault detection, but event handlers with a larger F.MaxWith are associatedwith less fault detection.
6.2. Test-suite characteristics
6.2.1. Proportion of coverage. The code-coverage metrics—T.Class, T.Meth, T.Block, andT.Line—were, of course, associated with the probability of covering a given faulty line.Interestingly, greater coverage did not necessarily increase the likelihood of detectinga given fault—at least for the range of coverage levels considered in this experiment(see tables in Section 4). For FreeMind, in fact, code coverage seemed to add no statis-tically significant value to testing. Had a broader range of code coverage levels beenstudied, however, code coverage would almost certainly have been shown to increasethe likelihood of fault detection significantly.
The event-coverage metrics—T.Pairs and T.Triples—behaved in nearly the oppositefashion. While they did not increase the likelihood of covering a given faulty line, theydid (for CrosswordSage and sometimes for FreeMind) significantly increase the likeli-hood of detecting a given fault.
6.2.2. Size. As expected, test suites with a greater size (T.Events) were more likely todetect a given fault. (They were not any more likely to cover a given faulty line.) Animportant question in studies of test-suite characteristics is whether code coverage stillaffects fault detection when test-suite size is controlled for. In this study, the only casewhere test-suite size influenced fault detection more than coverage (i.e., when T.Events
ACM Transactions on Embedded Computing Systems, Vol. 9, No. 4, Article 39, Publication date: March 2010.

39:38 J. Strecker and A. M. Memon
was chosen for a multivariate model) was in the model for FreeMind in Table XV, inwhich no coverage metrics were significant at all.
6.2.3. Granularity. Contrary to previous experiments [Rothermel et al. 2004; Xie andMemon 2006], granularity (T.Len) had no effect whatsoever on coverage or detection. Inthis experiment, the minimum test-case length was equal to the depth of the EFG. Inthe previous experiment on GUI testing [Xie and Memon 2006], shorter test cases wereallowed. Thus, test-case length appears to only affect fault detection to the extent thathigher-granularity test suites reach deeper into the EFG; once the granularity exceedsthe EFG depth, no further benefit is gained.
6.3. Interactions between test-suite and fault characteri stics
Interaction effects between test-suite and fault characteristics indicate cases wherecertain kinds of test suites are better at detecting certain kinds of faults. In practice,this information may be used to design test suites that target kinds of faults that tendto be more prevalent or more severe. Interaction effects can also influence the results ofevaluations of testing techniques because, if certain techniques are better at detectingcertain kinds of faults, the sample of faults may be biased for or against a technique.
Only for CrosswordSage did interactions between test-suite and fault characteris-tics significantly affect fault detection. For the POOLCOVFAULTS data set (Table XV),method-level mutation faults (F.MutType = 1), faults lying farther from the initialstate (higher F.CovBef), and faults lying in larger event handlers (higher F.MinWith)were better targeted by test suites with greater line coverage (T.Line). Both for thatdata set and for the SUITECOVFAULTS data set (Table XVII), faults lying farther fromthe initial state (higher F.CovBef) were also better targeted by test suites with greaterevent-pair coverage (T.Pairs).
6.4. Model fit
The multivariate models of Cov for the POOLCOVFAULTS data set (Table XI) fit thedata well, with sensitivity and specificity between 81% and 99%. For CrosswordSage,the fit was nearly perfect. This suggests that the set of metrics studied is nearly suffi-cient to predict whether a test suite will cover a given line—a prerequisite to predictingwhether the suite will detect a fault in the line. But, at least for applications like Free-Mind, some influential test-suite or fault metrics remain to be identified, as part offuture work.
The multivariate models of Det for the POOLCOVFAULTS data set (Table XV) and ofDet given Cov for the SUITECOVFAULTS data set (Table XVII) did not fit as well, withsensitivity and specificity between 60% and 82%. This shows that predicting whethera test suite will detect a fault is harder than predicting whether the test suite coversthe faulty code; more factors are at work.
Finally, the multivariate models of Cov and Det for the POOLCOVFAULTS data set,which includes all fault characteristics, fit much better than those for the ALLFAULTS
data set, which includes just one fault characteristic (F.MutType). This provides addi-tional evidence that at least some of the fault characteristics studied besides F.MutTypeare important predictors of fault coverage and detection.
Naturally, the fit of the multivariate models differed for different data sets. Whenmore fault metrics were available as independent variables—in the POOLCOVFAULTS
and SUITECOVFAULTS data sets, as opposed to the ALLFAULTS data set—the models,not surprisingly, fit better. The models also fit better when the dependent variable wasCov than when the dependent variable was Det (a variable influenced by Cov), andbetter when the dependent variable was Det than when it was Det given Cov (a variablenot influenced by Cov). One reason is that some of the characteristics studied—e.g.,
ACM Transactions on Embedded Computing Systems, Vol. 9, No. 4, Article 39, Publication date: March 2010.

Accounting for Defect Characteristics in Evaluations of Testing Techniques 39:39
fault’s distance from initial state and test suite’s code coverage—are inherently morerelated to fault coverage than to fault detection. (Empirically, this is shown by thelarger coefficient magnitudes in Table IX than in Table XIII for distance from initialstate (both applications) and code coverage (CrosswordSage only).) Another reasonmay be that fault detection is inherently harder to predict than fault coverage, beinga product of more variables.
The fit of the multivariate models differed also between the two applications. Themodels of Cov fit the data for CrosswordSage somewhat better, while the models ofDet and of Det given Cov fit the data for FreeMind somewhat better (based on the per-centage of data points correctly classified). The largest difference, and the only casewhere both sensitivity and specificity are greater for one application than for another,is the models of Cov for the POOLCOVFAULTS data set (Table XI). The model for Cross-wordSage may fit markedly better in this case because of some additional, unknowntest-suite or fault characteristics affecting coverage for FreeMind, which is the largerand more complex of the two applications.
Even though the set of fault and test-suite characteristics studied did not result inperfectly-fitting models, the experiment results are still of value. While the character-istics studied do not comprise a complete list of factors that influence fault detection insoftware testing, they are certainly some of the factors that empirical studies of testingshould account for.
6.5. Differences between applications
There were numerous minor differences between the results for CrosswordSage andFreeMind—cases where the significance, magnitude, or even the direction of a metric’sinfluence on coverage or fault detection differed for the two applications. But there wasonly one metric, mutation type (F.MutType), that was influential enough to be includedin the multivariate models yet influenced fault detection in opposite ways for the twoapplications. For CrosswordSage, method-level mutation faults were consistently morelikely to be detected (even though they were less likely to be covered). For FreeMind,method-level mutation faults were less likely to be detected. The proportion of faultsthat were method-level mutations also differed widely between the applications: 47%for CrosswordSage and 70% for FreeMind.
These differences seem to result from the structure of the applications and the na-ture of the test oracle, with FreeMind having more opportunities to seed method-levelmutation faults and with those opportunities lying in code that is less likely to af-fect the GUI state (as checked by GUITAR). For example, FreeMind contains a methodcalled ccw that helps calculate the coordinates of an object in the GUI. Since the test or-acle ignored the coordinates of GUI objects, faults in ccw were unlikely to be detected ifthey only changed the calculated coordinate values. And since ccw mainly operates onprimitive types, nearly all of the mutation opportunities were for method-level faults.Thus, in the experiment, all 21 of the faults sampled from ccw were method-level mu-tations, and only 2 were detected by their corresponding test suite.
Another notable difference between the applications was in the total percentage offaults covered and detected in each data set (Table VII). Even though the percentage ofall faults covered was nearly the same (49% for CrosswordSage, 48% for FreeMind), thepercentage of faults detected was lower for FreeMind in every data set. This suggestsat least one of the following explanations:
(1) the sample of faults selected for FreeMind, out of the population of mutation faultsfor that application, happened to be especially hard to detect;
(2) the structure of FreeMind makes it harder to detect randomly seeded faults; or
ACM Transactions on Embedded Computing Systems, Vol. 9, No. 4, Article 39, Publication date: March 2010.
39:40 J. Strecker and A. M. Memon
(3) event-coverage-adequate GUI test suites are less effective for FreeMind than forCrosswordSage.
The experiment offers some evidence of the second explanation (e.g., the mean valueof F.CovBef is greater for FreeMind), but the other explanations cannot be ruled out.Further investigation is a subject for future work.
6.6. Threats to validity
Four kinds of threats to validity are possible for this experiment.Threats to internal validity are possible alternative causes for experiment results.
Since one aim of the experiment was to identify characteristics of faults that makethem easier or harder to detect, threats to internal validity here would cause certainkinds of faults to seem easier or harder to detect when in fact they are not. For exam-ple, it could be that faults seeded nearer to the initial state of the program happenedto be easier for reasons independent of their location in the program. But, becausefaults were seeded objectively and randomly, there is no reason to suspect that this isthe case. The faults considered in this work are those that can be mapped to “piecesof code.” It should be noted that faults are often more complex and involve not justsingle (presumably contiguous) “pieces” of code but also interactions between pieces ofcode [Frankl et al. 1998]. Furthermore, studying Cov separately from Det (Section 5.1)helped to nullify one potential threat to validity: that class-level mutation faults ap-peared to be significantly easier to cover, even though this is not an inherent propertyof such faults. Because only two applications were studied, and each had different re-sults, some of those inconsistent results may have arisen by chance or through quirksof one or the other of the applications.
Threats to construct validity are discrepancies between the concepts intended to bemeasured and the actual measures used. The experiment studied metrics of faults andtest suites that were intended to measure some more abstract characteristics (Table I).These characteristics could have been measured in other ways. Indeed, if static analy-sis had been feasible for the applications studied, then it would have been a better wayto measure certain fault metrics than using estimates based on the test pool. How-ever, because care was taken to define the metrics such that they would not depend toomuch on the test pool (e.g., by using minima and maxima rather than averages), andbecause the test pool was much larger than any test suite, the authors contend thatthe threats to validity posed by these estimates are not severe.
Threats to conclusion validity are problems with the way statistics are used. Becausethe experiment was designed to meet the requirements of logistic regression, it doesnot violate any of those requirements. The only known threat to conclusion validity isthe sample size. While it is not recommended that the sample size or power be cal-culated retrospectively from the experiment data [Lenth 2000], the required theoreti-cal sample size would probably be very large because so many independent variableswere used. (Sample sizes calculated from the experiment data for use in for futureexperiments are presented by Strecker [Strecker 2009].) The sample size for this ex-periment was chosen not to achieve some desired level of power but to generate asmany data points as possible in a reasonable amount of time and then perform an ex-ploratory analysis, focusing on the fault characteristics. Since the fault characteristicsfrequently showed up as statistically significant, the sample size apparently served itspurpose.
Threats to external validity limit the generalizability of experiment results. Any em-pirical study must suffer from these threats to some degree because only a limitedsample of all possible objects of study (here, software, faults, and test suites) can beconsidered. In this experiment, only two GUI-intensive applications, mutation faults,
ACM Transactions on Embedded Computing Systems, Vol. 9, No. 4, Article 39, Publication date: March 2010.
Accounting for Defect Characteristics in Evaluations of Testing Techniques 39:41
and event-coverage-adequate GUI test suites (with line and block coverage around50%) containing test cases of equal length were studied; different results might be ob-tained for different objects of study. Besides the limitations of the objects of study, theexperiment is also unrealistic in that some of the faults are trivial to detect (they causea major failure for every test case) and in real life would likely be eliminated beforethe system-testing phase. However, it is crucial to note that this experiment is moregeneralizable in one respect than most other studies of software testing. This workcharacterized the faults used in the experiment, and it presented the results in termsof those characteristics, to make clear what impact the particular sample of faults hadon the results. The same was done for test suites and their characteristics. This workcan serve as a model to help other researchers improve the external validity of theirexperiments.
7. CONCLUSIONS
The experiment in this work tested hypotheses about faults in GUI testing. It showedthat, in the context studied, certain kinds of faults were consistently harder to detect:
— faults in code that lies further from the initial program state (“deep faults”),— faults in code that is not always executed more than once by an event handler, and— faults in event handlers with more predecessors (in-edges) in the event-flow graph.
These results have implications for stake-holders in GUI testing. First, the resultsprovide a picture of the faults most likely to go undetected. For users of GUI testing,this gives valuable information about reliability. (For example, deep faults are morelikely to survive testing, but they may also be less likely to affect users of the software;therefore, additional effort to target them may not be warranted.) For researchers,understanding the faults often missed by GUI testing can guide the development ofnew testing techniques. The second implication is that the results suggest ways totarget harder-to-detect faults. They show that these faults are more likely to reside incertain parts of the code (e.g., event handlers with more predecessors), so testers canfocus on these parts. They also show that increasing the line coverage or event-paircoverage of GUI test suites may boost detection of deep faults.
The experiment also tested hypotheses about GUI test suites, with several surpris-ing results. Test suites with modestly greater code coverage (line, block, method, orclass) did not necessarily detect more faults. Test suites with greater event-pair andevent-triple coverage were not more likely to execute faulty code, yet they sometimeswere more likely to detect faults; evidently, these suites executed more different pathswithin the covered portion of the code. Test-case granularity did not affect fault detec-tion.
While results like these may interest the GUI-testing community, the experimenthas broader implications. It shows that fault characteristics can be accounted for whenevaluating testing techniques—using the experiment architecture presented here—and they should be accounted for because they can impact the results. It is imperativethat evaluations of testing techniques be as accurate and effective as possible. Effec-tive evaluations can convince practitioners that a new technique is worth adopting, orprevent them from wasting resources if it is not. Effective evaluations can illuminatethe strengths and weaknesses of different, possibly complementary, techniques. Theycan even direct the invention of new techniques. Only if evaluations of testing tech-niques account for fault characteristics can they satisfactorily explain and predict theperformance of testing techniques.
To account for fault characteristics in this experiment, a new fault characterizationwas proposed. Unlike previous attempts to characterize faults, this work used charac-teristics that are objective, practical to measure, and—as the experiment shows—can
ACM Transactions on Embedded Computing Systems, Vol. 9, No. 4, Article 39, Publication date: March 2010.

39:42 J. Strecker and A. M. Memon
significantly affect faults’ susceptibility to detection. While the characterization hereis not intended to be complete or definitive, it is an important first step from whichfurther progress can be made.
8. FUTURE WORK
The experiment, the experiment architecture, and the fault characterization can allbe improved upon in future work. The experiment should be replicated in differ-ent contexts, and replications should study different test-suite and fault metrics. Tolend external validity to the experiment results on GUI testing, the experiment shouldbe replicated with different GUI-based applications. One weakness of this experimentwas that it explored only a narrow range of test-suite coverage criteria; there are manyother code coverage measures (e.g. decision, condition, def-use) that might be betterpredictors than block and line coverage; future work will need to incorporate thesecriteria into the study. Moreover, a different strategy for GUI-test-suite generation,such as augmenting automatically-generated test suites with manually-generated testcases, could be used. In terms of seeded faults, we have performed coarse-grained anal-ysis by examining only class and method-level mutants; to provide finer-grained anal-ysis, in future work, we intend to model mutation operators as characteristics of faults.
To lend even broader external validity to the experiment, it should be replicatedin domains other than GUI testing and with faults other than one-line mutations.Especially interesting would be natural faults made by programmers. To make thispossible, analogues of the GUI-testing-specific metrics used in this experiment willneed to be found for other testing domains. One metric, test-case length, already hasan analogue: test granularity. For other metrics based on GUI events and the event-flow graph, function calls or “test grains” [Rothermel et al. 2004] might be substitutedfor events. A different graph representation, such as the control-flow graph, might besubstituted for the event-flow graph.
The assumption that faults affect just one line of code will also need to be relaxed.This should be straightforward. For example, “coverage of the line containing a fault”could be generalized to “coverage of all the lines altered by a fault”.
The experiment architecture should be enhanced and validated. It should beextended to account for program characteristics as well as test-suite and fault charac-teristics. One solution seems to be to look at 〈test suite, fault, program〉 triples ratherthan 〈test suite, fault〉 pairs. But the solution is not so straightforward: the fundamen-tal rule of logistic regression—independent data points—would dictate that each 〈testsuite, fault, program〉 tuple must refer to a different program. Clearly, a better way toaccount for program characteristics is needed.
Instantiations or variations of the experiment architecture could be developed toperform experiments more efficiently, requiring fewer test cases or fewer faults. Forexample, a factorial design may be more appropriate in some situations than this ex-periment’s method of randomly generating data points. For efficiency, goodness of fit,and ease of interpreting results, alternatives to logistic-regression analysis, such asdecision trees or Bayesian networks, may be tried.
In some cases, it may be more interesting to study test cases than test suites. Avariation of the experiment architecture could be developed that replaces test suiteswith test cases. Since a single test case would not usually be expected to exercise all ofthe software under test, restrictions might be placed on the faults that may be pairedwith a test case. Last but not least, the experiment architecture should be validatedby using it in evaluations of testing techniques conducted by people other than theauthors.
The fault characterization should be expanded and refined. Additional relevantcharacteristics should be identified to more fully explain faults’ susceptibility to detec-
ACM Transactions on Embedded Computing Systems, Vol. 9, No. 4, Article 39, Publication date: March 2010.

Accounting for Defect Characteristics in Evaluations of Testing Techniques 39:43
tion. Even better, an underlying theory of fault types in software testing—rather thana somewhat ad hoc list of characteristics—should be developed.
The characterization could be made even more applicable to practice by incorpo-rating fault severity. Although severity is highly subjective, perhaps one or more faultcharacteristics (such as the distance of faulty code from the initial program state) couldapproximate it. Characteristics of the failures caused by a fault should be identifiedand studied. These may help explain faults’ susceptibility to detection in ways thatstatic fault characteristics cannot, and they may also establish a connection to faultseverity.
Eventually, the fault characterization, as well as test-suite and software characteri-zations, should mature to the point where these characteristics can accurately predictwhether a given kind of fault in an application will be detected by a given test suite.The more accurate those predictions are, the more effective evaluations of testing tech-niques can be.
ACKNOWLEDGMENTS
We would like to thank the anonymous reviewers for all of their feedback, insights and comments on thispaper. Bao Nguyen helped to create the GUI example of Section 2.1.
REFERENCES
AGRESTI, A. 2007. An introduction to categorical data analysis second Ed. John Wiley & Sons, Inc.
AMMANN, P. AND OFFUTT, J. 2008. Introduction to Software Testing. Cambridge University Press, NewYork, NY, USA.
ANDREWS, J. H., BRIAND, L. C., LABICHE, Y., AND NAMIN, A. S. 2006. Using mutation analysis for as-sessing and comparing testing coverage criteria. IEEE Trans. Softw. Eng. 32, 8, 608–624.
BASILI, V. R. AND SELBY, R. W. 1987. Comparing the effectiveness of software testing strategies. IEEETrans. Softw. Eng. 13, 12, 1278–1296.
BASILI, V. R., SHULL, F., AND LANUBILE, F. 1999. Building knowledge through families of experiments.IEEE Trans. Softw. Eng. 25, 4, 456–473.
BRIAND, L. C., MELO, W. L., AND WST, J. 2002. Assessing the applicability of fault-proneness models acrossobject-oriented software projects. IEEE Trans. Softw. Eng. 28, 7, 706–720.
DO, H. AND ROTHERMEL, G. 2006. On the use of mutation faults in empirical assessments of test caseprioritization techniques. IEEE Trans. Softw. Eng. 32, 9, 733–752.
ELBAUM, S., GABLE, D., AND ROTHERMEL, G. 2001. Understanding and measuring the sources of variationin the prioritization of regression test suites. In Proceedings of METRICS ’01. IEEE Computer Society,Washington, DC, USA, 169–179.
FENTON, N. E. AND NEIL, M. 1999. A critique of software defect prediction models. IEEE Trans. Softw.Eng. 25, 5, 675–689.
FRANKL, P. G., HAMLET, R. G., LITTLEWOOD, B., AND STRIGINI, L. 1998. Evaluating testing methods bydelivered reliability. IEEE Trans. Softw. Eng. 24, 8, 586–601.
FRANKL, P. G. AND WEISS, S. N. 1991. An experimental comparison of the effectiveness of the all-uses andall-edges adequacy criteria. In Proceedings of TAV4. ACM, New York, NY, USA, 154–164.
FRANKL, P. G. AND WEYUKER, E. J. 1993. A formal analysis of the fault-detecting ability of testing methods.IEEE Trans. Softw. Eng. 19, 3, 202–213.
GARSON, G. D. 2006. Statnotes: Topics in multivariate analysis. http://www2.chass.ncsu.edu/garson/PA765/statnote.htm.
GRAVES, T. L., HARROLD, M. J., KIM, J.-M., PORTER, A., AND ROTHERMEL, G. 2001. An empirical studyof regression test selection techniques. ACM Trans. Softw. Eng. Methodol. 10, 2, 184–208.
HARROLD, M. J., OFFUTT, A. J., AND TEWARY, K. 1997. An approach to fault modeling and fault seedingusing the program dependence graph. J. Syst. Softw. 36, 3, 273–295.
HUTCHINS, M., FOSTER, H., GORADIA, T., AND OSTRAND, T. 1994. Experiments on the effectiveness ofdataflow- and controlflow-based test adequacy criteria. In Proceedings of ICSE ’94. IEEE ComputerSociety, Los Alamitos, CA, USA, 191–200.
ACM Transactions on Embedded Computing Systems, Vol. 9, No. 4, Article 39, Publication date: March 2010.

39:44 J. Strecker and A. M. Memon
JURISTO, N., MORENO, A. M., AND VEGAS, S. 2004. Reviewing 25 years of testing technique experiments.Empirical Softw. Eng. 9, 1–2, 7–44.
LENTH, R. V. 2000. Two sample-size practices that i don’t recommend. In Proceedings of the Section onPhysical and Engineering Sciences. American Statistical Association.
MCMASTER, S. AND MEMON, A. 2008. Call-stack coverage for GUI test suite reduction. IEEE Trans. Softw.Eng. 34, 1, 99–115.
MEMON, A. M. 2007. An event-flow model of GUI-based applications for testing. Software Testing, Verifica-tion and Reliability 17, 3, 137–157.
MEMON, A. M. 2009. Using reverse engineering for automated usability evaluation of gui-based applica-tions. In Software Engineering Models, Patterns and Architectures for HCI. Springer-Verlag LondonLtd.
MORGAN, J. A., KNAFL, G. J., AND WONG, W. E. 1997. Predicting fault detection effectiveness. In Proceed-ings of METRICS ’97. IEEE Computer Society, Washington, DC, USA, 82–89.
MYERS, G. J. 1978. A controlled experiment in program testing and code walkthroughs/inspections. Com-mun. ACM 21, 9, 760–768.
OFFUTT, A. J. AND HAYES, J. H. 1996. A semantic model of program faults. In Proceedings of ISSTA ’96.ACM, New York, NY, USA, 195–200.
OFFUTT, A. J., LEE, A., ROTHERMEL, G., UNTCH, R. H., AND ZAPF, C. 1996. An experimental determina-tion of sufficient mutant operators. ACM Trans. Softw. Eng. Methodol. 5, 2, 99–118.
RICHARDSON, D. J. AND THOMPSON, M. C. 1993. An analysis of test data selection criteria using theRELAY model of fault detection. IEEE Trans. Softw. Eng. 19, 6, 533–553.
RIPLEY, B. D. 2001. The R project in statistical computing. MSOR Connections: Newsletter of the LTSNMaths, Stats and OR Network 1, 1, 23–25.
ROSNER, B. 2000. Fundamentals of Biostatistics fifth Ed. Duxbury.
ROTHERMEL, G., ELBAUM, S., MALISHEVSKY, A. G., KALLAKURI, P., AND QIU, X. 2004. On test suitecomposition and cost-effective regression testing. ACM Trans. Softw. Eng. Methodol. 13, 3, 277–331.
SLUD, E. V. 2008. Personal Communication with Prof. Eric V. Slud, Professor, Statistics Program, Depart-ment of Mathematics, University of Maryland College Park, MD 20742.
STAIGER, S. 2007. Static analysis of programs with graphical user interface. In Proceedings of CSMR ’07.IEEE Computer Society, Washington, DC, USA, 252–264.
STRECKER, J. 2009. Accounting for defect characteristics in empirical studies of software testing. Ph.D.thesis, University of Maryland, College Park.
STRECKER, J. AND MEMON, A. M. 2007. Faults’ context matters. In Proceedings of SOQUA ’07. ACM, NewYork, NY, USA, 112–115.
STRECKER, J. AND MEMON, A. M. 2008. Relationships between test suites, faults, and fault detection inGUI testing. In Proceedings of ICST ’08. IEEE Computer Society, Washington, DC, USA, 12–21.
STRECKER, J. AND MEMON, A. M. 2009. Testing graphical user interfaces. In Encyclopedia of InformationScience and Technology second Ed. IGI Global.
Testbeds 2009. First International Workshop on Testing Techniques and Experimentation Benchmarks forEvent-Driven Software.
VOAS, J. M. 1992. PIE: A dynamic failure-based technique. IEEE Trans. Softw. Eng. 18, 8, 717–727.
XIE, Q. AND MEMON, A. 2006. Studying the characteristics of a ”good” GUI test suite. In Proceedings ofISSRE ’06. IEEE Computer Society, Los Alamitos, CA, USA, 159–168.
XIE, Q. AND MEMON, A. M. 2007. Designing and comparing automated test oracles for gui-based softwareapplications. ACM Transactions on Software Engineering and Methodology 16, 1, 4.
YUAN, X., COHEN, M. B., AND MEMON, A. M. 2010. Gui interaction testing: Incorporating event context.IEEE Transactions on Software Engineering NN, N.
YUAN, X. AND MEMON, A. M. 2007. Using GUI run-time state as feedback to generate test cases. In Pro-ceedings ICSE ’07. IEEE Computer Society, Washington, DC, USA, 396–405.
ZELKOWITZ, M. V. AND WALLACE, D. 1997. Experimental validation in software engineering. Informationand Software Technology 39, 11, 735–743.
Received February 2007; revised March 2009; accepted June 2009
ACM Transactions on Embedded Computing Systems, Vol. 9, No. 4, Article 39, Publication date: March 2010.