3a.8a climatology of water vapor fluxes in the
TRANSCRIPT

CLIMATOLOGY OF WATER VAPOR FLUXES IN THE NORTHEASTERN UNITED STATES
Natalie G. Teale*, David A. Robinson Rutgers University, New Brunswick, New Jersey
* Corresponding author address: Natalie G. Teale, Rutgers Univ, Dept. of Geography, Piscataway, NJ, 08854-8045; e-mail: [email protected].
3A.8A
1. INTRODUCTION
Substantial changes in the precipitation regime, particularly in heavy precipitation, have been observed in the northeastern United States (e.g., Groisman et al. 2005; Karl et al. 2009; Walsh et al. 2014; Douglas and Fairbank 2011). However, there has been little to no discussion regarding how the observed changes in precipitation in the eastern and northeastern United States (hereafter “the Northeast”) may be driven by changes in moisture source region or transport mechanism. In fact, a thorough understanding of water vapor fluxes in the Northeast does not currently exist. Because the Northeast is particularly sensitive to global climate change, both in the sense that it is a heavily populated region reliant on a multiplicity of climate-dependent economies, as well as in the sense that the regional weather patterns are greatly influenced by internal and external factors such as topography, land-ocean interactions, and transient cyclones, this shortcoming must be addressed to better understand changes in the regional hydroclimatic regime, particularly as it pertains to extreme precipitation. This research 1) discerns typical patterns of water vapor transport through the eastern US and 2) investigates if and how the patterns of water vapor transport changed in the 20th century.
2. DATA & METHODS
This research borrows from atmospheric rivers literature in using integrated vapor transport (IVT) to represent water vapor fluxes. IVT, a vector indicating both water vapor content and wind speed and direction measured in kg m-1 s-1, is calculated as the product of daily vertically-integrated u- and v- components of water vapor flux in ECMWF ERA-Interim reanalysis from 1979–2017 at 2.5° × 2.5° resolution for the study area extent 30°N–50°N and 60°W–90°W (Dee et al. 2011).
To discern water vapor flux patterns typical for the study area, a self-organizing map (SOM) methodology was employed. One advantage of self-organizing maps is their strength in representing transitional patterns, which is a key part of this research in detecting subtle shifts in atmospheric moisture transport. A SOM layout of 4 × 4 nodes (16 patterns) was determined to best capture water vapor transport in the study area, as variability was well-captured but the number of patterns was not overfitted or resulting in nearly-redundant
patterns. Several statistical analyses were performed to characterize the climatology of these water vapor flux patterns.
The identification of water vapor pathways in the Northeast has applications for atmospheric river (AR) studies. While many definitions of ARs exist in practice, one common method for identifying ARs is as threshold-based approach, wherein any band of IVT exceeding the 85th percentile is considered an AR. The 85th and 95th percentile of IVT for the study period were calculated and these thresholds were applied to the SOM water vapor flux nodes.
To determine if the frequency of patterns changed over the 20th century, IVT was calculated from ECMWF ERA-20C reanalysis from 1900–2010 identically as in ERA-Interim used previously in this study (Poli et al. 2016). The historical daily IVT were classified into the SOM-identified water vapor flux patterns by utilizing MATLAB Classification Learner. In this method, a model was trained to classify previously-assigned ERA-Interim IVT patterns, with a success rate of 92%. Examination of errors in the model suggest that 1) where the model misclassifies, the misclassification is based on magnitude of IVT, frequently misclassifying into the less-intense pattern, and 2) where the model misclassifies, it tends to classify into the more commonly-occurring pattern. This classification model was applied to daily historical IVT from 1900–2010. A time series analysis was performed on the frequency of each pattern over the extended time series to determine if changes in the frequency of each pattern had changed over the 20th century.
3. RESULTS & DISCUSSION
The 16 IVT patterns show a wide range of water vapor fluxes influencing the study region. While some patterns depict broad systems IVT, other show confined corridors of enhanced water vapor fluxes (Fig. 1, Node 11 and Nodes 1–4, respectively). Other patterns show very little IVT, indicating that air moving through the region is either very dry or advancing slowly (e.g., Fig. 1, Node 13). Some patterns reflect recognizable pressure patterns, such as an anticyclone centered over the East Coast in Nodes 14 and 15. A sum of IVT per grid cell indicates that the nodes with strongest IVT stem from the top right (Node 4) along the edges of the SOM node array, and the nodes with the weakest IVT are clustered in the bottom left corner of the SOM node array.
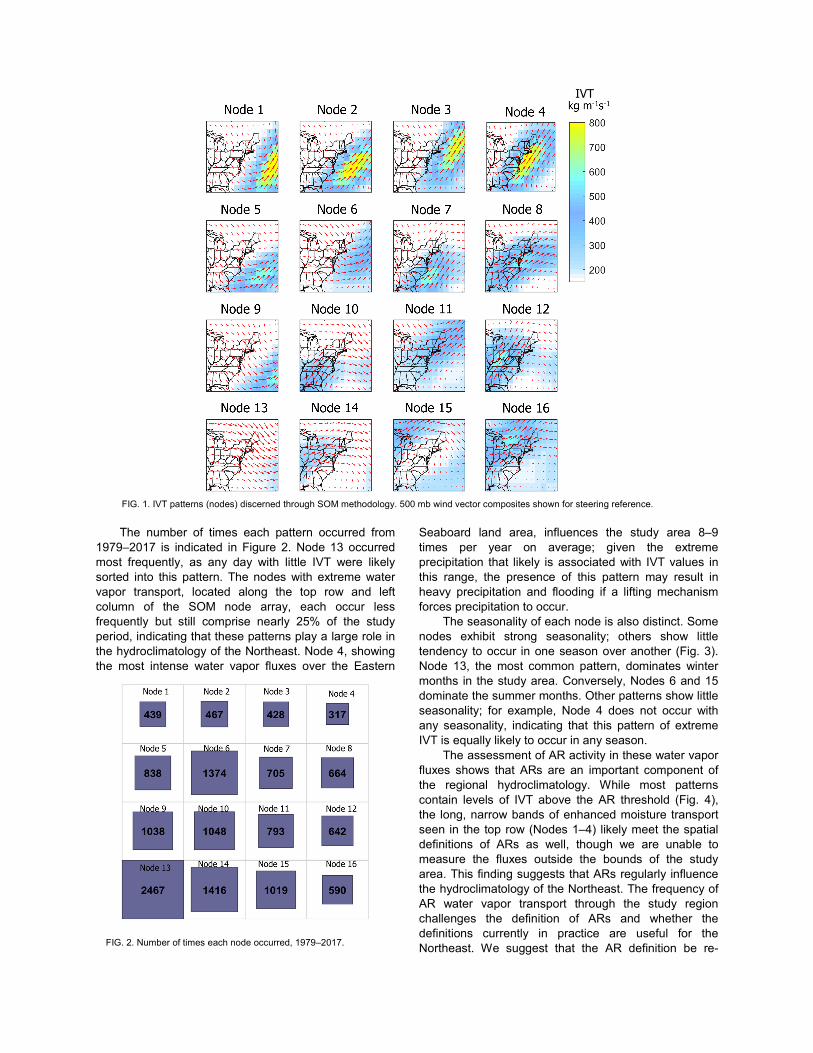
The number of times each pattern occurred from 1979–2017 is indicated in Figure 2. Node 13 occurred most frequently, as any day with little IVT were likely sorted into this pattern. The nodes with extreme water vapor transport, located along the top row and left column of the SOM node array, each occur less frequently but still comprise nearly 25% of the study period, indicating that these patterns play a large role in the hydroclimatology of the Northeast. Node 4, showing the most intense water vapor fluxes over the Eastern
Seaboard land area, influences the study area 8–9 times per year on average; given the extreme precipitation that likely is associated with IVT values in this range, the presence of this pattern may result in heavy precipitation and flooding if a lifting mechanism forces precipitation to occur.
The seasonality of each node is also distinct. Some nodes exhibit strong seasonality; others show little tendency to occur in one season over another (Fig. 3). Node 13, the most common pattern, dominates winter months in the study area. Conversely, Nodes 6 and 15 dominate the summer months. Other patterns show little seasonality; for example, Node 4 does not occur with any seasonality, indicating that this pattern of extreme IVT is equally likely to occur in any season.
The assessment of AR activity in these water vapor fluxes shows that ARs are an important component of the regional hydroclimatology. While most patterns contain levels of IVT above the AR threshold (Fig. 4), the long, narrow bands of enhanced moisture transport seen in the top row (Nodes 1–4) likely meet the spatial definitions of ARs as well, though we are unable to measure the fluxes outside the bounds of the study area. This finding suggests that ARs regularly influence the hydroclimatology of the Northeast. The frequency of AR water vapor transport through the study region challenges the definition of ARs and whether the definitions currently in practice are useful for the Northeast. We suggest that the AR definition be re-
FIG. 1. IVT patterns (nodes) discerned through SOM methodology. 500 mb wind vector composites shown for steering reference.
FIG. 2. Number of times each node occurred, 1979–2017.
IVT
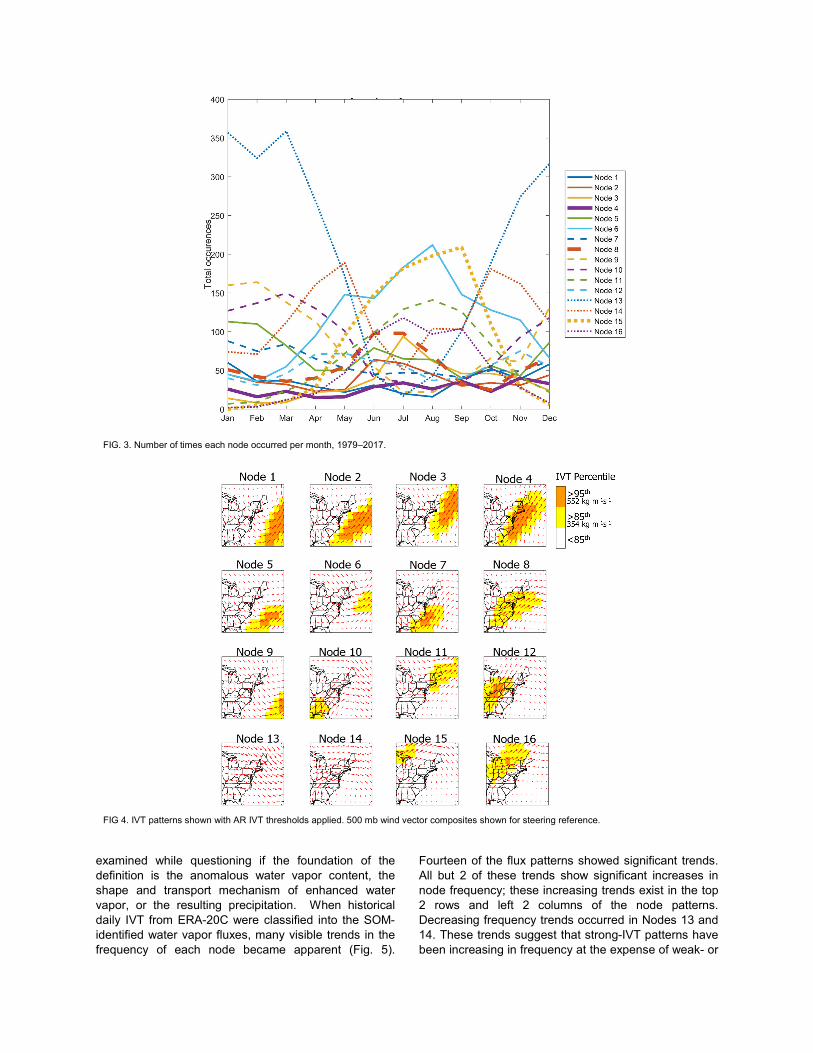
examined while questioning if the foundation of the definition is the anomalous water vapor content, the shape and transport mechanism of enhanced water vapor, or the resulting precipitation. When historical daily IVT from ERA-20C were classified into the SOM-identified water vapor fluxes, many visible trends in the frequency of each node became apparent (Fig. 5).
Fourteen of the flux patterns showed significant trends. All but 2 of these trends show significant increases in node frequency; these increasing trends exist in the top 2 rows and left 2 columns of the node patterns. Decreasing frequency trends occurred in Nodes 13 and 14. These trends suggest that strong-IVT patterns have been increasing in frequency at the expense of weak- or
FIG. 3. Number of times each node occurred per month, 1979–2017.
FIG 4. IVT patterns shown with AR IVT thresholds applied. 500 mb wind vector composites shown for steering reference.

no-IVT patterns over the 20th century. While these results are logical given the increases in precipitation observed in the study area over the past century, caution should be exercised while interpreting results based on reanalysis products. Changes and additions to the data being assimilated into the reanalysis product may produce false trends. Additionally, the skill of the reanalysis product in representing the variable in question should also be considered when interpreting results.
4. CONCLUSIONS
In this research, a climatology of water vapor fluxes through the Northeast and surrounding areas is identified and characterized. Overall, 16 unique patterns of water vapor fluxes were found to be typical of the study area. These patterns occur with distinct seasonalities to form the foundations of the atmospheric component of the regional hydroclimatology. While not the most common patterns, extreme IVT patterns are an important part of this story. Some of these extreme IVT patterns by some definitions could be considered ARs; however, given the debates surrounding the definition of
ARs as research into the phenomena expands from the US West Coast and Europe, we urge new discussion into the definition as it is applied elsewhere. Finally, we detect trends in the historical analysis of water vapor fluxes over the study area, with patterns representing high moisture transport significantly increasing in frequency at the expense of the patterns with low moisture transport. This aligns with observations in increases in precipitation and heavy precipitation in the Northeast.
Future work includes direct association of these water vapor flux patterns with observed precipitation, as the presence of water vapor fluxes alone does not necessarily indicate precipitation. Future work also includes examination of temporal flux variability within each pattern to determine if fluxes are becoming more or less saturated over time, and the effect of those changes on precipitation on the ground. We expect to find trends aligning with the Clausius-Clapeyron relationship, as well as changes in the characteristics of the water vapor fluxes which account for the dramatic increase in extreme precipitation observed in the Northeast.
FIG. 5. Number of times each node occurs per year in ERA-20C daily IVT, 1900–2010. Red lines indicate significant trends at ɑ<0.05 confidence level. Horizontal axes are identical in each subplot.

5. REFERENCES
Dee, D., and Coauthors, 2011: The ERA - Interim reanalysis: Configuration and performance of the data assimilation system. Quaterly J. R. Meteorol. Soc., 137, 553–597.
Douglas, E. M., and C. A. Fairbank, 2011: Is Precipitation in Northern New England Becoming More Extreme? Statistical Analysis of Extreme Rainfall in Massachusetts, New Hampshire, and Maine and Updated Estimates of the 100-Year Storm. J. Hydrol. Eng., 16, 203–217.
Groisman, P. Y., R. W. Knight, D. R. Easterling, T. R. Karl, G. C. Hegerl, and V. N. Razuvaev, 2005: Trends in intense precipitation in the climate record. J. Clim., 18, 1326–1350.
Karl, T. R., J. M. Melillo, and T. C. Peterson, 2009: Global Climate Change Impacts in the United States. 196 pp.
Poli, P., and Coauthors, 2016: ERA-20C: An Atmospheric Reanalysis of the Twentieth Century. J. Clim., 29, 4083–4097.
Walsh, J., D. Wuebbles, and K. Hayhoe, 2014: Chapter 2: our changing climate. Clim. Chang. Impacts United States Third Natl. Clim. Assessment., 19–67.
fds