3d modelling of tunnel excavation using pressurized tunnel boring
TRANSCRIPT

Studia Geotechnica et Mechanica, Vol. XXXV, No. 2, 2013DOI: 10.2478/sgem-2013-0020
3D MODELLING OF TUNNEL EXCAVATIONUSING PRESSURIZED TUNNEL BORING MACHINE
IN OVERCONSOLIDATED SOILS
RAFIK DEMAGH
University of Batna, Civil Engineering Department, Algeria.
FABRICE EMERIAULT
Grenoble-INP, UJF-Grenoble 1, CNRS UMR 5521, 3SR, Grenoble F-38041, France.
FARID HAMMOUD
University of Batna, Civil Engineering Department, Algeria.
Abstract: The construction of shallow tunnels in urban areas requires a prior assessment of theireffects on the existing structures. In the case of shield tunnel boring machines (TBM), the variousconstruction stages carried out constitute a highly three-dimensional problem of soil/structure inter-action and are not easy to represent in a complete numerical simulation. Consequently, the tunnel-ling-induced soil movements are quite difficult to evaluate. A 3D simulation procedure, using a finitedifferences code, namely FLAC3D, taking into account, in an explicit manner, the main sources ofmovements in the soil mass is proposed in this paper. It is illustrated by the particular case of Tou-louse Subway Line B for which experimental data are available and where the soil is saturated andhighly overconsolidated. A comparison made between the numerical simulation results and the in-situ measurements shows that the 3D procedure of simulation proposed is relevant, in particular re-garding the adopted representation of the different operations performed by the tunnel boring ma-chine (excavation, confining pressure, shield advancement, installation of the tunnel lining, groutingof the annular void, etc). Furthermore, a parametric study enabled a better understanding of the sin-gular behaviour origin observed on the ground surface and within the solid soil mass, till now notmentioned in the literature.
1. INTRODUCTION
During shield tunnelling, soil movements induced by tunnel boring machines(TBM) (deformations of surrounding tunnel ground and surface settlement) are theresult of a complex sequence of operations: excavation, front support, shield ad-vancement, grouting of the annular void, grout percolation along the shield and groutconsolidation. This complexity makes the explicit numerical simulation of the shieldtunnelling difficult and at a particular design phase, the movements should be evalu-ated by accurate numerical modelling.
During the last decade, several 3D phased simulations of tunnel boring processes,generally for soft and saturated soils, have been proposed by various authors [5], [10],

R. DEMAGH et al.4
[12]–[15]. On the other hand, only limited information is currently available, regard-ing ground disturbance associated with shield tunnelling in overconsolidated materialswhich can be found in [1] and [16].
In spite of the current progress in terms of means and computing time, 3D calcula-tions remain long and numerical problems frequent. In addition, the confrontation withresults of observations made in-situ shows that the tunnelling-induced phenomena arenot well known yet. This is due to the fact that the shield passage induces a three-dimensional field displacement.
In this paper, an explicit 3D simulation procedure of a tunnel boring process ispresented. The latter is applied to an underground construction in overconsolidatedsoil (K0 close to 1.7), namely Toulouse Subway Line B [19]. The confrontation withresults of observations made on this construction site shows that the proposed ver-satile numerical procedure is able to take into consideration all the complexity ofthe tunnelling-induced movements. The simulations were carried out with the drivenshield control parameters recorded during the passage under “Castera” measurementsection, with undrained conditions. The simulation results are respectively con-fronted with the in-situ data collected on the structure site support. These data in-clude the ground movements at the ground surface and within the solid mass. Inaddition, a parametric study has allowed us to partially understand the origin of theatypical ground behaviour observed and which till now has not been mentioned inthe literature.
2. EXPERIMENTAL SUPPORT
2.1. MONITORED SECTION
The tunnel was bored using an EPB’s (Earth Pressure Balanced shield) from Her-renknecht TBM. The shield has a diameter D = 7.7 m, a length L = 8.4 m and a halfconicity equal to 25 mm. The shield crosses essentially homogenous and overconsoli-dated argillaceous soils (K0 is close to 1.7), characterized by a very low permeability(10–8 to 10–9 m/s) with strong undrained shear strength cu equal to 300 kPa. In par-ticular, “Toulouse molasse” is also characterized by constant Young’s modulus in thefirst 10 m equal to 165 MPa, and beyond increases with depth according to the linearrelation E(z) = E0 + z.ΔE with E0 = 66.1 MPa and ΔE = 9.9 MN/m2/m (Table 2).Based on triaxial test results, this profile has been validated by numerical back-analysis on another monitoring section with similar geological context but exca-vated with the conventional method [19]. In addition, as seen in Fig. 2, the roof ofthe Toulouse molasse coincides with the water table. At the right of the monitoredsection, the tunnel axis is at a depth of 16.5 m and under a cover of 12.7 m. Theliner rings are constituted of six segments (including key segment) with 35 cmthickness and 1.40 m length. The geometrical parameters of the tunnel, shield and

3D modelling of tunnel excavation... 5
liner are summarized in Table 1 and Fig. 1. The “Castera” section, for which thequality results of in-situ measurements are available, has been retained for confron-tation and validation.
Δ/2
ΦextΦintDext
Liner
Shield
L
DintTunnel
Hw
GapC
D
H
Fig. 1. Geometrical notation for the tunnel, shield and liner
T a b l e 1
Geometrical parameters of the tunnel, shield and liner
Tunnel Shield LinerHm
Dm
C/D–
Hwm
Gapcm
Dextm
Dintm
Lm
Δ/2mm
Φextm
Φintm
Widthcm
Thicknesscm
16.5 7.7 1.65 4 20 7.7 7.65 8.4 25 7.5 6.8 140 35
(Source: [19])
T a b l e 2
Mechanical parameters of the soil
Layer Depthm
γkN/m3
K0–
cukPa
ϕudegrees
EMPa
ν–
Fill 0–4 20 0.5 0 25 25 0.304–10 22 1.7 300 0 165 0.45Molasse >10 22 1.7 300 0 E(z) 0.45
(Source: [19])
Figure 2 shows the instrumentation of the monitored section. It is constituted of3 inclinometers (I1-I3) and 5 multipoint extensometers (E1-E5) with automatic acqui-sition (one total acquisition every 5 seconds). In addition, during the passage of theTBM, a precision levelling was carried out at the end of each ring excavation.

R. DEMAGH et al.6
Fig. 2. Monitored Castera section, (source: [19])
2.2. DRIVEN SHIELD CONTROL PARAMETERS
Figure 3 shows the speed progression of the TBM when it is passing under Casterasection [20 m before and 50 m after] the front passage. During the shield tunnelling inthis portion, it remains almost constant and equal to 1.33 m/hour, which correspondsto the average time of the installation of one ring which is one hour (the liner ringshave a length equal to 1.40 m). This information will be useful later on.
-20
-10
0
10
20
30
40
50
-20 -10 0 10 20 30 40 50
Dist
ance
of t
he h
ead
shie
ld to
the
mea
sure
men
t se
ctio
n (m
)
Hours since head shield passage
Fig. 3. Advancement speed when shield is passing under Castera section

3D modelling of tunnel excavation... 7
The main driven shield control parameters are presented in Fig. 4. Figure 4(a) il-lustrates the evolution of the confining pressure Pconf on the front face (normalized to
the initial total vertical stress in the tunnel crown crown0Vσ ), the ratio crown
conf
0V
Pσ
is roughly
constant and equal to 0.6. Figure 4(b) shows the evolution of the injection pressurePgrout into the annular void (gap), measured at the exit of the four grout ports and lo-cated on the upper shield tail (Fig. 9), normalized also to crown
0Vσ . On the average, the
ratio crowngrout
0V
Pσ
is comprised between 0.8 and 1.2 in the range [20 m before and 50 m
after] the front passage (monitored section).At the passage under the Castera section, the average pressure Pgrout is equal to
0.9 crown0Vσ . After that it increases and reaches 1.2 crown
0Vσ along the first meters after
exhaust of the shield tail to stabilize at the total vertical stress crown0Vσ . These values
induce a millimetric heave on the ground surface after injection, as will be mentionedin the following paragraph.
0
0,2
0,4
0,6
0,8
1
-20 -10 0 10 20 30 40 50
Nor
mal
ized
con
finin
g pr
essu
re
Distance to the measurement section (m)
0,4
0,6
0,8
1
1,2
1,4
1957 1967 1977 1987 1997 2007
Nor
mal
ized
inje
ctio
n pr
essu
re
Number of the ring
Grout port 1Grout port 2Grout port 3Grout port 4Castera section
(a) (b)
Fig. 4. Evolution of driven shield parameters: (a) front pressure, (b) injection pressure
3. NUMERICAL SIMULATION PROCEDURES
The 3D procedure proposed in Fig. 5 for the simulation of the phased excavation isan attempt to accurately describe all the operations achieved by the TBM and the as-sociated phenomena. It is implemented in the commercial numerical code FLAC3D.Using the TBM operation parameters recorded during the passage under the monitor-ing section (Figs. 3 and 4), this procedure is repeated throughout the shield progres-sion until a stationary section is reached (stabilization of displacements), [7] and [8].The grid, 75000 nodes, is composed of eight node brick elements. The boundary con-

R. DEMAGH et al.8
ditions are imposed in terms of null displacements in the perpendicular direction to thefaces. The extent of the grid, in the longitudinal direction, is conditioned by the posi-tion of the stationary section. The vertical symmetry makes it possible to limit themodel size. The soils are modelled in elasto-plasticity with the Mohr–Coulomb yieldcriterion and a non-associated flow rule requiring few parameters.
A conical shape shield, perfectly rigid (the nodes are fixed according to the methodcalled fixed center, [2]), modelled with thin volumetric elements is installed in a virginground solid mass for which an initial state of geostatic stresses is instituted witha horizontal earth pressure coefficient K0.
Volume lossby conicity
Pfront
Solidmortar
ν=0,50 ν=0,20
Lower bound of the model
Shield Tunnel
Water table
LiningPgrout
Freshmortar
Ground surface (free field)
ν=0,40 ν=0,30
Fig. 5. A complete phased simulation of TBM excavation process, (source: [8])
XY
Z
0.0000e+000 2.5000e-003 5.0000e-003 7.5000e-003 1.0000e-002 1.2500e-002 1.5000e-002 1.7500e-002 2.0000e-002 2.2500e-002 2.5000e-002
(a) (b)
Fig. 6. Used mesh: (a) contour of vertical displacement after complete installation of the shield,(b) arch effect of the displacements at the soil/shield interface
Figure 6(a) shows the state of the deformation field once the shield is completelyinstalled, afterwards, the procedure illustrated in Fig. 5 can be applied. As far as the

3D modelling of tunnel excavation... 9
shield installation is concerned, it is characterized by the fact that in the absence ofgrout injection, the volume loss is completely filled. The assumption of a fixed centeris verified since the deformations evolve in the same way on the excavation perimeterand the total convergence (in the crown, springline and invert of the tunnel) is uniformand equal to the maximum shield conicity Δ = 25 mm. In addition, these movementsare confined in the vicinity of the excavation because of the strong undrained shearstrength of Toulouse molasse (Fig. 6a).
The excavation is simulated by the deactivation of soil disk elements. The stabilityof the front face is controlled by the normal pressure recorded on site. The latter isequal to Pfront = 0.6 crown
0Vσ and has a gradient with the depth equal to 22 kN/m2 permeter (equal to the weight of the excavated soils). This distribution is interdependent ofthe shield and progresses with it. This confining pressure profile must respect the in-structions of pressure thresholds recorded on the construction site support (see Fig. 9).
The shield passage, simulated by the annulment of the local tangential stresses,clears a volume loss that is immediately filled by the soil convergence (large dis-placements taken into consideration, as shown in Fig. 6(a)). The interface which isattached on the shield is activated as soon as a contact is established with the sur-rounding ground; the role of this interface is to block the radial ground convergenceand also to allow the tangential convergence by transverse deformation arch effect(Fig. 6(b)). The volume loss is partially compensated by the possible migration of thegrout towards the front of the shield (there is a great uncertainty regarding the post-closing shape of the ground around the shield). Two techniques are used to simulatethis migration; either by a pressure applied over a certain back length of the shield, orby a correction of the shield conicity, fixed in order to reproduce a vertical displace-ment recorded on the construction site (back-analysis on surface and/or tunnel crownvertical displacement). In [10], this second technique is more relevant.
The liner is simulated by a longitudinal model; it can be modelled either by meansof shells or volumetric elements. It is characterized by a weaker Young’s modulus inorder to take into account the seals between the liner prefabricated rings. The injectionof the grout into the annular void (the gap parameter is equal to 20 cm) is controlledboth in volume and pressure. The choice of the pressure diagram denoted Pgrout
(Fig. 5) is justified by the position of the grout ports, located on the upper part of thetail shield, as illustrated in Fig. 9. The maximum injection pressure is fixed on thevertical displacement measured at the nearest point to the vertical axis of the tunnel(namely Extensometer E3-1 in Fig. 2). It shows in particular that the pressure reallytransmitted to the ground remains lower than the average pressure measured at the exitof the grout ports. This difference is due to the pressure loss by friction following theflow of the grout as well as to its impregnation of the surrounding ground [9]. Uncer-tainty concerning the behaviour of the grout leads to consideration of two principalphases (liquid and solid phase) intercalated by a transitional one:

R. DEMAGH et al.10
• The liquid phase corresponds to the incompressible behaviour of the grout in orderto fill the annular void and to transmit the injection pressure to the surrounding ground.This phase is simulated by the application of Pgrout and the reactivation of volumetricelements. A pressure gradient is considered in order to take into account not only theactual weight of the grout but also of the injection specific measures. During this phase,the grout is considered elastic-incompressible [10] and is characterized by a high bulkmodulus K associated with a low shear modulus G, 102 ≤ K/G ≤ 103, [3] and [4]. Thisphase lasts as long time as the grout keeps entirely its workability, approximately fourhours according to [18], which corresponds in average to the pose of four liner rings.
• The transitional phase corresponds to the grout consolidation (drying grout). Dur-ing this phase, the behaviour of the grout evolves more or less quickly, according to thetype of the grout used (active or inert). More consistent, the grout acquires a shearstrength associated with a sort of compressibility. This phase is simulated by the annul-ment of the injection pressure and a progressive reduction in Poisson’s ratio [11].
• The solid phase corresponds to the final situation where the grout is at least asrigid as the surrounding ground and transmits the efforts of the ground solid mass tothe liner [12]. This phase is characterized by the ratio K/G ≅ 1 [11].
This procedure is repeated throughout the shield progression, until reaching a sta-tionary section after a few tens of excavation steps, as illustrated in Fig. 3 (approxi-mately 40 meters after the passage of the front face, Fig. 9).
Because of the impervious nature of the soils crossed (the permeability coefficientis close to 10–9 m/s), the simulations are carried out under undrained conditions, takinginto account the water table, which corresponds to the short-term behaviour. Thestrength parameters of the molasse adopted in this study are those given by the rapidtriaxial compression tests [19].
The 3D simulation results are compared to the in-situ data collected on the con-struction site support. These data include the movements of the ground surface andinside the ground solid mass, as well as the driven shield control parameters.
4. RESULTS
4.1. REFERENCE CASE
As shown in Figure 7, the tunnel excavation through the highly overconsolidatedmaterials (K0 close to 1.7) induced a surface heaving trough with a maximum dis-placement of approximately 1 mm. This trough is well simulated both qualitatively(evolution during the progression of TBM) and quantitatively. In addition, the finalreversed half-width trough [17], which is equal to 8 m, as well as the settlementzones, seem to be in good agreement with the corresponding in-situ recorded meas-urements.

3D modelling of tunnel excavation... 11
-0,6
-0,3
0
0,3
0,6
0,9
1,2
0 3 6 9 12 15Dis
plac
emen
ts (m
m)
Position/tunnel axis (m)
Front Passage FPTail Passage TP+12 m after FPin Final
Simulations
-0,6
-0,3
0
0,3
0,6
0,9
1,2
0 3 6 9 12 15Dis
plac
emen
ts (m
m)
Position/tunnel axis (m)
Front passage FP+4,2 m after FP+12,6 m after FP+42 m after FP
Measurements
(a) (b)
Fig. 7. Transverse settlement trough: (a) FLAC3D, (b) measurements
In Fig. 8, the induced horizontal movements measured on the vertical profile closeto the tunnel (deep inclinometer I3, Fig. 2, at one diameter of tunnel axis) agree alsoquite well. Likewise a good result was obtained in relation to the position of the shieldhead in the final state. The increase of convergence during the progression of the headshield is also well simulated by the 3D simulation procedure proposed.
-30
-25
-20
-15
-10
-5
0-6 -5 -4 -3 -2 -1 0 1
Posi
tion /
surf
ace (
m)
Convergence (mm)
3m before FPFront Passage FP5m after FPShield Tail30m after FP
-30
-25
-20
-15
-10
-5
0-6 -5 -4 -3 -2 -1 0 1
Posi
tion /
surf
ace (
m)
Convergence (mm)
2m before FP5m after FP10m after FP30m after FP15 days after FP
(a) (b)
Fig. 8. Horizontal convergences: (a) FLAC3D, (b) measurements
The atypical behavior recorded, that is 5 mm horizontal convergence associatedwith 1 mm heave on the ground surface, is essentially due to the overconsolidatedcharacter of the soil crossed. Nevertheless, a variation law of Young’s modulus moresuitable than that proposed in Section 2 could still refine the results of convergencedisplacements for a depth in the rage –5 to –10 m.
R. DEMAGH et al.12
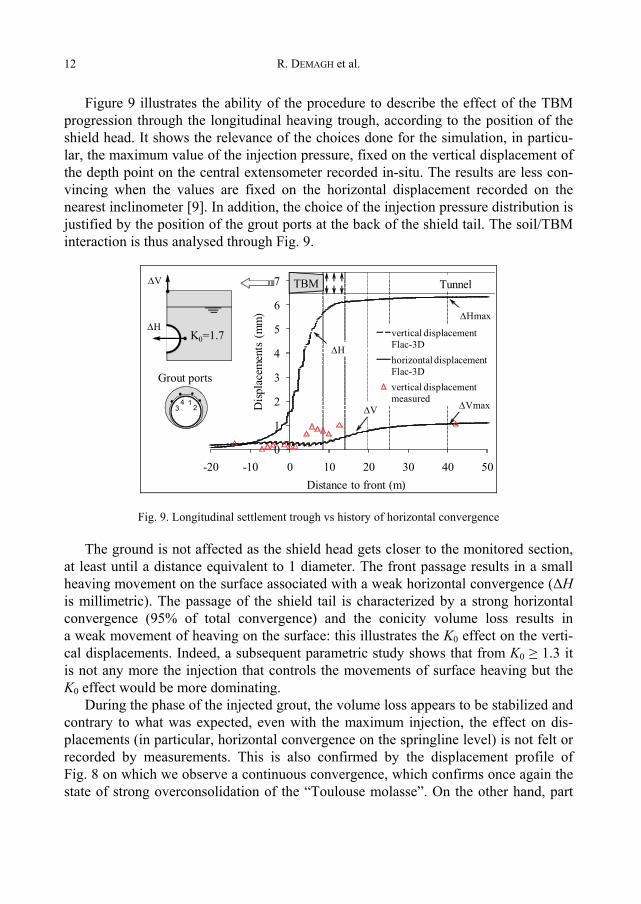
Figure 9 illustrates the ability of the procedure to describe the effect of the TBMprogression through the longitudinal heaving trough, according to the position of theshield head. It shows the relevance of the choices done for the simulation, in particu-lar, the maximum value of the injection pressure, fixed on the vertical displacement ofthe depth point on the central extensometer recorded in-situ. The results are less con-vincing when the values are fixed on the horizontal displacement recorded on thenearest inclinometer [9]. In addition, the choice of the injection pressure distribution isjustified by the position of the grout ports at the back of the shield tail. The soil/TBMinteraction is thus analysed through Fig. 9.
0
1
2
3
4
5
6
7
-20 -10 0 10 20 30 40 50
Disp
lace
men
ts (m
m)
Distance to front (m)
vertical displacement Flac-3Dhorizontal displacement Flac-3Dvertical displacement measured
TBM Tunnel
ΔV
ΔH
ΔV
ΔH
••• •1
234
Grout ports
ΔVmax
ΔHmax
K0=1.7
Fig. 9. Longitudinal settlement trough vs history of horizontal convergence
The ground is not affected as the shield head gets closer to the monitored section,at least until a distance equivalent to 1 diameter. The front passage results in a smallheaving movement on the surface associated with a weak horizontal convergence (ΔHis millimetric). The passage of the shield tail is characterized by a strong horizontalconvergence (95% of total convergence) and the conicity volume loss results ina weak movement of heaving on the surface: this illustrates the K0 effect on the verti-cal displacements. Indeed, a subsequent parametric study shows that from K0 ≥ 1.3 itis not any more the injection that controls the movements of surface heaving but theK0 effect would be more dominating.
During the phase of the injected grout, the volume loss appears to be stabilized andcontrary to what was expected, even with the maximum injection, the effect on dis-placements (in particular, horizontal convergence on the springline level) is not felt orrecorded by measurements. This is also confirmed by the displacement profile ofFig. 8 on which we observe a continuous convergence, which confirms once again thestate of strong overconsolidation of the “Toulouse molasse”. On the other hand, part

3D modelling of tunnel excavation... 13
of the heaving observed in Fig. 7, with a more important slope (Fig. 9) can be as-signed, at least partly, to the injection and not only to convergence due to K0 effect. Itis worth noting for this purpose that the injection pressure adopted in calculations andset on the vertical displacement remains lower than half of the average pressure meas-ured on the 4 grout ports. In practice, it is generally recommended to inject witha threshold of pressure slightly higher than the initial vertical stress at the tunnel key.The difference in pressure can be explained by a load loss by friction following themortar flow during its impregnation of the surrounding ground.
The grout consolidation is characterized by a return of point ΔH to its positionafter the passage of the shield tail, which shows that the proposed procedure to simu-late this phase appears to be relevant. It is further observed that the shifted effect ofthe injection is felt to a distance of 30 m compared to the monitored section where themaximum heaving is recorded.
At the end of the last phase (stabilization of displacements), a ratio ΔH/ΔV close to4 is recorded (identical to that recorded on the monitored section, [19]).
4.2. PARAMETRIC STUDY
A parametric study aiming to show the sensitivity of the model to the most rele-vant parameters of the 3D simulation is presented. The response of the model is ana-lysed through the following displacements: ΔF, ΔH and ΔV, representing the axialextrusion of the front face, the horizontal displacement of the springline and the verti-cal displacement on the ground surface, respectively.
-1,5
0
1,5
3
4,5
6
7,5
0,8 1 1,2 1,4 1,6 1,8
Dis
plac
emen
ts (m
m)
K0
FHV
01234567
0,3 0,35 0,4 0,45 0,5
Dis
plac
emen
ts (m
m)
Poisson's ratio
FHV
(a) (b)
Fig. 10. Parametric study: (a) effect of K0, (b) effect of Poisson’s ratio
Figure 10(a) shows a regular linear evolution of displacements according to the atrest earth pressure coefficient K0, through which it can be seen that for a given dia-gram of injection pressure, the sensitivity of the three parameters with regard to K0 is

R. DEMAGH et al.14
identical. Figure 10(a) shows also a ground surface heaving for K0 ≥ 1.3, whereas forlower values of K0 a settlement trough is observed.
Figure 10(b) highlights the displacement sensitivity with respect to Poisson’s ratio ν.The relevance of the latter is dictated by important computation times when perfectlyincompressible materials (ν = 0.5) are considered. It mainly shows that the displace-ments remain more or less the same. This can be explained, on the one hand, by thefact that the incompressibility potential of the model is not completely reached and, onthe other hand, by the length insufficiency of the model. The choice of a Poisson’sratio value of 0.45 instead of 0.49 decreases the computation times by 3.
Figure 11(a) shows the influence of conicity on displacements. In general, whenthe conicity increases, the convergence ΔH increases while the axial extrusion ΔFdecreases. Initially, the ground surface heaving ΔV increases when the conicity valuedoubles from Δ/2 = 12.5 mm to Δ/2 = 25 mm, then ΔV decreases when the conicitypasses from 25 to 50 mm. This can be explained by the fact that in the first case,ground surface heaving is governed by the convergence ΔH on the springline level,while in the second case, decompression on the springline level being total, the verti-cal extension of the cover [19] attenuates heaving and thus ΔV decreases.
Figure 11(b) shows logically that the extrusion ΔF decreases when Pfront increases.It also shows that the variation in the range 0.3 crown
0Vσ ≤ Pfront ≤ 0.9 crown0Vσ has little
effect on the convergence ΔH and consequently the variation of ΔV remains negligible.
01234567
0 50 100 150 200 250
Dis
plac
emen
ts (m
m)
actual conicity actuelle/real conicity (%)
FHV
01234567
0,2 0,4 0,6 0,8 1
Dis
plac
emen
ts (m
m)
Confining Pressure /Initial vertical stress
FHV
(a) (b)
Fig. 11. Parametric study: (a) effect of conicity, (b) effect of confining pressure
Theoretically, the stability of the front face is ensured even with a null pressure onthe front face because of the high undrained shear strength cu which is equal to300 kPa (numerical analysis of face stability of shallow tunnel [6]); however, simula-tion carried out without confining pressure (Pfront = 0) gave an axial extrusion reported tothe excavation diameter about 1%, which value allows the collapse of the front face [6].This can be explained by the overconsolidated state of the molasse (K0 close to 1.7).
3D modelling of tunnel excavation... 15
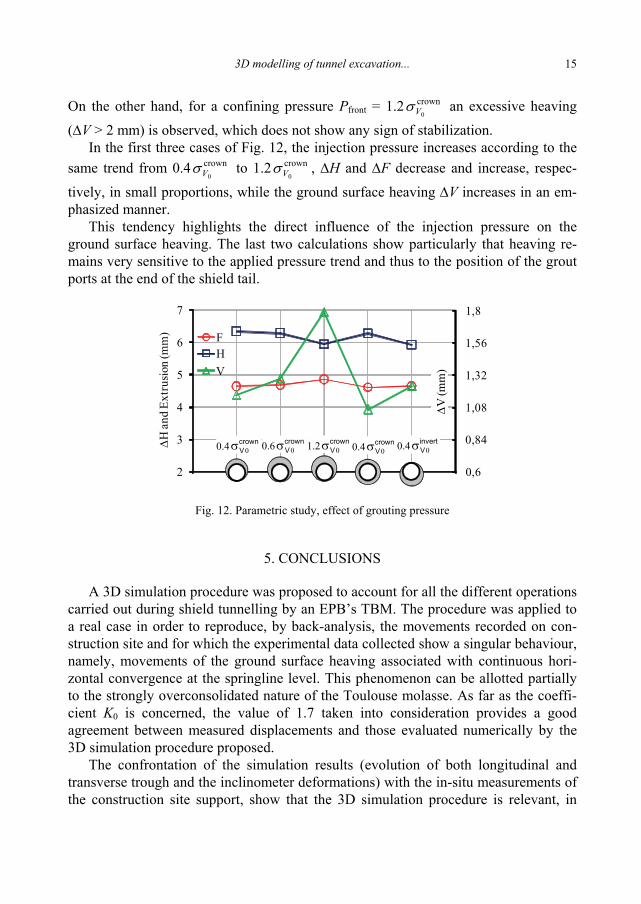
On the other hand, for a confining pressure Pfront = 1.2 crown0Vσ an excessive heaving
(ΔV > 2 mm) is observed, which does not show any sign of stabilization.In the first three cases of Fig. 12, the injection pressure increases according to the
same trend from 0.4 crown0Vσ to 1.2 crown
0Vσ , ΔH and ΔF decrease and increase, respec-
tively, in small proportions, while the ground surface heaving ΔV increases in an em-phasized manner.
This tendency highlights the direct influence of the injection pressure on theground surface heaving. The last two calculations show particularly that heaving re-mains very sensitive to the applied pressure trend and thus to the position of the groutports at the end of the shield tail.
2
3
4
5
6
7
ΔH
and
Extr
usio
n (m
m) F
H
0,6
0,84
1,08
1,32
1,56
1,8
ΔV
(mm
)V
0.4 0σcrownV 0.6 0σcrown
V 1.2 0σcrownV 0.4 0σcrown
V 0.4 0σinvertV
Fig. 12. Parametric study, effect of grouting pressure
5. CONCLUSIONS
A 3D simulation procedure was proposed to account for all the different operationscarried out during shield tunnelling by an EPB’s TBM. The procedure was applied toa real case in order to reproduce, by back-analysis, the movements recorded on con-struction site and for which the experimental data collected show a singular behaviour,namely, movements of the ground surface heaving associated with continuous hori-zontal convergence at the springline level. This phenomenon can be allotted partiallyto the strongly overconsolidated nature of the Toulouse molasse. As far as the coeffi-cient K0 is concerned, the value of 1.7 taken into consideration provides a goodagreement between measured displacements and those evaluated numerically by the3D simulation procedure proposed.
The confrontation of the simulation results (evolution of both longitudinal andtransverse trough and the inclinometer deformations) with the in-situ measurements ofthe construction site support, show that the 3D simulation procedure is relevant, in

R. DEMAGH et al.16
particular in the adopted representation for the different operations conducted by thetunnel boring machine.
Qualitatively, the calculations carried out in undrained conditions showed a goodagreement of the displacements evaluated numerically and those recorded in-situ. Theobtained ground surface longitudinal and transverse troughs as well as the transversehorizontal displacement vertical profiles are in good agreement with the measurements(final values and evolution during the TBM progression). In particular, the atypicalbehaviour of the monitored section was displayed.
Nevertheless, uncertainties related to the injection of the mortar remain; if the mi-gration of the mortar appears well simulated by a correction of the conicity, the differ-ent phases of the injection remain still difficult to simulate.
In addition to the K0 effect, a parametric study is undertaken in order to assess animpact of the shield control parameters, namely the confining pressure, the conicity,the injection pressure into the annular void as well as the position of the grout ports.
An increase in the conicity is likely to change, by a subtle play of horizontal de-compression and vertical extension, the displacement amplitude on the surface. Theinfluence of the injection pressure, in particular, on vertical displacements, seems to bein good agreement with the instruction generally allowed on the shield tunnelling con-struction sites, namely Pgrout = crown
0Vσ . The confining pressure has no important effect
on vertical displacements, at least by respecting the instruction 0.3 crown0Vσ ≤ Pfront ≤
0.9 .crown0Vσ
REFERENCES
[1] ATTEWELL P.B., FARMER I.W., Ground disturbance caused by shield tunnelling in a stiff, overcon-solidated clay, Elsevier, Engineering Geology, 8, 1974, 361–381.
[2] BENMEBAREK S., KASTNER R., Modélisation numérique des mouvements de terrain meuble induitspar un tunnelier, Revue Canadienne de Géotechnique, 37, 2000, 1309–1324.
[3] BEZUIJEN A., TALMON A.M., KAALBERG F.J., PLUGGE R., Field measurements of grout pressureduring tunnelling of Sophia Rail Tunnel, Tunneling. GeoDelft, 2005, 83–93.
[4] BEZUIJEN A., TALMON A.M., Proceedings of the Geotechnical Aspects of Underground Constructionin soft Ground, Bakker et al. (eds.) Taylor & Francis Group, London, 2006, 187–193.
[5] BROERE W., BRIKGREVE R.B.J., Phased simulation of a tunnel boring process in soft soil, NUMGE,Mestat (ed.), Presses de l’ENPC/LCPC, Paris, 2002, 529–536.
[6] DEMAGH R., EMERIAULT F., BENMEBAREK S., Analyse numérique de la stabilité du front de taille d’untunnel à faible couverture en milieu frottant, Revue Française de Géotechnique, 123, 2008a, 27–35.
[7] DEMAGH R., EMERIAULT F., KASTNER R., Modélisation 3D du creusement de tunnel par tunnelierà front pressurisé dans les sols surconsolidés, Proceedings des Journées Nationales de Géotechniqueet de Géologie de l’Ingénieur (JNGG’08) Nantes, 18–20 juin 2008b, 305–312, (in French).
[8] DEMAGH R., EMERIAULT E., KASTNER R., Shield tunnelling – Validation of a complete 3D numericalsimulation on 3 different case studies. Euro:Tun 2009. Proceedings of the 2nd International Confer-ence on Computational Methods in Tunnelling, Ruhr University Bochum, September 2009a, 77–82.

3D modelling of tunnel excavation... 17
[9] DEMAGH R., EMERIAULT F., KASTNER R., Modélisation 3D du creusement de tunnel par tunnelierà front pressurisé – Validation sur 3 cas d’études. Proceedings of the 17ème Conférence de Mé-canique des Sols et de Géotechnique (17ème ICSMGE), 5–9 Octobre 2009b, Alexandrie, Egypte,77–82, (in French).
[10] DIAS D., KASTNER R., MAGHAZI M., 3D simulation of slurry shield tunnelling, Proceedings of Inter-national Symposium on Geotechnical aspects of underground construction in soft ground, Kusakabeet al. (eds.), Balkema, Rotterdam, 2000, 351–356.
[11] DIERKENS M., Mesures rhéologiques et modélisation de matériaux en cours de prise, Ph.D. thesis,INSA-Lyon, 2005.
[12] KASPER T., MESCHKE G., A 3D finite element simulation model for TBM tunneling in soft ground,Proceedings of the International Journal for Numerical and Analytical Methods in Geomechanics,28, 2004, 1441–1460.
[13] KASPER T., MESCHKE G., On the influence of face pressure, grouting pressure and TBM design insoft ground tunnelling, Tunnelling and Underground Space Technology, 21, 2006, 160–171.
[14] MROUEH H., SHAHROUR I., Modélisation 3D du creusement de tunnels en site urbain, Revue Fran-çaise de Génie Civil, 3, 1999, 7–23, (in French).
[15] MROUEH H., SHAHROUR I., A simplified 3D model for tunnel construction using tunnel boring ma-chines, Tunnelling and Underground Space Technology, 23, 2008, 38–45.
[16] MYRIANTHIS M.L., Ground disturbance associated with shield tunnelling, in overconsolidated stiffclay, Springer-Verlag, Rock Mechanics 7, 1975, 35–65.
[17] PECK R.B., Deep excavations and tunnelling in soft ground, Proceedings of the 7th InternationalConference on Soil Mechanics and Foundation Engineering, Mexico City, State-of-the-art Volume,1969, 225–290.
[18] TALMON A.M., AANEN L., BEZUIGEN A., van der ZON W.H., Grout pressure around a tunnel linning,Tunneling. A Decade of Progress. GeoDelft, 2005, 77–82.
[19] VANOUDHEUSDEN E. et al., Analysis of movements induced by tunnelling with an earth-pressurebalance machine and correlation with excavating parameters, Proceedings of the GeotechnicalAspects of Underground Construction in Soft Ground, Bakker et al. (eds.), Taylor & Francis Group,London, 2006, 81–86.