3d random voronoi grain-based models for simulation of ... random voronoi grain-based models for...
TRANSCRIPT
able at ScienceDirect
Journal of Rock Mechanics and Geotechnical Engineering 6 (2014) 506e521
Contents lists avail
Journal of Rock Mechanics andGeotechnical Engineering
journal homepage: www.rockgeotech.org
Full length article
3D random Voronoi grain-based models for simulation of brittle rockdamage and fabric-guided micro-fracturing
E. Ghazvinian a,*, M.S. Diederichs a, R. Quey b
aGeoEngineering Centre, Queen’s University, Kingston, ON, Canadab Ecole Nationale Supérieure des Mines de Saint-Etienne, CNRS UMR 5307, France
a r t i c l e i n f o
Article history:Received 17 July 2014Received in revised form16 September 2014Accepted 16 September 2014Available online 6 October 2014
Keywords:Numerical modelling3D Voronoi tessellationDiscrete element methodGrain-based modelCrack damage thresholdsFabric-guided micro-fracturingAnisotropy
* Corresponding author. Tel.: þ1 613 539 3330.E-mail addresses: [email protected]
(E. Ghazvinian).Peer review under responsibility of Institute of R
nese Academy of Sciences.1674-7755 � 2014 Institute of Rock and Soil Mechanences. Production and hosting by Elsevier B.V. All righttp://dx.doi.org/10.1016/j.jrmge.2014.09.001
a b s t r a c t
A grain-based distinct element model featuring three-dimensional (3D) Voronoi tessellations (randompoly-crystals) is proposed for simulation of crack damage development in brittle rocks. The grainboundaries in poly-crystal structure produced by Voronoi tessellations can represent flaws in intact rockand allow for numerical replication of crack damage progression through initiation and propagation ofmicro-fractures along grain boundaries. The Voronoi modelling scheme has been used widely in the pastfor brittle fracture simulation of rock materials. However the difficulty of generating 3D Voronoi modelshas limited its application to two-dimensional (2D) codes. The proposed approach is implemented inNeper, an open-source engine for generation of 3D Voronoi grains, to generate block geometry files thatcan be read directly into 3DEC. A series of Unconfined Compressive Strength (UCS) tests are simulated in3DEC to verify the proposed methodology for 3D simulation of brittle fractures and to investigate therelationship between each micro-parameter and the model’s macro-response. The possibility of nu-merical replication of the classical U-shape strength curve for anisotropic rocks is also investigated innumerical UCS tests by using complex-shaped (elongated) grains that are cemented to one another alongtheir adjoining sides. A micro-parameter calibration procedure is established for 3D Voronoi models foraccurate replication of the mechanical behaviour of isotropic and anisotropic (containing a fabric) rocks.� 2014 Institute of Rock and Soil Mechanics, Chinese Academy of Sciences. Production and hosting by
Elsevier B.V. All rights reserved.
1. Introduction
The simulation of micro-fracturing and crack damage progres-sion for brittle rocks can be performed implicitly in continuum orexplicitly with the aid of discontinuum numerical approaches. Inimplicit simulation of micro-crack formation, the weakness causedby the formation of cracks is smeared within the material by meansof constitutive relationships. The Damage Initiation-Spalling Limit(DISL) approach is an example of implicit brittle fracture simulationwith continuum codes (Diederichs, 2007). The explicit simulationof micro-fracturing in rock-like material can be accomplished bydirect representation of cracks in models formulated based on theDiscrete Element Method (DEM) (Cundall and Hart, 1985; Cundall,1988) or by using the hybrid Finite-Discrete Element Method(FDEM) codes (Mahabadi et al., 2012).
ock and Soil Mechanics, Chi-
ics, Chinese Academy of Sci-hts reserved.
In DEM, the rock-like material can be simulated as a denseassembly of rigid or deformable particles that interact at theircontact points. Also, the discrete bodies can detach and newcontacts can automatically be detected (Itasca, 2013a) and there-fore fractures can be simulated at the grain (or block) boundaryopening. In the Bonded-Particle Model (BPM), which falls withinthe DEM formulation, the particles are represented by rigid disksin 2D and rigid spheres in 3D (Potyondy and Cundall, 2004). Thebreakage of bonds between the spheres in the BPM is comparableto fracturing in rock. The BPM which is implemented in ParticleFlow Code (PFC) (Itasca, 2008) has been used widely for crackdamage simulation in rock. The concerns and possible solutionsfor the accuracy of PFC simulations have been documented in thepast by many researchers, including Diederichs (2003), Potyondyand Cundall (2004), Cho et al. (2007), Yoon et al. (2008), andGhazvinian (2010).
The random polygonal blocks (grains) in DEM are an alternativegeometry to the disks and spheres employed in BPM approach forsimulation of fracturing. Voronoi tessellation is one of the availabletechniques for generating the random polygonal grains within adomain. In this technique, a region is populated with random seedpoints. Lines or planar surfaces are generated so that the boundedregion surrounding each seed point includes all the space that iscloser to that seed point than any other. The grain boundaries in the

E. Ghazvinian et al. / Journal of Rock Mechanics and Geotechnical Engineering 6 (2014) 506e521 507
poly-crystal structure produced by Voronoi tessellation can be usedto represent flaws in intact rock and therefore allow for simulationof crack damage development through initiation and propagationof fractures along grain boundaries.
In the Voronoi modelling approach for numerical simulation offracturing in intact rock, the grains (blocks) can be rigid, deform-able or inelastic. The behaviour of contacts between the grains iscommonly governed by the available constitutive formulations forrock mass joints and discontinuities. Some of the concerns associ-ated with the PFC results were demonstrated to be no longerapplicable to the Voronoi method (Kazerani and Zhao, 2010; Lanet al., 2010). The Voronoi scheme has been used widely in thepast for brittle fracture modelling of rock materials, however thecomplexity of generating 3D Voronoi domains has limited itsapplication to 2D models. In this paper, a new methodology forgeneration of 3D Voronoi Grain-Based Models (GBMs) is proposedwhich would provide a means for simulation of rock brittle frac-turing in 3DEC (Itasca, 2013a).
Damage process in laminated intact rocks or rocks that have apreferred fabric orientation, which commonly represent an aniso-tropic mechanical behaviour, can also be simulated by means of anequivalent continuum such as the Ubiquitous Joint Model in FLAC(Itasca, 2012), or with DEM and hybrid FDEM discontinuum ap-proaches. The discontinuum methods either apply implicit aniso-tropic contact and material constitutive behaviour or introduce ananisotropic defect or pre-damage to the model (e.g. Diederichset al., 2004; You et al., 2011; Kazerani, 2013; Lisjak et al., 2014a).By using the proposed approach in this paper for generation of 3DVoronoi GBMs, an analogue for intact rocks with inherent anisot-ropy is suggested by scaling the models and therefore achievingelongated grains. The fabric-guided micro-fracturing in the aniso-tropic models is verified by laboratory test results of the CobourgLimestone and the calibration procedure for the laminated GBMs isestablished from sensitivity analyses of the contact micro-parameters.
2. Numerical approach
The extensile “crack opening forces” at the micro-scale can begenerated through different mechanisms. These mechanismsamplify the localized shear strains and subsequently facilitate thenucleation of inter-granular and intra-granular cracks at the CrackInitiation (CI) threshold (Diederichs, 2003). Some of the mecha-nisms of extension crack generation under deviatoric stress con-ditions are illustrated in Fig. 1.
To simulate the extensile crack opening forces at themicro-scalein DEMmodels, the rigid or deformable particles are approximatedby simple geometries. The three commonly used geometries are
Fig. 1. Schematic illustration of crack opening forces generated through differentmechanisms at the micro-scale under deviatoric stress condition. High (Hi) and low(Lo) E and v are the Young’s modulus and Poisson’s ratio, respectively (after Diederichs(2000)).
disks (spheres in 3D) (Potyondy and Cundall, 2004; Scholtès andDonzé, 2013), Voronoi grains (Damjanac et al., 2007), and tri-angles (trigons in 3D) (Gao and Stead, 2014). The geometry of theparticles plays a key role in the generation of the crack extensionand shearing forces acting on the sliding fractures. A schematic ofan identical micro-mechanism simulated with Voronoi grains andcircular disks is illustrated in Fig. 2. The applied compressive forcesin the Voronoi model can be resolved into extensile and shearingforces acting on the grain boundaries (sliding flaw in this case). Inthe circular disk model, the applied forces will translate into tensilestresses at the contact between the disks and rotational momentsacting upon the disks. The geometrically imposed restriction on thegeneration of shear stresses at the contacts between the disks in theBPM has a minor effect on the CI threshold since most of the micro-cracks in brittle rocks form in tension (Diederichs, 2007). However,with increasing deviatoric stress and on reaching the CriticalDamage (CD) threshold, micro-cracks start to interact and coalesce,mostly through shearing. Therefore, the BPMwith circular disks haslimited application for simulation of crack interaction (Diederichs,2007).
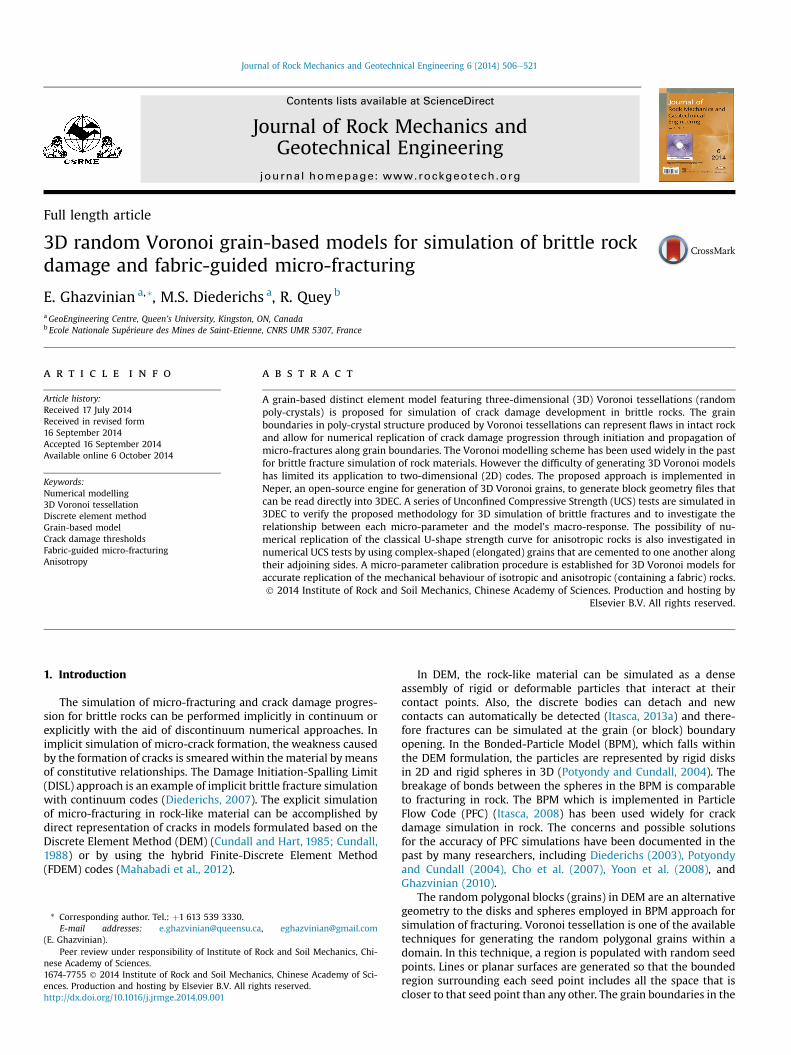
The simplicity of generating triangular grains (trigons) in DEMfor simulation of fracturing in rock is assisting the increasing rateof using this approach. The micro-properties of the trigonsmodels can be calibrated to simulate the exact macro-propertiesof rock tested in the laboratory. At the micro-scale, in contraryto the BPM models, most of the failure occurs in shear (Gao andStead, 2014). In Fig. 3a, the potential sliding path in a trigonmodel is shown (red lines). In Fig. 3b, a Voronoi tessellated modelwith similar edge length to the trigon model is also illustrated.While the trigon model includes smooth pathways thatencourage shear sliding, the grain boundaries of the Voronoimodel provide asperities and rough failure paths which lead toextensile opening of some grain boundaries and simultaneousshear sliding along other grain edges. This figure shows that theexistence of these smooth pathways for cracking encouragesshear sliding.
Fig. 2. Micro-mechanisms for compression-induced tensile stress at the contactsbetween the particles in DEM. (a) The compressive force can be resolved into tensileand shear stresses acting on the boundaries between the grains. (b) The compressiveforces are resolved into tensile stress at the contacts and moments trying to rotatethe disks.
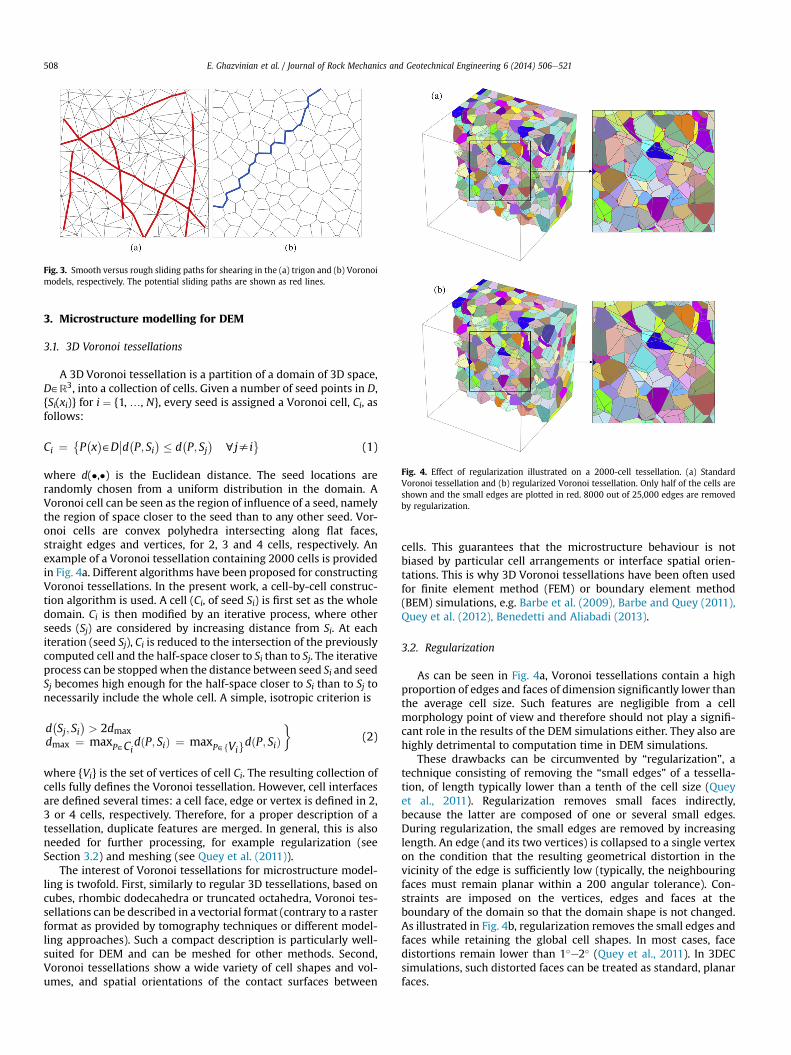
Fig. 4. Effect of regularization illustrated on a 2000-cell tessellation. (a) StandardVoronoi tessellation and (b) regularized Voronoi tessellation. Only half of the cells areshown and the small edges are plotted in red. 8000 out of 25,000 edges are removedby regularization.
Fig. 3. Smooth versus rough sliding paths for shearing in the (a) trigon and (b) Voronoimodels, respectively. The potential sliding paths are shown as red lines.
E. Ghazvinian et al. / Journal of Rock Mechanics and Geotechnical Engineering 6 (2014) 506e521508
3. Microstructure modelling for DEM
3.1. 3D Voronoi tessellations
A 3D Voronoi tessellation is a partition of a domain of 3D space,D˛R3, into a collection of cells. Given a number of seed points in D,{Si(xi)} for i ¼ {1, ., N}, every seed is assigned a Voronoi cell, Ci, asfollows:
Ci ¼�P�x�˛D
��d�P; Si� � d�P; Sj
�cjsi
�(1)
where d(�,�) is the Euclidean distance. The seed locations arerandomly chosen from a uniform distribution in the domain. AVoronoi cell can be seen as the region of influence of a seed, namelythe region of space closer to the seed than to any other seed. Vor-onoi cells are convex polyhedra intersecting along flat faces,straight edges and vertices, for 2, 3 and 4 cells, respectively. Anexample of a Voronoi tessellation containing 2000 cells is providedin Fig. 4a. Different algorithms have been proposed for constructingVoronoi tessellations. In the present work, a cell-by-cell construc-tion algorithm is used. A cell (Ci, of seed Si) is first set as the wholedomain. Ci is then modified by an iterative process, where otherseeds (Sj) are considered by increasing distance from Si. At eachiteration (seed Sj), Ci is reduced to the intersection of the previouslycomputed cell and the half-space closer to Si than to Sj. The iterativeprocess can be stoppedwhen the distance between seed Si and seedSj becomes high enough for the half-space closer to Si than to Sj tonecessarily include the whole cell. A simple, isotropic criterion is
d�Sj; Si
�> 2dmax
dmax ¼ maxP˛CidðP; SiÞ ¼ maxP˛fVigdðP; SiÞ
�(2)
where {Vi} is the set of vertices of cell Ci. The resulting collection ofcells fully defines the Voronoi tessellation. However, cell interfacesare defined several times: a cell face, edge or vertex is defined in 2,3 or 4 cells, respectively. Therefore, for a proper description of atessellation, duplicate features are merged. In general, this is alsoneeded for further processing, for example regularization (seeSection 3.2) and meshing (see Quey et al. (2011)).
The interest of Voronoi tessellations for microstructure model-ling is twofold. First, similarly to regular 3D tessellations, based oncubes, rhombic dodecahedra or truncated octahedra, Voronoi tes-sellations can be described in a vectorial format (contrary to a rasterformat as provided by tomography techniques or different model-ling approaches). Such a compact description is particularly well-suited for DEM and can be meshed for other methods. Second,Voronoi tessellations show a wide variety of cell shapes and vol-umes, and spatial orientations of the contact surfaces between
cells. This guarantees that the microstructure behaviour is notbiased by particular cell arrangements or interface spatial orien-tations. This is why 3D Voronoi tessellations have been often usedfor finite element method (FEM) or boundary element method(BEM) simulations, e.g. Barbe et al. (2009), Barbe and Quey (2011),Quey et al. (2012), Benedetti and Aliabadi (2013).
3.2. Regularization
As can be seen in Fig. 4a, Voronoi tessellations contain a highproportion of edges and faces of dimension significantly lower thanthe average cell size. Such features are negligible from a cellmorphology point of view and therefore should not play a signifi-cant role in the results of the DEM simulations either. They also arehighly detrimental to computation time in DEM simulations.
These drawbacks can be circumvented by “regularization”, atechnique consisting of removing the “small edges” of a tessella-tion, of length typically lower than a tenth of the cell size (Queyet al., 2011). Regularization removes small faces indirectly,because the latter are composed of one or several small edges.During regularization, the small edges are removed by increasinglength. An edge (and its two vertices) is collapsed to a single vertexon the condition that the resulting geometrical distortion in thevicinity of the edge is sufficiently low (typically, the neighbouringfaces must remain planar within a 200 angular tolerance). Con-straints are imposed on the vertices, edges and faces at theboundary of the domain so that the domain shape is not changed.As illustrated in Fig. 4b, regularization removes the small edges andfaces while retaining the global cell shapes. In most cases, facedistortions remain lower than 1�e2� (Quey et al., 2011). In 3DECsimulations, such distorted faces can be treated as standard, planarfaces.

Fig. 5. Two-scale Voronoi tessellations applied to modelling (a) a two-scale material(e.g. sedimentary rocks) and (b) intra-grain cracking paths.
E. Ghazvinian et al. / Journal of Rock Mechanics and Geotechnical Engineering 6 (2014) 506e521 509
3.3. Two-scale Voronoi tessellations
A “two-scale Voronoi tessellation” is a tessellation for whichevery cell of a first, “primary” Voronoi tessellation, is partitioned byanother, “secondary” Voronoi tessellation. Fig. 5 provides twopossible applications of two-scale Voronoi tessellations. First, suchtessellations enable to model microstructures that clearly exhibittwo scales such as sedimentary rocks, consisting of 45�-tilted bandsdecomposed into individual blocks (Fig. 5a). The primary Voronoitessellation was created from seeds regularly spaced along a line(hence the band structure) and the secondary Voronoi tessellationswere obtained using random seed locations. Second, two-scaletessellations enable inclusion of potential intra-grain crack pathsinto a regular, single-scale material (Fig. 5b). Intra-grain interfacescan be assigned micro-properties different from grain-to-grain in-terfaces. The algorithm for constructing a two-scale Voronoitessellation consists of sequentially constructing standard, single-scale Voronoi tessellations. Secondary Voronoi tessellations canbe constructed independently from each other. The Voronoitessellation algorithm described in Section 4.1 is used, using theprimary cell (instead of the whole domain) as a starting point forthe secondary cells. This results in a collection of secondary tes-sellations. Similarly to single-scale Voronoi tessellations, dupli-cated, or overlapping features are found at the intersectionsbetween secondary tessellations. These features must be merged toget a proper description of the tessellation. The procedure involvesmerging, creation and decomposition of vertices, edges and faceslocated at the intersection between secondary tessellations. Detailswill be provided separately. Similar to single-scale tessellations, theresulting two-scale tessellations contain small edges and faces,which can be removed by regularization.
Fig. 6. Generation of a Voronoi tessellated cube in Neper an
3.4. The Neper software
All algorithms described previously have been implemented in afree (open-source) software: Neper (Quey et al., 2011; Quey, 2014).The software offers support for both single-scale and two-scaleVoronoi tessellations, in 2D and 3D, however the focus of this pa-per is on single-scale 3D Voronoi tessellated models. Thanks toefficient and robust algorithms, very large tessellations can beeasily created (typically 105 cells). Any convex domain shape can beused; cubes (or any parallelepiped) and cylinders are directlysupported. The tessellations can also be stretched to get elongatedcells. Rotation and cropping are also straightforward operations.Finally, tessellations can be written at various formats, including3DEC for DEM simulations, and meshed for FEM simulations.
4. Grain-based model for 3DEC
The Voronoi blocks can be used for simulating fractures atdifferent scales, from micro-cracks within a laboratory specimen(Lan et al., 2010) to modelling spalling and slabbing in the walls ofunderground excavations (Itasca, 2011). The focus of this paper ison GBMs. With the currently available computational power, GBMsare commonly restricted to the laboratory specimen scale. Toinvestigate the application of the 3D Voronoi tessellation approachfor simulation of brittle micro-fracturing in rock, a series of UniaxialCompressive Strength (UCS) tests are simulated in 3DEC from thetessellations generated in Neper.
4.1. Specimen generation
Cylindrical specimens were decided to be used for the simula-tion of numerical UCS tests. Any 3D convex domain geometry canbe filled with 3D Voronoi diagrams with Neper. To avoid grainswhose geometry is affected by the domain boundary in a cylindricalspecimen, a cubical domain was generated which was then carvedinto a cylindrical specimen in 3DEC (Fig. 6). For generation of thespecimens, a cylinder with the height of 140 mmwas cut from thecentre of the tessellated block and then two 10 mm slices were cutfrom each end of the specimen. The grains in these 10 mm thickslices were joined to form the platens. The final specimen had adiameter of 55 mm and a length of 120 mm. The cubical domains inNeper were generatedwith 40,000 grains while the final cylindricalspecimens contained 5300 grains on average.
4.2. Numerical test set-up
Loading of the UCS models was performed by applying a con-stant velocity to the top and bottom platens until a moderate state
d cutting the cube into a cylindrical specimen in 3DEC.
E. Ghazvinian et al. / Journal of Rock Mechanics and Geotechnical Engineering 6 (2014) 506e521510
of monotonically increasing axial stress was reached in the speci-mens. After this stage, a servo-controlled system took over theloading control. This servo mechanism kept the average unbal-anced mechanical forces in the model within a specified range byadjusting the applied velocity to the platens. The unbalanced forceservo system is particularly important at the failure stage to keepthe loading condition within the static range. The loading velocityat the beginning of the test and the specified range for unbalancedforces for the servo-mechanically controlled loading stage was keptsmall enough to ensure the uniform distribution of stress withinthe specimen.
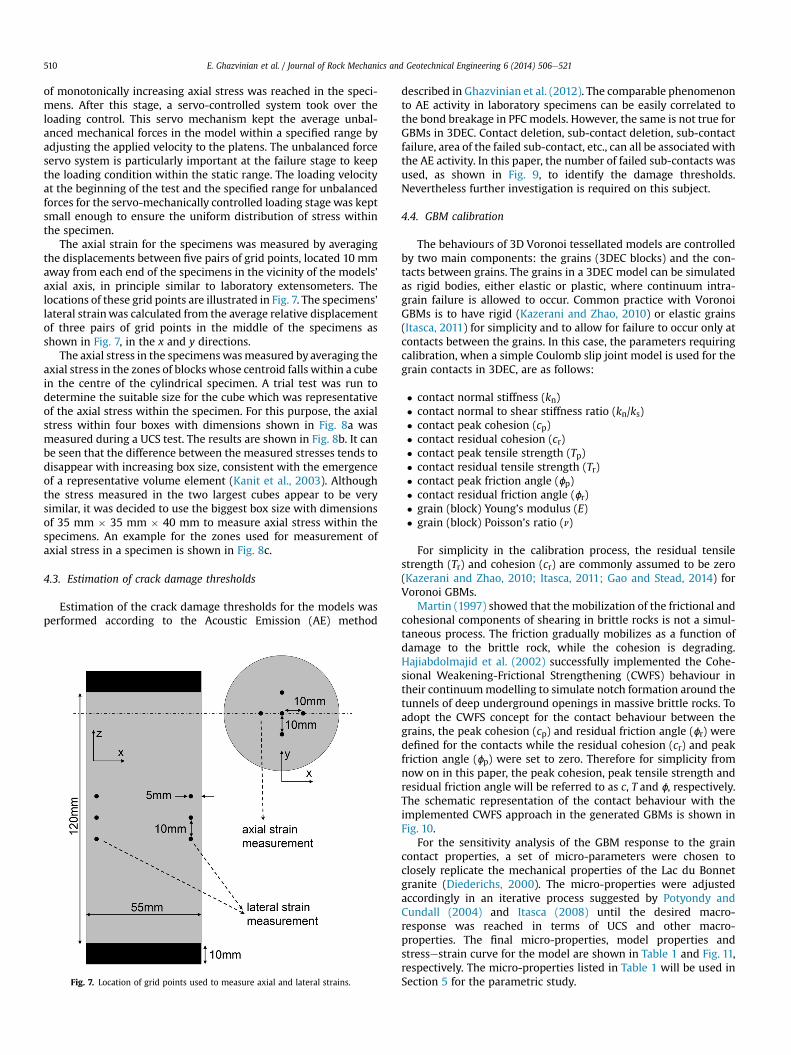
The axial strain for the specimens was measured by averagingthe displacements between five pairs of grid points, located 10 mmaway from each end of the specimens in the vicinity of the models’axial axis, in principle similar to laboratory extensometers. Thelocations of these grid points are illustrated in Fig. 7. The specimens’lateral strainwas calculated from the average relative displacementof three pairs of grid points in the middle of the specimens asshown in Fig. 7, in the x and y directions.
The axial stress in the specimenswasmeasured by averaging theaxial stress in the zones of blocks whose centroid falls within a cubein the centre of the cylindrical specimen. A trial test was run todetermine the suitable size for the cube which was representativeof the axial stress within the specimen. For this purpose, the axialstress within four boxes with dimensions shown in Fig. 8a wasmeasured during a UCS test. The results are shown in Fig. 8b. It canbe seen that the difference between the measured stresses tends todisappear with increasing box size, consistent with the emergenceof a representative volume element (Kanit et al., 2003). Althoughthe stress measured in the two largest cubes appear to be verysimilar, it was decided to use the biggest box size with dimensionsof 35 mm � 35 mm � 40 mm to measure axial stress within thespecimens. An example for the zones used for measurement ofaxial stress in a specimen is shown in Fig. 8c.
4.3. Estimation of crack damage thresholds
Estimation of the crack damage thresholds for the models wasperformed according to the Acoustic Emission (AE) method
Fig. 7. Location of grid points used to measure axial and lateral strains.
described in Ghazvinian et al. (2012). The comparable phenomenonto AE activity in laboratory specimens can be easily correlated tothe bond breakage in PFC models. However, the same is not true forGBMs in 3DEC. Contact deletion, sub-contact deletion, sub-contactfailure, area of the failed sub-contact, etc., can all be associated withthe AE activity. In this paper, the number of failed sub-contacts wasused, as shown in Fig. 9, to identify the damage thresholds.Nevertheless further investigation is required on this subject.
4.4. GBM calibration
The behaviours of 3D Voronoi tessellated models are controlledby two main components: the grains (3DEC blocks) and the con-tacts between grains. The grains in a 3DEC model can be simulatedas rigid bodies, either elastic or plastic, where continuum intra-grain failure is allowed to occur. Common practice with VoronoiGBMs is to have rigid (Kazerani and Zhao, 2010) or elastic grains(Itasca, 2011) for simplicity and to allow for failure to occur only atcontacts between the grains. In this case, the parameters requiringcalibration, when a simple Coulomb slip joint model is used for thegrain contacts in 3DEC, are as follows:
� contact normal stiffness (kn)� contact normal to shear stiffness ratio (kn/ks)� contact peak cohesion (cp)� contact residual cohesion (cr)� contact peak tensile strength (Tp)� contact residual tensile strength (Tr)� contact peak friction angle (ɸp)� contact residual friction angle (ɸr)� grain (block) Young’s modulus (E)� grain (block) Poisson’s ratio (n)
For simplicity in the calibration process, the residual tensilestrength (Tr) and cohesion (cr) are commonly assumed to be zero(Kazerani and Zhao, 2010; Itasca, 2011; Gao and Stead, 2014) forVoronoi GBMs.
Martin (1997) showed that the mobilization of the frictional andcohesional components of shearing in brittle rocks is not a simul-taneous process. The friction gradually mobilizes as a function ofdamage to the brittle rock, while the cohesion is degrading.Hajiabdolmajid et al. (2002) successfully implemented the Cohe-sional Weakening-Frictional Strengthening (CWFS) behaviour intheir continuummodelling to simulate notch formation around thetunnels of deep underground openings in massive brittle rocks. Toadopt the CWFS concept for the contact behaviour between thegrains, the peak cohesion (cp) and residual friction angle (ɸr) weredefined for the contacts while the residual cohesion (cr) and peakfriction angle (ɸp) were set to zero. Therefore for simplicity fromnow on in this paper, the peak cohesion, peak tensile strength andresidual friction angle will be referred to as c, T and ɸ, respectively.The schematic representation of the contact behaviour with theimplemented CWFS approach in the generated GBMs is shown inFig. 10.
For the sensitivity analysis of the GBM response to the graincontact properties, a set of micro-parameters were chosen toclosely replicate the mechanical properties of the Lac du Bonnetgranite (Diederichs, 2000). The micro-properties were adjustedaccordingly in an iterative process suggested by Potyondy andCundall (2004) and Itasca (2008) until the desired macro-response was reached in terms of UCS and other macro-properties. The final micro-properties, model properties andstressestrain curve for the model are shown in Table 1 and Fig. 11,respectively. The micro-properties listed in Table 1 will be used inSection 5 for the parametric study.
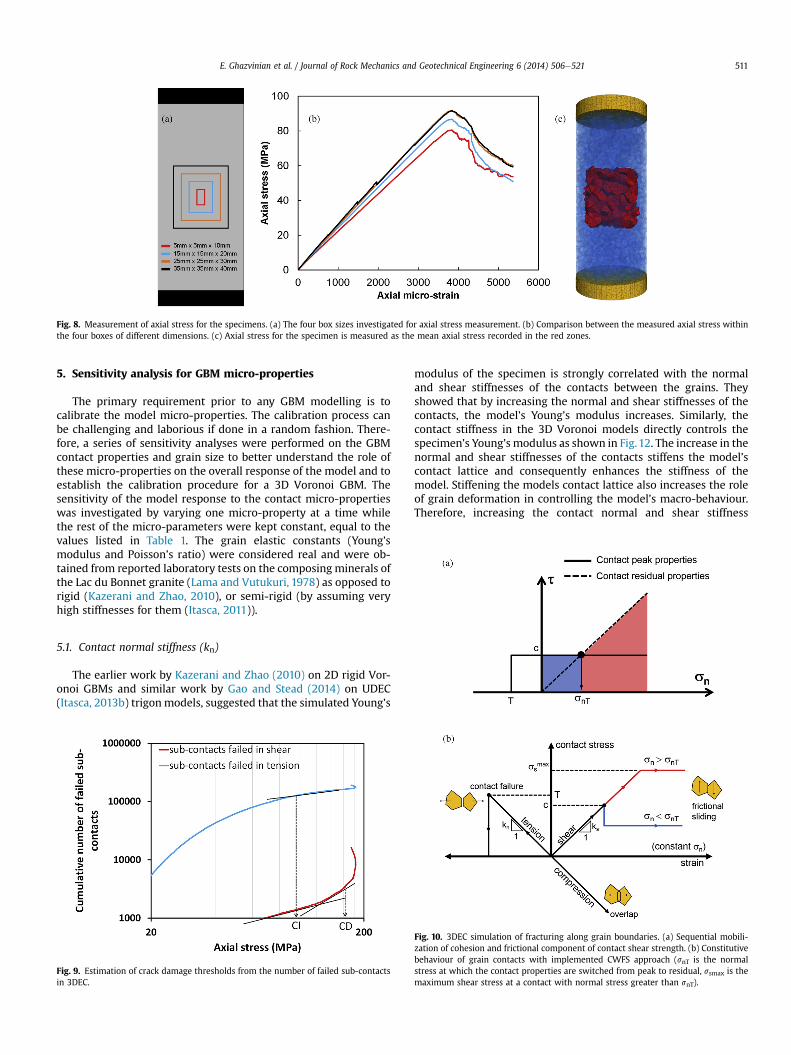
Fig. 8. Measurement of axial stress for the specimens. (a) The four box sizes investigated for axial stress measurement. (b) Comparison between the measured axial stress withinthe four boxes of different dimensions. (c) Axial stress for the specimen is measured as the mean axial stress recorded in the red zones.
E. Ghazvinian et al. / Journal of Rock Mechanics and Geotechnical Engineering 6 (2014) 506e521 511
5. Sensitivity analysis for GBM micro-properties
The primary requirement prior to any GBM modelling is tocalibrate the model micro-properties. The calibration process canbe challenging and laborious if done in a random fashion. There-fore, a series of sensitivity analyses were performed on the GBMcontact properties and grain size to better understand the role ofthese micro-properties on the overall response of the model and toestablish the calibration procedure for a 3D Voronoi GBM. Thesensitivity of the model response to the contact micro-propertieswas investigated by varying one micro-property at a time whilethe rest of the micro-parameters were kept constant, equal to thevalues listed in Table 1. The grain elastic constants (Young’smodulus and Poisson’s ratio) were considered real and were ob-tained from reported laboratory tests on the composing minerals ofthe Lac du Bonnet granite (Lama and Vutukuri, 1978) as opposed torigid (Kazerani and Zhao, 2010), or semi-rigid (by assuming veryhigh stiffnesses for them (Itasca, 2011)).
5.1. Contact normal stiffness (kn)
The earlier work by Kazerani and Zhao (2010) on 2D rigid Vor-onoi GBMs and similar work by Gao and Stead (2014) on UDEC(Itasca, 2013b) trigonmodels, suggested that the simulated Young’s
Fig. 9. Estimation of crack damage thresholds from the number of failed sub-contactsin 3DEC.
modulus of the specimen is strongly correlated with the normaland shear stiffnesses of the contacts between the grains. Theyshowed that by increasing the normal and shear stiffnesses of thecontacts, the model’s Young’s modulus increases. Similarly, thecontact stiffness in the 3D Voronoi models directly controls thespecimen’s Young’s modulus as shown in Fig.12. The increase in thenormal and shear stiffnesses of the contacts stiffens the model’scontact lattice and consequently enhances the stiffness of themodel. Stiffening the models contact lattice also increases the roleof grain deformation in controlling the model’s macro-behaviour.Therefore, increasing the contact normal and shear stiffness
Fig. 10. 3DEC simulation of fracturing along grain boundaries. (a) Sequential mobili-zation of cohesion and frictional component of contact shear strength. (b) Constitutivebehaviour of grain contacts with implemented CWFS approach (snT is the normalstress at which the contact properties are switched from peak to residual, ssmax is themaximum shear stress at a contact with normal stress greater than snT).
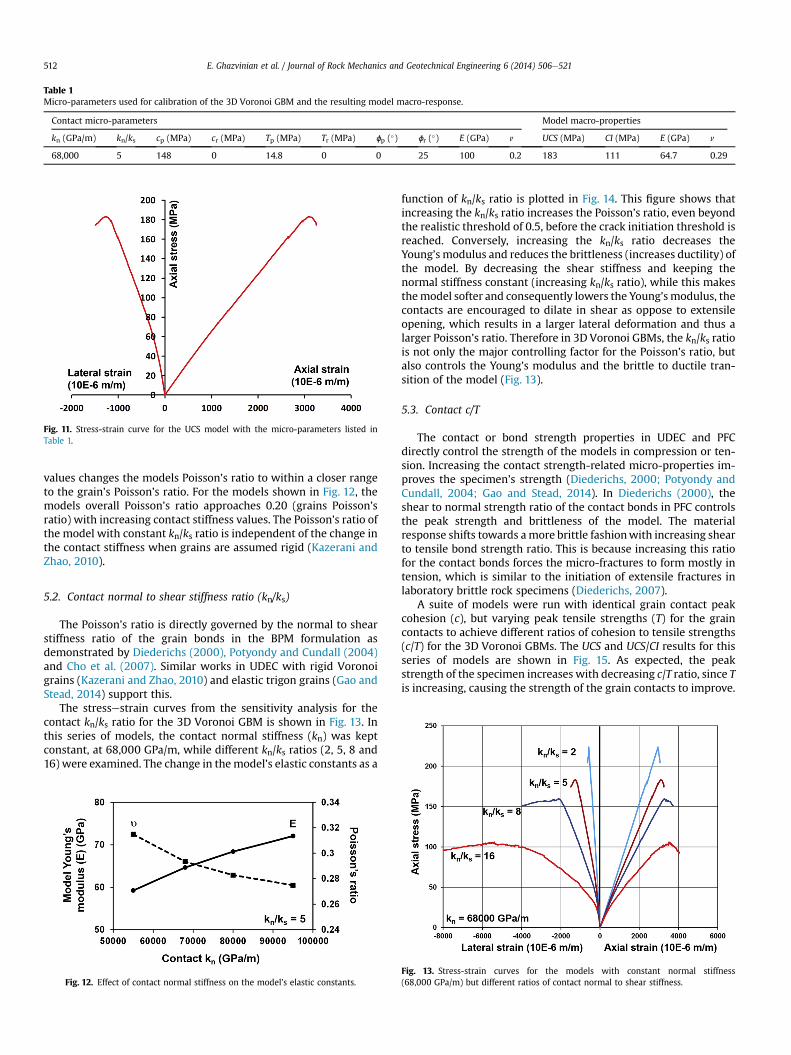
Table 1Micro-parameters used for calibration of the 3D Voronoi GBM and the resulting model macro-response.
Contact micro-parameters Model macro-properties
kn (GPa/m) kn/ks cp (MPa) cr (MPa) Tp (MPa) Tr (MPa) ɸp (�) ɸr (�) E (GPa) n UCS (MPa) CI (MPa) E (GPa) n
68,000 5 148 0 14.8 0 0 25 100 0.2 183 111 64.7 0.29
Fig. 11. Stress-strain curve for the UCS model with the micro-parameters listed inTable 1.
E. Ghazvinian et al. / Journal of Rock Mechanics and Geotechnical Engineering 6 (2014) 506e521512
values changes the models Poisson’s ratio to within a closer rangeto the grain’s Poisson’s ratio. For the models shown in Fig. 12, themodels overall Poisson’s ratio approaches 0.20 (grains Poisson’sratio) with increasing contact stiffness values. The Poisson’s ratio ofthe model with constant kn/ks ratio is independent of the change inthe contact stiffness when grains are assumed rigid (Kazerani andZhao, 2010).
5.2. Contact normal to shear stiffness ratio (kn/ks)
The Poisson’s ratio is directly governed by the normal to shearstiffness ratio of the grain bonds in the BPM formulation asdemonstrated by Diederichs (2000), Potyondy and Cundall (2004)and Cho et al. (2007). Similar works in UDEC with rigid Voronoigrains (Kazerani and Zhao, 2010) and elastic trigon grains (Gao andStead, 2014) support this.
The stressestrain curves from the sensitivity analysis for thecontact kn/ks ratio for the 3D Voronoi GBM is shown in Fig. 13. Inthis series of models, the contact normal stiffness (kn) was keptconstant, at 68,000 GPa/m, while different kn/ks ratios (2, 5, 8 and16) were examined. The change in themodel’s elastic constants as a
Fig. 12. Effect of contact normal stiffness on the model’s elastic constants.
function of kn/ks ratio is plotted in Fig. 14. This figure shows thatincreasing the kn/ks ratio increases the Poisson’s ratio, even beyondthe realistic threshold of 0.5, before the crack initiation threshold isreached. Conversely, increasing the kn/ks ratio decreases theYoung’s modulus and reduces the brittleness (increases ductility) ofthe model. By decreasing the shear stiffness and keeping thenormal stiffness constant (increasing kn/ks ratio), while this makesthemodel softer and consequently lowers the Young’smodulus, thecontacts are encouraged to dilate in shear as oppose to extensileopening, which results in a larger lateral deformation and thus alarger Poisson’s ratio. Therefore in 3D Voronoi GBMs, the kn/ks ratiois not only the major controlling factor for the Poisson’s ratio, butalso controls the Young’s modulus and the brittle to ductile tran-sition of the model (Fig. 13).
5.3. Contact c/T
The contact or bond strength properties in UDEC and PFCdirectly control the strength of the models in compression or ten-sion. Increasing the contact strength-related micro-properties im-proves the specimen’s strength (Diederichs, 2000; Potyondy andCundall, 2004; Gao and Stead, 2014). In Diederichs (2000), theshear to normal strength ratio of the contact bonds in PFC controlsthe peak strength and brittleness of the model. The materialresponse shifts towards amore brittle fashionwith increasing shearto tensile bond strength ratio. This is because increasing this ratiofor the contact bonds forces the micro-fractures to form mostly intension, which is similar to the initiation of extensile fractures inlaboratory brittle rock specimens (Diederichs, 2007).
A suite of models were run with identical grain contact peakcohesion (c), but varying peak tensile strengths (T) for the graincontacts to achieve different ratios of cohesion to tensile strengths(c/T) for the 3D Voronoi GBMs. The UCS and UCS/CI results for thisseries of models are shown in Fig. 15. As expected, the peakstrength of the specimen increases with decreasing c/T ratio, since Tis increasing, causing the strength of the grain contacts to improve.
Fig. 13. Stress-strain curves for the models with constant normal stiffness(68,000 GPa/m) but different ratios of contact normal to shear stiffness.
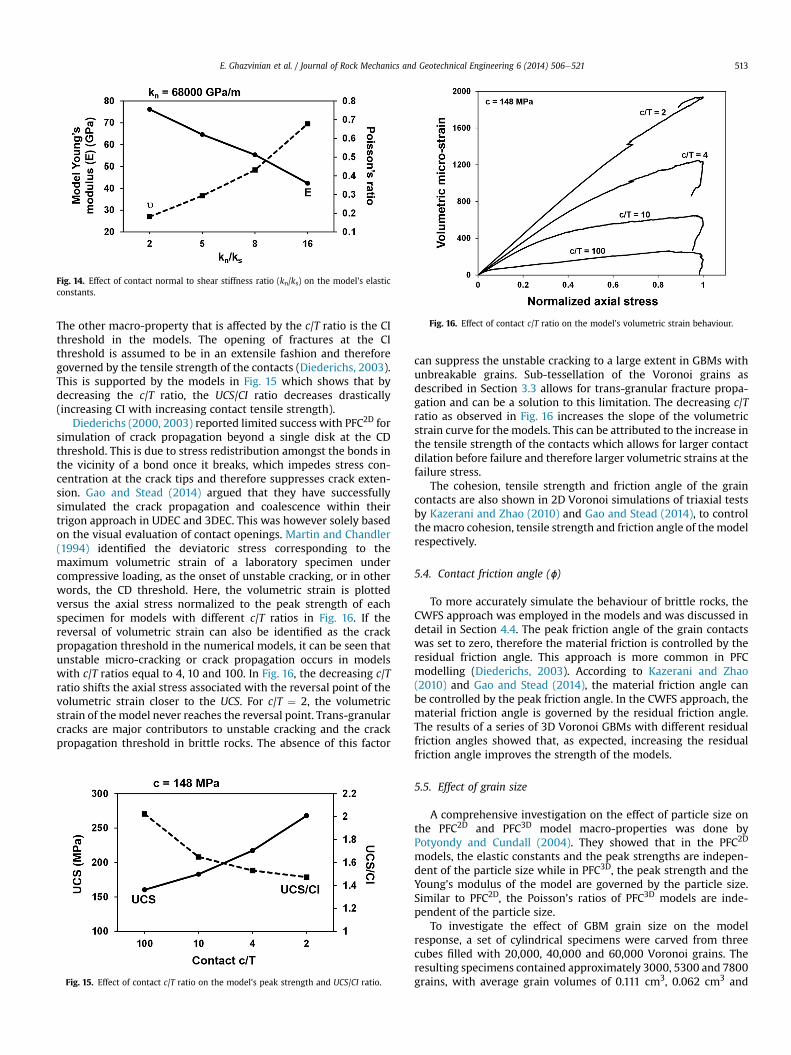
Fig. 14. Effect of contact normal to shear stiffness ratio (kn/ks) on the model’s elasticconstants.
Fig. 16. Effect of contact c/T ratio on the model’s volumetric strain behaviour.
E. Ghazvinian et al. / Journal of Rock Mechanics and Geotechnical Engineering 6 (2014) 506e521 513
The other macro-property that is affected by the c/T ratio is the CIthreshold in the models. The opening of fractures at the CIthreshold is assumed to be in an extensile fashion and thereforegoverned by the tensile strength of the contacts (Diederichs, 2003).This is supported by the models in Fig. 15 which shows that bydecreasing the c/T ratio, the UCS/CI ratio decreases drastically(increasing CI with increasing contact tensile strength).
Diederichs (2000, 2003) reported limited success with PFC2D forsimulation of crack propagation beyond a single disk at the CDthreshold. This is due to stress redistribution amongst the bonds inthe vicinity of a bond once it breaks, which impedes stress con-centration at the crack tips and therefore suppresses crack exten-sion. Gao and Stead (2014) argued that they have successfullysimulated the crack propagation and coalescence within theirtrigon approach in UDEC and 3DEC. This was however solely basedon the visual evaluation of contact openings. Martin and Chandler(1994) identified the deviatoric stress corresponding to themaximum volumetric strain of a laboratory specimen undercompressive loading, as the onset of unstable cracking, or in otherwords, the CD threshold. Here, the volumetric strain is plottedversus the axial stress normalized to the peak strength of eachspecimen for models with different c/T ratios in Fig. 16. If thereversal of volumetric strain can also be identified as the crackpropagation threshold in the numerical models, it can be seen thatunstable micro-cracking or crack propagation occurs in modelswith c/T ratios equal to 4, 10 and 100. In Fig. 16, the decreasing c/Tratio shifts the axial stress associated with the reversal point of thevolumetric strain closer to the UCS. For c/T ¼ 2, the volumetricstrain of the model never reaches the reversal point. Trans-granularcracks are major contributors to unstable cracking and the crackpropagation threshold in brittle rocks. The absence of this factor
Fig. 15. Effect of contact c/T ratio on the model’s peak strength and UCS/CI ratio.
can suppress the unstable cracking to a large extent in GBMs withunbreakable grains. Sub-tessellation of the Voronoi grains asdescribed in Section 3.3 allows for trans-granular fracture propa-gation and can be a solution to this limitation. The decreasing c/Tratio as observed in Fig. 16 increases the slope of the volumetricstrain curve for the models. This can be attributed to the increase inthe tensile strength of the contacts which allows for larger contactdilation before failure and therefore larger volumetric strains at thefailure stress.
The cohesion, tensile strength and friction angle of the graincontacts are also shown in 2D Voronoi simulations of triaxial testsby Kazerani and Zhao (2010) and Gao and Stead (2014), to controlthemacro cohesion, tensile strength and friction angle of themodelrespectively.
5.4. Contact friction angle (ɸ)
To more accurately simulate the behaviour of brittle rocks, theCWFS approach was employed in the models and was discussed indetail in Section 4.4. The peak friction angle of the grain contactswas set to zero, therefore the material friction is controlled by theresidual friction angle. This approach is more common in PFCmodelling (Diederichs, 2003). According to Kazerani and Zhao(2010) and Gao and Stead (2014), the material friction angle canbe controlled by the peak friction angle. In the CWFS approach, thematerial friction angle is governed by the residual friction angle.The results of a series of 3D Voronoi GBMs with different residualfriction angles showed that, as expected, increasing the residualfriction angle improves the strength of the models.
5.5. Effect of grain size
A comprehensive investigation on the effect of particle size onthe PFC2D and PFC3D model macro-properties was done byPotyondy and Cundall (2004). They showed that in the PFC2D
models, the elastic constants and the peak strengths are indepen-dent of the particle size while in PFC3D, the peak strength and theYoung’s modulus of the model are governed by the particle size.Similar to PFC2D, the Poisson’s ratios of PFC3D models are inde-pendent of the particle size.
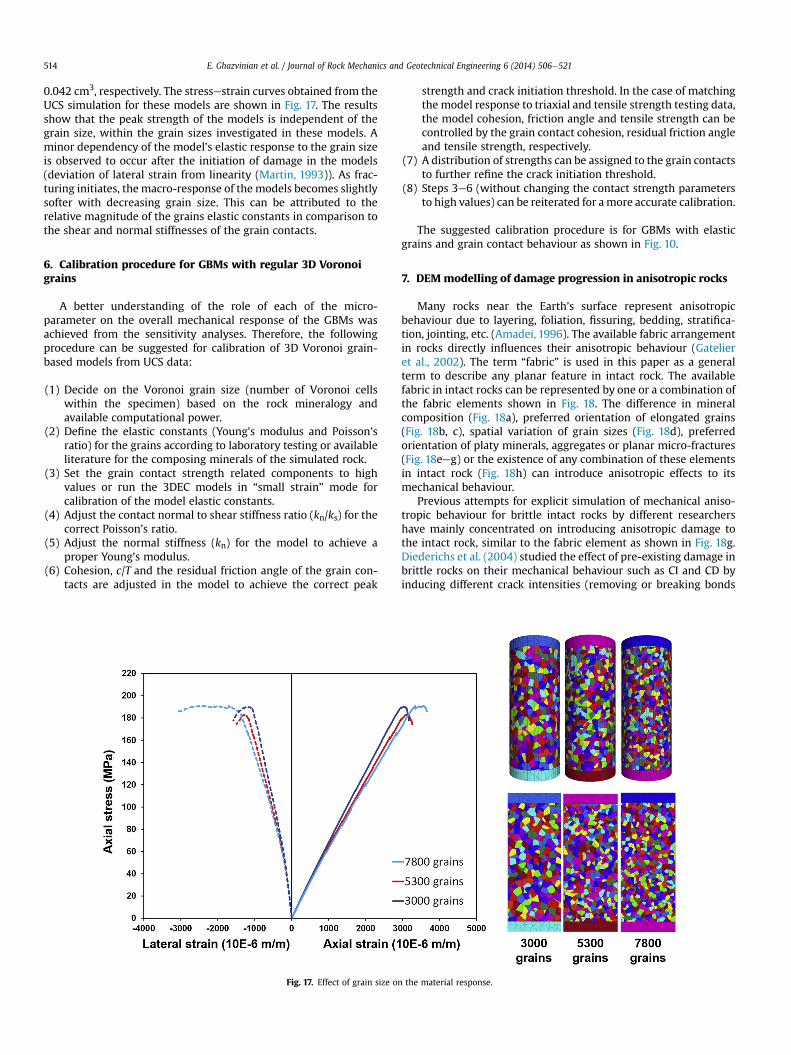
To investigate the effect of GBM grain size on the modelresponse, a set of cylindrical specimens were carved from threecubes filled with 20,000, 40,000 and 60,000 Voronoi grains. Theresulting specimens contained approximately 3000, 5300 and 7800grains, with average grain volumes of 0.111 cm3, 0.062 cm3 and
E. Ghazvinian et al. / Journal of Rock Mechanics and Geotechnical Engineering 6 (2014) 506e521514
0.042 cm3, respectively. The stressestrain curves obtained from theUCS simulation for these models are shown in Fig. 17. The resultsshow that the peak strength of the models is independent of thegrain size, within the grain sizes investigated in these models. Aminor dependency of the model’s elastic response to the grain sizeis observed to occur after the initiation of damage in the models(deviation of lateral strain from linearity (Martin, 1993)). As frac-turing initiates, the macro-response of the models becomes slightlysofter with decreasing grain size. This can be attributed to therelative magnitude of the grains elastic constants in comparison tothe shear and normal stiffnesses of the grain contacts.
6. Calibration procedure for GBMs with regular 3D Voronoigrains
A better understanding of the role of each of the micro-parameter on the overall mechanical response of the GBMs wasachieved from the sensitivity analyses. Therefore, the followingprocedure can be suggested for calibration of 3D Voronoi grain-based models from UCS data:
(1) Decide on the Voronoi grain size (number of Voronoi cellswithin the specimen) based on the rock mineralogy andavailable computational power.
(2) Define the elastic constants (Young’s modulus and Poisson’sratio) for the grains according to laboratory testing or availableliterature for the composing minerals of the simulated rock.
(3) Set the grain contact strength related components to highvalues or run the 3DEC models in “small strain” mode forcalibration of the model elastic constants.
(4) Adjust the contact normal to shear stiffness ratio (kn/ks) for thecorrect Poisson’s ratio.
(5) Adjust the normal stiffness (kn) for the model to achieve aproper Young’s modulus.
(6) Cohesion, c/T and the residual friction angle of the grain con-tacts are adjusted in the model to achieve the correct peak
Fig. 17. Effect of grain size on
strength and crack initiation threshold. In the case of matchingthe model response to triaxial and tensile strength testing data,the model cohesion, friction angle and tensile strength can becontrolled by the grain contact cohesion, residual friction angleand tensile strength, respectively.
(7) A distribution of strengths can be assigned to the grain contactsto further refine the crack initiation threshold.
(8) Steps 3e6 (without changing the contact strength parametersto high values) can be reiterated for amore accurate calibration.
The suggested calibration procedure is for GBMs with elasticgrains and grain contact behaviour as shown in Fig. 10.
7. DEM modelling of damage progression in anisotropic rocks
Many rocks near the Earth’s surface represent anisotropicbehaviour due to layering, foliation, fissuring, bedding, stratifica-tion, jointing, etc. (Amadei, 1996). The available fabric arrangementin rocks directly influences their anisotropic behaviour (Gatelieret al., 2002). The term “fabric” is used in this paper as a generalterm to describe any planar feature in intact rock. The availablefabric in intact rocks can be represented by one or a combination ofthe fabric elements shown in Fig. 18. The difference in mineralcomposition (Fig. 18a), preferred orientation of elongated grains(Fig. 18b, c), spatial variation of grain sizes (Fig. 18d), preferredorientation of platy minerals, aggregates or planar micro-fractures(Fig. 18eeg) or the existence of any combination of these elementsin intact rock (Fig. 18h) can introduce anisotropic effects to itsmechanical behaviour.
Previous attempts for explicit simulation of mechanical aniso-tropic behaviour for brittle intact rocks by different researchershave mainly concentrated on introducing anisotropic damage tothe intact rock, similar to the fabric element as shown in Fig. 18g.Diederichs et al. (2004) studied the effect of pre-existing damage inbrittle rocks on their mechanical behaviour such as CI and CD byinducing different crack intensities (removing or breaking bonds
the material response.
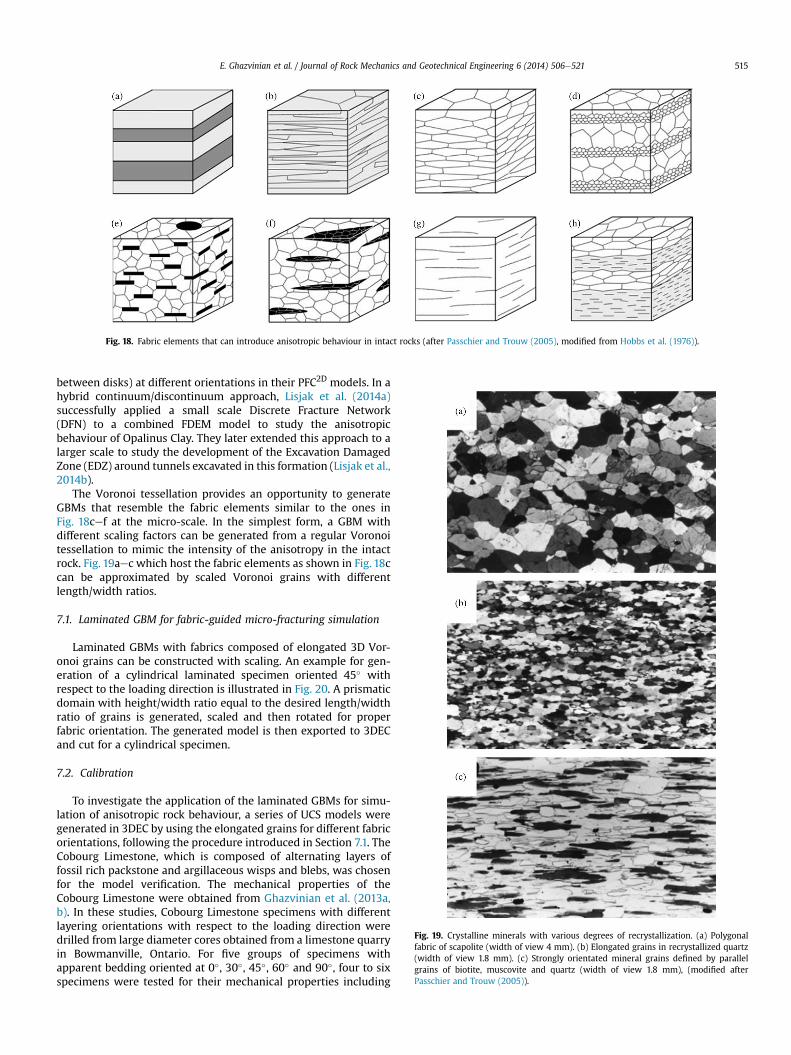
Fig. 18. Fabric elements that can introduce anisotropic behaviour in intact rocks (after Passchier and Trouw (2005), modified from Hobbs et al. (1976)).
Fig. 19. Crystalline minerals with various degrees of recrystallization. (a) Polygonalfabric of scapolite (width of view 4 mm). (b) Elongated grains in recrystallized quartz(width of view 1.8 mm). (c) Strongly orientated mineral grains defined by parallelgrains of biotite, muscovite and quartz (width of view 1.8 mm), (modified afterPasschier and Trouw (2005)).
E. Ghazvinian et al. / Journal of Rock Mechanics and Geotechnical Engineering 6 (2014) 506e521 515
between disks) at different orientations in their PFC2D models. In ahybrid continuum/discontinuum approach, Lisjak et al. (2014a)successfully applied a small scale Discrete Fracture Network(DFN) to a combined FDEM model to study the anisotropicbehaviour of Opalinus Clay. They later extended this approach to alarger scale to study the development of the Excavation DamagedZone (EDZ) around tunnels excavated in this formation (Lisjak et al.,2014b).
The Voronoi tessellation provides an opportunity to generateGBMs that resemble the fabric elements similar to the ones inFig. 18cef at the micro-scale. In the simplest form, a GBM withdifferent scaling factors can be generated from a regular Voronoitessellation to mimic the intensity of the anisotropy in the intactrock. Fig. 19aec which host the fabric elements as shown in Fig. 18ccan be approximated by scaled Voronoi grains with differentlength/width ratios.
7.1. Laminated GBM for fabric-guided micro-fracturing simulation
Laminated GBMs with fabrics composed of elongated 3D Vor-onoi grains can be constructed with scaling. An example for gen-eration of a cylindrical laminated specimen oriented 45� withrespect to the loading direction is illustrated in Fig. 20. A prismaticdomain with height/width ratio equal to the desired length/widthratio of grains is generated, scaled and then rotated for properfabric orientation. The generated model is then exported to 3DECand cut for a cylindrical specimen.
7.2. Calibration
To investigate the application of the laminated GBMs for simu-lation of anisotropic rock behaviour, a series of UCS models weregenerated in 3DEC by using the elongated grains for different fabricorientations, following the procedure introduced in Section 7.1. TheCobourg Limestone, which is composed of alternating layers offossil rich packstone and argillaceous wisps and blebs, was chosenfor the model verification. The mechanical properties of theCobourg Limestone were obtained from Ghazvinian et al. (2013a,b). In these studies, Cobourg Limestone specimens with differentlayering orientations with respect to the loading direction weredrilled from large diameter cores obtained from a limestone quarryin Bowmanville, Ontario. For five groups of specimens withapparent bedding oriented at 0�, 30�, 45�, 60� and 90�, four to sixspecimens were tested for their mechanical properties including
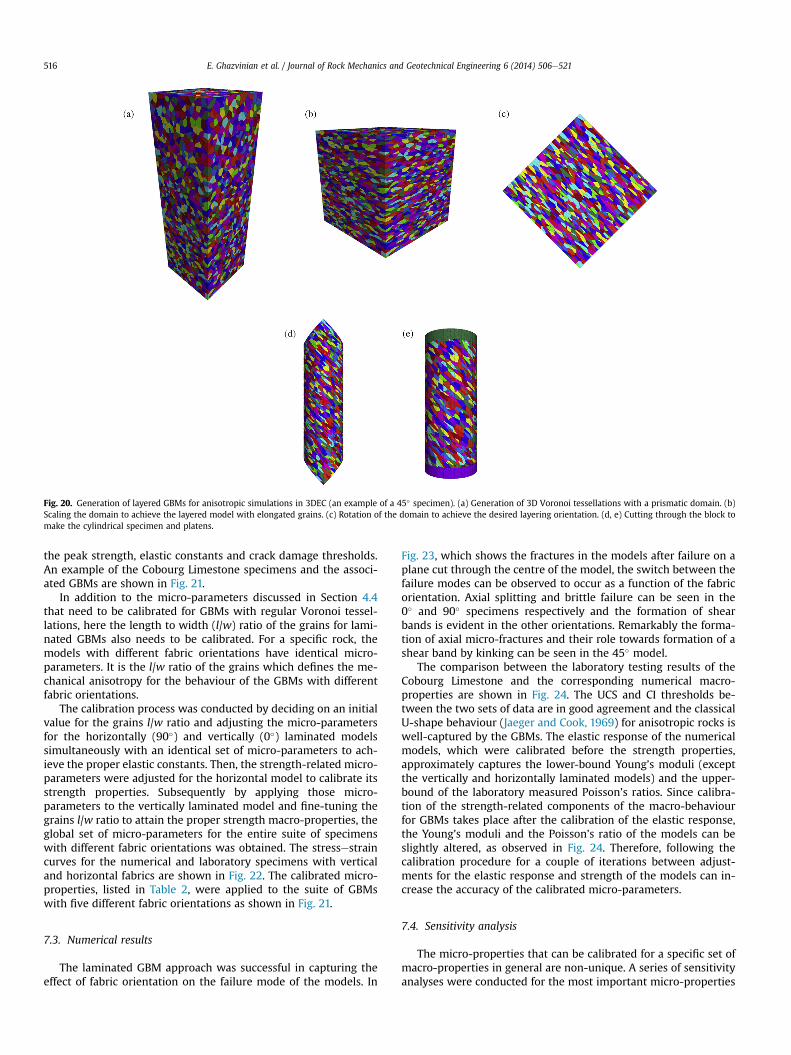
Fig. 20. Generation of layered GBMs for anisotropic simulations in 3DEC (an example of a 45� specimen). (a) Generation of 3D Voronoi tessellations with a prismatic domain. (b)Scaling the domain to achieve the layered model with elongated grains. (c) Rotation of the domain to achieve the desired layering orientation. (d, e) Cutting through the block tomake the cylindrical specimen and platens.
E. Ghazvinian et al. / Journal of Rock Mechanics and Geotechnical Engineering 6 (2014) 506e521516
the peak strength, elastic constants and crack damage thresholds.An example of the Cobourg Limestone specimens and the associ-ated GBMs are shown in Fig. 21.
In addition to the micro-parameters discussed in Section 4.4that need to be calibrated for GBMs with regular Voronoi tessel-lations, here the length to width (l/w) ratio of the grains for lami-nated GBMs also needs to be calibrated. For a specific rock, themodels with different fabric orientations have identical micro-parameters. It is the l/w ratio of the grains which defines the me-chanical anisotropy for the behaviour of the GBMs with differentfabric orientations.
The calibration process was conducted by deciding on an initialvalue for the grains l/w ratio and adjusting the micro-parametersfor the horizontally (90�) and vertically (0�) laminated modelssimultaneously with an identical set of micro-parameters to ach-ieve the proper elastic constants. Then, the strength-related micro-parameters were adjusted for the horizontal model to calibrate itsstrength properties. Subsequently by applying those micro-parameters to the vertically laminated model and fine-tuning thegrains l/w ratio to attain the proper strength macro-properties, theglobal set of micro-parameters for the entire suite of specimenswith different fabric orientations was obtained. The stressestraincurves for the numerical and laboratory specimens with verticaland horizontal fabrics are shown in Fig. 22. The calibrated micro-properties, listed in Table 2, were applied to the suite of GBMswith five different fabric orientations as shown in Fig. 21.
7.3. Numerical results
The laminated GBM approach was successful in capturing theeffect of fabric orientation on the failure mode of the models. In
Fig. 23, which shows the fractures in the models after failure on aplane cut through the centre of the model, the switch between thefailure modes can be observed to occur as a function of the fabricorientation. Axial splitting and brittle failure can be seen in the0� and 90� specimens respectively and the formation of shearbands is evident in the other orientations. Remarkably the forma-tion of axial micro-fractures and their role towards formation of ashear band by kinking can be seen in the 45� model.
The comparison between the laboratory testing results of theCobourg Limestone and the corresponding numerical macro-properties are shown in Fig. 24. The UCS and CI thresholds be-tween the two sets of data are in good agreement and the classicalU-shape behaviour (Jaeger and Cook, 1969) for anisotropic rocks iswell-captured by the GBMs. The elastic response of the numericalmodels, which were calibrated before the strength properties,approximately captures the lower-bound Young’s moduli (exceptthe vertically and horizontally laminated models) and the upper-bound of the laboratory measured Poisson’s ratios. Since calibra-tion of the strength-related components of the macro-behaviourfor GBMs takes place after the calibration of the elastic response,the Young’s moduli and the Poisson’s ratio of the models can beslightly altered, as observed in Fig. 24. Therefore, following thecalibration procedure for a couple of iterations between adjust-ments for the elastic response and strength of the models can in-crease the accuracy of the calibrated micro-parameters.
7.4. Sensitivity analysis
The micro-properties that can be calibrated for a specific set ofmacro-properties in general are non-unique. A series of sensitivityanalyses were conducted for the most important micro-properties
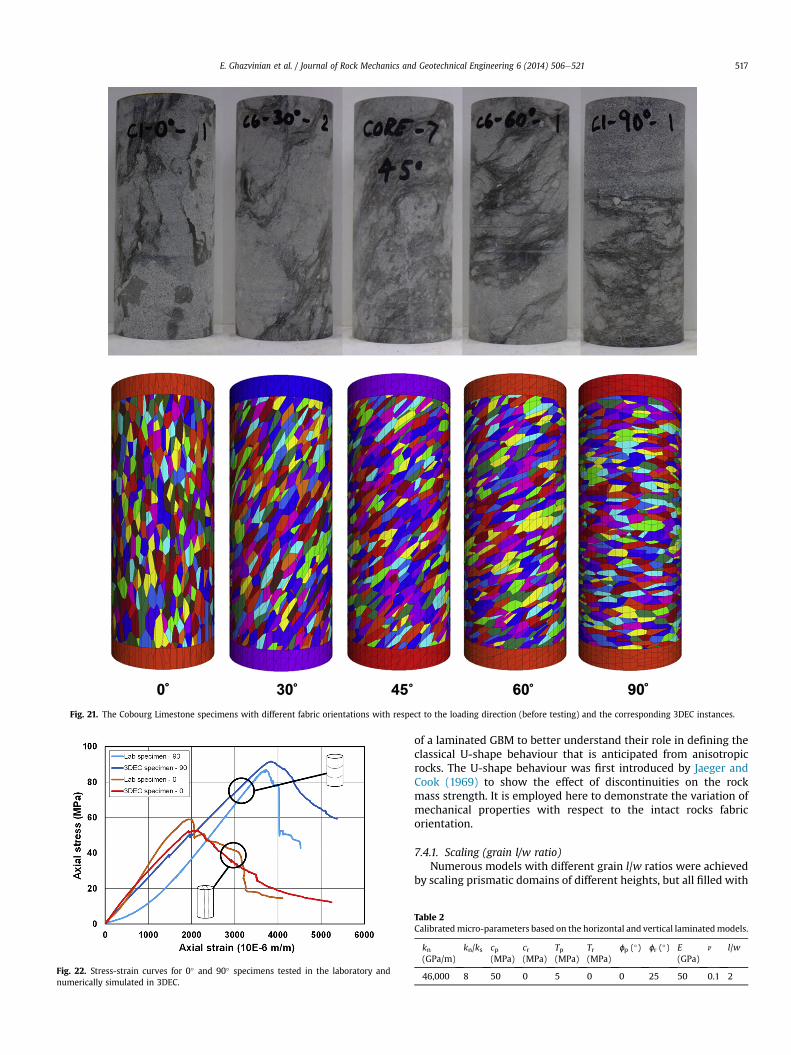
Fig. 21. The Cobourg Limestone specimens with different fabric orientations with respect to the loading direction (before testing) and the corresponding 3DEC instances.
Fig. 22. Stress-strain curves for 0� and 90� specimens tested in the laboratory andnumerically simulated in 3DEC.
E. Ghazvinian et al. / Journal of Rock Mechanics and Geotechnical Engineering 6 (2014) 506e521 517
of a laminated GBM to better understand their role in defining theclassical U-shape behaviour that is anticipated from anisotropicrocks. The U-shape behaviour was first introduced by Jaeger andCook (1969) to show the effect of discontinuities on the rockmass strength. It is employed here to demonstrate the variation ofmechanical properties with respect to the intact rocks fabricorientation.
7.4.1. Scaling (grain l/w ratio)Numerous models with different grain l/w ratios were achieved
by scaling prismatic domains of different heights, but all filled with
Table 2Calibratedmicro-parameters based on the horizontal and vertical laminatedmodels.
kn(GPa/m)
kn/ks cp(MPa)
cr(MPa)
Tp(MPa)
Tr(MPa)
ɸp (�) ɸr (�) E(GPa)
n l/w
46,000 8 50 0 5 0 0 25 50 0.1 2
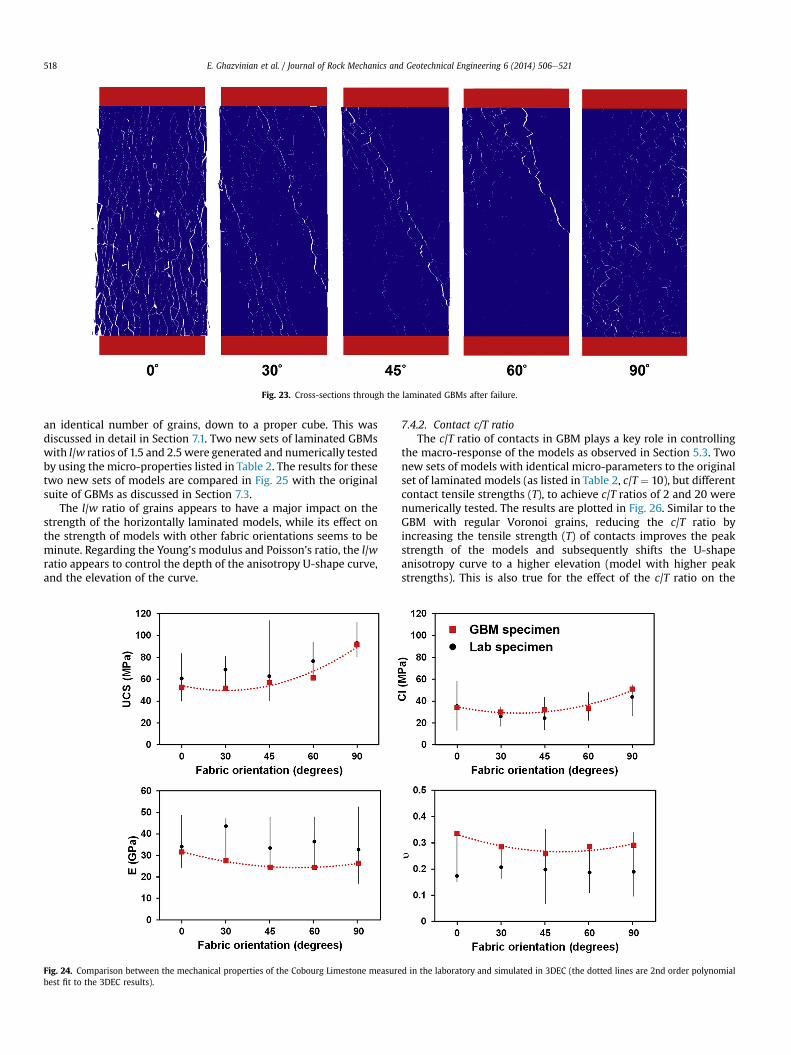
Fig. 23. Cross-sections through the laminated GBMs after failure.
E. Ghazvinian et al. / Journal of Rock Mechanics and Geotechnical Engineering 6 (2014) 506e521518
an identical number of grains, down to a proper cube. This wasdiscussed in detail in Section 7.1. Two new sets of laminated GBMswith l/w ratios of 1.5 and 2.5 were generated and numerically testedby using the micro-properties listed in Table 2. The results for thesetwo new sets of models are compared in Fig. 25 with the originalsuite of GBMs as discussed in Section 7.3.
The l/w ratio of grains appears to have a major impact on thestrength of the horizontally laminated models, while its effect onthe strength of models with other fabric orientations seems to beminute. Regarding the Young’s modulus and Poisson’s ratio, the l/wratio appears to control the depth of the anisotropy U-shape curve,and the elevation of the curve.
Fig. 24. Comparison between the mechanical properties of the Cobourg Limestone measurebest fit to the 3DEC results).
7.4.2. Contact c/T ratioThe c/T ratio of contacts in GBM plays a key role in controlling
the macro-response of the models as observed in Section 5.3. Twonew sets of models with identical micro-parameters to the originalset of laminated models (as listed in Table 2, c/T ¼ 10), but differentcontact tensile strengths (T), to achieve c/T ratios of 2 and 20 werenumerically tested. The results are plotted in Fig. 26. Similar to theGBM with regular Voronoi grains, reducing the c/T ratio byincreasing the tensile strength (T) of contacts improves the peakstrength of the models and subsequently shifts the U-shapeanisotropy curve to a higher elevation (model with higher peakstrengths). This is also true for the effect of the c/T ratio on the
d in the laboratory and simulated in 3DEC (the dotted lines are 2nd order polynomial
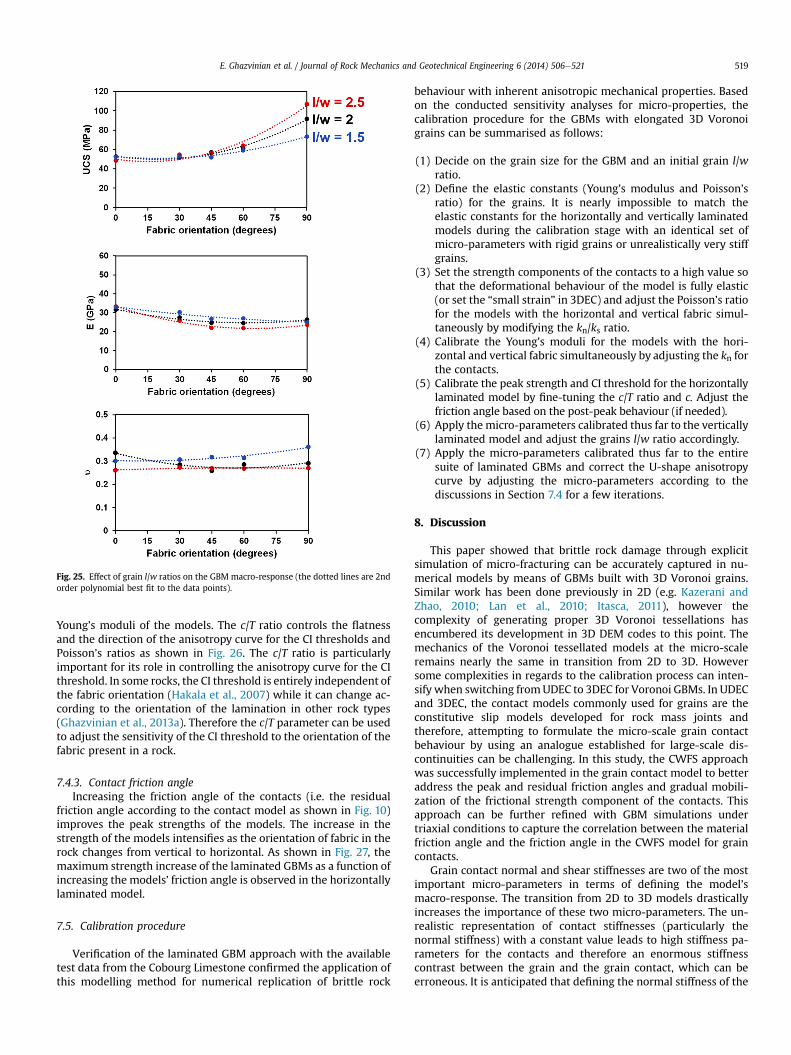
Fig. 25. Effect of grain l/w ratios on the GBM macro-response (the dotted lines are 2ndorder polynomial best fit to the data points).
E. Ghazvinian et al. / Journal of Rock Mechanics and Geotechnical Engineering 6 (2014) 506e521 519
Young’s moduli of the models. The c/T ratio controls the flatnessand the direction of the anisotropy curve for the CI thresholds andPoisson’s ratios as shown in Fig. 26. The c/T ratio is particularlyimportant for its role in controlling the anisotropy curve for the CIthreshold. In some rocks, the CI threshold is entirely independent ofthe fabric orientation (Hakala et al., 2007) while it can change ac-cording to the orientation of the lamination in other rock types(Ghazvinian et al., 2013a). Therefore the c/T parameter can be usedto adjust the sensitivity of the CI threshold to the orientation of thefabric present in a rock.
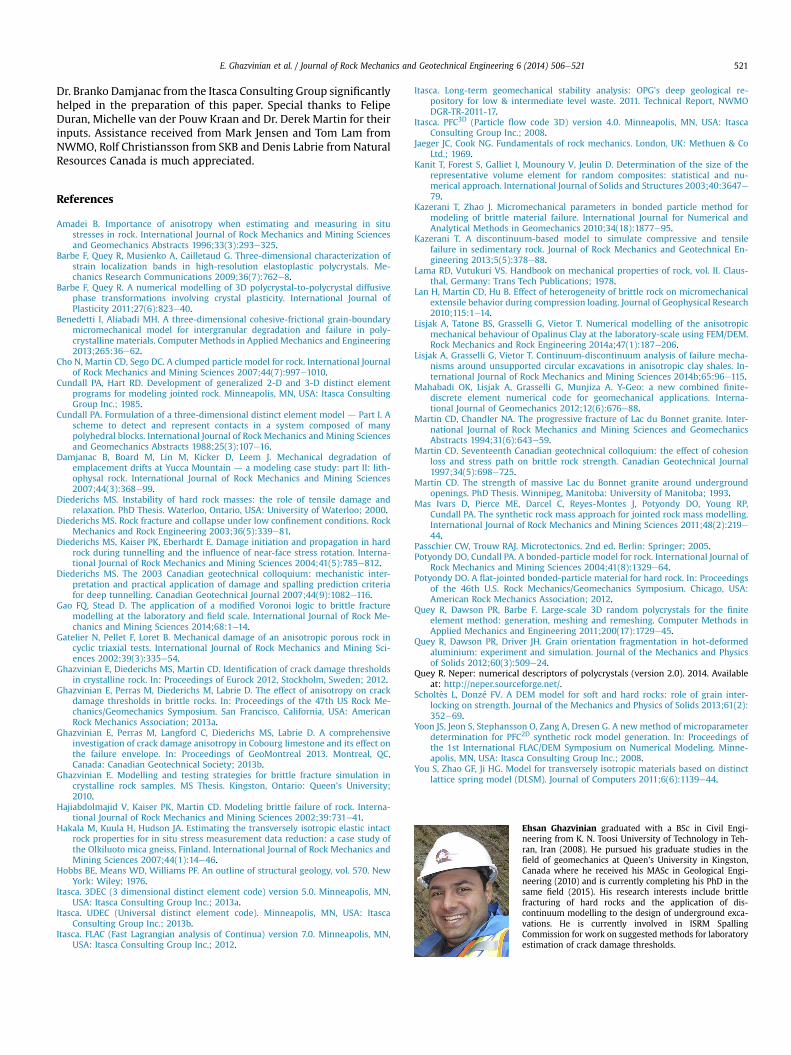
7.4.3. Contact friction angleIncreasing the friction angle of the contacts (i.e. the residual
friction angle according to the contact model as shown in Fig. 10)improves the peak strengths of the models. The increase in thestrength of the models intensifies as the orientation of fabric in therock changes from vertical to horizontal. As shown in Fig. 27, themaximum strength increase of the laminated GBMs as a function ofincreasing the models’ friction angle is observed in the horizontallylaminated model.
7.5. Calibration procedure
Verification of the laminated GBM approach with the availabletest data from the Cobourg Limestone confirmed the application ofthis modelling method for numerical replication of brittle rock
behaviour with inherent anisotropic mechanical properties. Basedon the conducted sensitivity analyses for micro-properties, thecalibration procedure for the GBMs with elongated 3D Voronoigrains can be summarised as follows:
(1) Decide on the grain size for the GBM and an initial grain l/wratio.
(2) Define the elastic constants (Young’s modulus and Poisson’sratio) for the grains. It is nearly impossible to match theelastic constants for the horizontally and vertically laminatedmodels during the calibration stage with an identical set ofmicro-parameters with rigid grains or unrealistically very stiffgrains.
(3) Set the strength components of the contacts to a high value sothat the deformational behaviour of the model is fully elastic(or set the “small strain” in 3DEC) and adjust the Poisson’s ratiofor the models with the horizontal and vertical fabric simul-taneously by modifying the kn/ks ratio.
(4) Calibrate the Young’s moduli for the models with the hori-zontal and vertical fabric simultaneously by adjusting the kn forthe contacts.
(5) Calibrate the peak strength and CI threshold for the horizontallylaminated model by fine-tuning the c/T ratio and c. Adjust thefriction angle based on the post-peak behaviour (if needed).
(6) Apply the micro-parameters calibrated thus far to the verticallylaminated model and adjust the grains l/w ratio accordingly.
(7) Apply the micro-parameters calibrated thus far to the entiresuite of laminated GBMs and correct the U-shape anisotropycurve by adjusting the micro-parameters according to thediscussions in Section 7.4 for a few iterations.
8. Discussion
This paper showed that brittle rock damage through explicitsimulation of micro-fracturing can be accurately captured in nu-merical models by means of GBMs built with 3D Voronoi grains.Similar work has been done previously in 2D (e.g. Kazerani andZhao, 2010; Lan et al., 2010; Itasca, 2011), however thecomplexity of generating proper 3D Voronoi tessellations hasencumbered its development in 3D DEM codes to this point. Themechanics of the Voronoi tessellated models at the micro-scaleremains nearly the same in transition from 2D to 3D. Howeversome complexities in regards to the calibration process can inten-sify when switching fromUDEC to 3DEC for Voronoi GBMs. In UDECand 3DEC, the contact models commonly used for grains are theconstitutive slip models developed for rock mass joints andtherefore, attempting to formulate the micro-scale grain contactbehaviour by using an analogue established for large-scale dis-continuities can be challenging. In this study, the CWFS approachwas successfully implemented in the grain contact model to betteraddress the peak and residual friction angles and gradual mobili-zation of the frictional strength component of the contacts. Thisapproach can be further refined with GBM simulations undertriaxial conditions to capture the correlation between the materialfriction angle and the friction angle in the CWFS model for graincontacts.
Grain contact normal and shear stiffnesses are two of the mostimportant micro-parameters in terms of defining the model’smacro-response. The transition from 2D to 3D models drasticallyincreases the importance of these two micro-parameters. The un-realistic representation of contact stiffnesses (particularly thenormal stiffness) with a constant value leads to high stiffness pa-rameters for the contacts and therefore an enormous stiffnesscontrast between the grain and the grain contact, which can beerroneous. It is anticipated that defining the normal stiffness of the
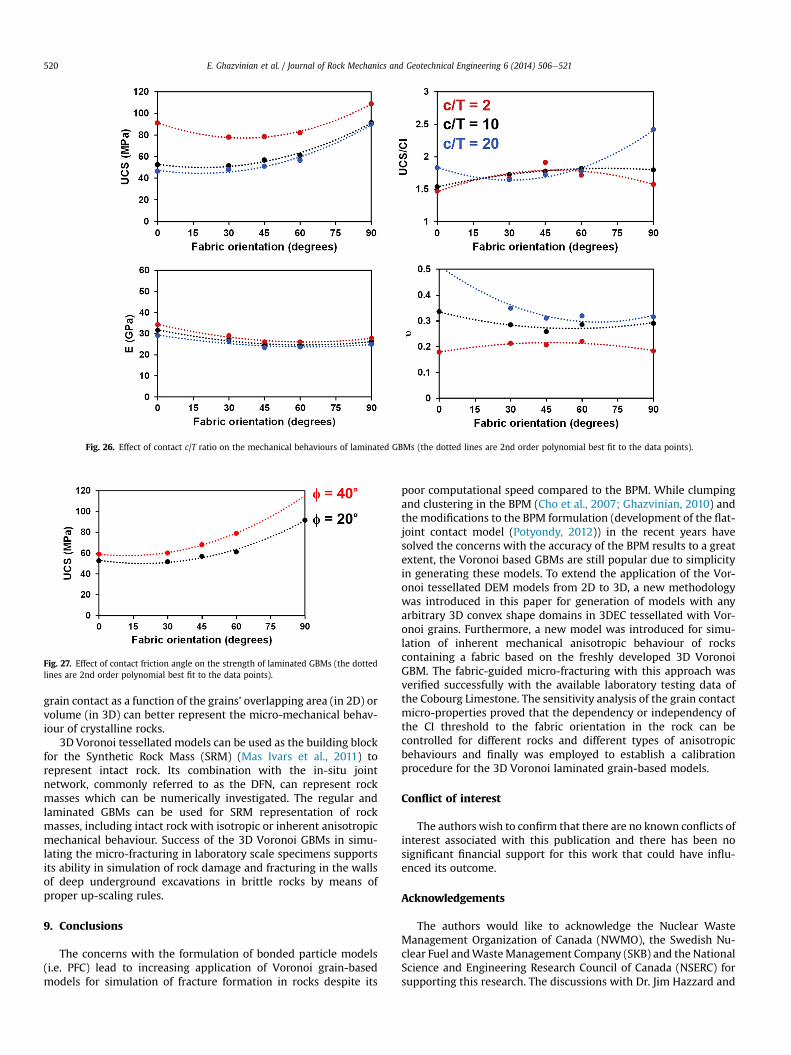
Fig. 26. Effect of contact c/T ratio on the mechanical behaviours of laminated GBMs (the dotted lines are 2nd order polynomial best fit to the data points).
Fig. 27. Effect of contact friction angle on the strength of laminated GBMs (the dottedlines are 2nd order polynomial best fit to the data points).
E. Ghazvinian et al. / Journal of Rock Mechanics and Geotechnical Engineering 6 (2014) 506e521520
grain contact as a function of the grains’ overlapping area (in 2D) orvolume (in 3D) can better represent the micro-mechanical behav-iour of crystalline rocks.
3D Voronoi tessellated models can be used as the building blockfor the Synthetic Rock Mass (SRM) (Mas Ivars et al., 2011) torepresent intact rock. Its combination with the in-situ jointnetwork, commonly referred to as the DFN, can represent rockmasses which can be numerically investigated. The regular andlaminated GBMs can be used for SRM representation of rockmasses, including intact rock with isotropic or inherent anisotropicmechanical behaviour. Success of the 3D Voronoi GBMs in simu-lating the micro-fracturing in laboratory scale specimens supportsits ability in simulation of rock damage and fracturing in the wallsof deep underground excavations in brittle rocks by means ofproper up-scaling rules.
9. Conclusions
The concerns with the formulation of bonded particle models(i.e. PFC) lead to increasing application of Voronoi grain-basedmodels for simulation of fracture formation in rocks despite its
poor computational speed compared to the BPM. While clumpingand clustering in the BPM (Cho et al., 2007; Ghazvinian, 2010) andthe modifications to the BPM formulation (development of the flat-joint contact model (Potyondy, 2012)) in the recent years havesolved the concerns with the accuracy of the BPM results to a greatextent, the Voronoi based GBMs are still popular due to simplicityin generating these models. To extend the application of the Vor-onoi tessellated DEM models from 2D to 3D, a new methodologywas introduced in this paper for generation of models with anyarbitrary 3D convex shape domains in 3DEC tessellated with Vor-onoi grains. Furthermore, a new model was introduced for simu-lation of inherent mechanical anisotropic behaviour of rockscontaining a fabric based on the freshly developed 3D VoronoiGBM. The fabric-guided micro-fracturing with this approach wasverified successfully with the available laboratory testing data ofthe Cobourg Limestone. The sensitivity analysis of the grain contactmicro-properties proved that the dependency or independency ofthe CI threshold to the fabric orientation in the rock can becontrolled for different rocks and different types of anisotropicbehaviours and finally was employed to establish a calibrationprocedure for the 3D Voronoi laminated grain-based models.
Conflict of interest
The authors wish to confirm that there are no known conflicts ofinterest associated with this publication and there has been nosignificant financial support for this work that could have influ-enced its outcome.
Acknowledgements
The authors would like to acknowledge the Nuclear WasteManagement Organization of Canada (NWMO), the Swedish Nu-clear Fuel andWasteManagement Company (SKB) and the NationalScience and Engineering Research Council of Canada (NSERC) forsupporting this research. The discussions with Dr. Jim Hazzard and
E. Ghazvinian et al. / Journal of Rock Mechanics and Geotechnical Engineering 6 (2014) 506e521 521
Dr. Branko Damjanac from the Itasca Consulting Group significantlyhelped in the preparation of this paper. Special thanks to FelipeDuran, Michelle van der Pouw Kraan and Dr. Derek Martin for theirinputs. Assistance received from Mark Jensen and Tom Lam fromNWMO, Rolf Christiansson from SKB and Denis Labrie from NaturalResources Canada is much appreciated.
References
Amadei B. Importance of anisotropy when estimating and measuring in situstresses in rock. International Journal of Rock Mechanics and Mining Sciencesand Geomechanics Abstracts 1996;33(3):293e325.
Barbe F, Quey R, Musienko A, Cailletaud G. Three-dimensional characterization ofstrain localization bands in high-resolution elastoplastic polycrystals. Me-chanics Research Communications 2009;36(7):762e8.
Barbe F, Quey R. A numerical modelling of 3D polycrystal-to-polycrystal diffusivephase transformations involving crystal plasticity. International Journal ofPlasticity 2011;27(6):823e40.
Benedetti I, Aliabadi MH. A three-dimensional cohesive-frictional grain-boundarymicromechanical model for intergranular degradation and failure in poly-crystalline materials. Computer Methods in Applied Mechanics and Engineering2013;265:36e62.
Cho N, Martin CD, Sego DC. A clumped particle model for rock. International Journalof Rock Mechanics and Mining Sciences 2007;44(7):997e1010.
Cundall PA, Hart RD. Development of generalized 2-D and 3-D distinct elementprograms for modeling jointed rock. Minneapolis, MN, USA: Itasca ConsultingGroup Inc.; 1985.
Cundall PA. Formulation of a three-dimensional distinct element model d Part I. Ascheme to detect and represent contacts in a system composed of manypolyhedral blocks. International Journal of Rock Mechanics and Mining Sciencesand Geomechanics Abstracts 1988;25(3):107e16.
Damjanac B, Board M, Lin M, Kicker D, Leem J. Mechanical degradation ofemplacement drifts at Yucca Mountain d a modeling case study: part II: lith-ophysal rock. International Journal of Rock Mechanics and Mining Sciences2007;44(3):368e99.
Diederichs MS. Instability of hard rock masses: the role of tensile damage andrelaxation. PhD Thesis. Waterloo, Ontario, USA: University of Waterloo; 2000.
Diederichs MS. Rock fracture and collapse under low confinement conditions. RockMechanics and Rock Engineering 2003;36(5):339e81.
Diederichs MS, Kaiser PK, Eberhardt E. Damage initiation and propagation in hardrock during tunnelling and the influence of near-face stress rotation. Interna-tional Journal of Rock Mechanics and Mining Sciences 2004;41(5):785e812.
Diederichs MS. The 2003 Canadian geotechnical colloquium: mechanistic inter-pretation and practical application of damage and spalling prediction criteriafor deep tunnelling. Canadian Geotechnical Journal 2007;44(9):1082e116.
Gao FQ, Stead D. The application of a modified Voronoi logic to brittle fracturemodelling at the laboratory and field scale. International Journal of Rock Me-chanics and Mining Sciences 2014;68:1e14.
Gatelier N, Pellet F, Loret B. Mechanical damage of an anisotropic porous rock incyclic triaxial tests. International Journal of Rock Mechanics and Mining Sci-ences 2002;39(3):335e54.
Ghazvinian E, Diederichs MS, Martin CD. Identification of crack damage thresholdsin crystalline rock. In: Proceedings of Eurock 2012, Stockholm, Sweden; 2012.
Ghazvinian E, Perras M, Diederichs M, Labrie D. The effect of anisotropy on crackdamage thresholds in brittle rocks. In: Proceedings of the 47th US Rock Me-chanics/Geomechanics Symposium. San Francisco, California, USA: AmericanRock Mechanics Association; 2013a.
Ghazvinian E, Perras M, Langford C, Diederichs MS, Labrie D. A comprehensiveinvestigation of crack damage anisotropy in Cobourg limestone and its effect onthe failure envelope. In: Proceedings of GeoMontreal 2013. Montreal, QC,Canada: Canadian Geotechnical Society; 2013b.
Ghazvinian E. Modelling and testing strategies for brittle fracture simulation incrystalline rock samples. MS Thesis. Kingston, Ontario: Queen’s University;2010.
Hajiabdolmajid V, Kaiser PK, Martin CD. Modeling brittle failure of rock. Interna-tional Journal of Rock Mechanics and Mining Sciences 2002;39:731e41.
Hakala M, Kuula H, Hudson JA. Estimating the transversely isotropic elastic intactrock properties for in situ stress measurement data reduction: a case study ofthe Olkiluoto mica gneiss, Finland. International Journal of Rock Mechanics andMining Sciences 2007;44(1):14e46.
Hobbs BE, Means WD, Williams PF. An outline of structural geology, vol. 570. NewYork: Wiley; 1976.
Itasca. 3DEC (3 dimensional distinct element code) version 5.0. Minneapolis, MN,USA: Itasca Consulting Group Inc.; 2013a.
Itasca. UDEC (Universal distinct element code). Minneapolis, MN, USA: ItascaConsulting Group Inc.; 2013b.
Itasca. FLAC (Fast Lagrangian analysis of Continua) version 7.0. Minneapolis, MN,USA: Itasca Consulting Group Inc.; 2012.
Itasca. Long-term geomechanical stability analysis: OPG’s deep geological re-pository for low & intermediate level waste. 2011. Technical Report, NWMODGR-TR-2011-17.
Itasca. PFC3D (Particle flow code 3D) version 4.0. Minneapolis, MN, USA: ItascaConsulting Group Inc.; 2008.
Jaeger JC, Cook NG. Fundamentals of rock mechanics. London, UK: Methuen & CoLtd.; 1969.
Kanit T, Forest S, Galliet I, Mounoury V, Jeulin D. Determination of the size of therepresentative volume element for random composites: statistical and nu-merical approach. International Journal of Solids and Structures 2003;40:3647e79.
Kazerani T, Zhao J. Micromechanical parameters in bonded particle method formodeling of brittle material failure. International Journal for Numerical andAnalytical Methods in Geomechanics 2010;34(18):1877e95.
Kazerani T. A discontinuum-based model to simulate compressive and tensilefailure in sedimentary rock. Journal of Rock Mechanics and Geotechnical En-gineering 2013;5(5):378e88.
Lama RD, Vutukuri VS. Handbook on mechanical properties of rock, vol. II. Claus-thal, Germany: Trans Tech Publications; 1978.
Lan H, Martin CD, Hu B. Effect of heterogeneity of brittle rock on micromechanicalextensile behavior during compression loading. Journal of Geophysical Research2010;115:1e14.
Lisjak A, Tatone BS, Grasselli G, Vietor T. Numerical modelling of the anisotropicmechanical behaviour of Opalinus Clay at the laboratory-scale using FEM/DEM.Rock Mechanics and Rock Engineering 2014a;47(1):187e206.
Lisjak A, Grasselli G, Vietor T. Continuum-discontinuum analysis of failure mecha-nisms around unsupported circular excavations in anisotropic clay shales. In-ternational Journal of Rock Mechanics and Mining Sciences 2014b;65:96e115.
Mahabadi OK, Lisjak A, Grasselli G, Munjiza A. Y-Geo: a new combined finite-discrete element numerical code for geomechanical applications. Interna-tional Journal of Geomechanics 2012;12(6):676e88.
Martin CD, Chandler NA. The progressive fracture of Lac du Bonnet granite. Inter-national Journal of Rock Mechanics and Mining Sciences and GeomechanicsAbstracts 1994;31(6):643e59.
Martin CD. Seventeenth Canadian geotechnical colloquium: the effect of cohesionloss and stress path on brittle rock strength. Canadian Geotechnical Journal1997;34(5):698e725.
Martin CD. The strength of massive Lac du Bonnet granite around undergroundopenings. PhD Thesis. Winnipeg, Manitoba: University of Manitoba; 1993.
Mas Ivars D, Pierce ME, Darcel C, Reyes-Montes J, Potyondy DO, Young RP,Cundall PA. The synthetic rock mass approach for jointed rock mass modelling.International Journal of Rock Mechanics and Mining Sciences 2011;48(2):219e44.
Passchier CW, Trouw RAJ. Microtectonics. 2nd ed. Berlin: Springer; 2005.Potyondy DO, Cundall PA. A bonded-particle model for rock. International Journal of
Rock Mechanics and Mining Sciences 2004;41(8):1329e64.Potyondy DO. A flat-jointed bonded-particle material for hard rock. In: Proceedings
of the 46th U.S. Rock Mechanics/Geomechanics Symposium. Chicago, USA:American Rock Mechanics Association; 2012.
Quey R, Dawson PR, Barbe F. Large-scale 3D random polycrystals for the finiteelement method: generation, meshing and remeshing. Computer Methods inApplied Mechanics and Engineering 2011;200(17):1729e45.
Quey R, Dawson PR, Driver JH. Grain orientation fragmentation in hot-deformedaluminium: experiment and simulation. Journal of the Mechanics and Physicsof Solids 2012;60(3):509e24.
Quey R. Neper: numerical descriptors of polycrystals (version 2.0). 2014. Availableat: http://neper.sourceforge.net/.
Scholtès L, Donzé FV. A DEM model for soft and hard rocks: role of grain inter-locking on strength. Journal of the Mechanics and Physics of Solids 2013;61(2):352e69.
Yoon JS, Jeon S, Stephansson O, Zang A, Dresen G. A newmethod of microparameterdetermination for PFC2D synthetic rock model generation. In: Proceedings ofthe 1st International FLAC/DEM Symposium on Numerical Modeling. Minne-apolis, MN, USA: Itasca Consulting Group Inc.; 2008.
You S, Zhao GF, Ji HG. Model for transversely isotropic materials based on distinctlattice spring model (DLSM). Journal of Computers 2011;6(6):1139e44.
Ehsan Ghazvinian graduated with a BSc in Civil Engi-neering from K. N. Toosi University of Technology in Teh-ran, Iran (2008). He pursued his graduate studies in thefield of geomechanics at Queen’s University in Kingston,Canada where he received his MASc in Geological Engi-neering (2010) and is currently completing his PhD in thesame field (2015). His research interests include brittlefracturing of hard rocks and the application of dis-continuum modelling to the design of underground exca-vations. He is currently involved in ISRM SpallingCommission for work on suggested methods for laboratoryestimation of crack damage thresholds.