3g, hsdpa, hsupa and fdd versus tdd networking - eprints soton
TRANSCRIPT

3G, HSDPA, HSUPA and FDD Versus TDDNetworking:
Smart Antennas and Adaptive Modulation
by
c©L. Hanzo, J.S. Blogh, S. NiSchool of Electronics and Computer Science,
University of Southampton, UK

About the AuthorsLajos Hanzo(http://www-mobile.ecs.soton.ac.uk) FREng, FIEEE, FIET,DSc received his degree in electronics in 1976 and his doctorate in 1983.During his 30-year career in telecommunications he has heldvariousresearch and academic posts in Hungary, Germany and the UK. Since1986 he has been with the School of Electronics and Computer Science,University of Southampton, UK, where he holds the chair in telecom-munications. He has co-authored 14 books on mobile radio communica-tions totalling in excess of 10 000, published about 700 research papers,acted as TPC Chair of IEEE conferences, presented keynote lectures and
been awarded a number of distinctions. Currently he is directing an academic research team,working on a range of research projects in the field of wireless multimedia communicationssponsored by industry, the Engineering and Physical Sciences Research Council (EPSRC)UK, the European IST Programme and the Mobile Virtual Centreof Excellence (VCE), UK.He is an enthusiastic supporter of industrial and academic liaison and he offers a range ofindustrial courses. He is also an IEEE Distinguished Lecturer of both the CommunicationsSociety and the Vehicular Technology Society (VTS). Since 2005 he has been a Governer ofthe VTS. For further information on research in progress andassociated publications pleaserefer to http://www-mobile.ecs.soton.ac.uk
Jonathan Blogh was awarded an MEng. degree with Distinction inInformation Engineering from the University of Southampton, UK in1997. In the same year he was also awarded the IEE Lord Lloyd ofKilgerran Memorial Prize for his interest in and commitmentto mo-bile radio and RF engineering. Between 1997 and 2000 he conductedpostgraduate research and in 2001 he earned a PhD in mobile commu-
nications at the University of Southampton, UK. His currentareas of research include thenetworking aspects of FDD and TDD mode third generation mobile cellular networks. Cur-rently he is with Radioscape, London, UK, working as a software engineer.
i

ii

Other Wiley and IEEE PressBooks on Related Topics1
• R. Steele, L. Hanzo (Ed):Mobile Radio Communications: Second and Third Gener-ation Cellular and WATM Systems, John Wiley and IEEE Press, 2nd edition, 1999,ISBN 07 273-1406-8, 1064 pages
• L. Hanzo, F.C.A. Somerville, J.P. Woodard:Voice Compression and Communications:Principles and Applications for Fixed and Wireless Channels; IEEE Press and JohnWiley, 2001, 642 pages
• L. Hanzo, P. Cherriman, J. Streit:Wireless Video Communications: Second to ThirdGeneration and Beyond, IEEE Press and John Wiley, 2001, 1093 pages
• L. Hanzo, T.H. Liew, B.L. Yeap:Turbo Coding, Turbo Equalisation and Space-TimeCoding, John Wiley and IEEE Press, 2002, 751 pages
• J.S. Blogh, L. Hanzo:Third-Generation Systems and Intelligent Wireless Networking:Smart Antennas and Adaptive Modulation, John Wiley and IEEE Press, 2002, 408pages
• L. Hanzo, C.H. Wong, M.S. Yee:Adaptive Wireless Transceivers: Turbo-Coded, Turbo-Equalised and Space-Time Coded TDMA, CDMA and OFDM Systems, John Wiley andIEEE Press, 2002, 737 pages
• L. Hanzo, L-L. Yang, E-L. Kuan, K. Yen:Single- and Multi-Carrier CDMA: Multi-User Detection, Space-Time Spreading, Synchronisation, Networking and Standards,John Wiley and IEEE Press, June 2003, 1060 pages
• L. Hanzo, M. Munster, T. Keller, B-J. Choi,OFDM and MC-CDMA for BroadbandMulti-User Communications, WLANs and Broadcasting, John-Wiley and IEEE Press,2003, 978 pages
• L. Hanzo, S-X. Ng, T. Keller and W.T. Webb,Quadrature Amplitude Modulation:From Basics to Adaptive Trellis-Coded, Turbo-Equalised and Space-Time Coded OFDM,CDMA and MC-CDMA Systems, John Wiley and IEEE Press, 2004, 1105 pages
1For detailed contents and sample chapters please refer to http://www-mobile.ecs.soton.ac.uk
iii
iv
• L. Hanzo, T. Keller:An OFDM and MC-CDMA Primer, John Wiley and IEEE Press,2006, 430 pages
• L. Hanzo, F.C.A. Somerville, J.P. Woodard:Voice and Audio Compression for WirelessCommunications, John Wiley and IEEE Press, 2007, 858 pages
• L. Hanzo, P.J. Cherriman, J. Streit:Video Compression and Communications:H.261, H.263, H.264, MPEG4 and HSDPA-Style Adaptive Turbo-TransceiversJohnWiley and IEEE Press, 2007, 680 pages

Contents
About the Authors i
Other Wiley and IEEE Press Books on Related Topics i
Preface xiii
Acknowledgments xxv
1 Third-Generation CDMA Systems 11.1 Introduction . . . . . . . . . . . . . . . . . . . . . . . . . . . . . . . . . . . 11.2 Basic CDMA System . . . . . . . . . . . . . . . . . . . . . . . . . . . . . . 2
1.2.1 Spread Spectrum Fundamentals . . . . . . . . . . . . . . . . . . . .21.2.1.1 Frequency Hopping . . . . . . . . . . . . . . . . . . . . . 31.2.1.2 Direct Sequence . . . . . . . . . . . . . . . . . . . . . . . 3
1.2.2 The Effect of Multipath Channels . . . . . . . . . . . . . . . . . .. 61.2.3 RAKE Receiver . . . . . . . . . . . . . . . . . . . . . . . . . . . . . 91.2.4 Multiple Access . . . . . . . . . . . . . . . . . . . . . . . . . . . . 13
1.2.4.1 Downlink Interference . . . . . . . . . . . . . . . . . . . . 141.2.4.2 Uplink Interference . . . . . . . . . . . . . . . . . . . . . 151.2.4.3 Gaussian Approximation . . . . . . . . . . . . . . . . . . 18
1.2.5 Spreading Codes . . . . . . . . . . . . . . . . . . . . . . . . . . . . 191.2.5.1 m-sequences . . . . . . . . . . . . . . . . . . . . . . . . . 201.2.5.2 Gold Sequences . . . . . . . . . . . . . . . . . . . . . . . 211.2.5.3 Extendedm-sequences . . . . . . . . . . . . . . . . . . . 22
1.2.6 Channel Estimation . . . . . . . . . . . . . . . . . . . . . . . . . . . 221.2.6.1 Downlink Pilot-Assisted Channel Estimation . . . . .. . . 231.2.6.2 Uplink Pilot-Symbol Assisted Channel Estimation .. . . . 241.2.6.3 Pilot-Symbol Assisted Decision-Directed Channel
Estimation . . . . . . . . . . . . . . . . . . . . . . . . . . 251.2.7 Summary . . . . . . . . . . . . . . . . . . . . . . . . . . . . . . . . 27
1.3 Third-Generation Systems . . . . . . . . . . . . . . . . . . . . . . . . .. . 27
v

vi CONTENTS
1.3.1 Introduction . . . . . . . . . . . . . . . . . . . . . . . . . . . . . . . 271.3.2 UMTS Terrestrial Radio Access (UTRA) . . . . . . . . . . . . . .. 29
1.3.2.1 Characteristics of UTRA . . . . . . . . . . . . . . . . . . 291.3.2.2 Transport Channels . . . . . . . . . . . . . . . . . . . . . 321.3.2.3 Physical Channels . . . . . . . . . . . . . . . . . . . . . . 33
1.3.2.3.1 Dedicated Physical Channels . . . . . . . . . . . 341.3.2.3.2 Common Physical Channels . . . . . . . . . . . 36
1.3.2.3.2.1 Common Physical Channels of the FDDMode . . . . . . . . . . . . . . . . . . . 36
1.3.2.3.2.2 Common Physical Channels of the TDDMode . . . . . . . . . . . . . . . . . . . 41
1.3.2.4 Service Multiplexing and Channel Coding in UTRA . . .. 441.3.2.4.1 CRC Attachment . . . . . . . . . . . . . . . . . 451.3.2.4.2 Transport Block Concatenation . . . . . . . . . . 451.3.2.4.3 Channel-Coding . . . . . . . . . . . . . . . . . . 451.3.2.4.4 Radio Frame Padding . . . . . . . . . . . . . . . 451.3.2.4.5 First Interleaving . . . . . . . . . . . . . . . . . 481.3.2.4.6 Radio Frame Segmentation . . . . . . . . . . . . 481.3.2.4.7 Rate Matching . . . . . . . . . . . . . . . . . . . 481.3.2.4.8 Discontinuous Transmission Indication . . . . . . 481.3.2.4.9 Transport Channel Multiplexing . . . . . . . . . 481.3.2.4.10 Physical Channel Segmentation . . . . . . . . . . 491.3.2.4.11 Second Interleaving . . . . . . . . . . . . . . . . 491.3.2.4.12 Physical Channel Mapping . . . . . . . . . . . . 491.3.2.4.13 Mapping Several Multirate Services to the UL
Dedicated Physical Channels in FDD Mode . . . 491.3.2.4.14 Mapping of a 4.1 Kbps Data Service to the DL
DPDCH in FDD Mode . . . . . . . . . . . . . . 501.3.2.4.15 Mapping Several Multirate Services to the UL
Dedicated Physical Channels in TDD Mode . . . 521.3.2.5 Variable-Rate and Multicode Transmission in UTRA .. . 551.3.2.6 Spreading and Modulation . . . . . . . . . . . . . . . . . 56
1.3.2.6.1 Orthogonal Variable Spreading Factor Codes . . . 571.3.2.6.2 Uplink Scrambling Codes . . . . . . . . . . . . . 591.3.2.6.3 Downlink Scrambling Codes . . . . . . . . . . . 591.3.2.6.4 Uplink Spreading and Modulation . . . . . . . . 601.3.2.6.5 Downlink Spreading and Modulation . . . . . . . 60
1.3.2.7 Random Access . . . . . . . . . . . . . . . . . . . . . . . 611.3.2.7.1 Mobile-Initiated Physical Random Access
Procedures . . . . . . . . . . . . . . . . . . . . . 611.3.2.7.2 Common Packet Channel Access Procedures . . . 63
1.3.2.8 Power Control . . . . . . . . . . . . . . . . . . . . . . . . 631.3.2.8.1 Closed-Loop Power Control in UTRA . . . . . . 631.3.2.8.2 Open-Loop Power Control in TDD Mode . . . . 64
1.3.2.9 Cell Identification . . . . . . . . . . . . . . . . . . . . . . 641.3.2.9.1 Cell Identification in the FDD Mode . . . . . . . 64

CONTENTS vii
1.3.2.9.2 Cell Identification in the TDD Mode . . . . . . . 671.3.2.10 Handover . . . . . . . . . . . . . . . . . . . . . . . . . . 68
1.3.2.10.1 Intra-Frequency Handover or Soft Handover . . . 691.3.2.10.2 Inter-Frequency Handover or Hard Handover . . 69
1.3.2.11 Intercell Time Synchronisation in the UTRA TDD Mode . 701.3.3 The cdma2000 Terrestrial Radio Access . . . . . . . . . . . . .. . . 71
1.3.3.1 Characteristics of cdma2000 . . . . . . . . . . . . . . . . 721.3.3.2 Physical Channels in cdma2000 . . . . . . . . . . . . . . . 731.3.3.3 Service Multiplexing and Channel Coding . . . . . . . . .751.3.3.4 Spreading and Modulation . . . . . . . . . . . . . . . . . 76
1.3.3.4.1 Downlink Spreading and Modulation . . . . . . . 791.3.3.4.2 Uplink Spreading and Modulation . . . . . . . . 80
1.3.3.5 Random Access . . . . . . . . . . . . . . . . . . . . . . . 801.3.3.6 Handover . . . . . . . . . . . . . . . . . . . . . . . . . . 83
1.3.4 Performance-Enhancement Features . . . . . . . . . . . . . . .. . . 851.3.4.1 Downlink Transmit Diversity Techniques . . . . . . . . .. 85
1.3.4.1.1 Space Time Block Coding-Based Transmit Di-versity . . . . . . . . . . . . . . . . . . . . . . . 85
1.3.4.1.2 Time-Switched Transmit Diversity . . . . . . . . 851.3.4.1.3 Closed-Loop Transmit Diversity . . . . . . . . . 85
1.3.4.2 Adaptive Antennas . . . . . . . . . . . . . . . . . . . . . 851.3.4.3 Multi-User Detection/Interference Cancellation. . . . . . 85
1.3.5 Summary of 3G Systems . . . . . . . . . . . . . . . . . . . . . . . . 861.4 Summary and Conclusions . . . . . . . . . . . . . . . . . . . . . . . . . . .87
2 HSDPA-Style Burst-by-Burst Adaptive Wireless Transceivers 892.1 Motivation . . . . . . . . . . . . . . . . . . . . . . . . . . . . . . . . . . . . 892.2 Narrowband Burst-by-Burst Adaptive Modulation . . . . . .. . . . . . . . . 902.3 Wideband Burst-by-Burst Adaptive Modulation . . . . . . . .. . . . . . . . 93
2.3.1 Channel quality metrics . . . . . . . . . . . . . . . . . . . . . . . . 932.4 Wideband BbB-AQAM Video Transceivers . . . . . . . . . . . . . . .. . . 962.5 BbB-AQAM Performance . . . . . . . . . . . . . . . . . . . . . . . . . . . 992.6 Wideband BbB-AQAM Video Performance . . . . . . . . . . . . . . . .. . 102
2.6.1 AQAM Switching Thresholds . . . . . . . . . . . . . . . . . . . . . 1042.6.2 Turbo-coded AQAM videophone performance . . . . . . . . . .. . 106
2.7 BbB Adaptive Joint-detection CDMA Video Transceiver . .. . . . . . . . . 1072.7.1 Multi-user Detection for CDMA . . . . . . . . . . . . . . . . . . . .1072.7.2 JD-ACDMA Modem Mode Adaptation and Signalling . . . . . .. . 1092.7.3 The JD-ACDMA Video Transceiver . . . . . . . . . . . . . . . . . . 1102.7.4 JD-ACDMA Video Transceiver Performance . . . . . . . . . . .. . 113
2.8 Subband-Adaptive OFDM Video Transceivers . . . . . . . . . . .. . . . . . 1162.9 Summary and Conclusions . . . . . . . . . . . . . . . . . . . . . . . . . . .118

viii CONTENTS
3 Intelligent Antenna Arrays and Beamforming 1233.1 Introduction . . . . . . . . . . . . . . . . . . . . . . . . . . . . . . . . . . . 1233.2 Beamforming . . . . . . . . . . . . . . . . . . . . . . . . . . . . . . . . . . 124
3.2.1 Antenna Array Parameters . . . . . . . . . . . . . . . . . . . . . . . 1243.2.2 Potential Benefits of Antenna Arrays in Mobile Communications . . 125
3.2.2.1 Multiple Beams . . . . . . . . . . . . . . . . . . . . . . . 1253.2.2.2 Adaptive Beams . . . . . . . . . . . . . . . . . . . . . . . 1263.2.2.3 Null Steering . . . . . . . . . . . . . . . . . . . . . . . . . 1263.2.2.4 Diversity Schemes . . . . . . . . . . . . . . . . . . . . . . 1273.2.2.5 Reduction in Delay Spread and Multipath Fading . . . .. 1313.2.2.6 Reduction in Co-channel Interference . . . . . . . . . . .. 1323.2.2.7 Capacity Improvement and Spectral Efficiency . . . . .. . 1343.2.2.8 Increase in Transmission Efficiency . . . . . . . . . . . . .1343.2.2.9 Reduction in Handovers . . . . . . . . . . . . . . . . . . . 134
3.2.3 Signal Model . . . . . . . . . . . . . . . . . . . . . . . . . . . . . . 1343.2.4 A Beamforming Example . . . . . . . . . . . . . . . . . . . . . . . 1383.2.5 Analogue Beamforming . . . . . . . . . . . . . . . . . . . . . . . . 1403.2.6 Digital Beamforming . . . . . . . . . . . . . . . . . . . . . . . . . . 1403.2.7 Element-Space Beamforming . . . . . . . . . . . . . . . . . . . . . 1413.2.8 Beam-Space Beamforming . . . . . . . . . . . . . . . . . . . . . . . 141
3.3 Adaptive Beamforming . . . . . . . . . . . . . . . . . . . . . . . . . . . . .1433.3.1 Fixed Beams . . . . . . . . . . . . . . . . . . . . . . . . . . . . . . 1443.3.2 Temporal Reference Techniques . . . . . . . . . . . . . . . . . . .. 145
3.3.2.1 Least Mean Squares . . . . . . . . . . . . . . . . . . . . . 1483.3.2.2 Normalised Least Mean Squares Algorithm . . . . . . . . 1503.3.2.3 Sample Matrix Inversion . . . . . . . . . . . . . . . . . . 1513.3.2.4 Recursive Least Squares . . . . . . . . . . . . . . . . . . . 158
3.3.3 Spatial Reference Techniques . . . . . . . . . . . . . . . . . . . .. 1593.3.3.1 Antenna Calibration . . . . . . . . . . . . . . . . . . . . . 160
3.3.4 Blind Adaptation . . . . . . . . . . . . . . . . . . . . . . . . . . . . 1623.3.4.1 Constant Modulus Algorithm . . . . . . . . . . . . . . . . 162
3.3.5 Adaptive Arrays in the Downlink . . . . . . . . . . . . . . . . . . .1643.3.6 Adaptive Beamforming Performance Results . . . . . . . . .. . . . 165
3.3.6.1 Two Element Adaptive Antenna Using Sample Matrix In-version . . . . . . . . . . . . . . . . . . . . . . . . . . . . 166
3.3.6.2 Two Element Adaptive Antenna Using UnconstrainedLeast Mean Squares . . . . . . . . . . . . . . . . . . . . . 168
3.3.6.3 Two Element Adaptive Antenna Using Normalised LeastMean Squares . . . . . . . . . . . . . . . . . . . . . . . . 169
3.3.6.4 Performance of a Three Element Adaptive Antenna Array . 1723.3.6.5 Complexity analysis . . . . . . . . . . . . . . . . . . . . . 179
3.4 Summary and Conclusions . . . . . . . . . . . . . . . . . . . . . . . . . . .182

CONTENTS ix
4 Adaptive Arrays in Cellular Networks 1934.1 Introduction . . . . . . . . . . . . . . . . . . . . . . . . . . . . . . . . . . . 1934.2 Modelling Adaptive Antenna Arrays . . . . . . . . . . . . . . . . . .. . . . 194
4.2.1 Algebraic Manipulation with Optimal Beamforming . . .. . . . . . 1944.2.2 Using Probability Density Functions . . . . . . . . . . . . . .. . . . 1964.2.3 Sample Matrix Inversion Beamforming . . . . . . . . . . . . . .. . 197
4.3 Channel Allocation Techniques . . . . . . . . . . . . . . . . . . . . .. . . . 1984.3.1 Overview of Channel Allocation . . . . . . . . . . . . . . . . . . .. 199
4.3.1.1 Fixed Channel Allocation . . . . . . . . . . . . . . . . . . 2004.3.1.1.1 Channel Borrowing . . . . . . . . . . . . . . . . 2024.3.1.1.2 Flexible Channel Allocation . . . . . . . . . . . 204
4.3.1.2 Dynamic Channel Allocation . . . . . . . . . . . . . . . . 2044.3.1.2.1 Centrally Controlled DCA Algorithms . . . . . . 2064.3.1.2.2 Distributed DCA Algorithms . . . . . . . . . . . 2064.3.1.2.3 Locally distributed DCA algorithms . . . . . . . 207
4.3.1.3 Hybrid Channel Allocation . . . . . . . . . . . . . . . . . 2084.3.1.4 The Effect of Handovers . . . . . . . . . . . . . . . . . . . 2094.3.1.5 The Effect of Transmission Power Control . . . . . . . . .210
4.3.2 Simulation of the Channel Allocation Algorithms . . . .. . . . . . . 2104.3.2.1 The Mobile Radio Network Simulator, “Netsim” . . . . .. 210
4.3.2.1.1 Physical Layer Model . . . . . . . . . . . . . . . 2124.3.2.1.2 Shadow Fading Model . . . . . . . . . . . . . . 213
4.3.3 Overview of Channel Allocation Algorithms . . . . . . . . .. . . . 2144.3.3.1 Fixed Channel Allocation Algorithm . . . . . . . . . . . . 2154.3.3.2 Distributed Dynamic Channel Allocation Algorithms . . . 2154.3.3.3 Locally Distributed Dynamic Channel Allocation Algorithms2164.3.3.4 Performance Metrics . . . . . . . . . . . . . . . . . . . . 2164.3.3.5 Nonuniform Traffic Model . . . . . . . . . . . . . . . . . 219
4.3.4 DCA Performance without Adaptive Arrays . . . . . . . . . . .. . . 2204.4 Employing Adaptive Antenna Arrays . . . . . . . . . . . . . . . . . .. . . . 2204.5 Multipath Propagation Environments . . . . . . . . . . . . . . . .. . . . . . 2244.6 Network Performance Results . . . . . . . . . . . . . . . . . . . . . . .. . 231
4.6.1 System Simulation Parameters . . . . . . . . . . . . . . . . . . . .. 2314.6.2 Non-Wraparound Network Performance Results . . . . . . . .. . . 239
4.6.2.1 Performance Results over a LOS Channel . . . . . . . . . 2394.6.2.2 Performance Results over a Multipath Channel . . . . .. . 2454.6.2.3 Performance over a Multipath Channel using Power Control 2504.6.2.4 Transmission over a Multipath Channel using Power Con-
trol andAdaptive Modulation . . . . . . . . . . . . . . . . . . . . 259
4.6.2.5 Power Control and Adaptive Modulation Algorithm . .. . 2604.6.2.6 Performance of PC-assisted, AQAM-aided Dynamic Chan-
nel Allocation . . . . . . . . . . . . . . . . . . . . . . . . 2634.6.2.7 Summary of Non-Wraparound Network Performance . . . 269
4.6.3 Wrap-around Network Performance Results . . . . . . . . . . .. . . 2714.6.3.1 Performance Results over a LOS Channel . . . . . . . . . 271

x CONTENTS
4.6.3.2 Performance Results over a Multipath Channel . . . . .. . 2754.6.3.3 Performance over a Multipath Channel using Power Control 2774.6.3.4 Performance of an AQAM based Network using Power
Control . . . . . . . . . . . . . . . . . . . . . . . . . . . . 2854.7 Summary and Conclusions . . . . . . . . . . . . . . . . . . . . . . . . . . .293
5 HSDPA-Style FDD Networking, Adaptive Arrays and AQAM 2955.1 Introduction . . . . . . . . . . . . . . . . . . . . . . . . . . . . . . . . . . . 2955.2 Direct Sequence Code Division Multiple Access . . . . . . . .. . . . . . . . 2965.3 UMTS Terrestrial Radio Access . . . . . . . . . . . . . . . . . . . . . .. . 298
5.3.1 Spreading and Modulation . . . . . . . . . . . . . . . . . . . . . . . 2995.3.2 Common Pilot Channel . . . . . . . . . . . . . . . . . . . . . . . . . 3035.3.3 Power Control . . . . . . . . . . . . . . . . . . . . . . . . . . . . . 304
5.3.3.1 Uplink Power Control . . . . . . . . . . . . . . . . . . . . 3055.3.3.2 Downlink Power Control . . . . . . . . . . . . . . . . . . 306
5.3.4 Soft Handover . . . . . . . . . . . . . . . . . . . . . . . . . . . . . 3065.3.5 Signal-to-Interference plus Noise Ratio Calculations . . . . . . . . . 307
5.3.5.1 Downlink . . . . . . . . . . . . . . . . . . . . . . . . . . 3075.3.5.2 Uplink . . . . . . . . . . . . . . . . . . . . . . . . . . . . 308
5.3.6 Multi-User Detection . . . . . . . . . . . . . . . . . . . . . . . . . . 3095.4 Simulation Results . . . . . . . . . . . . . . . . . . . . . . . . . . . . . . .310
5.4.1 Simulation Parameters . . . . . . . . . . . . . . . . . . . . . . . . . 3105.4.2 The Effect of Pilot Power on Soft Handover Results . . . .. . . . . 314
5.4.2.1 Fixed Received Pilot Power Thresholds without Shadowing 3145.4.2.2 Fixed Received Pilot Power Thresholds with 0.5 Hz Shad-
owing . . . . . . . . . . . . . . . . . . . . . . . . . . . . 3195.4.2.3 Fixed Received Pilot Power Thresholds with 1.0 Hz Shad-
owing . . . . . . . . . . . . . . . . . . . . . . . . . . . . 3205.4.2.4 Summary . . . . . . . . . . . . . . . . . . . . . . . . . . . 3215.4.2.5 Relative Received Pilot Power Thresholds without Shad-
owing . . . . . . . . . . . . . . . . . . . . . . . . . . . . 3225.4.2.6 Relative Received Pilot Power Thresholds with 0.5 Hz Shad-
owing . . . . . . . . . . . . . . . . . . . . . . . . . . . . 3245.4.2.7 Relative Received Pilot Power Thresholds with 1.0 Hz Shad-
owing . . . . . . . . . . . . . . . . . . . . . . . . . . . . 3275.4.2.8 Summary . . . . . . . . . . . . . . . . . . . . . . . . . . . 329
5.4.3 Ec/Io Power Based Soft Handover Results . . . . . . . . . . . . . . 3295.4.3.1 FixedEc/Io Thresholds without Shadowing . . . . . . . . 3295.4.3.2 FixedEc/Io Thresholds with 0.5 Hz Shadowing . . . . . . 3325.4.3.3 FixedEc/Io Thresholds with 1.0 Hz Shadowing . . . . . . 3335.4.3.4 Summary . . . . . . . . . . . . . . . . . . . . . . . . . . . 3355.4.3.5 RelativeEc/Io Thresholds without Shadowing . . . . . . . 3365.4.3.6 RelativeEc/Io Thresholds with 0.5 Hz Shadowing . . . . 3375.4.3.7 RelativeEc/Io Thresholds with 1.0 Hz Shadowing . . . . 3405.4.3.8 Summary . . . . . . . . . . . . . . . . . . . . . . . . . . . 342
5.4.4 Overview of Results . . . . . . . . . . . . . . . . . . . . . . . . . . 342

CONTENTS xi
5.4.5 Performance of Adaptive Antenna Arrays in a High Data Rate Pedes-trian Environment . . . . . . . . . . . . . . . . . . . . . . . . . . . 343
5.4.6 Performance of Adaptive Antenna Arrays and AdaptiveModulation in a High Data Rate Pedestrian Environment . . . . .. . 350
5.5 Summary and Conclusions . . . . . . . . . . . . . . . . . . . . . . . . . . .357
6 HSDPA-Style FDD/CDMA Performance Using LS Spreading Codes 3616.1 Effects of LS Spreading Codes on the Performance of CDMA Systems . . . . 361
6.1.1 Introduction . . . . . . . . . . . . . . . . . . . . . . . . . . . . . . . 3616.1.2 Loosely Synchronized Codes . . . . . . . . . . . . . . . . . . . . . .3626.1.3 System Parameters . . . . . . . . . . . . . . . . . . . . . . . . . . . 3646.1.4 Simulation Results . . . . . . . . . . . . . . . . . . . . . . . . . . . 3666.1.5 Summary . . . . . . . . . . . . . . . . . . . . . . . . . . . . . . . . 369
6.2 Effects of Cell Size on the UTRA Performance . . . . . . . . . . .. . . . . 3706.2.1 Introduction . . . . . . . . . . . . . . . . . . . . . . . . . . . . . . . 3706.2.2 System Model and System Parameters . . . . . . . . . . . . . . . .. 3716.2.3 Simulation Results and Comparisons . . . . . . . . . . . . . . .. . 373
6.2.3.1 Network performance using adaptive antenna arrays. . . . 3736.2.3.2 Network performance using adaptive antenna arraysand
adaptive modulation . . . . . . . . . . . . . . . . . . . . . 3756.2.4 Summary and Conclusion . . . . . . . . . . . . . . . . . . . . . . . 377
6.3 Effects of SINR Threshold on the UTRA Performance . . . . . .. . . . . . 3786.3.1 Introduction . . . . . . . . . . . . . . . . . . . . . . . . . . . . . . . 3786.3.2 Simulation Results . . . . . . . . . . . . . . . . . . . . . . . . . . . 3796.3.3 Summary and Conclusion . . . . . . . . . . . . . . . . . . . . . . . 383
6.4 Network-Layer Performance of Multi-Carrier CDMA . . . . .. . . . . . . . 3846.4.1 Introduction . . . . . . . . . . . . . . . . . . . . . . . . . . . . . . . 3846.4.2 Simulation Results . . . . . . . . . . . . . . . . . . . . . . . . . . . 3896.4.3 Summary and Conclusions . . . . . . . . . . . . . . . . . . . . . . . 396
7 HSDPA-Style TDD/CDMA Network Performance 3997.1 Introduction . . . . . . . . . . . . . . . . . . . . . . . . . . . . . . . . . . . 3997.2 UMTS FDD Versus TDD Terrestrial Radio Access . . . . . . . . . .. . . . 400
7.2.1 FDD Versus TDD Spectrum Allocation of UTRA . . . . . . . . . .. 4007.2.2 Physical Channels . . . . . . . . . . . . . . . . . . . . . . . . . . . 401
7.3 UTRA TDD/CDMA System . . . . . . . . . . . . . . . . . . . . . . . . . . 4027.3.1 The TDD Physical Layer . . . . . . . . . . . . . . . . . . . . . . . . 4037.3.2 Common Physical Channels of the TDD Mode . . . . . . . . . . . .4047.3.3 Power Control . . . . . . . . . . . . . . . . . . . . . . . . . . . . . 4067.3.4 Time Advance . . . . . . . . . . . . . . . . . . . . . . . . . . . . . 406
7.4 Interference Scenario In TDD CDMA . . . . . . . . . . . . . . . . . . .. . 4067.4.1 Mobile to Mobile Interference . . . . . . . . . . . . . . . . . . . .. 4077.4.2 Base Station to Base Station Interference . . . . . . . . . .. . . . . 407
7.5 Simulation Results . . . . . . . . . . . . . . . . . . . . . . . . . . . . . . .4087.5.1 Simulation Parameters . . . . . . . . . . . . . . . . . . . . . . . . . 4097.5.2 Performance of Adaptive Antenna Array Aided TDD CDMA Systems 412

xii CONTENTS
7.5.3 Performance of AAA and AQAM Aided TDD HSDPA-Style Systems 4167.6 LS Code Aided Network Performance of UTRA-like TDD/CDMA. . . . . . 421
7.6.1 Introduction . . . . . . . . . . . . . . . . . . . . . . . . . . . . . . . 4217.6.2 LS Codes in UTRA TDD/CDMA . . . . . . . . . . . . . . . . . . . 4227.6.3 System Parameters . . . . . . . . . . . . . . . . . . . . . . . . . . . 4237.6.4 Simulation Results . . . . . . . . . . . . . . . . . . . . . . . . . . . 4247.6.5 Summary and Conclusions . . . . . . . . . . . . . . . . . . . . . . . 427
8 The Effects of Power Control and Hard Handovers on the UTRA TDD/CDMASystem 4298.1 A Historical Perspective on Handovers . . . . . . . . . . . . . . .. . . . . . 4298.2 Hard Handover in UTRA-like TDD/CDMA Systems . . . . . . . . . .. . . 431
8.2.1 Relative Pilot Power Based Hard Handover . . . . . . . . . . .. . . 4328.2.2 Simulation Results . . . . . . . . . . . . . . . . . . . . . . . . . . . 433
8.2.2.1 Near-Symmetric UL/DL Traffic Loads . . . . . . . . . . . 4338.2.2.2 Asymmetric Traffic loads . . . . . . . . . . . . . . . . . . 434
8.3 Power Control in UTRA-like TDD/CDMA Systems . . . . . . . . . .. . . . 4388.3.1 UTRA TDD Downlink Closed-loop Power Control . . . . . . . .. . 4438.3.2 UTRA TDD Uplink Closed-loop Power Control . . . . . . . . . .. 4458.3.3 Closed-loop Power Control Simulation Results . . . . . .. . . . . . 445
8.3.3.1 UL/DL Symmetric Traffic Loads . . . . . . . . . . . . . . 4468.3.3.2 Uplink Dominated Asymmetric Traffic Loads . . . . . . . 4488.3.3.3 Downlink Dominated Asymmetric Traffic Loads . . . . . .450
8.3.4 UTRA TDD Uplink Open-loop Power Control . . . . . . . . . . . .4528.3.5 Frame-Delay Based Power Adjustment Model . . . . . . . . . .. . 454
8.3.5.1 UL/DL Symmetric Traffic Loads . . . . . . . . . . . . . . 4598.3.5.2 Asymmetric Traffic Loads . . . . . . . . . . . . . . . . . . 463
8.4 Summary and Conclusion . . . . . . . . . . . . . . . . . . . . . . . . . . . .466
9 Genetically Enhanced UTRA/TDD Network Performance 4679.1 Introduction . . . . . . . . . . . . . . . . . . . . . . . . . . . . . . . . . . . 4679.2 The Genetically Enhanced UTRA-like TDD/CDMA System . . .. . . . . . 4689.3 Simulation Results . . . . . . . . . . . . . . . . . . . . . . . . . . . . . . .4739.4 Summary and Conclusion . . . . . . . . . . . . . . . . . . . . . . . . . . . .478
10 Conclusions and Further Research 48110.1 Summary of FDD Networking . . . . . . . . . . . . . . . . . . . . . . . . .48110.2 Summary of FDD Versus TDD Networking . . . . . . . . . . . . . . . .. . 48610.3 Further Research . . . . . . . . . . . . . . . . . . . . . . . . . . . . . . . .491
10.3.1 Advanced Objective Functions . . . . . . . . . . . . . . . . . . .. . 49310.3.2 Other Types of Genetic Algorithms . . . . . . . . . . . . . . . .. . 493
Glossary 495
Bibliography 496
Author Index 523


Chapter 5HSDPA-Style FDD Networking,Adaptive Arrays and AdaptiveModulation
5.1 Introduction
In January 1998, the European standardisation body for third generation mobile radio sys-tems, the European Telecommunications Standards Institute - Special Mobile Group (ETSISMG), agreed upon a radio access scheme for third generationmobile radio systems, referredto as the Universal Mobile Telecommunication System (UMTS)[11,59]. Although this chap-ter was detailed in Chapter 1, here we provide a rudimentary introduction to the system, inorder to allow readers to consult this chapter directly, without having to read Chapter 1 first.Specifically, the UMTS Terrestrial Radio Access (UTRA) supports two modes of duplexing,namely Frequency Division Duplexing (FDD) , where the uplink and downlink are transmit-ted on different frequencies, and Time Division Duplexing (TDD) , where the uplink and thedownlink are transmitted on the same carrier frequency, butmultiplexed in time. The agree-ment recommends the employment of Wideband Code Division Multiple Access (W-CDMA)for UTRA FDD and Time Division - Code Division Multiple Access (TD-CDMA) for UTRATDD. TD-CDMA is based on a combination of Time Division Multiple Access (TDMA) andCDMA, whereas W-CDMA is a pure CDMA-based system. The UTRA scheme can beused for operation within a minimum spectrum of 2 x 5 MHz for UTRA FDD and 5 MHz forUTRA TDD. Both duplex or paired and simplex or unpaired frequency bands have been iden-tified in the region of 2 GHz to be used for the UTRA third generation mobile radio system.Both modes of UTRA have been harmonised with respect to the basic system parameters,such as carrier spacing, chip rate and frame length. Thereby, FDD/TDD dual mode operationis facilitated, which provides a basis for the development of low cost terminals. Furthermore,the interworking of UTRA with GSM [11] is ensured.
In UTRA, the different service needs are supported in a spectrally efficient way by a com-
295

296 CHAPTER 5. HSDPA-STYLE FDD NETWORKING, ADAPTIVE ARRAYS AND AQA M
bination of FDD and TDD. The FDD mode is intended for applications in both macro- andmicro-cellular environments, supporting data rates of up to 384 kbps and high mobility. TheTDD mode, on the other hand, is more suited to micro and pico-cellular environments, aswell as for licensed and unlicensed cordless and wireless local loop applications. It makesefficient use of the unpaired spectrum - for example in wireless Internet applications, wheremuch of the teletraffic is in the downlink - and supports data rates of up to 2 Mbps. Therefore,the TDD mode is particularly well suited for environments generating a high traffic density(e.g. in city centres, business areas, airports etc.) and for indoor coverage, where the applica-tions require high data rates and tend to have highly asymmetric traffic again, as in Internetaccess.
In parallel to the European activities, extensive work has been carried out also in Japanand the USA on third generation mobile radio systems. The Japanese standardisation bodyknown as the Association of Radio Industry and Business (ARIB) also opted for using W-CDMA, and the Japanese as well as European proposals for FDD bear strong similarities.Similar concepts have also been developed by the North-American T1 standardisation bodyfor the pan-American third generation (3G) system known as cdma2000, which was alsodescribed in Chapter 1 [11].
In order to work towards a truly global third generation mobile radio standard, the ThirdGeneration Partnership Project (3GPP) was formed in December 1998. 3GPP consists ofmembers of the standardisation bodies in Europe (ETSI), theUS (T1), Japan (ARIB), Korea(TTA - Telecommunications Technologies Association), andChina (CWTS - China WirelessTelecommunications Standard). 3GPP merged the already well harmonised proposals by theregional standardisation bodies and now works towards a single common third generationmobile radio standard under the terminology UTRA, retaining its two modes, and aiming tooperate on the basis of the evolved GSM core network. The Third Generation PartnershipProject 2 (3GPP2), on the other hand, works towards a third generation mobile radio stan-dard, which is based on an evolved IS-95 type system which wasoriginally referred to ascdma2000 [11]. In June 1999, major international operatorsin the Operator HarmonisationGroup (OHG) proposed a harmonised G3G (Global Third Generation) concept, which hasbeen accepted by 3GPP and 3GPP2. The harmonised G3G concept is a single standard withthe following three modes of operation:
• CDMA direct spread (CDMA-DS), based on UTRA FDD as specified by 3GPP.
• CDMA multi-carrier (CDMA-MC), based on cdma2000 using FDD as specified by3GPP2.
• TDD (CDMA TDD) based on UTRA TDD as specified by 3GPP.
5.2 Direct Sequence Code Division Multiple Access
A rudimentary introduction to CDMA was provided in Chapter 1in the context of single-userreceivers, while in Chapter 2 the basic concepts of multi-user detection have been introduced.However, as noted earlier, our aim is to allow reader to consult this chapter directly, withouthaving to refer back to the previous chapters. Hence here a brief overview of the undrlyingCDMA basics is provided.

5.2. DIRECT SEQUENCE CODE DIVISION MULTIPLE ACCESS 297
Code
Time
Fre
quen
cy
Fre
quen
cy
Fre
quen
cyTimeTime
User 1
User 2 Use
r 1
Use
r 2
21
User 3
Figure 5.1: Multiple access schemes: FDMA (left), TDMA (middle) and CDMA (right).
Traditional ways of separating signals in time using TDMA and in frequency ensure thatthe signals are transmitted orthogonal in either time or frequency and hence they are non-interfering. In CDMA different users are separated employing a set of waveforms exhibitinggood correlation properties, which are known as spreading codes. Figure 5.1 illustrates theprinciples of FDMA, TDMA and CDMA. More explicitly, FDMA uses a fraction of the totalFDMA frequency band for each communications link for the whole duration of a conver-sation, while TDMA uses the entire bandwidth of a TDMA channel for a fraction of theTDMA frame, namely for the duration of a time slot. Finally, CDMA uses the entire avail-able frequency band all the time and separates the users withthe aid of unique, orthogonaluser signature sequences.
In a CDMA digital communications system, such as that shown in Figure 5.2, the datastream is multiplied by the spreading code, which replaces each data bit with a sequence ofcode chips. A chip is defined as the basic element of the spreading code, which typicallyassumes binary values. Hence, the spreading process consists of replacing each bit in theoriginal user’s data sequence with the complete spreading code. The chip rate is significantlyhigher than the data rate, hence causing the bandwidth of theuser’s data to be spread, asshown in Figure 5.2.
At the receiver, the composite signal containing the spreaddata of multiple users is mul-tiplied by a synchronised version of the spreading code of the wanted user. The specificauto-correlation properties of the codes allow the receiver to identify and recover each de-layed, attenuated and phase-rotated replica of the transmitted signal, provided that the signalsare separated by more than one chip period and the receiver has the capability of trackingeach significant path. This is achieved using a Rake receiver[5] that can process multipledelayed received signals. Coherent combination of these transmitted signal replicas allowsthe original signal to be recovered. The unwanted signals ofthe other simultaneous usersremain wideband, having a bandwidth equal to that of the noise, and appear as additionalnoise with respect to the wanted signal. Since the bandwidthof the despread wanted signal isreduced relative to this noise, the signal-to-noise ratio of the wanted signal is enhanced by thedespreading process in proportion to the ratio of the spreadand despread bandwidths, since

298 CHAPTER 5. HSDPA-STYLE FDD NETWORKING, ADAPTIVE ARRAYS AND AQA M
A/SF
Signal
B
A
SF · BSpreading code
A/SF
Interferer
B
A
SF · B
Spreading code
Despreading code
A/SF
A
Figure 5.2: CDMA Spreading and Despreading Processes
the noise power outside the useful despread signal’s bandwidth can be removed by a low-pass filter. This bandwidth ratio is equal to the ratio of the chip rate to the data rate, whichis known as the Processing Gain (PG). For this process to workefficiently, the signals of allof the users should be received at or near the same power at thereceiver. This is achievedwith the aid of power control, which is one of the critical elements of a CDMA system. Theperformance of the power control scheme directly affects the capacity of the CDMA network.
5.3 UMTS Terrestrial Radio Access
A bandwidth of 155 MHz has been allocated for UMTS services inEurope in the frequencyregion of 2.0 GHz. The paired bands of 1920-1980 MHz (uplink)and 2110-2170 MHz(downlink) have been set aside for FDD W-CDMA systems, and the unpaired frequencybands of 1900-1920 MHz and 2010-2025 MHz for TDD CDMA systems.
A UTRA Network (UTRAN) consists of one or several Radio Network Sub-systems(RNSs), which in turn consist of base stations (referred to as Node Bs) and Radio NetworkControllers (RNCs). A Node B may serve one or multiple cells.Mobile stations are known asUser Equipment (UE), which are expected to support multi-mode operation in order to enablehandovers between the FDD and TDD modes and, prior to complete UTRAN coverage, alsoto GSM. The key parameters of UTRA have been defined as in Table5.1.

5.3. UMTS TERRESTRIAL RADIO ACCESS 299
Duplex scheme FDD TDDMultiple access scheme W-CDMA TD-CDMAChip rate 3.84 Mchip/s 3.84 Mchip/sSpreading factor range 4-512 1-16Frequency bands 1920-1980 MHz (UL) 1900-1920 MHz
2110-2170 MHz (DL) 2010-2025 MHzModulation mode 4-QAM/QPSK 4-QAM/QPSKBandwidth 5 MHz 5 MHzNyquist pulse shaping 0.22 0.22Frame length 10 ms 10 msNumber of timeslots per frame 15 15
Table 5.1: Key UTRA Parameters.
5.3.1 Spreading and Modulation
As usual, the uplink is defined as the transmission path from the mobile station to the basestation, which receives the unsynchronised channel impaired signals from the network’s mo-biles. The base station has the task of extracting the wantedsignal from the received signalcontaminated by both intra- and inter-cell interference. However, as described in Section 5.2,some degree of isolation between interfering users is achieved due to employing unique or-thogonal spreading codes, although their orthogonality isdestroyed by the hostile mobilechannel.
The spreading process consists of two operations. The first one is the channelisationoperation, which transforms every data symbol into a numberof chips, thus increasing thebandwidth of the signal, as seen in Figure 5.2 of Section 5.2.The channelisation codesin UTRA are Orthogonal Variable Spreading Factor (OVSF) codes [11] that preserve theorthogonality between a given user’s different physical channels, which are also capable ofsupporting multirate operation. These codes will be further discussed in the context of Figure5.4. The second operation related to the spreading, namely the ‘scrambling’ process thenmultiplies the resultant signals separately on the I- and Q-branches by a complex-valuedscrambling code, as shown in Figure 5.3. The scrambling codes may be one of either224
different ‘long’ codes or224 ‘short’ uplink scrambling codes.The Dedicated Physical Control CHannel (DPCCH) [11, 386] isspread to the chip rate
by the channelisation codeCc, while thenth Dedicated Physical Data CHannel (DPDCH),namely DPDCHn, is spread to the chip rate by the channelisation codeCd,n. One DPCCHand up to six parallel DPDCHs can be transmitted simultaneously, i.e. 1 ≤ n ≤ 6 as seenin Figure 5.3). However, it is beneficial to transmit with theaid of a single DPDCH, if therequired bit-rate can be provided by a single DPDCH for reasons of terminal amplifier ef-ficiency. This is because multi-code transmissions increase the peak-to-average ratio of thetransmission, which reduces the efficiency of the terminal’s power amplifier [59]. The max-imum user data rate achievable with the aid of a single code isderived from the maximumchannel bit rate, which is 960 kbps using a spreading factor of four without channel codingin the 1999 version of the UTRA standard. However, at the timeof writing a spreading factorof one is being considered by the standardisation body. Withchannel coding the maximum

300 CHAPTER 5. HSDPA-STYLE FDD NETWORKING, ADAPTIVE ARRAYS AND AQA M
Cd,1 βd
Cd,2 βd
Cd,4 βd
Cd,6 βd
Cc βd
Σ
Σ
I
Sdpch,n
S
DPDCH1
Cd,3 βd
Cd,5 βd
DPDCH3
DPDCH5
DPDCH2
DPDCH4
DPDCH6
DPCCH
Q
j
I+jQ
Figure 5.3: Spreading for uplink DPCCH and DPDCHs

5.3. UMTS TERRESTRIAL RADIO ACCESS 301
c
cch,1,1 = (1)
SF=4
cch,2,1 = (1, 1)
cch,2,2 = (1,−1)
cch,4,1 = (1, 1, 1, 1)
cch,4,2 = (1, 1,−1,−1)
cch,4,3 = (1,−1, 1,−1)
cch,4,4 = (1,−1,−1, 1)
(c, c)
(c,−c)
SF=2SF=1
Figure 5.4: Code tree for the generation of Orthogonal Variable Spreading Factor (OVSF) codes
practical user data rate for single code transmission is of the order of 400-500 kbps. Forachieving higher data rates parallel multi-code channels are used. This allows up to six par-allel codes to be used, increasing the achievable channel bit rate up to 5740 kbps, which canaccommodate a 2 Mbps user data rate or even higher data rates,when the channel coding rateis 1/2.
The OVSF codes [130] can be defined using the code tree of Figure 5.4. In Figure 5.4, thechannelisation codes are uniquely described byCch,SF,k, where SF is the spreading factorof the codes, andk is the code index where0 ≤ k ≤ SF − 1. Each level in the codetree defines spreading codes of length SF, corresponding to aparticular spreading factor ofSF. The number of codes available for a particular spreadingfactor is equal to the spreadingfactor itself. All the codes of the same level in the code treeconstitute a set and they areorthogonal to each other. Any two codes of different levels are also orthogonal to each other,as long as one of them is not the mother of the other code. For example, the codesc15(2),

302 CHAPTER 5. HSDPA-STYLE FDD NETWORKING, ADAPTIVE ARRAYS AND AQA M
c7(1) andc3(1) are all the mother codes ofc31(3) and hence are not orthogonal toc31(3),where the number in the round bracket indicates the code index. Thus not all the codes withinthe code tree can be used simultaneously by a mobile station.Specifically, a code can be usedby an MS if and only if no other code on the path from the specificcode to the root of thetree, or in the sub-tree below the specific node is used by the same MS.
For the DPCCH and DPDCHs the following applies:
• The PDCCH is always spread by codeCc = Cch,256,0.
• When only one DPDCH is to be transmitted, DPDCH1 is spread by the codeCd,1 =Cch,SF,k, where SF is the spreading factor of DPDCH1 andk = SF/4.
• When more than one DPDCHs have to be transmitted, all DPDCHs have spreadingfactors equal to four. Furthermore, DPDCHn is spread by the codeCd,n = Cch,4,k,wherek = 1 if n ⊂ {1, 2}, k = 3 if n ⊂ {3, 4}, andk = 2 if n ⊂ {5, 6}.
A fundamental difference between the uplink and the downlink is that in the downlinksynchronisation is common to all users and channels of a given cell. This enables us to exploitthe cross-correlation properties of the OVSF codes, which were originally proposed in [130].These codes offer perfect cross-correlation in an ideal channel, but there is only a limitednumber of these codes available. The employment of OVSF codes allows the spreadingfactor to be changed and orthogonality between the spreading codes of different lengths to bemaintained. The codes are selected from the code tree, whichis illustrated in Figure 5.4. Asillustrated above, there are certain restrictions as to which of the channelisation codes can beused for transmission from a single source. Another physical channel may invoke a certaincode from the tree, if no other physical channel to be transmitted employing the same codetree is using a code on an underlying branch, since this wouldbe equivalent to using a higherspreading factor code generated from the spreading code to be used, which are not orthogonalto each other on the same branch of the code tree. Neither can asmaller spreading factor codeon the path to the root of the tree be used. Hence, the number ofavailable codes depends onthe required transmission rate and spreading factor of eachphysical channel.
In the UTRA downlink a part of the multi-user interference can be orthogonal - apartfrom the channel effects. The users within the same cell share the same scrambling code, butuse different channelisation/OVSF codes. In a non-dispersive downlink channel, all intra-cellusers are synchronised and therefore they are perfectly orthogonal. Unfortunately, in mostcases the channel will be dispersive, implying that non-synchronised interference will besuppressed only by a factor corresponding to the processinggain, and thus they will interferewith the desired signal. The interference from other cells which is referred to as inter-cellinterference, is non-orthogonal, due to employing different scrambling but possibly the samechannelisation codes. Therefore inter-cell interferenceis also suppressed by a factor corre-sponding to the processing gain.
The channelisation code used for the Primary Common PIlot CHannel (CPICH) is fixed toCch,256,0, while the channelisation code for the Primary Common Control Physical CHannel(CCPCH) is fixed toCch,256,1 [386]. The channelisation codes for all other physical channelsare assigned by the UTRAN [386].
A total of 218 − 1 = 262143 scrambling codes, numbered as0 . . . 262142 can be gener-ated. However, not all of the scrambling codes are used. The scrambling codes are divided
5.3. UMTS TERRESTRIAL RADIO ACCESS 303
into 512 sets, each consisting of a primary scrambling code and 15 secondary scramblingcodes [386].
More specifically, the primary scrambling codes consist of scrambling codesn = 16 ∗ i,wherei = 0 . . . 511. Theith set of secondary scrambling codes consists of scrambling codes16 ∗ i + k wherek = 1 . . . 15. There is a one-to-one mapping between each primary scram-bling code and the associated 15 secondary scrambling codesin a set, such that theith pri-mary scrambling code uniquely identifies theith set of secondary scrambling codes. Hence,according to the above statement, scrambling codesk = 0 . . . 8191 are used. Each of thesecodes is associated with a left alternative scrambling codeand a right alternative scramblingcode, that may be used for the so-called compressed frames. Specifically, compressed framesare shortened duration frames transmitted right before a handover, in order to create an inac-tive period during which no useful data is transmitted. Thisallows the transceivers to carryout operations necessary for the handover to be successful.The left alternative scramblingcode associated with scrambling codek is the scrambling codek + 8192, while the corre-sponding right alternative scrambling code is scrambling codek + 16384. In compressedframes, the left alternative scrambling code is used, ifn < SF/2 and the right alternativescrambling code is used, ifn ≥ SF/2, whereCch,SF,n is the channelisation code used fornon-compressed frames.
The set of 512 primary scrambling codes is further divided into 64 scrambling codegroups, each consisting of 8 primary scrambling codes. Thejth scrambling code groupconsists of primary scrambling codes16 ∗ 8 ∗ j + 16 ∗ k, wherej = 0 . . . 63 andk = 0 . . . 7.
Each cell is allocated one and only one primary scrambling code. The primary CCPCHand primary CPICH are always transmitted using this primaryscrambling code. The otherdownlink physical channels can be spread and transmitted with the aid of either the primaryscrambling code or a secondary scrambling code from the set associated with the primaryscrambling code of the cell.
5.3.2 Common Pilot Channel
The Common PIlot CHannel (CPICH) is an unmodulated downlinkcode channel, which isscrambled with the aid of the cell-specific primary scrambling code. The function of thedownlink CPICH is to aid the Channel Impulse Response (CIR) estimation necessary for thedetection of the dedicated channel at the mobile station andto provide the CIR estimationreference for the demodulation of the common channels, which are not associated with thededicated channels.
UTRA has two types of common pilot channels, namely the primary and secondaryCPICHs. Their difference is that the primary CPICH is alwaysspread by the primary scram-bling code defined in Section 5.3.1. More explicitly, the primary CPICH is associated witha fixed channelisation code allocation and there is only one such channel and channelisationcode for a cell or sector. The secondary CPICH may use any channelisation code of length256 and may use a secondary scrambling code as well. A typicalapplication of secondaryCPICHs usage would be in conjunction with narrow antenna beams intended for service pro-vision at specific teletraffic ‘hot spots’ or places exhibiting a high traffic density [59].
An important application of the primary common pilot channel is during the collection ofchannel quality measurements for assisting during the handover and cell selection process.The measured CPICH reception level at the terminal can be used for handover decisions.

304 CHAPTER 5. HSDPA-STYLE FDD NETWORKING, ADAPTIVE ARRAYS AND AQA M
Furthermore, by adjusting the CPICH power level the cell load can be balanced betweendifferent cells, since reducing the CPICH power level encourages some of the terminals tohandover to other cells, while increasing it invites more terminals to handover to the cell, aswell as to make their initial access to the network in that cell.
5.3.3 Power Control
Agile and accurate power control is perhaps the most important aspect in W-CDMA, in partic-ular on the uplink, since a single high-powered rogue mobilecan cause serious performancedegradation to other users in the cell. The problem is referred to as the ‘near-far effect’ andoccurs when, for example, one mobile is near the cell edge, and another is near the cell cen-tre. In this situation, the mobile at the cell edge is exposedto a significantly higher pathloss,say 70 dB higher, than that of the mobile near the cell centre.If there were no power controlmechanisms in place, the mobile near the base station could easily ‘overpower’ the mobile atthe cell edge, and thus may block a large part of the cell. The optimum strategy in the senseof maximising the system’s capacity is to equalise the received power per bit of all mobilestations at all times.
A so-called open-loop power control mechanism [59] attempts to make a rough estimateof the expected pathloss by means of a downlink beacon signal, but this method can be highlyinaccurate. The prime reason for this is that the fast fadingis essentially uncorrelated betweenthe uplink and downlink, due to the large frequency separation of the uplink and downlinkband of the W-CDMA FDD mode. Open-loop power control is however, used in W-CDMA,but only to provide a coarse initial power setting of the mobile station at the beginning of aconnection.
A better solution is to employ fast closed-loop power control [59]. In closed-loop powercontrol in the uplink, the base station performs frequent estimates of the received SIR andcompares it to the target SIR. If the measured SIR is higher than the target SIR, the basestation commands the mobile station to reduce the power, while if it is too low it will instructthe MS to increase its power. Since each 10 ms UTRA frame consists of 15 time slots,each corresponding to one power control power adjustment period, this procedure takes placeat a rate of 1500 Hz. This is far faster than any significant change of pathloss, includingstreet corner effects, and indeed faster than the speed of Rayleigh fading for low to moderatemobile speeds. The street corner effect occurs when a mobileturns the street corner andhence the received signal power drops markedly. Therefore the mobile responds by rapidlyincreasing its transmit power, which may inflict sever interference upon other closely locatedbase stations. In response, the mobiles using these base stations increase their transmit powersin an effort to maintain their communications quality. Thisis undesirable, since it results ina high level of co-channel interference, leading to excessive transmission powers and to areduction of the battery recharge period.
The same closed-loop power control technique is used on the downlink, although therationale is different. More specifically, there is no near-far problem due to the one-to-manydistributive scenario, i.e. all the signals originate fromthe single base station to all mobiles.It is, however, desirable to provide a marginal amount of additional power to mobile stationsnear the cell edge, since they suffer from increased inter-cell interference. Hence, the closedloop power control in CDMA systems ensures that each mobile transmits just sufficient powerto satisfy the outer-loop power control scheme’s SIR target. The SIR target is controlled by

5.3. UMTS TERRESTRIAL RADIO ACCESS 305
an outer-loop power control process that adjusts the required SIR in order to meet the BitError Ratio (BER) requirements of a particular service. At higher mobile speeds typically ahigher SIR is necessary for attaining a given BER/FER.
5.3.3.1 Uplink Power Control
The uplink’s inner-loop power control adjusts the mobile’stransmit power in order to main-tain the received uplink SIR at the given SIR target, namely at SIRtarget. The base stationsthat are communicating with the mobile generate Transit Power Control (TPC) commandsand transmit them, once per slot, to the mobile. The mobile then derives from the TPCcommands of the various base stations, a single TPC command,TPC cmd, for each slot,combining multiple received TPC commands if necessary. In [387] two algorithms weredefined for the processing of TPC commands and hence for deriving TPC cmd.
Algorithm 1: [387]When not in soft-handover, i.e. when the mobile communicateswith a single base station,
only one TPC command will be received in each slot. Hence, foreach slot, if the TPCcommand is equal to 0 (SIR > SIRtarget) thenTPC cmd = −1, otherwise, if the TPCcommand is 1 (SIR < SIRtarget) thenTPC cmd = 1, which implies powering down orup, respectively.
When in soft handover, multiple TPC commands are received in each slot from the dif-ferent base stations in the active base station set. If all ofthe base station’s TPC commandsare identical, then they are combined to form a single TPC command, namelyTPC cmd.However, if the TPC commands of the different base stations differ, then a soft decisionWi
is generated for each of the TPC commands,TPCi, wherei = 1, 2, . . . , N , andN is thenumber of TPC commands. TheseN soft decisions are then used to form a combined TPCcommandTPC cmd according to:
TPC cmd = γ(W1,W2, . . . ,WN ) (5.1)
whereTPC cmd is either -1 or +1 andγ() is the decision function combining the soft values,W1, . . . ,WN .
If the N TPC commands appear to be uncorrelated, and have a similar probability ofbeing 0 or 1, then functionγ() should be defined such that the probability that the output ofthe functionγ() is equal to 1, is greater than or equal to 1/2N , and the probability that theoutput ofγ() is equal to -1, shall be greater than or equal to 0.5 [387]. Alternatively, thefunctionγ() should be defined such thatP (γ() = 1) ≥ 1/2N andP (γ() = −1) ≥ 0.5.
Algorithm 2: [387]When not in soft handover, only one TPC command will be received in each slot, and
the mobile will process the maximum 15 TPC commands in a five-slot cycle, where the setsof five slots are aligned with the frame boundaries and the sets do not overlap. Therefore,when not in soft handover, for the first four slots of a five-slot setTPC cmd = 0 is used forindicating that no power control adjustments are made. For the fifth slot of a set the mobileperforms hard decisions on all five of the received TPC commands. If all five hard decisionsresult in a binary 1, then we setTPC cmd = 1. In contrast, if all five hard decisions yield abinary 0, thenTPC cmd = −1 is set, elseTPC cmd = 0.
When the mobile is in soft handover, multiple TPC commands will be received in eachslot from each of the base stations in the set of active base stations. When the TPC commands

306 CHAPTER 5. HSDPA-STYLE FDD NETWORKING, ADAPTIVE ARRAYS AND AQA M
of the active base stations are identical, then they can be combined into a single TPC com-mand. However, when the received TPC commands are different, the mobile makes a harddecision concerning the value of each TPC command for three consecutive slots, resulting inN hard decisions for each of the three slots, whereN is the number of base stations withinthe active set. The sets of three slots are aligned to the frame boundaries and do not overlap.ThenTPC cmd = 0 is set for the first two slots of the three-slot set, and thenTPC cmd isdetermined for the third slot as follows.
The temporary commandTPC tempi is determined for each of theN sets of three TPCcommands of the consecutive slots by settingTPC tempi = 1 if all three TPC hard deci-sions are binary 1. In contrast, if all three TPC hard decisions are binary 0,TPC tempi =−1 is set, otherwise we setTPC tempi = 0. These temporary TPC commands are then usedto determine the combined TPC command for the third slot invoking the decision functionγ(TPC temp1, TPC temp2, . . . , TPC tempN ) defined as:
TPC cmd = 1 if1
N
N∑
i=1
TPC tempi > 0.5
TPC cmd = −1 if1
N
N∑
i=1
TPC tempi < −0.5 (5.2)
TPC cmd = 0 otherwise.
5.3.3.2 Downlink Power Control
The downlink transmit power control procedure simultaneously controls the power of boththe DPCCH and its corresponding DPDCHs, both of which are adjusted by the same amount,and hence the relative power difference between the DPCCH and DPDCHs remains constant.
The mobile generates TPC commands for controlling the base station’s transmit powerand sends them in the TPC field of the uplink DPCCH. When the mobile is not in softhandover, the TPC command generated is transmitted in the first available TPC field us-ing the uplink DPCCH. In contrast, when the mobile is in soft handover, it checks thedownlink power control mode (DPC MODE) before generating the TPC command. IfDPC MODE = 0, the mobile sends a unique TPC command in the first available TPCfield in the uplink DPCCH. If however,DPC MODE = 1, the mobile repeats the sameTPC command over three consecutive slots of the same frame and the new TPC command istransmitted to the base station in an effort the control its power at the beginning of the nextframe. The minimum required transmit power step size is 1 dB,with a smaller step size of0.5 dB being optional. The power control step size can be increased from 1 dB to 2 dB, thusallowing a 30 dB correction range during the 15 slots of a 10 msframe. The maximum trans-mit powers are +21 dBm and +24 dBm, although it is likely that in the first phase of networkdeployment most terminals will belong to the 21 dBm power class [59].
5.3.4 Soft Handover
Theoretically, the ability of CDMA to despread the interfering signals, and thus adequatelyoperate at low signal-to-noise ratios, allows a CDMA network to have a frequency reusefactor of one [59]. Traditionally, non-CDMA based networkshave required adjacent cells to

5.3. UMTS TERRESTRIAL RADIO ACCESS 307
have different carrier frequencies, in order to reduce the co-channel interference to acceptablelevels. Therefore, when a mobile hands over from one cell to another, it has to re-tune its syn-thesiser to the new carrier frequency, i.e. it performs an inter-frequency handover. This pro-cess is a ‘break-before-make’ procedure, known as a hard handover, and hence call disruptionor interruption is possible. However, in a CDMA based network, having a frequency reusefactor of one, so-called soft handovers may be performed, which is a ‘make-before-break’process, potentially allowing for a smoother handover between cells. During a soft handovera mobile is connected to two or more base stations simultaneously, thus utilising more net-work resources and transmitting more signals, which interfere with other users. Therefore, itis in the network operator’s interests to minimise the number of users in soft handover, whilstmaintaining a satisfactory quality of service. In soft handover, each connected base stationreceives and demodulates the user’s data, and selection diversity is performed between thebase stations, i.e. the best version of the uplink frame is selected. In the downlink, the mobilestation performs maximal ratio combining [5] of the signal received from the multiple basestations. This diversity combining improves the coverage in regions of previously low-qualityservice provision, but at the expense of increased backhaulconnections.
The set of base stations engaged in soft handover is known as the active set. The mo-bile station continuously monitors the received power level of the PIlot CHannels (PICHs)transmitted by its neighbouring base stations. The received pilot power levels of these basestations are then compared to two thresholds, the acceptance threshold,Tacc and the drop-ping thresholdTdrop. Therefore, as a mobile moves away from base station 1, and towardsbase station 2, the pilot signal strength received from basestation 2 increases. When the pilotstrength exceeds theacceptance threshold, Tacc, the mobile station enters the soft handoverstate, as shown in Figure 5.5. As the mobile continues to moveaway from base station 1,its pilot strength decreases, until it falls below thedrop threshold. After a given time inter-val, Tdrop, during which the signal strength from base station 1 has notexceeded the dropthreshold, base station 1 is removed from the active set.
5.3.5 Signal-to-Interference plus Noise Ratio Calculations
5.3.5.1 Downlink
The interference received at the mobile can be divided into interference due to the signalstransmitted to other mobiles from the same base station, which is known as intra-cell inter-ference, and that received due to the signals transmitted toother mobiles from other basestations, which is termed inter-cell interference. In an ideal case, the intra-cell interferencewould be zero, since all the signals from the base station aresubjected to the same channelconditions, and orthogonal channelisation codes are used for separating the users. However,after propagation through a dispersive multipath channel,this orthogonality is eroded. Theintra-cell and inter-cell interference values are always non-zero when in a single-user scenariodue to the inevitable interference inflicted by the common pilot channels.
The instantaneous SINR is obtained by dividing the receivedsignal powers by the totalinterference plus thermal noise power, and then by multiplying this ratio by the spreadingfactor,SF , yielding
SINRDL =SF · S
(1 − α)IIntra + IInter + N0
, (5.3)

308 CHAPTER 5. HSDPA-STYLE FDD NETWORKING, ADAPTIVE ARRAYS AND AQA M
Pilot 2
Time
TotalEc/Io
Ec/Io
Pilot 1
Active Set
Add thresholdDrop threshold
Add Pilot 2to Active Set
Tdrop
Remove Pilot 1from Active Set
Figure 5.5: The soft handover process showing the process of adding and dropping base stations fromthe active set.
whereα = 1 corresponds to the ideal case of perfectly orthogonal intra-cell interference,andα = 0 is for completely asynchronous intra-cell interference. Furthermore,N0 is thethermal noise’s power spectral density,S is the received signal power,IIntra is the intra-cellinterference andIInter is the inter-cell interference. Again, the interference plus noise poweris scaled by the spreading factor,SF , since after the low-pass filtering the noise bandwidthis reduced by a factor ofSF during the despreading process.
When in soft handover, the maximum ratio combining is performed on theN receivedsignals of theN active base stations. Therefore, provided that the active base stations’ re-ceived signals are independent, the SINR in this situation is:
SINRDL = SINRDL1+ SINRDL2
+ . . . + SINRDLN. (5.4)
5.3.5.2 Uplink
The uplink differs from the downlink in that the multiple access interference is asynchronousin the uplink due to the un-coordinated transmissions of themobile stations, whereas it mayremain quasi-synchronous in the downlink. Therefore, the intra-cell uplink interference isnot orthogonal. A possible solution for mitigating this problem is employing Multi-UserDetectors (MUDs) [93] at the base stations.
Thus, we defineβ as the MUD’s efficiency, which effectively gives the percentage of theintra-cell interference that is removed by the MUD. Settingβ = 0.0 implies 0% efficiency,when the intra-cell interference is not reduced by the MUD, whereasβ = 1.0 results in theperfect suppression of all the intra-cell interference. Therefore, the expression for the uplink
5.3. UMTS TERRESTRIAL RADIO ACCESS 309
SINR is:
SINRUL =SF · S
(1 − β)IIntra + IInter + N0
. (5.5)
When in soft handover, selection diversity is performed on theN received signals at eachof the active base stations. Therefore, the SINR in this situation becomes:
SINRUL = max(SINRUL1, SINRUL2
, . . . , SINRULN). (5.6)
5.3.6 Multi-User Detection
Multiple access communications using DS-CDMA is interference limited due to the Mul-tiple Access Interference (MAI) generated by the users transmitting simultaneously withinthe same bandwidth. The signals received from the users are separated with the aid of thedespreader using spreading sequences that are unique to each user. Again, these spreadingsequences are usually non-orthogonal. Even if they are orthogonal, the asynchronous up-link transmissions of the users or the time-varying nature of the mobile radio channel maypartially destroy this orthogonality. The non-orthogonalnature of the codes results in resid-ual MAI, which degrades the performance of the system. The frequency selective mobileradio channel also gives rise to Inter-Symbol Interference(ISI) due to dispersive multipathpropagation. This is exacerbated by the fact that the mobileradio channel is time-varying.
Conventional CDMA detectors - such as the matched filter [5, 388] and the RAKE com-biner [389] - are optimised for detecting the signal of a single desired user. RAKE combinersexploit the inherent multi-path diversity in CDMA, since they essentially consist of matchedfilters combining each resolvable path of the multipath channel. The outputs of these matchedfilters are then coherently combined according to a diversity combining technique, such asmaximal ratio combining [309], equal gain combining or selective diversity combining .These conventional single-user detectors are inefficient,because the interference is treated asnoise, and our knowledge concerning the CIR of the mobile channel, or that of the spreadingsequences of the interferers is not exploited. The efficiency of these detectors is dependenton the cross-correlation (CCL) between the spreading codesof all the users. The higher thecross-correlation, the higher the MAI. This CCL-induced MAI is exacerbated by the effectsof the dispersive multi-path channel and asynchronous transmissions. The utilisation of theseconventional receivers results in an interference-limited system. Another weakness of theabove-mentioned conventional CDMA detectors is the phenomenon known as the ‘near-fareffect’ [390,391]. For conventional detectors to operate efficiently, the signals received fromall the users have to arrive at the receiver with approximately the same power. A signal thathas a significantly weaker signal strength compared to the other signals will be ‘swamped’by the relatively higher powers of the other signals and the quality of the weaker signal at theoutput of the conventional receiver will be severely degraded. Therefore, stringent power con-trol algorithms are needed to ensure that the signals arriveat similar powers at the receiver, inorder to achieve a similar quality of service for different users [391,392]. Using conventionaldetectors to detect a signal corrupted by MAI, while encountering a hostile channel resultsin an irreducible BER, even if theEs/N0 ratio is increased. This is because at highEs/N0
values the probability of errors due to thermal noise is insignificant compared to the errorscaused by the MAI and the channel. Therefore, detectors thatcan reduce or remove the effectsof MAI and ISI are needed in order to achieve user capacity gains. These detectors also have

310 CHAPTER 5. HSDPA-STYLE FDD NETWORKING, ADAPTIVE ARRAYS AND AQA M
to be ‘near-far resistant’, in order to avoid the need for stringent power control requirements.In order to mitigate the problem of MAI, Verdu [93] proposed the optimum multi-user detec-tor for asynchronous Gaussian multiple access channels. This optimum detector significantlyoutperforms the conventional detector and it is near-far resistant, but unfortunately its com-plexity increases exponentially according to the order ofO(2NK), whereN is the numberof overlapping asynchronous bits considered in the detector’s window, andK is the numberof interfering users. In order to reduce the complexity of the receiver and yet to provide anacceptable BER performance, significant research efforts have been invested in the field ofsub-optimal CDMA multiuser receivers [93,393].
In summary, multi-user detectors reduce the error floor due to MAI and this translates intouser capacity gains for the system. These multi-user detectors are also near-far resistant to acertain extent and this results in less stringent power control requirements. However, multi-user detectors are more complex than conventional detectors. Coherent detectors require theexplicit knowledge of the channel impulse response estimates, which implies that a channelestimator is needed in the receiver, and hence training sequences have to be included in thetransmission frames. Training sequences are specified in the TDD mode of the UTRA stan-dard and enable the channel impulse response of each simultaneously communicating user tobe derived, which is necessary for the multi-user detectorsto be able to separate the signalsreceived from each user. These multi-user detectors also exhibit an inherent latency, whichresults in delayed reception. Multi-user detection is moresuitable for the uplink receiversince the base station has to detect all users’ signals anyway and it can tolerate a higher com-plexity. In contrast, a hand-held mobile receiver is required to be compact and lightweight,imposing restrictions on the available processing power. Recent research into blind MUDshas shown that data detection is possible for the desired user without invoking the knowledgeof the spreading sequences and channel estimates of other users. Hence using these detectorsfor downlink receivers is becoming feasible.
5.4 Simulation Results
This section presents simulation results obtained for an FDD mode UMTS type CDMA cel-lular network, investigating the applicability of varioussoft handover metrics when subjectedto different propagation conditions. This is followed by performance curves obtained usingadaptive antenna arrays, when subjected to both non-shadowed as well as shadowed propa-gation conditions. The performance of adaptive modulationtechniques used in conjunctionwith adaptive antenna arrays in a shadow faded environment is then characterised.
5.4.1 Simulation Parameters
Simulations of an FDD mode UMTS type CDMA based cellular network were conducted forvarious scenarios and algorithms in order to study the interactions of the processes involvedin such a network. As in the standard, the frame length was setto 10 ms, containing 15 powercontrol timeslots. The power control target SINR was chosento give a Bit Error Ratio (BER)of 1× 10⁻³, with a low quality outage occurring at a BER of5× 10−3 and an outage takingplace at a BER of1×10−2. The received SINRs at both the mobile and the base stations wererequired for each of the power control timeslots, and hence the outage and low quality outage

5.4. SIMULATION RESULTS 311
statistics were gathered. If the received SINR was found to be below the outage SINR for 75consecutive power control timeslots, corresponding to 5 consecutive transmission frames or50 ms, the call was dropped. The post despreading SINRs necessary for obtaining the targetBERs were determined with the aid of physical-layer simulations using a 4-QAM modulationscheme, in conjunction with1/2 rate turbo coding and joint detection over a COST 207seven-path Bad Urban channel [394]. For a spreading factor of 16, the post-de-spreadingSINR required to give a BER of1 × 10−3 was 8.0 dB, for a BER of5 × 10−3 it was 7.0 dB,and for a BER of1 × 10−2 was about 6.6 dB. These values can be seen along with the othersystem parameters in Table 5.2. The-pre de-spreading SINR is related toEb/No and to thespreading factor by :
SINR = (Eb/No)/SF, (5.7)
where the spreading factorSF = W/R, with W being the chip rate andR the data rate.A receiver noise figure of 7 dB was assumed for both the mobile and the base stations [59].Thus, in conjunction with a thermal noise density of -174 dBm/Hz and a noise bandwidth of3.84 MHz, this resulted in a receiver noise power of -100 dBm.The power control algorithmused was relatively simple, and unrelated to the previouslyintroduced schemes of Section5.3.3. Furthermore, since it allowed a full transmission power change of 15 dB within a 15-slot UTRA data frame, the power control scheme advocated is unlikely to limit the network’scapacity.
Specifically, for each of the 15 timeslots per transmitted frame, both the mobile and basestation transmit powers were adjusted such that the received SINR was greater than the tar-get SINR, but less than the target SINR plus 1 dB of hysteresis. When in soft handover, amobile’s transmission power was only increased if all of thebase stations in the Active Basestation Set (ABS) requested a power increase, but was it decreased if any of the base stationsin the ABS had an excessive received SINR. In the downlink, ifthe received SINR at the mo-bile was insufficiently high then all of the active base stations were commanded to increasetheir transmission powers. Similarly, if the received SINRwas unnecessarily high, then theactive base stations would reduce their transmit powers. The downlink intra-cell interferenceorthogonality factor,α, as described in Section 5.3.5, was set to 0.5 [395–397]. Dueto thefrequency reuse factor of one, with its associated low frequency reuse distance, it was nec-essary for both the mobiles and the base stations, when initiating a new call or entering softhandover, to increase their transmitted power gradually. This was required to prevent sud-den increases in the level of interference, particularly onlinks using the same base station.Hence, by gradually increasing the transmit power to the desired level, the other users ofthe network were capable of compensating for the increased interference by increasing theirtransmit powers, without encountering undesirable outages. In an FDMA/TDMA networkthis effect is less noticeable due to the significantly higher frequency reuse distance.
Since a dropped call is less desirable from a user’s viewpoint than a blocked call, tworesource allocation queues were invoked, one for new calls and the other - higher prior-ity - queue, for handovers. By forming a queue of the handoverrequests, which have ahigher priority during contention for network resources than new calls, it is possible to re-duce the number of dropped calls at the expense of an increased blocked call probability. Afurther advantage of the Handover Queueing System (HQS) is that during the time a han-dover is in the queue, previously allocated resources may become available, hence increasingthe probability of a successful handover. However, in a CDMAbased network the capac-ity is not hard-limited by the number of frequency/timeslotcombinations available, like in

312 CHAPTER 5. HSDPA-STYLE FDD NETWORKING, ADAPTIVE ARRAYS AND AQA M
Parameter Value Parameter ValueFrame length 10 ms Timeslots per frame 15TargetEb/No 8.0 dB OutageEb/No 6.6 dBLow Quality (LQ) OutageEb/No 7.0 dB BS Pilot Power -5 dBmBS/MS Minimum TX Power -44 dBm BS Antenna Gain 11 dBiBS/MS Maximum TX Power +21 dBm MS Antenna Gain 0 dBiAttenuation at 1 m reference point 39 dB Pathloss exponent -3.5Power control SINR hysteresis 1 dB Cell radius 150 mDownlink scrambling codes per BS 1 Modulation scheme 4-QAMDownlink OVSF codes per BS Variable Max new-call queue-time 5 sUplink scrambling codes per BS Variable Average inter-call time 300 sUplink OVSF codes per BS Variable Average call length 60 sSpreading factor Variable Data/voice bit rate VariableRemove BS from ABS threshold Variable Add BS to ABS threshold VariableUser speed 1.34 m/s Noisefloor -100 dBm
(3 mph) Size of ABS 2
Table 5.2: Simulation parameters of the UTRA-type CDMA based cellular network.
an FDMA/TDMA based network, such as GSM. The main limiting factors are the numberof available spreading and OVSF codes, where the number of the available OVSF codes isrestricted to the spreading factor minus one, since an OVSF code is reserved for the pilotchannel. This is because, although the pilot channel has a spreading factor of 256, it removesan entire branch of the OVSF code generation tree. Other limiting factors are the interferencelevels in conjunction with the restricted maximum transmitpower, resulting in excessive calldropping rates. New call allocation requests were queued for up to 5 s, if they could not beimmediately satisfied, and were blocked if the request had not been completed successfullywithin the 5 s.
Similarly to our TDMA-based investigations portrayed in Chapter 4, several networkperformance metrics were used in order to quantify the quality of service provided by thecellular network, namely the:
• New Call Blocking probability,PB ,
• Call Dropping or Forced Termination probability,PFT ,
• Probability of low quality connection,Plow,
• Probability of Outage,Pout,
• Grade Of Service,GOS.
The new call blocking probability,PB , is defined as the probability that a new call isdenied access to the network. In an FDMA/TDMA based network,such as GSM, this mayoccur because there are no available physical channels at the desired base station or the avail-able channels are subject to excessive interference. However, in a CDMA based network thisdoes not occur, provided that no interference level based admission control is performed andhence the new call blocking probability is typically low.
The call dropping probability,PFT , is the probability that a call is forced to terminateprematurely. In a GSM type network, an insufficiently high SINR, which inevitably leads
5.4. SIMULATION RESULTS 313
to dropped calls, may be remedied by an intra- or inter-cell handover. However, in CDMAeither the transmit power must be increased, or a soft handover must be performed in orderto exploit the available diversity gain.
Again, the probability of a low quality connection is definedas:
Plow = P{SINRuplink < SINRreq or SINRdownlink < SINRreq} (5.8)
= P{min(SINRuplink, SINRdownlink) < SINRreq}.
The GOS was defined in [317] as:
GOS = P{unsuccessful or low-quality call access} (5.9)
= P{call is blocked} + P{call is admitted} ×
P{low signal quality and call is admitted}
= PB + (1 − PB)Plow,
and is interpreted as the probability of unsuccessful network access (blocking), or low qualityaccess, when a call is admitted to the system.
In our forthcoming investigations, in order to compare the network capacities of differentnetworks, similarly to our TDMA-based investigations in Chapter 4, it was decided to usetwo scenarios defined as :
• A conservative scenario, where the maximum acceptable value for the new call block-ing probability,PB , is 3%, the maximum call dropping probability,PFT , is 1%, andPlow is 1%.
• A lenient scenario, where the maximum acceptable value for the new call blockingprobability,PB , is 5%, the maximum call dropping probability,PFT , is 1%, andPlow
is 2%.
In the next section we consider the network’s performance considering both fixed and nor-malised soft handover thresholds using both received pilotpower and received pilot powerversus interference threshold metrics. A spreading factorof 16 was used, corresponding to achannel data rate of 3.84 Mbps/16 = 240 kbps with no channel coding, or 120 kbps when us-ing 1/2 rate channel coding. It must be noted at this stage that the results presented in the fol-lowing sections are network capacities obtained using a spreading factor of 16. The networkcapacity results presented in the previous chapter, which were obtained for an FDMA/TDMAGSM-like system, were achieved for speech-rate users. Herewe assumed that the channelcoded speech-rate was 15 kbps, which is the lowest possible Dedicated Physical Data CHan-nel (DPDCH) rate. Speech users having a channel coded rate of15 kbps may be supportedby invoking a spreading factor of 256. Hence, subjecting thechannel data rate of 15 kbps to1/2 rate channel coding gives a speech-rate of 7.5 kbps, or if protected by a2/3 rate codethe speech-rate becomes 10 kbps, which are sufficiently highfor employing the so-calledAdvanced MultiRate (AMR) speech codec [398–400] capable ofoperating at rates between4.7 kbps and 12.2 kbps. Therefore, by multiplying the resultant network capacities accordingto a factor of 256/16=16, it is possible to estimate the number of speech users supported bya speech-rate network. However, with the aid of our exploratory simulations, conducted us-ing a spreading factor of 256, which are not presented here, we achieved network capacities
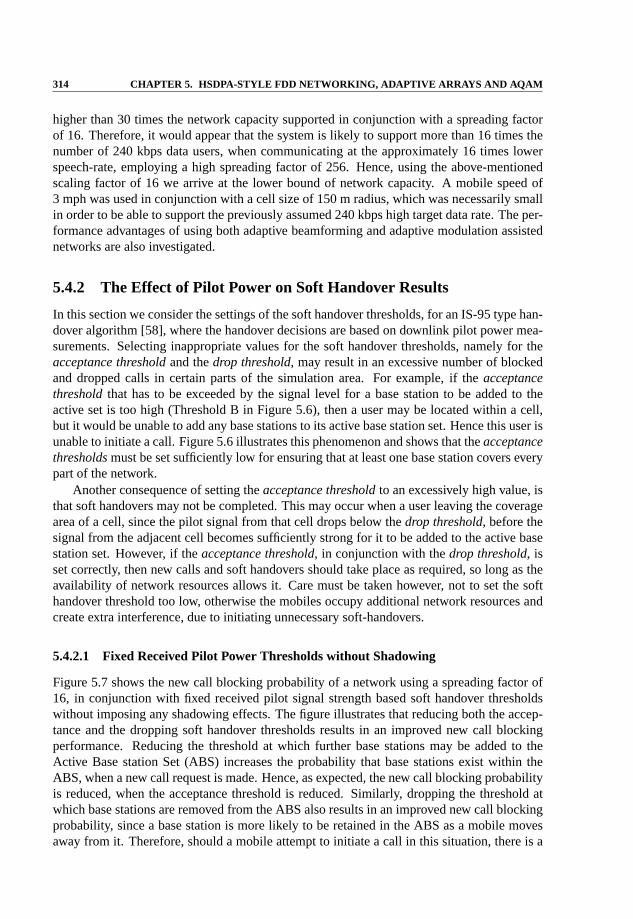
314 CHAPTER 5. HSDPA-STYLE FDD NETWORKING, ADAPTIVE ARRAYS AND AQA M
higher than 30 times the network capacity supported in conjunction with a spreading factorof 16. Therefore, it would appear that the system is likely tosupport more than 16 times thenumber of 240 kbps data users, when communicating at the approximately 16 times lowerspeech-rate, employing a high spreading factor of 256. Hence, using the above-mentionedscaling factor of 16 we arrive at the lower bound of network capacity. A mobile speed of3 mph was used in conjunction with a cell size of 150 m radius, which was necessarily smallin order to be able to support the previously assumed 240 kbpshigh target data rate. The per-formance advantages of using both adaptive beamforming andadaptive modulation assistednetworks are also investigated.
5.4.2 The Effect of Pilot Power on Soft Handover Results
In this section we consider the settings of the soft handoverthresholds, for an IS-95 type han-dover algorithm [58], where the handover decisions are based on downlink pilot power mea-surements. Selecting inappropriate values for the soft handover thresholds, namely for theacceptance thresholdand thedrop threshold, may result in an excessive number of blockedand dropped calls in certain parts of the simulation area. For example, if theacceptancethresholdthat has to be exceeded by the signal level for a base station to be added to theactive set is too high (Threshold B in Figure 5.6), then a usermay be located within a cell,but it would be unable to add any base stations to its active base station set. Hence this user isunable to initiate a call. Figure 5.6 illustrates this phenomenon and shows that theacceptancethresholdsmust be set sufficiently low for ensuring that at least one base station covers everypart of the network.
Another consequence of setting theacceptance thresholdto an excessively high value, isthat soft handovers may not be completed. This may occur whena user leaving the coveragearea of a cell, since the pilot signal from that cell drops below thedrop threshold, before thesignal from the adjacent cell becomes sufficiently strong for it to be added to the active basestation set. However, if theacceptance threshold, in conjunction with thedrop threshold, isset correctly, then new calls and soft handovers should takeplace as required, so long as theavailability of network resources allows it. Care must be taken however, not to set the softhandover threshold too low, otherwise the mobiles occupy additional network resources andcreate extra interference, due to initiating unnecessary soft-handovers.
5.4.2.1 Fixed Received Pilot Power Thresholds without Shadowing
Figure 5.7 shows the new call blocking probability of a network using a spreading factor of16, in conjunction with fixed received pilot signal strengthbased soft handover thresholdswithout imposing any shadowing effects. The figure illustrates that reducing both the accep-tance and the dropping soft handover thresholds results in an improved new call blockingperformance. Reducing the threshold at which further base stations may be added to theActive Base station Set (ABS) increases the probability that base stations exist within theABS, when a new call request is made. Hence, as expected, the new call blocking probabilityis reduced, when the acceptance threshold is reduced. Similarly, dropping the threshold atwhich base stations are removed from the ABS also results in an improved new call blockingprobability, since a base station is more likely to be retained in the ABS as a mobile movesaway from it. Therefore, should a mobile attempt to initiatea call in this situation, there is a

5.4. SIMULATION RESULTS 315
New call ‘dead zone’
Threshold CThreshold B
Threshold A
Handover ‘dead zone’
Figure 5.6: This figure indicates that using inappropriate soft handover thresholdsmay lead to blockedand dropped calls due to insufficient pilot coverage of the simulation area. Threshold Ais the drop threshold, which when combined with the acceptance threshold Ccan fail tocover the simulation area sufficiently well, thus leading to soft handover failure. Whencombining threshold A with the acceptance threshold B, users located in the ‘new call deadzone’ may become unable to initiate calls.

316 CHAPTER 5. HSDPA-STYLE FDD NETWORKING, ADAPTIVE ARRAYS AND AQA M
0.8 0.9 1.0 1.1 1.2 1.3 1.4 1.5 1.6 1.7 1.8
Mean Carried Teletraffic (Erlangs/km2/MHz)
10-3
2
5
10-2
2
5
New
Cal
lBlo
ckin
gP
roba
bilit
y,P B
3%
5%
-113, -115-112, -114-112, -113-111, -114-111, -113-111, -112Tacc(dBm), Tdrop (dBm)
Figure 5.7: New call blocking probability versus mean carried traffic of a CDMA based cellular net-work usingfixed received pilot powerbased soft handover thresholdswithout shadowingfor SF=16.
greater chance that the ABS will contain a suitable base station.The associated call dropping probability is depicted in Figure 5.8, indicating that reducing
the soft handover thresholds, and thus increasing the time spent in soft handover, improvedthe performance up to a certain point. However, above this point the additional interferenceinflicted by the soft handover process led to a degraded performance. For example, in this fig-ure the performance associated withTacc = −111 dBm improved, whenTdrop was decreasedfrom -112 dBm to -113 dBm. However, at high traffic levels the performance degraded whenTdrop was decreased further, to -114 dBm. The call dropping probability obtained usingTacc=-113 dBm andTdrop=-115 dBm was markedly lower for the lesser levels of traffic car-ried due to the extra diversity gain provided by the soft handover process. However, sincethese soft handover thresholds resulted in a greater proportion of time spent in soft handover,the levels of interference were increased, and thus at the higher traffic levels the performancedegraded rapidly, as can be seen in Figure 5.8. Hence, the call dropping performance isbased on a trade-off between the diversity gain provided by the soft handover process and theassociated additional interference.
The probability of low quality access (not explicitly shown) was similar in terms of itscharacter to the call dropping probability, since reducingTdrop improved the performance toa certain point, after which it degraded.
The mean number of base stations in the ABS is shown in Figure 5.9, illustrating thatreducing the soft handover thresholds leads, on average, toa higher number of base stationsin the ABS. Therefore, a greater proportion of call time is spent in soft handover. The asso-ciated diversity gain improves the link quality of the reference user but additional co-channelinterference is generated by the diversity links, thus ultimately reducing the call quality, as

5.4. SIMULATION RESULTS 317
0.8 0.9 1.0 1.1 1.2 1.3 1.4 1.5 1.6 1.7 1.8
Mean Carried Teletraffic (Erlangs/km2/MHz)
10-3
2
5
10-2
2
Cal
lDro
ppin
gP
roba
bilit
y,P FT
1%
-113, -115-112, -114-112, -113-111, -114-111, -113-111, -112Tacc(dBm), Tdrop (dBm)
Figure 5.8: Call dropping probability versus mean carried traffic of a CDMA based cellular networkusingfixed received pilot powerbased soft handover thresholdswithout shadowing forSF=16.
shown in Figure 5.8. Additionally, this extra co-channel interference required more transmis-sion power for maintaining the target SINR as depicted in Figure 5.10. This figure shows thatwhen lower soft handover thresholds are used, and thus a greater proportion of time is spentin soft handover, greater levels of co-channel interference are present, and thus the requiredmean transmission powers became higher. It is interesting to note that for the highest softhandover thresholds employed in Figure 5.10, the downlink transmission power required formaintaining the target SINR is lower than the uplink transmission power, whereas for thelower soft handover thresholds, the required mean uplink transmission power is lower thanthe downlink transmission power. The required downlink transmission power was, in gen-eral, lower than the uplink transmission power due to the mobile stations’ ability to performmaximal ratio combining when in soft handover. This was observed despite the absence ofthe pilot interference in the uplink, and despite the base stations’ ability to perform selec-tive diversity which offers less diversity gain when compared to maximal ratio combining.However, reducing the soft handover thresholds to the lowest levels shown in Figure 5.10,led to increased co-channel interference on the downlink, thus requiring higher base stationtransmission powers, as clearly seen in the figure.
In summary, as seen by comparing Figures 5.7-5.10 the maximum capacity of the net-work using fixed received pilot power based soft handover thresholds was limited by the calldropping probability. The new call blocking probability remained below the 3% limit, thanksto the appropriate choice of thresholds used, whilst the probability of low quality access wasconstantly below the 1% mark. Therefore, the maximum normalised teletraffic load was1.64 Erlangs/km2/MHz, corresponding to a total network capacity of 290 users, while satis-fying both quality of service constraints, was achieved with the aid of an acceptance threshold

318 CHAPTER 5. HSDPA-STYLE FDD NETWORKING, ADAPTIVE ARRAYS AND AQA M
0.8 0.9 1.0 1.1 1.2 1.3 1.4 1.5 1.6 1.7 1.8
Mean Carried Teletraffic (Erlangs/km2/MHz)
1.0
1.1
1.2
1.3
1.4
1.5
1.6
1.7
1.8
1.9
2.0N
umbe
rof
BS
inth
eA
BS
-113, -115-112, -114-112, -113-111, -114-111, -113-111, -112Tacc(dBm), Tdrop (dBm)
Figure 5.9: Mean number of base stations in the active base station set versus mean carried traffic ofa CDMA based cellular network usingfixed received pilot powerbased soft handoverthresholdswithout shadowing for SF=16.
0.8 0.9 1.0 1.1 1.2 1.3 1.4 1.5 1.6 1.7 1.8
Mean Carried Teletraffic (Erlangs/km2/MHz)
-1
0
1
2
3
4
5
6
7
8
9
Mea
nT
rans
mis
sion
Pow
er(d
Bm
)
Filled = BS, Blank = MS-113, -115-111, -114-111, -113-111, -112Tacc(dBm), Tdrop (dBm)
Figure 5.10: Mean transmission power versus mean carried traffic of a CDMA basedcellular networkusingfixed received pilot powerbased soft handover thresholdswithout shadowing forSF=16.

5.4. SIMULATION RESULTS 319
0.0 0.1 0.2 0.3 0.4 0.5 0.6 0.7 0.8 0.9
Mean Carried Teletraffic (Erlangs/km2/MHz)
10-3
2
5
10-2
2
5
10-1
2
5
Cal
lDro
ppin
gP
roba
bilit
y,P FT
1%
-113, -115-112, -114-111, -114-111, -113-111, -112Tacc(dBm), Tdrop (dBm)
Figure 5.11: Call dropping probability versus mean carried traffic of a CDMA based cellular networkusing fixed received pilot power based soft handover thresholds in conjunctionwith0.5 Hz shadowing having a standard deviation of 3 dBfor SF=16.
of -112 dBm and a dropping threshold of -114 dBm. A mean ABS size of 1.7 base stationswas registered at this traffic level, and both the mobile and base stations exhibited a meantransmission power of 5.1 dBm.
5.4.2.2 Fixed Received Pilot Power Thresholds with 0.5 Hz Shadowing
In this section we examine the achievable performance, uponusing fixed received pilot powerbased soft handover thresholds when subjected to log-normal shadow fading having a stan-dard deviation of 3 dB and a maximum frequency of 0.5 Hz.
The call dropping results of Figure 5.11 suggested that the network’s performance waspoor when using fixed received pilot power soft handover thresholds in the above mentionedshadow fading environment. The root cause of the problem is that the fixed thresholds mustbe set such that the received pilot signals, even when subjected to shadow fading, are retainedin the active set. Therefore, setting the thresholds too high results in the base stations beingremoved from the active set, thus leading to an excessive number of dropped calls. However,if the thresholds are set too low, in order to counteract thisphenomenon, then the base stationscan be in soft handover for too high a proportion of time, and thus an unacceptable level oflow quality accesses is generated due to the additional co-channel interference inflicted bythe high number of active base stations. Figure 5.11 shows that reducing the soft handoverthresholds improved the network’s call dropping probability, but Figure 5.12 illustrates thatreducing the soft handover thresholds engendered an increase in the probability of a lowquality access.
The network cannot satisfy the quality requirements of the conservative scenario, namely
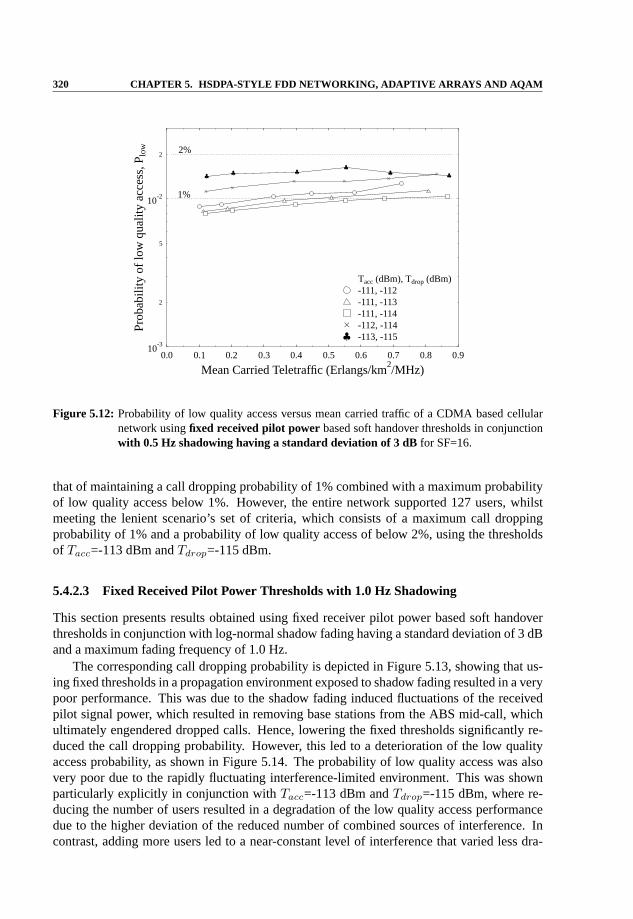
320 CHAPTER 5. HSDPA-STYLE FDD NETWORKING, ADAPTIVE ARRAYS AND AQA M
0.0 0.1 0.2 0.3 0.4 0.5 0.6 0.7 0.8 0.9
Mean Carried Teletraffic (Erlangs/km2/MHz)
10-3
2
5
10-2
2
Pro
babi
lity
oflo
wqu
ality
acce
ss,P lo
w
1%
2%
-113, -115-112, -114-111, -114-111, -113-111, -112Tacc(dBm), Tdrop (dBm)
Figure 5.12: Probability of low quality access versus mean carried traffic of a CDMA based cellularnetwork usingfixed received pilot powerbased soft handover thresholds in conjunctionwith 0.5 Hz shadowing having a standard deviation of 3 dBfor SF=16.
that of maintaining a call dropping probability of 1% combined with a maximum probabilityof low quality access below 1%. However, the entire network supported 127 users, whilstmeeting the lenient scenario’s set of criteria, which consists of a maximum call droppingprobability of 1% and a probability of low quality access of below 2%, using the thresholdsof Tacc=-113 dBm andTdrop=-115 dBm.
5.4.2.3 Fixed Received Pilot Power Thresholds with 1.0 Hz Shadowing
This section presents results obtained using fixed receiverpilot power based soft handoverthresholds in conjunction with log-normal shadow fading having a standard deviation of 3 dBand a maximum fading frequency of 1.0 Hz.
The corresponding call dropping probability is depicted inFigure 5.13, showing that us-ing fixed thresholds in a propagation environment exposed toshadow fading resulted in a verypoor performance. This was due to the shadow fading induced fluctuations of the receivedpilot signal power, which resulted in removing base stations from the ABS mid-call, whichultimately engendered dropped calls. Hence, lowering the fixed thresholds significantly re-duced the call dropping probability. However, this led to a deterioration of the low qualityaccess probability, as shown in Figure 5.14. The probability of low quality access was alsovery poor due to the rapidly fluctuating interference-limited environment. This was shownparticularly explicitly in conjunction withTacc=-113 dBm andTdrop=-115 dBm, where re-ducing the number of users resulted in a degradation of the low quality access performancedue to the higher deviation of the reduced number of combinedsources of interference. Incontrast, adding more users led to a near-constant level of interference that varied less dra-

5.4. SIMULATION RESULTS 321
0.0 0.1 0.2 0.3 0.4 0.5 0.6 0.7 0.8 0.9
Mean Carried Teletraffic (Erlangs/km2/MHz)
10-3
2
5
10-2
2
5
10-1
2
5
Cal
lDro
ppin
gP
roba
bilit
y,P FT
1%
-113, -115-112, -114-112, -113-111, -114-111, -113-111, -112Tacc(dBm), Tdrop (dBm)
Figure 5.13: Call dropping probability versus mean carried traffic of a CDMA based cellular networkusingfixed received pilot powerbased soft handover thresholds in conjunctionwith 1 Hzshadowing having a standard deviation of 3 dBfor SF=16.
matically.It was found that the network was unable to support any users at the required service
quality, since using the thresholds that allowed the maximum 1% call dropping probabilityrestriction to be met, led to a greater than 2% probability ofa low quality outage occurring.
5.4.2.4 Summary
In summary of our findings in the context of Figure 5.7-5.14, adisadvantage of using fixedsoft handover thresholds is that in some locations all pilotsignals may be weak, whereas inother locations, all of the pilot signals may be strong due tothe localised propagation envi-ronment or terrain. Hence, using relative or normalised soft handover thresholds is expectedto be advantageous in terms of overcoming this limitation. An additional benefit of using dy-namic thresholds is confirmed within a fading environment, where the received pilot powermay drop momentarily below a fixed threshold, thus causing unnecessary removals and ad-ditions to/from the ABS. However, these base stations may have been the only base stationsin the ABS, thus ultimately resulting in a dropped call. When using dynamically controlledthresholds this scenario would not have occurred. Hence, inthe next section we consideredthe performance of using relative received pilot power based soft handover thresholds underboth non-shadowing and shadowing impaired propagation conditions.
To summarise, using fixed received pilot power thresholds ina non-shadowing environ-ment resulted in a total network capacity of 290 users for both quality of service scenarios,namely for both the conservative and lenient scenarios considered. However, this perfor-mance was severely degraded in a shadow fading impaired propagation environment, where

322 CHAPTER 5. HSDPA-STYLE FDD NETWORKING, ADAPTIVE ARRAYS AND AQA M
0.0 0.1 0.2 0.3 0.4 0.5 0.6 0.7 0.8 0.9
Mean Carried Teletraffic (Erlangs/km2/MHz)
10-3
2
5
10-2
2
Pro
babi
lity
oflo
wqu
ality
acce
ss,P lo
w
1%
2%
-113, -115-112, -114-112, -113-111, -114-111, -113-111, -112Tacc(dBm), Tdrop (dBm)
Figure 5.14: Probability of low quality access versus mean carried traffic of a CDMA based cellularnetwork usingfixed received pilot powerbased soft handover thresholds in conjunctionwith 1 Hz shadowing having a standard deviation of 3 dBfor SF=16.
a total network capacity of 127 users was supported in conjunction with a maximum shadowfading frequency of 0.5 Hz. Unfortunately, the network capacity could not be evaluated whenusing a maximum shadow fading frequency of 1.0 Hz due to the contrasting characteristicsof the dropped call and low quality access probability results.
5.4.2.5 Relative Received Pilot Power Thresholds without Shadowing
Employing relative received pilot power thresholds is important in realistic propagation en-vironments exposed to shadow fading. More explicitly, in contrast to the previously usedthresholds, which were expressed in terms of dBm, i.e. with respect to 1 mW, in this sec-tion the thresholdsTacc andTdrop are expressed in terms of dB relative to the received pilotstrength of the base stations in the ABS. Their employment also caters for situations, wherethe absolute pilot power may be too low for use in conjunctionwith fixed thresholds, butnonetheless sufficiently high for reliable communications. Hence, in this section we examinethe performance of relative received pilot power based softhandover thresholds in a non-shadow faded environment.
The call dropping performance is depicted in Figure 5.15, which shows that reducingthe soft handover thresholds, and thus increasing the time spent in soft handover, improvedthe call dropping performance. It was also found in the casesconsidered here, that simul-taneously the probability of a low quality access decreased, as illustrated by Figure 5.16.However, it was also evident in both figures, that reducing the soft handover thresholds past acertain point resulted in degraded performance due to the extra interference incurred duringthe soft handover process.

5.4. SIMULATION RESULTS 323
0.8 0.9 1.0 1.1 1.2 1.3 1.4 1.5 1.6 1.7 1.8
Mean Carried Teletraffic (Erlangs/km2/MHz)
10-3
2
5
10-2
2
Cal
lDro
ppin
gP
roba
bilit
y,P FT
1%-14, -18-12, -18-10, -18-10, -12Tacc(dB), Tdrop (dB)
Figure 5.15: Call dropping probability versus mean carried traffic of a CDMA based cellular networkusingrelative received pilot powerbased soft handover thresholdswithout shadowingfor SF=16.
1.1 1.2 1.3 1.4 1.5 1.6 1.7 1.8
Mean Carried Teletraffic (Erlangs/km2/MHz)
10-3
2
5
10-2
2
Pro
babi
lity
oflo
wqu
ality
acce
ss,P lo
w
1%
2%
-12, -18-12, -14-10, -18-10, -12Tacc(dB), Tdrop (dB)
Figure 5.16: Probability of low quality access versus mean carried traffic of a CDMA based cellu-lar network usingrelative received pilot powerbased soft handover thresholdswithoutshadowingfor SF=16.

324 CHAPTER 5. HSDPA-STYLE FDD NETWORKING, ADAPTIVE ARRAYS AND AQA M
0.3 0.4 0.5 0.6 0.7 0.8 0.9
Mean Carried Teletraffic (Erlangs/km2/MHz)
10-3
2
5
10-2
2
Cal
lDro
ppin
gP
roba
bilit
y,P FT
1%-16, -18-15, -18-14, -18-12, -14-10, -12Tacc(dB), Tdrop (dB)
Figure 5.17: Call dropping probability versus mean carried traffic of a CDMA based cellular networkusingrelative received pilot powerbased soft handover thresholds in conjunctionwith0.5 Hz shadowing and a standard deviation of 3 dBfor SF=16.
Since the probability of low quality access was under the 1% threshold, the networkcapacity for both the lenient and conservative scenarios were the same, namely 1.65 Erlangs/ km2 / MHz or a total of 288 users over the entire simulation area of2.86 km2. The meanABS size was 1.7 base stations, with a mean mobile transmission power of 4.1 dBm and anaverage base station transmit power of 4.7 dBm.
5.4.2.6 Relative Received Pilot Power Thresholds with 0.5 Hz Shadowing
In this section we present results obtained using relative received pilot power based soft han-dover thresholds in a shadowing-impaired propagation environment. The maximum shadowfading frequency was 0.5 Hz and the standard deviation of thelog-normal shadowing was3 dB.
Figure 5.17 depicts the call dropping probability for several relative thresholds and showsthat by reducing both the thresholds, the call dropping performance is improved. This enablesthe mobile to add base stations to its ABS earlier on during the soft handover process, andto relinquish them at a much later stage than in the case of using higher handover thresholds.Therefore, using lower relative soft handover thresholds results in a longer period of timespent in soft handover, as can be seen in Figure 5.18, which shows the mean number of basestations in the ABS.
The probability of low quality access is shown in Figure 5.19, illustrating that, in general,as the relative soft handover thresholds were reduced, the probability of low quality accessincreased. This demonstrated that spending more time in soft handover generated more co-channel interference and thus degraded the network’s performance. However, the difference

5.4. SIMULATION RESULTS 325
0.3 0.4 0.5 0.6 0.7 0.8 0.9
Mean Carried Teletraffic (Erlangs/km2/MHz)
1.0
1.1
1.2
1.3
1.4
1.5
1.6
1.7
1.8
1.9
2.0
Num
ber
ofB
Sin
the
AB
S
-16, -18-15, -18-14, -18-12, -14-10, -12Tacc(dB), Tdrop (dB)
Figure 5.18: Mean number of base stations in the active base station set versus mean carried traffic ofa CDMA based cellular network usingrelative received pilot powerbased soft handoverthresholds in conjunctionwith 0.5 Hz shadowing and a standard deviation of 3 dBforSF=16.
between the two thresholds must also be considered. For example, the probability of lowquality access is higher in conjunction withTacc = −16 dB andTdrop=-18 dB, than usingTacc=-16 dB andTdrop=-20 dB, since the latter scenario has a higher mean number ofbasestations in its ABS. Therefore, there is a point at which the soft handover gain experiencedby the desired user outweighs the detrimental effects of theextra interference generated bybase stations’ transmissions to users engaged in the soft handover process.
Figure 5.20 shows the mean transmission powers of both the mobiles and the base sta-tions. The mobiles are required to transmit at a lower power than the base stations, becausethe base stations are not subjected to downlink pilot power interference and to soft handoverinterference. Furthermore, the mobiles are not affected bythe level of the soft handoverthresholds, because only selective diversity is performedin the uplink, and hence the mo-bile transmits as if not in soft handover. As the soft handover thresholds were reduced, thetime spent in soft handover increased and thus the mean base transmission power had to beincreased in order to overcome the additional downlink interference.
The maximum network capacity of 0.835 Erlangs/km2/MHz, or 144 users over the entiresimulation area, was achieved using the soft handover thresholds ofTacc=-14 dB andTdrop=-18 dB for the conservative scenario. The mean ABS size was 1.77 base stations, while themean mobile transmit power was -1.5 dBm and 0.6 dBm for the base stations. In the lenientscenario a maximum teletraffic load of 0.865 Erlangs / km2 / MHz, corresponding to a totalnetwork capacity of 146 users was maintained using soft handover thresholds ofTacc=-16 dBandTdrop=-18 dB. The mean number of base stations in the ABS was 1.78, with an averagetransmit power of -1.5 dBm for the mobile handset, and 1.3 dBmfor the base station.

326 CHAPTER 5. HSDPA-STYLE FDD NETWORKING, ADAPTIVE ARRAYS AND AQA M
0.3 0.4 0.5 0.6 0.7 0.8 0.9
Mean Carried Teletraffic (Erlangs/km2/MHz)
10-3
2
5
10-2
2
Pro
babi
lity
oflo
wqu
ality
acce
ss,P lo
w
1%
2%
-16, -20-16, -18-15, -18-14, -18-12, -14-10, -12Tacc(dB), Tdrop (dB)
Figure 5.19: Probability of low quality access versus mean carried traffic of a CDMA based cellularnetwork usingrelative received pilot powerbased soft handover thresholds in conjunc-tion with 0.5 Hz shadowing and a standard deviation of 3 dBfor SF=16.
0.3 0.4 0.5 0.6 0.7 0.8 0.9
Mean Carried Teletraffic (Erlangs/km2/MHz)
-4
-3
-2
-1
0
1
2
3
Mea
nT
rans
mis
sion
Pow
er(d
Bm
)
-14, -18-14, -16-12, -14-10, -12Tacc(dB), Tdrop (dB)Filled = BS, Blank = MS
Figure 5.20: Mean transmission power versus mean carried traffic of a CDMA basedcellular networkusingrelative received pilot powerbased soft handover thresholds in conjunctionwith0.5 Hz shadowing and a standard deviation of 3 dBfor SF=16.

5.4. SIMULATION RESULTS 327
0.3 0.4 0.5 0.6 0.7 0.8 0.9
Mean Carried Teletraffic (Erlangs/km2/MHz)
10-3
2
5
10-2
2
Cal
lDro
ppin
gP
roba
bilit
y,P FT
1%
-18, -20-14, -18-14, -16-12, -14-2, -22-2, -20Tacc(dB), Tdrop (dB)
Figure 5.21: Call dropping probability versus mean carried traffic of a CDMA based cellular networkusingrelative received pilot powerbased soft handover thresholds in conjunctionwith1 Hz shadowing and a standard deviation of 3 dBfor SF=16.
5.4.2.7 Relative Received Pilot Power Thresholds with 1.0 Hz Shadowing
In this section we present further performance results obtained using relative received pilotpower based soft handover thresholds in a shadowing propagation environment. The max-imum shadow fading frequency was 1.0 Hz and the standard deviation of the log-normalshadowing was 3 dB.
On comparing the call dropping probability curves seen in Figure 5.21 with the call drop-ping probability obtained for a maximum shadow fading frequency of 0.5 Hz in Figure 5.17it was found that the performance of the 1.0 Hz frequency shadowing scenario was slightlyworse. However, the greatest performance difference was observed in the probability of lowquality access, as can be seen in Figure 5.22.
Using the soft handover thresholds which gave a good performance for a maximumshadow fading frequency of 0.5 Hz resulted in significantly poorer low quality access per-formance for a maximum shadowing frequency of 1.0 Hz. In order to obtain a probabilityof low quality access of below 1% it was necessary to use markedly different soft handoverthresholds, which reduced the time spent in soft handover and hence also the size of the ABS,as illustrated in Figure 5.23.
For the conservative scenario, where the maximum probability of low quality access,Plow, was set to 1%, the maximum network capacity was found to be 0.69 Erlangs/km2/MHz,equivalent to a total network capacity of 127 users, obtained usingTdrop=-2 dB andTacc=-16 dB. In contrast, in the lenient scenario, where thePlow limit was 2%, the maximumnumber of users supported was found to be 144, or 0.825 Erlangs/km2/MHz, in conjunctionwith Tacc=-14 dB andTdrop=-18 dB.
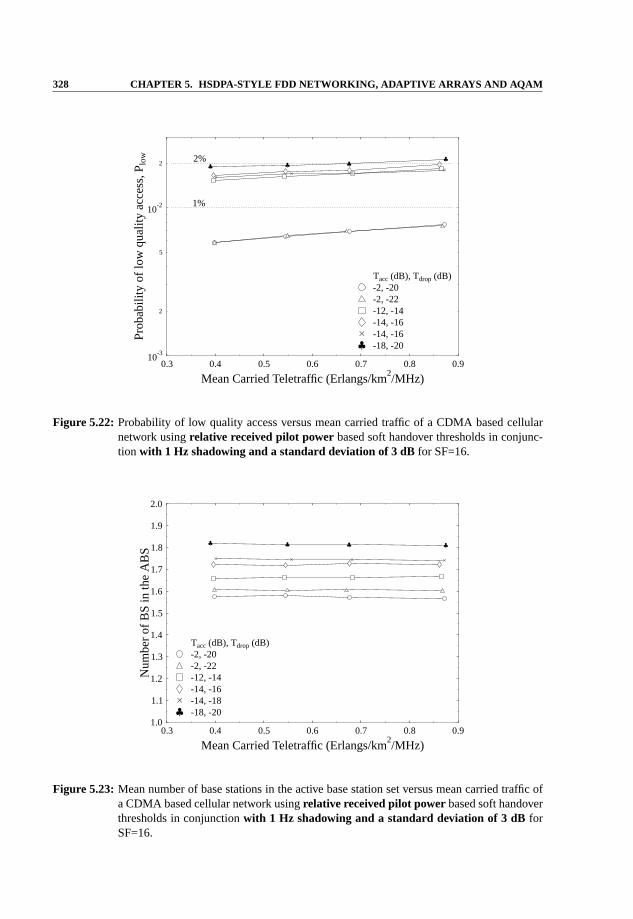
328 CHAPTER 5. HSDPA-STYLE FDD NETWORKING, ADAPTIVE ARRAYS AND AQA M
0.3 0.4 0.5 0.6 0.7 0.8 0.9
Mean Carried Teletraffic (Erlangs/km2/MHz)
10-3
2
5
10-2
2
Pro
babi
lity
oflo
wqu
ality
acce
ss,P lo
w
1%
2%
-18, -20-14, -16-14, -16-12, -14-2, -22-2, -20Tacc(dB), Tdrop (dB)
Figure 5.22: Probability of low quality access versus mean carried traffic of a CDMA based cellularnetwork usingrelative received pilot powerbased soft handover thresholds in conjunc-tion with 1 Hz shadowing and a standard deviation of 3 dBfor SF=16.
0.3 0.4 0.5 0.6 0.7 0.8 0.9
Mean Carried Teletraffic (Erlangs/km2/MHz)
1.0
1.1
1.2
1.3
1.4
1.5
1.6
1.7
1.8
1.9
2.0
Num
ber
ofB
Sin
the
AB
S
-18, -20-14, -18-14, -16-12, -14-2, -22-2, -20Tacc(dB), Tdrop (dB)
Figure 5.23: Mean number of base stations in the active base station set versus mean carried traffic ofa CDMA based cellular network usingrelative received pilot powerbased soft handoverthresholds in conjunctionwith 1 Hz shadowing and a standard deviation of 3 dBforSF=16.

5.4. SIMULATION RESULTS 329
5.4.2.8 Summary
In summary, using relative received pilot power as a soft handover metric has resulted in asignificantly improved performance in comparison to that ofthe fixed received pilot powerbased results in a shadow fading environment. In the non-shadowed environment the net-work capacity was approximately the same as when using the fixed threshold algorithm,albeit with a slightly improved mean transmission power. Due to the time varying nature ofthe received signals subjected to shadow fading, using relative thresholds has been found tobe more amenable to employment in a realistic propagation environment, than using fixedthresholds. In conclusion, without shadow fading the network supported a total of 288 users,whilst with a maximum shadow fading frequency of 0.5 Hz, approximately 145 users weresupported by the entire network, for both the conservative and lenient scenarios. However,different soft handover thresholds were required for each situation, for achieving these ca-pacities. At a maximum shadowing frequency of 1.0 Hz, a totalof 127 users were supportedin the conservative scenario, and 144 in the lenient scenario. However, again, different softhandover thresholds were required in each scenario in orderto maximise the network capac-ity.
5.4.3 Ec/Io Power Based Soft Handover Results
An alternative soft handover metric used to determine ‘cellownership’ is the pilot to down-link interference ratio of a cell, which was proposed for employment in the 3rd generationsystems [59]. The pilot to downlink interference ratio, orEc/Io, may be calculated thusas [401]:
Ec
Io
=Ppilot
Ppilot + N0 +∑Ncells
k=1PkTk
, (5.10)
wherePk is the total transmit power of cellk, Tk is the transmission gain, which includesthe antenna gain and pathloss as well as shadowing,N0 is the power spectral density of thethermal noise andNcells is the number of cells in the network. The advantage of using sucha scheme is that it is not an absolute measurement that is used, but the ratio of the pilot powerto the interference power. Thus, if fixed thresholds were used a form of admission controlmay be employed for new calls if the interference level became too high. A further advantageis that it takes into account the time-varying nature of the interference level in a shadowedenvironment.
5.4.3.1 FixedEc/Io Thresholds without Shadowing
The new call blocking probability obtained when using fixedEc/Io soft handover thresholdswithout any form of shadow fading is shown in Figure 5.24, which suggests that in general,lowering the soft handover thresholds reduced the probability of a new call attempt beingblocked. However, it was found that in conjunction withTdrop = −40 dB, dropping thethresholdTacc from -20 dB to -24 dB actually increased the new call blockingprobability.This was attributed to the fact that the lower threshold precipitated a higher level of co-channel interference, since there was a higher mean number of base stations in the ABS,as evidenced by Figure 5.25. Therefore, since the mean levelof interference present in thenetwork is higher, when using a lower threshold, and the threshold determines the value of

330 CHAPTER 5. HSDPA-STYLE FDD NETWORKING, ADAPTIVE ARRAYS AND AQA M
0.8 0.9 1.0 1.1 1.2 1.3 1.4 1.5 1.6 1.7 1.8
Mean Carried Teletraffic (Erlangs/km2/MHz)
10-3
2
5
10-2
2
5
10-1
New
Cal
lBlo
ckin
gP
roba
bilit
y,P B
3%
5%
-34, -44-32, -44-28, -42-24, -40-20, -40Tacc(dB), Tdrop (dB)
Figure 5.24: New call blocking probability versus mean carried traffic of a CDMA based cellular net-work usingfixed Ec/Io based soft handover thresholdswithout shadowing for SF=16.
the pilot to downlink interference ratio at which base stations may be added to the ABS, amore frequent blocking of calls occurs. Alternatively, a lower threshold resulted in a higherlevel of downlink interference due to the additional interference inflicted by supporting themobiles in soft handover, which prevented base stations from being included in the ABS dueto insufficient pilot to interference ‘head-room’. This then ultimately led to blocked calls dueto the lack of base stations in the ABS.
Again, the mean number of base stations in the ABS is given in Figure 5.25, whichillustrates that as expected, reducing the soft handover thresholds increased the proportion oftime spent in soft handover, and thus reduced the mean numberof base stations in the ABS.The average size of the ABS was found to decrease, as the network’s traffic load increased.This was a consequence of the increased interference levelsassociated with the higher trafficloads, which therefore effectively reduced the pilot to interference ratio at a given point, andhence base stations were less likely to be in soft handover and in the ABS.
Figure 5.26 depicts the mean transmission powers for both the uplink and the downlink,for a range of different soft handover thresholds. These results show similar trends to theresults presented in previous sections, with the required average downlink transmission powerincreasing, since a greater proportion of call time is spentin soft handover. Again, the meanuplink transmission power varied only slightly, since the selection diversity technique of thebase stations only marginally affected the received interference power at the base stations.
Figure 5.27 shows the call dropping performance, indicating that lowering the soft han-dover thresholds generally improved the call dropping performance. However, reducing thesoft handover thresholds too much resulted in a degradationof the call dropping probabilitydue to the increased levels of co-channel interference inherent when a higher proportion ofthe call time is spent in soft handover. This is explicitly illustrated by Figure 5.28, which

5.4. SIMULATION RESULTS 331
0.8 0.9 1.0 1.1 1.2 1.3 1.4 1.5 1.6 1.7 1.8
Mean Carried Teletraffic (Erlangs/km2/MHz)
1.0
1.1
1.2
1.3
1.4
1.5
1.6
1.7
1.8
1.9
2.0
Mea
nnu
mbe
rof
BS
inA
BS
-34, -44-32, -44-28, -42-24, -40-20, -40Tacc(dB), Tdrop (dB)
Figure 5.25: Mean number of base stations in the active base station set versus mean carried traffic of aCDMA based cellular network usingfixed Ec/Io based soft handover thresholdswithoutshadowingfor SF=16.
0.8 0.9 1.0 1.1 1.2 1.3 1.4 1.5 1.6 1.7 1.8
Mean Carried Teletraffic (Erlangs/km2/MHz)
-2
0
2
4
6
8
10
12
14
16
Mea
nT
rans
mis
sion
Pow
er(d
Bm
)
-32, -44-28, -42-24, -40-20, -40Tacc(dB), Tdrop (dB)Filled = BS, Blank = MS
Figure 5.26: Mean transmission power versus mean carried traffic of a CDMA basedcellular net-work usingfixed receivedEc/Io based soft handover thresholdswithout shadowingfor SF=16.

332 CHAPTER 5. HSDPA-STYLE FDD NETWORKING, ADAPTIVE ARRAYS AND AQA M
0.8 0.9 1.0 1.1 1.2 1.3 1.4 1.5 1.6 1.7 1.8
Mean Carried Teletraffic (Erlangs/km2/MHz)
10-3
2
5
10-2
2
For
ced
Term
inat
ion
Pro
babi
lity,
P FT
1%-34, -44-32, -44-28, -42-24, -40-20, -40Tacc(dB), Tdrop (dB)
Figure 5.27: Call dropping probability versus mean carried traffic of a CDMA based cellular net-work usingfixed receivedEc/Io based soft handover thresholdswithout shadowingfor SF=16.
indicates that reducing the soft handover thresholds caused a significant degradation in theprobability of low quality access. This was a consequence ofthe additional co-channel in-terference associated with the soft handover process. The figure also shows that there is apoint where the diversity gain of the mobiles obtained with the advent of the soft handoverprocedure outweighs the extra interference that it generates.
On the whole, the capacity of the network when using fixedEc/Io soft handover thresh-olds was lower than when using fixed received pilot power based soft handover thresholds.This can be attributed to the fact that theEc/Io thresholds are related to the interference levelof the network, which changes with the network load and propagation conditions. Henceusing a fixed threshold is sub-optimal. In the conservative scenario, the network capacitywas 1.275 Erlangs/km2/MHz, corresponding to a total network capacity of 223 users. In thelenient scenario, this increased to 1.305 Erlangs/km2/MHz, or 231 users. In contrast, whenusing fixed received pilot power thresholds the entire network supported 290 users.
5.4.3.2 FixedEc/Io Thresholds with 0.5 Hz Shadowing
In this section we consider fixed pilot to downlink interference ratio based soft handoverthresholds in a propagation environment exhibiting shadowfading in conjunction with a max-imum fading frequency of 0.5 Hz and a standard deviation of 3 dB.
Examining Figure 5.29, which shows the call dropping probability, we see, again, thatreducing the soft handover thresholds typically resulted in a lower probability of a droppedcall. However, since the handover thresholds are dependentupon the interference level, therewas some interaction between the handover thresholds and the call dropping rate. For exam-

5.4. SIMULATION RESULTS 333
0.8 0.9 1.0 1.1 1.2 1.3 1.4 1.5 1.6 1.7 1.8
Mean Carried Teletraffic (Erlangs/km2/MHz)
10-3
2
5
10-2
2
Pro
babi
lity
oflo
wqu
ality
acce
ss,P lo
w
1%
2%
-34, -44-32, -44-28, -42-24, -40-20, -40Tacc(dB), Tdrop (dB)
Figure 5.28: Probability of low quality access versus mean carried traffic of a CDMA based cellularnetwork usingfixed receivedEc/Io based soft handover thresholdswithout shadowingfor SF=16.
ple, it can be seen in the figure that whenTdrop = −40 dB, the call dropping probability fellasTacc was reduced from -20 dB to -24 dB. However, on loweringTacc further, to -26 dB,the call dropping rate at low traffic loads became markedly higher. A similar phenomenonwas observed in Figure 5.30, which shows the probability of low quality outage.
It is explicitly seen from Figures 5.29 and 5.30 that the performance of the fixedEc/Io
soft handover threshold based scheme clearly exceeded thatof the fixed received pilot powerthreshold based system in a shadow fading environment. The network supported a teletrafficload of 0.7 Erlangs/km2/MHz or a total of 129 users in the conservative scenario, which roseto 0.78 Erlangs/km2/MHz, or 140 users, in the lenient scenario. These network capacitieswere achieved with the aid of a mean number of active base stations in the ABS, which were1.88 and 1.91, respectively. In order to achieve the total network capacity of 129 users inthe conservative scenario, a mean mobile transmit power of -2.4 dBm was required, whilethe mean base station transmission power was 7 dBm. For the lenient scenario, these figureswere -2.4 dBm and 8.7 dBm, respectively.
5.4.3.3 FixedEc/Io Thresholds with 1.0 Hz Shadowing
Increasing the maximum shadow fading frequency from 0.5 Hz to 1.0 Hz resulted in anincreased call dropping probability and a greater probability of low quality access, for agiven level of carried teletraffic. This is clearly seen by comparing Figures 5.31 and 5.32 withFigures 5.29 and 5.30. Explicitly, Figure 5.31 and 5.32 showthat reducing the soft handoverthreshold,Tacc from -20 dB to -24 dB led to both an increased call dropping probability andan increased probability of low quality access. This can be attributed to the extra co-channel
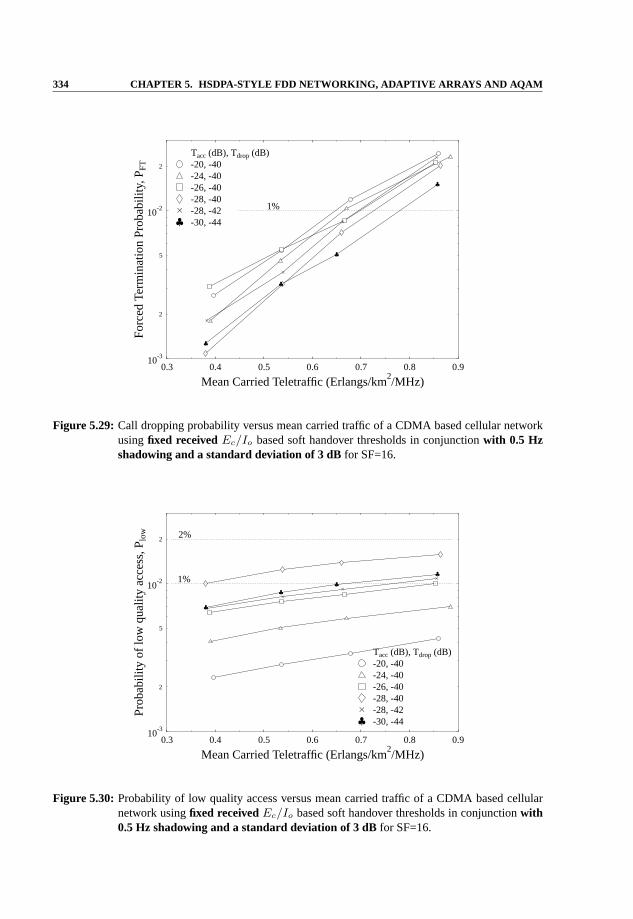
334 CHAPTER 5. HSDPA-STYLE FDD NETWORKING, ADAPTIVE ARRAYS AND AQA M
0.3 0.4 0.5 0.6 0.7 0.8 0.9
Mean Carried Teletraffic (Erlangs/km2/MHz)
10-3
2
5
10-2
2
For
ced
Term
inat
ion
Pro
babi
lity,
P FT
1%
-30, -44-28, -42-28, -40-26, -40-24, -40-20, -40Tacc(dB), Tdrop (dB)
Figure 5.29: Call dropping probability versus mean carried traffic of a CDMA based cellular networkusingfixed receivedEc/Io based soft handover thresholds in conjunctionwith 0.5 Hzshadowing and a standard deviation of 3 dBfor SF=16.
0.3 0.4 0.5 0.6 0.7 0.8 0.9
Mean Carried Teletraffic (Erlangs/km2/MHz)
10-3
2
5
10-2
2
Pro
babi
lity
oflo
wqu
ality
acce
ss,P lo
w
1%
2%
-30, -44-28, -42-28, -40-26, -40-24, -40-20, -40Tacc(dB), Tdrop (dB)
Figure 5.30: Probability of low quality access versus mean carried traffic of a CDMA based cellularnetwork usingfixed receivedEc/Io based soft handover thresholds in conjunctionwith0.5 Hz shadowing and a standard deviation of 3 dBfor SF=16.
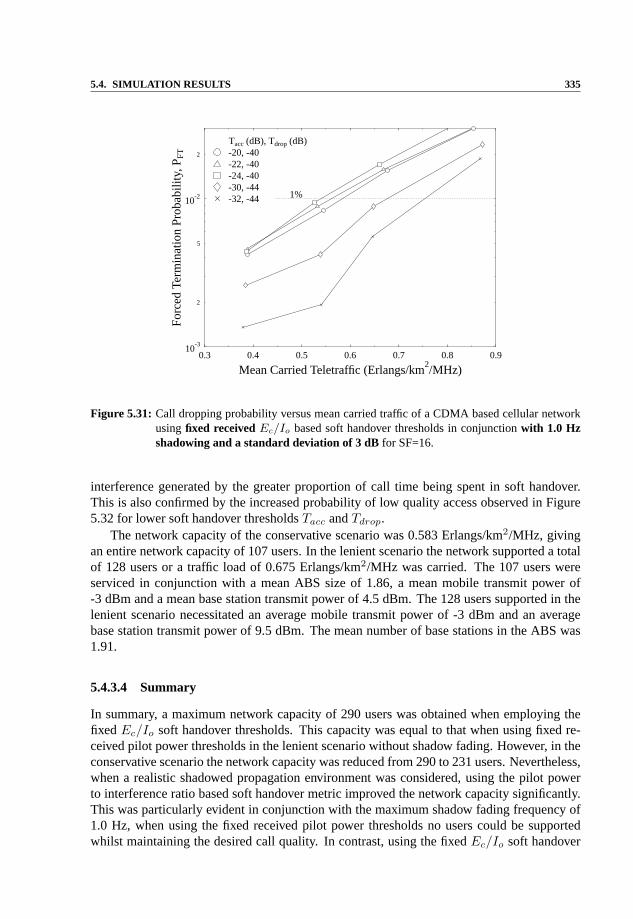
5.4. SIMULATION RESULTS 335
0.3 0.4 0.5 0.6 0.7 0.8 0.9
Mean Carried Teletraffic (Erlangs/km2/MHz)
10-3
2
5
10-2
2
For
ced
Term
inat
ion
Pro
babi
lity,
P FT1%-32, -44
-30, -44-24, -40-22, -40-20, -40Tacc(dB), Tdrop (dB)
Figure 5.31: Call dropping probability versus mean carried traffic of a CDMA based cellular networkusingfixed receivedEc/Io based soft handover thresholds in conjunctionwith 1.0 Hzshadowing and a standard deviation of 3 dBfor SF=16.
interference generated by the greater proportion of call time being spent in soft handover.This is also confirmed by the increased probability of low quality access observed in Figure5.32 for lower soft handover thresholdsTacc andTdrop.
The network capacity of the conservative scenario was 0.583Erlangs/km2/MHz, givingan entire network capacity of 107 users. In the lenient scenario the network supported a totalof 128 users or a traffic load of 0.675 Erlangs/km2/MHz was carried. The 107 users wereserviced in conjunction with a mean ABS size of 1.86, a mean mobile transmit power of-3 dBm and a mean base station transmit power of 4.5 dBm. The 128 users supported in thelenient scenario necessitated an average mobile transmit power of -3 dBm and an averagebase station transmit power of 9.5 dBm. The mean number of base stations in the ABS was1.91.
5.4.3.4 Summary
In summary, a maximum network capacity of 290 users was obtained when employing thefixed Ec/Io soft handover thresholds. This capacity was equal to that when using fixed re-ceived pilot power thresholds in the lenient scenario without shadow fading. However, in theconservative scenario the network capacity was reduced from 290 to 231 users. Nevertheless,when a realistic shadowed propagation environment was considered, using the pilot powerto interference ratio based soft handover metric improved the network capacity significantly.This was particularly evident in conjunction with the maximum shadow fading frequency of1.0 Hz, when using the fixed received pilot power thresholds no users could be supportedwhilst maintaining the desired call quality. In contrast, using the fixedEc/Io soft handover

336 CHAPTER 5. HSDPA-STYLE FDD NETWORKING, ADAPTIVE ARRAYS AND AQA M
0.3 0.4 0.5 0.6 0.7 0.8 0.9
Mean Carried Teletraffic (Erlangs/km2/MHz)
10-3
2
5
10-2
2
Pro
babi
lity
oflo
wqu
ality
acce
ss,P lo
w
1%
2%
-32, -44-30, -44-24, -40-22, -40-20, -40Tacc(dB), Tdrop (dB)
Figure 5.32: Probability of low quality access versus mean carried traffic of a CDMA based cellularnetwork usingfixed receivedEc/Io based soft handover thresholds in conjunctionwith1.0 Hz shadowing and a standard deviation of 3 dBfor SF=16.
thresholds led to a total network capacity of between 107 and128 users, for the conservativeand lenient scenarios, respectively. This capacity increase was the benefit of the more effi-cient soft handover mechanism, which was capable of taking into account the interferencelevel experienced, leading to a more intelligent selectionof base stations supporting the call.At a maximum shadow fading frequency of 0.5 Hz the network hada maximum capacity of129 and 140 users, for the conservative and lenient scenario, respectively, when using thefixedEc/Io soft handover thresholds.
5.4.3.5 RelativeEc/Io Thresholds without Shadowing
In this section we combined the benefits of using the receivedEc/Io ratio and relative softhandover thresholds, thus ensuring that variations in boththe received pilot signal strengthand interference levels were monitored in the soft handoverprocess.
The call dropping performance is shown in Figure 5.33, illustrating that reducing the softhandover thresholds improved the probability of dropped calls, in particular at higher trafficloads. This phenomenon is also evident in Figure 5.34, whichshows the probability of alow quality outage. However, in some cases it was evident that excessive reduction of thethresholds led to increasing the co-channel interference,and hence to a greater probabilityof outage associated with low quality. Again, this was the consequence of supporting anexcessive number of users in soft handover, which provided abeneficial diversity gain for themobiles but also increased the amount of downlink interference inflicted by the base stationssupporting the soft handovers.
The entire network supported a total of 256 users employing soft handover thresholds of
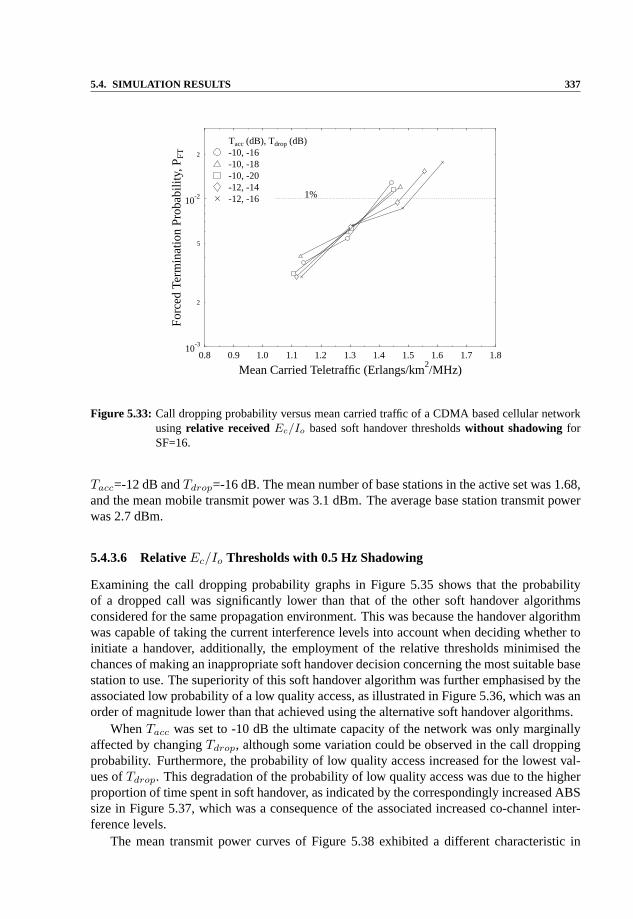
5.4. SIMULATION RESULTS 337
0.8 0.9 1.0 1.1 1.2 1.3 1.4 1.5 1.6 1.7 1.8
Mean Carried Teletraffic (Erlangs/km2/MHz)
10-3
2
5
10-2
2
For
ced
Term
inat
ion
Pro
babi
lity,
P FT1%-12, -16
-12, -14-10, -20-10, -18-10, -16Tacc(dB), Tdrop (dB)
Figure 5.33: Call dropping probability versus mean carried traffic of a CDMA based cellular networkusing relative receivedEc/Io based soft handover thresholdswithout shadowing forSF=16.
Tacc=-12 dB andTdrop=-16 dB. The mean number of base stations in the active set was1.68,and the mean mobile transmit power was 3.1 dBm. The average base station transmit powerwas 2.7 dBm.
5.4.3.6 RelativeEc/Io Thresholds with 0.5 Hz Shadowing
Examining the call dropping probability graphs in Figure 5.35 shows that the probabilityof a dropped call was significantly lower than that of the other soft handover algorithmsconsidered for the same propagation environment. This was because the handover algorithmwas capable of taking the current interference levels into account when deciding whether toinitiate a handover, additionally, the employment of the relative thresholds minimised thechances of making an inappropriate soft handover decision concerning the most suitable basestation to use. The superiority of this soft handover algorithm was further emphasised by theassociated low probability of a low quality access, as illustrated in Figure 5.36, which was anorder of magnitude lower than that achieved using the alternative soft handover algorithms.
WhenTacc was set to -10 dB the ultimate capacity of the network was onlymarginallyaffected by changingTdrop, although some variation could be observed in the call droppingprobability. Furthermore, the probability of low quality access increased for the lowest val-ues ofTdrop. This degradation of the probability of low quality access was due to the higherproportion of time spent in soft handover, as indicated by the correspondingly increased ABSsize in Figure 5.37, which was a consequence of the associated increased co-channel inter-ference levels.
The mean transmit power curves of Figure 5.38 exhibited a different characteristic in

338 CHAPTER 5. HSDPA-STYLE FDD NETWORKING, ADAPTIVE ARRAYS AND AQA M
0.4 0.6 0.8 1.0 1.2 1.4 1.6 1.8 2.0
Mean Carried Teletraffic (Erlangs/km2/MHz)
10-4
2
5
10-3
2
5
10-2
2
Pro
babi
lity
oflo
wqu
ality
acce
ss,P lo
w
1%
2%
-12, -16-12, -14-10, -20-10, -18-10, -16Tacc(dB), Tdrop (dB)
Figure 5.34: Probability of low quality access versus mean carried traffic of a CDMA based cellularnetwork usingrelative receivedEc/Io based soft handover thresholdswithout shadow-ing for SF=16.
0.3 0.4 0.5 0.6 0.7 0.8 0.9
Mean Carried Teletraffic (Erlangs/km2/MHz)
10-3
2
5
10-2
2
For
ced
Term
inat
ion
Pro
babi
lity,
P FT
1%+2, -20-10, -20-10, -18-10, -16Tacc(dB), Tdrop (dB)
Figure 5.35: Call dropping probability versus mean carried traffic of a CDMA based cellular networkusingrelative receivedEc/Io based soft handover thresholds in conjunctionwith 0.5 Hzshadowing and a standard deviation of 3 dBfor SF=16.

5.4. SIMULATION RESULTS 339
0.3 0.4 0.5 0.6 0.7 0.8 0.9
Mean Carried Teletraffic (Erlangs/km2/MHz)
10-4
2
5
10-3
2
5
10-2
2
Pro
babi
lity
oflo
wqu
ality
acce
ss,P lo
w1%
2%
+2, -20-10, -20-10, -18-10, -16Tacc(dB), Tdrop (dB)
Figure 5.36: Probability of low quality access versus mean carried traffic of a CDMA based cellularnetwork usingrelative received Ec/Io based soft handover thresholds in conjunctionwith 0.5 Hz shadowing and a standard deviation of 3 dBfor SF=16.
0.3 0.4 0.5 0.6 0.7 0.8 0.9
Mean Carried Teletraffic (Erlangs/km2/MHz)
1.0
1.1
1.2
1.3
1.4
1.5
1.6
1.7
1.8
1.9
2.0
Mea
nnu
mbe
rof
BS
inth
eac
tive
set
+2, -20-10, -20-10, -18-10, -16Tacc(dB), Tdrop (dB)
Figure 5.37: Mean number of base stations in the active base station set versus mean carried trafficof a CDMA based cellular network usingrelative receivedEc/Io based soft handoverthresholds in conjunctionwith 0.5 Hz shadowing and a standard deviation of 3 dBforSF=16.

340 CHAPTER 5. HSDPA-STYLE FDD NETWORKING, ADAPTIVE ARRAYS AND AQA M
0.3 0.4 0.5 0.6 0.7 0.8 0.9
Mean Carried Teletraffic (Erlangs/km2/MHz)
-4.0
-3.5
-3.0
-2.5
-2.0
-1.5
-1.0M
ean
Tra
nsm
issi
onP
ower
(dB
m)
+2, -20-12, -14-10, -18Tacc(dB), Tdrop (dB)Filled = BS, Blank = MS
Figure 5.38: Mean transmission power versus mean carried traffic of a CDMA basedcellular networkusingrelative receivedEc/Io based soft handover thresholds in conjunctionwith 0.5 Hzshadowing and a standard deviation of 3 dBfor SF=16.
comparison to that observed for the other soft handover algorithms. Specifically, at low traf-fic loads the mean mobile transmit power was less than that of the base stations, whereas atthe higher traffic loads, the mobile transmit power was greater than that of the base stations.Although, comparing this graph with Figure 5.20 revealed that the spread and the rate ofchange of the mobile transmit power versus the traffic load was similar in both scenarios,the mean base station transmission power was lower in Figure5.38. This reduced base sta-tion transmission power, again demonstrated the superiority of this soft handover algorithm,which manifested itself in its more efficient use of resources.
Since the probability of low quality access fell well below the 1% threshold, both the con-servative and lenient scenarios exhibited the same total network capacity, which was slightlyabove 150 users for the entire network. This was achieved on average with the aid of 1.65base stations, at a mean mobile transmit power of−1.2 dBm and at a mean base stationtransmit power of -1.7 dBm.
5.4.3.7 RelativeEc/Io Thresholds with 1.0 Hz Shadowing
The call dropping probability shown in Figure 5.39 is slightly worse than that obtained inFigure 5.35 for a maximum shadow fading frequency of 0.5 Hz, with a greater performancedifference achieved by alteringTdrop. A similar performance degradation was observed forthe probability of low quality access in Figure 5.40, with anassociated relatively low impactdue to varying the soft handover thresholds. Although not explicitly shown, we found thatthe mean transmission powers were similar to those requiredfor a maximum shadow fadingfrequency of 0.5 Hz.

5.4. SIMULATION RESULTS 341
0.3 0.4 0.5 0.6 0.7 0.8 0.9
Mean Carried Teletraffic (Erlangs/km2/MHz)
10-3
2
5
10-2
2
For
ced
Term
inat
ion
Pro
babi
lity,
P FT
1%+2, -20-10, -20-10, -18-10, -16Tacc(dB), Tdrop (dB)
Figure 5.39: Call dropping probability versus mean carried traffic of a CDMA based cellular networkusingrelative receivedEc/Io based soft handover thresholds in conjunctionwith 1.0 Hzshadowing and a standard deviation of 3 dBfor SF=16.
0.3 0.4 0.5 0.6 0.7 0.8 0.9
Mean Carried Teletraffic (Erlangs/km2/MHz)
10-4
2
5
10-3
2
5
10-2
2
Pro
babi
lity
oflo
wqu
ality
acce
ss,P lo
w
1%
2%
+2, -20-10, -20-10, -18-10, -16Tacc(dB), Tdrop (dB)
Figure 5.40: Probability of low quality access versus mean carried traffic of a CDMA based cellularnetwork usingrelative received Ec/Io based soft handover thresholds in conjunctionwith 1.0 Hz shadowing and a standard deviation of 3 dBfor SF=16.

342 CHAPTER 5. HSDPA-STYLE FDD NETWORKING, ADAPTIVE ARRAYS AND AQA M
5.4.3.8 Summary
In summary, the employment of relativeEc/Io soft handover thresholds resulted in a superiornetwork performance and capacity under all the propagationconditions investigated. Thiswas achieved whilst invoking the lowest average number of base stations and the minimummean base station transmit power. A further advantage of this handover scheme is that thesame soft handover thresholds excelled in all of the propagation environments studied, unlikethe previously considered algorithms, which obtained their best results at different thresholdsfor different conditions. The entire network capacity was 256 users without shadow fading,with a mean ABS size of 1.68. At a maximum shadowing frequencyof 0.5 Hz the networksupported just over a total of 150 users, whilst 144 users were served by the entire network,when a maximum shadow fading frequency of 1.0 Hz was encountered.
5.4.4 Overview of Results
Conservative scenario Lenient scenarioPFT =1%,Plow=1% PFT =1%,Plow=2%
Soft handover Power (dBm) Power (dBm)algorithm Shadowing Users ABS MS BS Users ABS MS BS
Fixed pilot pwr. No 290 1.7 5.1 5.1 290 1.7 5.1 5.1Fixed pilot pwr. 0.5 Hz, 3 dB - - - - 127 1.83 -2.0 6.5Fixed pilot pwr. 1.0 Hz, 3 dB - - - - - - - -Delta pilot pwr. No 288 1.7 4.1 4.7 288 1.7 4.1 4.1Delta pilot pwr. 0.5 Hz, 3 dB 144 1.77 -1.5 0.6 146 1.78 -1.5 1.3Delta pilot pwr. 1.0 Hz, 3 dB 127 1.5 -2.4 -1.9 144 1.72 -1.5 0.8FixedEc/Io No 223 1.83 2.0 10.0 231 1.86 2.0 10.3FixedEc/Io 0.5 Hz, 3 dB 129 1.88 -2.4 7.0 140 1.91 -2.4 8.7FixedEc/Io 1.0 Hz, 3 dB 107 1.86 -3.0 4.5 128 1.91 -3.0 9.5DeltaEc/Io No 256 1.68 3.1 2.7 256 1.68 3.1 2.7DeltaEc/Io 0.5 Hz, 3 dB ≈150 1.65 -1.2 -1.7 ≈150 1.65 -1.2 -1.7DeltaEc/Io 1.0 Hz, 3 dB 144 1.65 -1.1 -1.6 144 1.65 -1.1 -1.6
Table 5.3: Maximum number of mobile users that can be supported by the network, for different softhandover metrics/algorithms whilst meeting the preset quality constraints. The mean num-ber of base stations in the Active Base station Set (ABS) is also presented,along with themean mobile and mean base station transmit powers.
Table 5.3 summarises the results obtained for the various soft handover algorithms overthe three different propagation environments considered.The fixed receiver pilot power basedalgorithm performed the least impressively overall, as expected due to its inherent inability tocope with shadow fading. However, it did offer a high networkcapacity in a non-shadowedenvironment. Using the relative received pilot power basedsoft handover algorithm improvedthe performance under shadow fading, but different fading rates required different thresholdsto meet the conservative and lenient quality criteria. The performance of the fixedEc/Io
based soft handover algorithm also varied significantly, when using the same thresholds forthe two different fading rates considered. However, the maximum network capacity achievedunder the different shadow fading conditions was significantly higher, than that of the fixedreceived pilot power based algorithm. This benefit resultedfrom the inclusion of the interfer-

5.4. SIMULATION RESULTS 343
ence levels in the handover process, which thus took into account the fading of both the signaland the co-channel interference. Combining the relative threshold based scheme with usingEc/Io thresholds allowed us to support the highest number of usersunder the shadow fadingconditions investigated. Whilst its performance was not thehighest in the non-shadowed en-vironment, this propagation environment is often unrealistic, and hence the relative receivedEc/Io based soft handover algorithm was chosen as the basis for ourfuture investigations,while using the soft handover thresholds ofTacc=-10 dB andTdrop=-18 dB. The advantagesof this handover algorithm were its reduced fraction of timespent in soft handover, and itsability to perform well under both shadow fading conditionsevaluated, whilst utilising thesame soft handover thresholds. Since the constraining factor of these network capacity re-sults was the probability of a dropped call,PFT , which was the same for both scenarios,further network capacity results were only shown for the conservative scenario.
5.4.5 Performance of Adaptive Antenna Arrays in a High Data RatePedestrian Environment
In our previous investigations we endeavoured to identify the soft handover algorithm, whichsupports the greatest number of users, at the best call quality, regardless of the propagationconditions. In this section we study the impact of adaptive antenna arrays on the network’sperformance. The investigations were conducted using the relativeEc/Io based soft han-dover algorithm in conjunction withTacc=-10 dB andTdrop=-18 dB, using a spreading factorof 16. Given that the chip rate of UTRA is 3.84 Mchips/sec, this spreading factor correspondsto a channel data rate of 3.84×10⁶/16=240 kbps. Applying1/2 rate error correction codingwould result in an effective data throughput of 120 kbps, whereas utilising a2/3 rate errorcorrection code would provide a useful throughput of 160 kps. As in the previous simula-tions, a cell radius of 150 m was assumed and a pedestrian walking velocity of 3 mph wasused. In our previous results investigations employing adaptive antenna arrays at the basestation and using a FDMA/TDMA based network, as in Chapter 4,we observed quite sig-nificant performance gains as a direct result of the interference rejection capabilities of theadaptive antenna arrays invoked. Since the CDMA based network considered here has a fre-quency reuse of 1, the levels of co-channel interference aresignificantly higher, and hence theadaptive antennas may be able to null the interference more effectively. However, the greaternumber of interference sources may limit the achievable interference rejection.
Network performance results were obtained using two and four element adaptive antennaarrays, both in the absence of shadow fading, and in the presence of 0.5 Hz and 1.0 Hz fre-quency shadow fading exhibiting a standard deviation of 3 dB. The adaptive beamformingalgorithm used was the Sample Matrix Inversion (SMI) algorithm, as described in Chapter3 and used in the FDMA/TDMA network simulations of Chapter 4.The specific adaptivebeamforming implementation used in the CDMA based network was identical to that usedin the FDMA/TDMA network simulations. Briefly, one of the eight possible 8-bit BPSKreference signals was used to identify the desired user, andthe remaining interfering userswere assigned the other seven 8-bit reference signals. The received signal’s autocorrelationmatrix was then calculated, and from the knowledge of the desired user’s reference signal,the receiver’s optimal antenna array weights were determined with the aid of the SMI algo-rithm. The reader is referred to Section 4.6.1 for further details. Since this implementationof the algorithm only calculated the receiver’s antenna array weights, i.e. the antenna arrays
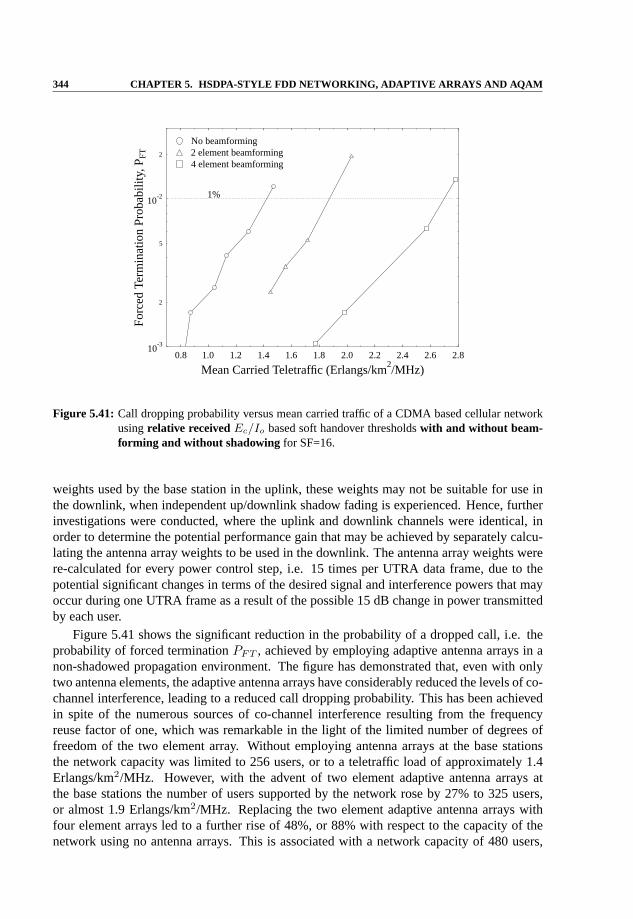
344 CHAPTER 5. HSDPA-STYLE FDD NETWORKING, ADAPTIVE ARRAYS AND AQA M
0.8 1.0 1.2 1.4 1.6 1.8 2.0 2.2 2.4 2.6 2.8
Mean Carried Teletraffic (Erlangs/km2/MHz)
10-3
2
5
10-2
2
For
ced
Term
inat
ion
Pro
babi
lity,
P FT
1%
4 element beamforming2 element beamformingNo beamforming
Figure 5.41: Call dropping probability versus mean carried traffic of a CDMA based cellular networkusingrelative receivedEc/Io based soft handover thresholdswith and without beam-forming and without shadowing for SF=16.
weights used by the base station in the uplink, these weightsmay not be suitable for use inthe downlink, when independent up/downlink shadow fading is experienced. Hence, furtherinvestigations were conducted, where the uplink and downlink channels were identical, inorder to determine the potential performance gain that may be achieved by separately calcu-lating the antenna array weights to be used in the downlink. The antenna array weights werere-calculated for every power control step, i.e. 15 times per UTRA data frame, due to thepotential significant changes in terms of the desired signaland interference powers that mayoccur during one UTRA frame as a result of the possible 15 dB change in power transmittedby each user.
Figure 5.41 shows the significant reduction in the probability of a dropped call, i.e. theprobability of forced terminationPFT , achieved by employing adaptive antenna arrays in anon-shadowed propagation environment. The figure has demonstrated that, even with onlytwo antenna elements, the adaptive antenna arrays have considerably reduced the levels of co-channel interference, leading to a reduced call dropping probability. This has been achievedin spite of the numerous sources of co-channel interferenceresulting from the frequencyreuse factor of one, which was remarkable in the light of the limited number of degrees offreedom of the two element array. Without employing antennaarrays at the base stationsthe network capacity was limited to 256 users, or to a teletraffic load of approximately 1.4Erlangs/km2/MHz. However, with the advent of two element adaptive antenna arrays atthe base stations the number of users supported by the network rose by 27% to 325 users,or almost 1.9 Erlangs/km2/MHz. Replacing the two element adaptive antenna arrays withfour element arrays led to a further rise of 48%, or 88% with respect to the capacity of thenetwork using no antenna arrays. This is associated with a network capacity of 480 users,

5.4. SIMULATION RESULTS 345
0.8 1.0 1.2 1.4 1.6 1.8 2.0 2.2 2.4 2.6 2.8
Mean Carried Teletraffic (Erlangs/km2/MHz)
10-4
2
5
10-3
2
5
10-2
2
Pro
babi
lity
oflo
wqu
ality
acce
ss,P lo
w
2%
1%4 element beamforming2 element beamformingNo beamforming
Figure 5.42: Probability of low quality access versus mean carried traffic of a CDMA based cellularnetwork usingrelative receivedEc/Io based soft handover thresholdswith and withoutbeamforming and without shadowingfor SF=16.
or 2.75 Erlangs/km2/MHz. A summary of the network capacities achieved under differentconditions is given in Table 5.4.
The probability of low quality outage, presented in Figure 5.42 also exhibited a sub-stantial improvement with the advent of two element adaptive antenna arrays. However, theperformance gains obtained when invoking four element adaptive antenna arrays were moreinvolved. It can be seen from the figure that higher traffic loads were carried with at a suffi-ciently low probability of a low quality occurring, and at higher traffic loads the probabilityof a low quality access was lower than that achieved using a two element array. However,at lower traffic loads the performance was worse than that obtained when using two elementarrays, and the gradient of the performance curve was significantly lower. Further in-depthanalysis of the results suggested that the vast majority of the low quality outages were oc-curring when new calls started. When a user decided to commence communications with thebase station, the current interference level was measured,and the target transmission powerwas determined in order to reach the target SINR necessary for reliable communications.However, in order to avoid disrupting existing calls the transmission power was ramped upslowly, until the target SINR was reached. A network using noadaptive antenna arrays, i.e.employing omnidirectional antennas, can be viewed as offering equal gain to all users of thenetwork, which we assumed to be 1.0, or 0 dB. Thus, when a new call is initiated, the level ofinterference rises gradually, and the power control algorithm ensures that the existing userscompensate for the increased level of co-channel interference by increasing their transmis-sion power. In a network using adaptive antenna arrays, the adaptive antenna arrays are usedto null the sources of interference, and in doing so the arraymay reduce the antenna gain inthe direction of the desired user, in order to maximise the SINR. Hence a user starting a new

346 CHAPTER 5. HSDPA-STYLE FDD NETWORKING, ADAPTIVE ARRAYS AND AQA M
111.0 111.5 112.0 112.5 113.0 113.5 114.0 114.5 115.0Frames
3
4
5
6
7
8
9
SIN
R(d
B)
DownlinkUplink
111.0 111.5 112.0 112.5 113.0 113.5 114.0 114.5 115.00.2
0.3
0.4
0.5
0.6
0.7
Ant
enna
gain
111.0 111.5 112.0 112.5 113.0 113.5 114.0 114.5 115.04
6
8
1012
14
16
18
Tra
nsm
itpo
wer
(dB
m)
DownlinkUplink
Figure 5.43: The changes in the antenna array gain, versus time, in the direction of the desired user,the up and downlink transmission powers, and the up- and downlink received SINRs,when a new call starts using four element adaptive antenna arrays without shadowing inconjunction with theoriginal power ramping algorithm and SF=16.
call, even if it has low transmission power, can alter the antenna array’s response, and thusthe antenna gain experienced by the existing users. This phenomenon is more marked whenusing four element arrays since their directivity, and thussensitivity to interfering signals, isgreater.
Figure 5.43 illustrates this phenomenon, where another user starts a new call at frame112 suddenly reducing the antenna gain in the direction of the desired user from 0.4 to justabove 0.2, a drop of 3 dB. As can be seen from the figure, the downlink SINR falls sharplybelow the low quality outage threshold of 7.0 dB, resulting in several consecutive outages,until the downlink transmission power is increased sufficiently. The impact of reducing theinitial transmission power, in order to ensure that the power ramping takes place more gently,is depicted in Figure 5.44. In this figure it can be seen that the antenna gain falls much moregently, over a prolonged period of time, thus reducing the number of low quality outages, asthe downlink transmission power is increased in an effort tocompensate for the lower antennagain. It is of interest to note how the received SINR varies asthe antenna gain and the powercontrol algorithm interact, in order to maintain the targetSINR.
Even though the employment of adaptive antenna arrays can result in the attenuation ofthe desired signal, this is performed in order to maximise the received SINR, and thus thelevels of interference are attenuated more strongly, ultimately leading to the reduction of themean transmission power, as emphasised by Figure 5.45. Thisfigure clearly shows the lowerlevels of transmission power, required in order to maintainan acceptable performance, whilstusing adaptive antenna arrays at the base stations. A reduction of 3 dB in the mean mobiletransmission power was achieved by invoking two element antenna arrays, and a further re-

5.4. SIMULATION RESULTS 347
125.0 125.5 126.0 126.5 127.0 127.5 128.0 128.5 129.0Frames
3
4
5
6
7
8
9
SIN
R(d
B)
DownlinkUplink
125.0 125.5 126.0 126.5 127.0 127.5 128.0 128.5 129.00.2
0.3
0.4
0.5
0.6
0.7
Ant
enna
gain
125.0 125.5 126.0 126.5 127.0 127.5 128.0 128.5 129.04
6
8
1012
14
16
18
Tra
nsm
itpo
wer
(dB
m)
DownlinkUplink
Figure 5.44: The changes in the antenna array gain, versus time, in the direction of the desired user, theup and downlink transmission powers, and the up and downlink receivedSINRs, when anew call starts using four element adaptive antenna arrays without shadowing in conjunc-tion with aslower power rampingalgorithm and SF=16.
duction of 1.5 dB resulted from using four element arrays. These power budget savings wereobtained in conjunction with reduced levels of co-channel interference, leading to superiorcall quality, as illustrated in Figures 5.41 and 5.42. A greater performance advantage wasevident in the uplink scenario, suggesting that the selective base station diversity techniquesemployed in the uplink are amenable to amalgamation with adaptive antenna arrays. In con-trast, the maximum ratio combining performed at the mobile inherently reduces the impactof co-channel interference, and hence benefits to a lesser extent from the employment ofadaptive antenna arrays.
The impact of adaptive antenna arrays in a propagation environment subjected to shadowfading was then investigated. The associated call droppingperformance is shown in Figure5.46. This figure illustrates the substantial network capacity gains achieved with the aid ofboth two and four element adaptive antenna arrays under shadow fading propagation condi-tions. Simulations were conducted in conjunction with log-normal shadow fading having astandard deviation of 3 dB, and maximum shadowing frequencies of both 0.5 Hz and 1.0 Hz.As expected the network capacity was reduced at the faster fading frequency. The effect ofperforming independent up- and down-link beamforming, as opposed to using the base sta-tion’s receive antenna array weights in the downlink was also studied, and a small, but notinsignificant call dropping probability reduction can be seen in the Figure 5.46. The net-work supported just over 150 users, and 144 users, when subjected to 0.5 Hz and 1.0 Hzfrequency shadow fading, respectively. With the application of two element adaptive antennaarrays, re-using the base station’s uplink receiver weights on the downlink, these capacitiesincreased by 35% and 40%, to 203 users and 201 users. Performing independent up- and

348 CHAPTER 5. HSDPA-STYLE FDD NETWORKING, ADAPTIVE ARRAYS AND AQA M
0.8 1.0 1.2 1.4 1.6 1.8 2.0 2.2 2.4 2.6 2.8
Mean Carried Teletraffic (Erlangs/km2/MHz)
-3
-2
-1
0
1
2
3
4
5
6M
ean
Tra
nsm
issi
onP
ower
(dB
m)
4 element beamforming2 element beamformingNo beamformingFilled = Downlink, Blank = Uplink
Figure 5.45: Mean transmission power versus mean carried traffic of a CDMA basedcellular networkusingrelative receivedEc/Io based soft handover thresholdswith and without beam-forming and without shadowing for SF=16.
0.4 0.6 0.8 1.0 1.2 1.4 1.6 1.8 2.0 2.2
Mean Carried Teletraffic (Erlangs/km2/MHz)
10-3
2
5
10-2
2
For
ced
Term
inat
ion
Pro
babi
lity,
P FT
1%
4 element beamforming2 element beamformingNo beamforming
1.0Hz, 3dB shadowing0.5Hz, 3dB shadowing
downlink beamformingFilled = Independent up/
Figure 5.46: Call dropping probability versus mean carried traffic of a CDMA based cellular networkusingrelative receivedEc/Io based soft handover thresholdswith and without beam-forming and with shadowing having a standard deviation of 3 dBfor SF=16.

5.4. SIMULATION RESULTS 349
0.4 0.6 0.8 1.0 1.2 1.4 1.6 1.8 2.0 2.2
Mean Carried Teletraffic (Erlangs/km2/MHz)
10-4
2
5
10-3
2
5
10-2
2
Pro
babi
lity
oflo
wqu
ality
acce
ss,P lo
w
1%
2%
downlink beamformingFilled = independent up/1.0Hz, 3dB shadowing0.5Hz, 3dB shadowing4 element beamforming2 element beamformingNo beamforming
Figure 5.47: Probability of low quality access versus mean carried traffic of a CDMA based cellularnetwork usingrelative receivedEc/Io based soft handover thresholdswith and withoutbeamforming and with shadowing having a standard deviation of 3 dBfor SF=16.
down-link beamforming resulted in a mean further increase of 13% in the network capacity.The implementation of four element adaptive antenna arraysled to a network capacity of349 users at a 0.5 Hz shadowing frequency, and 333 users at a 1.0 Hz shadowing frequency.This corresponded to relative gains of 133% and 131% over thecapacity provided withoutbeamforming. Invoking independent up- and down-link beamforming gave another boost of7% and 10% to network capacity for 0.5 Hz and 1.0 Hz frequency shadowing environments,respectively, giving final network capacities of just over 375 users and 365 users.
Similar trends were observed regarding the probability of low quality outage to thosefound in the non-shadowing scenarios. However, the trend was much more prevalent undershadowing, due to greater variation of the received signal strengths, as a result of the shadowfading, as shown in Figure 5.47. The figure indicates that thetrend is also evident, whenusing two element adaptive antenna arrays in conjunction with shadow fading. As expected,the performance deteriorated as the number of antenna elements increased, and when themaximum shadow fading frequency was increased from 0.5 Hz to1.0 Hz. It should be noted,however that the probability of low quality access always remained below the 1% constraintof the conservative scenario, and the call dropping probability was considerably reduced bythe adaptive antenna arrays.
The mean transmission power performance is depicted in Figure 5.48, suggesting that asfor the non-shadowing scenario of Figure 5.45, the number ofantenna elements had only alimited impact on the base stations’ transmission power, although there was some reductionin the mobile stations’ mean transmission power. The mean transmission powers requiredwhen using independent up- and down-link beamforming are not explicitly shown, but wereslightly less than those presented here, with a mean reduction of about 0.4 dB.

350 CHAPTER 5. HSDPA-STYLE FDD NETWORKING, ADAPTIVE ARRAYS AND AQA M
0.4 0.6 0.8 1.0 1.2 1.4 1.6 1.8 2.0 2.2
Mean Carried Teletraffic (Erlangs/km2/MHz)
-4
-3
-2
-1
0
1
2
3
Mea
nT
rans
mis
sion
Pow
er(d
Bm
)
Filled = Downlink, Blank = Uplink1.0Hz, 3dB shadowing0.5Hz, 3dB shadowing4 element beamforming2 element beamformingNo beamforming
Figure 5.48: Mean transmission power versus mean carried traffic of a CDMA basedcellular networkusingrelative receivedEc/Io based soft handover thresholdswith and without beam-forming and shadowing having a standard deviation of 3 dBfor SF=16.
A summary of the maximum network capacities of the networks considered in this sectionboth with and without shadowing, employing beamforming using two and four element arraysis given in Table 5.4, along with the teletraffic carried and the mean mobile and base stationtransmission powers required.
The lower bounds of the maximum network capacities obtainedunder identical scenariosin conjunction with a spreading factor of 256, are also presented in Table 5.5, leading to abit rate of 15 kbps, which is suitable for use by speech-rate users. The network capacitycalculations were performed by scaling the number of users supported, as presented in Table5.4, by the ratio of their spreading factors, i.e. 256/16=16. Further interesting user capacityfigures can be inferred for a variety of target bit rates by comparing Tables 5.4, 5.5, 5.7 and5.8 and applying the appropriate spreading factor related scaling mentioned in the context ofestimating the number of 15 kbps speech users supported.
5.4.6 Performance of Adaptive Antenna Arrays and AdaptiveModulation in a High Data Rate Pedestrian Environment
In this section we build upon the results presented in the previous section by applying Adap-tive Quadrature Amplitude Modulation (AQAM) techniques. The various scenarios andchannel conditions investigated were identical to those ofthe previous section, except forthe application of AQAM. Since in the previous section an increased network capacity wasachieved due to using independent up- and down-link beamforming, this procedure was in-voked in these simulations. AQAM involves the selection of the appropriate modulationmode in order to maximise the achievable data throughput over a channel, whilst minimis-

5.4. SIMULATION RESULTS 351
Conservative scenario,PFT =1%,Plow=1%Shadowing Beamforming: independent Users Traffic (Erlangs Power (dBm)
up/downlink /km2/MHz) MS BS
No No - 256 1.42 3.1 2.7No 2 elements - 325 1.87 3.75 0.55No 4 elements - 480 2.75 4.55 1.85
0.5 Hz, 3 dB No - ≈150 0.87 -1.2 -1.70.5 Hz, 3 dB 2 elements No 203 1.16 0.1 -1.10.5 Hz, 3 dB 4 elements No 349 2.0 2.0 0.650.5 Hz, 3 dB 2 elements Yes 233 1.35 0.2 -0.80.5 Hz, 3 dB 4 elements Yes ≈375 2.2 2.15 0.85
1.0 Hz, 3 dB No - 144 0.82 -1.1 -1.61.0 Hz, 3 dB 2 elements No 201 1.12 -0.3 -1.11.0 Hz, 3 dB 4 elements No 333 1.88 1.6 0.51.0 Hz, 3 dB 2 elements Yes 225 1.31 0.1 -0.91.0 Hz, 3 dB 4 elements Yes 365 2.05 1.65 0.6
Table 5.4: Maximum mean carried traffic and maximum number of mobile users that can be supportedby the network, whilst meeting the conservative quality constraints. The carried traffic isexpressed in terms of normalised Erlangs (Erlang/km2/MHz) for the network described inTable 5.2 bothwith and without beamforming (as well as with and without indepen-dent up/down-link beamforming), and also with and without shadow fading having astandard deviation of 3 dBfor SF=16.
Shadowing Beamforming: independent Users Traffic (Erlangsup/down-link when SF=256 /km2/MHz)
No No - 4096 22.7No 2 elements - 5200 29.9No 4 elements - 7680 44.0
0.5 Hz, 3 dB No - 2400 13.90.5 Hz, 3 dB 2 elements No 3248 18.60.5 Hz, 3 dB 4 elements No 5584 32.00.5 Hz, 3 dB 2 elements Yes 3728 21.60.5 Hz, 3 dB 4 elements Yes 6000 35.2
1.0 Hz, 3 dB No - 2304 13.11.0 Hz, 3 dB 2 elements No 3216 17.91.0 Hz, 3 dB 4 elements No 5328 30.11.0 Hz, 3 dB 2 elements Yes 3600 21.01.0 Hz, 3 dB 4 elements Yes 5840 32.8
Table 5.5: A lower bound estimate of the maximum mean traffic and the maximum numberof mo-bile speech-rateusers that can be supported by the network, whilst meeting theconserva-tive quality constraints. The carried traffic is expressed in terms of normalised Erlangs(Erlang/km2/MHz) for the network described in Table 5.2 bothwith and without beam-forming (as well as with and without independent up/down-link beamforming), andalso with and without shadow fading having a standard deviation of 3 dB for SF=256.The number of users supported in conjunction with a spreading factor of256 was calculatedby multiplying the capacities obtained in Table 5.4 by 256/16=16.

352 CHAPTER 5. HSDPA-STYLE FDD NETWORKING, ADAPTIVE ARRAYS AND AQA M
ing the Bit Error Ratio (BER). More explicitly, the philosophy behind adaptive modulationis the most appropriate selection of a modulation mode according to the instantaneous radiochannel quality experienced [12, 13]. Therefore, if the SINR of the channel is high, thena high-order modulation mode may be employed, thus exploiting the temporal fluctuationof the radio channel’s quality. Similarly, if the channel isof low quality, exhibiting a lowSINR, a high-order modulation mode would result in an unacceptably high BER or FER, andhence a more robust, but lower throughput modulation mode would be employed. Therefore,adaptive modulation combats the effects of time-variant channel quality, while also attempt-ing to maximise the achieved data throughput, and maintaining a given BER or FER. In theinvestigations conducted, the modulation modes of the up and downlink were determinedindependently, thus taking advantage of the lower levels ofco-channel interference on theuplink, or of the potentially greater transmit power of the base stations.
The particular implementation of AQAM used in these investigations is illustrated inFigure 5.49. This figure describes the algorithm in the context of the downlink, but the sameimplementation was used also in the uplink. The first step in the process was to establish thecurrent modulation mode. If the user was invoking 16-QAM andthe SINR was found to bebelow the Low Quality (LQ) outage SINR threshold after the completion of the power controliterations, then the modulation mode for the next data framewas 4-QAM. Alternatively,if the SINR was above the LQ outage SINR threshold, but any of the base stations in theABS were using a transmit power within 15 dB of the maximum transmit power - whichis the maximum possible power change range during a 15-slot UTRA frame - then the 4-QAM modulation mode was selected. This ‘headroom’ was introduced in order to providea measure of protection, since if the interference conditions degrade, then at least 15 dB ofincreased transmit power would be available in order to mitigate the consequences of theSINR reduction experienced.
A similar procedure was invoked when switching to other legitimate AQAM modes fromthe 4-QAM mode. If the SINR was below the 4-QAM target SINR andany one of the basestations in the ABS was within 15 dB (the maximum possible power change during a 15-slot UTRA data frame) of the maximum transmit power, then theBPSK modulation modewas employed for the next data frame. However, if the SINR exceeded the 4-QAM targetSINR and there would be 15 dB of headroom in the transmit powerbudget in excess of theextra transmit power required for switching from 4-QAM to 16-QAM, then the 16-QAMmodulation mode was invoked.
And finally, when in the BPSK mode, the 4-QAM modulation mode was selected if theSINR exceeded the BPSK target SINR, and the transmit power ofany of the base stationsin the ABS was less than the power required to transmit reliably using 4-QAM, while be-ing at least 15 dB below the maximum transmit power. The algorithm was activated at theend of each 15-slot UTRA data frame, after the power control algorithm had performedits 15 iterations per data frame, and thus the AQAM mode selection was performed on aUTRA transmission frame-by-frame basis. When changing froma lower-order modulationto a higher-order modulation mode, the lower-order mode wasretained for an extra frame inorder to ramp up the transmit power to the required level, as shown in Figure 5.50(a). Con-versely, when changing from a higher-order modulation modeto a lower-order modulationmode, the lower-order modulation mode was employed whilst ramping the power down, inorder to avoid excessive outages in the higher-order modulation mode due to the reduction ofthe transmit power, as illustrated in Figure 5.50(b).

5.4. SIMULATION RESULTS 353
Y
N
16-QAM Mode?
Thus, in BPSK mode
4-QAM to 16-QAM thres.Any BS TX power <
Y
-15dB
Switch to 16-QAM
Downlink Start
Y
N
SINR < 4-QAM TargetSINR?
Switch to BPSK
Y
N
SINR < 16-QAM LQ Switch to 4-QAMOutage SINR?
max. BS TX power-15dBAny BS TX power >
Switch to 4-QAMY
Any BS TX power >max. BS TX power-15dB
Y
Y
N
4-QAM Mode?
SINR > BPSK TargetSINR?
YBPSK to 4-QAM thres.Any BS TX power <
Y
-15dB
Switch to 4-QAM
Figure 5.49: The AQAM mode switching algorithm used in the downlink of the CDMA based cellularnetwork.
Table 5.6 gives the BPSK, 4-QAM and 16-QAM SINR thresholds used in the simulations.The BPSK SINR thresholds were 4 dB lower than those necessarywhen using 4-QAM, whilethe 16-QAM SINR thresholds were 5.5 dB higher [394]. In otherwords, in moving from theBPSK modulation mode to the 4-QAM modulation mode, the target SINR, low quality outageSINR and outage SINR all increased by 4 dB. When switching to the 16-QAM mode fromthe 4-QAM mode, the SINR thresholds increased by 5.5 dB. However, setting the BPSK to4-QAM and the 4-QAM to 16-QAM mode switching thresholds to a value 7 dB higher thanthe SINR required for maintaining the target BER/FER was necessary in order to preventexcessive outages due to sudden dramatic channel-induced variations in the SINR levels.
Performance results were obtained both with and without beamforming in a log-normalshadow fading environment, at maximum fading frequencies of 0.5 Hz and 1.0 Hz, and astandard deviation of 3 dB. A pedestrian velocity of 3 mph, a cell radius of 150 m and aspreading factor of 16 were used, as in our previous investigations.
Figure 5.51 shows the significant reduction in the probability of a dropped call, achieved

354 CHAPTER 5. HSDPA-STYLE FDD NETWORKING, ADAPTIVE ARRAYS AND AQA M
16-QAM4-QAM4-QAM
Frame n Frame n+2Frame n+1
Tra
nsm
it po
wer
(a) Ramping up the transmit power whilst re-maining in the lower order modulation mode.
4-QAM4-QAM16-QAM
Frame n Frame n+2Frame n+1
Tra
nsm
it po
wer
(b) Ramping down the transmit power whilstswitching to the lower order modulation mode.
Figure 5.50: Power ramping requirements whilst switching modulation modes.
SINR Threshold BPSK 4-QAM 16-QAM
Outage SINR 2.6 dB 6.6 dB 12.1 dBLow Quality Outage SINR 3.0 dB 7.0 dB 12.5 dBTarget SINR 4.0 dB 8.0 dB 13.5 dB
Table 5.6: The target SINR, low quality outage SINR and outage SINR thresholds used for the BPSK,4-QAM and 16-QAM modulation modes of the adaptive modem.
by employing adaptive antenna arrays in conjunction with adaptive modulation in a log-normal shadow faded environment. The figure demonstrates that, even with the aid of a twoelement adaptive antenna array and its limited degrees of freedom, a substantial call droppingprobability reduction was achieved. The performance benefit of increasing the array’s degreesof freedom, achieved by increasing the number of antenna elements, becomes explicit fromthe figure, resulting in a further call dropping probabilityreduction. Simulations were con-ducted in conjunction with log-normal shadow fading havinga standard deviation of 3 dB,and maximum shadowing frequencies of 0.5 Hz and 1.0 Hz. As expected, the call droppingprobability was generally higher at the faster fading frequency, as demonstrated by Figure5.51. The network was found to support 223 users, corresponding to a traffic load of 1.27Erlang/km2/MHz, when subjected to 0.5 Hz frequency shadow fading. The capacity of thenetwork was reduced to 218 users, or 1.24 Erlang/km2/MHz, upon increasing the maximumshadow fading frequency to 1.0 Hz. On employing two element adaptive antenna arrays,the network capacity increased by 64% to 366 users, or to an equivalent traffic load of 2.11Erlang/km2/MHz when subjected to 0.5 Hz frequency shadow fading. When the maximumshadow fading frequency was raised to 1.0 Hz, the number of users supported by the networkwas 341 users, or 1.98 Erlang/km2/MHz, representing an increase of 56% in comparison tothe network without adaptive antenna arrays. Increasing the number of antenna elements tofour, whilst imposing shadow fading with a maximum frequency of 0.5 Hz, resulted in a net-work capacity of 2.68 Erlang/km2/MHz or 476 users, corresponding to a gain of an extra 30%with respect to the network employing two element arrays, and of 113% in comparison to thenetwork employing no adaptive antenna arrays. In conjunction with a maximum shadow fad-ing frequency of 1.0 Hz the network capacity was 460 users or 2.59 Erlang/km2/MHz, which

5.4. SIMULATION RESULTS 355
0.8 1.0 1.2 1.4 1.6 1.8 2.0 2.2 2.4 2.6 2.8
Mean Carried Teletraffic (Erlangs/km2/MHz)
10-3
2
5
10-2
2
For
ced
Term
inat
ion
Pro
babi
lity,
P FT1%
4 element beamforming2 element beamformingNo beamforming
1Hz, 3dB shadowing0.5Hz, 3dB shadowing
Figure 5.51: Call dropping probability versus mean carried traffic of a CDMA based cellular networkusing relative receivedEc/Io based soft handover thresholds bothwith and withoutbeamforming in conjunction with AQAM as well as with shadowing havinga stan-dard deviation of 3 dB for SF=16. See Figure 5.46 for corresponding results withoutadaptive modulation.
represented an increase of 35% with respect to the network invoking two element antennaarrays, or 111% relative to the identical network without adaptive antenna arrays.
The probability of low quality outage, presented in Figure 5.52, did not benefit from theapplication of adaptive antenna arrays, or from the employment of adaptive modulation. Fig-ure 5.47 depicts the probability of low quality outage without adaptive modulation, and uponcomparing these results to those obtained in conjunction with adaptive modulation shown inFigure 5.52, the performance degradation due to adaptive modulation can be explicitly seen.However, the increase in the probability of low quality access can be attributed to the em-ployment of less robust, but higher throughput, higher-order modulation modes invoked bythe adaptive modulation scheme. Hence, under given propagation conditions and using thefixed 4-QAM modulation mode a low quality outage may not occur, yet when using adaptivemodulation and a higher order modulation mode, the same propagation conditions may inflicta low quality outage. This phenomenon is further exacerbated by the adaptive antenna arrays,as described in Section 5.4.5, where the addition of a new source of interference, constitutedby a user initiating a new call, results in an abrupt change inthe gain of the antenna in thedirection of the desired user. This in turn leads to low quality outages, which are more likelyto occur for prolonged periods of time when using a higher order modulation mode. Again,increasing the number of antenna elements from two to four results in an increased proba-bility of a low quality outage due to the sharper antenna directivity. This results in a highersensitivity to changes in the interference incident upon it.
The mean transmission power versus teletraffic performanceis depicted in Figure 5.53,

356 CHAPTER 5. HSDPA-STYLE FDD NETWORKING, ADAPTIVE ARRAYS AND AQA M
0.8 1.0 1.2 1.4 1.6 1.8 2.0 2.2 2.4 2.6 2.8
Mean Carried Teletraffic (Erlangs/km2/MHz)
10-4
2
5
10-3
2
5
10-2
2P
roba
bilit
yof
low
qual
ityac
cess
,P low
1%
2%
1Hz, 3dB shadowing0.5Hz, 3dB shadowing4 element beamforming2 element beamformingNo beamforming
Figure 5.52: Probability of low quality access versus mean carried traffic of a CDMA based cellularnetwork usingrelative receivedEc/Io based soft handover thresholds bothwith andwithout beamforming in conjunction with AQAM as well as with shadowing havinga standard deviation of 3 dB for SF=16. See Figure 5.47 for corresponding resultswithout adaptive modulation.
suggesting that the mean uplink transmission power was always significantly below the meandownlink transmission power, which can be attributed to thepilot power interference en-countered by the mobiles in the downlink. This explanation can be confirmed by examiningFigure 5.54, which demonstrates that the mean modem throughput in the downlink, withoutadaptive antenna arrays, was lower than that in the uplink even in conjunction with increaseddownlink transmission power. Invoking adaptive antenna arrays at the base stations reducedthe mean uplink transmission power required in order to meetthe service quality targets ofthe network. The attainable downlink power reduction increased as the number of antennaarray elements increased, as a result of the superior interference rejection achieved with theaid of a higher number of array elements. A further advantageof employing a larger numberof antenna array elements was the associated increase in themean uplink modem throughput,which became more significant at higher traffic loads. In the downlink scenario, however,increasing the number of adaptive antenna array elements led to an increased mean downlinktransmission power, albeit with a substantially improved mean downlink modem throughput.This suggests that there was some interaction between the adaptive antenna arrays, the adap-tive modulation mode switching algorithm and the maximal ratio combining performed atthe mobiles. In contrast, simple switched diversity was performed by the base stations on theuplink, thus avoiding such a situation. However, the increase in the mean downlink trans-mission power resulted in a much more substantial increase in the mean downlink modemthroughput, especially with the advent of the four element antenna arrays, which exhibited anapproximately 0.5 BPS throughput gain over the two element arrays for identical high traffic

5.5. SUMMARY AND CONCLUSIONS 357
0.8 1.0 1.2 1.4 1.6 1.8 2.0 2.2 2.4 2.6 2.8
Mean Carried Teletraffic (Erlangs/km2/MHz)
0
1
2
3
4
5
6
Mea
nT
rans
mis
sion
Pow
er(d
Bm
)
1Hz, 3dB shadowing0.5Hz, 3dB shadowing4 element beamforming2 element beamformingNo beamformingFilled = Downlink, Blank = Uplink
Figure 5.53: Mean transmission power versus mean carried traffic of a CDMA basedcellular networkusing relative receivedEc/Io based soft handover thresholds bothwith and withoutbeamforming in conjunction with AQAM as well as with shadowing havinga stan-dard deviation of 3 dB for SF=16. See Figure 5.48 for corresponding results withoutadaptive modulation.
loads which can be seen in Figure 5.54.A summary of the maximum user capacities of the networks considered in this section
in conjunction with log-normal shadowing having a standarddeviation of 3 dB, with andwithout employing beamforming using two and four element arrays is given in Table 5.7.The teletraffic carried the mean mobile and base station transmission powers required, andthe mean up- and down-link modem data throughputs achieved are also shown in Table 5.7.Similarly, the lower bounds of the maximum network capacities obtained under identicalscenarios in conjunction with a spreading factor of 256, leading to a bit rate of 15 kbps,suitable for speech-rate users are presented in Table 5.8. The network capacity calculationswere performed by scaling the number of users supported, as presented in Table 5.7, by theratio of their spreading factors, i.e. by 256/16=16.
5.5 Summary and Conclusions
We commenced this chapter with a brief overview of the background behind the 3G UTRAstandard. This was followed in Sections 5.2 and 5.3 by an introduction to CDMA and thetechniques invoked in the UTRA standard.
Network capacity studies were then conducted in Section 5.4, which evaluated the per-formance of four different soft handover algorithms in the context of both non-shadowed andlog-normal shadow faded propagation environments. The algorithm using relative received

358 CHAPTER 5. HSDPA-STYLE FDD NETWORKING, ADAPTIVE ARRAYS AND AQA M
0.8 1.0 1.2 1.4 1.6 1.8 2.0 2.2 2.4 2.6 2.8
Mean Carried Teletraffic (Erlangs/km2/MHz)
2.0
2.2
2.4
2.6
2.8
3.0
3.2
3.4
3.6
3.8
4.0
Mea
nM
odem
Thr
ough
put(
BP
S)
4 element beamforming2 element beamformingNo beamformingFilled = Uplink, Blank = Downlink
1Hz, 3dB shadowing0.5Hz, 3dB shadowing
Figure 5.54: Mean modem throughput versus mean carried traffic of a CDMA basedcellular networkusing relative receivedEc/Io based soft handover thresholds bothwith and withoutbeamforming in conjunction with AQAM as well as with shadowing havinga stan-dard deviation of 3 dB for SF=16.
Conservative scenarioTraffic (Erlangs Power (dBm) Throughput (BPS)
Shadowing Beamforming Users /km2/MHz) MS BS Uplink Downlink
0.5 Hz, 3 dB No 223 1.27 3.25 4.95 2.86 2.950.5 Hz, 3 dB 2 elements 366 2.11 3.55 4.7 2.56 2.660.5 Hz, 3 dB 4 elements 476 2.68 3.4 5.0 2.35 2.72
1.0 Hz, 3 dB No 218 1.24 3.3 4.95 2.87 2.961.0 Hz, 3 dB 2 elements 341 1.98 3.5 4.9 2.62 2.731.0 Hz, 3 dB 4 elements 460 2.59 3.5 4.95 2.4 2.8
Table 5.7: Maximum mean carried traffic and maximum number of mobile users that can be supportedby the network, whilst meeting the conservative quality constraints. The carried traffic isexpressed in terms of normalised Erlangs (Erlang/km2/MHz), for the network described inTable 5.2 bothwith and without beamforming (using independent up/down-link beam-forming), in conjunction with shadow fading having a standard deviation of 3 dB,whilst employing adaptive modulation techniquesfor SF=16.

5.5. SUMMARY AND CONCLUSIONS 359
Conservative scenarioTraffic (Erlangs
Shadowing Beamforming Users /km2/MHz)
0.5 Hz, 3 dB No 3568 20.30.5 Hz, 3 dB 2 elements 5856 33.80.5 Hz, 3 dB 4 elements 7616 42.9
1.0 Hz, 3 dB No 3488 19.81.0 Hz, 3 dB 2 elements 5456 31.71.0 Hz, 3 dB 4 elements 7360 41.4
Table 5.8: A lower bound estimate of the maximum mean carried traffic and maximum number ofmobilespeech-rateusers that can be supported by the network, whilst meeting the conser-vative quality constraints. The carried traffic is expressed in terms of normalised Erlangs(Erlang/km2/MHz), for the network described in Table 5.2 bothwith and without beam-forming (using independent up/down-link beamforming), in conjunction with shadowfading having a standard deviation of 3 dB, whilst employing adaptivemodulation tech-niques for SF=256. The number of users supported in conjunction with a spreading factorof 256 was calculated by multiplying the capacities obtained in Table 5.7 by 256/16=16.
pilot-to-interference ratio measurements at the mobile, in order to determine the most suit-able base stations for soft handover, was found to offer the highest network capacity whensubjected to shadow fading propagation conditions. Hence,this algorithm and its associ-ated parameters were selected for use in our further investigations. The impact of adaptiveantenna arrays upon the network capacity was then considered in Section 5.4.5 in both non-shadowed and log-normal shadow faded propagation environments. Considerable networkcapacity gains were achieved, employing both two and four element adaptive antenna arrays.This work was then extended in Section 5.4.6 by the application of adaptive modulation tech-niques in conjunction with the previously studied adaptiveantenna arrays in a log-normalshadow faded propagation environment, which elicited further significant network capacitygains.

Chapter 7HSDPA-Style TDD/CDMANetwork Performance
7.1 Introduction
In January 1998, the European standardization body createdfor the definition of the thirdgeneration (3G) mobile radio system, namely the European Telecommunications Institute’s- Special Mobile Group (ETS ISMG), ratified a radio access scheme referred to as the Uni-versal Mobile Telecommunications System (UMTS) [402]. TheUMTS terrestrial RadioAccess known as UTRA supports two duplexing modes, namely the Frequency Division Du-plexing (FDD) mode, where the uplink and downlink are transmitted on different frequencies,and the Time Division Duplexing (TDD) mode, where the uplinkand the downlink are trans-mitted on the same carrier frequency, but multiplexed in time [402]. UMTS networks willintroduce into wide area using a completely new high bit rateradio technology - widebandCDMA (WCDMA).
In UTRA, the different services are expected to be supportedin a spectrally efficientmanner, either by FDD or TDD. The FDD mode is intended for applications in both macro-and micro-cellular environments, supporting data rates ofup to 384 Kbps both at relativelyhigh velocity. The TDD mode, on the other hand, is more suitedto micro and pico-cellularenvironments, as well as for licensed and unlicensed cordless and wireless local loop appli-cations. It makes efficient use of the unpaired spectrum - forexample in wireless Internetapplications, where much of the teletraffic is expected to beon the downlink - and supportsdata rates of up to 2 Mbps. Therefore, the TDD mode is particularly well suited for environ-ments generating a high traffic density e.g. in city centres,business areas, airports etc. andfor indoor coverage, where the applications require high data rates and tend to have highlyasymmetric traffic, again, as in wireless Internet access.
399

400 CHAPTER 7. HSDPA-STYLE TDD/CDMA NETWORK PERFORMANCE
7.2 UMTS FDD Versus TDD Terrestrial Radio Access
A bandwidth of 215 MHz in the region of 2.0 GHz has been allocated for UMTS services inEurope. The paired bands of 1920-1980 MHz (uplink) and 2110-2170 MHz (downlink) havebeen set aside for FDD W-CDMA systems, and the unpaired frequency bands of 1900-1920MHz and 2010-2025 MHz for TDD CDMA systems.
A UTRA Network (UTRAN) consists of one or several Radio Network Sub-systems(RNSs), which in turn consist of base stations (referred to as Node BS) and Radio Net-work Controllers (RNCs). A Node B may serve a single or multiple cells. Mobile stationsare known as User Equipment (UE), which are expected to support multi-mode operation inorder to enable handovers between the FDD and TDD modes and, prior to complete UTRANcoverage, also to GSM. The two modes differ in a number of waysin the physical layer, butfor compatibility and implementation reasons they are harmonized as far as possible, espe-cially in higher layers. More details on the differences anddistinctions can be found in [437].The key parameters of UTRA have been defined in Table 5.1. The harmonization enables thesame services to be offered over both modes, while the differences lead to one mode beingbest utilized in certain system scenarios while the other mode may perform better in otherscenarios.
7.2.1 FDD Versus TDD Spectrum Allocation of UTRA
The FDD versus TDD spectrum allocation of UTRA is shown in Figure 7.1. As can beseen, UTRA is unable to utilize the full frequency spectrum allocated for the 3G mobile ra-dio systems during the WARC’92 conference [422], since those frequency bands have alsobeen partially allocated to the Digital Enhanced Cordless Telecommunications (DECT) sys-tem [438]. The frequency spectrum was originally allocatedbased on the assumption thatspeech and low data rate transmission would become the dominant services offered by IMT-2000 [402,439]. However, in recent years a paradigm has beenexperienced towards servicesthat require high-speed data transmission, such as wireless Internet access and multimediaservices. A study conducted by the UMTS Forum [440] forecastthat the current frequencybands allocated for IMT-2000 are only sufficient for the initial deployment until the year2005. According to the current demand estimates, it was foreseen that an additional fre-quency spectrum of 187 MHz might be required for IMT-2000 in high-traffic areas by theyear 2010. Among of numerous candidate extension bands, theband 2520-2670 MHz hasbeen deemed to be the most likely. Unlike other bands, which have already been allocatedfor use in other applications, this band was allocated to mobile services in all regions. Fur-thermore, the 150 MHz bandwidth available is sufficiently wide for satisfying most of theforecast spectrum requirements.
Again, the UMTS radio access supports both FDD and TDD operations [402]. The oper-ating principles of these two schemes are augmented here in the context of Figure 7.2.
Specifically, the Uplink (UL) and Downlink (DL) signals are transmitted using differ-ent carrier frequencies, namelyfUL andfDL, respectively, separated by a frequency guardband in the FDD mode. On the other hand, the UL and DL messages in the TDD modeare transmitted using the same carrier frequencyfTDD, but in different time-slots, separatedby a guard period. As seen from the spectrum allocation of Figure 7.1, the paired bands of1920-1980 MHz and 2110-2170 MHz are allocated for FDD operation in the UL and DL,

7.2. UMTS FDD VERSUS TDD TERRESTRIAL RADIO ACCESS 401
1900 1920 1980 2010 2025 2110 2170 2200
MS TDD MS
18851710 1785 1805
GSM 1800UTRA
TDDDowlinkUplink
GSM 1800 DECT
RX/TX
UTRA
FDD
UTRA
RX/TXUplinkRX/TX Dowlink FDDUTRA
Frequency (MHz)
Figure 7.1: The proposed spectrum allocation in UTRA
f1
f2
fc
Up−link (UL)
Down−link (DL)
FrequencyTime
FDD Operation
TDD Operation
ULDL DL DLUL UL
Frequency
Time
Figure 7.2: Principle of FDD and TDD operation.
respectively, whereas the TDD mode is operated in the remaining unpaired bands. The pa-rameters designed for FDD and TDD operations are mutually compatible so as to ease theimplementation of a dual-mode terminal capable of accessing the services offered by bothFDD and TDD operators.
7.2.2 Physical Channels
The transport channels are transmitted using the UTRA physical channels [402, 441, 442].The physical channels are typically organized in terms of radio frames and time-slots, asshown in Figure 7.3. While in GSM [443] each TDMA user had an exclusive slot allocation,in W-CDMA the number of simultaneous users supported is dependent on the users’ requiredbit rate and their associated spreading factors. The MSs cantransmit continuously in all slotsor discontinuously, for example, when invoking a Voice Activity Detector (VAD) [443].
As seen in Figure 7.3, there are 15 timeslots within each radio frame. The duration ofeach timeslot is 2/3 ms, which yields a total duration of 10 msfor the radio frame. As weshall see later in this section, the configuration of the information in the time-slots of the

402 CHAPTER 7. HSDPA-STYLE TDD/CDMA NETWORK PERFORMANCE
Time−slot2/3 ms
Radio frame Radio frame1 2
Radio frame (10 ms)
TS 1 TS 2 TS 3 TS 15 TS 1 TS 2 TS 15
Figure 7.3: UTRA physical channel structure
physical channels differs from one another in the UL and DL, as well as in the FDD andTDD modes. In the FDD mode, a DL physical channel is defined by its spreading codeand frequency. Furthermore, in the UL, the modem’s orthogonal in-phase(I) and quadrature-phase (Q) branches are used for delivering the data and control information simultaneouslyin parallel [402]. On the other hand, in the TDD mode, a physical channel is defined by itsspreading code, frequency and time-slot.
7.3 UTRA TDD/CDMA System
The UTRA TDD mode is partly a result of the original UMTS spectrum allocation, whichconsists of one paired and two unpaired bands. This led to an ETSI decision in 1998 thatnot just one but two of the proposed access technologies should be adopted for the UMTSstandard. Hence, the FDD mode should be used in paired band and the TDD mode in the un-paired band. The TDD UTRA scheme will be deployed in the unpaired IMT-2000 frequencybands. The so-called band A is the 3G unpaired frequency allocation in Europe: 1900-1920MHz and 2010-2025 MHz. In the United States so-called band B,namely the PCS spectrumallocation encompasses the range of 1850-1910 MHz and 1930-1990 MHz. Furthermore, theUnited States also allocated band C, an unlicensed band from1910 MHz to 1930 MHz. Thenominal channel spacing in UTRA is 5 MHz, with a channel raster of 200kHz, which meansthat the carrier frequency is a multiple of 200 kHz.
There are a few characteristics that are typical of TDD systems and different from thecharacteristics of FDD systems. These characteristics arelisted below.
• Utilization of unpaired bands : the TDD system can be invoked in unpaired bands,while the FDD system always requires a pair of bands. It is more likely that in thefuture unpaired spectrum resources will be made available for UMTS.
• Possible interference between uplink and downlink : since both the uplink anddownlink share the same carrier frequency in TDD, any timeslot can be used in anydirection and hence the signals of the two transmission directions may interfere witheach other.
• Flexible capacity allocation between the uplink and downlink : in the TDDmode, the uplink and downlink are divided in the time domain.It is possible to controlthe switching point [444] between the uplink and downlink, as seen in Figure 7.2, and

7.3. UTRA TDD/CDMA SYSTEM 403
move capacity form the uplink to downlink, or vice versa, if the capacity requirementis asymmetric between the uplink and downlink.
• Discontinuous transmission : the mobile and the base station transmissions are dis-continuous in TDD. Discontinuous transmissions impose specific requirements on theimplementation. Switching between the transmission directions requires a reflectingtime, since the effects of switching effects of transients must be avoided. Hence, forthe aim of avoiding the overlapping of the uplink and downlink transmissions, a guardperiod is used at the end of each slot.
• Uplink/Downlink channel properties : in case of frequency selective fading thechannel’s function depends on the frequency and, thereforein the FDD mode the fastfading is typically uncorrelated between the uplink and downlink. Since the samefrequency is used both for the uplink and downlink in the TDD mode, the fast fadingproperties are more similar in the uplink and downlink. The similarity of the fast fadingbetween the uplink and downlink can be exploited in both power control and adaptiveantenna arrays used in TDD.
It is unlikely that any of the service providers would operate standalone wide-area TDDnetworks, but rather they would invoke the FDD UTRA mode and possibly GSM to providecontinuous wide-area coverage, while TDD to serve as a separate capacity-enhancing layerin the network [445]. Furthermore, as a benefit of being able to arbitrarily adjust the UL/DLasymmetry, the TDD mode is also capable of supporting high bit rates, ranging from 144kbps to 2 Mbps in wireless Internet type applications.
7.3.1 The TDD Physical Layer
The UTRA TDD mode has a similar frame structure to that of the UTRA FDD mode. Asseen in Figure 7.3, there are 15 slots in a frame, which has a period of 10 ms. Each slot has2560 chips and lasts for 0.667 ms. A superframe consists of 72frames and lasts for 720 ms.A physical channel consists of bursts that are transmitted in the same slot of each frame. Forspecifying a physical channel explicitly, we also have to define its so-called repetition period,repetition length and superframe offset, which will be exemplified below. The number offrames between slots belonging to the same physical channelis the repetition period of agiven physical channel, which must be sub-multiple of 72, i.e. 1,2,3,4,6,8,9,12,18,24,36 and72. An example is given by the physical channel occupying slot 0 in every 12th frame. Thesuperframe offset defines the repetition period offset within a superframe, with respect to thebeginning of the frame. Returning to our example, if the superframe offset is 3, the physicalchannel will occupy slot 0 in frames 3,15,27,39,..., since it was offset by 3 frames, where thecorresponding slots are 12 frames apart. The repetition length defines the number of slotsassociated with each repetition, and may have values of 1,2,3,4. For the example where thephysical channel occupies slot 0, the repetition period is 12, the superframe offset is 3, andsay, the repetition length is 4, the physical channel will occupy slot 0 in frames (3,4,5,6,),(15,16,17,18), (27,28,29,30), etc.

404 CHAPTER 7. HSDPA-STYLE TDD/CDMA NETWORK PERFORMANCE
GPDataMidambleData
2/3 ms
2560 chips
Guard PeriodMidamble
512
256 96
Burst type
Burst Type 1
Burst Type 2
Data
1104
976 96
Figure 7.4: Time slot of the physical channels.
7.3.2 Common Physical Channels of the TDD Mode
The UTRA TDD mode employs time division duplexing for creating bidirectional transmis-sion links. Each slot in a frame can be used for carrying either uplink or downlink infor-mation. The switching point or points between uplink and downlink slots may be variable,as is the number of slots allocated to each link. At least one slot must be allocated in eachdirection.
In TDD operation, the burst structure of Figure 7.4 is used for all the physical channels,where each time-slot’s transmitted information can be arbitrarily allocated to the uplink ordownlink, as shown in the four possible TDD allocations of Figure 7.5. A symmetric UL/DLallocation refers to a scenario in which an approximately equal number of DL and UL burstsis allocated within a TDD frame, while in case of asymmetric UL/DL allocation there is anunequal number of UL and DL bursts, such as services, etc., for example, in “near-simplex”file download from the wireless Internet or in case of video-on-demand.
In UTRA, two different TDD burst structures, known asBurst Type 1 andBurst Type2, are defined, which are shown in Figure 7.4. The Type 1 burst has a longer midamble of512 chips than the Type 2 burst of length 256 chips. However, both types of bursts have anidenticalGuard Period (GP) of 96 chips. The midamble sequences that are allocated tothe different TDD bursts in each time-slot belong to a so-called midamble code set. Thecodes in each midamble code set are derived from a uniqueBasic Midamble Code. Adja-cent cells are allocated different midamble code sets. Thiscan be exploited to assist in cellidentification.

7.3. UTRA TDD/CDMA SYSTEM 405
Up−link :
Down−link :
(a) Symmetric UL/DL allocation with multiple switching points
(b) Asymmetric UL/DL allocation with multiple switching points
(c) Symmetric UL/DL allocation with single swithing point
(d) Asymmetric UL/DL allocation with single swithing point2/3 ms
10 ms
Figure 7.5: Multiple switching points per frame for different slot per frame allocations.

406 CHAPTER 7. HSDPA-STYLE TDD/CDMA NETWORK PERFORMANCE
7.3.3 Power Control
Power control of the UTRA TDD mode is performed on a framely basis, for example using apower control update per 10 ms, which is carried out differently for the uplink and downlink.
Specifically, the uplink power control uses an open loop technique, which exploits thesimilarity of the uplink and downlink channel in a TDD system, in particular as regardsto the pathloss. In each cell there is at least one beacon, i.e. a physical channel having aknown transmit power. Furthermore, during unallocated uplink timeslots the base station iscapable of estimating the uplink interference by exploiting the knowledge of the requiredtarget SIR, the MS can set its transmission power in order to fulfill the transmission integrityrequirements at the BS. A first-order predictor corresponding to a weighting factor can beused for taking into account the expected delay between the downlink pathloss estimate andthe actual uplink pathloss. At the BS, an outer power controlloop is used for estimating theSIR of the received signal, which is compared it to the targetSIR requirements. Then thenecessary MS transmit power is calculated, which is signalled to the MS. This requirementallows the SIR-based outer loop to compensate for the long-term fluctuation of the associatedpathlosses.
7.3.4 Time Advance
Timing advance is the mechanism used in UTRA for controllingthe transmit time instantof signals from different MSs for mitigating leakage between time slots. During the initialaccess, the base station estimates the instant of receptionfor the MSs and advances theirinstant of transmission by the estimated propagation delay, so that all signals arrive approxi-mately within the expected time window at the BS. The UTRA TDDsystem can be used inwide area cells, where the employment of this timing advancemechanism is necessary forpreventing the up-link burst collisions at the BS receiver.The timing advance operates to aresolution of four chips or 1.04µs, since the chip-rate is 3.84 Mchip/s. The BS estimates thetime offset associated with the PRACH transmissions [402] and calculates the required initialtiming advance. The timing advance parameter is transmitted as an 8-bit number, cateringfor a maximum timing advance of 256× 1.04µs corresponding to the up-link transmissionsfrom the MS. This maximum propagation delay of approximately 256µs potentially allowsfor a cell-size of 80 km.
There are proposals to have an enhanced timing advance mechanism with a resolution ofone-eighth of a chip period. This potentially holds the promise of quasi-synchronous up-linktransmission, which would dramatically decrease the multiple access interference, since allthe transmitted codes of the MSs would remain quasi-orthogonal.
When performing a handover to another TDD cell, which is generally synchronized toreference cell, the MS is capable of autonomously applying the right timing advance in thenew cell. In any case, the MS has to signal the timing advance it applies to the BS in the newcell.
7.4 Interference Scenario In TDD CDMA
One of the major attractions for the UTRA TDD mode system is that it allows the uplink anddownlink capacities to be allocated asymmetrically. The uplink and downlink are transmitted
7.4. INTERFERENCE SCENARIO IN TDD CDMA 407
on the same carrier frequency, which creates additional interference scenarios compared toUTRA FDD, and as seen in Figure 7.6, the UL/DL transmission directions of adjacent co-channel BSs may severely interfere with each other. This kind of interference may becomeparticularly detrimental, if the base stations are not synchronized, or if a different ratio ofuplink and downlink timeslots is used in adjacent cells, even if the base stations are framesynchronized. Frame synchronization requires an accuracyof a few symbols, rather than anaccuracy of a few chips.
The interference between uplink and downlink can also occurbetween adjacent frequen-cies. Therefore, the interference between uplink and downlink can take place within oneoperator’s band, and also between two operators.
The interference between uplink and downlink can occur between two mobile stationsand between two base stations. In FDD operation the duplex separation prevents the interfer-ence between uplink and downlink. In a TDD system there are four types of inter-cell/inter-operator interference. These are:
• MS → MS
• BS→ BS
• MS → BS
• BS→ MS
The interference between a mobile station and a base stationis the same both in TDD andin FDD operation. The extent of these interference is dependent on many parameters suchas the cell locations and user distributions, however thereare two parameters that can greatlyaffect the system performance and can potentially be managed by the network. There aresynchronization between cells, and the asymmetry across the network.
7.4.1 Mobile to Mobile Interference
Mobile to mobile interference occurs in Figure 7.6, at the timeslot 7 the mobileMS2 is trans-mitting and the mobileMS1 is receiving in the same frequency in adjacent cells. Mobiletomobile interference is statistical because the locations of the mobiles cannot be controlled.Therefore, mobile to mobile interference cannot be avoidedcompletely by the network plan-ning.
7.4.2 Base Station to Base Station Interference
Base station to base station interference occurs in Figure 7.6, at the timeslot 7 the base stationBS1 is transmitting and the base stationBS2 is receiving in the same frequency in adjacentcells. Base station to base station interference depends heavily on the path loss betweenthe two base stations, and therefore, the network planning greatly affects this interferencescenario [446].

408 CHAPTER 7. HSDPA-STYLE TDD/CDMA NETWORK PERFORMANCE
Cell 1
Cell 2
Uplink
DownlinkTimeslot 1 2 3 4 5 6 7 8 9 10 11 12 151413
BS2
Cell 2Cell 1
MS1
MS2
BS1
Figure 7.6: MS-to-MS BS-to-BS inter-cell interference
7.5 Simulation Results
A number of studies have been conducted, in order to characterise the network capacity ofWCDMA-assisted 3G networks [395–397].The Timeslot (TS) opposing techniqueproposedby Haas, McLaughlin and Povey [32, 447] enables asynchronous cells to overlap without asignificant capacity degradation in comparison to the more idealistic scenario, when the basestations of all cells transmit and receive slot-synchronously in the UTRA-TDD system. Fur-thermore, the Dynamic Channel Allocation (DCA) [448] aidedTS-opposing algorithm [32]enables neighbouring cells to adopt different grades of uplink/downlink (UL/DL) asymmetrywithout inflicting a significant capacity loss. The co-existence of the UTRA-TDD and FDDmodes was studied in [449–451], since they are expected to co-exist in the same geographicalarea. Owing to the presence of increased levels of interference, capacity degradations are ex-pected. It is crucial to estimate this potential capacity degradation and to identify appropriatecountermeasures. Power control is a standard technique of improving the performance ofwireless systems. Different power control techniques and their application within the UMTSwere presented in [452–455]. More specifically, in [452], received signal level-based andinterference level-based power control algorithms were introduced and the achievable systemperformance was compared by means of simulations. In [453],the UTRA TDD mode wasstudied in conjunction with an open loop power control algorithm combined with outer looppower control functions, which resulted in an improved rateof successful call establishmentin the network. An Optimum Power Control (OPC) method was proposed in [454], whichachieved the same performance as Wu’s [456] at the cost of a lower complexity. Kurjen-niemi [455] studied uplink power control in the context of the UTRA TDD system by themeans of system level simulations, demonstrating that the UTRA TDD uplink power con-trol substantially benefited from exploiting accurate interference measurements and hence

7.5. SIMULATION RESULTS 409
achieved a high capacity, even in the presence of implementation errors. A pre-Rake smartantenna system designed for TDD CDMA was studied in [457]. The study demonstrated thatincorporating an antenna array at the base station significantly improves the achievable ca-pacity by reducing the interference between the uplink and downlink of adjacent cells, whichis a consequence of potentially using all timeslots in an arbitrary uncoordinated fashion bothin the UL and DL. Conventional single-user detectors, such as the Rake receiver are expectedto result in a low network capacity owing to the excessive TDD-induced Multiple AccessInterference . By contrast, Multi-User Detectors (MUD) have the potential of increasing thenetwork capacity at the cost of a higher complexity [93,405,458].
This section presents our simulation results obtained for aTDD mode UTRA-like CDMAcellular network, investigating the achievable user capacity of the TDD mode in both non-shadowed and shadowed propagation environments. This is inSection 7.5.2 followed byour performance investigations using adaptive antenna arrays, when subjected to both non-shadowed as well as shadowed propagation conditions. Finally, the performance of adaptivemodulation techniques used in conjunction with adaptive antenna arrays in shadow fadedenvironments is then characterised in Section 7.5.3.
7.5.1 Simulation Parameters [402]
In this section simulations were conducted for various scenarios and algorithms in the contextof a TDD mode UTRA-like CDMA based cellular network in order to study the interactionsof the processes involved in such a network. As in the UTRA standard, the frame lengthwas set to 10 ms, containing 15 power control timeslots. The power control target SINR waschosen to give a Bit Error Ratio (BER) of1 × 10−3, with a low quality outage occurring at aBER of5×10−3 and an outage taking place at a BER of1×10−2. The received SINRs at boththe mobile and the base stations were required for each of thepower control timeslots, andhence the outage and low quality outage statistics were gathered. If the received SINR wasfound to be below the outage SINR for 75 consecutive power control timeslots, correspondingto 5 consecutive transmission frames or 50 ms, the call was dropped. The post-despreadingSINRs necessary for obtaining the target BERs were determined with the aid of physical-layersimulations using a 4-QAM modulation scheme, in conjunction with 1/2 rate turbo codingand joint detection over a COST 207 seven-path Bad Urban channel [394]. For a spreadingfactor of 16, the post-de-spreading SINR required for maintaining BER of1 × 10−3 was 8.0dB, while for a BER of5× 10−3 it was 7.0 dB, and for a BER of1× 10−2 was about 6.6 dB.These values can be seen along with the other system parameters specified earlier in Table5.2. The pre-de-spreading SINR is related toEb/No and to the spreading factor by
SINR = (Eb/No)/SF, (7.1)
where the spreading factor is given bySF = W/R, with W being the chip rate andR thedata rate. A receiver noise figure of 7 dB was assumed for both the mobile and the basestations [59]. Thus, in conjunction with a thermal noise density of -174 dBm/Hz and a noisebandwidth of 5 MHz, this resulted in a receiver noise power of-100 dBm. The power controlalgorithm used was relatively simple, and unrelated to the previously introduced schemesof Section 7.3.3. Furthermore, since it allowed a full transmission power change of 15 dBwithin a 15-slot UTRA data frame, the power control scheme advocated is unlikely to limitthe network’s capacity.

410 CHAPTER 7. HSDPA-STYLE TDD/CDMA NETWORK PERFORMANCE
Specifically, for each of the 15 timeslots per transmitted frame, both the mobile and basestation transmit powers were adjusted such that the received SINR was higher than the targetSINR, but less than the target SINR plus a 1 dB hysteresis. Whenin handover, a mobile’stransmission power was only increased, if all of the base stations in the Active Base stationSet (ABS) requested a power increase, but was it decreased ifany of the base stations in theABS had an excessive received SINR. In the downlink, if the received SINR at the mobilewas insufficiently high, then all of the active base stationswere commanded to increase theirtransmission powers. Similarly, if the received SINR was unnecessarily high, then the ac-tive base stations would reduce their transmit powers. The downlink intra-cell interferenceorthogonality factorα, was set to 0.5 [395–397]. Due to using a frequency reuse factor ofone, with its associated low frequency reuse distance, it was necessary for both the mobilesand the base stations to increase their transmitted power gradually when initiating a new callor entering handover. This was required for preventing sudden increases in the level of inter-ference, particularly on links using the same base station.Hence, by gradually increasing thetransmit power to the desired level, the other users of the network were capable of compensat-ing for the increased interference by increasing their transmit powers, without encounteringundesirable outages. In an FDMA/TDMA network this effect isless noticeable due to thesignificantly higher frequency reuse distance.
Since a dropped call is less desirable from a user’s viewpoint than a blocked call, tworesource allocation queues were invoked, one for new calls and the other - higher priority -queue, for handovers. By forming a queue of the handover requests, which have a higherpriority during contention for network resources than new calls, it is possible to reduce thenumber of dropped calls at the expense of an increased blocked call probability. A furtheradvantage of the Handover Queueing System (HQS) is that during the time a handover is inthe queue, previously allocated resources may become available, hence increasing the proba-bility of a successful handover. However, in a CDMA based network the capacity is not hard-limited by the number of frequency/timeslot combinations available, like in a FDMA/TDMAbased network such as GSM. The main limiting factors are the number of available spreadingor OVSF codes, or the interference levels in conjunction with the restricted maximum trans-mit power, resulting in excessive forced termination rates. New call allocation requests werequeued for up to 5 seconds, if they could not be immediately satisfied, and were blocked ifthe request had not been completed successfully within the 5second.
There are several performance metrics that can be used for quantifying the quality ofservice provided by a cellular network. The following performance metrics have been widelyused in the literature and were also advocated by Chuanget al. [383]:
• New Call Blocking probability,PB ,
• Call Dropping or Forced Termination probability,PFT ,
• Probability of low quality connection,Plow,
• Probability of Outage,Pout,
• Grade Of Service,GOS.
The new call blocking probability,PB , is defined as the probability that a new call isdenied access to the network. In an FDMA/TDMA based network,such as GSM, this may

7.5. SIMULATION RESULTS 411
occur because there are no available physical channels at the desired base station or the avail-able channels are subject to excessive interference. However, in a CDMA based network thisdoes not occur, and hence the new call blocking performance is typically very high.
The forced termination probability,PFT , is the probability that a call is forced to ter-minate prematurely. In a GSM type network, an insufficientlyhigh SINR, which inevitablyleads to dropped calls, may be remedied by an intra- or inter-cell handover. However, inCDMA either the transmit power must be increased, or a soft handover must be performed inorder to exploit the available diversity gain.
Again, the probability of a low quality connection is definedas :
Plow = P{SINRuplink < SINRreq or SINRdownlink < SINRreq} (7.2)
= P{min(SINRuplink, SINRdownlink) < SINRreq}.
The GOS was defined in [383] as :
GOS = P{unsuccessful or low-quality call access} (7.3)
= P{call is blocked} + P{call is admitted} ×
P{low signal quality and call is admitted}
= PB + (1 − PB)Plow,
and is interpreted as the probability of unsuccessful network access (blocking), or low qualityaccess, when a call is admitted to the system. However, sincethe new call blocking probabil-ity of CDMA based networks is negligible, this metric has been omitted.
In our forthcoming investigations, in order to compare the network capacities of differentnetworks, it was decided to use two scenarios defined as :
• A conservative scenario, where the maximum acceptable value for the new call block-ing probability,PB , is 3%, the maximum forced termination probability,PFT , is 1%,andPlow is 1%.
• A lenient scenario, where the maximum acceptable value for the new call blockingprobability,PB , is 5%, the maximum forced termination probability,PFT , is 1%, andPlow is 2%.
In the next section we characterise the capacity of an adaptive modulation [13] assisted,beam-steering aided TDD/CDMA system. In TDD/CDMA the mobiles suffer from interfer-ence inflicted by the other mobile stations (MSs) both in the reference cell the MS is roamingin (intracell interference) as well as due to those in the neighbouring cells (intercell inter-ference). Furthermore, in contrast to FDD/CDMA, where the Base Stations (BSs) transmitin an orthogonal frequency band, in TDD/CDMA there is additional interference imposedby other BSs of the adjacent cells, since all times-slots canbe used in both the uplink anddownlink. In return for this disadvantage TDD/CDMA guarantees the flexible utilization ofall the available bandwidth, which meets the demand for the support of asymmetric uplinkand downlink services, such as high data rate file download inmobile Internet services, etc.In wireless systems the link quality fluctuates due to eitherfading- and dispersion-inducedchannel impairments or as a consequence of the time-variantco-channel interference imposedby the teletraffic fluctuations due to the varying number of users supported. Owing to these

412 CHAPTER 7. HSDPA-STYLE TDD/CDMA NETWORK PERFORMANCE
impairments conventional wireless systems often drop the call. By contrast, a particular ad-vantage of employing adaptive modulation is that the transceiver is capable of automaticallyreconfiguring itself in a more error-resilient transmission mode, instead of dropping the call.Here we study the achievable network performance by simulation and compare it to that ofthe FDD/UTRA system.
7.5.2 Performance of Adaptive Antenna Array AidedTDD CDMA Systems
In this section we study the impact of adaptive antenna arrays on the network’s performance.The investigations were conducted using a spreading factorof 16. Given that the chip rate ofUTRA is 3.84 Mchips/sec, this spreading factor correspondsto a channel data rate of3.84 ×106/16 = 240 kbps. Applying 1/2 rate error correction coding would result in an effectivedata throughput of 120 kbps, whereas utilizing a 2/3 rate error correction code would providea useful throughput of 160 kbps. A cell radius of 150 m was assumed, and a pedestrianwalking velocity of 3 mph was used.
The advanced UTRA FDD system level simulator [402] employing adaptive antenna ar-rays at the basestation as well as adaptive modulation [13] was extended to the UTRA TDDmode for evaluating the system’s achievable performance. We observed quite significantperformance gains as a direct result of the interference rejection capabilities of the adaptiveantenna arrays and adaptive modulation invoked. Network performance results were obtainedusing two and four element adaptive antenna arrays, both in the absence of shadow fading,and in the presence of 0.5 Hz and 1.0 Hz frequency shadow fading exhibiting a standarddeviation of 3 dB. The adaptive beamforming algorithm used was the Sample Matrix Inver-sion (SMI) algorithm [402]. The specific adaptive beamforming implementation used in ourTDD/CDMA based network was identical to that used in the network simulations of [402].Briefly [402], one of the eight possible 8-bit BPSK referencesignals was used for uniquelyand unambiguously identifying the desired user, while the remaining interfering users-up toseven of-them were assigned the other seven 8-bit referencesignals. The received signal’sautocorrelation matrix was then calculated, and from the knowledge of the desired user’s ref-erence signal the receiver’s optimal antenna array weightswere determined with the aid ofthe SMI algorithm. This implementation of the algorithm only calculated the receiver’s an-tenna array weights, namely the antenna array weights used by the base station for receivingthe mobiles’ uplink transmissions. However, it was demonstrated in [402] that further per-formance gains are attainable, if the BS’s UL and DL array patterns, namely the transmit andreceive beamforms are optimised individually. The antennaarray weights were re-calculatedfor every power control step, i.e. 15 times per UTRA data frame, owing to the potential sig-nificant changes in terms of the desired signal and interference powers that may occur duringone UTRA frame as a result of the maximum possible 15 dB changein the power transmittedby each user.
Figure 7.7 shows the forced termination probability associated with a variety of trafficloads without shadowing, measured in terms of the mean normalised carried traffic expressedin Erlangs/km2/MHz. The figure suggests that the TDD network’s performancewas poor incomparison to the FDD mode both with and without employing antenna arrays at the basestations. As expected, the “No beamforming” scenario suffered from the highest forced termi-nation probability of the three beamforming scenarios at a given traffic load, which was valid
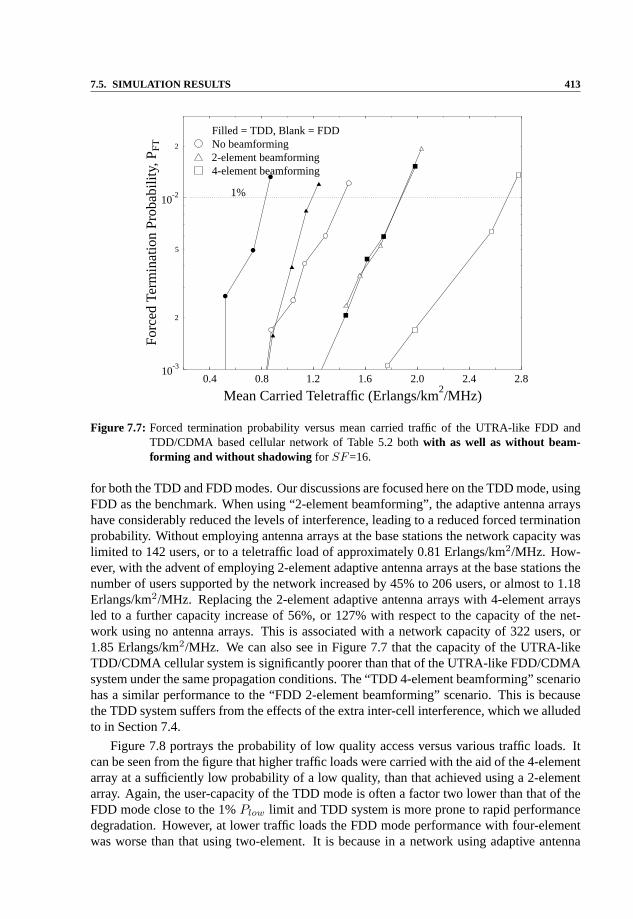
7.5. SIMULATION RESULTS 413
0.4 0.8 1.2 1.6 2.0 2.4 2.8
Mean Carried Teletraffic (Erlangs/km2/MHz)
10-3
2
5
10-2
2F
orce
dTe
rmin
atio
nP
roba
bilit
y,P FT
1%
4-element beamforming2-element beamformingNo beamformingFilled = TDD, Blank = FDD
Figure 7.7: Forced termination probability versus mean carried traffic of the UTRA-like FDD andTDD/CDMA based cellular network of Table 5.2 bothwith as well as without beam-forming and without shadowing for SF=16.
for both the TDD and FDD modes. Our discussions are focused here on the TDD mode, usingFDD as the benchmark. When using “2-element beamforming”, the adaptive antenna arrayshave considerably reduced the levels of interference, leading to a reduced forced terminationprobability. Without employing antenna arrays at the base stations the network capacity waslimited to 142 users, or to a teletraffic load of approximately 0.81 Erlangs/km2/MHz. How-ever, with the advent of employing 2-element adaptive antenna arrays at the base stations thenumber of users supported by the network increased by 45% to 206 users, or almost to 1.18Erlangs/km2/MHz. Replacing the 2-element adaptive antenna arrays with4-element arraysled to a further capacity increase of 56%, or 127% with respect to the capacity of the net-work using no antenna arrays. This is associated with a network capacity of 322 users, or1.85 Erlangs/km2/MHz. We can also see in Figure 7.7 that the capacity of the UTRA-likeTDD/CDMA cellular system is significantly poorer than that of the UTRA-like FDD/CDMAsystem under the same propagation conditions. The “TDD 4-element beamforming” scenariohas a similar performance to the “FDD 2-element beamforming” scenario. This is becausethe TDD system suffers from the effects of the extra inter-cell interference, which we alludedto in Section 7.4.
Figure 7.8 portrays the probability of low quality access versus various traffic loads. Itcan be seen from the figure that higher traffic loads were carried with the aid of the 4-elementarray at a sufficiently low probability of a low quality, thanthat achieved using a 2-elementarray. Again, the user-capacity of the TDD mode is often a factor two lower than that of theFDD mode close to the 1%Plow limit and TDD system is more prone to rapid performancedegradation. However, at lower traffic loads the FDD mode performance with four-elementwas worse than that using two-element. It is because in a network using adaptive antenna
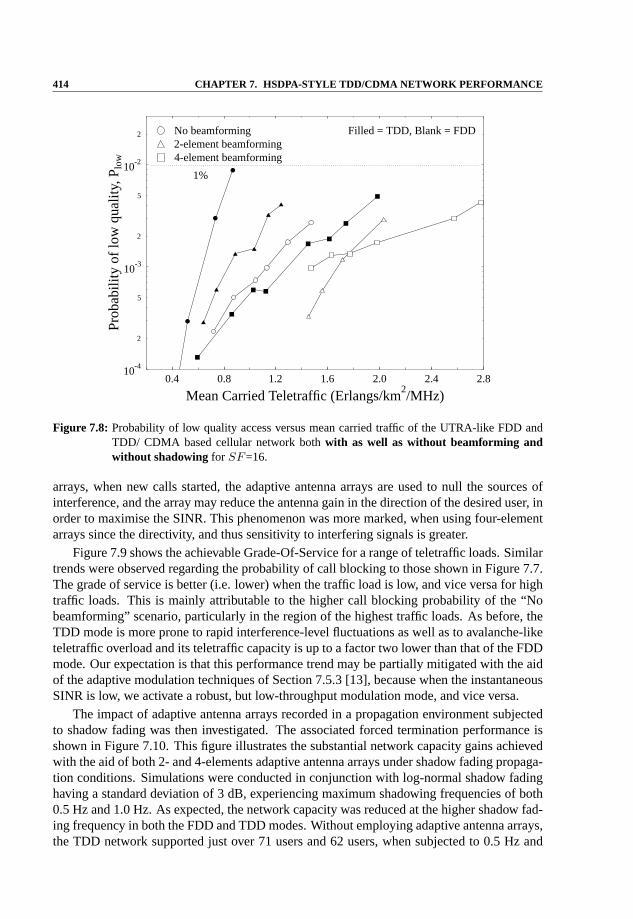
414 CHAPTER 7. HSDPA-STYLE TDD/CDMA NETWORK PERFORMANCE
0.4 0.8 1.2 1.6 2.0 2.4 2.8
Mean Carried Teletraffic (Erlangs/km2/MHz)
10-4
2
5
10-3
2
5
10-2
2
Pro
babi
lity
oflo
wqu
ality
,Plo
w
1%
4-element beamforming2-element beamformingNo beamforming Filled = TDD, Blank = FDD
Figure 7.8: Probability of low quality access versus mean carried traffic of the UTRA-like FDD andTDD/ CDMA based cellular network bothwith as well as without beamforming andwithout shadowing for SF=16.
arrays, when new calls started, the adaptive antenna arraysare used to null the sources ofinterference, and the array may reduce the antenna gain in the direction of the desired user, inorder to maximise the SINR. This phenomenon was more marked,when using four-elementarrays since the directivity, and thus sensitivity to interfering signals is greater.
Figure 7.9 shows the achievable Grade-Of-Service for a range of teletraffic loads. Similartrends were observed regarding the probability of call blocking to those shown in Figure 7.7.The grade of service is better (i.e. lower) when the traffic load is low, and vice versa for hightraffic loads. This is mainly attributable to the higher callblocking probability of the “Nobeamforming” scenario, particularly in the region of the highest traffic loads. As before, theTDD mode is more prone to rapid interference-level fluctuations as well as to avalanche-liketeletraffic overload and its teletraffic capacity is up to a factor two lower than that of the FDDmode. Our expectation is that this performance trend may be partially mitigated with the aidof the adaptive modulation techniques of Section 7.5.3 [13], because when the instantaneousSINR is low, we activate a robust, but low-throughput modulation mode, and vice versa.
The impact of adaptive antenna arrays recorded in a propagation environment subjectedto shadow fading was then investigated. The associated forced termination performance isshown in Figure 7.10. This figure illustrates the substantial network capacity gains achievedwith the aid of both 2- and 4-elements adaptive antenna arrays under shadow fading propaga-tion conditions. Simulations were conducted in conjunction with log-normal shadow fadinghaving a standard deviation of 3 dB, experiencing maximum shadowing frequencies of both0.5 Hz and 1.0 Hz. As expected, the network capacity was reduced at the higher shadow fad-ing frequency in both the FDD and TDD modes. Without employing adaptive antenna arrays,the TDD network supported just over 71 users and 62 users, when subjected to 0.5 Hz and

7.5. SIMULATION RESULTS 415
0.4 0.8 1.2 1.6 2.0 2.4 2.8
Mean Carried Teletraffic (Erlangs/km2/MHz)
10-4
2
5
10-3
2
5
10-2
2
5
10-1
Gra
deof
Ser
vice
(GO
S)
1%
4-element beamforming2-element beamformingNo beamformingFilled = TDD, Blank = FDD
Figure 7.9: Grade-Of-Service (GOS) versus mean carried traffic of the UTRA-like FDD andTDD/CDMA based cellular network bothwith as well as without beamforming andwithout shadowing for SF=16.
0.0 0.5 1.0 1.5 2.0
Mean Carried Teletraffic (Erlangs/km2/MHz)
10-3
2
5
10-2
2
For
ced
Term
inat
ion
Pro
babi
lity,
P FT
1%
4-element beamforming2-element beamformingNo beamforming
1.0Hz, 3dB shadowing0.5Hz, 3dB shadowingBlank = FDDFilled = TDD
Figure 7.10: Forced termination probability versus mean carried traffic of the UTRA-like FDD andTDD/CDMA based cellular network bothwith as well as without beamforming andwith shadowing for SF=16.

416 CHAPTER 7. HSDPA-STYLE TDD/CDMA NETWORK PERFORMANCE
1.0 Hz frequency shadow fading, respectively. With the application of 2-element adaptiveantenna arrays, these capacities increased by 111% and 113%, to 151 users and 131 users,respectively. The employment of 4-element adaptive antenna arrays led to a TDD networkcapacity of 245 users at a 0.5 Hz shadowing frequency, and 234users at a 1.0 Hz shadowingfrequency. This corresponded to relative gains of 62% and 78% over the capacity providedin the TDD mode with the aid of two-element adaptive antenna arrays. In comparison to theFDD benchmark we have recorded again up to a factor two lower teletraffic capacity.
The probability of low quality access performance is depicted in Figure 7.11. As ex-pected, a givenPlow value was associated with a higher traffic load, as the numberof antennaelements increased. When the maximum shadow fading frequency was increased from 0.5 Hzto 1.0 Hz,Plow also increased. The probability of low quality seen in Figure 7.11 is similarin the scenarios employing adaptive antenna arrays in the UTRA TDD and FDD CDMA sys-tems. It should be noted, however that the probability of lowquality access always remainedbelow the 1% constraint of the conservative scenario under the scenarios studied, and theforced termination probability was considerably reduced by the adaptive antenna arrays, asit will demonstrated during our later discussion in the context of Figure 7.13. When usingbeamforming, the inferiority of the TDD mode was less pronounced than in the context ofthe previously studied performance metrics.
Figure 7.12 presents the Grade-Of-Service (GOS) for a rangeof teletraffice loads withand without beamforming as well as in conjunction with shadowing. A summary of themaximum network capacities of the various scenarios considered in this section both withand without shadowing having a standard deviation of 3dB, aswell as with and withoutemploying beamforming using two and four element arrays is given in Table 7.1. Throughoutthis section we have observed that the capacity of the TDD mode was consistently lower thanthat of the FDD mode owing to the fact that any timeslot may be used both in the uplinkand in the downlink. In the next section we will invoke adaptive modulation as a furthercountermeasure for mitigating this deficiency.
7.5.3 Performance of Adaptive Antenna Array and AdaptiveModulation Aided TDD HSDPA-Style Systems
In this section we build upon the results presented in the previous section by applying Adap-tive Quadrature Amplitude Modulation (AQAM) techniques [13]. The various scenarios andchannel conditions to be investigated here were identical to those of the previous section,except for the application of AQAM. Since in the previous section an increased networkcapacity was achieved due to using independent up- and down-link beamforming, this pro-cedure was invoked in these simulations. AQAM involves the selection of the appropriatemodulation mode in order to maximise the achievable data throughput over a given channel,whilst maintaining a given target the Bit Error Ratio. More explicitly, the philosophy be-hind adaptive modulation is the most appropriate selectionof a modulation mode accordingto the instantaneous radio channel quality experienced [13]. Therefore, if the SINR of thechannel is high, then a high-throughput high-order modulation mode may be employed forexploiting the high instantaneous quality of the radio channel. Similarly, if the channel isinstantaneously of low quality, exhibiting a low SINR, a high-order modulation mode wouldresult in an unacceptably high BER or FER, and hence a more robust, but lower throughputmodulation mode would be employed. Therefore, adaptive modulation combats the effects of

7.5. SIMULATION RESULTS 417
0.0 0.5 1.0 1.5 2.0
Mean Carried Teletraffic (Erlangs/km2/MHz)
10-4
2
5
10-3
2
5
10-2
2
Pro
babi
lity
oflo
wqu
ality
acce
ss,P lo
w
1%
4-element beamforming2-element beamformingNo beamforming
1.0Hz, 3dB shadowing0.5Hz, 3dB shadowingFilled = TDD, Blank = FDD
Figure 7.11: Probability of low quality access versus mean carried traffic of the UTRA-like FDD andTDD/CDMA based cellular network bothwith as well as without beamforming andwith shadowing for SF=16.
0.0 0.5 1.0 1.5 2.0
Mean Carried Teletraffic (Erlangs/km2/MHz)
10-4
2
5
10-3
2
5
10-2
2
Gra
deof
Ser
vice
(GO
S)
1%
4-element beamforming2-element beamformingNo beamforming
1.0Hz, 3dB shadowing0.5Hz, 3dB shadowingBlank = FDDFilled = TDD
Figure 7.12: Grade-Of-Service (GOS) versus mean carried traffic of the UTRA-like FDD andTDD/CDMA based cellular network bothwith as well as without beamforming andwithout shadowing for SF=16.

418 CHAPTER 7. HSDPA-STYLE TDD/CDMA NETWORK PERFORMANCE
Conservative scenarioNumber of Users Traffic (Erlangs/km2/MHz
Shadowing Beamforming FDD TDD FDD TDD
No No 256 142 1.42 0.81No 2 elements 325 206 1.87 1.18No 4 elements 480 322 2.75 1.85
0.5 Hz, 3 dB No 150 72 0.87 0.410.5 Hz, 3 dB 2 elements 203 151 1.16 0.870.5 Hz, 3 dB 4 elements 349 245 2.0 1.39
1.0 Hz, 3 dB No 144 62 0.82 0.351.0 Hz, 3 dB 2 elements 201 131 1.12 0.751.0 Hz, 3 dB 4 elements 333 234 1.88 1.33
Table 7.1: Maximum mean carried traffic and maximum number of mobile users that can be supportedby the FDD/TDD network, whilst meeting the conservative quality constraints. The car-ried traffic is expressed in terms of normalised Erlangs (Erlang/km2/MHz), for the networkdescribed in Table 5.2 bothwith and without beamforming, and also with and withoutshadow fading having a standard deviation of 3 dBfor SF=16. The FDD benchmarkresults were adopted from [402].
time-variant channel quality, while also attempting to maximise the achieved data throughput,and maintaining a given BER or FER. In the investigations conducted, the modulation modesof the up and downlink were determined independently, thus taking advantage of the lowerlevels of co-channel interference on the uplink, or of the potentially higher transmit powerof the base stations.The particular implementation of AQAMused in these investigations isillustrated in [402].
Comparison Figure 7.13 to Figure 7.10 shows the significant reduction in the probabil-ity of a dropped TDD call, achieved by employing adaptive antenna arrays in conjunctionwith adaptive modulation [402, 405] in a log-normal shadow faded environment. The fig-ure demonstrates that even with the aid of a two-element adaptive antenna array, a sub-stantial forced termination probability reduction was achieved. The single-antenna basedTDD network was found to support 153 users, corresponding toa traffic load of 0.875Erlang/km2/MHz, when subjected to 0.5 Hz frequency shadow fading. The capacity of thesingle-antenna aided TDD network was slightly reduced to 152 users, corresponding to 0.874Erlang/km2/MHz, when increasing the maximum shadow fading frequency to 1.0 Hz. Uponemploying two-element adaptive antenna arrays, the TDD network capacity increased by109% to 320 users, or to an equivalent traffic load of 1.834 Erlang/km2/MHz, when sub-jected to 0.5 Hz frequency shadow fading. When the maximum shadow fading frequencywas increased to 1.0 Hz, the number of users supported by the TDD network was 307, or1.82 Erlang/km2/MHz, representing an increase of 102% in comparison to the network re-fraining from using adaptive antenna arrays. It is seen in Figure 7.13 that the forced termina-tion probability of the UTRA-like TDD/CDMA scenarios is close to that of the FDD/CDMAscenarios, when employing adaptive antenna arrays in conjunction with adaptive modulation.
The probability of low quality outage, presented in Figure 7.14, did not benefit from

7.5. SIMULATION RESULTS 419
0.5 1.0 1.5 2.0 2.5
Mean Carried Teletraffic (Erlangs/km2/MHz)
10-3
2
5
10-2
2F
orce
dTe
rmin
atio
nP
roba
bilit
y,P FT
1%
2 element
4 element
4-element beamforming Filled2-element beamforming BlankNo beamforming
1.0Hz, 3dB shadowing0.5Hz, 3dB shadowingFilled = TDD, Blank = FDD
Figure 7.13: Forced termination probability versus mean carried traffic of the UTRA-like FDD andTDD/CDMA based cellular network bothwith and without beamforming in conjunc-tion with AQAM as well as with shadowing having a standard deviation of3 dB forSF=16.
the application of adaptive antenna arrays, in fact on the contrary. Furthermore, recall thatFigure 7.11 depicted the probability of low quality outage without adaptive modulation, i.e.using fixed modulation, and upon comparing these results to those obtained in conjunctionwith adaptive modulation shown in Figure 7.14, the performance degradation owing to theemployment of adaptive modulation can be explicitly seen. This is because the increasein the probability of low quality access can be attributed tothe employment of less robust,but higher throughput, higher-order modulation modes invoked by the adaptive modulationscheme. Hence, under given propagation conditions and using the interference-resilient fixed4-QAM modulation mode, as in Figure 7.11, a low quality outage may not occur. By contrast,when using adaptive modulation invoking a less resilient, but higher-throughput and higher-order modulation mode, the same propagation conditions mayinflict a low quality outage.
A summary of the maximum user capacities of the FDD and TDD networks consideredin this section both with and without shadowing having a standard deviation of 3dB as wellas with and without employing beamforming using two and fourelement arrays, whilst em-ploying adaptive modulation is given in Table 7.2.

420 CHAPTER 7. HSDPA-STYLE TDD/CDMA NETWORK PERFORMANCE
0.5 1.0 1.5 2.0 2.5
Mean Carried Teletraffic (Erlangs/km2/MHz)
10-4
2
5
10-3
2
5
10-2
2
Pro
babi
lity
oflo
wqu
ality
acce
ss,P lo
w
1%
2 element
4 element
1.0Hz, 3dB shadowing0.5Hz, 3dB shadowing4-element beamforming Filled2-element beamforming BlankNo beamformingFilled = TDD, Blank = FDD
Figure 7.14: Probability of low quality access versus mean carried traffic of the UTRA-like FDD andTDD/CDMA based cellular network bothwith and without beamforming in conjunc-tion with AQAM as well as with shadowing having a standard deviation of3dB forSF=16.
0.5 1.0 1.5 2.0 2.5
Mean Carried Teletraffic (Erlangs/km2/MHz)
10-4
2
5
10-3
2
5
10-2
2
Gra
deof
Ser
vice
(GO
S) 1%4-element beamforming
2-element beamformingNo beamforming
1.0Hz, 3dB shadowing0.5Hz, 3dB shadowingFilled = TDD, Blank = FDD
Figure 7.15: Grade-Of-Service (GOS) versus mean carried traffic of the UTRA-like FDD andTDD/CDMA based cellular network bothwith and without beamforming in conjunc-tion with AQAM as well as with shadowing having a standard deviation of3dB forSF=16.

7.6. LS CODE AIDED NETWORK PERFORMANCE OF UTRA-LIKE TDD/CDMA 421
Conservative scenarioNumber of Users Traffic (Erlangs/km2/MHz
Shadowing Beamforming FDD TDD FDD TDD
0.5 Hz, 3 dB No 223 153 1.27 0.8750.5 Hz, 3 dB 2 elements 366 320 2.11 1.8340.5 Hz, 3 dB 4 elements 476 420 2.68 2.41
1.0 Hz, 3 dB No 218 152 1.24 0.8741.0 Hz, 3 dB 2 elements 341 307 1.98 1.7581.0 Hz, 3 dB 4 elements 460 393 2.59 2.234
Table 7.2: Maximum mean carried traffic and maximum number of mobile users that can be supportedby the FDD and TDD network, whilst meeting the conservative quality constraints. Thecarried traffic is expressed in terms of normalised Erlangs (Erlang/km2/MHz), for the net-work described in Table 5.2 bothwith and without beamforming, in conjunction withshadow fading having a standard deviation of 3 dB, whilst employing adaptive modu-lation techniquesfor SF=16. The FDD benchmark results were adopted from [402].
7.6 Loosely Synchronized Spreading Code Aided NetworkPerformance of UTRA-like TDD/CDMA Systems
7.6.1 Introduction
In this section we investigate the achievable capacity of a UTRA-like TDD/CDMA systememploying Loosely Synchronized (LS) spreading codes. The family of operational CDMAsystems is interference limited, suffering from Inter-Symbol-Interference, since the orthog-onality of the spreading sequences is destroyed by the frequency selective channel. Theyalso suffer from Multiple-Access-Interference owing to the non-zero cross-correlations of thespreading codes. By contrast, the family of LS codes exhibits a so-called Interference FreeWindow (IFW), where both the auto-correlation and cross-correlation values of the codesbecome zero. Therefore LS codes have the promise of mitigating the effects of both ISIand MAI in time dispersive channels. Hence, LS codes have thepotential of increasing thecapacity of CDMA networks. This section studies the achievable network performance incomparison to that of a UTRA-like TDD/CDMA system using Orthogonal Variable Spread-ing Factor (OVSF) codes.
The air interface of UMTS supports both FDD and TDD mode [402], in order to facilitatean efficient exploitation of the paired and unpaired band of the allocated spectrum. The FDDmode is intended for applications in both macro- and micro-cellular environments, whensupporting both medium data rates and high mobility. In contrast to the FDD mode, the TDDmode was contrived for environments associated with a high traffic density and asymmetricuplink as well as downlink indoor coverage. Although the UTRA/TDD mode was contrivedfor the sake of improving the achievable network performance by assigning all the timeslotson a demand basis to the uplink and downlink [422], this measure may result in an excessiveBS → BS interference and hence in a potentially reduced number of system users [459,460]. As seen in Figure 7.6, ifBS1 is transmitting andBS2 is receiving at the same timein a given timeslot,BS → BS interference takes place, provided that these base stations

422 CHAPTER 7. HSDPA-STYLE TDD/CDMA NETWORK PERFORMANCE
are in adjacent cells. In [459] we demonstrated that the employment of adaptive arrays inconjunction with AQAM limited the detrimental effects of co-channel interference on theUTRA-like TDD/CDMA system and resulted in performance improvements both in termsof the achievable call quality and the number of users supported. However, in comparisonto a UTRA-like FDD/CDMA system, the capacity of the UTRA-like TDD/CDMA cellularsystem was shown to remain somewhat poorer than that of the UTRA-like FDD/CDMAsystem under the same propagation conditions.
The network performance of the UTRA-like FDD/CDMA systems was quantified inour previous research [413], when supported by adaptive beam-steering [405] and LS [407]spreading codes. It was demonstrated that the network performance of a UTRA-like FDD/CDMAsystem employing LS spreading codes was substantially better than that of the system usingOVSF codes [406]. We consider the employment of this specificfamily of LS spreadingcodes in the UTRA-like TDD/CDMA system. The LS spreading codes exhibit a so-calledInterference Free Window (IFW), where the off-peak aperiodic autocorrelation values as wellas the aperiodic cross-correlation values become zero. With the advent of the IFW we mayencounter both zero ISI and zero MAI, provided that all the delayed asynchronous trans-missions arrive within the IFW. More specifically, interference-free CDMA communicationsbecome possible, when the total time offset expressed in terms of the number of chip inter-vals, which is the sum of the time-offset of the mobiles plus the maximum channel-induceddelay spread is within the code’s IFW [408]. By employing this specific family of codes, weare capable of reducing the ISI and MAI, since users in the same cell do not interference witheach other, as a benefit of the IFW provided by the LS codes used.
7.6.2 LS Codes in UTRA TDD/CDMA
There exists a specific family of LS codes [407], which exhibits an IFW, where both the auto-correlation and cross-correlation values of the codes become zero. Specifically, LS codesexploit the properties of the so-called orthogonal complementary sets [407, 417]. An exam-ple of the design of LS spreading codes can be found in [413]. In the UTRA TDD mode, theuplink and downlink timeslots are transmitted on the same carrier frequency, which createsadditional undesirable and grave interference infested scenarios compared to UTRA FDD.More explicitly, as argued in the context of Figure 7.6, bothtransmission directions mayinterfere with each other, resulting in MS→ MS and BS→ BS interference, respectively.The interference experienced at the mobile may be divided into two categories. Firstly, in-terference is imposed by the signals transmitted to other mobiles from the same base station,which is known as intra-cell interference. Secondly, interference is encountered owing to thesignals transmitted to other mobiles from other basestations, as well as to other basestationsfrom other mobiles, which is termed inter-cell interference.
The instantaneous SINR is obtained upon dividing the received signal powers by the totalinterference plus thermal noise power, and then by multiplying this ratio by the spreadingfactor,SF , yielding [402]
SINRDL =SF · PBS
(1 − α)IIntra + IInter + N0
, (7.4)
whereα = 1 corresponds to the ideal case of perfectly orthogonal intra-cell interference andα = 0 to completely asynchronous intra-cell interference. Furthermore,PBS is the signal

7.6. LS CODE AIDED NETWORK PERFORMANCE OF UTRA-LIKE TDD/CDMA 423
Parameter Value Parameter ValueNoisefloor -100dBm Pilot power -9dBmFrame length 10ms Cell radius 78mMultiple access TDD/CDMA Number of basestations 49Modulation scheme 4QAM/QPSK Spreading factor 16Min BS transmit power -48dBm Min MS transmit power -48dBmMax BS transmit power 17dBm Max MS transmit power 17dBmLow quality access SINR 5.2dB Outage (1% BER) SINR 4.8dBPathloss exponent -2.0 Target SINR 6.2dBAverage inter-call-time 300s Max. new-call queue-time 5sAverage call length 60s Pedestrian speed 3mphMax consecutive outages 5 Signal bandwidth 5MHz
Table 7.3: Simulation parameters [413].
power received by the mobile user from the base station,N0 is the thermal noise,IIntra isthe intra-cell interference andIInter is the inter-cell interference. Again, the interferenceplus noise power is scaled by the spreading factor,SF , since during the despreading pro-cess the associated low-pass filtering reduces the noise bandwidth by a factor ofSF . Theinter-cell interference is not only due to the MSs, but also due to the BSs illuminating theadjacent cells by co-channel signals. Owing to invoking LS spreading codes in our UTRA-like TDD/CDMA system, the intra-cell interference may be completely eliminated, hencewe haveα = 1. Our current research is building on our previous findings recorded in thecontext of a UTRA-like TDD system [459], where we found that invoking adaptive mod-ulation as well as beam-steering proved to be a powerful means of enhancing the capacityof TDD/CDMA. In the investigations of [459], OVSF codes wereused as spreading codes.However, the intra-cell interference is only eliminated byemploying orthogonal OVSF codes,if the system is perfectly synchronous and provided that themobile channel does not destroythe OVSF codes’ orthogonality. In an effort to prevent intra-cell interference, again, in thissection we employ LS codes, which exhibit ideal auto-correlation and cross-correlation func-tions within the IFW. Thereby, the “near far effect” may be significantly reduced and hencethe user capacity of the system can be substantially enhanced. As a benefit of the LS codes’interference resilience, it was shown in [413] that the achievable BER performance of LScodes is better than that of OVSF codes. For a spreading factor of 16, the post-despreadingSINR required for maintaining a BER of1 × 10−3 was 6.2 dB in case of LS codes, which isalmost 2 dB lower than that necessitated by the OVSF codes.
7.6.3 System Parameters
The cell-radius was 78 m, which was the maximum affordable cell radius for the IFW du-ration of ±1 chip intervals at a chip rate of 3.84 Mchip/s. The mobiles were capable ofmoving freely, at a speed of 3mph, in random directions, selected at the start of the simu-lation from a uniform distribution, within the infinite simulation area of 49 wrapped-aroundtraffic cells [402]. Furthermore, the post-despreading SINRs required for obtaining the target
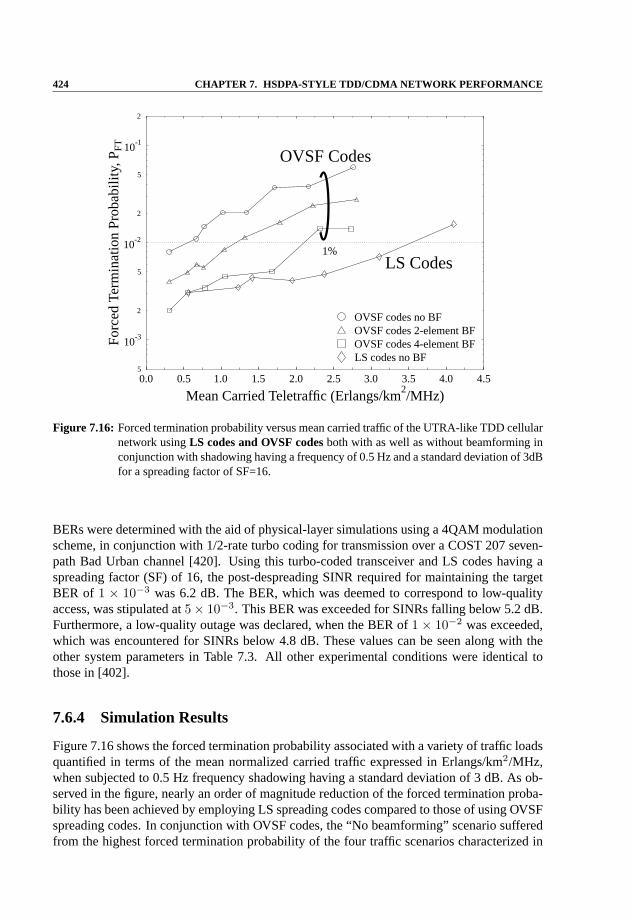
424 CHAPTER 7. HSDPA-STYLE TDD/CDMA NETWORK PERFORMANCE
0.0 0.5 1.0 1.5 2.0 2.5 3.0 3.5 4.0 4.5
Mean Carried Teletraffic (Erlangs/km2/MHz)
5
10-3
2
5
10-2
2
5
10-1
2F
orce
dTe
rmin
atio
nP
roba
bilit
y,P FT
OVSF Codes
LS Codes1%
LS codes no BFOVSF codes 4-element BFOVSF codes 2-element BFOVSF codes no BF
Figure 7.16: Forced termination probability versus mean carried traffic of the UTRA-like TDD cellularnetwork usingLS codes and OVSF codesboth with as well as without beamforming inconjunction with shadowing having a frequency of 0.5 Hz and a standarddeviation of 3dBfor a spreading factor of SF=16.
BERs were determined with the aid of physical-layer simulations using a 4QAM modulationscheme, in conjunction with 1/2-rate turbo coding for transmission over a COST 207 seven-path Bad Urban channel [420]. Using this turbo-coded transceiver and LS codes having aspreading factor (SF) of 16, the post-despreading SINR required for maintaining the targetBER of 1 × 10⁻³ was 6.2 dB. The BER, which was deemed to correspond to low-qualityaccess, was stipulated at5 × 10−3. This BER was exceeded for SINRs falling below 5.2 dB.Furthermore, a low-quality outage was declared, when the BER of 1 × 10⁻² was exceeded,which was encountered for SINRs below 4.8 dB. These values can be seen along with theother system parameters in Table 7.3. All other experimental conditions were identical tothose in [402].
7.6.4 Simulation Results
Figure 7.16 shows the forced termination probability associated with a variety of traffic loadsquantified in terms of the mean normalized carried traffic expressed in Erlangs/km2/MHz,when subjected to 0.5 Hz frequency shadowing having a standard deviation of 3 dB. As ob-served in the figure, nearly an order of magnitude reduction of the forced termination proba-bility has been achieved by employing LS spreading codes compared to those of using OVSFspreading codes. In conjunction with OVSF codes, the “No beamforming” scenario sufferedfrom the highest forced termination probability of the fourtraffic scenarios characterized in

7.6. LS CODE AIDED NETWORK PERFORMANCE OF UTRA-LIKE TDD/CDMA 425
0.0 0.5 1.0 1.5 2.0 2.5 3.0 3.5 4.0 4.5
Mean Carried Teletraffic (Erlangs/km2/MHz)
2
5
10-4
2
5
10-3
2
5
10-2
2
5
Pro
babi
lity
ofLo
wQ
ualit
yA
cces
s,P low
OVSF Codes
LS Codes
1%
LS codes no BFOVSF codes 4-element BFOVSF codes 2-element BFOVSF codes no BF
Figure 7.17: Probability of low quality access versus number of users of the UTRA-likeTDD cellularnetwork usingLS codes and OVSF codesboth with as well as without beamforming inconjunction with shadowing having a frequency of 0.5 and a standard deviation of 3dBfor a spreading factor of SF=16.
the figure at a given load. Specifically, the network capacitywas limited to 50 users, or toa teletraffic density of approximately 0.55 Erlangs/km2/MHz. With the advent of employing4-element adaptive antenna arrays at the base stations the number of users supported by theTDD system increased to 178 users, or a teletraffic density of2.03 Erlangs/km2/MHz. How-ever, in conjunction with LS codes, and even without employing antenna arrays at the basestations, the TDD system was capable of supporting 306 users, or an equivalent traffic densityof 3.45 Erlangs/km2/MHz.
Figure 7.17 portrays the probability of low quality access versus various traffic loads. Inconjunction with OVSF codes, it can be seen from the figure that without beamforming thesystem suffered from encountering more multiuser interference, as the traffic loads increased.Hence the probability of low quality access became higher. When invoking beamforming,both the intra- and inter-cell interference was reduced andhence the probability of low qualityaccess was reduced as well. As a benefit of employing LS codes,the intra-cell interferencewas efficiently reduced and therefore the probability of lowquality access was found to belower even without beamforming, than that of the system using OVSF codes and employing2-element beamforming. We also observed that at lower traffic loads the probability of lowquality access for the “LS codes no BF” scheme is higher than that of “OVSF codes 4-element BF” scheme. This is a consequence of the associated high probability of forcedtermination for the “LS codes no BF” scheme, as shown in Figure 7.16, because the higherthe probability of forced termination, the lower the numberof users supported by the TDD

426 CHAPTER 7. HSDPA-STYLE TDD/CDMA NETWORK PERFORMANCE
0.0 0.5 1.0 1.5 2.0 2.5 3.0 3.5 4.0 4.5
Mean Carried Teletraffic (Erlangs/km2/MHz)
-10
-5
0
5
10
15M
ean
Tra
nsm
issi
onP
ower
(dB
m)
OVSF Codes
LS Codes
LS codes no BFOVSF codes 4-element BFOVSF codes 2-element BFOVSF codes no BFFilled = Downlink, Blank = Uplink
Figure 7.18: Mean transmission power versus number of users of the UTRA-like TDDcellular networkusingLS codes and OVSF codesboth with as well as without beamforming in conjunc-tion with shadowing having a frequency of 0.5 Hz and a standard deviationof 3dB for aspreading factor of SF=16.
system and hence the effects of co-channel interference imposed by the existing connectionsremain more benign when a new call starts.
Traffic (Erlangs Power (dBm)Spreading Code Beamforming Users /km2/MHz) MS BS
OVSF codes No 50 0.55 0.54 -0.28OVSF codes 2-elements 113 1.18 1.33 0.90OVSF codes 4-elements 178 2.03 2.07 1.81LS codes No 306 3.45 -9.11 -9.21
Table 7.4: Maximum mean carried traffic and maximum number of mobile users that can be supportedby the network, whilst meeting the network quality constraints of Section 7.6.3, namelyPB ≤ 3%, PFT ≤ 1%, Plow ≤ 1% and GOS≤ 4%. The carried traffic is expressedin terms of normalized Erlangs (Erlang/km2/MHz) using OVSF codes and LS codesinconjunction with shadow fading having a standard deviation of 3 dB and a frequency of 0.5Hz for a spreading factor of SF=16.
For the sake of characterizing the achievable system performance also from a differentperspective, the mean transmission power versus teletraffic performance is depicted in Fig-ure 7.18. Again, as a benefit of employing LS codes, both the required mean uplink and

7.6. LS CODE AIDED NETWORK PERFORMANCE OF UTRA-LIKE TDD/CDMA 427
downlink transmission power are lower than that necessitated by OVSF codes. The TDDsystem using OVSF codes required an average 10 dBm to 20 dBm more signal power com-pared to the TDD system using LS codes. In [460] it was shown that the major source ofinterference is constituted by the BS-to-BS interference as a consequence of the BS’s highsignal power and the near-LOS propagation conditions prevailing between BSs. Even thoughthe employment of LS codes can only reduce the intra-cell interference, it results in a sub-stantial reduction of the BSs’ power consumption, as shown in Figure 7.18. Hence the sourceof BS → BS inter-cell interference was also reduced. In other words, the employment ofLS codes indirectly reduced the severeBS → BS inter-cell interference by keeping the BSs’transmission power at a low level.
Figure 7.19 shows the achievable Grade-Of-Service for a range of teletraffic loads. Weobserve similar trends regarding the probability of low quality access, as shown in Fig-ure 7.17. In Equation 4.15, the GOS performance is jointly determined byPB andPlow,which is interpreted as the probability of unsuccessful network access (blocking), or theprobability of encountering a low quality, provided that a call is admitted to the system. Theemployment of the LS codes may cause the shortage of spreading codes and hence may leadto the blocking of a new call, since there are only 8 LS codes that can be used, when the IFWduration is±1 chip-length. The call duration and inter-call periods werePoisson distributedhaving the mean values shown in Table 7.3. When encountering this call arrival distribution,we observe that the new call blocking probability is negligible, as shown in Figures 7.17and 7.19.
A summary of the maximum user capacities of the UTRA-like TDD/CDMA system usingOVSF codes and LS codes in conjunction with log-normal shadowing having a standarddeviation of 3dB and a shadowing frequency of 0.5 Hz as well asboth with and withoutbeamforming is given in Table 7.4. The teletraffic carried and the mean mobile and basestation transmission powers required are also shown in Table 7.4.
7.6.5 Summary and Conclusions
In this section we studied the network performance of a UTRA-like TDD/CDMA system em-ploying LS spreading codes. The computer simulation results provided showed that the TDDsystem invoking LS codes had a better performance compared to the system using OVSFcodes. We designed a 49-cell “wrapped around” simulation area, constituted by sufficientlysmall 78 m radius cells, which guaranteed that the delayed asynchronous transmissions arrivewithin the IFW, where the auto-correlation and cross-correlation values of the LS codes be-came zero and hence eliminated the effects of intra-cell interference. The SINR required bythe LS codes for the sake of maintaining a BER of1× 10−3 was almost 2 dB lower than thatnecessitated by the OVSF codes. Furthermore, a low mobile and base station transmissionpower has been maintained. Hence the average intra- and inter-cell interference level hasbecome low, the severeBS → BS interference has been reduced and this resulted in TDDsystem performance improvements both in terms of the achievable call quality and the num-ber of users supported. Our future research is focussed on further improving the performanceof TDD systems using genetic algorithm based timeslot scheduling.

428 CHAPTER 7. HSDPA-STYLE TDD/CDMA NETWORK PERFORMANCE
0.0 0.5 1.0 1.5 2.0 2.5 3.0 3.5 4.0 4.5
Mean Carried Teletraffic (Erlangs/km2/MHz)
2
5
10-4
2
5
10-3
2
5
10-2
2
5
Gra
deof
Ser
vide
,(G
OS
)
OVSF Codes
LS Codes
1%
LS codes no BFOVSF codes 4-element BFOVSF codes 2-element BFOVSF codes no BF
Figure 7.19: Grade-Of-Service (GOS) versus number of users of the UTRA-like TDD cellular networkusingLS codes and OVSF codesboth with as well as without beamforming in conjunc-tion with shadowing having a frequency of 0.5 Hz and a standard deviationof 3dB for aspreading factor of SF=16.


Glossary
AWGN Additive White Gaussian Noise
BS A common abbreviation for Base Station
CDMA Code Division Multiple Access
CMA Constant Modulus Algorithm
DCS1800 A digital mobile radio system standard, based on GSM, but operates at 1.8GHzat a lower power.
DOA Direction Of Arrival
FDD Frequency Division Duplex
GSM A Pan-European digital mobile radio standard, operating at 900MHz.
HIPERLAN High Performance Radio Local Area Network
IF Intermediate Frequency
LMS Least Mean Square, a stochastic gradient algorithm used in adapting coefficientsof a system
MS A common abbreviation for Mobile Station
MSE Mean Square Error, a criterion used to optimised the coefficients of a systemsuch that the noise contained in the received signal is minimised.
PDF Probability Density Function
RF Radio Frequency
RLS Recursive Least Square
SDMA Spatial Division Multiple Access
SINR Signal to Interference plus Noise ratio, same as signal to noise ratio (SNR) whenthere is no interference.
SIR Signal to Interference ratio
SNR Signal to Noise Ratio, noise energy compared to the signal energy
TDD Time Division Duplex
TDMA Time Division Multiple Access
UMTS Universal Mobile Telecommunication System
495

496 Glossary

Bibliography
[1] M. Barrett and R. Arnott, “Adaptive antennas for mobile communications,”IEE Electronics & Communica-tions Engineering Journal, pp. 203–214, August 1994.
[2] S. C. Swales, M. A. Beach, D. J. Edwards, and J. P. McGeehan, “The Performance Enhancement of Multi-beam Adaptive Base-Station Antennas for Cellular Land Mobile Radio Systems,”IEEE Transactions onVehicular Technology, vol. 39, pp. 56–67, February 1990.
[3] J. Litva and T. Lo,Digital Beamforming in Wireless Communications. Artech House, London, 1996.
[4] A. B. Carlson,Communication Systems. McGraw-Hill, 1986.
[5] J. G. Proakis,Digital Communications. Mc-Graw Hill International Editions, 3 ed., 1995.
[6] L. C. Godara, “Applications of Antenna Arrays to Mobile Communications, Part I: Performance Improve-ment, Feasibility, and System Considerations,”Proceedings of the IEEE, vol. 85, pp. 1029–1060, July 1997.
[7] G. V. Tsoulos and M. A. Beach, “Calibration and Linearityissues for an Adaptive Antenna System,” inIEEEProceedings of Vehicular Technology Conference, pp. 1597–1600, 1997.
[8] B. D. V. Veen and K. M. Buckley, “Beamforming: A Versatile Approach to Spatial Filtering,”IEEE ASSPMagazine, pp. 4–24, April 1988.
[9] A. J. Paulraj and B. C. Ng, “Space-Time Modems for Wireless Personal Communications,”IEEE PersonalCommunications, pp. 36–48, February 1998.
[10] A. J. Paulraj and E. Lindskog, “Taxonomy of space-time processing for wireless networks,”IEEE Proceedingson Radar, Sonar and Navigation, vol. 145, pp. 25–31, February 1998.
[11] R. Steele and L. Hanzo,Mobile Radio Communications. IEEE Press - John Wiley, 2nd ed., 1999.
[12] W. T. Webb and L. Hanzo,Modern Quadrature Amplitude Modulation: Principles and Applications forWireless Communications. IEEE Press-Pentech Press, 1994. ISBN 0-7273-1701-6.
[13] L. Hanzo, W. T. Webb, and T. Keller,Single- and Multi-Carrier Quadrature Amplitude Modulation. JohnWiley, IEEE Press, 2000.
[14] N. Anderson and P. Howard, “Technology and TransceiverArchitecture Considerations for Adaptive AntennaSystems,” inProceedings of ACTS Summit, pp. 965–970, 1997.
[15] J. Strandell, M. Wennstrom, A. Rydberg, T. Oberg, O. Gladh, L. Rexberg, E. Sandberg, B. V. Andersson, andM. Appelgren, “Experimental Evaluation of an Adaptive Antenna for a TDMA Mobile Telephony System,”in Proceedings of PIMRC, pp. 79–84, 1997.
[16] J. J. Monot, J. Thibault, P. Chevalier, F. Pipon, S. Mayrargue, and A. Levy, “A fully programmable prototypefor the experimentation of the SDMA concept and and use of smartantennas for UMTS and GSM/DCS1800networks,” inProceedings of PIMRC, (Helsinki, Finland), pp. 534–538, September 1997.
[17] M. Mizuno and T. Ohgane, “Application of Adaptive ArrayAntennas to Radio Communications,”Electronicsand Communications in Japan, Part 1, vol. 77, no. 2, pp. 48–56, 1994.
497
498 BIBLIOGRAPHY
[18] Y. Ogawa and T. Ohgane, “Adaptive Antennas for Future Mobile Radio,” IEICE Trans. Fundamentals,vol. E79-A, pp. 961–967, July 1996.
[19] G. V. Tsoulos, M. A. Beach, and S. C. Swales, “On the Sensitivity of the Capacity Enhancement of a TDMAsystem with Adaptive Multibeam Antennas,” inIEEE VTC Proceedings, pp. 165–169, 1997.
[20] P. Leth-Espensen, P. E. Mogensen, F. Frederiksen, K. Olesen, and S. L. Larsen, “Performance of DifferentCombining Algorithms for a GSM System applying Antenna Arrays,” in Proceedings of ACTS Summit, 1997.
[21] W. Jakes, ed.,Microwave Mobile Communications. Wiley-Interscience, 1974.
[22] T. Ojanpera and R. Prasad, “An overview of third-generation wireless personal communications: a europeanperspective,”IEEE Personal Communications, vol. 5, pp. 59 – 65, December 1998.
[23] E. Dahlman, B. Gudmundson, M. Nilsson, and A. Skold, “UMTS/IMT-2000 based on wideband CDMA,”IEEE Communications Magazine, vol. 39, pp. 70–80, September 1998.
[24] B. Brand and A. Aghvami, “Multidimensional PRMA with prioritized Bayesian broadcast-a MAC strategyfor multiservice traffic over UMTS,”IEEE Transactions on Vehicular Technology, vol. 47, pp. 1148–1161,November 1998.
[25] J. Markoulidakis, R. Menolascino, F. Galliano, and M. Pizarroso, “Network planning methodology appliedto the UTRA specifications,” inProceedings of the IEEE International Symposium on Personal, Indoor andMobile Radio Communications, vol. 2, (Boston USA), pp. 1009–1013, September 1998.
[26] X. Mestre, M. Najar, C. Anton, and J. Fonollosa, “Adaptive beamforming for high bit rate services in theFDD mode of UTRA,” inProceedings of the IEEE Vehicular Technology Conference 1999 Fall, vol. 4, (Am-sterdam, Netherlands), pp. 1951–1955, 19-22 September 1999.
[27] S. Akhtar and D. Zeghlache, “Capacity evaluation of theUTRA WCDMA interface,” inProceedings of theIEEE Vehicular Technology Conference 1999 Fall, vol. 2, (Amsterdam, Netherlands), pp. 914–918, 19-22September 1999.
[28] F. Berens, T. Bing, H. Michel, A. Worm, and P. Baier, “Performance of low complexity turbo-codes in theUTRA-TDD-mode,” inProceedings of the IEEE Vehicular Technology Conference 1999 Fall, vol. 5, (Ams-terdam, Netherlands), pp. 2621–2625, 19-22 September 1999.
[29] N. Haardt and W. Mohr, “The complete solution for third-generation wireless communications: two modeson air, one winning strategy,”IEEE Personal Communications, vol. 7, pp. 18 – 24, December 2000.
[30] H. Holma, S. Heikkinen, O.-A. Lehtinen, and A. Toskala, “Interference considerations for the time divisionduplex mode of the UMTS Terrestrial Radio Access,”IEEE Journal on Selected Areas in Communications,vol. 18, pp. 1386–1393, August 2000.
[31] L. Aguado, T. O’Farrell, and J. Harris, “Evaluation of impact of mixed traffic on UTRA performance,”IEEElectronics Letters, vol. 36, pp. 1876–1877, October 2000.
[32] H. Haas and S. McLaughlin, “A Dynamic Channel Assignment Algorithm for a Hybrid TDMA/CDMA-TDDInterface Using the TS-Opposing Technique,”IEEE Journal on Selected Areas in Communications, vol. 19,pp. 1831–1846, October 2001.
[33] M. Guenach and L. Vandendorpe, “Downlink performance analysis of a BPSK-based WCDMA using con-ventional RAKE receivers with channel estimation,”IEEE Journal on Selected Areas in Communications,vol. 19, pp. 2165–2176, November 2001.
[34] M. Poza, A. Heras, J. Lablanca, and E. Lopez, “Downlink interference estimation in UMTS,”IEE ElectronicsLetters, vol. 37, pp. 590–591, April 2001.
[35] J. Perez-Romero, O. Sallent, R. Agusti, and J. Sanchez, “Managing radio network congestion in UTRA-FDD,” IEE Electronics Letters, vol. 38, pp. 1384–1386, October 2002.
[36] B. Allen, M. Beach, and P. Karlsson, “Analysis of smart antenna outage in UTRA FDD networks,”IEEElectronics Letters, vol. 38, pp. 2–3, January 2002.
[37] M. Ruiz-Garcia, J. Romero-Jerez, and A. Diaz-Estrella,“Quality of service support of MAC protocols formultimedia traffic in UTRA,”IEE Electronics Letters, vol. 38, pp. 139–141, January 2002.
[38] A. Ebner, H. Rohling, R. Halfmann, and M. Lott, “Synchronization in ad hoc networks based on UTRATDD,” in Proceedings of the IEEE International Symposium on Personal, Indoor and Mobile Radio Commu-nications, vol. 4, (Lisbon, Portugal), pp. 1650–1654, 15-18 September2002.

BIBLIOGRAPHY 499
[39] A. Agnetis, G. Brogi, G. Ciaschetti, P. Detti, and G. Giambene, “Optimal packet scheduling in UTRA-TDD,”IEEE Communications Letters, vol. 7, pp. 112–114, March 2003.
[40] C. Kao and J. Mar, “Intelligent MBWIMA/UMTS protocol using cascade fuzzy logic control for UTRA TDDmode,”IEEE Transactions on Vehicular Technology, vol. 52, pp. 1663–1674, November 2003.
[41] J. Blogh and L. Hanzo, “Adaptive modulation and adaptiveantenna array assisted network performanceof multi-user detection aided UTRA-like FDD/CDMA,” inProceedings of the IEEE Vehicular TechnologyConference 2002 Fall, vol. 3, (Vancouver, Canada), pp. 1806–1810, 24-28 September 2002.
[42] R. Rummler, Y. W. Chung, and H. Aghvami, “A new multicast protocol for UMTS,” in Proceedings of theIEEE Global Telecommunications Conference, vol. 2, (San Francisco, USA), pp. 687–691, 1-5 December2003.
[43] Y. Yang and T.-S. Yum, “Maximally flexible assignment of orthogonal variable spreading factor codes formultirate traffic,”IEEE Transactions on Wireless Communications, vol. 3, pp. 781–792, May 2004.
[44] K. Sivarajah and H. Al-Raweshidy, “Dynamic channel allocation for ongoing calls in UTRA TDD system,”IEE Electronics Letters, vol. 40, pp. 1197–1198, September 2004.
[45] Y. Yang and T.-S. P. Yum, “UTRA TDD handover performance,”in Proceedings of the IEEE Global Telecom-munications Conference, vol. 5, (Dallas, Texas USA), pp. 3305–3309, 29 Nov. - 3 Dec. 2004.
[46] S. Ni and L. Hanzo, “Genetic algorithm aided timeslot scheduling for UTRA TDD CDMA networks,”IEEElectronics Letters, vol. 41, pp. 422 – 424, March 2005.
[47] T. Rouse, S. McLaughlin, and I. Band, “Congestion-based routing strategies in multihop TDD-CDMA net-works,” IEEE Journal on Selected Areas in Communications, vol. 23, pp. 668–681, March 2005.
[48] P. Zhang, X. Tao, J. Zhang, Y. Wang, L. Li, and Y. Wang, “A vision from the future: beyond 3g tdd,”IEEECommunications Magazine, vol. 43, pp. 38–44, January 2005.
[49] J. S. Blogh, P. J. Cherriman, and L. Hanzo, “Adaptive Beamforming Assisted Dynamic Channel Allocation,”in Proceedings of VTC, (Houston, USA), pp. 199–203, May 1999.
[50] J. S. Blogh, P. J. Cherriman, and L. Hanzo, “Comparative Study of Dynamic Channel Allocation Algorithms,”IEEE Transactions on Vehicular Technology, 2001.
[51] J. S. Blogh, P. J. Cherriman, and L. Hanzo, “Dynamic Channel Allocation Using Adaptive Antennas andPower Control,” inProceedings of ACTS Mobile Communications Summit, (Sorrento), pp. 943–948, June1999.
[52] J. S. Blogh, P. J. Cherriman, and L. Hanzo, “Dynamic Channel Allocation Techniques using Adaptive Modu-lation and Adaptive Antennas,”Accepted for publication in IEEE Journal on Selected Areas in Communica-tions, 2001.
[53] J. S. Blogh, P. J. Cherriman, and L. Hanzo, “Dynamic Channel Allocation Techniques using Adaptive Modu-lation and Adaptive Antennas,” inProceedings of VTC Fall, (Amsterdam, The Netherlands), pp. 2348–2352,September 1999.
[54] J. Rapeli, “UMTS: Targets, system concept, and standardization in a global framework,”IEEE PersonalCommunications, vol. 2, pp. 20–28, February 1995.
[55] L. Hanzo and J. Stefanov, “The Pan-European Digital Cellular Mobile Radio System – known as GSM,” inSteele [155], ch. 8, pp. 677–765.
[56] P.-G. Andermo and L.-M. Ewerbring, “A CDMA-based radio access design for UMTS,”IEEE Personal Com-munications, vol. 2, pp. 48–53, February 1995.
[57] E. Nikula, A. Toskala, E. Dahlman, L. Girard, and A. Klein, “FRAMES multiple access for UMTS andIMT-2000,” IEEE Personal Communications, vol. 5, pp. 16–24, April 1998.
[58] T. Ojanpera and R. Prasad, ed.,Wideband CDMA for 3rd Generation Mobile Communications. Artech HousePublishers, 1998.
[59] H. Holma and A. Toskala, eds.,WCDMA for UMTS: Radio Access for Third Generation Mobile Communi-cations. John Wiley & Sons, Ltd., 2000.
[60] E. Berruto, M. Gudmundson, R. Menolascino, W. Mohr, and M. Pizarroso, “Research activities on UMTSradio interface, network architectures, and planning,”IEEE Communications Magazine, vol. 36, pp. 82–95,February 1998.

500 BIBLIOGRAPHY
[61] M. Callendar, “Future public land mobile telecommunication systems,”IEEE Personal Communications,vol. 12, no. 4, pp. 18–22, 1994.
[62] W. Lee, “Overview of cellular CDMA,”IEEE Transactions on Vehicular Technology, vol. 40, pp. 291–302,May 1991.
[63] K. Gilhousen, I. Jacobs, R. Padovani, A. Viterbi, L. Weaver Jr., and C. Wheatley III, “On the capacity of acellular CDMA system,”IEEE Transactions on Vehicular Technology, vol. 40, pp. 303–312, May 1991.
[64] R. Pickholtz, L. Milstein, and D. Schilling, “Spread spectrum for mobile communications,”IEEE Transac-tions on Vehicular Technology, vol. 40, pp. 312–322, May 1991.
[65] R. Kohno,Wireless Communications: TDMA versus CDMA, ch. 1. Spatial and Temporal CommunicationTheory using Software Antennas for Wireless Communications,pp. 293–321. Kluwer Academic Publishers,1997.
[66] A. Viterbi, CDMA: Principles of Spread Spectrum Communication. Addison-Wesley, June 1995. ISBN0201633744.
[67] S. Glisic and B. Vucetic,Spread Spectrum CDMA Systems for Wireless Communications. Artech House,April 1997. ISBN 0890068585.
[68] R. Prasad,CDMA for Wireless Personal Communications. Artech House, May 1996. ISBN 0890065713.
[69] V. Garg, K. Smolik, J. Wilkes, and K. Smolik,Applications of CDMA in Wireless/Personal Communications.Englewood Cliffs NJ: Prentice-Hall, 1996.
[70] R. Price and E. Green Jr., “A communication technique for multipath channels,”Proceedings of the IRE,vol. 46, pp. 555–570, March 1958.
[71] B. Sklar, “Rayleigh fading channels in mobile digital communication systems part I : Characterization,”IEEECommunications Magazine, vol. 35, pp. 90–100, July 1997.
[72] B. Sklar, “Rayleigh fading channels in mobile digital communication systems part II: Mitigation,”IEEECommunications Magazine, vol. 35, pp. 148–155, July 1997.
[73] F. Amoroso, “Use of DS/SS signaling to mitigate Rayleigh fading in a dense scatterer environment,”IEEEPersonal Communications, vol. 3, pp. 52–61, April 1996.
[74] W. C. Jakes, ed.,Microwave Mobile Communications. John Wiley and Sons, 1974. ISBN 0-471-43720-4.
[75] M. Nakagami, “Them-distribution-a general formula of intensity distributionof fading,” Statistical Methodsin Radio Wave Propagation, 1960. W.C. Hoffman, ed., New York: Pergamon.
[76] H. Suzuki, “A statistical model for urban multipath propagation,” IEEE Transactions on Communications,vol. COM-25, pp. 673–680, July 1977.
[77] “COST 207: Digital land mobile radio communications, finalreport.” Office for Official Publications of theEuropean Communities, 1989. Luxembourg.
[78] M. Whitmann, J. Marti, and T. Kurner, “Impact of the power delay profile shape on the bit errorrate in mobileradio systems,”IEEE Transactions on Vehicular Technology, vol. 46, pp. 329–339, May 1997.
[79] D. Greenwood and L. Hanzo, “Characterisation of mobile radio channels,” in Steele [155], ch. 2, pp. 92–185.
[80] T. Eng, N. Kong, and L. Milstein, “Comparison of diversity combining techniques for Rayleigh-fading chan-nels,” IEEE Transactions on Communications, vol. 44, pp. 1117–1129, September 1996.
[81] M. Kavehrad and P. McLane, “Performance of low-complexity channel coding and diversity for spread spec-trum in indoor, wireless communications,”AT&T Technical Journal, vol. 64, pp. 1927–1965, October 1985.
[82] K.-T. Wu and S.-A. Tsaur, “Selection diversity for DS-SSMA communications on Nakagami fading chan-nels,” IEEE Transactions on Vehicular Technology, vol. 43, pp. 428–438, August 1994.
[83] L.-L. Yang and L. Hanzo, “Serial acquisition techniques for DS-CDMA signals in frequency-selective multi-user mobile channels,” inProceedings of VTC’98 (Spring)[544].
[84] L.-L. Yang and L. Hanzo, “Serial acquisition of DS-CDMAsignals in multipath fading mobile channels.”submitted to IEEE Transactions on Vehicular Technology, 1998.
[85] R. Ziemer and R. Peterson,Digital Communications and Spread Spectrum System. New York: MacmillanPublishing Company, 1985.

BIBLIOGRAPHY 501
[86] R. Pickholtz, D. Schilling, and L. Milstein, “Theory ofspread-spectrum communications — a tutorial,”IEEETransactions on Communications, vol. COM-30, pp. 855–884, May 1982.
[87] S. Rappaport and D. Grieco, “Spread-spectrum signal acquisition: Methods and technology,”IEEE Commu-nications Magazine, vol. 22, pp. 6–21, June 1984.
[88] E. Strom, S. Parkvall, S. Miller, and B. Ottersten, “Propagation delay estimation in asynchronous direct-sequence code division multiple access systems,”IEEE Transactions on Communications, vol. 44, pp. 84–93,January 1996.
[89] R. Rick and L. Milstein, “Optimal decision strategies for acquisition of spread-spectrum signals in frequency-selective fading channels,”IEEE Transactions on Communications, vol. 46, pp. 686–694, May 1998.
[90] J. Lee,CDMA Systems Engineering Handbook. London: Artech House Publishers, 1998.
[91] M. Varanasi and B. Aazhang, “Multistage detection in asynchronous code-division multiple-access commu-nications,”IEEE Transactions on Communications, vol. 38, pp. 509–519, April 1990.
[92] S. Moshavi, “Multi-user detection for DS-CDMA communications,” IEEE Communications Magazine,vol. 34, pp. 124–136, October 1996.
[93] S. Verdu, Multiuser Detection. Cambridge University Press, 1998.
[94] L. Hanzo, C. H. Wong, and M. S. Yee,Adaptive Wireless Transceivers. John Wiley, IEEE Press, 2002. (Fordetailed contents please refer to http://www-mobile.ecs.soton.ac.uk.).
[95] E. Kuan and L. Hanzo, “Joint detection CDMA techniques for third-generation transceivers,” inProceedingsof ACTS Mobile Communication Summit ’98, (Rhodes, Greece), pp. 727–732, ACTS, 8–11 June 1998.
[96] E. Kuan, C. Wong, and L. Hanzo, “Burst-by-burst adaptive joint detection CDMA,” inProceedings of VTC’98(Spring)[544].
[97] S. Verdu, Multiuser Detection. Cambridge: Cambridge University Press, 1998.
[98] F. Simpson and J. Holtzman, “Direct sequence CDMA power control, interleaving, and coding,”IEEE Journalon Selected Areas in Communications, vol. 11, pp. 1085–1095, September 1993.
[99] M. Pursley, “Performance evaluation for phase-coded spread-spectrum multiple-access communication-partI: System analysis,”IEEE Transactions on Communications, vol. COM-25, pp. 795–799, August 1977.
[100] R. Morrow Jr., “Bit-to-bit error dependence in slotted DS/SSMA packet systems with random signature se-quences,”IEEE Transactions on Communications, vol. 37, pp. 1052–1061, October 1989.
[101] J. Holtzman, “A simple, accurate method to calculate spread-spectrum multiple-access error probabilities,”IEEE Transactions on Communications, vol. 40, pp. 461–464, March 1992.
[102] U.-C. Fiebig and M. Schnell, “Correlation propertiesof extended m-sequences,”Electronic Letters, vol. 29,pp. 1753–1755, September 1993.
[103] J. McGeehan and A. Bateman, “Phase-locked transparenttone in band (TTIB): A new spectrum configura-tion particularly suited to the transmission of data over SSBmobile radio networks,”IEEE Transactions onCommunications, vol. COM-32, no. 1, pp. 81–87, 1984.
[104] A. Bateman, G. Lightfoot, A. Lymer, and J. McGeehan, “Speech and data transmissions over a 942MHz TABand TTIB single sideband mobile radio system,”IEEE Transactions on Vehicular Technology, vol. VT-34,pp. 13–21, February 1985.
[105] F. Davarian, “Mobile digital communications via tone calibration,” IEEE Transactions on Vehicular Technol-ogy, vol. VT-36, pp. 55–62, May 1987.
[106] M. Moher and J. Lodge, “TCMP—a modulation and coding strategy for Rician fading channels,”IEEEJournal on Selected Areas in Communications, vol. 7, pp. 1347–1355, December 1989.
[107] G. Irvine and P. McLane, “Symbol-aided plus decision-directed reception for PSK/TCM modulation onshadowed mobile satellite fading channels,”IEEE Journal on Selected Areas in Communications, vol. 10,pp. 1289–1299, October 1992.
[108] A. Baier, U.-C. Fiebig, W. Granzow, W. Koch, P. Teder, and J. Thielecke, “Design study for a CDMA-basedthird-generation mobile system,”IEEE Journal on Selected Areas in Communications, vol. 12, pp. 733–743,May 1994.

502 BIBLIOGRAPHY
[109] P. Rapajic and B. Vucetic, “Adaptive receiver structures for asynchornous CDMA systems,”IEEE Journal onSelected Areas in Communications, vol. 12, pp. 685–697, May 1994.
[110] M. Benthin and K.-D. Kammeyer, “Influence of channel estimation on the performance of a coherent DS-CDMA system,”IEEE Transactions on Vehicular Technology, vol. 46, pp. 262–268, May 1997.
[111] M. Sawahashi, Y. Miki, H. Andoh, and K. Higuchi, “Pilotsymbol-assisted coherent multistage interferencecanceller using recursive channel estimation for DS-CDMA mobile radio,” IEICE Transactions on Commu-nications, vol. E79-B, pp. 1262–1269, September 1996.
[112] J. Torrance and L. Hanzo, “Comparative study of pilot symbol assisted modem schemes,” inProceedingsof IEE Conference on Radio Receivers and Associated Systems(RRAS’95), (Bath), pp. 36–41, IEE, 26–28September 1995.
[113] J. Cavers, “An analysis of pilot symbol assisted modulation for Rayleigh fading channels,”IEEE Transactionson Vehicular Technology, vol. 40, pp. 686–693, November 1991.
[114] S. Sampei and T. Sunaga, “Rayleigh fading compensation for QAM in land mobile radio communications,”IEEE Transactions on Vehicular Technology, vol. 42, pp. 137–147, May 1993.
[115] The 3GPP1 website. http://www.3gpp.org.
[116] The 3GPP2 website. http://www.3gpp2.org.
[117] T. Ojanpera and R. Prasad,Wideband CDMA for Third Generation Mobile Communications. London: ArtechHouse, 1998.
[118] E. Dahlman, B. Gudmundson, M. Nilsson, and J. Skold, “UMTS/IMT-2000 based on wideband CDMA,”IEEE Communications Magazine, vol. 36, pp. 70–80, September 1998.
[119] T. Ojanpera, “Overview of research activities for third generation mobile communications,” in Glisic andLeppanen [334], ch. 2 (Part 4), pp. 415–446. ISBN 0792380053.
[120] European Telecommunications Standards Institute,The ETSI UMTS Terrestrial Radio Access (UTRA) ITU-RRTT Candidate Submission, June 1998. ETSI/SMG/SMG2.
[121] Association of Radio Industries and Businesses,Japan’s Proposal for Candidate Radio Transmission Tech-nology on IMT-2000: W-CDMA, June 1998.
[122] F. Adachi, M. Sawahashi, and H. Suda, “Wideband DS-CDMA for next-generation mobile communicationssystems,”IEEE Communications Magazine, vol. 36, pp. 56–69, September 1998.
[123] F. Adachi and M. Sawahashi, “Wideband wireless accessbased on DS-CDMA,”IEICE Transactions onCommunications, vol. E81-B, pp. 1305–1316, July 1998.
[124] A. Sasaki, “Current situation of IMT-2000 radio transmission technology study in Japan,”IEICE Transactionson Communications, vol. E81-B, pp. 1299–1304, July 1998.
[125] P. Baier, P. Jung, and A. Klein, “Taking the challenge of multiple access for third-generation cellular mobileradio systems — a European view,”IEEE Communications Magazine, vol. 34, pp. 82–89, February 1996.
[126] J. Schwarz da Silva, B. Barani, and B. Arroyo-Fernandez, “European mobile communications on the move,”IEEE Communications Magazine, vol. 34, pp. 60–69, February 1996.
[127] F. Ovesjo, E. Dahlman, T. Ojanpera, A. Toskala, and A. Klein, “FRAMES multiple access mode 2 — wide-band CDMA,” in Proceedings of IEEE International Symposium on Personal, Indoor and Mobile RadioCommunications, PIMRC’97[546].
[128] The UMTS Forum website. http://www.umts-forum.org/.
[129] M. Sunay, Z.-C. Honkasalo, A. Hottinen, H. Honkasalo,and L. Ma, “A dynamic channel allocation basedTDD DS CDMA residential indoor system,” inIEEE 6th International Conference on Universal PersonalCommunications, ICUPC’97, (San Diego, CA), pp. 228–234, October 1997.
[130] F. Adachi, M. Sawahashi, and K. Okawa, “Tree-structured Generation of Orthogonal Spreading Codes withDifferent Lengths for Forward Link of DS-CDMA Mobile,”Electronics Letters, vol. 33, no. 1, pp. 27–28,1997.
[131] F. Adachi, K. Ohno, A. Higashi, T. Dohi, and Y. Okumura, “Coherent multicode DS-CDMA mobile RadioAccess,”IEICE Transactions on Communications, vol. E79-B, pp. 1316–1324, September 1996.

BIBLIOGRAPHY 503
[132] L. Hanzo, C. Wong, and P. Cherriman, “Channel-adaptivewideband video telephony,”IEEE Signal Process-ing Magazine, vol. 17, pp. 10–30, July 2000.
[133] P. Cherriman and L. Hanzo, “Programmable H.263-based wireless video transceivers for interference-limitedenvironments,”IEEE Trans. on Circuits and Systems for Video Technology, vol. 8, pp. 275–286, June 1998.
[134] C. Berrou and A. Glavieux, “Near optimum error correcting coding and decoding: turbo codes,”IEEE Trans-actions on Communications, vol. 44, pp. 1261–1271, October 1996.
[135] A. Fujiwara, H. Suda, and F. Adachi, “Turbo codes application to DS-CDMA mobile radio,”IEICE Transac-tions on Communications, vol. E81A, pp. 2269–2273, November 1998.
[136] M. Juntti, “System concept comparison for multirate CDMA with multiuser detection,” inProceedings ofIEEE Vehicular Technology Conference (VTC’98)[543], pp. 18–21.
[137] S. Ramakrishna and J. Holtzman, “A comparison between single code and multiple code transmissionschemes in a CDMA system,” inProceedings of IEEE Vehicular Technology Conference (VTC’98) [543],pp. 791–795.
[138] M. K. Simon, J. K. Omura, R. A. Scholtz, and B. K. Levitt,Spread Spectrum Communications Handbook.McGraw-Hill, 1994.
[139] T. Kasami,Combinational Mathematics and its Applications. University of North Carolina Press, 1969.
[140] A. Brand and A. Aghvami, “Multidimensional PRMA with prioritized Bayesian broadcast — a MAC strategyfor multiservice traffic over UMTS,”IEEE Transactions on Vehicular Technology, vol. 47, pp. 1148–1161,November 1998.
[141] R. Ormondroyd and J. Maxey, “Performance of low rate orthogonal convolutional codes in DS-CDMA,”IEEE Transactions on Vehicular Technology, vol. 46, pp. 320–328, May 1997.
[142] A. Chockalingam, P. Dietrich, L. Milstein, and R. Rao, “Performance of closed-loop power control in DS-CDMA cellular systems,”IEEE Transactions on Vehicular Technology, vol. 47, pp. 774–789, August 1998.
[143] R. Gejji, “Forward-link-power control in CDMA cellular-systems,”IEEE Transactions on Vehicular Technol-ogy, vol. 41, pp. 532–536, November 1992.
[144] K. Higuchi, M. Sawahashi, and F. Adachi, “Fast cell search algorithm in DS-CDMA mobile radio using longspreading codes,” inProceedings of IEEE VTC ’97, vol. 3, (Phoenix, Arizona, USA), pp. 1430–1434, IEEE,4–7 May 1997.
[145] M. Golay, “Complementary series,”IRE Transactions on Information Theory, vol. IT-7, pp. 82–87, 1961.
[146] V. Tarokh, H. Jafarkhani, and A. Calderbank, “Space-time block codes from orthogonal designs,”IEEE Trans-actions on Information Theory, vol. 45, pp. 1456–1467, May 1999.
[147] W. Lee,Mobile Communications Engineering. New York: McGraw-Hill, 2nd ed., 1997.
[148] H. Wong and J. Chambers, “Two-stage interference immune blind equaliser which exploits cyclostationarystatistics,”Electronics Letters, vol. 32, pp. 1763–1764, September 1996.
[149] C. Lee and R. Steele, “Effects of Soft and Softer Handoffs on CDMA System Capacity,”IEEE Transactionson Vehicular Technology, vol. 47, pp. 830–841, August 1998.
[150] M. Gustafsson, K. Jamal, and E. Dahlman, “Compressed mode techniques for inter-frequency measurementsin a wide-band DS-CDMA system,” inProceedings of IEEE International Symposium on Personal, Indoorand Mobile Radio Communications, PIMRC’97[546], pp. 231–235.
[151] D. Knisely, S. Kumar, S. Laha, and S. Nanda, “Evolution of wireless data services : IS-95 to cdma2000,”IEEE Communications Magazine, vol. 36, pp. 140–149, October 1998.
[152] Telecommunications Industry Association (TIA),The cdma2000 ITU-R RTT Candidate Submission, 1998.
[153] D. Knisely, Q. Li, and N. Rames, “cdma2000: A third generation radio transmission technology,”Bell LabsTechnical Journal, vol. 3, pp. 63–78, July–September 1998.
[154] Y. Okumura and F. Adachi, “Variable-rate data transmission with blind rate detection for coherent DS-CDMAmobile radio,”IEICE Transactions on Communications, vol. E81B, pp. 1365–1373, July 1998.
[155] R. Steele, ed.,Mobile Radio Communications. IEEE Press-Pentech Press, 1992.
[156] M. Raitola, A. Hottinen, and R. Wichman, “Transmission diversity in wideband CDMA,” inProceedings ofVTC’98 (Spring)[544], pp. 1545–1549.

504 BIBLIOGRAPHY
[157] J. Liberti Jr. and T. Rappaport, “Analytical results for capacity improvements in CDMA,”IEEE Transactionson Vehicular Technology, vol. 43, pp. 680–690, August 1994.
[158] J. Winters, “Smart antennas for wireless systems,”IEEE Personal Communications, vol. 5, pp. 23–27, Febru-ary 1998.
[159] T. Lim and L. Rasmussen, “Adaptive symbol and parameter estimation in asynchronous multiuser CDMAdetectors,”IEEE Transactions on Communications, vol. 45, pp. 213–220, February 1997.
[160] T. Lim and S. Roy, “Adaptive filters in multiuser (MU) CDMA detection,”Wireless Networks, vol. 4, pp. 307–318, June 1998.
[161] L. Wei, “Rotationally-invariant convolutional channel coding with expanded signal space, part I and II,”IEEETransactions on Selected Areas in Comms, vol. SAC-2, pp. 659–686, September 1984.
[162] T. Lim and M. Ho, “LMS-based simplifications to the kalmanfilter multiuser CDMA detector,” inPro-ceedings of IEEE Asia-Pacific Conference on Communications/International Conference on CommunicationSystems, (Singapore), November 1998.
[163] D. You and T. Lim, “A modified blind adaptive multiuser CDMAdetector,” inProceedings of IEEE Interna-tional Symposium on Spread Spectrum Techniques and Application (ISSSTA’98)[545], pp. 878–882.
[164] S. Sun, L. Rasmussen, T. Lim, and H. Sugimoto, “Impact of estimation errors on multiuser detection inCDMA,” in Proceedings of IEEE Vehicular Technology Conference (VTC’98) [543], pp. 1844–1848.
[165] Y. Sanada and Q. Wang, “A co-channel interference cancellation technique using orthogonal convolutionalcodes on multipath rayleigh fading channel,”IEEE Transactions on Vehicular Technology, vol. 46, pp. 114–128, February 1997.
[166] P. Patel and J. Holtzman, “Analysis of a simple successive interference cancellation scheme in a DS/CDMAsystem,”IEEE Journal on Selected Areas in Communications, vol. 12, pp. 796–807, June 1994.
[167] P. Tan and L. Rasmussen, “Subtractive interference cancellation for DS-CDMA systems,” inProceedingsof IEEE Asia-Pacific Conference on Communications/International Conference on Communication Systems,(Singapore), November 1998.
[168] K. Cheah, H. Sugimoto, T. Lim, L. Rasmussen, and S. Sun, “Performance of hybrid interference can-celler with zero-delay channel estimation for CDMA,” inProceedings of Globecom’98, (Sydney, Australia),pp. 265–270, IEEE, 8–12 Nov 1998.
[169] S. Sun, L. Rasmussen, and T. Lim, “A matrix-algebraic approach to hybrid interference cancellation inCDMA,” in Proceedings of IEEE International Conference on UniversalPersonal Communications ’98, (Flo-rence, Italy), pp. 1319–1323, October 1998.
[170] A. Johansson and L. Rasmussen, “Linear group-wise successive interference cancellation in CDMA,” inProceedings of IEEE International Symposium on Spread Spectrum Techniques and Application (ISSSTA’98)[545], pp. 121–126.
[171] S. Sun, L. Rasmussen, H. Sugimoto, and T. Lim, “A hybrid interference canceller in CDMA,” inProceed-ings of IEEE International Symposium on Spread Spectrum Techniques and Application (ISSSTA’98)[545],pp. 150–154.
[172] D. Guo, L. Rasmussen, S. Sun, T. Lim, and C. Cheah, “MMSE-based linear parallel interference cancel-lation in CDMA,” in Proceedings of IEEE International Symposium on Spread Spectrum Techniques andApplication (ISSSTA’98)[545], pp. 917–921.
[173] L. Rasmussen, D. Guo, Y. Ma, and T. Lim, “Aspects on linearparallel interference cancellation in CDMA,”in Proceedings of IEEE International Symposium on Information Theory, (Cambridge, MA), p. 37, August1998.
[174] L. Rasmussen, T. Lim, H. Sugimoto, and T. Oyama, “Mapping functions for successive interference cancella-tion in CDMA,” in Proceedings of IEEE Vehicular Technology Conference (VTC’98) [543], pp. 2301–2305.
[175] S. Sun, T. Lim, L. Rasmussen, T. Oyama, H. Sugimoto, and Y. Matsumoto, “Performance comparison ofmulti-stage SIC and limited tree-search detection in CDMA,” in Proceedings of IEEE Vehicular TechnologyConference (VTC’98)[543], pp. 1854–1858.
[176] H. Sim and D. Cruickshank, “Chip based multiuser detector for the downlink of a DS-CDMA system using afolded state-transition trellis,” inProceedings of VTC’98 (Spring)[544], pp. 846–850.

BIBLIOGRAPHY 505
[177] J. Blogh and L. Hanzo,3G Systems and Intelligent Networking. John Wiley and IEEE Press, 2002. (Fordetailed contents please refer to http://www-mobile.ecs.soton.ac.uk.).
[178] L. Hanzo, P. Cherriman, and J. Streit,Video Compression and Communications over Wireless Channels:From Second to Third Generation Systems and Beyond. IEEE Press and John Wiley, 2001. (For detailedcontents please refer to http://www-mobile.ecs.soton.ac.uk.).
[179] L. Hanzo, “Bandwidth-efficient wireless multimedia communications,” Proceedings of the IEEE, vol. 86,pp. 1342–1382, July 1998.
[180] S. Nanda, K. Balachandran, and S. Kumar, “Adaptation techniques in wireless packet data services,”IEEECommunications Magazine, vol. 38, pp. 54–64, January 2000.
[181] Research and Development Centre for Radio Systems, Japan, Public Digital Cellular (PDC) Standard, RCRSTD-27.
[182] Telcomm. Industry Association (TIA), Washington, DC, USA, Dual-mode subscriber equipment — Networkequipment compatibility specification, Interim Standard IS-54, 1989.
[183] Telcomm. Industry Association (TIA), Washington, DC, USA, Mobile station — Base station compatibilitystandard for dual-mode wideband spread spectrum cellular system, EIA/TIA Interim Standard IS-95, 1993.
[184] T. Ojanpera and R. Prasad,Wideband CDMA for Third Generation Mobile Communications. Artech House,Inc., 1998.
[185] W. Webb and R. Steele, “Variable rate QAM for mobile radio,” IEEE Transactions on Communications,vol. 43, no. 7, pp. 2223–2230, 1995.
[186] S. Sampei, S. Komaki, and N. Morinaga, “Adaptive Modulation/TDMA scheme for large capacity personalmultimedia communications systems,”IEICE Transactions on Communications, vol. E77-B, pp. 1096–1103,September 1994.
[187] J. M. Torrance and L. Hanzo, “Upper bound performance ofadaptive modulation in a slow Rayleigh fadingchannel,”Electronics Letters, vol. 32, pp. 718–719, 11 April 1996.
[188] C. Wong and L. Hanzo, “Upper-bound performance of a wideband burst-by-burst adaptive modem,”IEEETransactions on Communications, vol. 48, pp. 367–369, March 2000.
[189] J. M. Torrance and L. Hanzo, “Optimisation of switchinglevels for adaptive modulation in a slow Rayleighfading channel,”Electronics Letters, vol. 32, pp. 1167–1169, 20 June 1996.
[190] H. Matsuoka, S. Sampei, N. Morinaga, and Y. Kamio, “Adaptive modulation system with variable codingrate concatenated code for high quality multi-media communications systems,” inProceedings of IEEE VTC’96 [547], pp. 487–491.
[191] A. J. Goldsmith and S. G. Chua, “Variable Rate Variable Power MQAM for Fading Channels,”IEEE Trans-actions on Communications, vol. 45, pp. 1218–1230, October 1997.
[192] S. Otsuki, S. Sampei, and N. Morinaga, “Square-qam adaptive modulation/TDMA/TDD systems using mod-ulation estimation level with walsh function,”IEE Electronics Letters, vol. 31, pp. 169–171, February 1995.
[193] J. Torrance and L. Hanzo, “Demodulation level selection in adaptive modulation,”Electronics Letters, vol. 32,pp. 1751–1752, 12 September 1996.
[194] Y. Kamio, S. Sampei, H. Sasaoka, and N. Morinaga, “Performance of modulation-level-control adaptive-modulation under limited transmission delay time for land mobilecommunications,” inProceedings of IEEEVehicular Technology Conference (VTC’95), (Chicago, USA), pp. 221–225, IEEE, 15–28 July 1995.
[195] J. M. Torrance and L. Hanzo, “Latency and Networking Aspects of Adaptive Modems over Slow IndoorsRayleigh Fading Channels,”IEEE Transactions on Vehicular Technology, vol. 48, pp. 1237–1251, July 1999.
[196] T. Ue, S. Sampei, and N. Morinaga, “Symbol rate controlled adaptive modulation/TDMA/TDD for wirelesspersonal communication systems,”IEICE Transactions on Communications, vol. E78-B, pp. 1117–1124,August 1995.
[197] T. Suzuki, S. Sampei, and N. Morinaga, “Space and path diversity combining technique for 10 Mbits/sadaptive modulation/TDMA in wireless communications systems,” in Proceedings of IEEE VTC ’96[547],pp. 1003–1007.
506 BIBLIOGRAPHY
[198] K. Arimochi, S. Sampei, and N. Morinaga, “Adaptive modulation system with discrete power control andpredistortion-type non-linear compensation for high spectral efficient and high power efficient wireless com-munication systems,” inProceedings of IEEE International Symposium on Personal, Indoor and MobileRadio Communications, PIMRC’97[546], pp. 472–477.
[199] T. Ikeda, S. Sampei, and N. Morinaga, “TDMA-based adaptive modulation with dynamic channel assign-ment (AMDCA) for high capacity multi-media microcellular systems,” in Proceedings of IEEE VehicularTechnology Conference, (Phoenix, USA), pp. 1479–1483, May 1997.
[200] T. Ue, S. Sampei, and N. Morinaga, “Adaptive modulation packet radio communication system using NP-CSMA/TDD scheme,” inProceedings of IEEE VTC ’96[547], pp. 416–421.
[201] M. Naijoh, S. Sampei, N. Morinaga, and Y. Kamio, “ARQ schemes with adaptive modulation/TDMA/TDDsystems for wireless multimedia communication systems,” inProceedings of IEEE International Symposiumon Personal, Indoor and Mobile Radio Communications, PIMRC’97 [546], pp. 709–713.
[202] S. Sampei, T. Ue, N. Morinaga, and K. Hamguchi, “Laboratory experimental results of an adaptive modu-lation TDMA/TDD for wireless multimedia communication systems,” in Proceedings of IEEE InternationalSymposium on Personal, Indoor and Mobile Radio Communications, PIMRC’97[546], pp. 467–471.
[203] J. Torrance and L. Hanzo, “Interference aspects of adaptive modems over slow Rayleigh fading channels,”IEEE Transactions on Vehicular Technology, vol. 48, pp. 1527–1545, September 1999.
[204] L. Hanzo, T. H. Liew, and B. L. Yeap,Turbo Coding, Turbo Equalisation and Space-Time Coding. JohnWiley, IEEE Press, 2002. (For detailed contents please referto http://www-mobile.ecs.soton.ac.uk.).
[205] J. Cheung and R. Steele, “Soft-decision feedback equalizer for continuous-phase modulated signals inwide-band mobile radio channels,”IEEE Transactions on Communications, vol. 42, pp. 1628–1638, Febru-ary/March/April 1994.
[206] M. Yee, T. Liew, and L. Hanzo, “Radial basis function decision feedback equalisation assisted block turboburst-by-burst adaptive modems,” inProceedings of VTC ’99 Fall, (Amsterdam, Holland), pp. 1600–1604,19-22 September 1999.
[207] M. S. Yee, B. L. Yeap, and L. Hanzo, “Radial basis function assisted turbo equalisation,” inProceedings ofIEEE Vehicular Technology Conference, (Japan, Tokyo), pp. 640–644, IEEE, 15-18 May 2000.
[208] L. Hanzo, F. Somerville, and J. Woodard,Voice Compression and Communications: Principles and Applica-tions for Fixed and Wireless Channels. IEEE Press and John Wiley, 2002. 2001 (For detailed contents, pleaserefer to http://www-mobile.ecs.soton.ac.uk.).
[209] ITU-T, Recommendation H.263: Video coding for low bitrate communication, March 1996.
[210] A. Klein, R. Pirhonen, J. Skoeld, and R. Suoranta, “FRAMES multiple access mode 1 — wideband TDMAwith and without spreading,” inProceedings of IEEE International Symposium on Personal, Indoor andMobile Radio Communications, PIMRC’97[546], pp. 37–41.
[211] P. Cherriman, C. Wong, and L. Hanzo, “Turbo- and BCH-coded wide-band burst-by-burst adaptive H.263-assisted wireless video telephony,”IEEE Transactions on Circuits and Systems for Video Technology, vol. 10,pp. 1355–1363, December 2000.
[212] T. Keller and L. Hanzo, “Adaptive multicarrier modulation: A convenient framework for time-frequencyprocessing in wireless communications,”Proceedings of the IEEE, vol. 88, pp. 611–642, May 2000.
[213] A. Klein and P. Baier, “Linear unbiased data estimationin mobile radio sytems applying CDMA,”IEEEJournal on Selected Areas in Communications, vol. 11, pp. 1058–1066, September 1993.
[214] K. Gilhousen, I. Jacobs, R. Padovani, A. Viterbi, L. Weaver Jr., and C. Wheatley III, “On the capacity of acellular CDMA system,”IEEE Transactions on Vehicular Technology, vol. 40, pp. 303–312, May 1991.
[215] S. Kim, “Adaptive rate and power DS/CDMA communications in fading channels,”IEEE CommunicationsLetters, vol. 3, pp. 85–87, April 1999.
[216] T. Ottosson and A. Svensson, “On schemes for multirate support in DS-CDMA systems,”Wireless PersonalCommunications (Kluwer), vol. 6, pp. 265–287, March 1998.
[217] S. Ramakrishna and J. Holtzman, “A comparison between single code and multiple code transmissionschemes in a CDMA system,” inProceedings of IEEE Vehicular Technology Conference (VTC’98) [543],pp. 791–795.

BIBLIOGRAPHY 507
[218] M. Saquib and R. Yates, “Decorrelating detectors for adual rate synchronous DS/CDMAchannel,”WirelessPersonal Communications (Kluwer), vol. 9, pp. 197–216, May 1999.
[219] A.-L. Johansson and A. Svensson, “Successive interference cancellation schemes in multi-rate DS/CDMAsystems,” inWireless Information Networks (Baltzer), pp. 265–279, 1996.
[220] S. Abeta, S. Sampei, and N. Morinaga, “Channel activation with adaptive coding rate and processing gaincontrol for cellular DS/CDMA systems,” inProceedings of IEEE VTC ’96[547], pp. 1115–1119.
[221] M. Hashimoto, S. Sampei, and N. Morinaga, “Forward and reverse link capacity enhancement of DS/CDMAcellular system using channel activation and soft power control techniques,” inProceedings of IEEE Interna-tional Symposium on Personal, Indoor and Mobile Radio Communications, PIMRC’97[546], pp. 246–250.
[222] T. Liew, C. Wong, and L. Hanzo, “Block turbo coded burst-by-burst adaptive modems,” inProceedings ofMicrocoll’99, Budapest, Hungary, pp. 59–62, 21–24 March 1999.
[223] L. Hanzo, P. Cherriman, and J. Streit,Wireless Video Communications: From Second to Third GenerationSystems, WLANs and Beyond. IEEE Press-John Wiley, 2001. IEEE Press, 2001. (For detailed contents pleaserefer to http://www-mobile.ecs.soton.ac.uk.).
[224] V. Tarokh, N. Seshadri, and A. Calderbank, “Space-timecodes for high data rate wireless communication:Performance criterion and code construction,”IEEE Transactions on Information Theory, vol. 44, pp. 744–765, March 1998.
[225] V. Tarokh, A. Naguib, N. Seshadri, and A. Calderbank, “Space-time codes for high data rate wireless com-munication: Performance criteria in the presence of channel estimation errors, mobility, and multiple paths,”IEEE Transactions on Communications, vol. 47, pp. 199–207, February 1999.
[226] V. Tarokh, N. Seshadri, and A. Calderbank, “Space-timecodes for high data rate wireless communications:Performance criterion and code construction,” inProc IEEE International Conference on Communications’97, (Montreal, Canada), pp. 299–303, 1997.
[227] V. Tarokh, H. Jafarkhani, and A. Calderbank, “Space-time block codes from orthogonal designs,”IEEE Trans-actions on Information Theory, vol. 45, pp. 1456–1467, July 1999.
[228] T. Rappaport, ed.,Smart Antennas: Adaptive Arrays, Algorithms and Wireless Position Location. IEEE, 1998.
[229] B. Widrow, P. E. Mantey, L. J. Griffiths and B. B. Goode, “Adaptive Antenna Systems,” inProceedings of theIEEE, vol. 55, pp. 2143–2159, December 1967.
[230] S. P. Applebaum, “Adaptive Arrays,”IEEE Transactions on Antennas and Propagation, vol. AP-24, pp. 585–598, September 1976.
[231] O. L. Frost III, “An Algorithm for Linearly Constrained Adaptive Array Processing,” inProceedings of theIEEE, vol. 60, pp. 926–935, August 1972.
[232] I. S. Reed, J. D. Mallett and L. E. Brennan, “Rapid Convergence Rate in Adaptive Arrays,”IEEE Transactionson Aerospace Electronic System, vol. AES-10, pp. 853–863, November 1974.
[233] J. Fernandez, I. R. Corden and M. Barrett, “Adaptive Array Algorithms for Optimal Combining in DigitalMobile Communications Systems,”IEE 8th International Conference on Antennas and Propagation, pp. 983–986, 1993.
[234] L.C. Godara, “Applications of Antenna Arrays to Mobile Communications, Part I: Performance Improvement,Feasibility, and System Considerations,” inProceedings of the IEEE, vol. 85, pp. 1031–1060, July 1997.
[235] L.C. Godara, “Application of Antenna Arrays to MobileCommunications, Part II: Beam-Forming andDirection-of-Arrival Considerations,” inProceedings of the IEEE, vol. 85, pp. 1195–1245, August 1997.
[236] W. F. Gabriel, “Adaptive Processing Array Systems,” inProceedings of the IEEE, vol. 80, pp. 152–162,January 1992.
[237] A. J. Paulraj and C. B. Papadias, “Space Time Processingfor Wireless Communications,”IEEE PersonalCommunications, vol. 14, pp. 49–83, November 1997.
[238] J. H. Winters, “Smart Antennas for Wireless Systems,”IEEE Personal Communications, vol. 1, pp. 23–27,February 1998.
[239] R. Kohno, “Spatial and Temporal Communication Theory Using Adaptive Antenna Array,”IEEE PersonalCommunications, vol. 1, pp. 28–35, February 1998.

508 BIBLIOGRAPHY
[240] H. Krim and M. Viberg, “Two Decades of Array Signal Processing Research,”IEEE Signal Processing Mag-azine, pp. 67–94, July 1996.
[241] G. V. Tsoulos, “Smart Antennas for Mobile Communication Systems: Benefits and Challenges,”IEE Elec-tronics and Communication Engineering Journal, vol. 11, pp. 84–94, April 1999.
[242] Special Issue on Active and Adaptive Antennas,IEEE Transactions on Antennas and Propagation, vol. AP-12. March 1964.
[243] Special Issue on Adaptive Antennas,IEEE Transaction on Antennas and Propagation, vol. AP-24. September1976.
[244] Special Issue on Adaptive Antennas,IEEE Transaction on Antennas and Propagation, vol. AP-34. March1986.
[245] A. Paulraj, R. Roy and T. Kailath, “A Subspace RotationApproach to Signal Parameter Estimation,” inProceedings of the IEEE, vol. 74, pp. 1044–1046, July 1986.
[246] J. H. Winters, “Signal Acquisition and Tracking with Adaptive Arrays in the Digital Mobile Radio SystemIS-54 with Flat Fading,”IEEE Transactions on Vehicular Technology, vol. 42, pp. 373–384, November 1993.
[247] L. C. Godara and D. B. Ward, “A General Framework for Blind Beamforming,”IEEE TENCON, pp. 1240–1243, June 1999.
[248] W. Pora, J. A. Chambers and A. G. Constantinides, “A Combined Kalman Filter and Constant ModulusAlgorithm Beamformer for Fast Fading Channels,”IEEE International Conference on Acoustics, Speech andSignal Processing, vol. 5, pp. 2925–2928, March 1999.
[249] J. H. Winters, J. Salz and R. D. Gitlin, “The Impact of Antenna Diversity on the Capacity of Wireless Com-munications System,”IEEE Transactions on Communications, vol. 42, February/March/April 1994.
[250] G. V. Tsoulos, M. A. Beach and S. C. Swales, “Adaptive Antennas for Third Generation DS-CDMA CellularSystems,”IEEE Vehicular Technology Conference, vol. 45, pp. 45–49, 1995.
[251] L. E. Brennan and I. S. Reed, “Theory of Adaptive Radar,” IEEE Transactions on Aerospace and ElectronicSystems, vol. AES-9, pp. 237–252, March 1973.
[252] L. E. Brennan, E. L. Pugh and I. S. Reed, “Control Loop Noise in Adaptive Array Antennas,”IEEE Transac-tions on Aerospace and Electronic Systems, vol. AES-7, pp. 254–262, March 1971.
[253] L. E. Brennan and I. S. Reed, “Effect of Envelope Limiting in Adaptive Array Control Loops,”IEEE Trans-actions on Aerospace and Electronic Systems, vol. AES-7, pp. 698–700, July 1971.
[254] L. E. Brennan, J. Mallet and I. S. Reed, “Adaptive Arrays in Airborne MTI Radar,”IEEE Transactions onAntennas and Propagation, vol. AP-24, pp. 607–615, September 1976.
[255] B. Widrow and J. M. McCool, “A Comparison of Adaptive Algorithms Based on the Method of SteepestDescent and Random Search,”IEEE Transactions on Antennas and Propagation, vol. AP-24, pp. 615–637,September 1976.
[256] R. O. Schmidt, “Multiple Emitter Location and Signal Parameter Estimation,”IEEE Transactions on Anten-nas Propagation, vol. AP-34, pp. 276–280, July 1986.
[257] R. Roy and T. Kailath , “ESPRIT-Estimation of Signal Parameters via Rotational Invariance Techniques,”IEEE Transactions on Acoustic, Speech and Signal Processing, vol. ASSP-37, pp. 984–995, July 1989.
[258] L. J. Griffiths, “A Simple Adaptive Algorithm for Real-time Processing in Antenna Arrays,” inProceedingsof the IEEE, vol. 57, pp. 1696–1704, October 1969.
[259] B. D. Van Veen and K. M. Buckley, “Beamforming: A Versatile Approach to Spatial Filtering,”IEEE Acous-tic, Speech and Signal Processing Magazine, pp. 4–24, April 1988.
[260] T. Chen, “Highlights of Statistical Signal and Array Processing,”IEEE Signal Processing Magazine, vol. 15,pp. 21–64, September 1998.
[261] C. Q. Xu, C. L. Law, S. Yoshida, “On Nonlinear Beamformingfor Interference Cancellation,” inIEEE Vehic-ular Technology Conference, May 2001.
[262] A. Margarita, S. J. Flores, L. Rubio, V. Almenar and J. L.Corral, “Application of MUSIC for Spatial Refer-ence Beamforming for SDMA in a Smart Antenna for GSM and DECT,”IEEE Vehicular Technology Con-ference, May 2001.

BIBLIOGRAPHY 509
[263] J. E. Hudson,Adaptive Array Principles. New York: Peter Peregrinus, Ltd., 1981.
[264] S. Haykin,Array Signal Processing. New Jersey: Prentice Hall, Inc., 1985.
[265] S. P. Applebaum, “Adaptive Arrays,” tech. rep., Syracuse University Research Corporation, 1965. Reprintedin IEEE Transactions on Antennas and Propagation, September1976.
[266] B. Widrow, P. E. Mantey, L. J. Griffiths, and B. B. Goode,“Adaptive Antenna Systems,”Proceedings of theIEEE, vol. 55, pp. 2143–2159, December 1967.
[267] O. L. Frost III, “An Algorithm for Linearly Constrained Adaptive Array Processing,”Proceedings of theIEEE, vol. 60, pp. 926–935, August 1972.
[268] L. J. Griffiths, “A Simple Adaptive Algorithm for Real-Time Processing in Antenna Arrays,”Proceedings ofthe IEEE, vol. 57, pp. 1696–1704, October 1969.
[269] L. C. Godara, “Applications of Antenna Arrays to Mobile Communications, Part II: Beam-Forming andDirection-of-Arrival Considerations,”Proceedings of the IEEE, vol. 85, pp. 1193–1245, August 1997.
[270] J. Capon, “High-resolution frequency-wavenumber spectrum analysis,”Proceedings of the IEEE, vol. 57,pp. 1408–1418, August 1969.
[271] I. S. Reed, J. D. Mallett, and L. E. Brennan, “Rapid Convergence Rate in Adaptive Arrays,”IEEE Transac-tions on Aerospace and Electronic Systems, vol. AES-10, pp. 853–863, November 1974.
[272] A. Paulraj and C. B. Papadias, “Space-Time Processing for Wireless Communications,”IEEE Signal Pro-cessing Magazine, pp. 49–83, November 1997.
[273] J. E. Hudson,Adaptive Array Principles. Peregrinus, London, 1981.
[274] S. Haykin,Adaptive Filter Theory. Prentice-Hall International, 1991.
[275] B. Widrow and S. Steams,Adaptive Signal Processing. Prentice-Hall, 1985.
[276] R. A. Monzingo and T. W. Miller,Introduction to Adaptive Arrays. John Wiley & Sons, Inc., 1980.
[277] J. H. Winters, “Smart Antennas for Wireless Systems,”IEEE Personal Communications, vol. 5, pp. 23–27,February 1998.
[278] U. Martin and I. Gaspard, “Capacity Enhancement of Narrowband CDMA by Intelligent Antennas,” inPro-ceedings of PIMRC, pp. 90–94, 1997.
[279] A. R. Lopez, “Performance Predictions for Cellular Switched-Beam Intelligent Antenna Systems,”IEEECommunications Magazine, pp. 152–154, October 1996.
[280] C. M. Simmonds and M. A. Beach, “Active Calibration of Adaptive Antenna Arrays for Third GenerationSystems,” inProceedings of ACTS Summit, 1997.
[281] H. Steyskal, “Digital Beamforming Antennas: An Introduction,” Microwave Journal, pp. 107–124, January1987.
[282] A. Mammela,Diversity receivers in a fast fading multipath channel. VTT Publications, 1995.
[283] W. Hollemans, “Performance Analysis of Cellular Digital Mobile Radio Systems including Diversity Tech-niques,” inProceedings of PIMRC, pp. 266–270, 1997.
[284] W. Tuttlebee, ed.,Cordless telecommunications in Europe : the evolution of personal communications. Lon-don: Springer-Verlag, 1990. ISBN 3540196331.
[285] H. Ochsner, “The digital european cordless telecommunications specification, DECT,” in Tuttlebee [284],pp. 273–285. ISBN 3540196331.
[286] P. Petrus, J. H. Reed, and T. S. Rappaport, “Effects of Directional Antennas at the Base Station on the DopplerSpectrum,”IEEE Communications Letters, vol. 1, pp. 40–42, March 1997.
[287] H. Krim and M. Viberg, “Two Decades of Array Signal Processing Research,”IEEE Signal Processing Mag-azine, pp. 67–94, July 1996.
[288] S. Ponnekanti, A. Pollard, C. Taylor, and M. G. Kyeong,“Flexibility for the deployment of adaptive antennasin the IMT-2000 framework and enhanced interference cancellation,” in Proceedings of ACTS Summit, 1997.
[289] J. H. Winters, J. Salz, and R. D. Gitlin, “The Impact of Antenna Diversity on the Capacity of Wireless Com-munication Systems,”IEEE Transactions on Communications, vol. 42, pp. 1740–1751, February/March/April1994.

510 BIBLIOGRAPHY
[290] M. Barnard and S. McLaughlin, “Reconfigurable terminals for mobile communication systems,”IEE Elec-tronics and Communication Engineering Journal, vol. 12, pp. 281–292, December 2000.
[291] S. M. Leach, A. A. Agius, and S. R. Saunders, “The intelligent quadrifilar helix antenna,”IEE Proceedingsof Microwave Antennas Propagation, pp. 219–223, June 2000.
[292] P. Petrus, R. B. Ertel, and J. H. Reed, “Capacity Enhancement Using Adaptive Arrays in an AMPS System,”IEEE Transactions on Vehicular Technology, vol. 47, pp. 717–727, August 1998.
[293] J. Laurila and E. Bonek, “SDMA Using Blind Adapation,”in Proceedings of ACTS Summit, 1997.
[294] M. C. Wells, “Increasing the capacity of GSM cellular radio using adaptive antennas,”IEE Proceedings onCommunications, vol. 143, pp. 304–310, October 1996.
[295] J. H. Winters, “Signal Acquisition and Tracking with Adaptive Arrays in the Digital Mobile Radio SystemIS-54 with Flat Fading,”IEEE Transactions on Vehicular Technology, vol. 42, November 1993.
[296] B. Widrow and E. Walach, “On the statistical efficiencyof the LMS algorithm with nonstationary inputs,”IEEE Trans. Information Theory - Special Issue on Adaptive Filtering, vol. 30, pp. 211–221, March 1984.
[297] Z. Raida, “Steering an Adaptive Antenna Array by the Simplified Kalman Filter,”IEEE Trans. on Antennasand Propagation, vol. 43, pp. 627–629, June 1995.
[298] M. W. Ganz, R. L. Moses, and S. L. Wilson, “Convergence of the SMI Algorithms with Weak Interference,”IEE Trans. Antenna Propagation, vol. 38, pp. 394–399, March 1990.
[299] H. Steyskal, “Array Error Effects in Adaptive Beamforming,” Microwave Journal, September 1991.
[300] M. C. Vanderveen, C. B. Papadias, and A. Paulraj, “Joint Angle and Delay Estimation (JADE) for MultipathSignals Arriving at an Antenna Array,”IEEE Communications Letters, vol. 1, pp. 12–14, January 1997.
[301] C. Passman and T. Wixforth, “A Calibrated Phased Array Antenna with Polarization Flexibility for theTsunami (II) SDMA Field Trial,” inProceedings of ACTS Summit, 1997.
[302] D. N. Godard, “Self-Recovering Equalization and Carrier Tracking in Two-Dimensional Data Communica-tion Systems,”IEEE Transactions on Communications, vol. COM-28, pp. 1876–1875, November 1980.
[303] Z. Ding, R. A. Kennedy, B. D. O. Anderson, and C. R. Johnson Jr, “Ill-Convergence of Godard Blind Equal-izers in Data Communication Systems,”IEEE Transactions on Communications, vol. 39, pp. 1313–1327,September 1991.
[304] J. E. Mazo, “Analysis of decision-directed equalizerconvergence,”Bell Systems Technical Journal, 1980.
[305] D. Gerlach and A. Paulraj, “Adaptive Transmitting Antenna Arrays with Feedback,”IEEE Signal ProcessingLetters, vol. 1, pp. 150–152, October 1994.
[306] D. Gerlach and A. Paulraj, “Base station transmitting antenna arrays for multipath environments,”SignalProcessing, pp. 59–73, 1996.
[307] T. Kanai, “Autonomous Reuse Partitioning in Cellular Systems,” inIEEE Proceedings of Vehicular Technol-ogy Conference, vol. 2, pp. 782–785, 1992.
[308] I. Katzela and M. Naghshineh, “Channel Assignment Schemes for Cellular Mobile Telecommunication Sys-tems: A Comprehensive Survey,”IEEE Personal Communications Magazine, vol. 3, pp. 10–31, June 1996.
[309] M. Dell’Anna and A. H. Aghvami, “Performance of optimum and sub-optimum combining at the antennaarray of a W-CDMA system,”IEEE Journal on Selected Areas in Communications, pp. 2123–2137, December1999.
[310] I. Howitt and Y. M. Hawwar, “Evaluation of Outage Probability Due to Cochannel Interference in Fading fora TDMA System with a Beamformer,” inProceedings of VTC, pp. 520–524, 1998.
[311] L. Ortigoza-Guerrero and A. H. Aghvami, “A self-adaptive prioritised hand-off DCA strategy for a microcel-lular environment,” inProceedings of PIMRC, (Helsinki, Finland), pp. 401–405, September 1997.
[312] L. Ortigoza-Guerrero and A. H. Aghvami, “A prioritisedhand-off dynamic channel allocation strategy forPCS,”IEEE Transactions on Vehicular Technology, pp. 1203–1215, July 1999.
[313] T. H. Le and H. Aghvami, “Fast channel access and DCA scheme for connection and connectionless-orientedservices in UMTS,”Electronics Letters, pp. 1048–1049, June 1999.
[314] L. Anderson, “A simulation study of some dynamic channel assignment algorithms in a high capacity mobiletelecommunications system,”IEEE Trans. on Communication, vol. 21, pp. 1294–1301, November 1973.

BIBLIOGRAPHY 511
[315] J. I. Chuang, “Performance issues and algorithms for dynamic channel assignment,”IEEE JSAC, vol. 11,pp. 955–963, August 1993.
[316] J. I. Chuang and N. Sollenberger, “Performance of autonomous dynamic channel assignment and powercontrol for TDMA/FDMA wireless access,”IEEE JSAC, vol. 12, pp. 1314–1323, October 1994.
[317] M. L. Cheng and J. I. Chuang, “Performance evaluation ofdistributed measurement-based dynamic channelassignment in local wireless communications,”IEEE JSAC, vol. 14, pp. 698–710, May 1996.
[318] I. ChihLin and C. PiHui, “Local packing - distributed dynamic channel allocation at cellular base station,” inProceedings of IEEE Globecom ’93, vol. 1, (Houston, TX, USA), pp. 293–301, Nov 29–Dec 2 1993.
[319] G. L. Stuber,Principles of Mobile Communcation. Kluwer Academic Publishers, 1996.
[320] A. Baiocchi, F. Delli-Priscoli, F. Grilli, and F. Sestini, “The geometric dynamic channel allocation as a prac-tical strategy in mobile networks with bursty user mobility,”IEEE Trans. on Vech. Tech., vol. 44, pp. 14–23,Feb 1995.
[321] F. D. Priscoli, N. P. Magnani, V. Palestini, and F. Sestini, “Application of dynamic channel allocation strategiesto the GSM cellular network,”IEEE Journal on Selected Areas in Comms., vol. 15, pp. 1558–1567, Oct 1997.
[322] P. J. Cherriman, F. Romiti, and L. Hanzo, “Channel Allocation for Third-generation Mobile Radio Systems,”in ACTS ’98, Rhodes, Greece, pp. 255–260, June 1998.
[323] R. B. Ertel, P. Cardieri, K. W. Sowerby, T. S. Rappaport, and J. H. Reed, “Overview of Spatial ChannelModels for Antenna Array Communications Systems,”IEEE Personal Communications, pp. 10–22, February1998.
[324] J. C. Liberti and T. S. Rappaport, “A Geometrically Based Model for Line-Of-Sight Multipath Radio Chan-nels,” inVTC Proceedings, pp. 844–848, 1996.
[325] S. W. Wales, “Technique for cochannel interference suppression in TDMA mobile radio systems,”IEE Proc.Communication, vol. 142, no. 2, pp. 106–114, 1995.
[326] J. Litva and T.Lo,Digital Beamforming in Wireless Communications. Artech House, London, 1996.
[327] L. Godara, “Applications of antenna arrays to mobile communications, part I: Performance improvement,feasibility, and system considerations,”Proceedings of the IEEE, vol. 85, pp. 1029–1060, July 1997.
[328] L. Godara, “Applications of antenna arrays to mobile communications, part II: Beam-forming and direction-of-arrival considerations,”Proceedings of the IEEE, vol. 85, pp. 1193–1245, Aug 1997.
[329] E. Sourour, “Time slot assignment techniques for TDMA digital cellular systems,”IEEE Trans. Vech. Tech.,vol. 43, pp. 121–127, Feb 1994.
[330] D. Wong and T. Lim, “Soft handoffs in CDMA mobile systems,”IEEE Personal Comms., pp. 6–17, December1997.
[331] S. Tekinay and B. Jabbari, “A measurement-based prioritisation scheme for handovers in mobile cellularnetworks,”IEEE JSAC, vol. 10, no. 8, pp. 1343–1350, 1992.
[332] G. P. Pollini, “Trends in handover design,”IEEE Comms. Mag., vol. 34, pp. 82–90, March 1996.
[333] R. C. Bernhardt, “Timeslot re-assignment in a frequencyreuse TDMA portable radio system,”IEEE Tr. onVech. Tech., vol. 41, pp. 296–304, August 1992.
[334] S. Glisic and P. Leppanen, eds.,Wireless Communications : TDMA versus CDMA. Kluwer Academic Pub-lishers, June 1997. ISBN 0792380053.
[335] A. H. M. Ross and K. S. Gilhousen, “CDMA technology and the IS-95 north american standard,” in Gibson[548], ch. 27, pp. 430–448.
[336] ETSI, Universal Mobile Telecommunications Systems (UMTS); UMTSTerrestrial Radio Access (UTRA);Concept evaluation, Dec 1997. TR 101 146 V3.0.0.
[337] I. Katzela and M. Naghshineh, “Channel assignment schemes for cellular mobile telecommunication systems:A comprehensive survey,”IEEE Personal Comms., pp. 10–31, June 1996.
[338] S. Tekinay and B. Jabbari, “Handover and channel assignment in mobile cellular networks,”IEEE Comms.Mag., pp. 42–46, November 1991.
[339] B. Jabbari, “Fixed and dynamic channel assignment,” in Gibson [548], ch. 83, pp. 1175–1181.

512 BIBLIOGRAPHY
[340] J. Zander, “Radio resource management in future wireless networks: Requirements and limitations,”IEEEComms. Magazine, pp. 30–36, Aug 1997.
[341] D. Everitt, “Traffic engineering of the radio interface for cellular mobile networks,”Proc. of the IEEE, vol. 82,pp. 1371–1382, Sept 1994.
[342] J. Dahlin, “Ericsson’s multiple reuse pattern for DCS1800,” Mobile Communications International, Novem-ber 1996.
[343] M. Madfors, K. Wallstedt, S. Magnusson, H. Olofsson, P. Backman, and S. Engstrom, “High capacity withlimited spectrum in cellular systems,”IEEE Comms. Mag., vol. 35, pp. 38–45, August 1997.
[344] A. Safak, “Optimal channel reuse in cellular radio systems with multiple correlated log-normal interferers,”IEEE Tr. on Vech. Tech, vol. 43, pp. 304–312, May 1994.
[345] H. Jiang and S. S. Rappaport, “Prioritized channel borrowing without locking: a channel sharing strategy forcellular communications,”IEEE/ACM Transactions on Networking, vol. 43, pp. 163–171, April 1996.
[346] J. Engel and M. Peritsky, “Statistically optimum dynamic server assignment in systems with interferingservers,”IEEE Trans. on Vehicular Tech., vol. 22, pp. 203–209, Nov 1973.
[347] M. Zhang and T. Yum, “Comparisons of channel assignment strategies in cellular mobile telephone systems,”IEEE Trans. on Vehicular Tech., vol. 38, pp. 211–215, Nov 1989.
[348] S. M. Elnoubi, R. Singh, and S. Gupta, “A new frequency channel assignment algorithm in high capacitymobile communications systems,”IEEE Trans. on Vehicular Tech., vol. 31, pp. 125–131, Aug 1982.
[349] M. Zhang and T. Yum, “The non-uniform compact pattern allocation algorithm for cellular mobile systems,”IEEE Trans. on Vehicular Tech., vol. 40, pp. 387–391, May 1991.
[350] S. S. Kuek and W. C. Wong, “Ordered dynamic channel assignment scheme with reassignment in highwaymicrocell,” IEEE Trans. on Vehicular Tech., vol. 41, pp. 271–277, Aug 1992.
[351] T. Yum and W. Wong, “Hot spot traffic relief in cellular systems,”IEEE Journal on selected areas in Comms.,vol. 11, pp. 934–940, Aug 1993.
[352] J. Tajima and K. Imamura, “A strategy for flexible channel assignment in mobile communication systems,”IEEE Trans. on Vehicular Tech., vol. 37, pp. 92–103, May 1988.
[353] ETSI,Digital European Cordless Telecommunications (DECT), 1st ed., October 1992. ETS 300 175-1 – ETS300 175-9.
[354] R. Steele, “Digital European Cordless Telecommunications (DECT) systems,” in Steele [155], ch. 1.7.2,pp. 79–83.
[355] S. Asghar, “Digital European Cordless Telephone,” inGibson [548], ch. 30, pp. 478–499.
[356] A. Law and L. B. Lopes, “Performance comparison of DCA call assignment algorithms within DECT,” inProceedings of IEEE VTC ’96[547], pp. 726–730.
[357] H. Salgado-Galicia, M. Sirbu, and J. M. Peha, “A narrowband approach to efficient PCS spectrum sharingthrough decentralized DCA access policies,”IEEE Personal Communications, pp. 24–34, Feb 1997.
[358] R. Steele, J. Whitehead, and W. C. Wong, “System aspectsof cellular radio,”IEEE Communications Maga-zine, vol. 33, pp. 80–86, Jan 1995.
[359] D. Cox and D. Reudink, “The behavior of dynamic channel-assignment mobile communications systems asa function of number of radio channels,”IEEE Trans. on Communications, vol. 20, pp. 471–479, June 1972.
[360] D. D. Dimitrijevic and J. Vuceric, “Design and performance analysis of the algorithms for channel allocationin cellular networks,”IEEE Trans. on Vehicular Tech., vol. 42, pp. 526–534, Nov 1993.
[361] D. C. Cox and D. O. Reudink, “Increasing channel occupancy in large scale mobile radio systems: Dynamicchannel reassignment,”IEEE Trans. on Vehicular Tech., vol. 22, pp. 218–222, Nov 1973.
[362] D. C. Cox and D. O. Reudink, “A comparison of some channel assignment strategies in large-scale mobilecommunications systems,”IEEE Trans. on Communications, vol. 20, pp. 190–195, April 1972.
[363] S. A. Grandhi, R. D. Yates, and D. Goodman, “Resource allocation for cellular radio systems,”IEEE Trans.Vech. Tech., vol. 46, pp. 581–587, Aug 1997.
[364] M. Serizawa and D. Goodman, “Instability and deadlock of distributed dynamic channel allocation,” inPro-ceedings of IEEE VTC ’93, (Secaucus, New Jersey, USA), pp. 528–531, May 18–20 1993.

BIBLIOGRAPHY 513
[365] Y. Akaiwa and H. Andoh, “Channel segregation - a self-organized dynamic channel allocation method: Appli-cation to tdma/fdma microcellular system,”IEEE Journal on Selected Areas in Comms., vol. 11, pp. 949–954,Aug 1993.
[366] E. D. Re, R. Fantacci, and G. Giambene, “Handover and dynamic channel allocation techniques in mobilecellular networks,”IEEE Trans. on Vech. Tech., vol. 44, pp. 229–237, May 1995.
[367] T. Kahwa and N. Georganas, “A hybrid channel assignmentscheme in large-scale, cellular-structured mobilecommunication systems,”IEEE Trans. on Communications, vol. 26, pp. 432–438, April 1978.
[368] J. S. Sin and N. Georganas, “A simulation study of a hybrid channel assignment scheme for cellular land-mobile radio systems with erlang-c service,”IEEE Trans. on Communications, vol. 29, pp. 143–147, Feb1981.
[369] S.-H. Oh and D.-W. Tcha, “Prioritized channel assignment in a cellular radio network,”IEEE Trans. onCommunications, vol. 40, pp. 1259–1269, July 1992.
[370] D. Hong and S. Rappaport, “Traffic model and performance analysis for cellular mobile radio telephone sys-tems with prioritizes and nonprioritized handoff procedures,” IEEE Trans. on Vehicular Technology, vol. 35,pp. 77–92, Aug 1986.
[371] R. Guerin, “Queueing-blocking system with two arrival streams and guard channels,”IEEE Trans. on Com-munications, vol. 36, pp. 153–163, Feb 1988.
[372] S. Grandhi, R. Vijayan, D. Goodman, and J. Zander, “Centralized power control in cellular radio systems,”IEEE Trans. Vech. Tech., vol. 42, pp. 466–468, Nov 1993.
[373] J. Zander, “Performance of optimum transmitter power control in cellular radio systems,”IEEE Tr. on Vehic-ular Technology, vol. 41, pp. 57–62, Feb 1992.
[374] J. Zander, “Distributed cochannel interference control in cellular radio systems,”IEEE Tr. on Vehicular Tech-nology, vol. 41, pp. 305–311, Aug 1992.
[375] A. Tanenbaum, “Introduction to queueing theory,” inComputer Networks, pp. 631–641, Prentice-Hall,2nd ed., 1989. ISBN 0131668366.
[376] D. C. Cox and D. O. Reudink, “Effects of some nonuniform spatial demand profiles on mobile radio systemperformance,”IEEE Trans. on Vehicular Tech., vol. 21, pp. 62–67, May 1972.
[377] P. J. Cherriman,Mobile Video Communications. PhD thesis, University of Southampton, 1998.
[378] R. C. French, “The Effect of Fading and Shadowing on Channel Reuse in Mobile Radio,”IEEE Transactionson Vehicular Technology, vol. 28, pp. 171–181, August 1979.
[379] W. Gosling, “A simple mathematical model of co-channel andadjacent channel interference in land mobileradio,” The Radio and Electronic Engineer, vol. 48, pp. 619–622, December 1978.
[380] R. Muammar and S. C. Gupta, “Cochannel Interference in High-Capacity Mobile Radio Systems,”IEEETransactions on Communications, vol. 30, pp. 1973–1978, August 1982.
[381] P. J. Cherriman and L. Hanzo, “Error-rate-based power-controlled multimode H.263-assisted video tele-phony,” IEEE Transactions on Vehicular Technology, vol. 48, pp. 1726–1738, September 1999.
[382] G. Foschini and Z. Miljanic, “Distributed Autonomous Wireless Channel Assignment Algorithm with PowerControl,” IEEE Transactions on Vehicular Technology, vol. 44, pp. 420–429, August 1995.
[383] J.-I. Chuang and N. Sollenberger, “Spectrum ResourceAllocation for Wireless Packet Access with Applica-tion to Advanced Cellular Internet Service,”IEEE Journal On Selected Areas in Communications, vol. 16,pp. 820–829, August 1998.
[384] J. M. Torrance, L. Hanzo, and T. Keller, “InterferenceAspects of Adaptive Modems over Slow RayleighFading Channels,”IEEE Transactions on Vehicular Technology, vol. 48, pp. 1527–1545, September 1999.
[385] C. H. Wong and L. Hanzo, “Upper-bound performance of a wideband burst-by-burst adaptive mode,”IEEETransactions on Communications, March 2000.
[386] “3rd Generation Partnership Project; Technical Specification Group Radio Access Network; Spreading andmodulation (FDD).” 3G TS 25.213 V3.2.0 (2000-03).
[387] “3rd Generation Partnership Project; Technical Specification Group Radio Access Network; Physical layerprocedures (FDD).” 3G TS 25.214 V3.2.0 (2000-03).

514 BIBLIOGRAPHY
[388] A. D. Whalen,Detection of signals in noise. Academic Press, 1971.
[389] W. T. Webb and L. Hanzo,Modern Quadrature Amplitude Modulation: Principles and Applications for Fixedand Wireless Channels. John Wiley and IEEE Press, 1994.
[390] R. L. Pickholtz, L. B. Milstein, and D. L. Schilling, “Spread spectrum for mobile communications,”IEEETransactions on Vehicular Technology, vol. 40, pp. 313–322, May 1991.
[391] K. S. Gilhousen, I. M. Jacobs, R. Padovani, A. J. Viterbi, L. A. Weaver, and C. E. Wheatley, “On the capacityof a cellular CDMA system design,”IEEE Transactions on Vehicular Technology, vol. 40, pp. 303–312, May1991.
[392] L. Wang and A. H. Aghvami, “Optimal power allocation based on QoS balance for a multi-rate packet CDMAsystem with multi-media traffic,” inProceedings of Globecom, (Rio de Janeiro, Brazil), pp. 2778–2782,December 1999.
[393] D. Koulakiotis and A. H. Aghvami, “Data detection techniques for DS/CDMA mobile systems: A review,”IEEE Personal Communications, pp. 24–34, June 2000.
[394] P. J. Cherriman, E. L. Kuan, and L. Hanzo, “Burst-by-burst adaptive joint-detection CDMA/H.263 basedvideo telephony,” inProceedings of the ACTS Mobile Communications Summit, Sorrento, Italy, pp. 715–720,June 1999.
[395] J. Laiho-Steffens, A. Wacker, and P. Aikio, “The Impactof the Radio Network Planning and Site Con-figuration on the WCDMA Network Capacity and Quality of Service,” in IEEE Proceedings of VehicularTechnology Conference, (Tokyo, Japan), pp. 1006–1010, 2000.
[396] R. D. Kimmo Hiltunen, “WCDMA Downlink Capacity Estimation,” in IEEE Proceedings of Vehicular Tech-nology Conference, (Tokyo, Japan), pp. 992–996, 2000.
[397] K. Sipila, Z.-C. Honkasalo, J. Laiho-Steffens, and A. Wacker, “Estimation of Capacity and Required Trans-mission Power of WCDMA Downlink Based on a Downlink Pole Equation,” in IEEE Proceedings of Vehic-ular Technology Conference, (Tokyo, Japan), pp. 1002–1005, 2000.
[398] “GSM 06.90: Digital cellular telecommunications system (Phase 2+).” Adaptive Multi-Rate (AMR) speechtranscoding, version 7.0.0, Release 1998.
[399] S. Bruhn, E. Ekudden, and K. Hellwig, “Adaptive Multi-Rate: A new speech service for GSM and beyond,”in Proceedings of 3rd ITG Conference on Source and Channel Coding, (Technical Univ. Munich, Germany),pp. 319–324, 17th-19th, January 2000.
[400] S. Bruhn, P. Blocher, K. Hellwig, and J. Sjoberg, “Concepts and Solutions for Link Adaptation and InbandSignalling for the GSM AMR Speech Coding Standard,” inProceedings of VTC, (Houston, Texas, USA),16-20 May 1999.
[401] R. Owen, P. Jones, S. Dehgan, and D. Lister, “Uplink WCDMA capacity and range as a function of inter-to-intra cell interference: theory and practice,” inIEEE Proceedings of Vehicular Technology Conference, vol. 1,(Tokyo, Japan), pp. 298–303, 2000.
[402] J. S. Blogh and L. Hanzo,Third-Generation Systems and Intelligent Wireless Networking - Smart Antennasand Adaptive Modulation. John Wiley and IEEE Press, 2002.
[403] J. S. Blogh and L. Hanzo, “Adaptive Antenna Assisted Network Performance of FDD-Mode UMTS,” inProceedings of the IEEE Vehicular Technology Conference 2001 Spring, (Rhodes, Greece), pp. 2455–2459,May, 2001.
[404] J. S. Blogh and L. Hanzo, “The Network Performance of Multi-Rate FDD-Mode UMTS,” inProceedings ofthe IEEE Vehicular Technology Conference 2001 Fall, (Atlantic City, USA), pp. 1294–1298, October, 2001.
[405] L. Hanzo, C. Wong, and M. Yee,Adaptive wireless transceivers: Turbo-Coded, Turbo-Equalised and Space-Time Coded TDMA, CDMA and OFDM systems. John Wiley and IEEE Press, 2002.
[406] F. Adachi, M. Sawahashi, and K. Okawa, “Tree-structured Generation of Orthogonal Spreading Codes withDifferent Lengths for Forward Link of DS-CDMA Mobile,”IEE Electronics Letters, vol. 33, no. 1, pp. 27–28,1997.
[407] S. Stanczak, H. Boche, and M. Haardt, “Are LAS-codes a miracle?,” inProceedings of the IEEE GlobalTelecommunications Conference, GLOBECOM ’01, (San Antonio, Texas, USA), pp. 589–593, November,2001.

BIBLIOGRAPHY 515
[408] D. Li, “A high spectrum efficient multiple access code,”Chinese Journal of Electronics, vol. 8, pp. 221–226,July 1999.
[409] N. B. Mehta, L. J. Greenstein, T. M. Willis, and Z. Kostic, “Analysis and Results for the Orthogonality Factorin WCDMA Downlinks,” in Proceedings of the IEEE Vehicular Technology Conference 2002 Spring, vol. 1,(Birmingham, AL, USA), pp. 100–104, 6-9 May 2002.
[410] M. Hunukumbure, M. Beach, and B. Allen, “Downlink Orthogonality Factor in UTRA FDD Systems,”IEEElectronics Letters, vol. 38, pp. 196–197, February 2002.
[411] R. Assarut, K. Kawanishi, R. Deshpande, U. Yamamoto, andY. Onozato, “Performance evaluation of Or-thogonal Variable-Spreading-Factor Code Assignment Schemes in W-CDMA,” in Proceeding of the IEEEInternational Conference on Communications ICC’2002, vol. 5, (New York, USA), pp. 3050–3054, 28 April- 2 May 2002.
[412] K. I. Pedersen and P. E. Mogensen, “The Downlink Orthogonality Factors Influence on WCDMA SystemPerformance,” inProceedings of the IEEE Vehicular Technology Conference 2002 Fall, vol. 4, (Vancouver,Canada), pp. 2061–2065, 24-28 September 2002.
[413] S. Ni, H. Wei, J. S. Blogh, and L. Hanzo, “Network Performance of Asynchronous UTRA-like FDD/CDMASystems using Loosely Synchronised Spreading Codes,” inProceedings of the IEEE Vehicular TechnologyConference 2003 Fall, vol. 2, (Orlando, USA), pp. 1359 – 1363, October, 2003.
[414] B. J. Choi and L. Hanzo, “On the Design of LAS Spreading Codes,” inProceedings of the IEEE VehicularTechnology Conference 2002 Fall, vol. 4, (Vancouver, Canada), pp. 2172–2176, 24-28 September 2002.
[415] H. Wei, L. Yang, and L. Hanzo, “Interference-free broadband single- and multicarrier ds-cdma,”IEEE Com-munications Magazine, vol. 43, pp. 68–73, February 2005.
[416] H. Wei and L. Hanzo, “On the Uplink Performance of LAS-CDMA,” in To appear in the IEEE VehicularTechnology Conference 2005 Spring, (Stockholm, Sweden), 30 May-1 June 2005.
[417] C.-C. Tseng and C. L. Liu, “Complementary Sets of Sequences,” IEEE Transactions on Information Theory,vol. 18, pp. 644–652, September 1972.
[418] R. L. Frank, “Polyphase Complementary Codes,”IEEE Transactions on Information Theory, vol. 26, pp. 641–647, November 1980.
[419] R. Sivaswamy, “Multiphase Complementary Codes,”IEEE Transactions on Information Theory, vol. 24,pp. 546–552, September 1987.
[420] L. Hanzo, L. L. Yang, E. L. Kuan, and K. Yen,Single- and Multi-carrier DS-CDMA. John Wiley and IEEEPress, 2003.
[421] H. Wei, L. Yang, and L. Hanzo, “Interference-free broadband single- and multicarrier ds-cdma,”IEEE Com-munications Magazine, vol. 43, pp. 68–73, February 2005.
[422] L. Hanzo, P. J. Cherriman, and J. Streit,Wireless Video Communications. John Wiley and IEEE Press, NewYork, 2001.
[423] B. Walke,Mobile Radio Networks - Networking, Protocols and Traffic Performance, 2nd Edition. John Wileyand Sons, IEEE Press, New York, 2002.
[424] M. Soleimanipour, W. Zhuang, and G. H. Freeman, “Modelling and resource allocation in wireless multi-media CDMA system,” inProceedings of the IEEE Vehicular Technology Conference 1998 Spring, vol. 2,(Ottawa, Canada), pp. 1279–1283, 18-21 May 1998.
[425] A. S. Acampora and M. Naghshinen, “Control and Quality-of-Service Provisioning in High-Speed Microcel-lular Networks,”IEEE Personal Communications, vol. 1, pp. 36–43, 2nd Quarter 1994.
[426] L. Hanzo, M. Muenster, B. Choi, and T. Keller,OFDM and MC-CDMA for Broadband Multi-user Commu-nications, WLANs and Broadcasting. John Wiley and IEEE Press, 2003.
[427] N. Yee, J.-P. Linnartz, and G. Fettweis, “Multicarrier CDMA in indoor wireless radio networks,” inPro-ceedings of the IEEE Personal, Indoor and Mobile Radio Communications, PIMRC’93, vol. 1, pp. 109–113,1993.
[428] K. Fazel and L. Papke, “On the performance of convolutionally-coded CDMA/OFDM for mobile communi-cation system,” inProceedings of the IEEE Personal, Indoor and Mobile Radio Communications, PIMRC’93,vol. 1, pp. 468–472, 1993.
516 BIBLIOGRAPHY
[429] A. Chouly, A. Brajal, and S. Jourdan, “Orthogonal multicarrier techniques applied to direct sequence spreadspectrum CDMA systems,” inProceedings of the IEEE Global Telecommunications Conference 1993, (Hous-ton, TX, USA), pp. 1723–1728, 29 November – 2 December 1993.
[430] V. M. DaSilva and E. S. Sousa, “Performance of orthogonal CDMA codes for quasi-synchronous communica-tion systems,” inProceedings of the IEEE International Conference on Universal Personal Communications,ICUPC ’93, (Ottawa, Canada), pp. 995–999, October 1993.
[431] L. Vandendorpe, “Multitone direct sequence CDMA system in an indoor wireless environment,” inPro-ceedings of the IEEE Symposium on Communications and Vehicular Technology, SCVT1993, (Delft, TheNetherlands), pp. 4.1.1–4.1.8, October 1993.
[432] R. Prasad and S. Hara, “Overview of multicarrier CDMA,”IEEE Communications Magazine, vol. 35,pp. 126–133, December 1997.
[433] R. Prasad and S. Hara, “Overview of multi-carrier CDMA,” in Proceedings of the IEEE International Sympo-sium on Spread Spectrum Techniques and Applications ISSSTA’1996, (Mainz, Germany), pp. 107–114, 22–25September 1996.
[434] D. I. Scott, P. M. Grant, S. McLaughlin, G. Povey, and D.Cruickshank, “Research in reconfigurable termi-nal design for mobile and personal communications,” tech. rep., Department of Electrical Engineering, TheUniversity of Edinburgh, March 1997.
[435] N. Yee and J. P. Linnartz, “MICRO 93-101: Multi-carrier CDMA in an indoor wireless radio channel,” tech.rep., University of California at Berkeley, 1994.
[436] “COST 207 : Digital land mobile radio communications, final report,” tech. rep., Office for Official Publica-tions of the European Communities, Luxembourg, 1989.
[437] M. Haardt, A. Klein, R. Koehn, S. Oestreich, M. Purat, V. Sommer, and T. Ulrich, “The TD-CDMA BasedUTRA TDD Mode,” IEEE Journal on Selected Areas in Communications, vol. 18, pp. 1375–1385, August2000.
[438] J. Gibson,The Mobile Communications Handbook. CRC PRESS, 1996.
[439] W. Lu, B. Walke, and X. Shen, “4G mobile communications: toward open wireless architecture,”IEEEPersonal Communications, vol. 11, pp. 4–6, April 2004.
[440] The UMTS Forum website.http://www.umts-forum.org/.
[441] T. Le and H. Aghvami, “Fast channel access and DCA scheme for connection and connectionless-orientedservices in UMTS,”IEE Electronics Letters, vol. 35, pp. 1048–1049, June 1999.
[442] B. Walke, M. Althoff, and P. Seidenberg,UMTS - A Comprehensive Introduction. John Wiley and Sons, IEEEPress, New York, 2002.
[443] R. Steele and L. Hanzo,Mobile Radio Communications. Piscataway, NJ: IEEE Press, 1999.
[444] T. Kriengchaiyapruk and I. Forkel, “Adaptive switching point allocation in TD/CDMA systems,” inProceed-ings of the IEEE Vehicular Technology Conference 2002 Fall, vol. 3, (Vancouver, Canada), pp. 1456–1460,24-28 September 2002.
[445] J. Laiho, A. Wacker, and T. Novosad,Radio Network Planning and Optimisation for UMTS. John Wiley &Sons, Ltd. and IEEE Press, 2002.
[446] H. Holma, G. J. R. Povey, and A. Toskala, “Evaluation Interference Between Uplink and Downlink inUTRA/TDD,” in Proceedings of the IEEE Vehicular Technology Conference 1999 Fall, vol. 5, (Amsterdam,the Netherlands), pp. 2616–2620, 19-22 September 1999.
[447] H. Haas, S. McLaughlin, and G. J. R. Povey, “A Novel Interference Resolving Algorithm for the TDD TD-CDMA Mode in UMTS,” in Proceedings of the IEEE International Symposium on Personal, Indoor andMobile Radio Communications, vol. 2, (London, UK), pp. 1231–1235, September 2000.
[448] T. Kriengchaiyapruk,Dynamic Channel Allocation in UTRA-TDD. PhD thesis, Lehrstuhl fur Kommunika-tionsnetze, July 2004.
[449] Q. Y. Miao, W. B. Wang, and D. C. Yang, “The Coexistence of UTRA-TDD and FDD System In the AdjacentChannel,” inProceedings of the IEEE Global Telecommunications Conference, Globecom 2001, vol. 6, (SanAntonio, U.S.A.), pp. 3714–3718, November 2001.

BIBLIOGRAPHY 517
[450] T. L. Lee, C. Faure, and D. Grandblaise, “Impact of FDD/TDD Co-Existence on Overall UMTS SystemPerformance,” inProceedings of the IEEE Vehicular Technology Conference 2001 Spring, vol. 4, (Rhodes,Greece), pp. 2655–2659, May 2001.
[451] H. Haas, S. McLaughlin, and G. Povey, “Capacity-coverage analysis of TDD and FDD Mode in UMTS at1920MHz,” IEE Electronics and Communication Engineering Journal, vol. 149, pp. 51–57, February 2002.
[452] I. Forkel, P. Seidenberg, R. Pabst, and G. Heidelberger, “Performance Evaluation of Power Control Algo-rithms in Cellular UTRA Systems,”3G Mobile Communication Technologies (3G 2001), pp. 11–15, March2001.
[453] J. Kurjenniemi, S. Hamalainen, T. Ristaniemi, O. Lehtinen, and P. Patronen, “Convergence of UTRA TDDUplink Power Control,” inProceedings of the IEEE Vehicular Technology Conference 2001 Spring, vol. 4,(Rhodes, Greece), pp. 2908–2912, May 2001.
[454] J. Wen, J. Sheu, and J. Chen, “An Optimum Downlink Power Control Method for CDMA Cellular Mo-bile Systems,” inProceedings of the IEEE International Conference on Communication, ICC2001, vol. 6,(Helsinki, Finland), pp. 1738–1742, Jun 2001.
[455] J. Kurjenniemi, S. Hamalainen, and T. Ristaniemi, “Uplink Power Control in UTRA TDD,”in Proceedingsof the IEEE International Conference on Communication, ICC2001, vol. 5, (Helsinki, Finland), June 2001.
[456] Q. Wu, “Performance of optimum transmitter power controlin CDMA cellular mobile systems,”IEEE Trans-actions on Vehicular Technology, vol. 48, pp. 571–575, March 1999.
[457] R. Choi and R. Murch, “Evaluation of a Pre-Rake Smart Antenna System for TDD CDMA Systems,” inProceedings of the IEEE Vehicular Technology Conference 2002 Fall, vol. 1, (Vancouver, Canada), pp. 346–350, September 2002.
[458] R. Machauer, M. Iurascu, and F. Jondral, “FFT Speed Multiuser Detection for High Rate Data Mode inUTRA-FDD,” in Proceedings of the IEEE Vehicular Technology Conference 2001 Fall, vol. 1, (AtlanticU.S.A.), pp. 502–505, October 2001.
[459] S. Ni, J. S. Blogh, and L. Hanzo, “On the network performance of UTRA-like TDD and FDD CDMA systemsusing adaptive modulation and adaptive beamforming,” inProceedings of the IEEE Vehicular TechnologyConference 2003 Spring, vol. 1, (Jeju, Korea), pp. 606 – 610, April, 2003.
[460] X. Wu, L.-L. Yang, and L. Hanzo, “Uplink capacity investigations of TDD/CDMA,” in Proceedings of theIEEE Vehicular Technology Conference, VTC Spring 2002, vol. 2, (Birmingham, Alabama, USA), pp. 997 –1001, 6-9 May 2002.
[461] S. Tekinay and B. Jabbari, “Handover and channel assignment in mobile cellular networks,”IEEE Communi-cations Magazine, vol. 29, pp. 42–46, November 1991.
[462] E. Berruto, M. Gudmundson, R. Menolascino, W. Mohr, andM. Pizarroso, “Research activities on UMTSradio interface, network architectures, and planning,”IEEE Communications Magazine, vol. 36, pp. 82–95,Feburary 1998.
[463] I. Katzela and M. Naghshineh, “Channel assignment schemes for cellular mobile telecommunication systems:a comprehensive survey,”IEEE Personal Communications, vol. 3, pp. 10–31, June 1996.
[464] B. Jabbari, “Teletraffic aspects of evolving and next-generation wireless communication networks,”IEEEPersonal Communications, vol. 3, pp. 4–9, December 1996.
[465] N. D. Tripathi, J. H. Reed, and H. F. VanLandinoham, “Handoff in cellular systems,”IEEE Personal Commu-nications, vol. 5, pp. 26–37, December 1998.
[466] R. Vijayan and J. Holtzman, “A model for analyzing handoff algorithms,” IEEE Transactions on VehicularTechnology, vol. 42, pp. 351–356, August 1993.
[467] J. Wang, J. Liu, and Y. Cen, “Handoff algorithms in dynamic spreading WCDMA system supporting mul-timedia traffic,” IEEE Journal on Selected Areas in Communications, vol. 21, pp. 1652–1662, December2003.
[468] D. Lugara, J. Tartiere, and L. Girard, “Performance of UMTS to GSM handover algorithms,” inProceed-ings of the IEEE International Symposium on Personal, Indoor and Mobile Radio Communications, vol. 1,(Barcelona, Spain), pp. 444–448, 5-8 September 2004.
[469] O. Grimlund and B. Gudmundson, “Handoff strategies in microcellular,” inProceedings of the IEEE Vehicu-lar Technology Conference, pp. 505–510, 19-22 May 1991.

518 BIBLIOGRAPHY
[470] A. Viterbi, A. Viterbi, K. Gilhousen, and E. Zehavi, “Soft handoff extends CDMA cell coverage and increasesreverse link capacity,”IEEE Journal on Selected Areas in Communications, vol. 12, pp. 1281–1288, October1994.
[471] E. Nakano, N. Umeda, and K. Ohno, “Performance of diversity handover in DS-CDMA cellular systems,”in Proceedings of the IEEE 4th International Conference on Universal Personal Communications, (Tokyo,Japan), pp. 421–425, November 1995.
[472] Y.-I. Kim, K.-J. Lee, and Y.-O. Chin, “Analysis of multi-level threshold handoff algorithm,” inProceedings ofthe IEEE Global Telecommunications Conference, GLOBECOM ’96, vol. 2, (London, UK), pp. 1141–1145,November 1996.
[473] D. Wong and D. Cox, “A handoff algorithm using pattern recognition,” inProceedings of the IEEE Interna-tional Conference on Universal Personal Communications, vol. 1, (Florence, Italy), pp. 759–763, October1998.
[474] S. Tekinay and B. Jabbari, “A measurement-based prioritization scheme for handovers in mobile cellularnetworks,”IEEE Journal on Selected Areas in Communications, vol. 10, pp. 1343–1350, October 1992.
[475] D. Calin and D. Zeghlache, “Performance and handoff analysis of an integrated voice-data cellular system,”in Proceedings of the IEEE 8th International Symposium on Personal, Indoor and Mobile Radio Communi-cations, vol. 2, (Helsinki, Finland), pp. 386–390, 1997.
[476] N. Benvenuto and F. Santucci, “A least squares path-loss estimation approach to handover algorithms,”IEEETransactions on Vehicular Technology, vol. 48, pp. 437–447, March 1999.
[477] F. Santucci, M. Pratesi, M. Ruggieri, and F. Graziosi,“A general analysis of signal strength handover algo-rithms with cochannel interference,”IEEE Transactions on Communications, vol. 48, pp. 231–241, February2000.
[478] X. Yang, S. Ghaheri-Niri, and R. Tafazolli, “Performance of power-triggered andEc/N0-triggered soft han-dover algorithms for UTRA,” inSecond International Conference on 3G Mobile Communication Technolo-gies, no. 477, (London, UK), pp. 7–10, 2001.
[479] S. Wang, S. Sridhar, and M. Green, “Adaptive soft handoff method using mobile location information,” inProceedings of the IEEE Vehicular Technology Conference 2002 Spring, vol. 4, (Birmingham, Alabama,USA), pp. 1936 – 1940, 6-9 May 2002.
[480] H. Persson and J. Karlsson, “Maintaining QoS by utilizing hierarchical wireless systems,” inProceedingsof The 9th Asia-Pacific Conference on Communications, vol. 1, (Penang, Malaysia), pp. 292–296, 21-24September 2003.
[481] A. Tolli, I. Barbancho, J. Gomez, and P. Hakalin, “Intra-system load balancing between adjacent GSM cells,”in Proceedings of the IEEE Vehicular Technology Conference, vol. 1, (Jeju Island, Korea), pp. 393 – 397,22-25 April 2003.
[482] J. Kim, D. H. Kim, P. jung Song, and S. Kim, “Design of optimumparameters for handover initiation inWCDMA,” in Proceedings of the IEEE Vehicular Technology Conference, vol. 4, (Atlantic City, NJ, USA),pp. 2768 – 2772, 7-11 October 2001.
[483] B. Singh, K. Aggarwal, and S. Kumar, “An analytical modelfor intersystem handover,” inProceedings of theIEEE Conference on Convergent Technologies for Asia-Pacific Region, vol. 4, (Bangalore, India), pp. 1311–1315, 15-17 October 2003.
[484] G. Durastante and A. Zanella, “An efficient monitoring strategy for intersystem handover from TD-SCDMAto GSM networks,” inProceedings of the IEEE International Symposium on Personal, Indoor and MobileRadio Communications (PIMRC) 2002, vol. 4, (Lisbon, Portugal), pp. 1555 – 1560, 15-18 September2002.
[485] M. Iwamura and A. Aghvami, “Impact of handover blocking oncontrol load, capacity and coverage of W-CDMA downlink,” in Proceedings of the IEEE International Symposium on Personal, Indoor and MobileRadio Communications (PIMRC) 2004, vol. 1, (Barcelona, Spain), pp. 350 – 354, 5-8 September 2004.
[486] K. Hiramatsu, K. Miya, O.Kato, and K. Homma, “Transmit diversity applied on the CDMA/TDD cellularsystems,” inProceedings of the IEEE Vehicular Technology Conference, vol. 2, (Tokyo, Japan), pp. 1170 –1174, 15-18 May 2000.
[487] P. Chaudhury, W. Mohr, and S. Onoe, “The 3gpp proposal for imt-2000,” IEEE Communications Magazine,vol. 37, pp. 72–81, December 1999.

BIBLIOGRAPHY 519
[488] J. Rodriguez, X. Yang, R. Tafazolli, D. Huy, V. Monteiro, and A. Gameiro, “Dynamic System Level Per-formance for MC-CDMA Scheme,” inProceedings of the European Wireless Conference 2004, (Barcelona,Spain), 24-27 February 2004.
[489] S. H. Hwang and L. Hanzo, “Effects of multipath propagation delay on uplink performance of synchronousDS-CDMA systems communicating in dispersive Rayleigh fading channels,”IEE Electronics Letters, vol. 40,pp. 1589 – 1591, December 2004.
[490] TS25.201, “Technical Specification Group Radio Access Network; Physical layer - General description,”3GPP TSG R6, v6.0.0, 2003-12.
[491] X. Yang, S. Ghaheri-Niri, and R. Tafazolli, “Evaluation of soft handover algorithms for UMTS,” inProceed-ings of the IEEE International Symposium on Personal, Indoor and Mobile Radio Communications (PIMRC)2000, vol. 2, (London, UK), pp. 772 – 776, 18-21 September 2000.
[492] N. Binucci, K. Hiltunen, and M. Caselli, “Soft handover gain in WCDMA,” in Proceedings of the IEEEVehicular Technology Conference, vol. 3, (Boston, MA, USA), pp. 1467 – 1472, 24-28 September 2000.
[493] K. Sipila, M. Jasberg, J. Laiho-Steffens, and A. Wacker, “Soft handover gains in a fast power controlledWCDMA uplink,” in Proceedings of the IEEE Vehicular Technology Conference 1999 Spring, vol. 2, (Hous-ton, Texas, USA), pp. 1594 – 1598, 16-20 May 1999.
[494] W. L. Lim, Y. C. Foo, and R. Tafazolli, “Adaptive softer handover algorithm for high altitude platform sta-tion UMTS with onboard power resource sharing,” inProceedings of the IEEE International Symposium onWireless Personal Multimedia Communications, vol. 1, (Hawaii, USA), pp. 52 – 56, 27-30 October 2002.
[495] W.-U. Pistelli and R. Verdone, “Downlink capacity forWCDMA with soft and softer handover; advantagesof unbalanced received powers,” inProceedings of the IEEE International Symposium on Wireless PersonalMultimedia Communications, vol. 1, (Hawaii, USA), pp. 77 – 81, 27-30 October 2002.
[496] R. Verdone and A. Zanella, “Performance of received power and traffic driven handover algorithms in urbancellular networks,”IEEE Transactions on Wireless Communications, vol. 9, pp. 60 – 70, February 2002.
[497] TS25.331, “Technical Specification Group Radio Access Network; Radio Resource Control (RRC),”3GPPTSG R6, v6.0.1, 2004-01.
[498] R. Owen, P. Jones, and S. D. adn D. Lister, “Uplink WCDMA capacity and range as a function of inter-to-intra cell interference: theory and pratice,” inProceedings of the IEEE Vehicular Technology Conference2000 Spring, vol. 1, (Tokyo, Japan), pp. 298–303, 2000.
[499] D. Calin and M. Areny, “Impact of Radio Resource Allocation Policies on the TD-CDMA System Per-formance: Evaluation of Major Critical Parameters,”IEEE Journal on Selected Areas in Communications,vol. 19, pp. 1847–1859, October 2001.
[500] TS25.105, “Technical Specification Group Radio Access Network; Base Station (BS) radio transmission andreception (TDD),”3GPP TSG R6, v6.0.0, 2003-12.
[501] J. Kurjenniemi, S. Hamalainen, and T. Ristanlemi, “UTRA TDD handover performance,” inProceedings ofthe IEEE Global Telecommunications Conference, GLOBECOM ’01, vol. 1, (San Antonio, Texas, USA),pp. 533–537, 2001.
[502] TS25.123, “Technical Specification Group Radio Access Network; Requirements for support of radio re-source management,”3GPP TSG R6, v6.0.0, 2003-12.
[503] A. Chockalingam, P. Dietrich, L. Milstein, and R. Rao, “Performance of closed-loop power control in DS-CDMA cellular systems,”IEEE Transactions on Vehicular Technology, vol. 47, pp. 774–789, August 1998.
[504] R. Gejji, “Forward-link-power control in CDMA cellular-systems,”IEEE Transactions on Vehicular Technol-ogy, vol. 41, pp. 532–536, November 1992.
[505] J. Dunlop, J. Irvine, and B. Manzanedo, “Power controlin a cellular adaptive air interface,”IEE ElectronicsLetters, vol. 32, pp. 1968–1969, October 1996.
[506] B. Manzanedo, P. Cosimini, J. Irvine, and J. Dunlop, “Implementation and assessment of adaptive powercontrol in a 3rd generation cellular system,” inProceedings of the IEEE Vehicular Technology Conference1996 Spring, vol. 2, (Atlanta, USA), pp. 1135 – 1139, 28 April-1 May 1996.
[507] TS25.104, “Technical Specification Group Radio Access Network; Base Station (BS) radio transmission andreception (FDD),”3GPP TSG R6, v6.7.0, 2004-09.

520 BIBLIOGRAPHY
[508] TS25.222, “Technical Specification Group Radio Access Network; Multiplexing and channel coding (TDD),”3GPP TSG R6, v6.0.0, 2003-12.
[509] TS25.224, “Technical Specification Group Radio Access Network; Physical layer procedures (TDD),”3GPPTSG R6, v6.2.0, 2004-09.
[510] J. Kurjenniemi, O. Lehtinen, and T. Ristaniemi, “Signaled step size for downlink power control of dedicatedchannels in UTRA TDD,” in4th International Workshop On Mobile and Wireless Communications Network,2002, vol. 1, (Stockholm, Sweden), pp. 675–679, 2002.
[511] J. D. Gibson,The Communications Handbook. CRC Press and IEEE Press, Boca Ration, Florida, 1997.
[512] “3rd Generation Partnership Project; Technical Specification Group Radio Access Network; Physical layerprocedures (TDD).” 3G TS 25.224 V4.3.0 (2001-12).
[513] D. Goldberg,Genetic Algorithms in Search, Optimization, and Machine Learning. ISBN 0201157675, MAUSA: Addison-Wesley, August 2001.
[514] J. Holland,Adaptation in Natural and Artificial Systems. Ann Arbor, Michigan: University of MichiganPress, 1975.
[515] M. Mitchell, An Introduction to Genetic Algorithms. Cambridge, Massachusetts: MIT Press, 1996.
[516] D. Whitley, “A Genetic Algorithm Tutorial,”Statistics and Computing, vol. 4, pp. 65 – 85, June 1994.
[517] S. Forrest, “Genetic algorithms: Principles of natural selection applied to computation,”Science, vol. 261,pp. 872 – 878, August 1993.
[518] H. Muhlenbein,Foundations of Genetic Algorithms, ch. Evolution in time and space – The Parallel GeneticAlgorithm, pp. 316–337. California, USA: G. Rawlins, ed., Morgan Kaufmann, 1991.
[519] J. J. Grefenstette and J. E. Baker, “How genetic algorithms work: A critical look at implicit parallelism,” inProceedings of the IEEE Third International Conference on Genetic Algorithms(J. D. Schaffer, ed.), (Cali-fornia, USA), pp. 20–27, Morgan Kaufmann, 1989.
[520] A. Wolfgang, N. N. Ahmad, S. Chen, and L. Hanzo, “Geneticalgorithm assisted minimm bit error ratebeamforming,” inCDROM of the IEEE 59th Vehicular Technology Conference, vol. 1, (Milan Italy), pp. 142– 146, 17-19 May, 2004.
[521] M. Alias, A. Samingan, S. Chen, and L. Hanzo, “Multiple antenna aided OFDM employing minimum biterror rate multiuser detection,”IEE Electronics Letters, vol. 39, pp. 1769–1770, November 2003.
[522] E. Hou, N. Ansari, and H. Ren, “A Genetic Algorithm for Multiprocessor Scheduling,”IEEE Transaction onParallel and Distributed Systems, vol. 5, pp. 113 – 120, February 1994.
[523] K.-S. Tang, K.-T. Ko, K. F. Man, and S. Kwong, “TopologyDesign and Bandwidth Allocation of EmbeddedATM Networks Using Genetic Algorithms,”IEEE Communications Letters, vol. 2, pp. 171 – 173, June 1998.
[524] C. Y. Ngo and V. O. K. Li, “Fixed Channel Assignment in Cellular Radio Network Using a Modified GeneticAlgorithm,” IEEE Transactions on Vehicular Technology, vol. 47, pp. 163 – 172, February 1998.
[525] D. Sadot, U. Mahlab, and V. Natan-Bar, “New method for developing optical CDMA address code se-quences using the genetic algorithm,” inProceedings of the IEEE International Conference on Communi-cation, ICC1998, vol. 3, (Atlanta, GA, USA), pp. 7–11, June 1998.
[526] Y. H. Lee, S. T. Sheu, and M. H. Chen, “Application of Genetic Algorithm for Optimal Simultaneous CodeSet Selection in Optical CDMA,” inModelling and Simulation, MS99, vol. 3, (Philadelphia, USA), pp. 5 – 8,May 1999.
[527] S. H. Hwang and L. Hanzo, “Reverse-link performance of synchronous DS-CDMA systems in dispersiveRician multipath fading channels,”IEE Electronics Letters, vol. 39, pp. 1682–1684, November 2003.
[528] B. G. Evans and K. Baughan, “Visions of 4G,”IEE Electronics and Communication Engineering Journal,vol. 12, pp. 293–303, December 2000.
[529] S. Hara and R. Prasad, “Overview of Multicarrier CDMA,” IEEE Communications Magazine, vol. 35,pp. 126–133, December 1997.
[530] B. Abdool-Rassool, F. Heliot, L. Revelly, R. Nakhai, and H. Aghvami, “4-PSK space-time trellis codes withfive and six transmit antennas for slow Rayleigh fading channels,” IEE Electronics Letters, vol. 39, pp. 297–299, February 2003.

BIBLIOGRAPHY 521
[531] B. Rassool, B. Allen, R. Nakhai, R. Roberts, and P. Sweeney, “Error statistics of optimal and sub-optimalspace-time trellis codes: concatenation requirements,” inProceedings of the IEEE International Sympo-sium on Personal, Indoor and Mobile Radio Communications, vol. 2, (Beijing, China), pp. 1007–1011, 7-10September 2003.
[532] B. Rassool, F. Heliot, L. Revelly, M. Dohler, R. Nakhai, and H. Aghvami, “Fast search techniques for ob-taining space-time trellis codes for Rayleigh fading channels and its performance in CDMA systems,” inProceedings of the IEEE Vehicular Technology Conference 2003 Spring, vol. 1, (Jeju, Korea), pp. 66–69,22-25 April 2003.
[533] F. Heliot, M. Ghavami, R. Nakhai, and A. Aghvami, “Performance of space-time block coding and space-timetrellis coding for impulse radio,” inProceedings of the IEEE Global Telecommunications Conference, vol. 5,(Dallas, Texas USA), pp. 3225–3229, 29 Nov. - 3 Dec. 2004.
[534] C. K. Toh,Wireless ATM and AD-HOC Networks Protocols and Architectures. Kluwer Academic Publishers,1997.
[535] A. Jardosh, E. Belding-Royer, K. Almeroth, and S. Suri,“Real-world environment models for mobile networkevaluation,”IEEE Journal on Selected Areas in Communications, vol. 23, pp. 622–632, March 2005.
[536] X. Liu and L. Hanzo, “Effects of rate adaptation on the throughput of random ad hoc networks,” inTo appearin the IEEE Vehicular Technology Conference 2005 Fall, (Dallas, Texas, USA), 25-28 September 2005.
[537] H. Luo and S. Lu, “A topology-independent wireless fair queueing model in ad hoc networks,”IEEE Journalon Selected Areas in Communications, vol. 23, pp. 585–597, March 2005.
[538] V. Srinivasan, P. Nuggehalli, C.-F. Chiasserini, andR. Rao, “An Analytical Approach to the Study of Coop-eration in Wireless Ad Hoc Networks,”IEEE Transaction on Wireless Communications, vol. 4, pp. 722–733,March 2005.
[539] M. Ghassemian, P. Hofmann, C. Prehofer, V. Friderikos, and H. Aghvami, “Performance analysis of Internetgateway discovery protocols in ad hoc networks,” inProceedings of the IEEE Wireless Communications andNetworking Conference, vol. 1, pp. 120–125, 21-25 March 2004.
[540] L. Yang, H. Wei, and L. Hanzo, “A Multicarrier DS-CDMA System Using Both Time-Domain andFrequency-Domain Spreading,” inProceedings of the IEEE Vehicular Technology Conference 2003 Fall,vol. 4, (Orlando, Florida, USA), pp. 2426 – 2430, 6-9 October2003.
[541] M. Wall, GAlib Genetic Algorithm Package version 2.45. Massachusetts Institute of Technology:http://lancet.mit.edu/ga/, 1996.
[542] W. Spears and K. DeJong,Foundations of Genetic Algorithms. California, USA: G. Rawlins ed., MorganKaufmann, 1991.
[543] IEEE,Proceedings of IEEE Vehicular Technology Conference (VTC’98), (Ottawa, Canada), 18–21 May 1998.
[544] IEEE,Proceedings of VTC’98 (Spring), (Houston, Texas, USA), 16–20 May 1999.
[545] IEEE, Proceedings of IEEE International Symposium on Spread Spectrum Techniques and Application(ISSSTA’98), (Sun City, South Africa), September 1998.
[546] IEEE,Proceedings of IEEE International Symposium on Personal, Indoor and Mobile Radio Communica-tions, PIMRC’97, (Marina Congress Centre, Helsinki, Finland), 1–4 September 1997.
[547] IEEE,Proceedings of IEEE VTC ’96, (Atlanta, GA, USA), 1996.
[548] J. D. Gibson, ed.,The Mobile Communications Handbook. CRC Press and IEEE Press, 1996.

Author Index
AAazhang, B. [91] . . . . . . . . . . . . . . . . . . . . . . . . . . 17, 86Abeta, S. [220] . . . . . . . . . . . . . . . . . . . . . . . . . . . . . . 109Adachi, F. [131] . . . . . . . . . . . . . . . . . . . . . . . . . . .38, 55Adachi, F. [123] . . . . . . . . . . . . . . . . . . . . . . . . . . . . . . 29Adachi, F. [122] . . . . . . . . . . . . . . . . . . . . . . . . . . . . . . 29Adachi, F. [130] . . . . . . . . . . . . . . . . . 32, 57, 301, 302Adachi, F. [154] . . . . . . . . . . . . . . . . . . . . . . . . . . . . . . 74Adachi, F. [135] . . . . . . . . . . . . . . . . . . . . . . . . . . .45, 76Adachi, F. [144] . . . . . . . . . . . . . . . . . . . . . . . . . . . . . . 65Adaptive Antennas, [242] . . . . . . . . . . . . . . . . . . . . 123Aghvami, A.H. [309] . . . . . . . . . . . . . . . . . . . . 193, 309Aghvami, A.H. [393] . . . . . . . . . . . . . . . . . . . . . . . . 310Aghvami, A.H. [311] . . . . . . . . . . . . . . . . . . . . . . . . 193Aghvami, A.H. [312] . . . . . . . . . . . . . . . . . . . . . . . . 193Aghvami, A.H. [392] . . . . . . . . . . . . . . . . . . . . . . . . 309Aghvami, A.H. [140] . . . . . . . . . . . . . . . . . . . . . . . . . 59Aghvami, H. [313] . . . . . . . . . . . . . . . . . . . . . . . . . . 193Agius, A.A. [291] . . . . . . . . . . . . . . . . . . . . . . . . . . . 144Aikio, P. [395] . . . . . . . . . . . . . . . . . . . . . . . . . . . . . . 311Akaiwa, Y. [365] . . . . . . . . . . . . . . . . . . . . . . . . . . . . 208Almenar, V. [262] . . . . . . . . . . . . . . . . . . . . . . . . . . . 123Amoroso, F. [73] . . . . . . . . . . . . . . . . . . . . . . . . . . . . . . 7Andermo, P-G. [56] . . . . . . . . . . . . . . . . . . . . . . . . 1, 29Anderson, B.D.O. [303] . . . . . . . . . . . . . . . . . . . . . . 162Anderson, L.G. [314] . . . . . . . . . . . . . . . . . . . 193, 204Anderson, N. [14] . . . . . . . . . . . . . . . . . . . . . . . . . 0, 132Andersson, B.V. [15]0, 132, 157, 158, 160, 193, 199Andoh, H. [365] . . . . . . . . . . . . . . . . . . . . . . . . . . . . .208Andoh, H. [111] . . . . . . . . . . . . . . . . . . . . . . . . . . 24, 87Appelgren, M. [15] . 0, 132, 157, 158, 160, 193, 199Applebaum, S.P. [265] . . . . . . . . . . . . . . 123, 124, 159Applebaum, S.P. [230] . . . . . . . . . . . . . . . . . . . . . . . 123Arimochi, K. [198] . . . . . . . . . . . . . . . . . . . . . . . . . . . 92Arnott, R. [1] . 0, 127, 128, 131, 132, 134, 144–147,
159, 162, 193Arroyo-Fernandez, B. [126] . . . . . . . . . . . . . . . . . . . 29Asghar, S. [355] . . . . . . . . . . . . . . . . . . . . . . . . . . . . . 205
BBackman, P.O. [343] . . . . . . . . . . . . . . . . . . . . . . . . . 202
Baier, A. [108] . . . . . . . . . . . . . . . . . . . . . . . . . . . . 23, 29Baier, P.W. [125] . . . . . . . . . . . . . . . . . . . . . . . . . . . . . 29Baier, P.W. [213] . . . . . . . . . . . . . . . . . . . . . . . . . . . . 108Baiocchi, A. [320] . . . . . . . . . . . . . . . . . . . . . . 193, 208Balachandran, K. [180] . . . . . . . . . . . . . . . . . . . . . . . 89Barani, B. [126] . . . . . . . . . . . . . . . . . . . . . . . . . . . . . . 29Barnard, M. [290] . . . . . . . . . . . . . . . . . . . . . . . . . . . 144Barrett, M. [1] 0, 127, 128, 131, 132, 134, 144–147,
159, 162, 193Barrett, M. [233] . . . . . . . . . . . . . . . . . . . . . . . . . . . . 123Bateman, A. [104] . . . . . . . . . . . . . . . . . . . . . . . . . . . . 23Bateman, A. [103] . . . . . . . . . . . . . . . . . . . . . . . . . . . . 23Baughan, K. [528] . . . . . . . . . . . . . . . . . . . . . . . . . . . 366Beach, M.A. [280] . . . . . . . . . . . . . 126, 127, 160, 161Beach, M.A. [2] . . . 0, 124, 125, 127, 132, 134, 193,
222–224Beach, M.A. [19] . . . . . . . . . . . . . . . . . . . . . 0, 126, 134Beach, M.A. [7] . . . . . . . . . . . . . . . . . 0, 126, 160, 162Beach, M.A. [250] . . . . . . . . . . . . . . . . . . . . . . . . . . .123Benthin, M. [110] . . . . . . . . . . . . . . . . . . . . . . . . . . . . 24Bernhardt, R.C. [333] . . . . . . . . . . . . . . . . . . . . . . . . 200Berrou, C. [134] . . . . . . . . . . . . . . . 45, 93, 95, 98, 104Berruto, E. [60] . . . . . . . . . . . . . . . . . . . . . . . . . . . . 1, 29Blocher, P. [400] . . . . . . . . . . . . . . . . . . . . . . . . . . . . 313Blogh, J. [177] . . . . . . . . . . . . . . . . . . . . . . . . . . .89, 120Blogh, J.S. [50]. . . . . . . . . . . . . . . . . . . . . . .0, 194, 221Blogh, J.S. [52] . . . . . . . . . . . . . . . . . . . . . . . . . . . . . . . .0Blogh, J.S. [49] . . . . . . . . . . . . . . . . . . . . . . . . . . . . . . . .0Blogh, J.S. [51] . . . . . . . . . . . . . . . . . . . . . . . . . . . . . . . .0Blogh, J.S. [53] . . . . . . . . . . . . . . . . . . . . . . . . . . . . . . . .0Bonek, E. [293] . . . . . . . . . . . . . . . . . . . . 144, 162, 164Brand, A.E. [140] . . . . . . . . . . . . . . . . . . . . . . . . . . . . 59Brennan, L.E. [252] . . . . . . . . . . . . . . . . . . . . . . . . . 123Brennan, L.E. [253] . . . . . . . . . . . . . . . . . . . . . . . . . 123Brennan, L.E. [251] . . . . . . . . . . . . . . . . . . . . . . . . . 123Brennan, L.E. [254] . . . . . . . . . . . . . . . . . . . . . . . . . 123Brennan, L.E. [271] . . . . . . . 123, 124, 152, 182, 235Brennan, L.E. [232] . . . . . . . . . . . . . . . . . . . . . . . . . 123Bruhn, S. [399]. . . . . . . . . . . . . . . . . . . . . . . . . . . . . .313Bruhn, S. [400]. . . . . . . . . . . . . . . . . . . . . . . . . . . . . .313Buckley, K.M. [8] . . . . . . . . . . . 0, 124, 144, 149, 159
523

524 AUTHOR INDEX
Buckley, K.M. [259] . . . . . . . . . . . . . . . . . . . . . . . . . 123
CCalderbank, A. [224] . . . . . . . . . . . . . . . . . . . . . . . . 120Calderbank, A. [225] . . . . . . . . . . . . . . . . . . . . . . . . 120Calderbank, A. [226] . . . . . . . . . . . . . . . . . . . . . . . . 120Calderbank, A. [227] . . . . . . . . . . . . . . . . . . . . . . . . 120Calderbank, A.R. [146] . . . . . . . . . . . . . . . . . . . . 65, 84Callendar, M.H. [61] . . . . . . . . . . . . . . . . . . . . . . . 1, 27Capon, J. [270] . . . . . . . . . . . . . . . . . . . . .123, 160, 165Cardieri, P. [323] . . . . . . . . . . 194, 226–228, 230, 236Carlson, A.B. [4] . . . . . . . . . . . . . . . . . . . . . . . . . . . . . . 0Cavers, J.K. [113] . . . . . . . . . . . . . . . . . . . . . . . . . . . . 24Chambers, J.A. [248] . . . . . . . . . . . . . . . . . . . . . . . . 123Chambers, J.A. [148] . . . . . . . . . . . . . . . . . . . . . . . . . 68Cheah, C. [172] . . . . . . . . . . . . . . . . . . . . . . . . . . . . . . 86Cheah, K.L. [168] . . . . . . . . . . . . . . . . . . . . . . . . . . . . 86Chen, T. [260] . . . . . . . . . . . . . . . . . . . . . . . . . . . . . . 123Cheng, M.M.L. [317] . 193, 208, 216, 217, 219, 313Cherriman, P. [133] . . . . . . . . . . . . . 45, 110, 111, 264Cherriman, P. [178] . . . .89, 95, 96, 98, 99, 102, 107,
116–122, 199, 202, 221, 222Cherriman, P. [132] . . . . . . . . . . . . . . . . . 42, 50, 57, 87Cherriman, P. [223] . . . . . . . . . . . . . . . . . . . . . . . . . . 110Cherriman, P. [211] . . . . . . . . . . . . . . . . . 103, 105–107Cherriman, P.J. [50] . . . . . . . . . . . . . . . . . . .0, 194, 221Cherriman, P.J. [52] . . . . . . . . . . . . . . . . . . . . . . . . . . . . 0Cherriman, P.J. [49] . . . . . . . . . . . . . . . . . . . . . . . . . . . . 0Cherriman, P.J. [51] . . . . . . . . . . . . . . . . . . . . . . . . . . . . 0Cherriman, P.J. [53] . . . . . . . . . . . . . . . . . . . . . . . . . . . . 0Cherriman, P.J. [322] . . . . . . . . . . . . . . . 194, 221, 222Cherriman, P.J. [377] . . . . . . . . . . . . . . . . . . . . . . . . 221Cherriman, P.J. [394] . . . . . . . . . . . . . . . . . . . . 311, 353Cherriman, P.J. [381] . . . . . . . . . . . . . . . . . . . . . . . . 234Cheung, J.C.S. [205] . . . . . . . . . . . . . . . . . . . . . . . . . . 94Chevalier, P. [16] . . . . . . . . . . . . . . . . . . . . . 0, 134, 165ChihLin, I. [318] . . . . . . . . . . . . . . . . . . . 193, 208, 217Chockalingam, A. [142] . . . . . . . . . . . . . . . . . . . . . . . 63Chua, S.G. [191] . . . . . . . . . . . . . . . . . . . . . . . . . . 90, 91Chuang, J.C.-I. [383] . . . . . . . . . . . . . . . . . . . . 234, 235Chuang, J.C.I. [315] . . . . . . . . . . . . . . . . . . . . .193, 206Chuang, J.C.I. [316] . . 193, 208, 210, 212, 213, 232Chuang, J.C.I. [317] . . 193, 208, 216, 217, 219, 313Constantinides, A.G. [248] . . . . . . . . . . . . . . . . . . . 123Corden, I.R. [233] . . . . . . . . . . . . . . . . . . . . . . . . . . . 123Corral, J.L. [262] . . . . . . . . . . . . . . . . . . . . . . . . . . . . 123Cox, D.C. [362] . . . . . . . . . . . . . . . . . . . . . . . . . . . . . 207Cox, D.C. [359] . . . . . . . . . . . . . . . . . . . . . . . . . . . . . 207Cox, D.C. [361] . . . . . . . . . . . . . . . . . . . . . . . . 207, 209Cox, D.C. [376] . . . . . . . . . . . . . . . . . . . . . . . . . . . . . 220Cruickshank, D. [176] . . . . . . . . . . . . . . . . . . . . . . . . 87
DDahlin, J. [342] . . . . . . . . . . . . . . . . . . . . . . . . . . . . . 202Dahlman, E. [118] . . . . . . . . . . . 29, 30, 32, 48, 62, 86Dahlman, E. [150] . . . . . . . . . . . . . . . . . . . . . . . . . . . . 69Dahlman, E. [57] . . . . . . . . . . . . . . . . . . . . . . . . . . . 1, 29Dahlman, E. [127] . . . . . . . . . . . . . . . . . . . . . . . . . . . . 29
Davarian, F. [105] . . . . . . . . . . . . . . . . . . . . . . . . . . . . 23De Bernadi, R. [396] . . . . . . . . . . . . . . . . . . . . . . . . .311Dehgan, S. [401] . . . . . . . . . . . . . . . . . . . . . . . . . . . . 329Del Re, E. [366] . . . . . . . . . . . . . . . . . . . . . . . . 208, 217Dell’Anna, M. [309] . . . . . . . . . . . . . . . . . . . . 193, 309Delli Priscoli, F. [321] . . . . . . . . . . . . . . . . . . . 193, 208Delli-Priscoli, F. [320] . . . . . . . . . . . . . . . . . . .193, 208Dietrich, P. [142] . . . . . . . . . . . . . . . . . . . . . . . . . . . . . 63Dimitrijevi c, D.D. [360] . . . . . . . . . . . . . . . . . . . . . .207Ding, Z. [303]. . . . . . . . . . . . . . . . . . . . . . . . . . . . . . .162Dohi, T. [131] . . . . . . . . . . . . . . . . . . . . . . . . . . . . 38, 55
EEdwards, D.J. [2] . . 0, 124, 125, 127, 132, 134, 193,
222–224Ekudden, E. [399] . . . . . . . . . . . . . . . . . . . . . . . . . . . 313Elnoubi, S.M. [348] . . . . . . . . . . . . . . . . . . . . . . . . . 204Eng, T. [80] . . . . . . . . . . . . . . . . . . . . . . . . . . . . . . . . . . 11Engel, J.S. [346] . . . . . . . . . . . . . . . . . . . . . . . . . . . . 204Engstrom, S. [343] . . . . . . . . . . . . . . . . . . . . . . . . . . 202Ertel, R.B. [323] . . . . . . . . . . 194, 226–228, 230, 236Ertel, R.B. [292] . . . . . . . . . . . . . . . . . . . 144, 193, 224Evans, B.G. [528] . . . . . . . . . . . . . . . . . . . . . . . . . . . 366Everitt, D.E. [341] . . . . . . . . . . . . . . . . . . . . . . . . . . . 201Ewerbring, L-M. [56] . . . . . . . . . . . . . . . . . . . . . . . 1, 29
FFantacci, R. [366] . . . . . . . . . . . . . . . . . . . . . . . 208, 217Fernandez, J. [233] . . . . . . . . . . . . . . . . . . . . . . . . . . 123Fiebig, U-C. [108] . . . . . . . . . . . . . . . . . . . . . . . . 23, 29Fiebig, U-C.G. [102] . . . . . . . . . . . . . . . . . . . . . . . . . . 22Flores, S.J. [262] . . . . . . . . . . . . . . . . . . . . . . . . . . . . 123Foschini, G.J. [382] . . . . . . . . . . . . . . . . . . . . . 234, 235Frederiksen, F. [20] . . . . . . . . . . 0, 126, 134, 140, 145French, R.C. [378] . . . . . . . . . . . . . . . . . . . . . . . . . . .223Frost, O.L. III [267] . . . . . . . . . . . . 123, 124, 159, 167Frost, O.L. III [231] . . . . . . . . . . . . . . . . . . . . . . . . . 123Fujiwara, A. [135] . . . . . . . . . . . . . . . . . . . . . . . . 45, 76
GGabriel, W.F. [236] . . . . . . . . . . . . . . . . . . . . . . . . . . 123Ganz, M.W. [298] . . . . . . . . . . . . . . . . . . . . . . .158, 199Garg, V.K. [69] . . . . . . . . . . . . . . . . . . . . . . . . . . . . . . . . 2Gaspard, I. [278] . . . . . . . . . . . . . . 125, 126, 144, 165Gejji, R.R. [143] . . . . . . . . . . . . . . . . . . . . . . . . . . . . . 63Georganas, N.D. [367] . . . . . . . . . . . . . . . . . . . . . . . 209Georganas, N.D. [368] . . . . . . . . . . . . . . . . . . . . . . . 209Gerlach, D. [305] . . . . . . . . . . . . . . . . . . . . . . . 165, 236Gerlach, D. [306] . . . . . . . . . . . . . . . . . . . . . . . 165, 236Giambene, G. [366] . . . . . . . . . . . . . . . . . . . . . 208, 217Gilhousen, K.S. [391] . . . . . . . . . . . . . . . . . . . . . . . . 309Gilhousen, K.S. [63] . . . . . . . . . . . . . . . . . . . . . . . . . . . 2Gilhousen, K.S. [335] . . . . . . . . . . . . . . . . . . . . . . . . 200Gilhousen, K.S. [214] . . . . . . . . . . . . . . . . . . . . . . . . 109Girard, L. [57] . . . . . . . . . . . . . . . . . . . . . . . . . . . . . 1, 29Gitlin, R.D. [289] . . . . . . . . . . . . . . . . . . . . . . . . . . . 144Gitlin, R.D. [249] . . . . . . . . . . . . . . . . . . . . . . . . . . . 123Gladh, O. [15] . . . . . 0, 132, 157, 158, 160, 193, 199

AUTHOR INDEX 525
Glavieux, A. [134] . . . . . . . . . . . . . 45, 93, 95, 98, 104Glisic, S. [67] . . . . . . . . . . . . . . . . . . . . . . . . . 2, 28, 200Glisic, S. [334] . . . . . . . . . . . . . . . . . . . . . . . . . . . . . . 200Godara, L.C. [327] . . . . . . . . . . . . . . . . . . . . . . . . . . 199Godara, L.C. [328] . . . . . . . . . . . . . . . . . . . . . . . . . . 199Godara, L.C. [6] . . . 0, 123–127, 130, 134, 143, 144,
162, 193, 236Godara, L.C. [269] . . . 123, 124, 137, 141, 147–150,
155, 158–160, 162–164, 166, 167, 169,193–195, 235
Godara, L.C. [234] . . . . . . . . . . . . . . . . . . . . . . . . . . 123Godara, L.C. [235] . . . . . . . . . . . . . . . . . . . . . . . . . . 123Godara, L.C. [247] . . . . . . . . . . . . . . . . . . . . . . . . . . 123Godard, D.N. [302] . . . . . . . . . . . . . . . . . . . . . 162, 163Golay, M.J.E. [145] . . . . . . . . . . . . . . . . . . . . . . . 65, 67Goldsmith, A.J. [191]. . . . . . . . . . . . . . . . . . . . . .90, 91Goode, B.B. [266]. . . .123, 124, 145, 147, 148, 159,
162, 167Goode, B.B. [229] . . . . . . . . . . . . . . . . . . . . . . . . . . . 123Goodman, D.J. [363] . . . . . . . . . . . . . . . . . . . . . . . . 208Goodman, D.J. [372] . . . . . . . . . . . . . . . . . . . . . . . . 210Goodman, D.J. [364] . . . . . . . . . . . . . . . . . . . . . . . . 208Gosling, W. [379] . . . . . . . . . . . . . . . . . . . . . . . . . . . 223Grandhi, S.A. [363] . . . . . . . . . . . . . . . . . . . . . . . . . .208Grandhi, S.A. [372] . . . . . . . . . . . . . . . . . . . . . . . . . .210Granzow, W. [108] . . . . . . . . . . . . . . . . . . . . . . . . 23, 29Green, E.P. Jr [70] . . . . . . . . . . . . . . . . . . . . . . . . . . 6, 11Greenwood, D. [79] . . . . . . . . . . . . . . . . . . . . 9–11, 214Gregory P. Pollini, [332] . . . . . . . . . . . . . . . . . . . . . 200Grieco, D.M. [87] . . . . . . . . . . . . . . . . . . . . . . . . . . . . 11Griffiths, L.J. [268] . . . . . . . . . . . . 123, 124, 159, 167Griffiths, L.J. [258] . . . . . . . . . . . . . . . . . . . . . . . . . . 123Griffiths, L.J. [266] . . . 123, 124, 145, 147, 148, 159,
162, 167Griffiths, L.J. [229] . . . . . . . . . . . . . . . . . . . . . . . . . . 123Grilli, F. [320] . . . . . . . . . . . . . . . . . . . . . . . . . . 193, 208Gudmundson, B. [118] . . . . . . . 29, 30, 32, 48, 62, 86Gudmundson, M. [60] . . . . . . . . . . . . . . . . . . . . . . 1, 29Guerin, R. [371] . . . . . . . . . . . . . . . . . . . . . . . . 210, 211Guo, D. [172] . . . . . . . . . . . . . . . . . . . . . . . . . . . . . . . . 86Guo, D. [173] . . . . . . . . . . . . . . . . . . . . . . . . . . . . . . . . 86Gupta, S.C. [348] . . . . . . . . . . . . . . . . . . . . . . . . . . . .204Gupta, S.C. [380] . . . . . . . . . . . . . . . . . . . . . . . 223, 224Gustafsson, M. [150] . . . . . . . . . . . . . . . . . . . . . . . . . 69
HHamguchi, K. [202] . . . . . . . . . . . . . . . . . . . . . . . . . . 92Hanzo, L. [95] . . . . . . . . . . . . . . . . . . . . 18, 59, 86, 111Hanzo, L. [133] . . . . . . . . . . . . . . . . . 45, 110, 111, 264Hanzo, L. [50] . . . . . . . . . . . . . . . . . . . . . . . 0, 194, 221Hanzo, L. [52] . . . . . . . . . . . . . . . . . . . . . . . . . . . . . . . . .0Hanzo, L. [49] . . . . . . . . . . . . . . . . . . . . . . . . . . . . . . . . .0Hanzo, L. [51] . . . . . . . . . . . . . . . . . . . . . . . . . . . . . . . . .0Hanzo, L. [53] . . . . . . . . . . . . . . . . . . . . . . . . . . . . . . . . .0Hanzo, L. [177] . . . . . . . . . . . . . . . . . . . . . . . . . . 89, 120Hanzo, L. [94]. . . . . . . . . . . . . . . .18, 89, 94, 107, 120Hanzo, L. [204] . . . . . . . . . . . . . . . . . . . . . . 93, 95, 120Hanzo, L. [12] . . . . . . . . . . . . 0, 23–25, 233, 260, 352
Hanzo, L. [178] . . . . . . . 89, 95, 96, 98, 99, 102, 107,116–122, 199, 202, 221, 222
Hanzo, L. [208] . . . . . . . . . . . . . . . . . . . . . . . . . . . . . . 95Hanzo, L. [188] . . . . . . . . . . . . . . . . . . . 90, 93, 94, 100Hanzo, L. [322] . . . . . . . . . . . . . . . . . . . . 194, 221, 222Hanzo, L. [394] . . . . . . . . . . . . . . . . . . . . . . . . .311, 353Hanzo, L. [84] . . . . . . . . . . . . . . . . . . . . . . . . . . . . . . . 11Hanzo, L. [96] . . . . . . . . . . . 18, 30, 35, 38, 42, 57, 87Hanzo, L. [79] . . . . . . . . . . . . . . . . . . . . . . . . .9–11, 214Hanzo, L. [55] . . . . . 1, 28, 33, 40, 70, 201, 208, 232Hanzo, L. [195] . . . . . . . . . . . . . . . . . . 91, 92, 101, 286Hanzo, L. [187] . . . . . . . . . . . . . . . . . . . . . . . . . . . 90, 93Hanzo, L. [189] . . . . . . . . . . . . . . . . . . . . . . . . . . . . . . 90Hanzo, L. [222] . . . . . . . . . . . . . . . . . . . . . . . . . . . . . 110Hanzo, L. [212] . . . . . . . . . . . . . . . . . . . . . . . . .105, 116Hanzo, L. [381] . . . . . . . . . . . . . . . . . . . . . . . . . . . . . 234Hanzo, L. [179] . . . . . . . . . . . . . . . . . . . . . . . . . . 89, 120Hanzo, L. [13] 0, 90, 94, 96, 98, 105, 116, 118, 120,
233, 260, 286, 352Hanzo, L. [389] . . . . . . . . . . . . . . . . . . . . . . . . . . . . . 309Hanzo, L. [132] . . . . . . . . . . . . . . . . . . . . 42, 50, 57, 87Hanzo, L. [11] 0, 7, 28, 89, 90, 93, 95, 98, 104, 145,
147, 151, 164, 232, 295, 296, 299Hanzo, L. [203] . . . . . . . . . . . . . . . . . . . . . . . . . . 92, 101Hanzo, L. [112] . . . . . . . . . . . . . . . . . . . . . . . . . . . 24, 25Hanzo, L. [193] . . . . . . . . . . . . . . . . . . . . . . . . . . . . . . 91Hanzo, L. [384] . . . . . . . . . . . . . . . . . . . . . . . . . . . . . 286Hanzo, L. [207] . . . . . . . . . . . . . . . . . . . . . . . . . . . . . . 94Hanzo, L. [223] . . . . . . . . . . . . . . . . . . . . . . . . . . . . . 110Hanzo, L. [385] . . . . . . . . . . . . . . . . . . . . . . . . . . . . . 286Hanzo, L. [211] . . . . . . . . . . . . . . . . . . . . 103, 105–107Hanzo, L. [83] . . . . . . . . . . . . . . . . . . . . . . . . . . . . . . . 11Hanzo, L. [206] . . . . . . . . . . . . . . . . . . . . . . . . . . . . . . 94Hashimoto, M. [221] . . . . . . . . . . . . . . . . . . . . . . . . 109Hawwar, Y.M. [310] . . . . . . . . . . . . . . . . . . . . 193, 223Haykin, S. [274] .124, 125, 137, 141, 143, 147–151,
158, 159, 169Haykin, S. [264]. . . . . . . . . . . . . . . . . . . . . . . . . . . . .123Hellwig, K. [399]. . . . . . . . . . . . . . . . . . . . . . . . . . . .313Hellwig, K. [400]. . . . . . . . . . . . . . . . . . . . . . . . . . . .313Higashi, A. [131] . . . . . . . . . . . . . . . . . . . . . . . . . 38, 55Higuchi, K. [144] . . . . . . . . . . . . . . . . . . . . . . . . . . . . .65Higuchi, K. [111] . . . . . . . . . . . . . . . . . . . . . . . . . 24, 87Ho, M.H. [162] . . . . . . . . . . . . . . . . . . . . . . . . . . . . . . .86Hollemans, W. [283] . . . . . . . . . . . . . . . . . . . . 127, 144Holtzman, J. [166] . . . . . . . . . . . . . . . . . . . . . . . . . . . . 86Holtzman, J.M. [101] . . . . . . . . . . . . . . . . . . . . . . . . . 18Holtzman, J.M. [137] . . . . . . . . . . . . . . . . . . . . . . . . . 55Holtzman, J.M. [98] . . . . . . . . . . . . . . . . . . . . . . . . . . 18Holtzman, J.M. [217] . . . . . . . . . . . . . . . . . . . . . . . . 109Hong, D. [370] . . . . . . . . . . . . . . . . . . . . . . . . . . . . . . 210Honkasalo, H. [129] . . . . . . . . . . . . . . . . . . . . . . . . . . 30Honkasalo, Z-C. [397] . . . . . . . . . . . . . . . . . . . . . . . 311Honkasalo, Z-C. [129] . . . . . . . . . . . . . . . . . . . . . . . . 30Hottinen, A. [156] . . . . . . . . . . . . . . . . . . . . . . . . . . . . 84Hottinen, A. [129] . . . . . . . . . . . . . . . . . . . . . . . . . . . . 30Howard, P. [14] . . . . . . . . . . . . . . . . . . . . . . . . . . . 0, 132Howitt, I. [310] . . . . . . . . . . . . . . . . . . . . . . . . . 193, 223

526 AUTHOR INDEX
Hudson, J.E. [273]124, 141, 143, 147, 149, 155, 157Hudson, J.E. [263] . . . . . . . . . . . . . . . . . . . . . . . . . . .123
IIkeda, T. [199] . . . . . . . . . . . . . . . . . . . . . . . . . . . . . . . 92Imamura, K. [352] . . . . . . . . . . . . . . . . . . . . . . . . . . .204Irvine, G.T. [107] . . . . . . . . . . . . . . . . . . . . . . . . . 23–25
JJabbari, B. [338] . . . . . . 201, 203, 204, 210, 214, 233Jabbari, B. [331] . . . . . . . . . . . . . . . 200, 205, 210, 211Jabbari, B. [339] . . . . . . . . . . . . . . . . . . . . . . . . 201, 203Jacobs, I.M. [391] . . . . . . . . . . . . . . . . . . . . . . . . . . . 309Jacobs, I.M. [63] . . . . . . . . . . . . . . . . . . . . . . . . . . . . . . 2Jacobs, I.M. [214] . . . . . . . . . . . . . . . . . . . . . . . . . . . 109Jafarkhani, H. [146] . . . . . . . . . . . . . . . . . . . . . . . 65, 84Jafarkhani, H. [227] . . . . . . . . . . . . . . . . . . . . . . . . . 120Jakes, W.C. [74] . . . . . . . . . . . . . . . . . . . . . . . . . . 7, 214Jakes, W.C. [21] . . . . . . . . 0, 129, 131, 225, 226, 238Jamal, K. [150] . . . . . . . . . . . . . . . . . . . . . . . . . . . . . . . 69Jiang, H. [345] . . . . . . . . . . . . . . . . . . . . . . . . . 203, 204Johansson, A.-L. [219] . . . . . . . . . . . . . . . . . . . . . . . 109Johansson, A.L. [170] . . . . . . . . . . . . . . . . . . . . . . . . . 86Johnson, C.R. Jr [303] . . . . . . . . . . . . . . . . . . . . . . . 162Jones, P. [401] . . . . . . . . . . . . . . . . . . . . . . . . . . . . . . 329Jung, P. [125] . . . . . . . . . . . . . . . . . . . . . . . . . . . . . . . . 29Juntti, M.J. [136] . . . . . . . . . . . . . . . . . . . . . . . . . . . . . 55
KKahwa, T.J. [367] . . . . . . . . . . . . . . . . . . . . . . . . . . . 209Kailath, T. [245] . . . . . . . . . . . . . . . . . . . . . . . . . . . . .123Kailath, T. [257] . . . . . . . . . . . . . . . . . . . . . . . . . . . . .123Kamio, Y. [194] . . . . . . . . . . . . . . . . . . . . . . . . . . . . . . 91Kamio, Y. [190] . . . . . . . . . . . . . . . . . . . . . . . . . . . 90, 91Kamio, Y. [201] . . . . . . . . . . . . . . . . . . . . . . . . . . . . . . 92Kammeyer, K-D. [110] . . . . . . . . . . . . . . . . . . . . . . . .24Kanai, T. [307] . . . . . . . . . . . . . . . . . . . . . . . . . . . . . . 193Kasami, T. [139] . . . . . . . . . . . . . . . . . . . . . . . . . . . . . 56Katzela, I. [337] . 201, 203, 204, 207, 210, 211, 214,
233Katzela, I. [308] . . . . . . . . . . . . . . . . . . . . . . . . . . . . . 193Kavehrad, M. [81] . . . . . . . . . . . . . . . . . . . . . . . . . . . . 11Keller, T. [212] . . . . . . . . . . . . . . . . . . . . . . . . . 105, 116Keller, T. [13] . 0, 90, 94, 96, 98, 105, 116, 118, 120,
233, 260, 286, 352Keller, T. [384] . . . . . . . . . . . . . . . . . . . . . . . . . . . . . . 286Kennedy, R.A. [303] . . . . . . . . . . . . . . . . . . . . . . . . . 162Kim, S.W. [215] . . . . . . . . . . . . . . . . . . . . . . . . . . . . . 109Kimmo Hiltunen, [396] . . . . . . . . . . . . . . . . . . . . . . 311Klein, A. [125] . . . . . . . . . . . . . . . . . . . . . . . . . . . . . . . 29Klein, A. [213] . . . . . . . . . . . . . . . . . . . . . . . . . . . . . . 108Klein, A. [210] . . . . . . . . . . . . . . . . . . 96, 97, 111, 112Klein, A. [57] . . . . . . . . . . . . . . . . . . . . . . . . . . . . . . 1, 29Klein, A. [127] . . . . . . . . . . . . . . . . . . . . . . . . . . . . . . . 29Knisely, D.N. [153] . . . . . . . . . . . . . . . . . . . . . . . 70, 71Knisely, D.N. [151] . . . . . . . . . . . . . . . . . . . . 70, 71, 90Koch, W. [108] . . . . . . . . . . . . . . . . . . . . . . . . . . . 23, 29Kohno, R. [239] . . . . . . . . . . . . . . . . . . . . . . . . . . . . . 123
Kohno, R. [65] . . . . . . . . . . . 2, 18, 126, 193, 195, 237Komaki, S. [186] . . . . . . . . . . . . . . . . . . . . . . . . . . 90, 93Kong, N. [80] . . . . . . . . . . . . . . . . . . . . . . . . . . . . . . . . 11Koulakiotis, D. [393] . . . . . . . . . . . . . . . . . . . . . . . . 310Krim, H. [287] . . . . . . . 137, 159, 160, 162, 163, 166Krim, H. [240] . . . . . . . . . . . . . . . . . . . . . . . . . . . . . . 123Kuan, E.L. [95] . . . . . . . . . . . . . . . . . . . 18, 59, 86, 111Kuan, E.L. [394] . . . . . . . . . . . . . . . . . . . . . . . . 311, 353Kuan, E.L. [96] . . . . . . . . . . 18, 30, 35, 38, 42, 57, 87Kuek, S.S. [350] . . . . . . . . . . . . . . . . . . . . . . . . . . . . 204Kumar, S. [151] . . . . . . . . . . . . . . . . . . . . . . . 70, 71, 90Kumar, S. [180] . . . . . . . . . . . . . . . . . . . . . . . . . . . . . . 89Kurner, T. [78] . . . . . . . . . . . . . . . . . . . . . . . . . . . . . . . . 8Kyeong, M.G. [288] . . . . . . . . . . . . . . . . . . . . .143, 193
LLaha, S. [151] . . . . . . . . . . . . . . . . . . . . . . . . . 70, 71, 90Laiho-Steffens, J. [397] . . . . . . . . . . . . . . . . . . . . . . 311Laiho-Steffens, J. [395] . . . . . . . . . . . . . . . . . . . . . . 311Larsen, S.L. [20] . . . . . . . . . . . . 0, 126, 134, 140, 145Laurila, J. [293] . . . . . . . . . . . . . . . . . . . . 144, 162, 164Law, A. [356] . . . . . . . . . . . . . . . . . . . . . . . . . . . . . . . 205Law, C.L. [261] . . . . . . . . . . . . . . . . . . . . . . . . . . . . . 123Le, T.H. [313] . . . . . . . . . . . . . . . . . . . . . . . . . . . . . . .193Leach, S.M. [291] . . . . . . . . . . . . . . . . . . . . . . . . . . . 144Lee, C.C. [149] . . . . . . . . . . . . . . . . . . . . . . . . . . . . . . .68Lee, J.S. [90] . . . . . . . . . . . . . . . . . . . . . . . . . . 15, 32, 33Lee, W.C.Y. [62] . . . . . . . . . . . . . . . . . . . . . . . . . 2, 7, 10Lee, W.C.Y. [147] . . . . . . . . . . . . . . . . . . . . . . . . . . . . 68Leppanen, P.A. [334] . . . . . . . . . . . . . . . . . . . . . . . . 200Leth-Espensen, P. [20] . . . . . . . 0, 126, 134, 140, 145Levitt, B.K. [138]. . . . . . . . . . . . . . . . . . . . . . . . . . . . .56Levy, A. [16] . . . . . . . . . . . . . . . . . . . . . . . . . 0, 134, 165Li, Q. [153]. . . . . . . . . . . . . . . . . . . . . . . . . . . . . . .70, 71Liberti, J.C. [324] . . . . . . . . . . . . . . 194, 228–230, 236Liberti, J.C. Jr [157] . . . . . . . . . . . . . . . . . . . . . . . . . . 86Liew, T. [206] . . . . . . . . . . . . . . . . . . . . . . . . . . . . . . . . 94Liew, T.H. [204] . . . . . . . . . . . . . . . . . . . . . . 93, 95, 120Liew, T.H. [222] . . . . . . . . . . . . . . . . . . . . . . . . . . . . .110Lightfoot, G. [104] . . . . . . . . . . . . . . . . . . . . . . . . . . . 23Lim, T.J. [330] . . . . . . . . . . . . . . . . . . . . . . . . . . . . . . 200Lim, T.J. [168] . . . . . . . . . . . . . . . . . . . . . . . . . . . . . . . 86Lim, T.J. [172] . . . . . . . . . . . . . . . . . . . . . . . . . . . . . . . 86Lim, T.J. [159] . . . . . . . . . . . . . . . . . . . . . . . . . . . . . . . 86Lim, T.J. [160] . . . . . . . . . . . . . . . . . . . . . . . . . . . . . . . 86Lim, T.J. [162] . . . . . . . . . . . . . . . . . . . . . . . . . . . . . . . 86Lim, T.J. [173] . . . . . . . . . . . . . . . . . . . . . . . . . . . . . . . 86Lim, T.J. [174] . . . . . . . . . . . . . . . . . . . . . . . . . . . . . . . 86Lim, T.J. [169] . . . . . . . . . . . . . . . . . . . . . . . . . . . . . . . 86Lim, T.J. [171] . . . . . . . . . . . . . . . . . . . . . . . . . . . . . . . 86Lim, T.J. [164] . . . . . . . . . . . . . . . . . . . . . . . . . . . . . . . 86Lim, T.J. [175] . . . . . . . . . . . . . . . . . . . . . . . . . . . . . . . 86Lim, T.J. [163] . . . . . . . . . . . . . . . . . . . . . . . . . . . . . . . 86Lindskog, E. [10] . . . . . . . . . . . . . . . . . . . . . . . . . . . . . . 0Lister, D. [401] . . . . . . . . . . . . . . . . . . . . . . . . . . . . . .329Litva, J. [326] . . . . . . . . . . . . . . . . . . . . . . . . . . . . . . . 199

AUTHOR INDEX 527
Litva, J. [3] . . . 0, 123, 124, 128–130, 140–142, 144,145, 147–149, 158–160, 162–164, 166,167, 193
Lo, T. [326] . . . . . . . . . . . . . . . . . . . . . . . . . . . . . . . . . 199Lo, T. [3] 0, 123, 124, 128–130, 140–142, 144, 145,
147–149, 158–160, 162–164, 166, 167,193
Lodge, J.H. [106] . . . . . . . . . . . . . . . . . . . . . . . . . 23, 24Lopes, L.B. [356] . . . . . . . . . . . . . . . . . . . . . . . . . . . 205Lopez, A.R. [279]. . . . . . . . . . . . . . . . . . . . . . .125, 145Lymer, A. [104] . . . . . . . . . . . . . . . . . . . . . . . . . . . . . . 23
MMa, L. [129] . . . . . . . . . . . . . . . . . . . . . . . . . . . . . . . . . 30Ma, Y. [173] . . . . . . . . . . . . . . . . . . . . . . . . . . . . . . . . . 86Madfors, M. [343] . . . . . . . . . . . . . . . . . . . . . . . . . . . 202Magnusson, S. [343] . . . . . . . . . . . . . . . . . . . . . . . . . 202Mallet, J. [254] . . . . . . . . . . . . . . . . . . . . . . . . . . . . . . 123Mallett, J.D. [271] . . . . . . . . .123, 124, 152, 182, 235Mallett, J.D. [232] . . . . . . . . . . . . . . . . . . . . . . . . . . . 123Mammela, A. [282] . . . . . . . . . . . . . . . . . . . . . 127, 144Mantey, P.E. [266] . . . 123, 124, 145, 147, 148, 159,
162, 167Mantey, P.E. [229] . . . . . . . . . . . . . . . . . . . . . . . . . . . 123Margarita, A. [262] . . . . . . . . . . . . . . . . . . . . . . . . . . 123Marti, J. [78] . . . . . . . . . . . . . . . . . . . . . . . . . . . . . . . . . . 8Martin, U. [278] . . . . . . . . . . . . . . . 125, 126, 144, 165Matsumoto, Y. [175] . . . . . . . . . . . . . . . . . . . . . . . . . . 86Matsuoka, H. [190] . . . . . . . . . . . . . . . . . . . . . . . .90, 91Maxey, J.J. [141] . . . . . . . . . . . . . . . . . . . . . . . . . . . . . 59Mayrargue, S. [16] . . . . . . . . . . . . . . . . . . . .0, 134, 165Mazo, J.E. [304] . . . . . . . . . . . . . . . . . . . . . . . . . . . . 162McCool, J.M. [255] . . . . . . . . . . . . . . . . . . . . . . . . . .123McGeehan, J.P. [104] . . . . . . . . . . . . . . . . . . . . . . . . . 23McGeehan, J.P. [103] . . . . . . . . . . . . . . . . . . . . . . . . . 23McGeehan, J.P. [2] . 0, 124, 125, 127, 132, 134, 193,
222–224McLane, P.J. [107] . . . . . . . . . . . . . . . . . . . . . . . . 23–25McLane, P.J. [81] . . . . . . . . . . . . . . . . . . . . . . . . . . . . . 11McLaughlin, S. [290] . . . . . . . . . . . . . . . . . . . . . . . . 144Menolascino, R. [60] . . . . . . . . . . . . . . . . . . . . . . . 1, 29Miki, Y. [111] . . . . . . . . . . . . . . . . . . . . . . . . . . . . 24, 87Miljanic, Z. [382] . . . . . . . . . . . . . . . . . . . . . . . 234, 235Miller, S.L. [88] . . . . . . . . . . . . . . . . . . . . . . . . . . . . . . 11Miller, T.W. [276] . . . . 124, 145, 147, 148, 152, 154,
162, 235Milstein, L.B. [142] . . . . . . . . . . . . . . . . . . . . . . . . . . .63Milstein, L.B. [80] . . . . . . . . . . . . . . . . . . . . . . . . . . . . 11Milstein, L.B. [86] . . . . . . . . . . . . . . . . . . . . . . . . . . . . 11Milstein, L.B. [390] . . . . . . . . . . . . . . . . . . . . . . . . . 309Milstein, L.B. [64] . . . . . . . . . . . . . . . . . . . . . . . 2, 3, 11Milstein, L.B. [89] . . . . . . . . . . . . . . . . . . . . . . . . . . . . 11Mizuno, M. [17] . . . . . . . . . . . . . . . . . 0, 126, 130, 134Mogensen, P.E. [20] . . . . . . . . . 0, 126, 134, 140, 145Moher, M.L. [106] . . . . . . . . . . . . . . . . . . . . . . . . 23, 24Mohr, W. [60] . . . . . . . . . . . . . . . . . . . . . . . . . . . . . .1, 29Monot, J.J. [16] . . . . . . . . . . . . . . . . . . . . . . 0, 134, 165
Monzingo, R.A. [276] 124, 145, 147, 148, 152, 154,162, 235
Morinaga, N. [192] . . . . . . . . . . . . . . . . . . . . . . . . . . . 91Morinaga, N. [186] . . . . . . . . . . . . . . . . . . . . . . . . 90, 93Morinaga, N. [196] . . . . . . . . . . . . . . . . . . . . . . . . . . . 91Morinaga, N. [194] . . . . . . . . . . . . . . . . . . . . . . . . . . . 91Morinaga, N. [190] . . . . . . . . . . . . . . . . . . . . . . . . 90, 91Morinaga, N. [197] . . . . . . . . . . . . . . . . . . . . . . . . . . . 91Morinaga, N. [221] . . . . . . . . . . . . . . . . . . . . . . . . . . 109Morinaga, N. [202] . . . . . . . . . . . . . . . . . . . . . . . . . . . 92Morinaga, N. [198] . . . . . . . . . . . . . . . . . . . . . . . . . . . 92Morinaga, N. [201] . . . . . . . . . . . . . . . . . . . . . . . . . . . 92Morinaga, N. [200] . . . . . . . . . . . . . . . . . . . . . . . . . . . 92Morinaga, N. [220] . . . . . . . . . . . . . . . . . . . . . . . . . . 109Morinaga, N. [199] . . . . . . . . . . . . . . . . . . . . . . . . . . . 92Morrow, R.K. Jr [100] . . . . . . . . . . . . . . . . . . . . . . . . 18Moses, R.L. [298]. . . . . . . . . . . . . . . . . . . . . . .158, 199Moshavi, S. [92] . . . . . . . . . . . . . . . . . . . . . . . . . . 18, 86Muammar, R. [380] . . . . . . . . . . . . . . . . . . . . . 223, 224
NNaghshineh, M. [337] 201, 203, 204, 207, 210, 211,
214, 233Naghshineh, M. [308] . . . . . . . . . . . . . . . . . . . . . . . .193Naguib, A. [225] . . . . . . . . . . . . . . . . . . . . . . . . . . . . 120Naijoh, M. [201] . . . . . . . . . . . . . . . . . . . . . . . . . . . . . 92Nakagami, M. [75] . . . . . . . . . . . . . . . . . . . . . . . . . . . . .7Nanda, S. [151] . . . . . . . . . . . . . . . . . . . . . . . .70, 71, 90Nanda, S. [180] . . . . . . . . . . . . . . . . . . . . . . . . . . . . . . 89Ng, B.C. [9] . . . . . . . . . . . . . . . . . . . . . . . . . .0, 160, 162Nikula, E. [57] . . . . . . . . . . . . . . . . . . . . . . . . . . . . . 1, 29Nilsson, M. [118] . . . . . . . . . . . .29, 30, 32, 48, 62, 86
OOberg, T. [15] . . . . . . 0, 132, 157, 158, 160, 193, 199Ochsner, H. [285] . . . . . . . . . . . . . . . . . . . . . . . 130, 205Ogawa, Y. [18] . . . . . . . . . . . . . . 0, 131, 134, 193, 237Oh, S-H. [369] . . . . . . . . . . . . . . . . . . . . . . . . . . . . . . 210Ohgane, T. [17] . . . . . . . . . . . . . . . . . . 0, 126, 130, 134Ohgane, T. [18] . . . . . . . . . . . . . 0, 131, 134, 193, 237Ohno, K. [131]. . . . . . . . . . . . . . . . . . . . . . . . . . . .38, 55Ojanpera, T. [117] . . . . . . . . . . . . . . . . . . . . . . . . . 29, 70Ojanpera, T. [184] . . . . . . . . . . . . . . . . . . . . . . . . . . . . 90Ojanpera, T. [119] . . . . . . . . . . . . . . . . . . . . . . . . . . . . 29Ojanpera, T. [127] . . . . . . . . . . . . . . . . . . . . . . . . . . . . 29Okawa, K. [130] . . . . . . . . . . . . . . . . . 32, 57, 301, 302Okumura, Y. [131] . . . . . . . . . . . . . . . . . . . . . . . . 38, 55Okumura, Y. [154] . . . . . . . . . . . . . . . . . . . . . . . . . . . . 74Olesen, K. [20] . . . . . . . . . . . . . . 0, 126, 134, 140, 145Olofsson, H. [343] . . . . . . . . . . . . . . . . . . . . . . . . . . .202Omura, J.K. [138] . . . . . . . . . . . . . . . . . . . . . . . . . . . . 56Ormondroyd, R.F. [141] . . . . . . . . . . . . . . . . . . . . . . . 59Ortigoza-Guerrero, L. [311] . . . . . . . . . . . . . . . . . . 193Ortigoza-Guerrero, L. [312] . . . . . . . . . . . . . . . . . . 193Otsuki, S. [192] . . . . . . . . . . . . . . . . . . . . . . . . . . . . . . 91Ottersten, B.E. [88] . . . . . . . . . . . . . . . . . . . . . . . . . . . 11Ottosson, T. [216] . . . . . . . . . . . . . . . . . . . . . . . . . . . 109Ovesjo, F. [127] . . . . . . . . . . . . . . . . . . . . . . . . . . . . . . 29

528 AUTHOR INDEX
Owen, R. [401]. . . . . . . . . . . . . . . . . . . . . . . . . . . . . .329Oyama, T. [174] . . . . . . . . . . . . . . . . . . . . . . . . . . . . . . 86Oyama, T. [175] . . . . . . . . . . . . . . . . . . . . . . . . . . . . . . 86
PPadovani, R. [391] . . . . . . . . . . . . . . . . . . . . . . . . . . .309Padovani, R. [63] . . . . . . . . . . . . . . . . . . . . . . . . . . . . . . 2Padovani, R. [214] . . . . . . . . . . . . . . . . . . . . . . . . . . .109Palestini, V. [321] . . . . . . . . . . . . . . . . . . . . . . . 193, 208Papadias, C.B. [272] . . . . . . . . . . . . . . . . . . . . 123, 124Papadias, C.B. [237] . . . . . . . . . . . . . . . . . . . . . . . . . 123Papadias, C.B. [300] . . . . . . . . . . . . . . . . . . . . 160, 162Parkvall, S. [88] . . . . . . . . . . . . . . . . . . . . . . . . . . . . . . 11Passman, C. [301] . . . . . . . . . . . . . . . . . . . . . . 160–162Patel, P. [166] . . . . . . . . . . . . . . . . . . . . . . . . . . . . . . . . 86Paulraj, A. [305] . . . . . . . . . . . . . . . . . . . . . . . . 165, 236Paulraj, A. [306] . . . . . . . . . . . . . . . . . . . . . . . . 165, 236Paulraj, A. [272] . . . . . . . . . . . . . . . . . . . . . . . . 123, 124Paulraj, A. [245] . . . . . . . . . . . . . . . . . . . . . . . . . . . . 123Paulraj, A. [300] . . . . . . . . . . . . . . . . . . . . . . . . 160, 162Paulraj, A.J. [10] . . . . . . . . . . . . . . . . . . . . . . . . . . . . . . 0Paulraj, A.J. [9] . . . . . . . . . . . . . . . . . . . . . . 0, 160, 162Paulraj, A.J. [237] . . . . . . . . . . . . . . . . . . . . . . . . . . . 123Peha, J.M. [357] . . . . . . . . . . . . . . . . . . . . . . . . . . . . .205Peritsky, M.M. [346] . . . . . . . . . . . . . . . . . . . . . . . . .204Peterson, R.L. [85] . . . . . . . . . . . . . . . . . . . . . . . . . . . 11Petrus, P. [286] . . . . . . . . . . . . . . . . . . . . . . . . . 131, 132Petrus, P. [292] . . . . . . . . . . . . . . . . . . . . . 144, 193, 224Pickholtz, R.L. [86] . . . . . . . . . . . . . . . . . . . . . . . . . . . 11Pickholtz, R.L. [390] . . . . . . . . . . . . . . . . . . . . . . . . 309Pickholtz, R.L. [64] . . . . . . . . . . . . . . . . . . . . . . 2, 3, 11PiHui, C. [318] . . . . . . . . . . . . . . . . . . . . .193, 208, 217Pio Magnani, N. [321] . . . . . . . . . . . . . . . . . . .193, 208Pipon, F. [16] . . . . . . . . . . . . . . . . . . . . . . . . 0, 134, 165Pirhonen, R. [210] . . . . . . . . . . . . . . . 96, 97, 111, 112Pizarroso, M. [60] . . . . . . . . . . . . . . . . . . . . . . . . . . 1, 29Pollard, A. [288] . . . . . . . . . . . . . . . . . . . . . . . . 143, 193Ponnekanti, S. [288] . . . . . . . . . . . . . . . . . . . . 143, 193Pora, W. [248] . . . . . . . . . . . . . . . . . . . . . . . . . . . . . . 123Prasad, R. [117] . . . . . . . . . . . . . . . . . . . . . . . . . . .29, 70Prasad, R. [68] . . . . . . . . . . . . . . . . . . . . . . . . 2, 28, 200Prasad, R. [184] . . . . . . . . . . . . . . . . . . . . . . . . . . . . . . 90Price, R. [70] . . . . . . . . . . . . . . . . . . . . . . . . . . . . . . 6, 11Proakis, J.G. [5] . . . 0, 6, 8, 9, 11, 20, 21, 32, 59, 76,
297, 307, 309Pugh, E.L. [252] . . . . . . . . . . . . . . . . . . . . . . . . . . . . 123Pursley, M.B. [99] . . . . . . . . . . . . . . . . . . . . . 18, 19, 56
RRaida, Z. [297] . . . . . . . . . . . . . . . . . . . . . . . . . . . . . . 150Raitola, M. [156] . . . . . . . . . . . . . . . . . . . . . . . . . . . . . 84Ramakrishna, S. [137] . . . . . . . . . . . . . . . . . . . . . . . . 55Ramakrishna, S. [217] . . . . . . . . . . . . . . . . . . . . . . . 109Rames, N.S. [153]. . . . . . . . . . . . . . . . . . . . . . . . .70, 71Rao, R.R. [142] . . . . . . . . . . . . . . . . . . . . . . . . . . . . . . 63Rapajic, P.B. [109] . . . . . . . . . . . . . . . . . . . . . . . . . . . .24Rapeli, J. [54] . . . . . . . . . . . . . . . . . . . . . . . . . . 1, 27, 29Rappaport, S.S. [345] . . . . . . . . . . . . . . . . . . . 203, 204
Rappaport, S.S. [370] . . . . . . . . . . . . . . . . . . . . . . . . 210Rappaport, S.S. [87] . . . . . . . . . . . . . . . . . . . . . . . . . . 11Rappaport, T.S. [323] . . . . . . 194, 226–228, 230, 236Rappaport, T.S. [324] . . . . . . . . . . 194, 228–230, 236Rappaport, T.S. [157] . . . . . . . . . . . . . . . . . . . . . . . . . 86Rappaport, T.S. [286] . . . . . . . . . . . . . . . . . . . 131, 132Rappaport, T.S. [228] . . . . . . . . . . . . . . . . . . . . . . . . 123Rasmussen, L.K. [168] . . . . . . . . . . . . . . . . . . . . . . . . 86Rasmussen, L.K. [172] . . . . . . . . . . . . . . . . . . . . . . . . 86Rasmussen, L.K. [170] . . . . . . . . . . . . . . . . . . . . . . . . 86Rasmussen, L.K. [159] . . . . . . . . . . . . . . . . . . . . . . . . 86Rasmussen, L.K. [173] . . . . . . . . . . . . . . . . . . . . . . . . 86Rasmussen, L.K. [174] . . . . . . . . . . . . . . . . . . . . . . . . 86Rasmussen, L.K. [169] . . . . . . . . . . . . . . . . . . . . . . . . 86Rasmussen, L.K. [171] . . . . . . . . . . . . . . . . . . . . . . . . 86Rasmussen, L.K. [164] . . . . . . . . . . . . . . . . . . . . . . . . 86Rasmussen, L.K. [175] . . . . . . . . . . . . . . . . . . . . . . . . 86Rasmussen, L.K. [167] . . . . . . . . . . . . . . . . . . . . . . . . 86Raymond Steele, [155] . . . . . . . . . . . . . . . . . . . . 76, 77Reed, I.S. [252] . . . . . . . . . . . . . . . . . . . . . . . . . . . . . 123Reed, I.S. [253] . . . . . . . . . . . . . . . . . . . . . . . . . . . . . 123Reed, I.S. [251] . . . . . . . . . . . . . . . . . . . . . . . . . . . . . 123Reed, I.S. [254] . . . . . . . . . . . . . . . . . . . . . . . . . . . . . 123Reed, I.S. [271] . . . . . . . . . . . 123, 124, 152, 182, 235Reed, I.S. [232] . . . . . . . . . . . . . . . . . . . . . . . . . . . . . 123Reed, J.H. [323]. . . . . . . . . . .194, 226–228, 230, 236Reed, J.H. [286] . . . . . . . . . . . . . . . . . . . . . . . . 131, 132Reed, J.H. [292] . . . . . . . . . . . . . . . . . . . .144, 193, 224Reudink, D.O. [362] . . . . . . . . . . . . . . . . . . . . . . . . . 207Reudink, D.O. [359] . . . . . . . . . . . . . . . . . . . . . . . . . 207Reudink, D.O. [361] . . . . . . . . . . . . . . . . . . . . 207, 209Reudink, D.O. [376] . . . . . . . . . . . . . . . . . . . . . . . . . 220Rexberg, L. [15] . . . .0, 132, 157, 158, 160, 193, 199Rick, R.R. [89] . . . . . . . . . . . . . . . . . . . . . . . . . . . . . . . 11Romiti, F. [322] . . . . . . . . . . . . . . . . . . . . 194, 221, 222Ross, A.H.M. [335] . . . . . . . . . . . . . . . . . . . . . . . . . .200Roy, R. [245] . . . . . . . . . . . . . . . . . . . . . . . . . . . . . . . 123Roy, R. [257] . . . . . . . . . . . . . . . . . . . . . . . . . . . . . . . 123Roy, S. [160] . . . . . . . . . . . . . . . . . . . . . . . . . . . . . . . . . 86Rubio, L. [262]. . . . . . . . . . . . . . . . . . . . . . . . . . . . . .123Rydberg, A. [15] . . . 0, 132, 157, 158, 160, 193, 199
SSafak, A. [344] . . . . . . . . . . . . . . . . . . . . . . . . . . . . . . 202Salgado-Galicia, H. [357] . . . . . . . . . . . . . . . . . . . . 205Salz, J. [289] . . . . . . . . . . . . . . . . . . . . . . . . . . . . . . . . 144Salz, J. [249] . . . . . . . . . . . . . . . . . . . . . . . . . . . . . . . . 123Sampei, S. [192]. . . . . . . . . . . . . . . . . . . . . . . . . . . . . .91Sampei, S. [186] . . . . . . . . . . . . . . . . . . . . . . . . . . 90, 93Sampei, S. [196]. . . . . . . . . . . . . . . . . . . . . . . . . . . . . .91Sampei, S. [194]. . . . . . . . . . . . . . . . . . . . . . . . . . . . . .91Sampei, S. [190] . . . . . . . . . . . . . . . . . . . . . . . . . . 90, 91Sampei, S. [197]. . . . . . . . . . . . . . . . . . . . . . . . . . . . . .91Sampei, S. [221] . . . . . . . . . . . . . . . . . . . . . . . . . . . . 109Sampei, S. [202]. . . . . . . . . . . . . . . . . . . . . . . . . . . . . .92Sampei, S. [198]. . . . . . . . . . . . . . . . . . . . . . . . . . . . . .92Sampei, S. [201]. . . . . . . . . . . . . . . . . . . . . . . . . . . . . .92Sampei, S. [114]. . . . . . . . . . . . . . . . . . . . . . . . . . . . . .24

AUTHOR INDEX 529
Sampei, S. [200]. . . . . . . . . . . . . . . . . . . . . . . . . . . . . .92Sampei, S. [220] . . . . . . . . . . . . . . . . . . . . . . . . . . . . 109Sampei, S. [199]. . . . . . . . . . . . . . . . . . . . . . . . . . . . . .92Sanada, Y. [165] . . . . . . . . . . . . . . . . . . . . . . . . . . . . . . 86Sandberg, E. [15] . . . 0, 132, 157, 158, 160, 193, 199Saquib, M. [218] . . . . . . . . . . . . . . . . . . . . . . . . . . . . 109Sasaki, A. [124] . . . . . . . . . . . . . . . . . . . . . . . . . . . . . . 29Sasaoka, H. [194]. . . . . . . . . . . . . . . . . . . . . . . . . . . . .91Saunders, S.R. [291] . . . . . . . . . . . . . . . . . . . . . . . . . 144Sawahashi, M. [123] . . . . . . . . . . . . . . . . . . . . . . . . . . 29Sawahashi, M. [122] . . . . . . . . . . . . . . . . . . . . . . . . . . 29Sawahashi, M. [130] . . . . . . . . . . . . . 32, 57, 301, 302Sawahashi, M. [144] . . . . . . . . . . . . . . . . . . . . . . . . . . 65Sawahashi, M. [111]. . . . . . . . . . . . . . . . . . . . . . .24, 87Schilling, D.L. [86] . . . . . . . . . . . . . . . . . . . . . . . . . . . 11Schilling, D.L. [390] . . . . . . . . . . . . . . . . . . . . . . . . . 309Schilling, D.L. [64] . . . . . . . . . . . . . . . . . . . . . . 2, 3, 11Schmidt, R.O. [256] . . . . . . . . . . . . . . . . . . . . . . . . . 123Schnell, M. [102] . . . . . . . . . . . . . . . . . . . . . . . . . . . . . 22Scholtz, R.A. [138] . . . . . . . . . . . . . . . . . . . . . . . . . . . 56Schwarz da Silva, J. [126] . . . . . . . . . . . . . . . . . . . . . 29Serizawa, M. [364] . . . . . . . . . . . . . . . . . . . . . . . . . . 208Seshadri, N. [224] . . . . . . . . . . . . . . . . . . . . . . . . . . . 120Seshadri, N. [225] . . . . . . . . . . . . . . . . . . . . . . . . . . . 120Seshadri, N. [226] . . . . . . . . . . . . . . . . . . . . . . . . . . . 120Sestini, F. [320] . . . . . . . . . . . . . . . . . . . . . . . . . 193, 208Sestini, F. [321] . . . . . . . . . . . . . . . . . . . . . . . . . 193, 208Sim, H.K. [176] . . . . . . . . . . . . . . . . . . . . . . . . . . . . . . 87Simmonds, C.M. [280] . . . . . . . . . 126, 127, 160, 161Simon, M.K. [138] . . . . . . . . . . . . . . . . . . . . . . . . . . . 56Simpson, F. [98] . . . . . . . . . . . . . . . . . . . . . . . . . . . . . . 18Sin, J.K.S. [368]. . . . . . . . . . . . . . . . . . . . . . . . . . . . .209Singh, R. [348] . . . . . . . . . . . . . . . . . . . . . . . . . . . . . . 204Sipila, K. [397]. . . . . . . . . . . . . . . . . . . . . . . . . . . . . .311Sirbu, M. [357] . . . . . . . . . . . . . . . . . . . . . . . . . . . . . .205Sjoberg, J. [400] . . . . . . . . . . . . . . . . . . . . . . . . . . . . .313Sklar, B. [71] . . . . . . . . . . . . . . . . . . . . . . . . . . . . . . . 7, 8Sklar, B. [72] . . . . . . . . . . . . . . . . . . . . . . . . . . . . . . . . . . 7Skoeld, J. [210] . . . . . . . . . . . . . . . . . . 96, 97, 111, 112Skold, J. [118] . . . . . . . . . . . . . . 29, 30, 32, 48, 62, 86Smolik, K. [69] . . . . . . . . . . . . . . . . . . . . . . . . . . . . . . . . 2Smolik, K.F. [69] . . . . . . . . . . . . . . . . . . . . . . . . . . . . . . 2Sollenberger, N.R. [316]. . .193, 208, 210, 212, 213,
232Sollenberger, N.R. [383] . . . . . . . . . . . . . . . . . 234, 235Somerville, F.C.A. [208] . . . . . . . . . . . . . . . . . . . . . . 95Sourour, E. [329] . . . . . . . . . . . . . . . . . . . . . . . . . . . . 199Sowerby, K.W. [323] . . . . . . 194, 226–228, 230, 236Special Issue on Active, [242] . . . . . . . . . . . . . . . . 123Special Issue on Adaptive Antennas, [243] . . . . . 123Special Issue on Adaptive Antennas, [244] . . . . . 123Steams, S.D. [275] . . . . . . . . . . . . . . . . . 124, 143, 149Steele, R. [358] . . . . . . . . . . . . . . . . . . . . . . . . . . . . . 205Steele, R. [185] . . . . . . . . . . . . . . . . . . . . . . .90, 93, 109Steele, R. [354] . . . . . . . . . . . . . . . . . . . . . . . . . . . . . 205Steele, R. [149]. . . . . . . . . . . . . . . . . . . . . . . . . . . . . . .68Steele, R. [11] 0, 7, 28, 89, 90, 93, 95, 98, 104, 145,
147, 151, 164, 232, 295, 296, 299
Steele, R. [205]. . . . . . . . . . . . . . . . . . . . . . . . . . . . . . .94Stefanov, J. [55] . . . . 1, 28, 33, 40, 70, 201, 208, 232Steyskal, H. [281]. . . . . . . . . . . . . .126, 140, 150, 160Steyskal, H. [299] . . . . . . . . . . . . . . . . . . . . . . .158, 199Strandell, J. [15]. . . .0, 132, 157, 158, 160, 193, 199Streit, J. [178]89, 95, 96, 98, 99, 102, 107, 116–122,
199, 202, 221, 222Streit, J. [223] . . . . . . . . . . . . . . . . . . . . . . . . . . . . . . . 110Strom, E.G. [88] . . . . . . . . . . . . . . . . . . . . . . . . . . . . . .11Stuber, G.L. [319] . . . . . . . . . . . . . . . . . . . . . . . . . . . 193Suda, H. [122] . . . . . . . . . . . . . . . . . . . . . . . . . . . . . . . 29Suda, H. [135] . . . . . . . . . . . . . . . . . . . . . . . . . . . . 45, 76Sugimoto, H. [168] . . . . . . . . . . . . . . . . . . . . . . . . . . . 86Sugimoto, H. [174] . . . . . . . . . . . . . . . . . . . . . . . . . . . 86Sugimoto, H. [171] . . . . . . . . . . . . . . . . . . . . . . . . . . . 86Sugimoto, H. [164] . . . . . . . . . . . . . . . . . . . . . . . . . . . 86Sugimoto, H. [175] . . . . . . . . . . . . . . . . . . . . . . . . . . . 86Sun, S.M. [168] . . . . . . . . . . . . . . . . . . . . . . . . . . . . . . 86Sun, S.M. [172] . . . . . . . . . . . . . . . . . . . . . . . . . . . . . . 86Sun, S.M. [169] . . . . . . . . . . . . . . . . . . . . . . . . . . . . . . 86Sun, S.M. [171] . . . . . . . . . . . . . . . . . . . . . . . . . . . . . . 86Sun, S.M. [164] . . . . . . . . . . . . . . . . . . . . . . . . . . . . . . 86Sun, S.M. [175] . . . . . . . . . . . . . . . . . . . . . . . . . . . . . . 86Sunaga, T. [114] . . . . . . . . . . . . . . . . . . . . . . . . . . . . . . 24Sunay, M.O. [129] . . . . . . . . . . . . . . . . . . . . . . . . . . . . 30Suoranta, R. [210]. . . . . . . . . . . . . . . .96, 97, 111, 112Suzuki, H. [76] . . . . . . . . . . . . . . . . . . . . . . . . . . . . . . . . 7Suzuki, T. [197] . . . . . . . . . . . . . . . . . . . . . . . . . . . . . . 91Svensson, A. [219] . . . . . . . . . . . . . . . . . . . . . . . . . . 109Svensson, A. [216] . . . . . . . . . . . . . . . . . . . . . . . . . . 109Swales, S.C. [2] . . . 0, 124, 125, 127, 132, 134, 193,
222–224Swales, S.C. [19] . . . . . . . . . . . . . . . . . . . . . 0, 126, 134Swales, S.C. [250] . . . . . . . . . . . . . . . . . . . . . . . . . . . 123
TTajima, J. [352] . . . . . . . . . . . . . . . . . . . . . . . . . . . . . 204Tan, P.H. [167] . . . . . . . . . . . . . . . . . . . . . . . . . . . . . . . 86Tanenbaum, A.S. [375] . . . . . . . . . . . . . 212, 213, 232Tarokh, V. [146] . . . . . . . . . . . . . . . . . . . . . . . . . . 65, 84Tarokh, V. [224] . . . . . . . . . . . . . . . . . . . . . . . . . . . . . 120Tarokh, V. [225] . . . . . . . . . . . . . . . . . . . . . . . . . . . . . 120Tarokh, V. [226] . . . . . . . . . . . . . . . . . . . . . . . . . . . . . 120Tarokh, V. [227] . . . . . . . . . . . . . . . . . . . . . . . . . . . . . 120Taylor, C. [288] . . . . . . . . . . . . . . . . . . . . . . . . .143, 193Tcha, D-W. [369] . . . . . . . . . . . . . . . . . . . . . . . . . . . .210Teder, P. [108] . . . . . . . . . . . . . . . . . . . . . . . . . . . . 23, 29Tekinay, S. [338] . . . . . 201, 203, 204, 210, 214, 233Tekinay, S. [331] . . . . . . . . . . . . . . 200, 205, 210, 211Thibault, J. [16] . . . . . . . . . . . . . . . . . . . . . . 0, 134, 165Thielecke, J. [108] . . . . . . . . . . . . . . . . . . . . . . . . 23, 29Torrance, J. [203] . . . . . . . . . . . . . . . . . . . . . . . . 92, 101Torrance, J.M. [195] . . . . . . . . . . . . . .91, 92, 101, 286Torrance, J.M. [187] . . . . . . . . . . . . . . . . . . . . . . . 90, 93Torrance, J.M. [189] . . . . . . . . . . . . . . . . . . . . . . . . . . 90Torrance, J.M. [112] . . . . . . . . . . . . . . . . . . . . . . . 24, 25Torrance, J.M. [193] . . . . . . . . . . . . . . . . . . . . . . . . . . 91Torrance, J.M. [384] . . . . . . . . . . . . . . . . . . . . . . . . . 286

530 AUTHOR INDEX
Toskala, A. [57] . . . . . . . . . . . . . . . . . . . . . . . . . . . . 1, 29Toskala, A. [127] . . . . . . . . . . . . . . . . . . . . . . . . . . . . . 29Tsaur, S-A. [82] . . . . . . . . . . . . . . . . . . . . . . . . . . . . . . 11Tsoulos, G.V. [241] . . . . . . . . . . . . . . . . . . . . . . . . . . 123Tsoulos, G.V. [19] . . . . . . . . . . . . . . . . . . . . 0, 126, 134Tsoulos, G.V. [7] . . . . . . . . . . . . . . . . .0, 126, 160, 162Tsoulos, G.V. [250] . . . . . . . . . . . . . . . . . . . . . . . . . . 123Tuttlebee, W.H.W. [284] . . . . . . . . . . . . . . . . . 130, 205
UUe, T. [196] . . . . . . . . . . . . . . . . . . . . . . . . . . . . . . . . . . 91Ue, T. [202] . . . . . . . . . . . . . . . . . . . . . . . . . . . . . . . . . . 92Ue, T. [200] . . . . . . . . . . . . . . . . . . . . . . . . . . . . . . . . . . 92
VVan Veen, B.D. [8] . . . . . . . . . . 0, 124, 144, 149, 159Van Veen, B.D. [259] . . . . . . . . . . . . . . . . . . . . . . . . 123Vanderveen, M.C. [300] . . . . . . . . . . . . . . . . . 160, 162Varanasi, M.K. [91] . . . . . . . . . . . . . . . . . . . . . . . 17, 86Verdu, S. [97] . . . . . . . . . . . . . . . . . . . . . . . . . . . . . . . . 18Verdu, S. [93] . . . . . . . . . . . . . . . . . . . .18, 86, 308–310Viberg, M. [287] . . . . . .137, 159, 160, 162, 163, 166Viberg, M. [240] . . . . . . . . . . . . . . . . . . . . . . . . . . . . 123Vijayan, R. [372] . . . . . . . . . . . . . . . . . . . . . . . . . . . . 210Viterbi, A.J. [66] . . . . . . . . . . . . . . . . . . . 2, 28, 59, 200Viterbi, A.J. [391] . . . . . . . . . . . . . . . . . . . . . . . . . . . 309Viterbi, A.J. [63] . . . . . . . . . . . . . . . . . . . . . . . . . . . . . . 2Viterbi, A.J. [214] . . . . . . . . . . . . . . . . . . . . . . . . . . . 109Vuceric, J. [360] . . . . . . . . . . . . . . . . . . . . . . . . . . . . .207Vucetic, B. [67]. . . . . . . . . . . . . . . . . . . . . . . .2, 28, 200Vucetic, B.S. [109] . . . . . . . . . . . . . . . . . . . . . . . . . . . 24
WWacker, A. [397] . . . . . . . . . . . . . . . . . . . . . . . . . . . . 311Wacker, A. [395] . . . . . . . . . . . . . . . . . . . . . . . . . . . . 311Walach, E. [296] . . . . . . . . . . . . . . . . . . . . . . . . . . . . 150Wales, S.W. [325] . . . . . . . . . . . . . . . . . . . . . . . . . . . 199Wallstedt, K. [343] . . . . . . . . . . . . . . . . . . . . . . . . . . 202Wang, L. [392] . . . . . . . . . . . . . . . . . . . . . . . . . . . . . . 309Wang, Q. [165] . . . . . . . . . . . . . . . . . . . . . . . . . . . . . . . 86Ward, D.B. [247] . . . . . . . . . . . . . . . . . . . . . . . . . . . . 123Weaver, L.A. [391] . . . . . . . . . . . . . . . . . . . . . . . . . . 309Weaver, L.A. Jr [63] . . . . . . . . . . . . . . . . . . . . . . . . . . . 2Weaver, L.A. Jr [214] . . . . . . . . . . . . . . . . . . . . . . . . 109Webb, W. [185] . . . . . . . . . . . . . . . . . . . . . . 90, 93, 109Webb, W.T. [12] . . . . . . . . . . 0, 23–25, 233, 260, 352Webb, W.T. [13] . . . 0, 90, 94, 96, 98, 105, 116, 118,
120, 233, 260, 286, 352Webb, W.T. [389] . . . . . . . . . . . . . . . . . . . . . . . . . . . 309Wei, L.F. [161] . . . . . . . . . . . . . . . . . . . . . . . . . . . . . . . 86Wells, M.C. [294] . . . . . . . . . . . . . . . . . . 147, 162, 193Wennstrom, M. [15] 0, 132, 157, 158, 160, 193, 199Whalen, A.D. [388] . . . . . . . . . . . . . . . . . . . . . . . . . .309Wheatley, C.E. [391] . . . . . . . . . . . . . . . . . . . . . . . . 309Wheatley, C.E. III [63] . . . . . . . . . . . . . . . . . . . . . . . . . 2Wheatley, C.E. III [214] . . . . . . . . . . . . . . . . . . . . . .109Whitehead, J. [358] . . . . . . . . . . . . . . . . . . . . . . . . . . 205Whitmann, M. [78] . . . . . . . . . . . . . . . . . . . . . . . . . . . . 8
Wichman, R. [156] . . . . . . . . . . . . . . . . . . . . . . . . . . . 84Widrow, B. [266] 123, 124, 145, 147, 148, 159, 162,
167Widrow, B. [296] . . . . . . . . . . . . . . . . . . . . . . . . . . . . 150Widrow, B. [275] . . . . . . . . . . . . . . . . . . . 124, 143, 149Widrow, B. [255] . . . . . . . . . . . . . . . . . . . . . . . . . . . . 123Widrow, B. [229] . . . . . . . . . . . . . . . . . . . . . . . . . . . . 123Wilkes, J.E. [69] . . . . . . . . . . . . . . . . . . . . . . . . . . . . . . . 2Wilson, S.L. [298] . . . . . . . . . . . . . . . . . . . . . . 158, 199Winters, J.H. [295] . . . . . . . . . . . . . . . . . 149, 157, 193Winters, J.H. [289] . . . . . . . . . . . . . . . . . . . . . . . . . . 144Winters, J.H. [277] . . . . . . . . . . . . . . . . . . . . . . 124, 193Winters, J.H. [246] . . . . . . . . . . . . . . . . . . . . . . . . . . 123Winters, J.H. [238] . . . . . . . . . . . . . . . . . . . . . . . . . . 123Winters, J.H. [249] . . . . . . . . . . . . . . . . . . . . . . . . . . 123Winters, J.H. [158] . . . . . . . . . . . . . . . . . . . . . . . . . . . 86Wixforth, T. [301] . . . . . . . . . . . . . . . . . . . . . . 160–162Wong, C.H. [94] . . . . . . . . . . . . . . 18, 89, 94, 107, 120Wong, C.H. [188] . . . . . . . . . . . . . . . . . 90, 93, 94, 100Wong, C.H. [96] . . . . . . . . . 18, 30, 35, 38, 42, 57, 87Wong, C.H. [222] . . . . . . . . . . . . . . . . . . . . . . . . . . . 110Wong, C.H. [132] . . . . . . . . . . . . . . . . . . 42, 50, 57, 87Wong, C.H. [385] . . . . . . . . . . . . . . . . . . . . . . . . . . . 286Wong, C.H. [211] . . . . . . . . . . . . . . . . . . 103, 105–107Wong, D. [330] . . . . . . . . . . . . . . . . . . . . . . . . . . . . . 200Wong, H.E. [148] . . . . . . . . . . . . . . . . . . . . . . . . . . . . .68Wong, W.C. [350] . . . . . . . . . . . . . . . . . . . . . . . . . . . 204Wong, W.C. [358] . . . . . . . . . . . . . . . . . . . . . . . . . . . 205Wong, W.S. [351] . . . . . . . . . . . . . . . . . . . . . . . 204, 220Woodard, J.P. [208] . . . . . . . . . . . . . . . . . . . . . . . . . . . 95Wu, K-T. [82] . . . . . . . . . . . . . . . . . . . . . . . . . . . . . . . . 11
XXu, C.Q. [261] . . . . . . . . . . . . . . . . . . . . . . . . . . . . . . 123
YYang, L-L. [84]. . . . . . . . . . . . . . . . . . . . . . . . . . . . . . .11Yang, L-L. [83]. . . . . . . . . . . . . . . . . . . . . . . . . . . . . . .11Yates, R. [218] . . . . . . . . . . . . . . . . . . . . . . . . . . . . . . 109Yates, R.D. [363] . . . . . . . . . . . . . . . . . . . . . . . . . . . . 208Yeap, B.L. [204] . . . . . . . . . . . . . . . . . . . . . .93, 95, 120Yeap, B.L. [207] . . . . . . . . . . . . . . . . . . . . . . . . . . . . . .94Yee, M. [206] . . . . . . . . . . . . . . . . . . . . . . . . . . . . . . . . 94Yee, M.S. [94] . . . . . . . . . . . . . . . .18, 89, 94, 107, 120Yee, M.S. [207] . . . . . . . . . . . . . . . . . . . . . . . . . . . . . . 94Yoshida, S. [261] . . . . . . . . . . . . . . . . . . . . . . . . . . . . 123You, D. [163] . . . . . . . . . . . . . . . . . . . . . . . . . . . . . . . . 86Yum, T.S. [351] . . . . . . . . . . . . . . . . . . . . . . . . .204, 220Yum, T.S. [347] . . . . . . . . . . . . . . . . . . . . . . . . .204, 207Yum, T.S. [349] . . . . . . . . . . . . . . . . . . . . . . . . .204, 207
ZZander, J. [372] . . . . . . . . . . . . . . . . . . . . . . . . . . . . . 210Zander, J. [374] . . . . . . . . . . . . . . . . . . . . . . . . . . . . . 210Zander, J. [340] . . . . . . . . . . . . . . . . . . . . . . . . . . . . . 201Zander, J. [373] . . . . . . . . . . . . . . . . . . . . . . . . . . . . . 210Zhang, M. [347] . . . . . . . . . . . . . . . . . . . . . . . . 204, 207Zhang, M. [349] . . . . . . . . . . . . . . . . . . . . . . . . 204, 207Ziemer, R.E. [85] . . . . . . . . . . . . . . . . . . . . . . . . . . . . . 11